Article

Improving the Computational Performance of Ontology-Based Classification Using Graph Databases

by
Thomas J. Lampoltshammer
1,2,* and
Stefanie Wiegand
3
1
School of Information Technology and Systems Management, Salzburg University of Applied Sciences, Urstein Süd 1, Puch, Salzburg 5412, Austria
2
Department of Geoinformatics (Z_GIS), University of Salzburg, Schillerstrasse 30, Salzburg 5020, Austria
3
IT Innovation Centre, University of Southampton, Gamma House, Enterprise Road, Southampton SO16 7NS, UK
*
Author to whom correspondence should be addressed.
Remote Sens. 2015, 7(7), 9473-9491; https://doi.org/10.3390/rs70709473
Submission received: 31 March 2015 / Revised: 16 July 2015 / Accepted: 17 July 2015 / Published: 22 July 2015

Abstract

:
The increasing availability of very high-resolution remote sensing imagery (i.e., from satellites, airborne laser scanning, or aerial photography) represents both a blessing and a curse for researchers. The manual classification of these images, or other similar geo-sensor data, is time-consuming and leads to subjective and non-deterministic results. Due to this fact, (semi-) automated classification approaches are in high demand in affected research areas. Ontologies provide a proper way of automated classification for various kinds of sensor data, including remotely sensed data. However, the processing of data entities—so-called individuals—is one of the most cost-intensive computational operations within ontology reasoning. Therefore, an approach based on graph databases is proposed to overcome the issue of a high time consumption regarding the classification task. The introduced approach shifts the classification task from the classical Protégé environment and its common reasoners to the proposed graph-based approaches. For the validation, the authors tested the approach on a simulation scenario based on a real-world example. The results demonstrate a quite promising improvement of classification speed—up to 80,000 times faster than the Protégé-based approach.

Graphical Abstract

1. Introduction

The increasing availability of very high-resolution remote sensing imagery (i.e., from satellites, airborne laser scanning, or aerial photography) represents both a blessing and a curse for researchers. The manual classification of these images, or other similar geo-sensor data, is time-consuming and leads to subjective and non-deterministic results. Due to this fact, (semi-) automated classification approaches are in high demand in affected research areas.
Ontologies provide a proper way of automated classification for various kinds of sensor data, including remotely sensed data. The formalized expert knowledge within the ontology ensures that every classification task is performed in such a way that a human expert would act, based on his or her knowledge, and repeated classification runs will produce the exact same classification results in terms of classification outcomes and the associated accuracy. However, the power of reasoning provided by description logics [1] employed by reasoners also introduces issues in terms of processing time. Several studies have focused on this issue, analyzing the performance of available reasoners [2,3,4]. The impact of the related performance issues can vary depending on the size and structure of the ontology, how sensor data are modeled and attached to it, as well as the structure and complexity of the queries submitted to the reasoner. Therefore, benchmark results have to be carefully analyzed and compared to the situation at hand [5]. Nevertheless, reasoning with objects of the domain of interest—so-called individuals—is one of the most costly processes within ontologies [5,6].
Keeping the aforementioned factors in mind, it can be concluded that an ontology-based setup for the classification of remote sensing data has to be tailored to the core aspects, namely the consistency of the modeled expert knowledge, while maintaining valid classification results within a reasonable amount of processing time. If this is reduced to a two-step process, the reasoner can be kept during the knowledge formalization process in the first step to ensure the consistency of the ontology but replace the classic reasoner-based approach with an alternative approach in the subsequent classification step.
This classification step can be compared to a very strict version of pattern matching/recognition, identifying objects of the domain that match specific (ranges of) data values. One technology providing such capabilities can be found in the form of graph databases. Within these databases, the schema and all entries are modeled as nodes and edges, which makes it possible to apply graph-based operations to the stored data and metadata [7]. These operations hold the potential of performing high-speed classifications, while retaining the same accuracy as the pure ontology/reasoner-based approach.
Therefore, this study aims at the following objectives: (i) to apply graph databases to the classification process of remote sensing data; (ii) to improve classification performance in terms of time consumption in relation to status quo methods; and (iii) to demonstrate new ways of how to query ontology-based models within graph databases.
The remainder of this paper is organized as follows: after an introduction to the overall topic of this study, Section 2 focuses on related work in the respective research areas touched upon by this paper. Subsequently, Section 3 presents the architectural design and associated implementation of the proposed approach. Section 4 then evaluates the approach based on the example of a classification task regarding remote sensing data and discusses the results. Section 5 closes the paper with the conclusions and future work.

2. Related Work

This section of the paper is dedicated to the necessary background in terms of related work. The first sub-section focuses on ontologies and their application in remote sensing, while the second sub-section discusses graph databases and their applications.

2.1. Remote Sensing and Ontologies

Object-based Image Analysis has positioned itself as a proper methodology to analyze objects derived from remotely-sensed imagery [8]. The basic idea is to fuse image areas to homogeneous objects representing meaningful real-world entities by means of segmentation algorithms. However, matching these generated objects to modeled classes remains a difficult and challenging task [9]. To (semi-) automate this classification process, while enabling an iterative development cycle and also to provide the possibility to model fuzzy concepts, ontologies provide one potential solution. Via ontologies, it becomes possible to fuse quantitative sensor information with qualitative and formalized expert knowledge for classification purposes. This can be achieved by ontologies, which, from an artificial intelligence perspective, serve as a mediator between shared domain concepts/perspectives of experts and a machine-readable formalization [10,11]. Regarding the level of detail of the formalization and expressiveness, ontologies position themselves on a higher level than, for example, a glossary, as they also comprise additional information such as the hierarchical structure and axioms describing the relationships between classes [12]. To express domain knowledge in such a machine-readable notation, the Web Ontology Language Version 2 (OWL2) has become established as the widely used standard [13]. OWL is based on a concept called description logic [14]. One major aspect within this concept is the associated knowledge expression by two components, the so-called T-Box and A-Box [15]. The T-Box is responsible for holding quantified knowledge and assertions about concepts and their hierarchy for example. The A-Box holds assertions about objects of the domain, for example, if a certain object is an instance of a class described within the ontology. Within real-world applications, A-Boxes with a large number of objects are difficult to handle [6].
The successful application of ontologies has already been demonstrated in a variety of remote sensing applications [16,17,18,19,20]. Yet the performance issues regarding the necessary time for processing and classification of real-world data in the form of individuals (domain objects) remain a challenge.

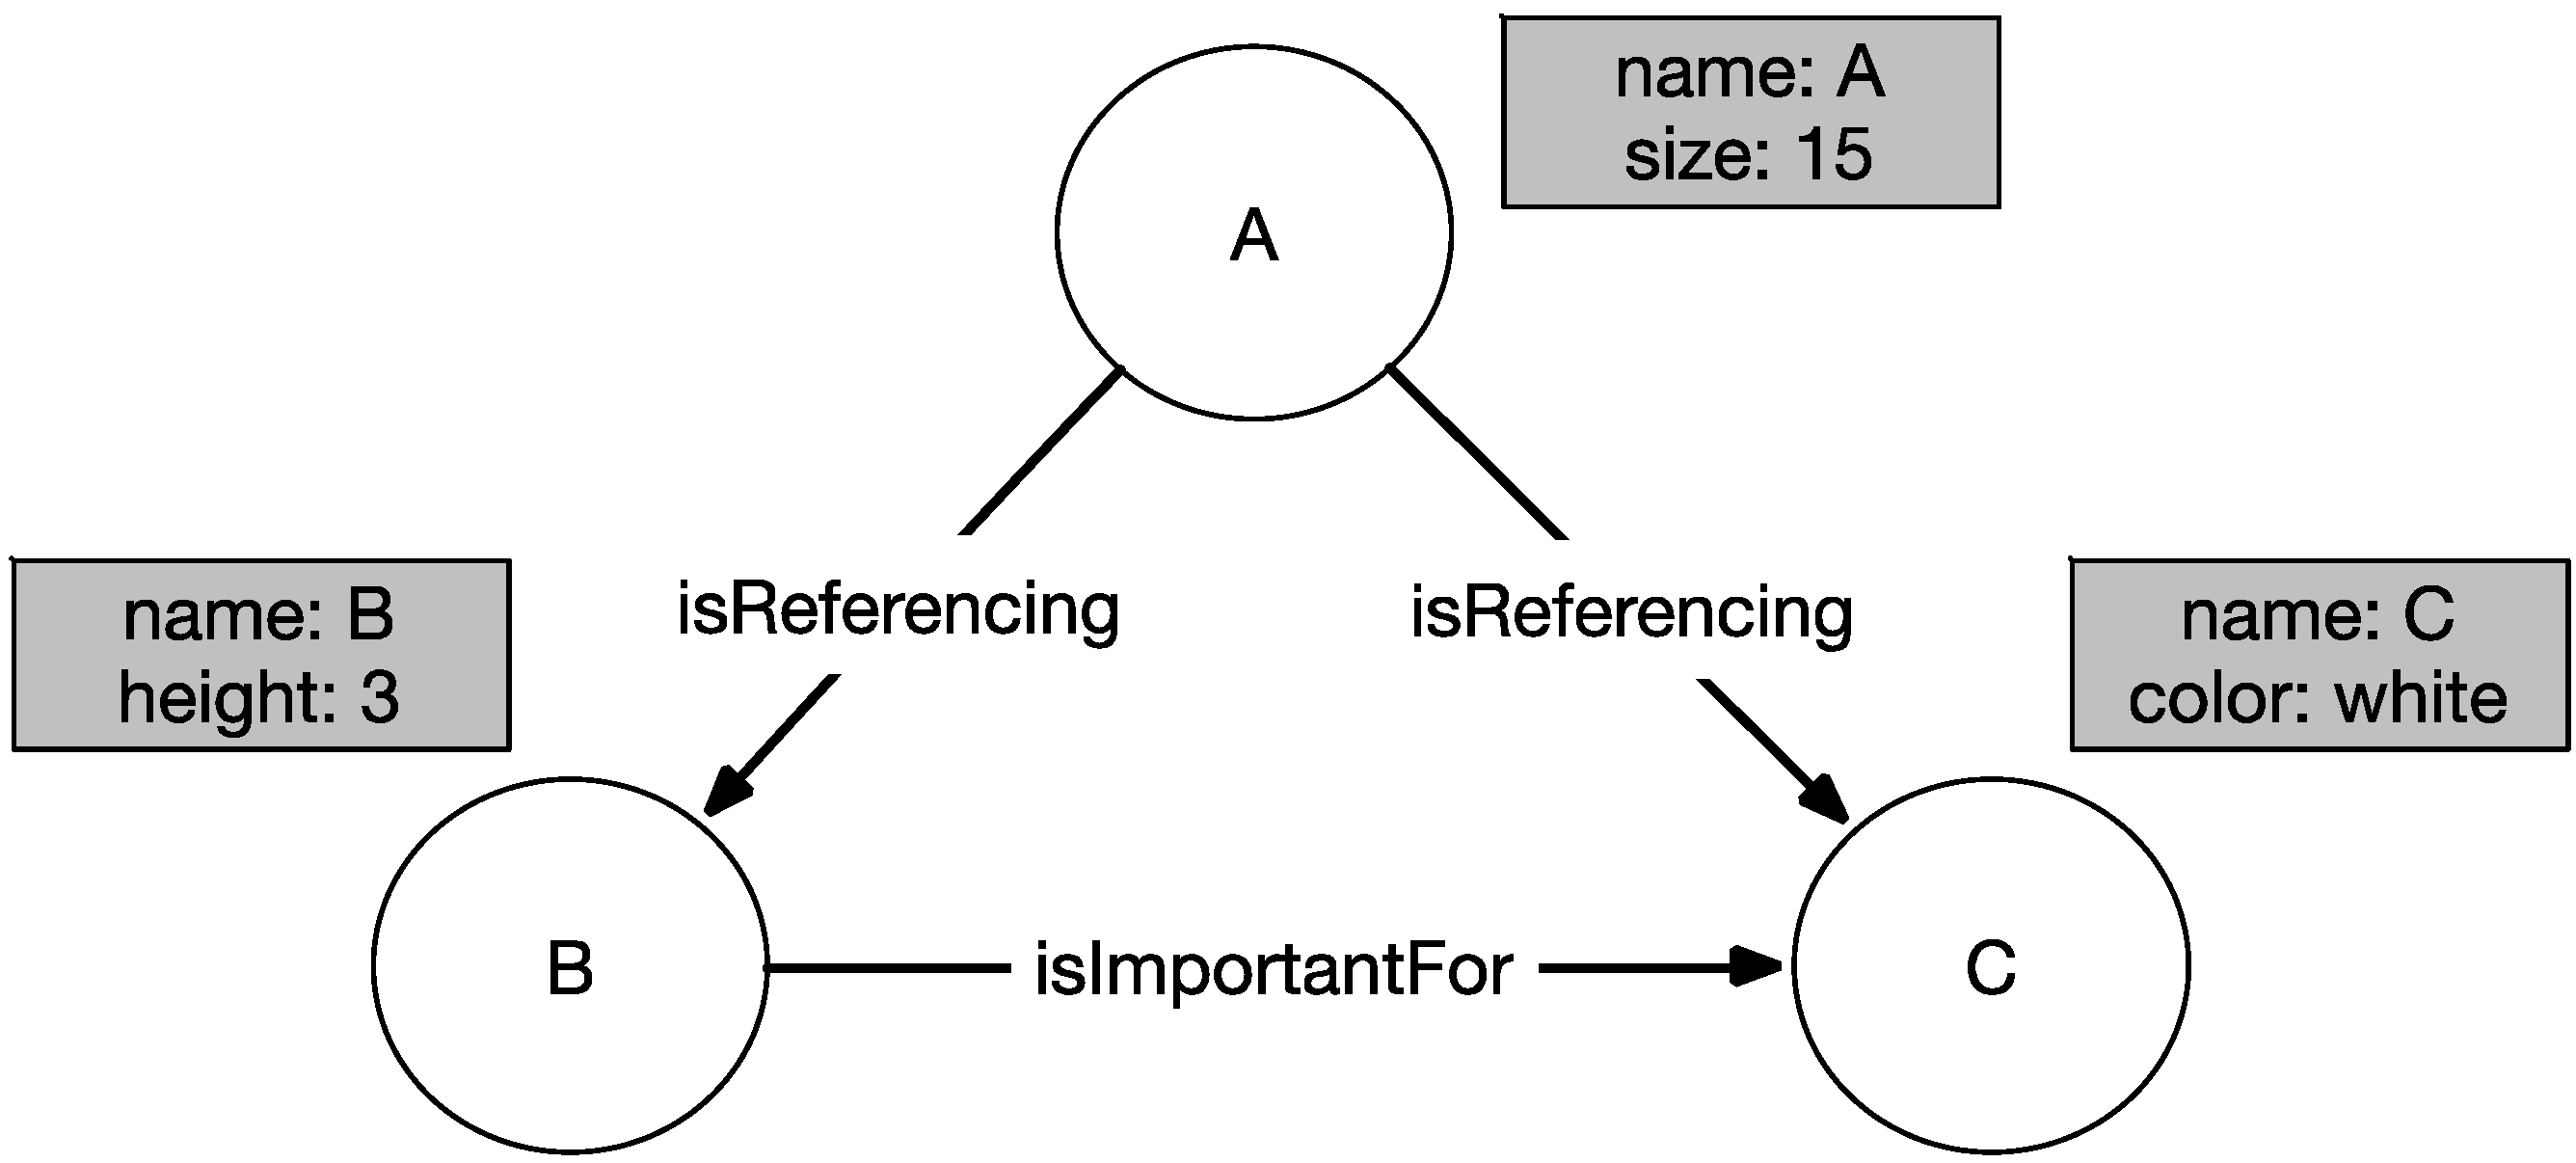
2.2. Graph Databases and Applications

In comparison to relational databases, graph databases do not contain data tables and attached data schemata. Instead, data are represented in the form of nodes, which hold all associated data attributes and values for each single entity. As there is no schema, each entity can comprise different data attributes. In order to express relationships between entities, the nodes are connected via edges. Each node can have 0 to n different relationships, which, in return, can have their own attributes and values. An example of such a graph can be seen in Figure 1. From the authors’ point of view, graph databases feature three distinct advantages over their relational counterparts.
Figure 1. Simple graph network of three nodes with their values and relationships.
Remotesensing 07 09473 g001
Firstly, as networks are common in a human environment, e.g., street networks, social networks, or real-life social ties, it is easier to develop the data model in a UML-like style, which can then directly be transferred into the database.
The structure of the model can still be seen, as it is not obscured by hundreds of thousands of Excel-like data rows. The second advantage directly connects to the first benefit in terms of the structure of the data model. Ontologies can already be visualized and structured as a tree, which is in fact a graph model itself. Therefore, transferring this tree graph into the database is as straightforward as any other graph model. In addition, no join operations have to be performed over several tables. This means that no redundant data are recorded nor are complex queries required to retrieve strongly connected datasets. Last but not least, well-established graph algorithms can be applied to query the data model. This provides the possibility of issuing queries regarding data values but also regarding the structure of the graph itself. One example of such an algorithm is the calculation of the shortest path between two nodes via Dijkstra’s algorithm or the A* algorithm [21].
One way to describe such graph relations within the domain of the semantic web is the Resource Description Framework (RDF) [22]. Entries within this data model consist of triples in the form of subject-predicate-object. In order to query this data model, the querying language SPARQL [23] was introduced. SPARQL can be described as a graph matching language consisting of three major parts: (i) the pattern-matching-related part that includes features of interests; (ii) the solution modifiers, representing common modifiers towards the before-created pattern such as ORDER or DISTINCT; (iii) and the output, e.g., yes/no answers to queries [24].
Several graph databases have become established throughout the market and community, including Neo4j [25], GraphDB [26], Sesame [27], OrientDB [28], or AlegroGraph [29]. Their applications are manifold: models of biochemical pathways [30], graph data management for biology [31], the analysis of social networks [32], recommendation engines [33], or aggregation and networking platforms for big open legal data [34]. For an in-depth review of the graph database research field, please refer to [7].

2.3. Advantages of Graph-Based Approaches for Classification Tasks

The task of classification via pattern recognition can be divided into three main categories [35]: (i) unsupervised; (ii) semi-supervised; and (iii) supervised. Within the area of unsupervised learning, it is the aim to reveal hidden patterns within large sets of data. These data are not labeled and therefore the algorithm cannot distinguish between erroneous or positive results. Semi-supervised approaches make use of both, labeled and un-labeled data, to improve classification results, while supervised methods build heavily on labeled data. The issue with labeled data is that it comes with high costs regarding the preparation of high quality gold-standard data. Supervised approaches make heavy use of labeled data to infer a function that fits the kind of data, which, in return, can then be used to classify data of within the same area and application context.
From the authors’ point of view, the semi-supervised approach with graphs has strong advantages within the area of remote sensing and the classification of sensor data in general. The labeled data nodes can be gained by examining the ontology including all the expert knowledge required within the domain of application. The unlabeled, to-be-classified sensor data can then be combined with the ontology data and, therefore, the classification becomes possible. This approach enables the usage of graph-based data stores and therefore no additional classification environment has to be introduced. Furthermore, the speed of graph/RDF-based solutions in terms of response time for data and classification queries is suitable for real-time applications, which is an important asset within the area of the semantic web. In addition, the high level of expressiveness with graph-based languages opens new opportunities for user interactions.

3. Data and Methods

This section of the paper focuses on the kind of remote sensing data to be classified, the ontology the classification is based on, as well as a detailed description about the evaluation workflow, including the accuracy assessment and the necessary technology stack.

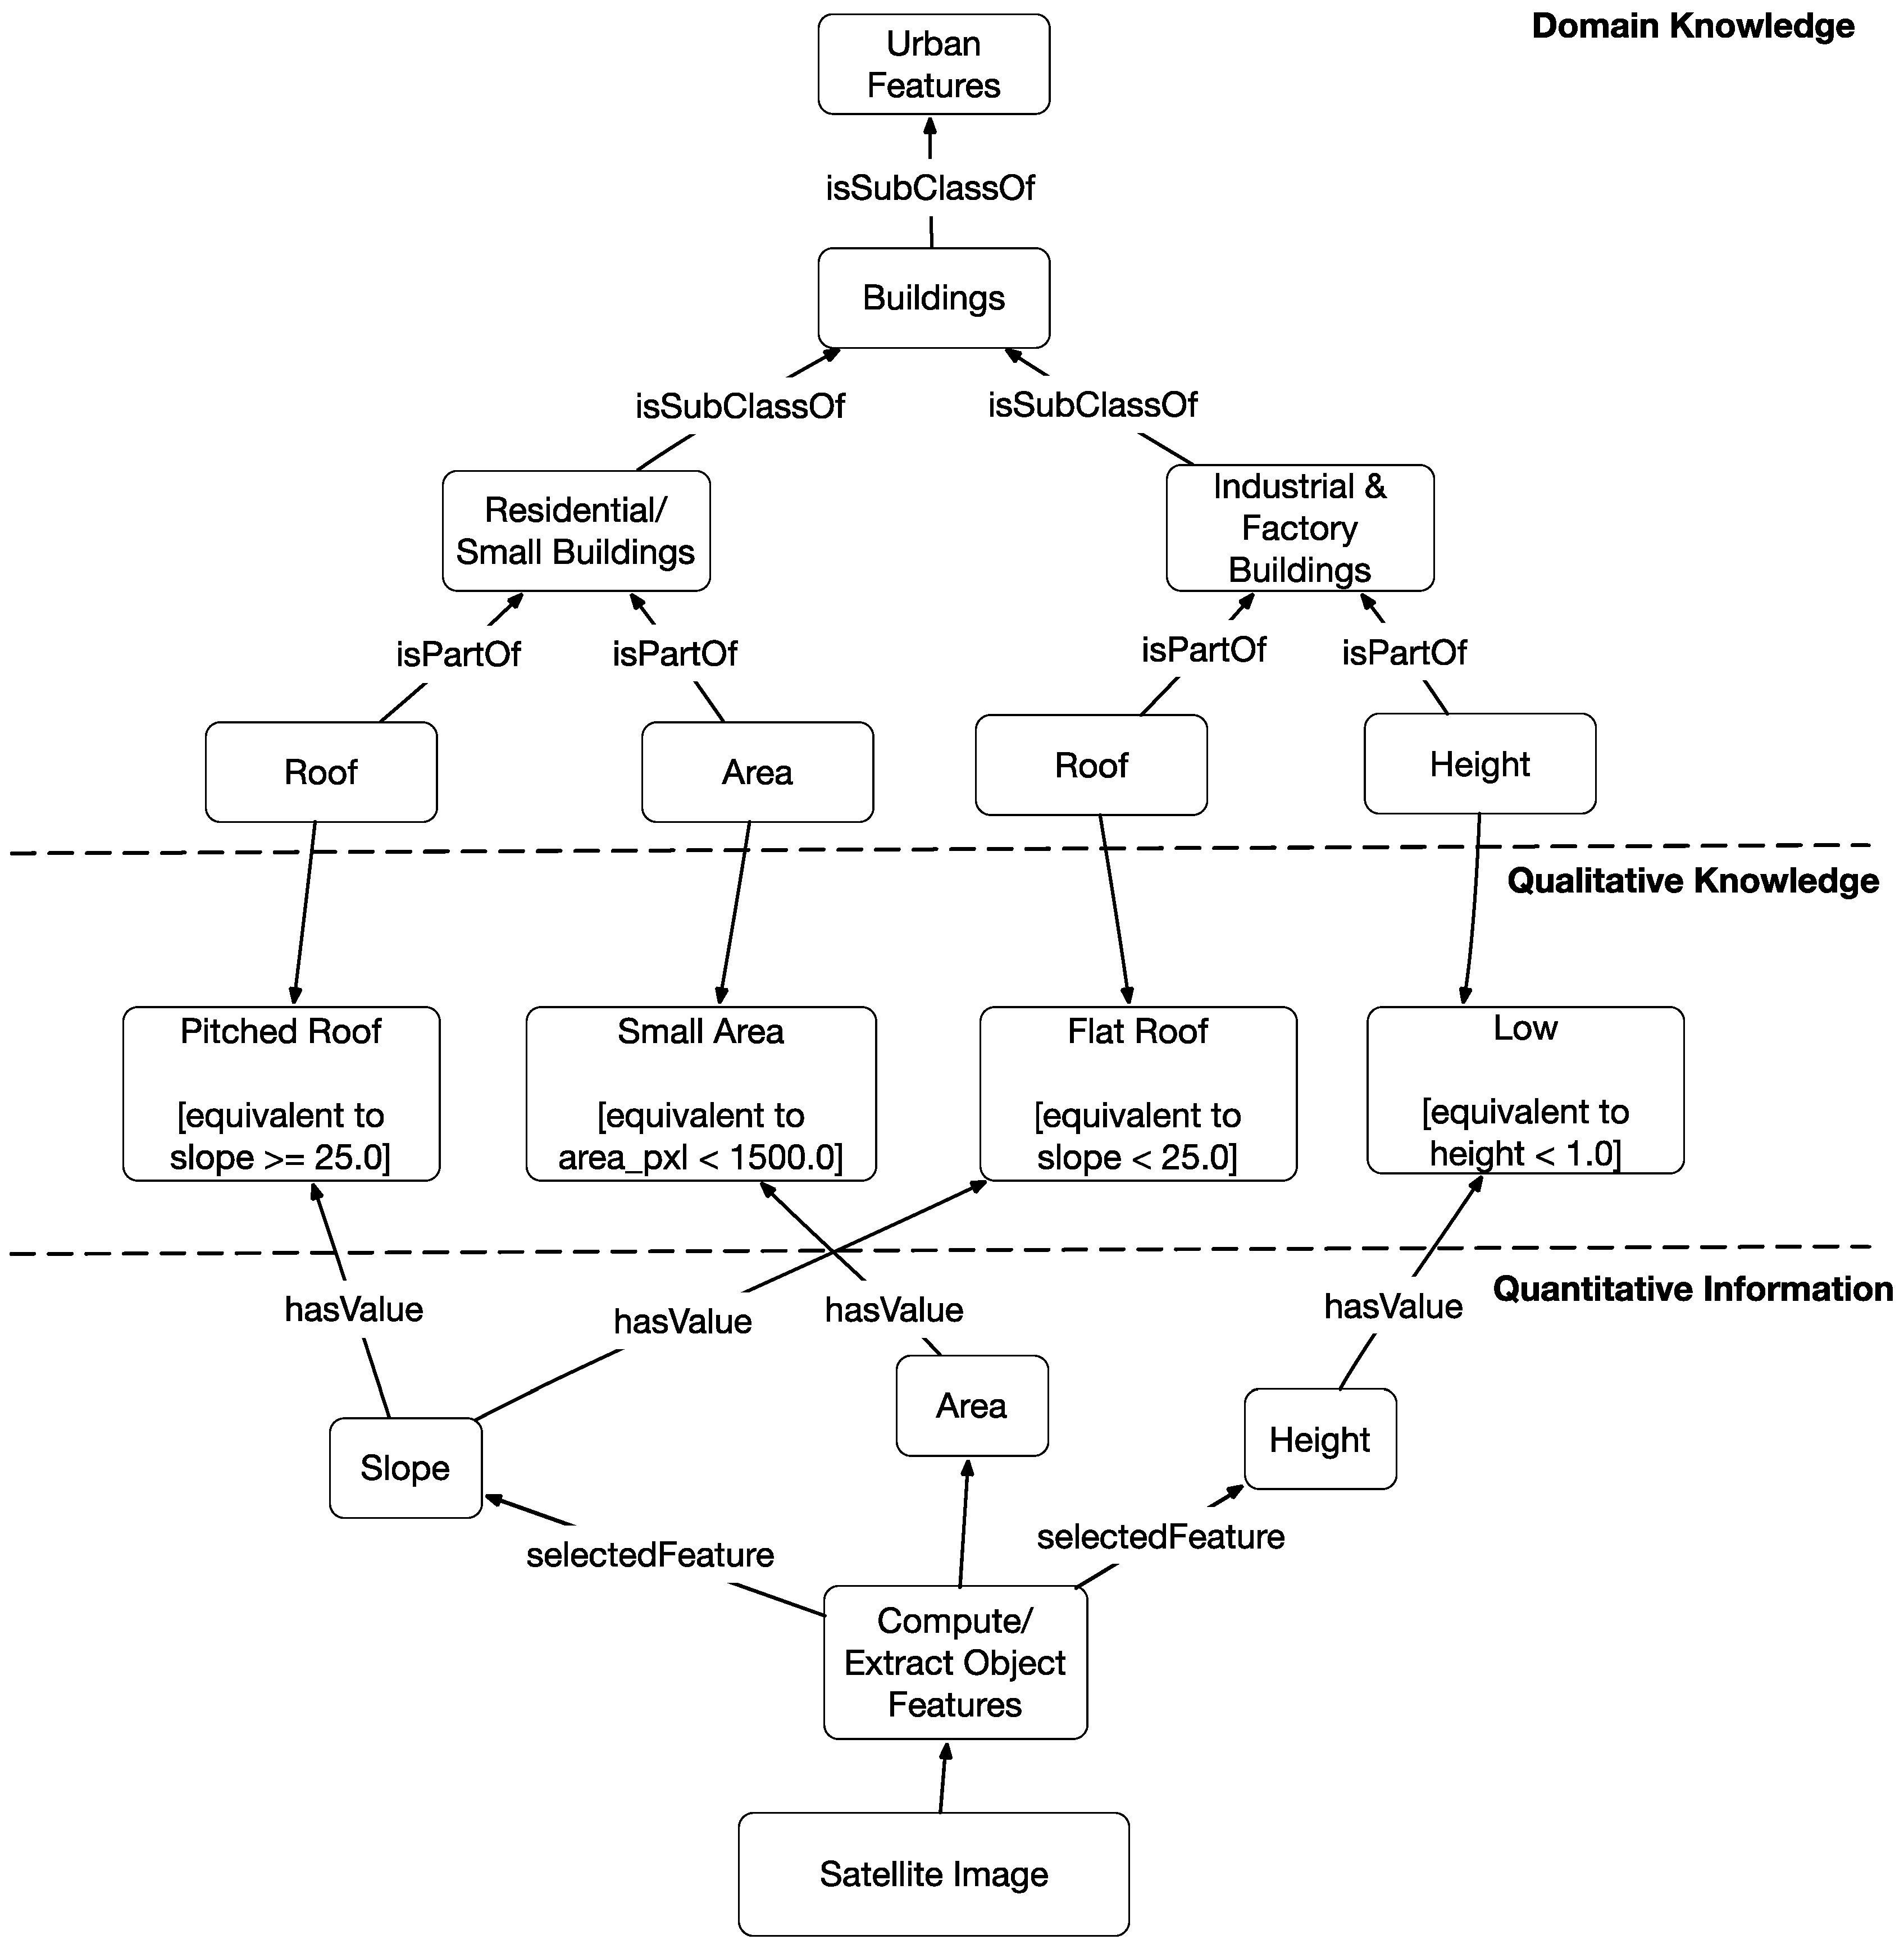
3.1. Remote Sensing Data and the Associated Ontology

For the purpose of this paper, the authors adopted the real-world example of Belgiu et al. [18]. They used Airborne Laser Scanning data (ALS) as the remote sensing data source. From these data, they extracted the footprints of buildings, which were then the objects to be classified into different building categories. These footprints feature common attributes such as the area a footprint occupies, the rectangular fit, the shape index, or density. Due to the use of ALS data, additional object attributes such as the slope of the buildings’ roof as well as the buildings’ height could be calculated as well, using a normalized Digital Surface Model (nDSM).
In total, about 800 delineated objects were classified. This number is too low for the purpose of this paper, as the authors want to demonstrate the impact of larger sets of domain objects on the computational performance regarding the time consumption for the classification process. Thus, the authors created a simulation environment to generate samples based on the delineated objects and their features as described by Belgiu et al. [18]. The environment creates sets of the following sample sizes: 100, 250, 500, 1000, 2500, 5000, and 10,000 samples. Table 1 shows the distribution of object categories within the sample sets.
Table 1. Distribution of class objects within each sample size.
Sample SizesResidential BuildingsIndustrial BuildingsOther Buildings
100252550
2505050150
500125125250
1000250250500
25005005001500
5000125012502500
10,000250025005000
Each of these samples consists of three different object categories: ResidentialBuilding, IndustrialBuilding, and OtherBuilding. The sample generator creates objects with random values, yet they are within the specific range for each object category.
At the same time, the generator tags each object to note its object category. By doing so, these tags can later be used for accuracy assessment as the tag can then be compared with the actual classification result for each object. For the knowledge base on which the classification process is based on, the authors adopt the ontology used by Belgiu et al. [18] in order to be consistent with the used data. The employed ontology can be seen in Figure 2.
The authors of this paper adopted the two classes Residential Buildings and Industrial Buildings for their classification process. The qualitative knowledge within this ontology is modeled via an Equivalent Classes expression in OWL. For example, an object will be classified as a member of the Pitched Roof class, if it features an attribute slope with a value of equal or larger than 25.0. An example of such an Equivalent Classes expression can be seen in Listing 1.
Listing 1. EquivalentClasses expression for class PitchedRoof.

    <EquivalentClasses>
     <Class IRI="#PitchedRoof"/>
            <DataSomeValuesFrom>
            <DataProperty IRI="#slope"/>
                   <DatatypeRestriction>
                         <Datatype abbreviatedIRI="xsd:double"/>
                               <FacetRestriction facet="&xsd;minInclusive">
                               <Literal datatypeIRI="&xsd;double">25.0</Literal>
                               </FacetRestriction>
                    </DatatypeRestriction>
     </DataSomeValuesFrom>
</EquivalentClasses>
The authors are aware of the impact of the chosen thresholds for the transferability of the modeled knowledge to other study areas. However, as the focus of this paper is not on transferability of ontologies, nor the increase of classification accuracy for building detection, reasonable values have been selected.
Figure 2. Structure of applied ontology for the classification process.
Remotesensing 07 09473 g002

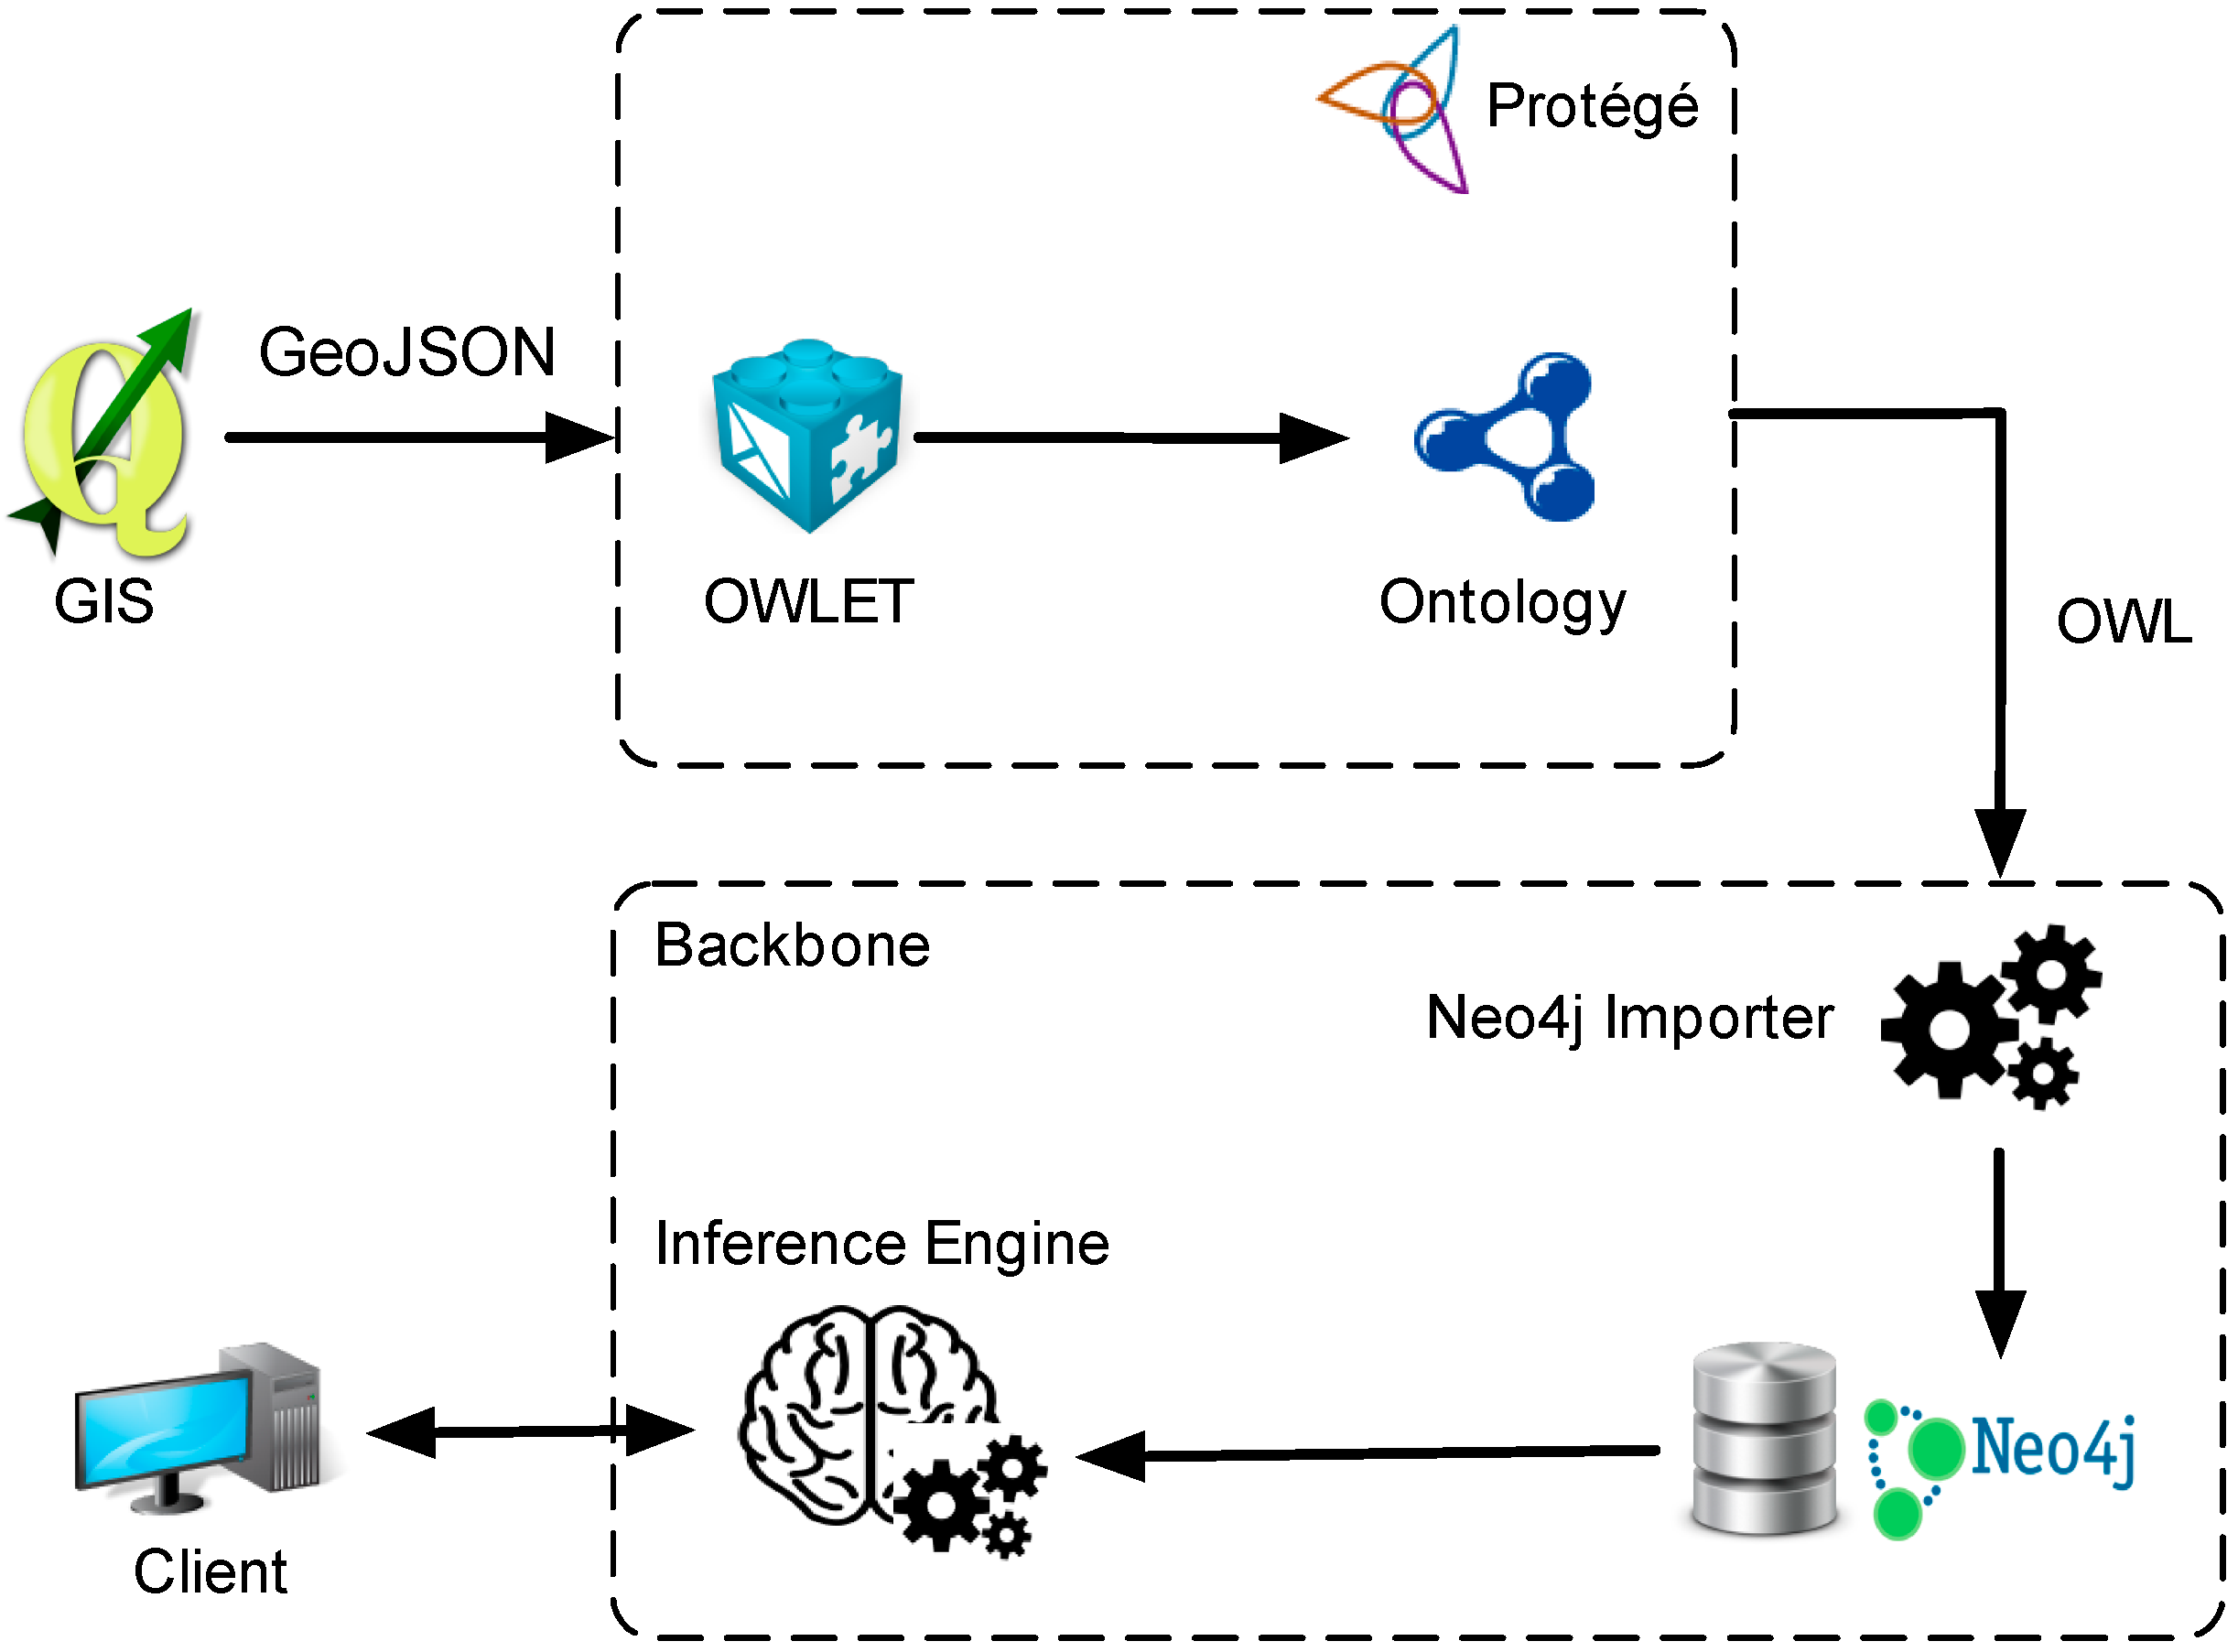
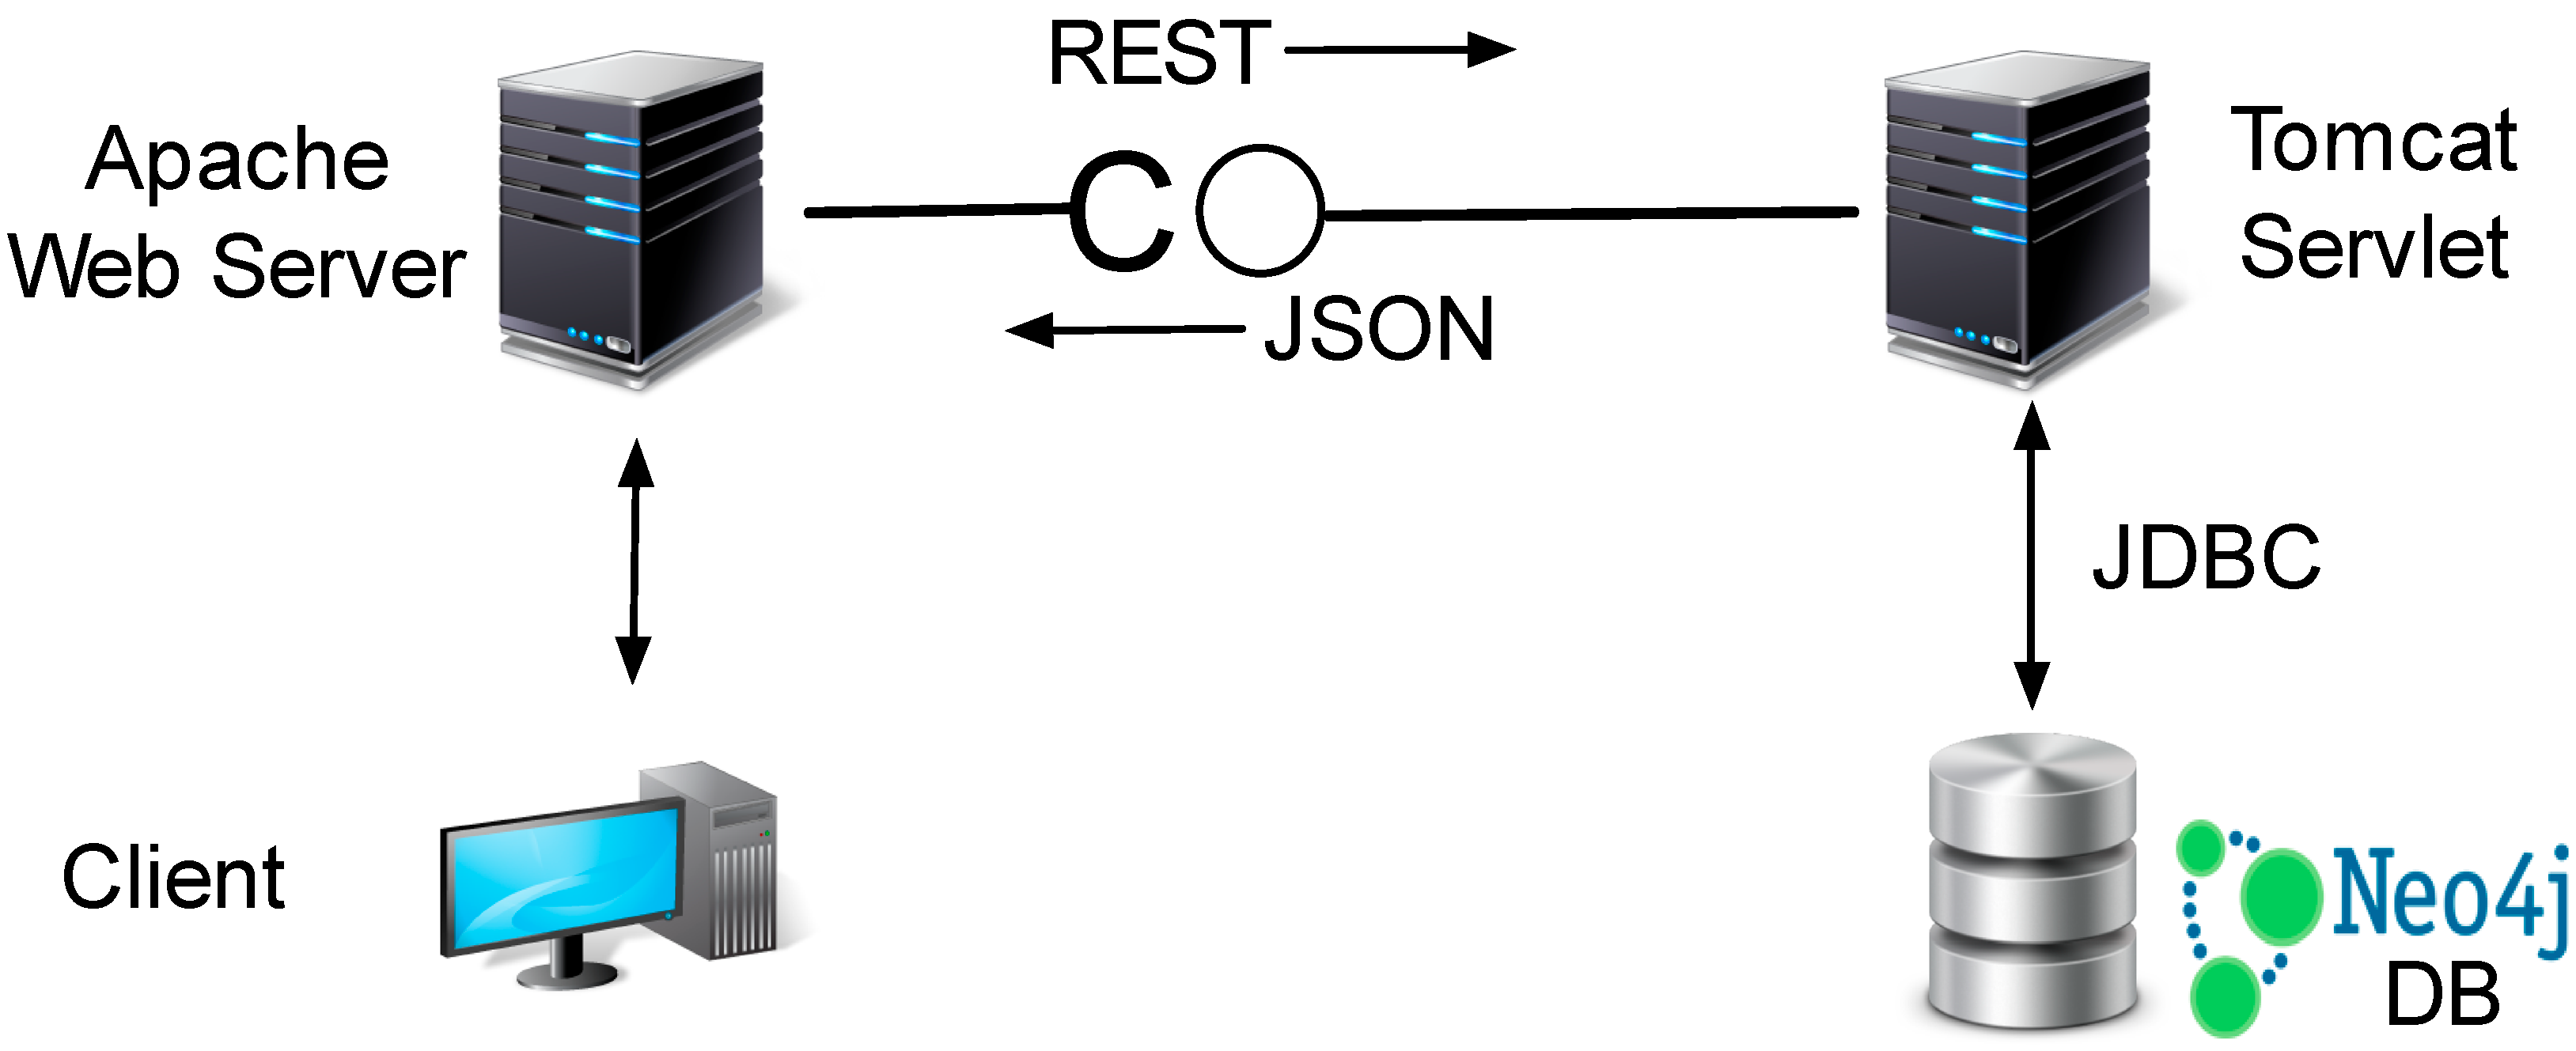
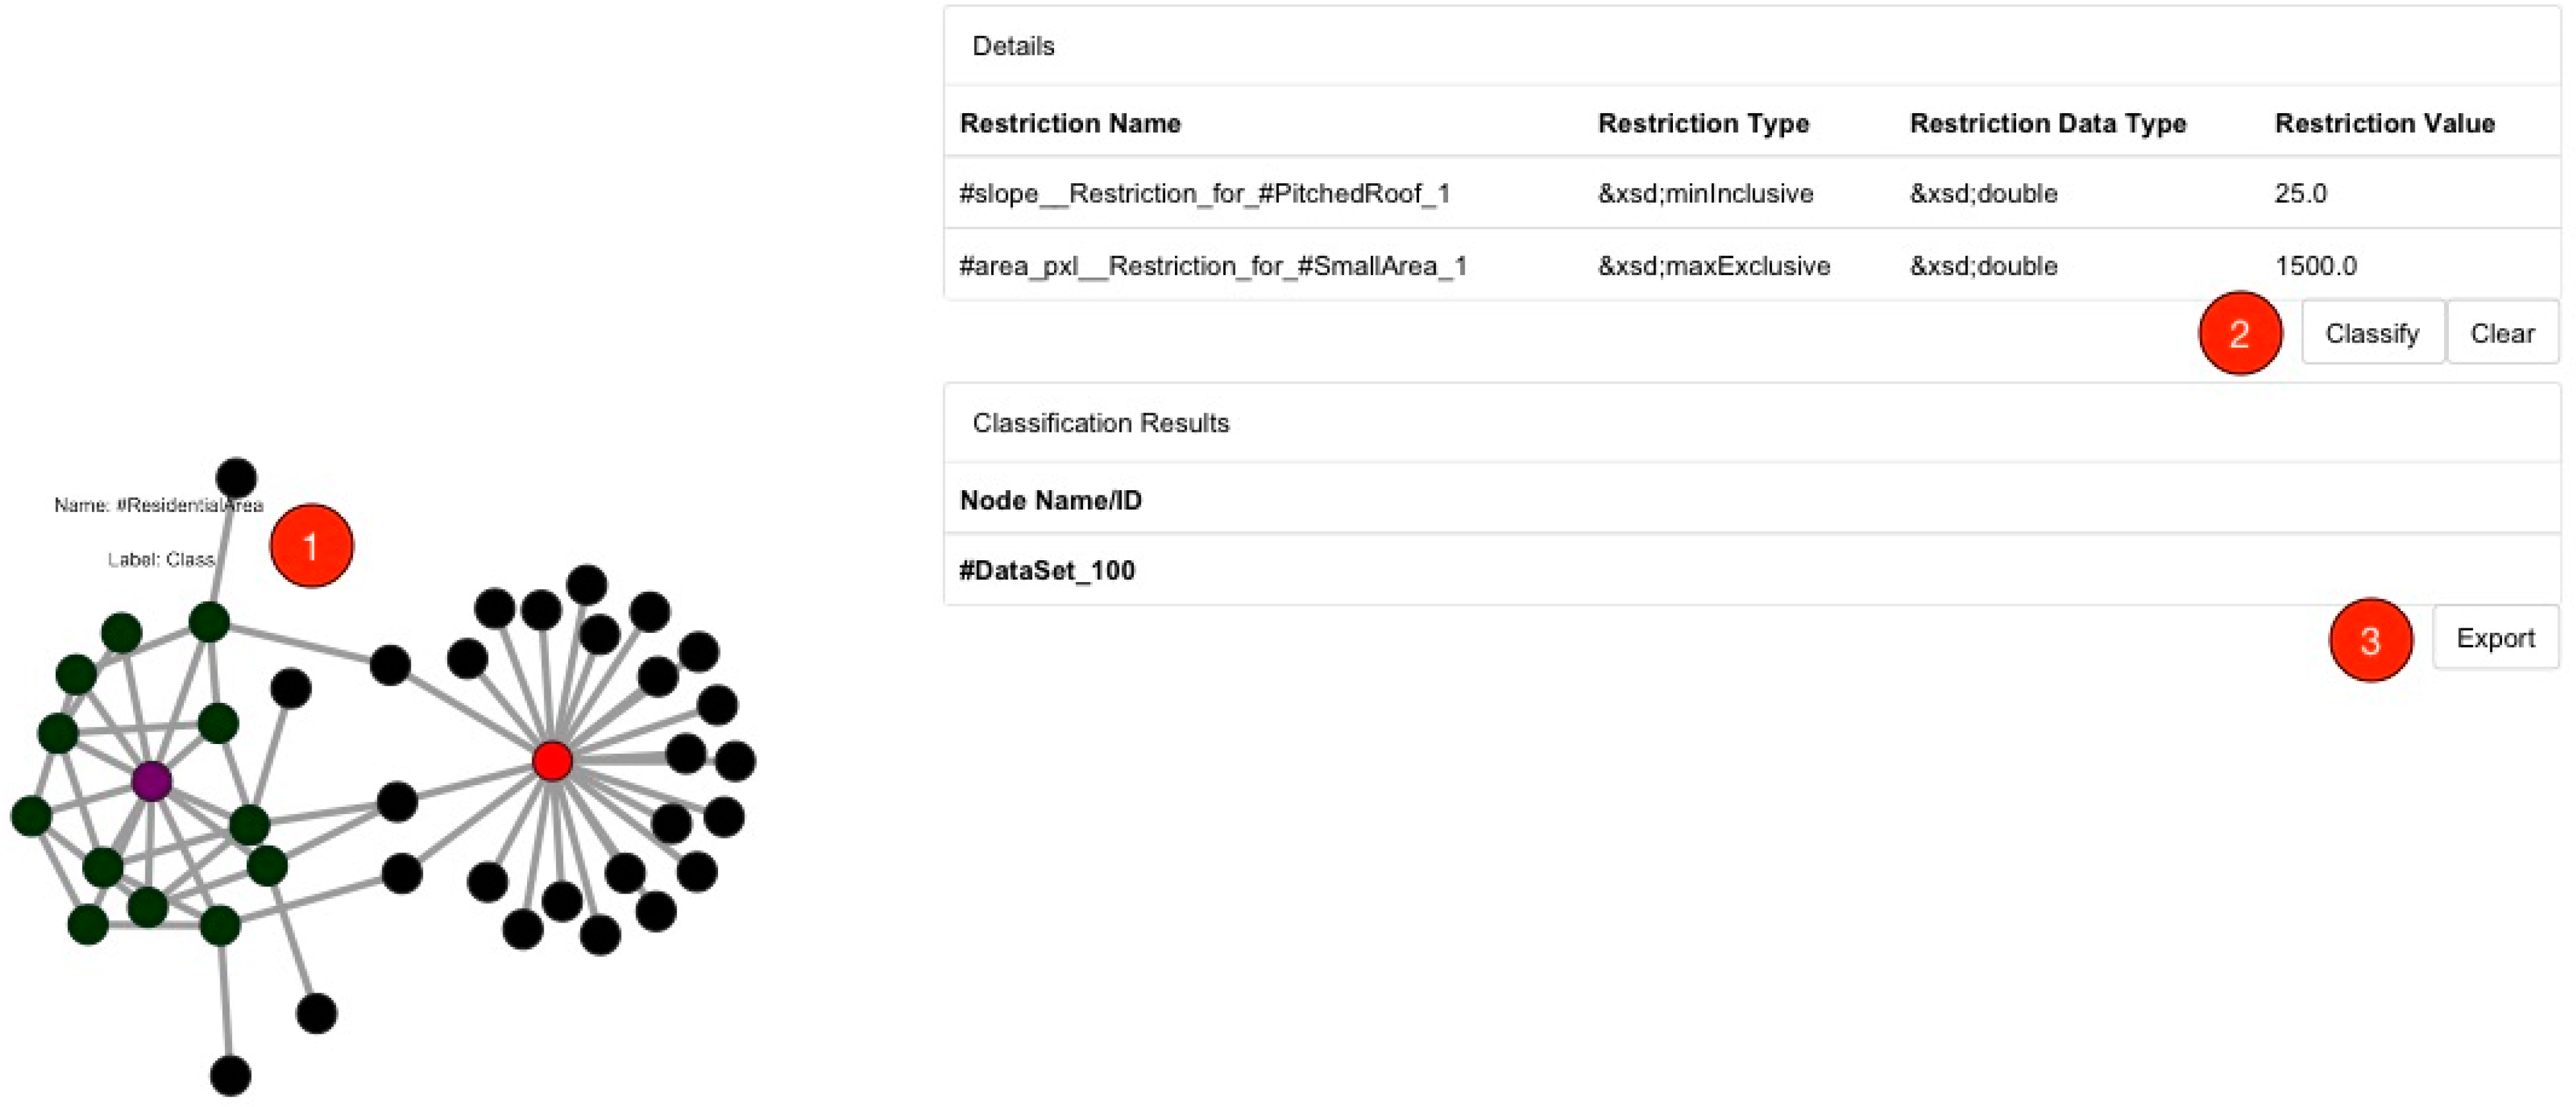
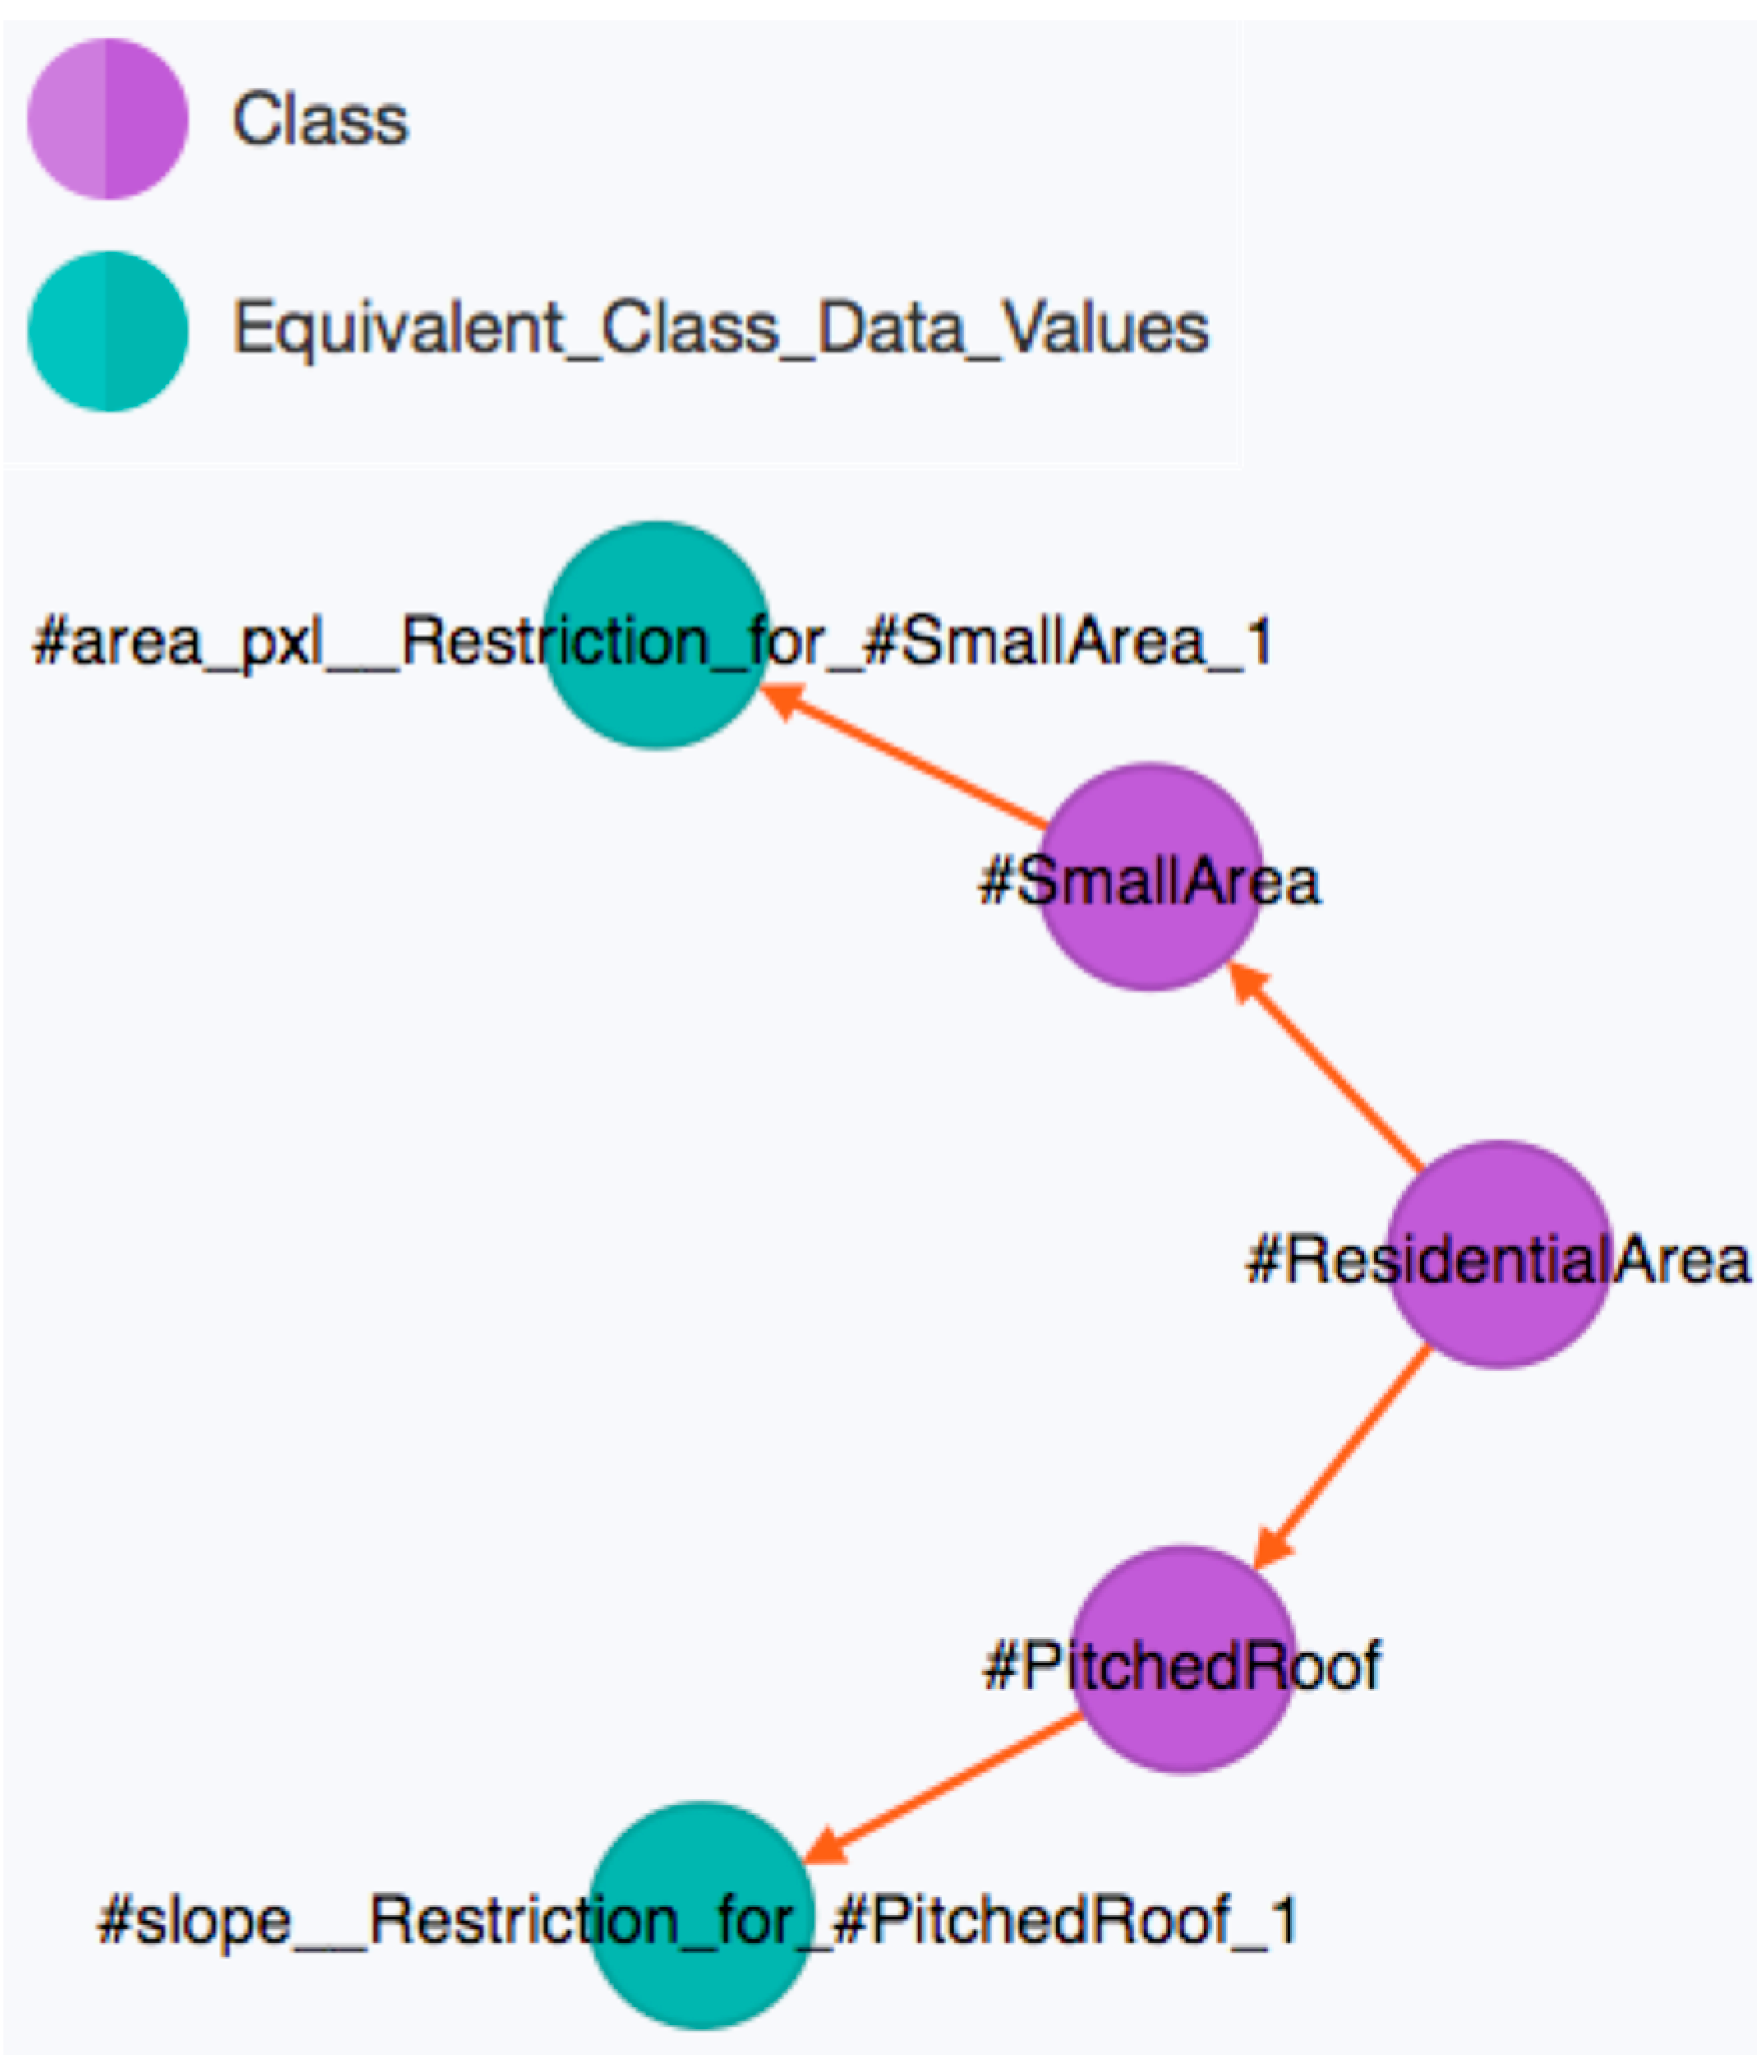
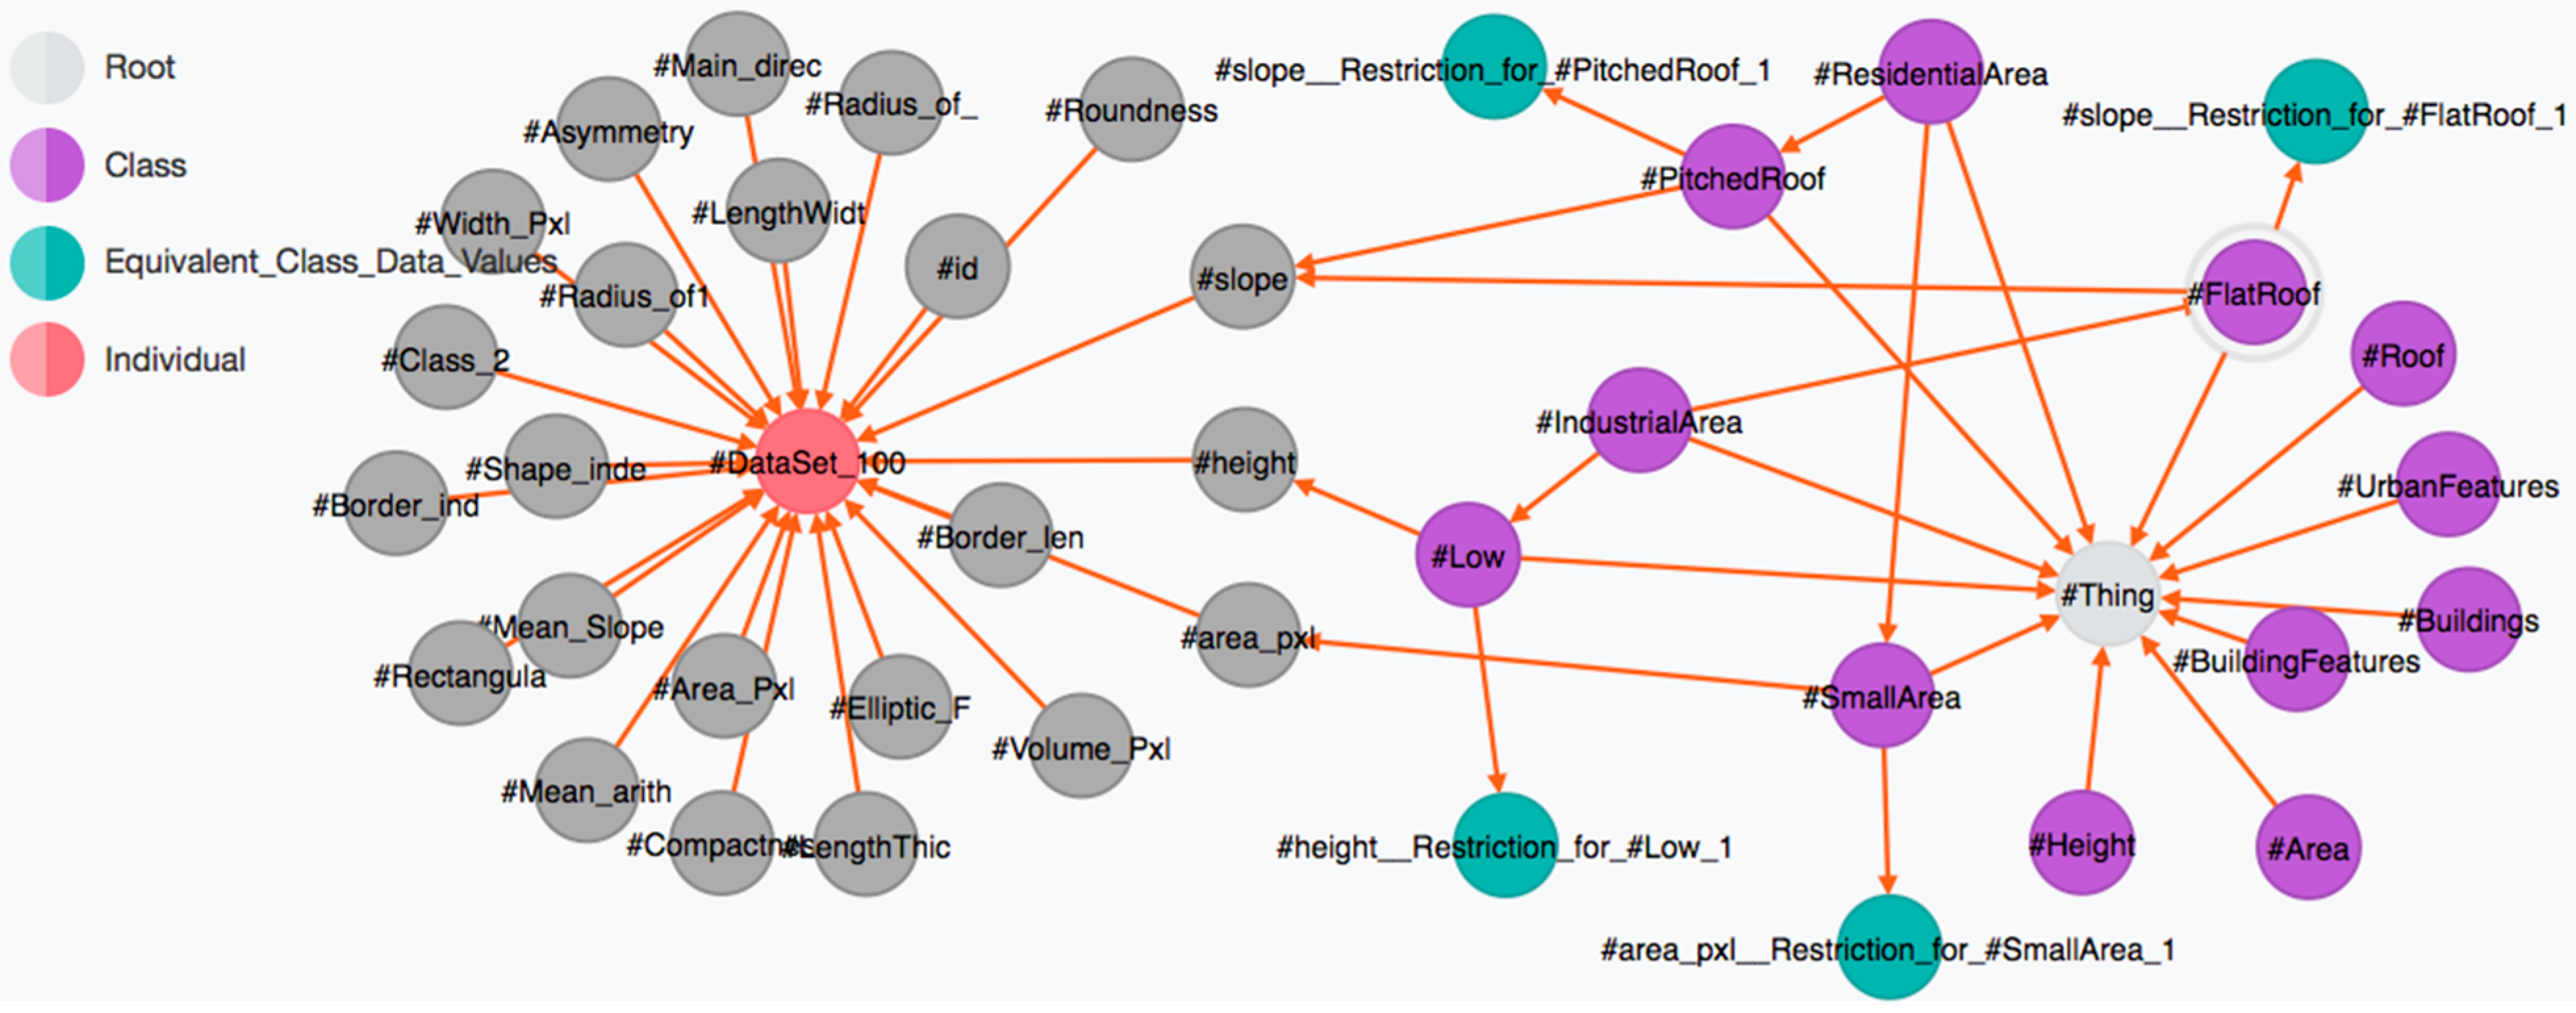
3.2. Neo4j-Based Classification Workflow

This section describes the details of the Neo4j-based workflow as it can be seen in Figure 3. The workflow starts at an already segmented image in the form of a shape file within a GIS environment such as Quantum GIS [36]. For the sake of completeness, the authors want to state that they are fully aware of the impact of the overall segmentation process, its issues, and challenges [9,37].
However, as the segmentation process itself is not the focus of this paper, the authors assume a satisfying segmentation result to begin with. In the next step, the OWLET plugin for Protégé [4] is employed. This plugin allows the import of the segments with all their attributes and values as individuals (domain objects) into the ontology. This enriched ontology can then be imported via the Neo4j importer module of the architecture. The importer in its current state supports basic OWL components such as classes, sub-classes, object properties, data properties, restrictions, and individuals. What the importer does is to parse the XML structure of the OWL file, and extract all required information to created nodes and relationships within the graph database. The open source Neo4j graph database was used, as it is one of the most widely employed graph solutions and the authors of this paper can already build on previous experiences with this database. Users can then issue queries from a web-based client to the inference engine. Figure 4 presents the user interface of the platform. The user has two possibilities to issue queries for a concept to the inference engine. The first is to select a node of interest out of the graph visualization (1). When hovering over a specific node, all attached attributes and values for this node are shown. After clicking on the node of interest, the details list (2) then displays all restrictions of this class, which need to be satisfied in order to classify a domain object accordingly.
Figure 3. Workflow of the proposed Neo4j-base approach.
Remotesensing 07 09473 g003
Figure 4. Web-based frontend to issue queries to the system.
Remotesensing 07 09473 g004
If the detailed description satisfies the user’s needs, a click on the “classify” button starts the inference engine. The results of all classified domain objects are then displayed in the results list (3) and can be exported into a CSV file.
The frontend communicates via a REST service [38,39] with the inference engine (see Figure 5). The engine is hosted on a Tomcat server within a servlet container. A unique instance is created for each request and, therefore, the solution offers multi-user capabilities right away.
Figure 5. Communication between frontend and backend.
Remotesensing 07 09473 g005
In the first step, queries formulated within the Cypher language [40] are issued to the database system. Cypher is a declarative query language for Neo4j and tries to mimic ASCII art [41] in order to ease the transfer process from the “drawn” model to the actual query. The applied queries can be seen in Listing 2 and Listing 3.
Listing 2. Cypher query to retrieve all restrictions for one class for the classification process.

MATCH (startTable { name:'#ResidentialArea'}),(endTable:Equivalent_Class_Data_Values),
  paths = (startTable)-[*..15]->(endTable)
    return filter(x IN nodes(paths) WHERE x:Equivalent_Class_Data_Values)
Listing 3. Cypher query to retrieve all distinct individuals that are suitable for classification.

MATCH (startTable { name:'#ResidentialArea' }),(endTable:Individual),
  paths = (startTable)-[*..15]->(endTable)
    return DISTINCT filter(x IN nodes(paths) WHERE x:Individual)
The first query (Listing 2) is responsible for gathering all restrictions that apply for the desired class to be used for the classification process. In this sample case, all restrictions for the class #ResidentialArea are detected. The authors then calculate all possible paths from the starting point #ResidentialArea towards the end point Equivalent_Class_Data_Values.
Equivalent_Class_Data_Values is a node label used within the graph model. Within Neo4j, it is possible to tag every node with a label, which could then be used to build a search index or to filter for specific nodes.
The expression [*..15] denotes that up to 15 hops are allowed between the start and endpoint. This value was chosen for practical reasons and can be adapted if required. Modifications to this threshold, together with the algorithm regarding the search (e.g., depth-first or breadth-first [42]), can heavily impact the completeness of the results as well as the query speed, and should therefore be chosen carefully. After all paths have been calculated, all nodes from the computed paths labeled as Equivalent_Class_Data_Values are filtered, and therefore contain the desired restrictions as their attributes and values (see Figure 6).
Figure 6. Visualized example of extracted restrictions for a classification concept.
Remotesensing 07 09473 g006
The second query (Listing 3) is responsible for collecting all individuals that are suitable for the classification process. To reduce the amount of individuals to the required minimum subset, the structure of the graph itself is used. During the import of the ontology, individuals were already connected to properties that are used to describe classes, if the individuals comprise the very same properties (see Figure 7).
Figure 7. Relationship between individuals and class properties.
Remotesensing 07 09473 g007
By doing so, the authors are now able to retrieve only those individuals, which share properties that are used within the restrictions (DatatypeRestriction) as well. In consequence, no individuals have to be found and checked that would have already been negatively classified, as they would not feature the restrictions’ properties.
As there is the possibility for individuals to be found several times, due to multiple paths leading to them, the results are then filtered in order to only collect DISTINCT individuals.
After both queries are completed, the restrictions are given to the inference engine. The engine is a Java-based program that checks for each individual if all requirements from the class are fulfilled. As the current version of the OWLET plugin only supports double values, the inference engine was also programmed to handle double values as a starting point. The engine is not only capable of threshold identification but also checks whether values are within a certain value range. The complete process is summarized in Listing 4. After the classification process is completed, the results are transferred as JSON data back to the frontend to be displayed.
Listing 4. Procedure of the new classification process.
Procedure CLASSIFICATION
Input: Individuals, Restrictions
  begin PROPERTY_CHECK
    1: while (Individuals)
    2: while (Individual_Properties)
    3: if (Individual_Property MATCHES Restriction) then SET Classified
    4: else SET Not_Classified and break
    5: end if
    6: end while
    7: end while
  end PROPERTY_CHECK
Output: Classified Individuals

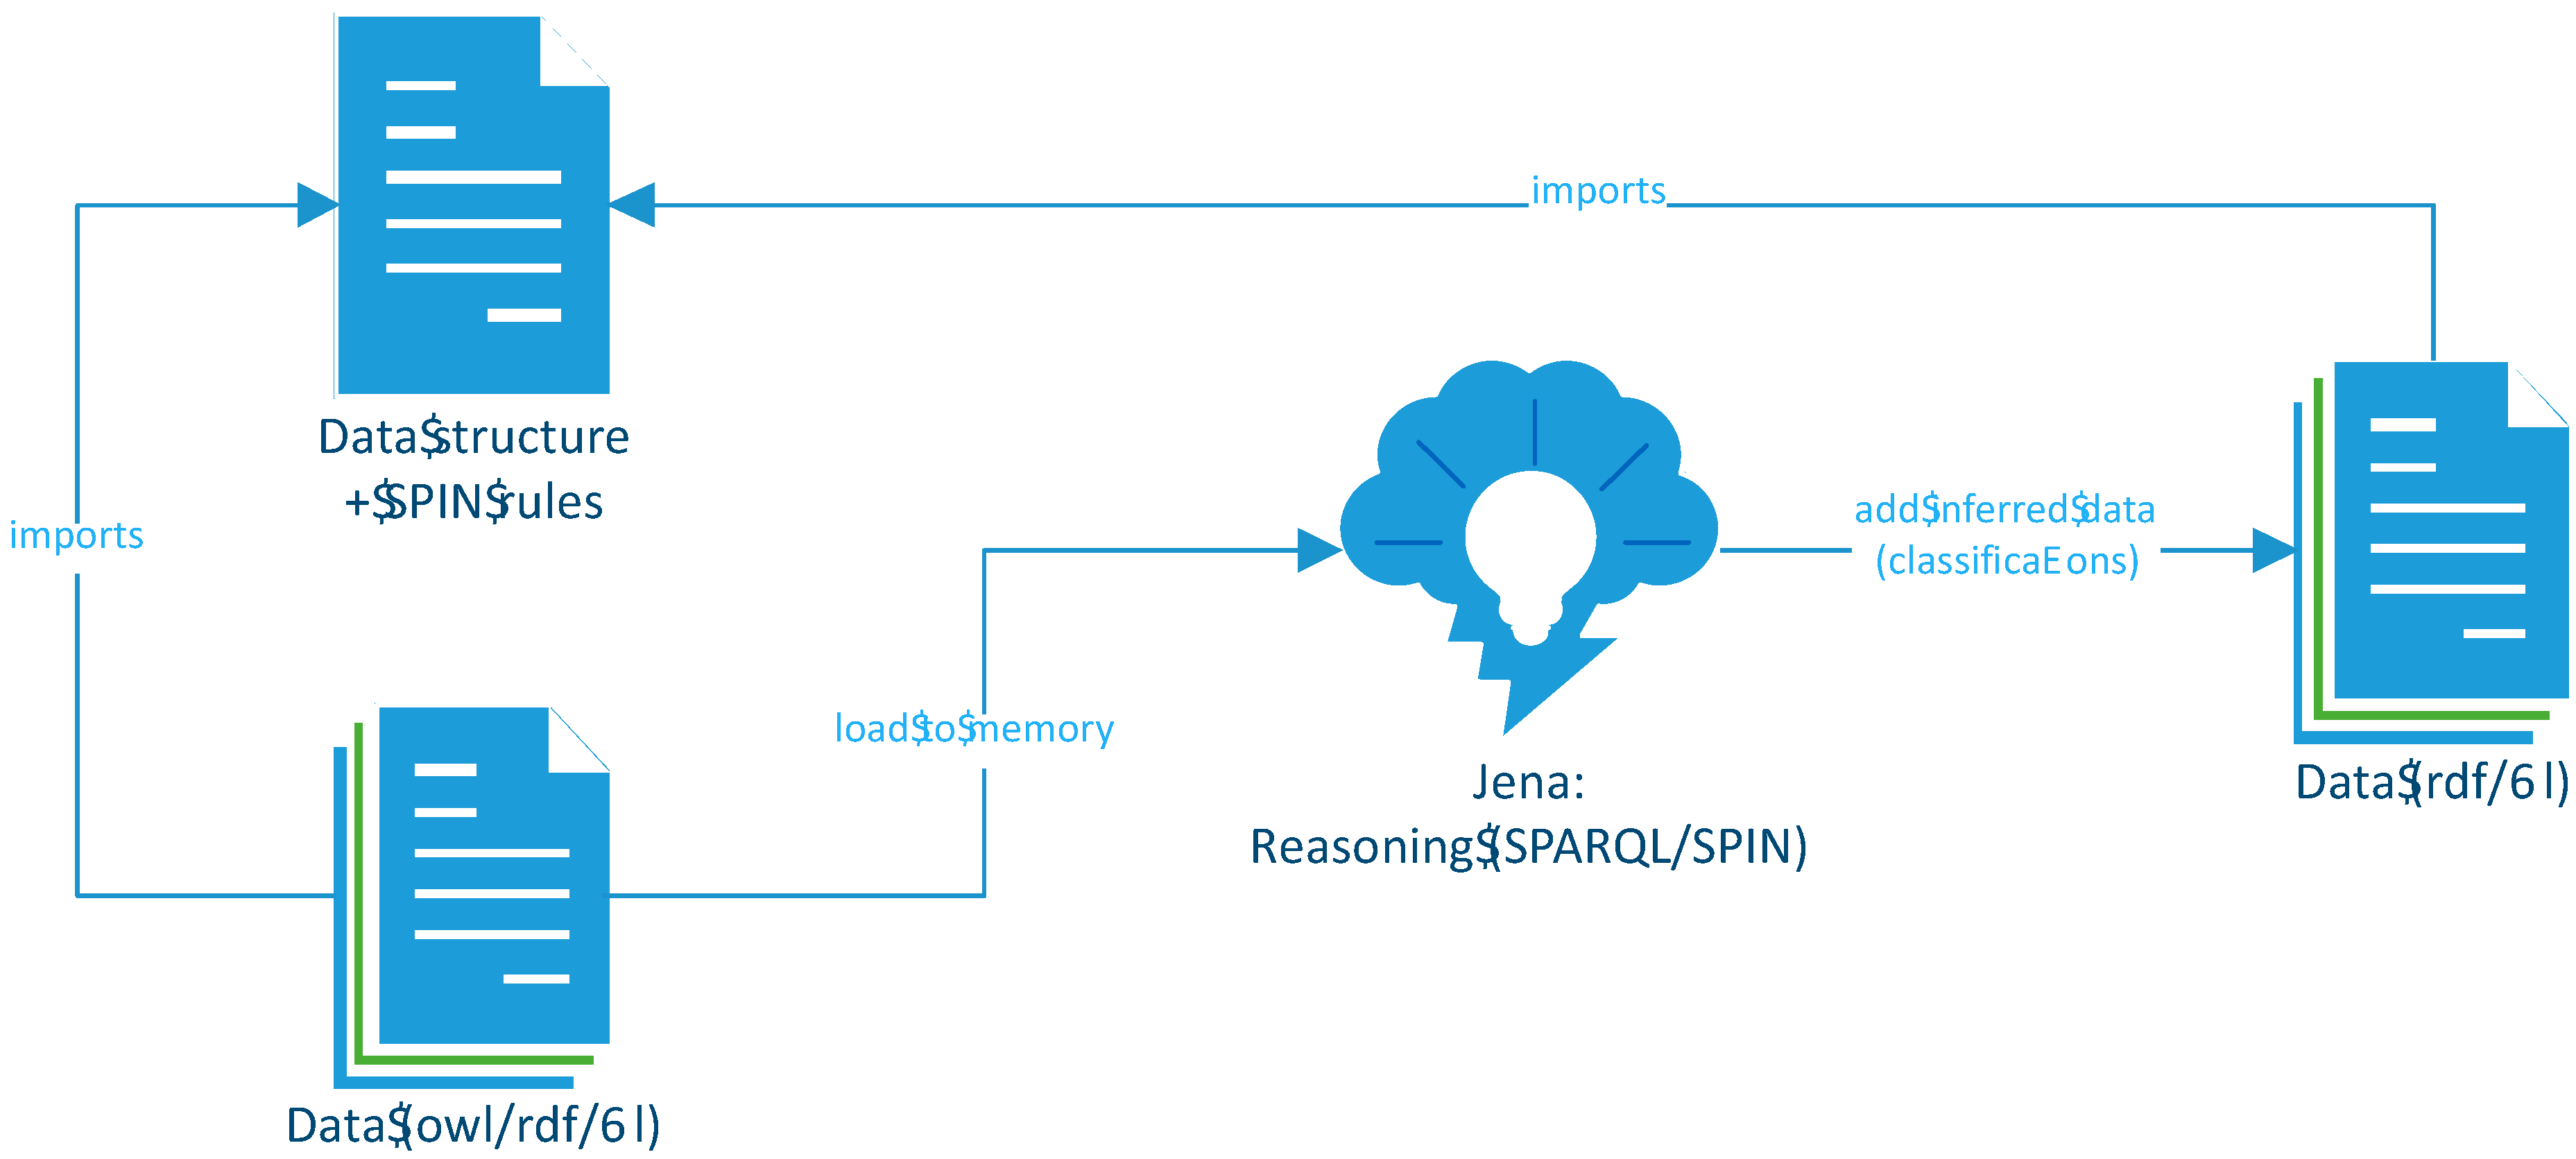
3.3. RDF/SPARQL-Based Approach

In this section of the paper, the authors present the RDF/SPARQL-based solution and the associated workflow. The general overview of this approach can be seen in Figure 8.
The input for the reasoning approach consists of two parts: (i) the data model, which is an ontology document containing the class hierarchy and the SPIN rules; and (ii) the data itself, consisting of OWL individuals. The datasets in this case import the data model via an owl:imports statement which helps to keep the data and data model separate and allows the data model to be enhanced easily. This is important as, in this use-case, new rules to further enhance the data might be added later on.
The input for the reasoning approach consists of two parts: (i) the data model, which is an ontology document containing the class hierarchy and the SPIN rules; and (ii) the data itself, consisting of OWL individuals. The datasets in this case import the data model via an owl: imports statement which helps to keep the data and data model separate and allows the data model to be enhanced easily. This is important as, in this use-case, new rules to further enhance the data might be added later on.
The resulting RDF files (data with imported data model) are then loaded into Apache Jena [43], which provides an API for manipulating RDF models. An alternative to this would be to load the data into a triple store and execute the SPARQL directly via native API or HTTP endpoint. The SPIN rules from the data model are then loaded and the SPARQL CONSTRUCT query contained in their spin: body is executed directly on the data. This creates new information, which is saved back into the ontology. This information can then be evaluated with regard to classification outcomes.
Figure 8. Workflow of the proposed RDF/SPARQL-based approach.
Remotesensing 07 09473 g008

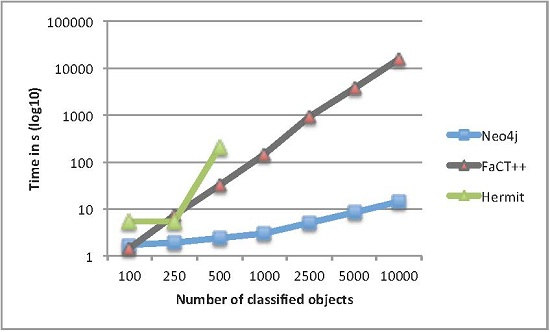
4. Benchmarking of Classification Performance

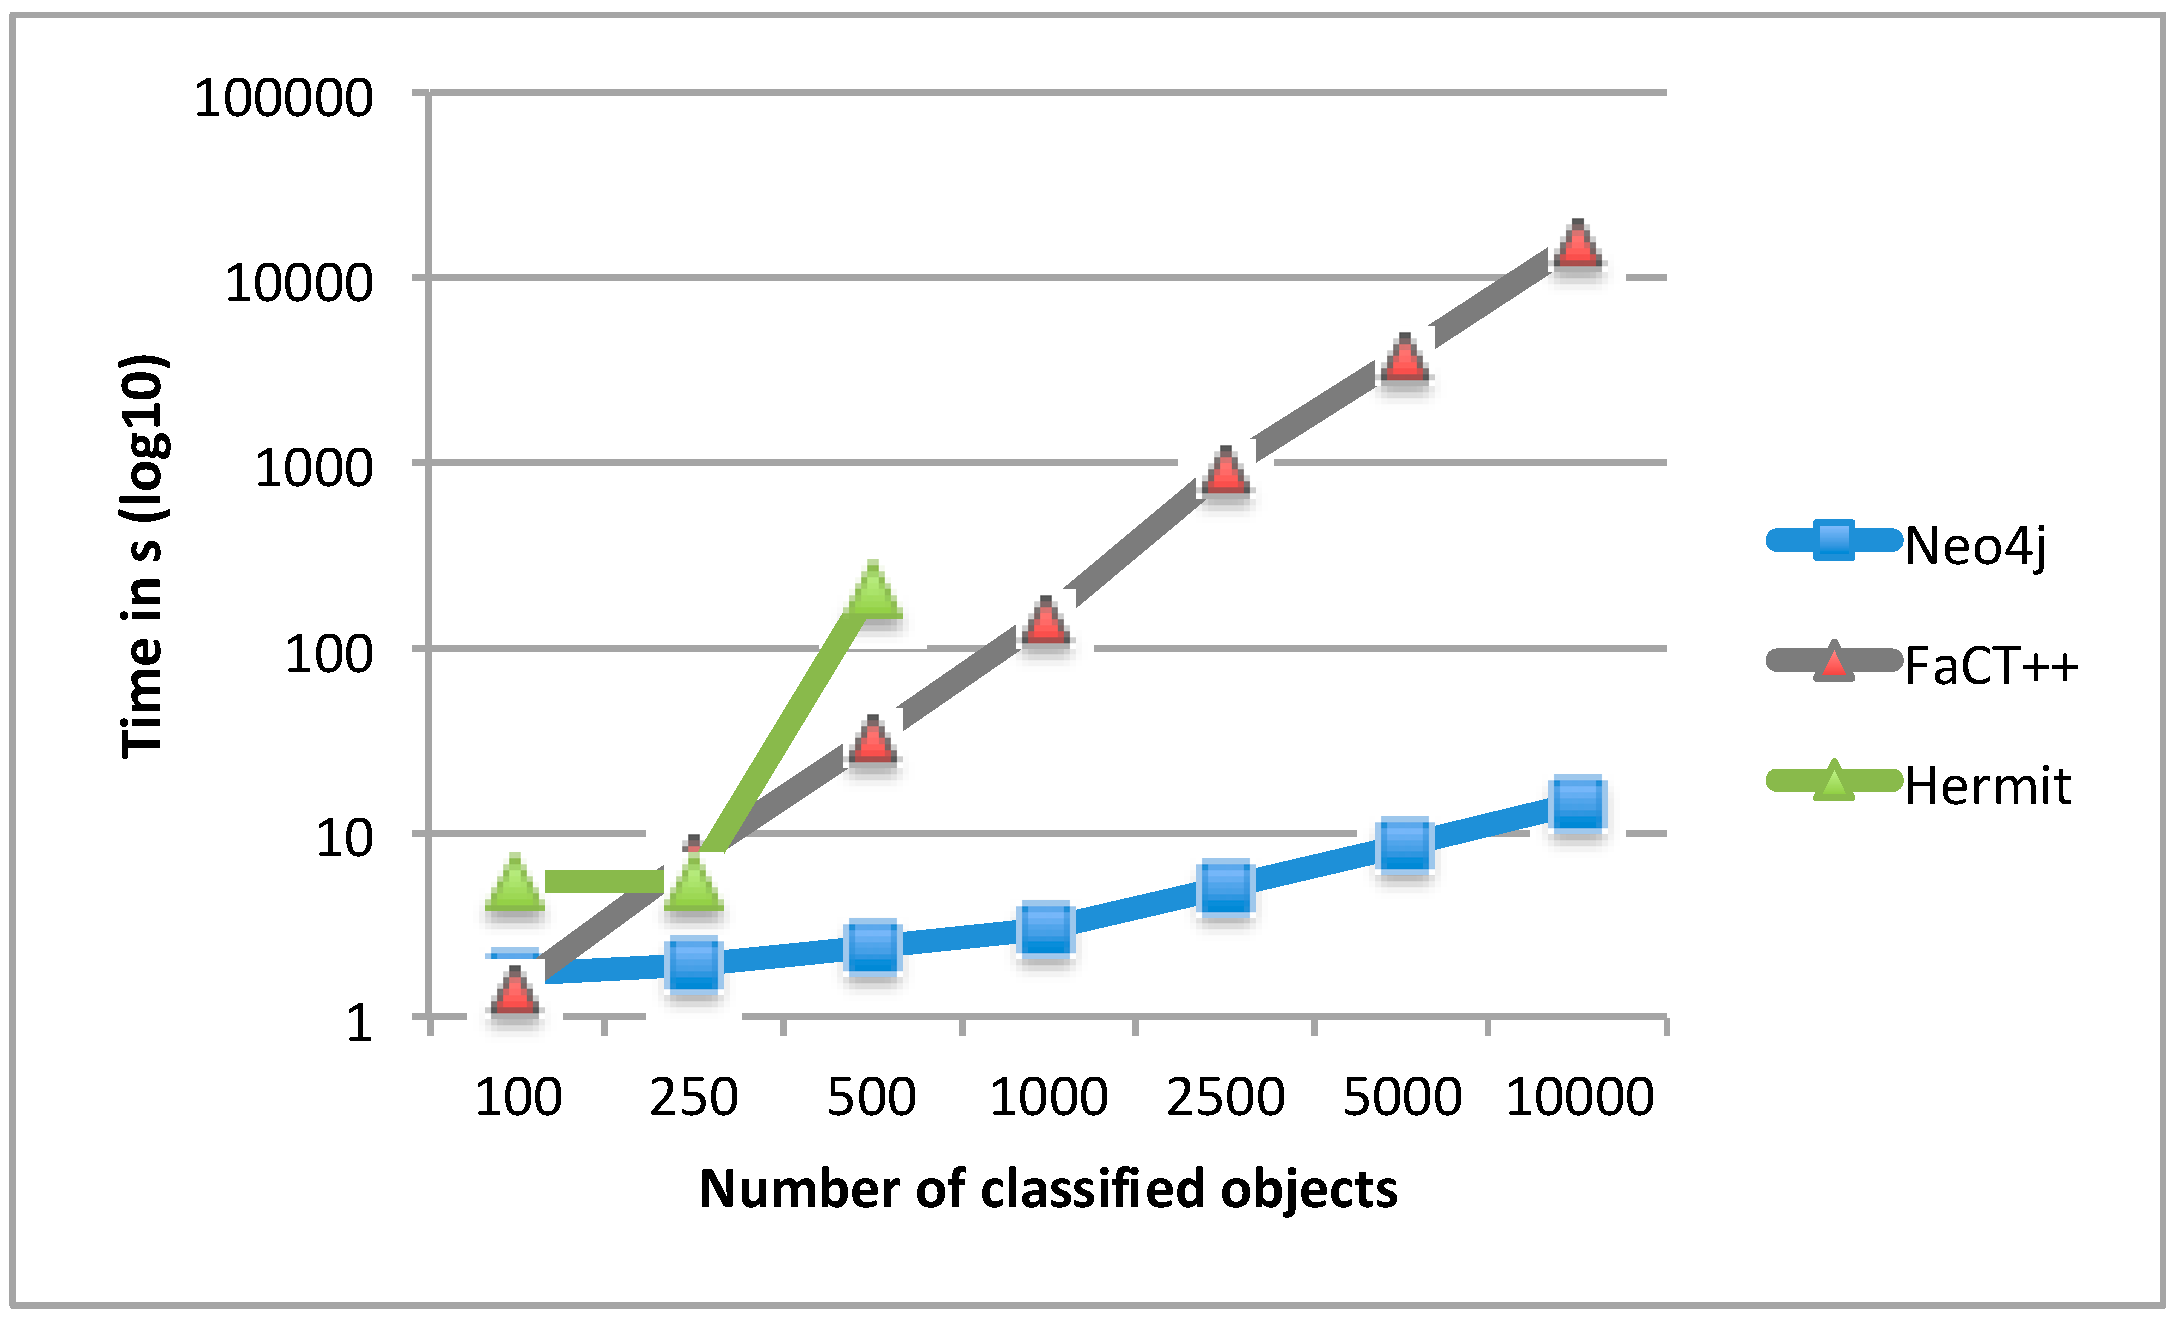
4.1. Classification Results for Protégé-Based Reasoners vs. the Neo4j-Based Approach

In the first step, the authors compare the classification performance regarding computational time between reasoners for the Protégé environment. However, not all available reasoners were suitable for the test environment. The Racer reasoner [44] was not available via an academic, non-commercial license during the creation of this paper. The Snorocket reasoner [45] and the ELK reasoner [46] are not supporting A-Box reasoning and are therefore not suitable as well. The TrOWL reasoner [47] was very fast in terms of classification speed (about 2 s for 10,000 individuals). However, the authors could not query the results in Protégé to see which individuals have been classified into which category. Therefore, this reasoner was skipped as well. The Pellet reasoner [48], although supporting A-Box reasoning, did not react anymore, even with a small sample (100 individuals) of the applied ontology.
The remaining reasoners for the benchmark were: the FaCT++ reasoner [49] and the Hermit reasoner [50]. The authors repeated the classification process ten times for each sample size and calculated the average value in terms of the required time. Figure 9 shows the results for the classification time for each sample set.
The benchmark results show that the Neo4j-based approach outperforms the two tested Protégé-based reasoners by far, when it comes to a large number of individuals. While between 250 and 500 individuals, all three candidates are close to each other; on higher numbers of individuals, the Neo4j-base approach is about 1,000 times faster than the FaCT++ reasoner. The Hermit reasoner became unresponsive on sample set sizes larger than 500. The reasoning process was therefore canceled after several hours.
All reasoners and the Neo4j-base approach achieved 100% accuracy, meaning that all classified individuals where correct (precision) and all relevant individuals within the sample set were classified (recall). This was checked by comparing the IDs of each distinct classified individual as well as with their pre-classification tags assigned by the simulation environment.
Figure 9. Classification time for each reasoner tested in Protégé vs. Neo4j.
Remotesensing 07 09473 g009

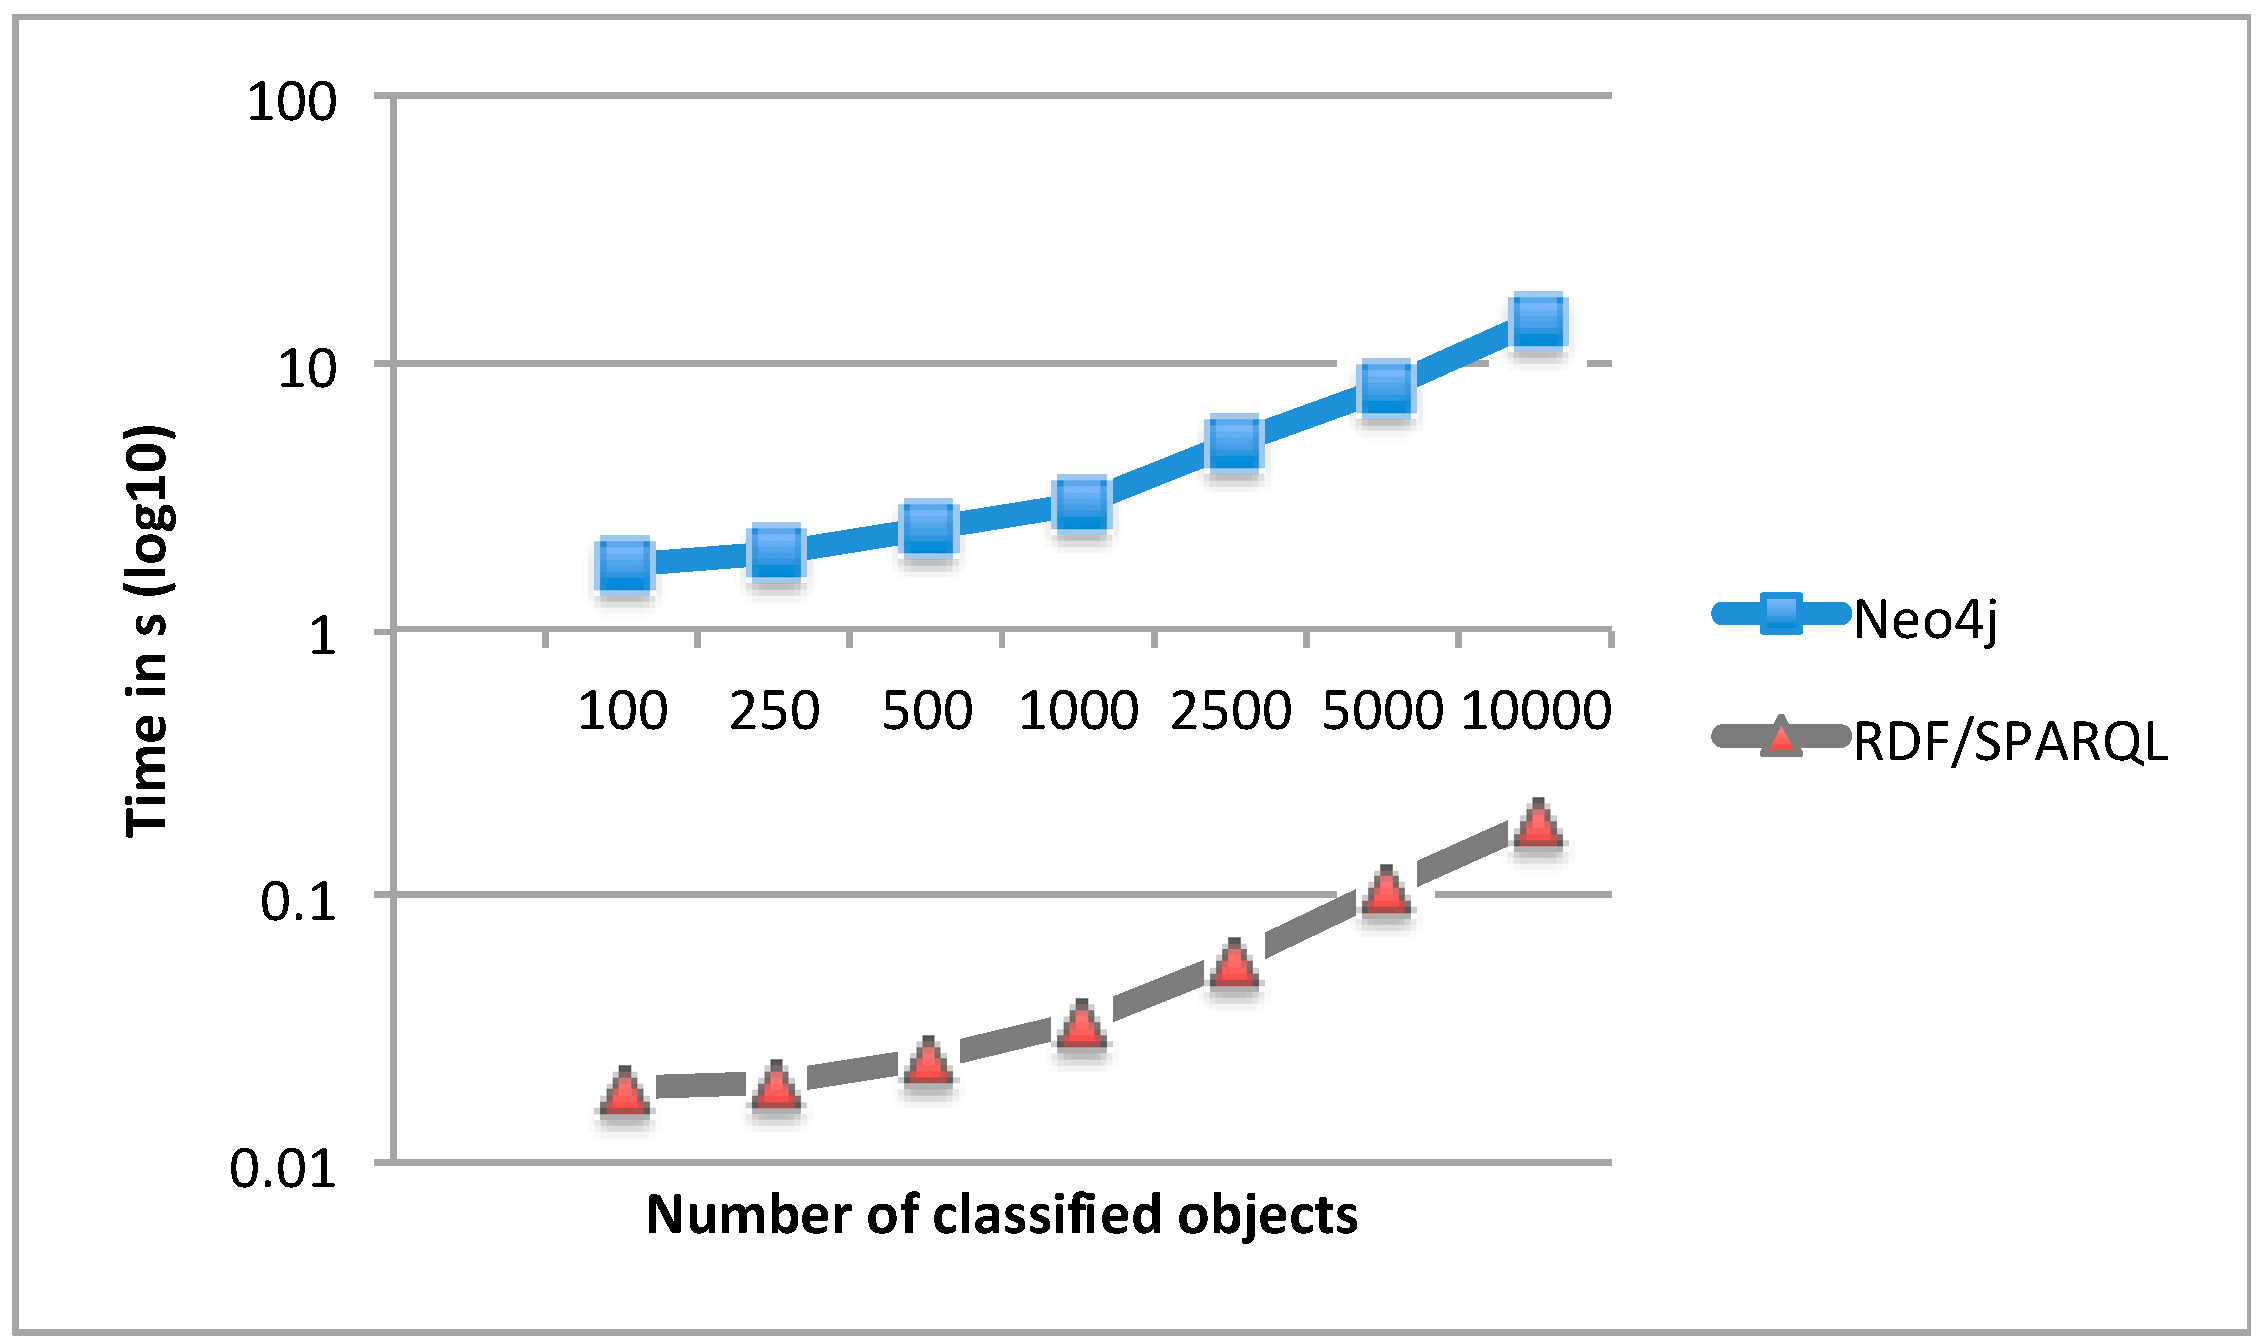
4.2. Classification Results for the Neo4j-Based Approach vs. the RDF/SPARQL-Based Approach

In the next step, the authors repeated the process with Neo4j-based solution and the RDF/SPARQL-based solution. The results can be seen in Figure 10 While the Neo4j-based approach was already promising, the RDF/SPARQL-based approach minimizes the computational time required for classification even more. When comparing the results regarding 10,000 individuals, it can be seen that the RDF/SPARQL-based approach is approximately 75 times faster than the Neo4j-based approach. As it was with the Protégé-based reasoners and the Neo4j-based approach, the RDF/SPARQL-based approach achieved 100% accuracy.
Figure 10. Classification time for Neo4j vs. RDF/SPARQL.
Remotesensing 07 09473 g010

5. Discussion

The results from this study clearly demonstrate the high potential of graph-based solutions for the classification of remote sensing data in terms of reducing computation time. Remarkably, there is even a huge performance gap between graph solutions themselves.
While the Neo4j-based solution is still fast and requires only about 15 s for the classification of 10,000 domain objects, the RDF/SPARQL-based solution outperforms its graph sibling by far, requiring only about 0.2 s for the same amount of objects. The main advantage of this method (as with the Neo4j method) is that there is no need to execute a fully equipped OWL reasoner. There are a few selected inferences that are desired and so making use of SPARQL/SPIN as an expressive way of defining rules helps to eliminate the reasoning overhead that is commonly faced when using OWL reasoners. Other than for the Neo4j, there is no need to modify the data before importing it as Jena supports a variety of formats like OWL, RDF or TTL.
Comparing the performance-time results becomes difficult, as related work towards similar reasoning with databases and individuals exist but are fairly old and do not state execution times, e.g., [14,51]. A more recent example is given by Horrocks et al. [6]. The classification of 10,000 individuals within their environment instanceStore (iS) took about 33,000 s. However, this comparison has to be regarded with caution, as the ontology employed was much bigger than the sample ontology, which certainly had an impact on the results.
As the development of the approach is only at the beginning, the authors would like to point out some limitations and challenges that should not be neglected, even if they are not all directly connected to the presented architecture.
The approach significantly speeds up classification time, which, in return, also affects iteration runs to improve the ontology modeling if applied to test data. Still, what it cannot fix is the subjectivity introduced by experts. Each individual visualizes his or her environment based on previous experiences, cultural influences etc. Therefore, objects and conditions can be perceived and interpreted in different ways. From a philosophical point of view, this circumstance is referred to as constructivism [52] and fuels a discussion, which has been on-going for decades. Regarding the research work in this paper, the authors agree with Kuhn [53] and approach the creational process for ontologies in a more pragmatic way towards semantic engineering, rather than towards a philosophical discussion or pure language interpretation.
It is also important to remember the fact that the classification time is affected by some conditions related to the evaluation example and architecture. In this example, the entire architecture stack was deployed on a single workstation. If, however, the components were to be distributed to different servers across a larger geographical distance, the overall time to deliver the actual classification results may increase. In addition, for the sake of simplification, a rather small ontology was employed (see Figure 2). If a larger network within the database has to be searched, this will definitely add to the overall time required. Still, a larger ontology would have affected the Protégé environment as well.
Another point concerns the inference engine. Compared to the reasoners available, the engine is a fairly small one. Nevertheless, it is capable of performing the desired classification with the same accuracy as its “big brother”.
To ensure consistency within the ontology, also after the import of individuals, the classic reasoner can and should still be used. If the consistency is verified, the enriched ontology can then be forwarded to the database importer module.
Finally, the query possibilities in the Neo4j-based approach are limited in that only tasks for the classification of a single class at one point in time are covered at the moment. The combination of concepts is not yet possible. Additionally, the alternative way of querying the database via the graph visualization can be a little bit cluttered when handling large ontologies.

6. Conclusions

In this paper, the authors presented an approach towards a computational improvement of ontology-based classification of segmented remote sensing imagery using graph databases. A graph database environment was designed and implemented, which enables the classification of huge amounts of data entities (individuals) in an extremely short time compared with classic approaches that use Protégé at the same level of accuracy. Through a combination of technologies from knowledge engineering and modern graph databases, the approach achieves a performance improvement of about the factor 80,000. This result clearly demonstrates the high potential of graph databases for classification tasks in remote sensing.
The reduction of the computational time enables the adaption of the presented approach in time-critical environments, such as crisis or disaster risk management and beyond.
Graphs and graph databases have been used within remote sensing before. For example, Rossmann et al. [54] have employed graph databases within remote sensing to build a virtual forest database to provide a basis for discrete event and quasi continuous simulations. Hullo et al. [55] realized an approach that combines remote sensing techniques with a graph database to support professionals in the challenging task of exploring complex datasets for preparing maintenance operations in power plants. Maciel and Silva [56] employed methods of graph mining to detect deforestation patterns related to deforestation objects in remote sensing data. Cai et al. [57] developed an approach including graph databases to enable an ecological environment sensitivity evaluation, which incorporates remote sensing data.
However, the combined approach of ontologies and graph databases for the classification of remote sensing data is to the best of the authors’ knowledge unique within the area of remote sensing.
For future work, the authors see some potential in how to extend and improve the approach and the comprised architecture related to the current shortcomings. One aspect comes in the form of the visual query navigation via the ontology graph. The authors plan to extend the visualization of the Neo4j-based approach with additional options for parameterization or even other navigational concepts.
Another interesting point is the improvement of the export function. While the export function currently delivers a textual file, another option could be the re-build of a shape file so the classification results could be merged for visualization within the GIS. In addition, the combination of classified data and other open data sources within the database provide interesting possibilities. As there is a spatial extension for Neo4j as well, spatial and even temporal queries as the base for the classification or based on the results of the classifications could be investigated. Last but not least, the importer and the inference engine could potentially be improved. Both are now optimized to cover information from a basic ontology.

Acknowledgments

The presented work is framed within the Doctoral College GIScience (DK W 1237N23). The research of this work is funded by the Austrian Science Fund (FWF) and the Salzburg University of Applied Sciences. The authors would like to thank Christoph Willemsen (ikwattro) as his Simple PHP Silex App using NeoClient for Neo4j served as the basis for the developed frontend. Furthermore, the authors want to thank the three anonymous reviewers for their valuable feedback, which led to significant improvements regarding this paper; especially towards the RDF/SPARQL-related results.

Author Contributions

Thomas J. Lampoltshammer proposed and developed the concept, created the research design, conducted the coordination of the research activities, developed and programmed the presented graph databases solution, performed the benchmarking and result interpretation, and wrote the manuscript. Stefanie Wiegand contributed to the development of the research design, co-developed and programmed the presented graph databases solution, contributed to the benchmarking and result interpretations as well as the manuscript writing. Both authors contributed equally to the revisions of the manuscript.

Conflicts of Interest

The authors declare no conflict of interest.

References

  1. Baader, F.; Horrocks, I.; Sattler, U. Description logics as ontology languages for the semantic web. In Mechanizing Mathematical Reasoning; Springer: Berlin, Germany, 2005; pp. 228–248. [Google Scholar]
  2. Bock, J.; Haase, P.; Ji, Q.; Volz, R. Benchmarking OWL Reasoners. Available online: http://ai.ia.agh.edu.pl/wiki/_media/pl:dydaktyka:miw:2010:dltls:prezentacja:testowanie_reasonerow.pdf (accessed on 31 March 2015).
  3. Li, Y.; Yu, Y.; Heflin, J. Evaluating Reasoners under Realistic Semantic Web Conditions. In Proceedings of the OWL Reasoner Evaluation Workshop (ORE 2012), Manchester, UK, 1 July 2012.
  4. Lampoltshammer, T.J.; Heistracher, T. Ontology evaluation with Protégé using OWLET. Infocommun. J. 2014, 6, 12–17. [Google Scholar]
  5. Weithöner, T.; Liebig, T.; Luther, M.; Böhm, S. What’s wrong with OWL benchmarks. In Proceedings of the Second International Workshop on Scalable Semantic Web Knowledge Base Systems (SSWS 2006), Athens, GA, USA, 5–6 November 2006; pp. 101–114.
  6. Horrocks, I.; Li, L.; Turi, D.; Bechhofer, S. The instance store: DL reasoning with large numbers of individuals. In Proceedings of the 2004 Description Logic Workshop (DL 2004), Whistler, BC, Canada, 6–8 June 2004; pp. 31–40.
  7. Angles, R.; Gutierrez, C. Survey of graph database models. ACM Comput. Surv. 2008, 40, 1–39. [Google Scholar] [CrossRef]
  8. Blaschke, T. Object based image analysis for remote sensing. ISPRS J. Photogramm. Remote Sens. 2010, 65, 2–16. [Google Scholar] [CrossRef]
  9. Hay, G.J.; Castilla, G.; Wulder, M.A.; Ruiz, J.R. An automated object-based approach for the multiscale image segmentation of forest scenes. Int. J. Appl. Earth Obs. Geoinf. 2005, 7, 339–359. [Google Scholar] [CrossRef]
  10. Gruber, T.R. A translation approach to portable ontology specifications. J. Knowl. Acquis. 1993, 5, 199–220. [Google Scholar] [CrossRef]
  11. Gruber, T.R. Toward principles for the design of ontologies used for knowledge sharing? Int. J. Hum. Comput. Stud. 1995, 43, 907–928. [Google Scholar] [CrossRef]
  12. Daconta, M.C.; Smith, K.T.; Oerst, L.J. The semantic web: A guide to the future of XML, web services, and knowledge management. Comput. Rev. 2004, 45, 778–779. [Google Scholar]
  13. Motik, B.; Grau, B.C.; Horrocks, I.; Wu, Z.; Fokoue, A.; Lutz, C. Owl 2 web ontology language: Profiles. W3C Recomm. 2009, 27, 61. [Google Scholar]
  14. Schmiedel, A. Semantic Indexing Based on Description Logics. Available online: http://ftp.informatik.rwth-aachen.de/Publications/CEUR-WS/Vol-1/schmiedel-long.pdf (accessed on 31 March 2015).
  15. De Giacomo, G.; Lenzerini, M. TBox and ABox Reasoning in Expressive Description Logics. Available online: http://www.aaai.org/Papers/Workshops/1996/WS-96-05/WS96-05-004.pdf (accessed on 31 March 2015).
  16. Durand, N.; Derivaux, S.; Forestier, G.; Wemmert, C.; Gançarski, P.; Boussaid, O.; Puissant, A. Ontology-based object recognition for remote sensing image interpretation. In Proceedings of the 19th IEEE International Conference on Tools with Artificial Intelligence (ICTAI 2007), Patras, Greece, 29–31 October 2007; pp. 472–479.
  17. Belgiu, M.; Lampoltshammer, T.; Hofer, B. An extension of an ontology-based land cover designation approach for fuzzy rules. In GI_Forum 2013. Creating the GISociety; Car, A., Jekel, T., Strobl, J., Eds.; Austrian Academy of Sciences Press: Vienna, Austria, 2013; pp. 59–70. [Google Scholar]
  18. Belgiu, M.; Tomljenovic, I.; Lampoltshammer, T.J.; Blaschke, T.; Höfle, B. Ontology-based classification of building types detected from airborne laser scanning data. Remote Sens. 2014, 6, 1347–1366. [Google Scholar] [CrossRef]
  19. Hofmann, P.; Lettmayer, P.; Blaschke, T.; Belgiu, M.; Wegenkittl, S.; Graf, R.; Lampoltshammer, T.J.; Andrejchenko, V. ABIA—A conceptional framework for agent based image analysis. South East. Eur. J. Earth Obs. Geomat. 2014, 3, 125–130. [Google Scholar]
  20. Hofmann, P.; Lettmayer, P.; Blaschke, T.; Belgiu, M.; Wegenkittl, S.; Graf, R.; Lampoltshammer, T.J.; Andrejchenko, V. Towards a framework for agent-based image analysis of remote-sensing data. Int. J. Image Data Fusion 2015, 6, 115–137. [Google Scholar] [CrossRef]
  21. Goldberg, A.V.; Harrelson, C. Computing the shortest path: A search meets graph theory. In Proceedings of the Sixteenth Annual ACM-SIAM Symposium on Discrete Algorithms, Philadelphia, PA, USA, 23–25 January 2005; pp. 156–165.
  22. Manola, F.; Miller, E.; McBride, B. RDF Primer. Available online: http://www.w3.org/TR/rdf-primer (accessed on 31 March 2015).
  23. Prud’Hommeaux, E.; Seaborne, A. SPARQL Query Language for RDF. Available online: http://www.w3.org/TR/rdf-sparql-query/ (accessed on 31 March 2015).
  24. Pérez, J.; Arenas, M.; Gutierrez, C. Semantics and complexity of SPARQL. In Proceedings of the International Semantic Web Conference, Athens, GA, USA, 5–9 November 2006; pp. 30–43.
  25. Neo4j the World’s Leading Graph Database. Available online: http://neo4j.com/ (accessed on 31 March 2015).
  26. Ontotext GraphDB—An Enterprise Triplestore with Meaning. Available online: http://www.ontotext.com/products/ontotext-graphdb/ (accessed on 31 March 2015).
  27. Sesame Java Framework for Processing and Handling RDF Data. Available online: http://rdf4j.org (accessed on 31 March 2015).
  28. Orient Technologies 2nd Generation Distributed Graph Database. Available online: http://www.orientechnologies.com/orientdb/ (accessed on 31 March 2015).
  29. Franz Inc. AlegroGraph. Available online: http://franz.com/agraph/allegrograph/ (accessed on 31 March 2015).
  30. Deville, Y.; Gilbert, D.; van Helden, J.; Wodak, S.J. An overview of data models for the analysis of biochemical pathways. Brief. Bioinform. 2003, 4, 246–259. [Google Scholar] [CrossRef] [PubMed]
  31. Olken, F. Tutorial on graph data management for biology. [Tutorial Hand-out]. Available online: https://www.researchgate.net/profile/Frank_Olken2/publication/242497760_Graph_Data_Management_For_Biology/links/02e7e52a21e337ad52000000.pdf (accessed on 21 July 2015).
  32. Brandes, U.; Erlebach, T. Network Analysis: Methodological Foundations; Springer Science & Business Media: Medford, MA, USA, 2005. [Google Scholar]
  33. Miller, J.J. Graph database applications and concepts with Neo4j. In Proceedings of the Southern Association for Information Systems Conference, Atlanta, GA, USA, 23–24 March 2013.
  34. Lampoltshammer, T.J.; Sageder, C.; Heistracher, T. The openlaws platform—An open architecture for big open legal data. In Proceedings of the 18th International Legal Informatics Symposium IRIS 2015, Salzburg, Austria, 26–28 February 2015.
  35. Karamizadeh, S.; Abdullah, S.M; Zamani, M.; Kherikhah, A. Pattern recognition techniques: studies on appropriate classifications. In Advanced Computer and Communication Engineering Technology; Springer International Publishing: Cham, Switzerland, 2015; Volume 315, pp. 791–799. [Google Scholar]
  36. QGIS A Free and Open Source Geographic Information System. Available online: http://www2.qgis.org/en/site/ (accessed on 31 March 2015).
  37. Weidner, U. Contribution to the assessment of segmentation quality for remote sensing applications. Int. Arch. Photogramm. Remote Sens. Spat. Inf. Sci. 2008, 37, 479–484. [Google Scholar]
  38. Fielding, R. T. Architectural Styles and the Design of Network-based Software Architectures. Ph.D. Thesis, University of California, Irvine, CA, USA, 2000. [Google Scholar]
  39. Battle, R.; Benson, E. Bridging the semantic Web and Web 2.0 with representational state transfer (REST). J. Web Semant. Sci. Serv. Agents World Wide Web 2008, 6, 61–69. [Google Scholar] [CrossRef]
  40. Jordan, G. Practical Neo4j; Apress: New York, NY, USA, 2014. [Google Scholar]
  41. Xu, X.; Zhang, L.; Wong, T.-T. Structure-based ASCII art. ACM Trans. Graph. 2010, 29. [Google Scholar] [CrossRef]
  42. Korf, R.E. Depth-first iterative-deepening: An optimal admissible tree search. Artif. Intell. 1985, 27, 97–109. [Google Scholar] [CrossRef]
  43. Foundation, A. Apache Jena. Available online: http://jena.apache.Org (accessed on 20 March 2014).
  44. Haarslev, V.; Möller, R. Racer: An OWL Reasoning Agent for the Semantic Web. Available online: http://www1.racer-systems.com/technology/contributions/2003/HaMo03d.pdf (accessed on 31 March 2015).
  45. Metke-Jimenez, A.; Lawley, M. Snorocket 2.0: Concrete Domains and Concurrent Classification. Available online: http://ceur-ws.org/Vol-1015/paper_3.pdf (accessed on 31 March 2015).
  46. Kazakov, Y.; Krötzsch, M.; Simančík, F. The incredible ELK. J. Autom. Reason. 2014, 53, 1–61. [Google Scholar] [CrossRef]
  47. Pan, J.Z.; Ren, Y.; Jekjantuk, N.; Garcia, J. Reasoning the FMA Ontologies with TrOWL. Available online: http://ceur-ws.org/Vol-1015/paper_18.pdf (accessed on 31 March 2015).
  48. Sirin, E.; Parsia, B.; Grau, B.C.; Kalyanpur, A.; Katz, Y. Pellet: A practical owl-dl reasoner. Web Semant. Sci. Serv. Agents World Wide Web 2007, 5, 51–53. [Google Scholar] [CrossRef]
  49. Tsarkov, D.; Horrocks, I. FaCT++ description logic reasoner: system description. In Automated Reasoning; Furbach, U., Shankar, N., Eds.; Springer: Berlin/Heidelberg, Germany, 2006; Volume 4130, pp. 292–297. [Google Scholar]
  50. Glimm, B.; Horrocks, I.; Motik, B.; Stoilos, G.; Wang, Z. HermiT: An OWL 2 reasoner. J. Autom. Reason. 2014, 53, 245–269. [Google Scholar] [CrossRef]
  51. Borgida, A.; Brachman, R.J. Loading data into description reasoners. ACM SIGMOD Rec. 1993, 22, 217–226. [Google Scholar] [CrossRef]
  52. Jonassen, D.H. Objectivism versus constructivism: Do we need a new philosophical paradigm? Educ. Technol. Res. Dev. 1991, 39, 5–14. [Google Scholar] [CrossRef]
  53. Kuhn, W. Semantic engineering. In Research Trends in Geographic Information Science; Springer: Berlin, Germany, 2009; pp. 63–76. [Google Scholar]
  54. Rossmann, J.; Schluse, R.; Waspe, R.; Moshammer, R. Simulation in the woods: From remote sensing based data acquisition and processing to various simulation applications. In Proceedings of the 2011 Winter Simulation Conference (WSC), Phoenix, AZ, USA, 11–14 December 2011; pp. 984–996.
  55. Hullo, J.F.; Thibault, G.; Boucheny, C. Advances in multi-sensor scanning and visualization of complex plants: The utmost case of a reactor building. Int. Arch. Photogramm. Remote Sens. Spat. Inf. Sci. 2015, 40, 163–169. [Google Scholar] [CrossRef]
  56. Maciel, M.; Silva, M.; Escada, M. Mining frequent substructures from deforestation objects. IGARSS 2012. [Google Scholar] [CrossRef]
  57. Cai, Z.; Zhong, S.; Jiang, W.; Lei, M. A schema of ecological environment sensitivity evaluation based on GIS. In Proceedings of the 2011 International Conference on Multimedia Technology (ICMT), Hangzhou, China, 26–28 July 2011; pp. 6745–6748.

