
A Remote Sensing and GIS Approach to Study the Long-Term Vegetation Recovery of a Fire-Affected Pine Forest in Southern Greece


Abstract
:
1. Introduction
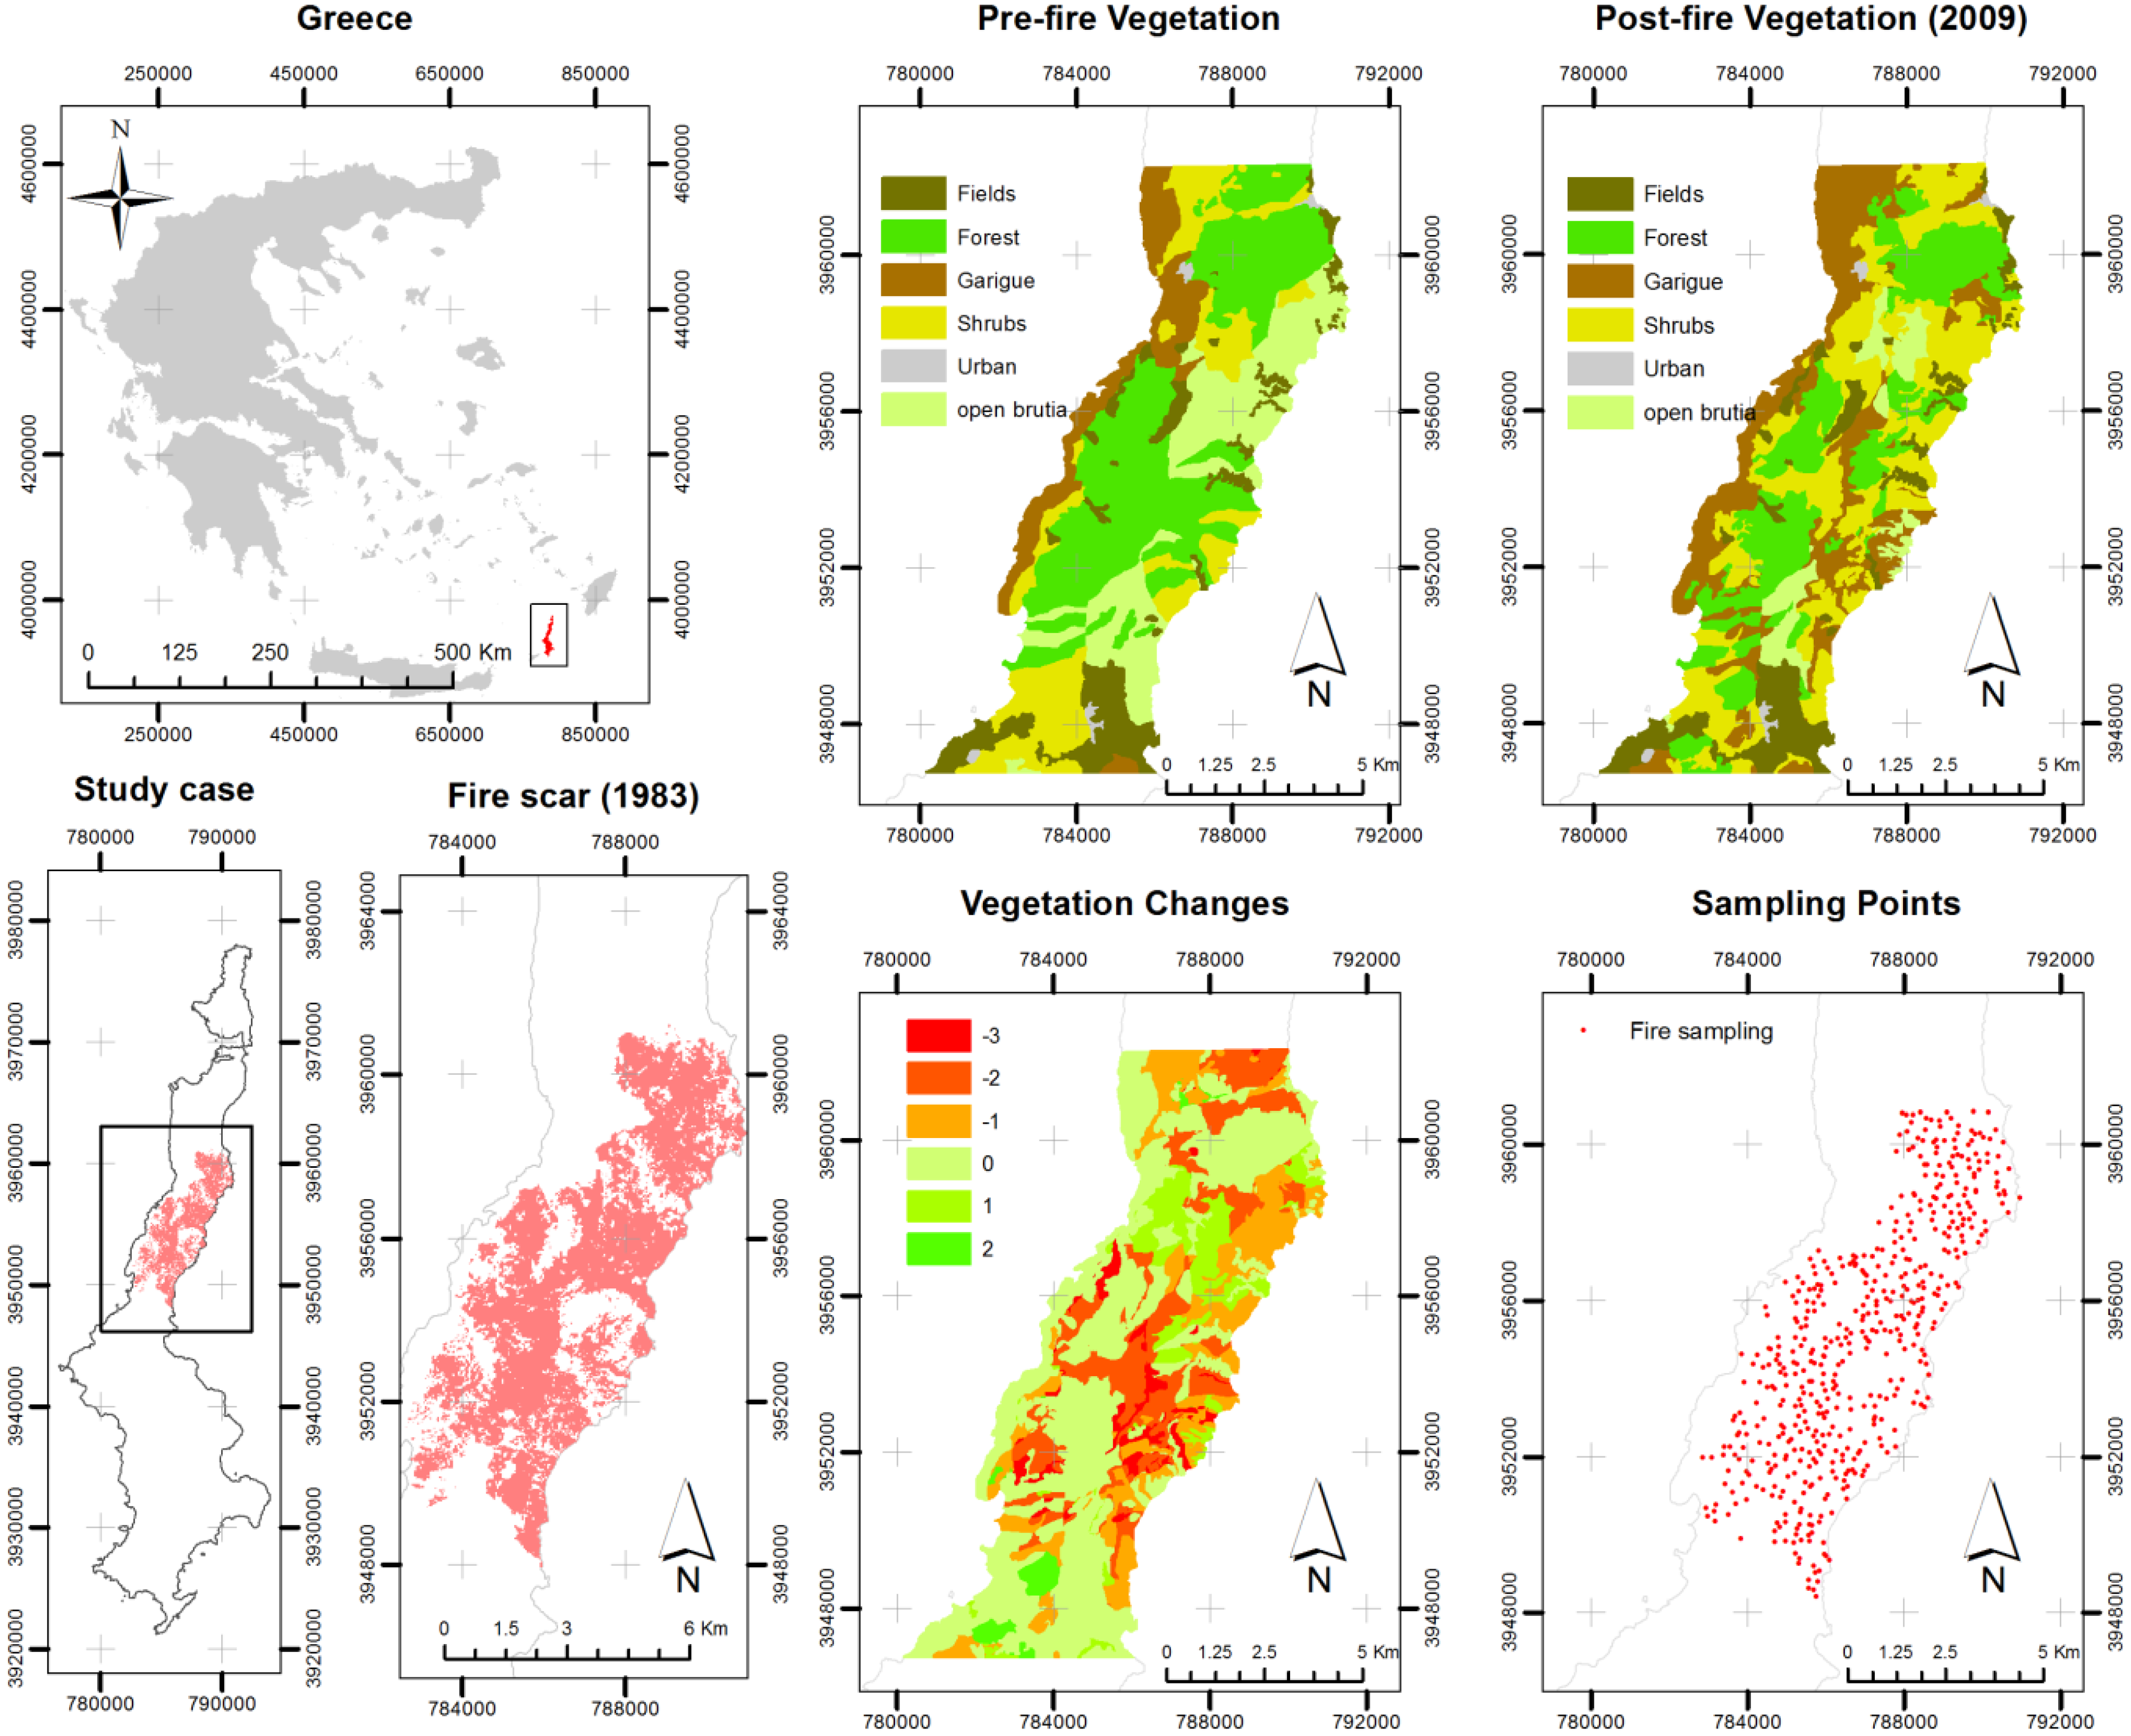
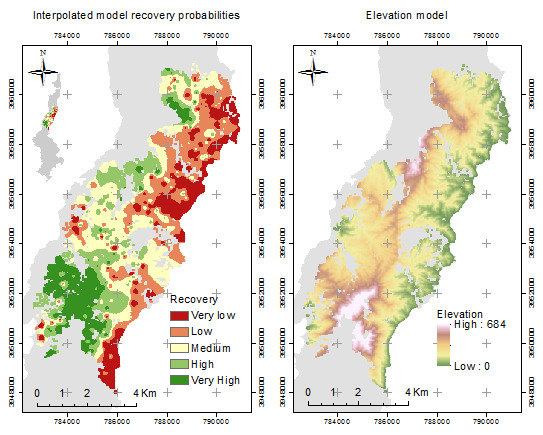
2. Study Area
3. Material and Methods
3.1. Creation of the Dependent and Independent Data Sets
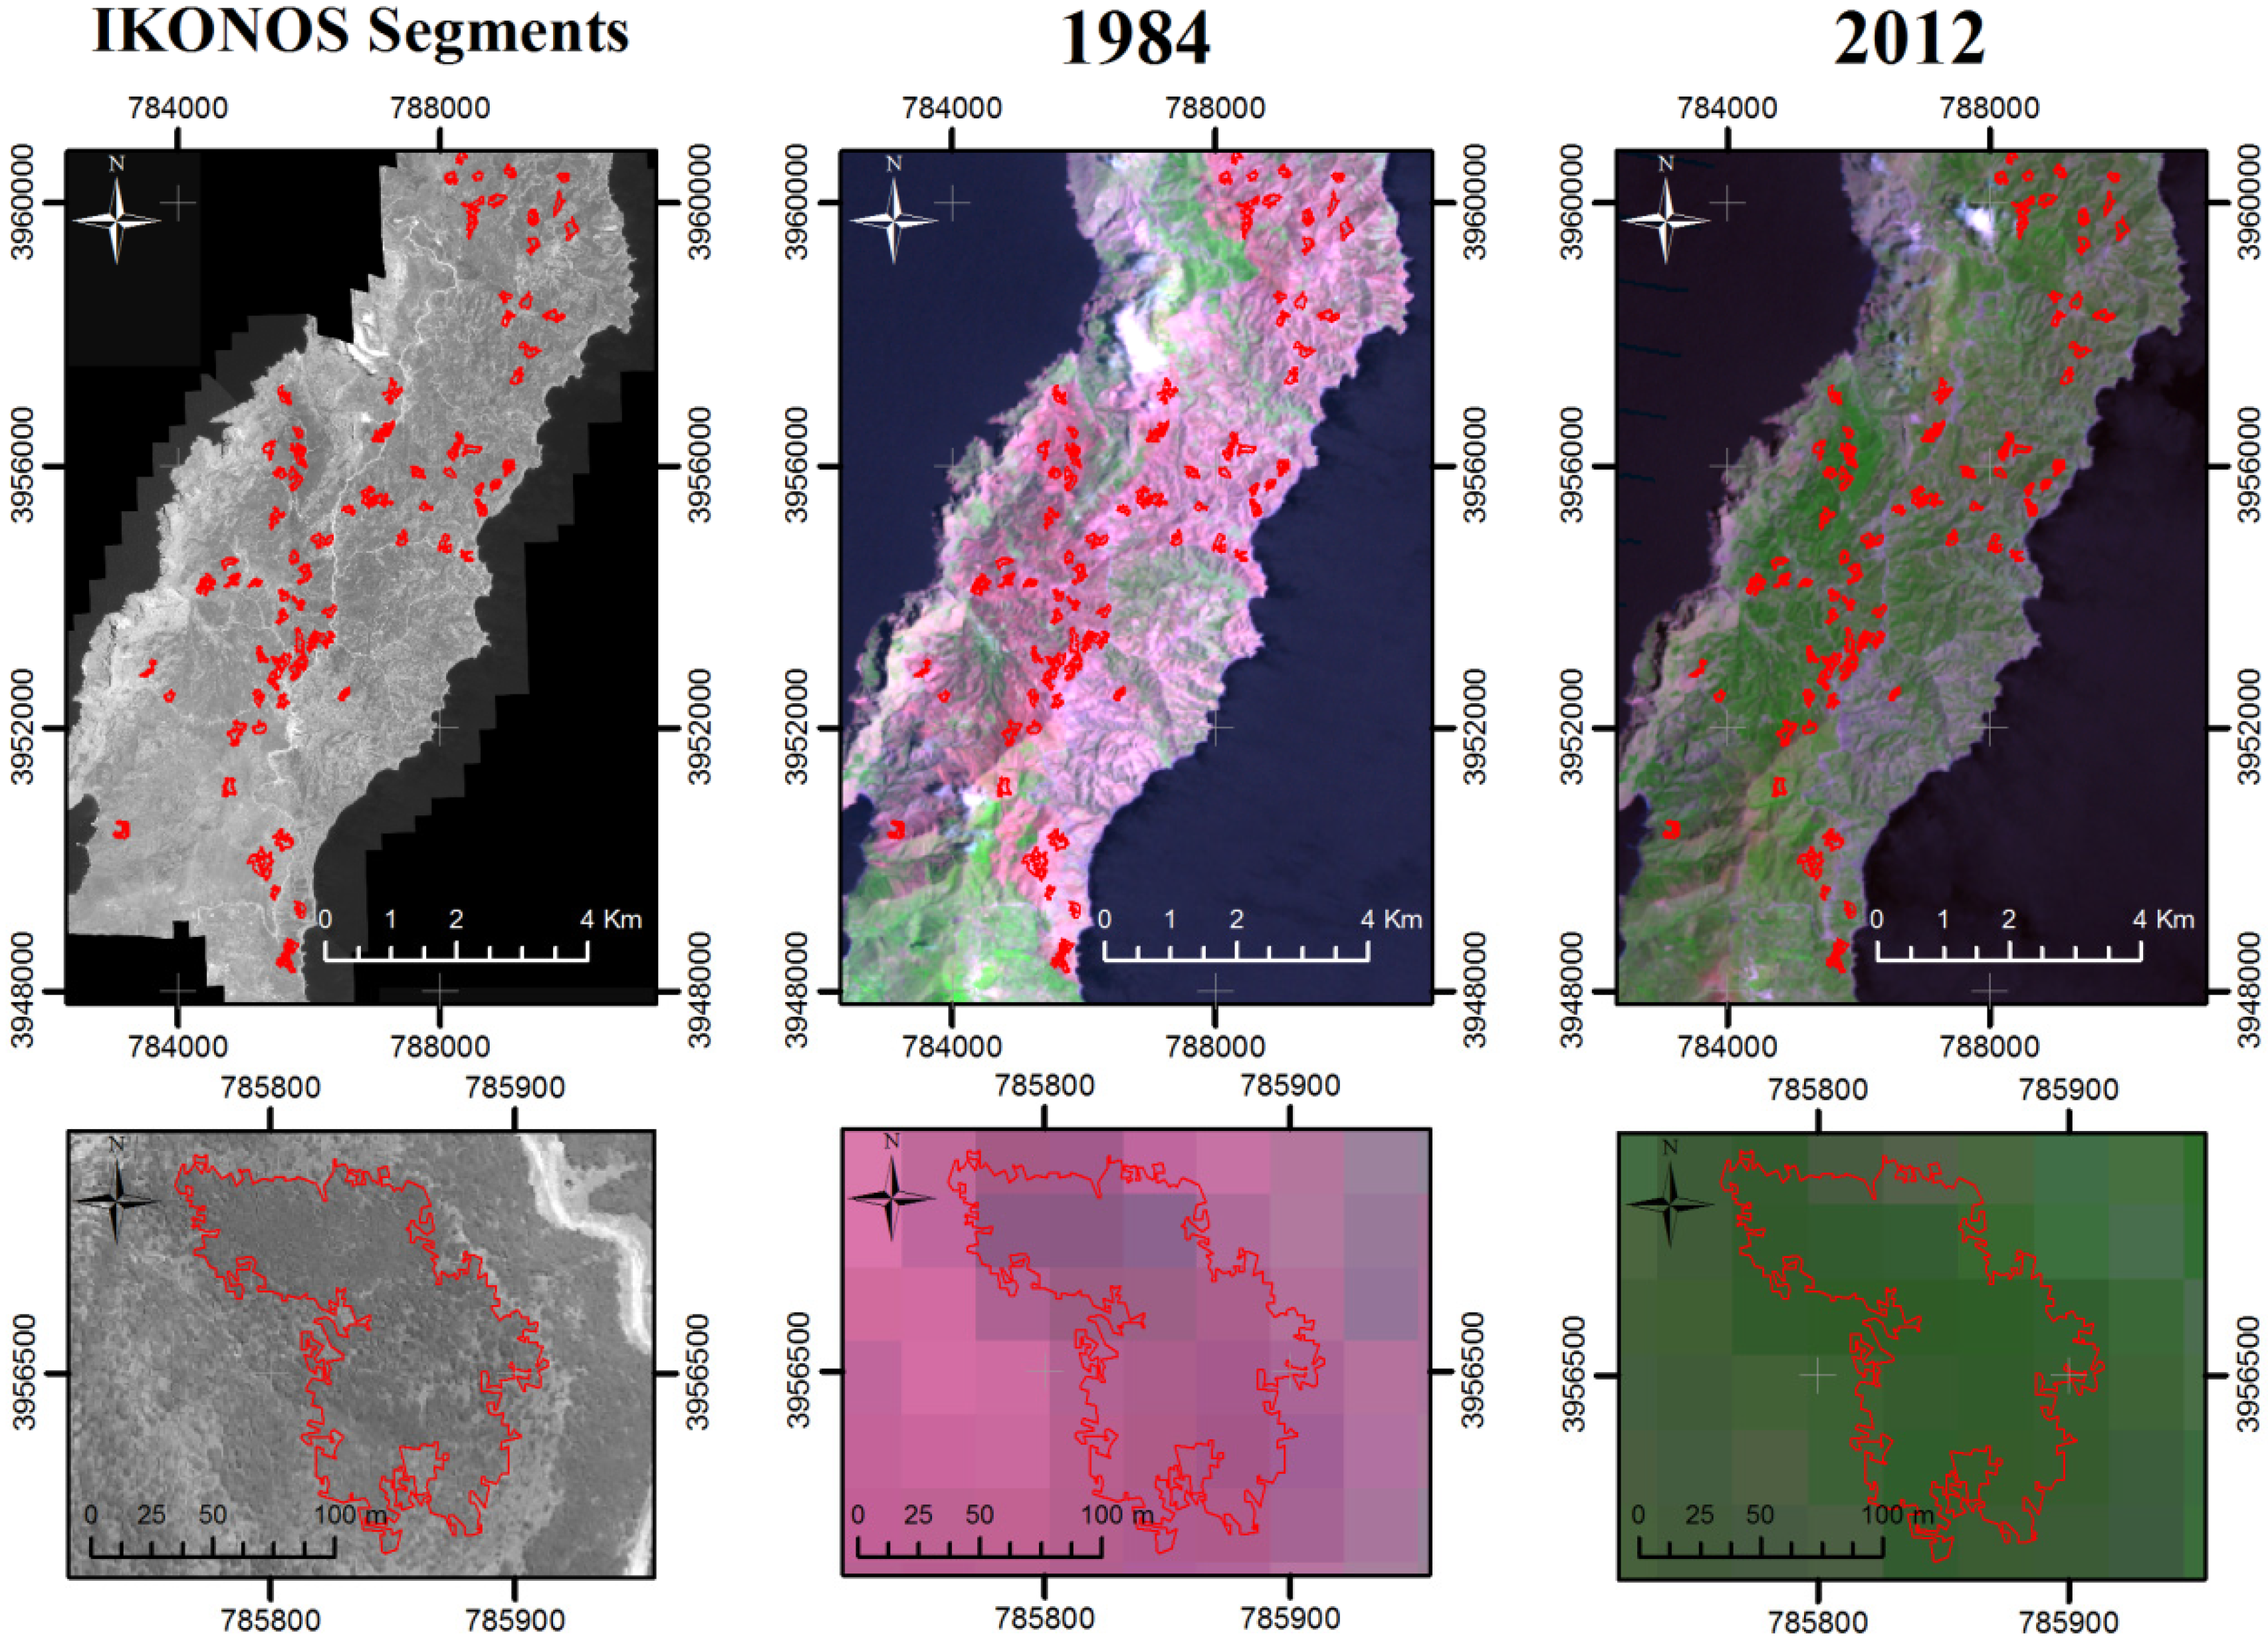
3.1.1. Burned Land Mapping
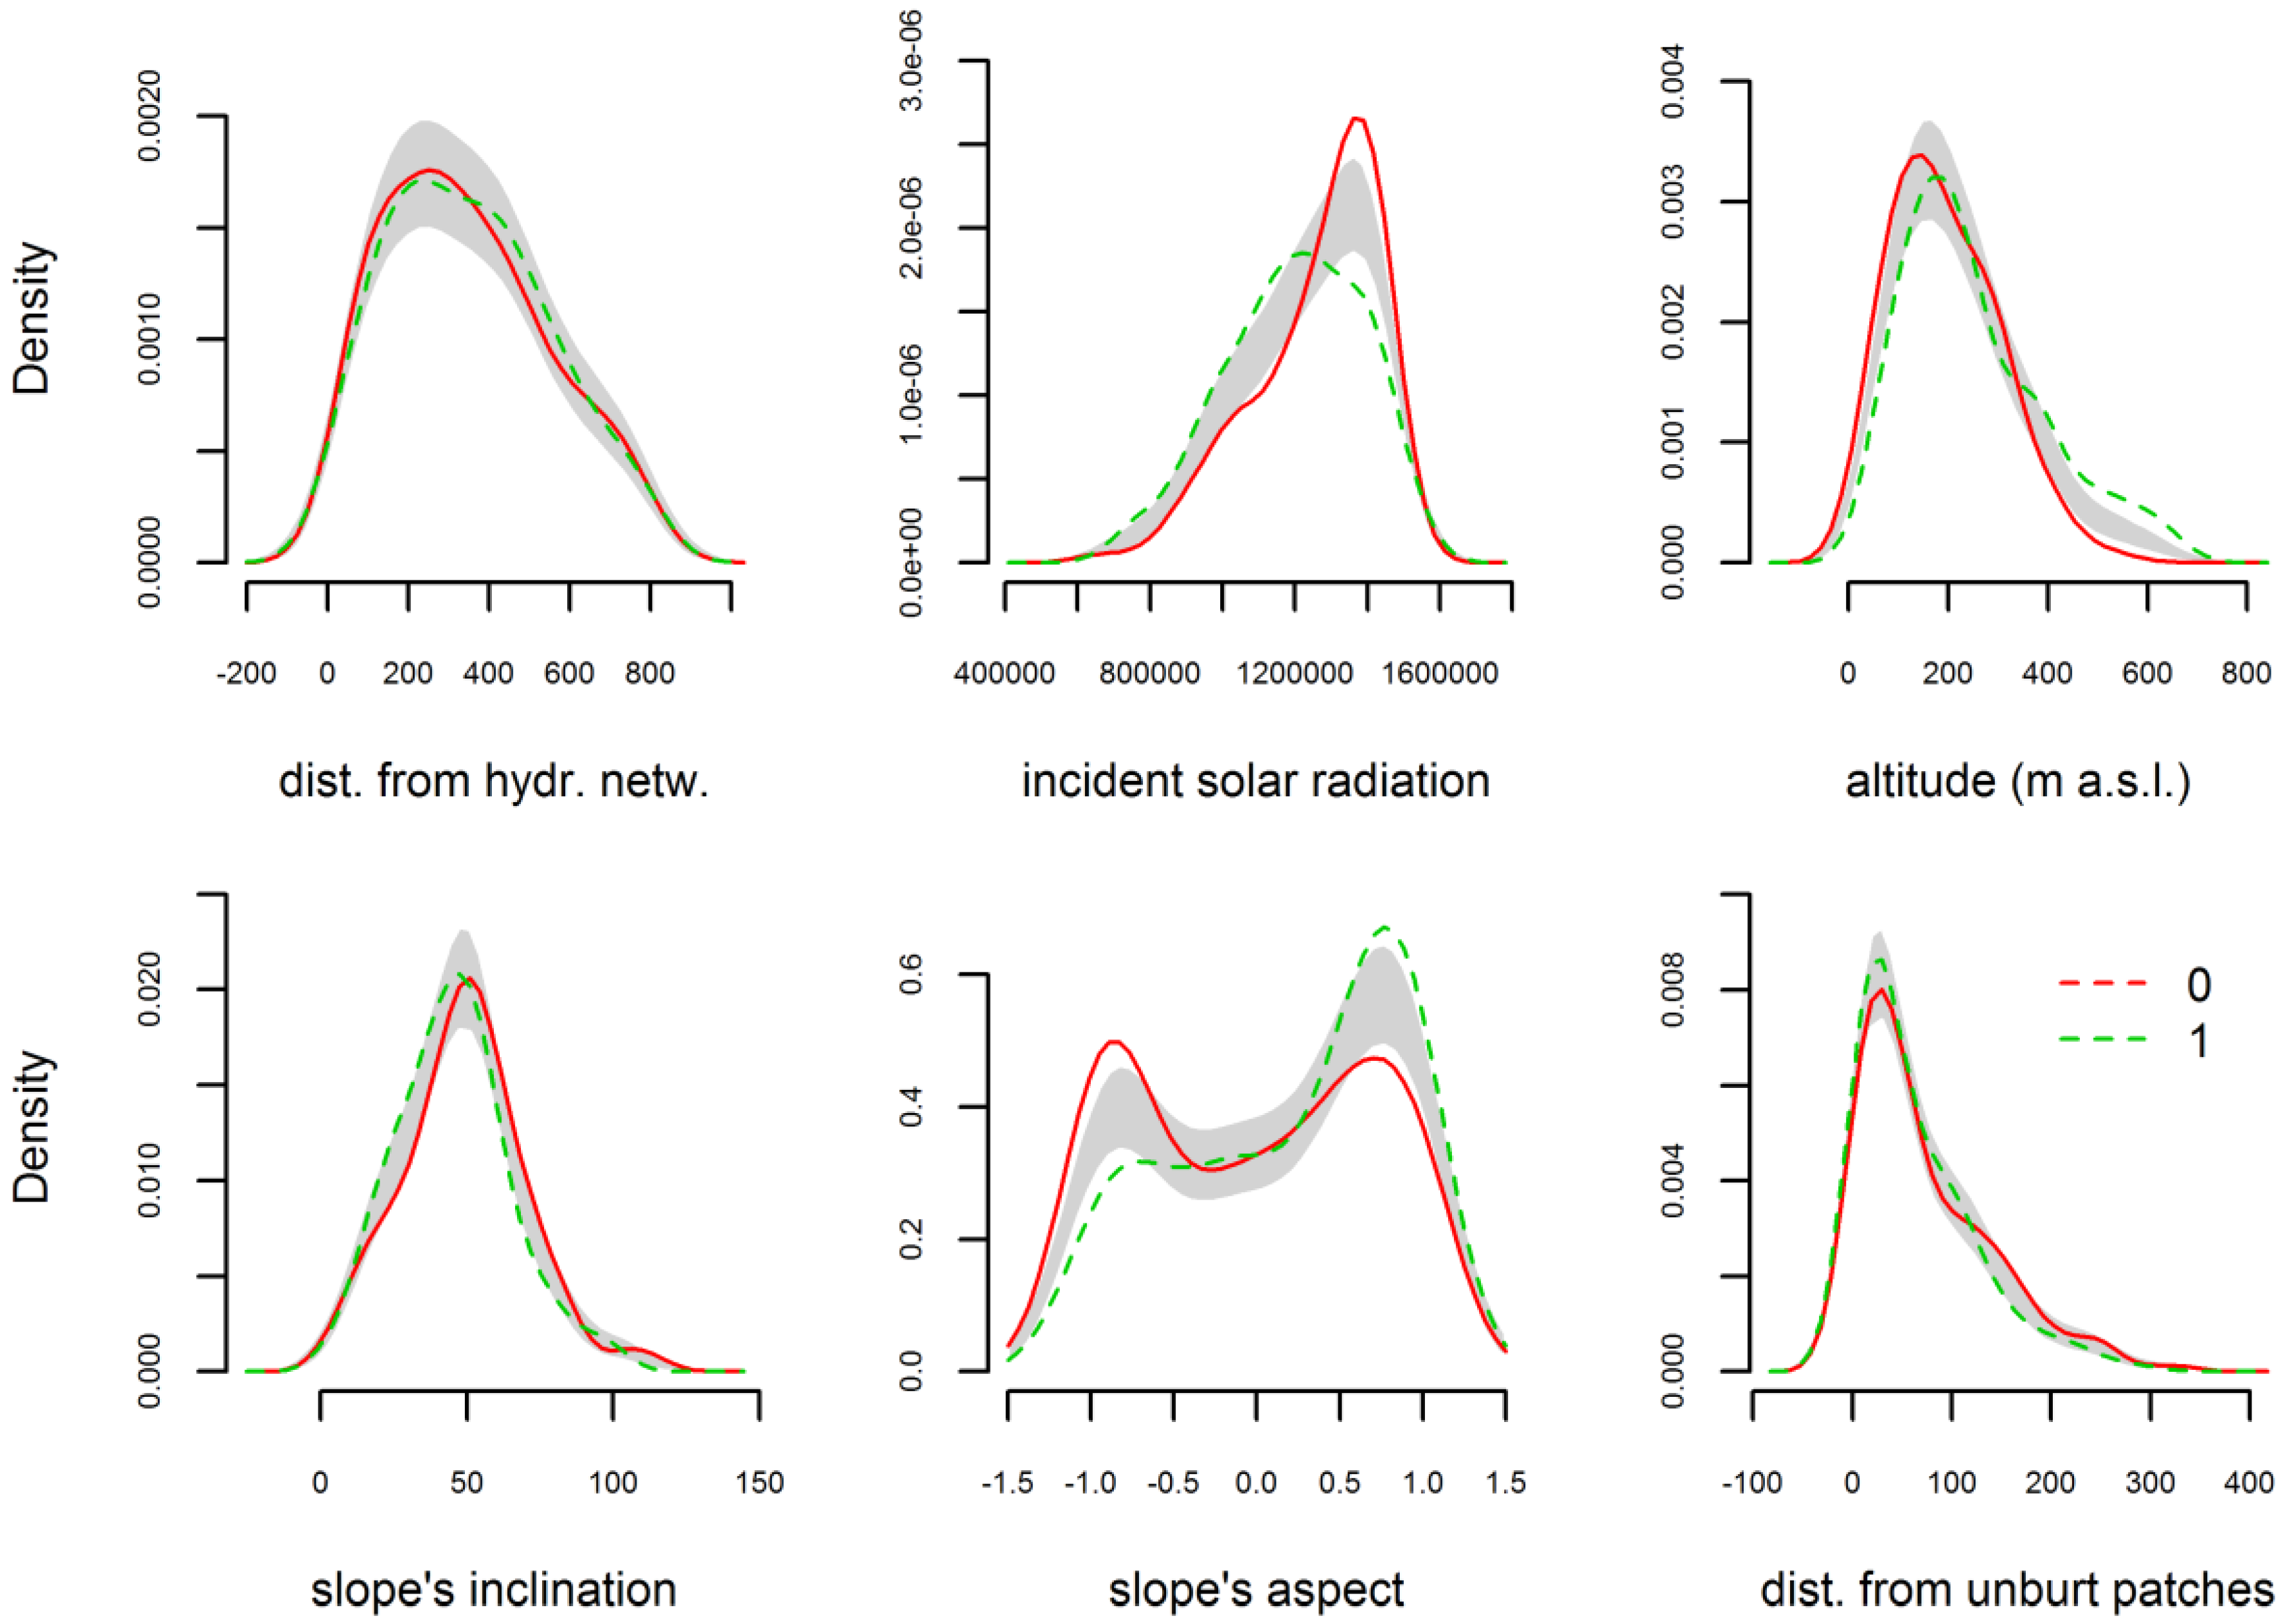
3.1.2. Environmental Explanatory Variables
3.1.3. Pre-Fire and Post-Fire Land Cover Mapping and Changes

| Pre-Fire Vegetation | Post-Fire Vegetation | |||
|---|---|---|---|---|
| Dense P. Brutia Woodland | Open P. Brutia Woodland | Scrubland | Phrygana (Garrigues) | |
| Dense P. brutia woodland | 0 | −1 | −2 | −3 |
| Open P. brutia woodland | 1 | 0 | −1 | −2 |
| Scrubland | 2 | 1 | 0 | −1 |
| Phrygana (garrigues) | 3 | 2 | 1 | 0 |
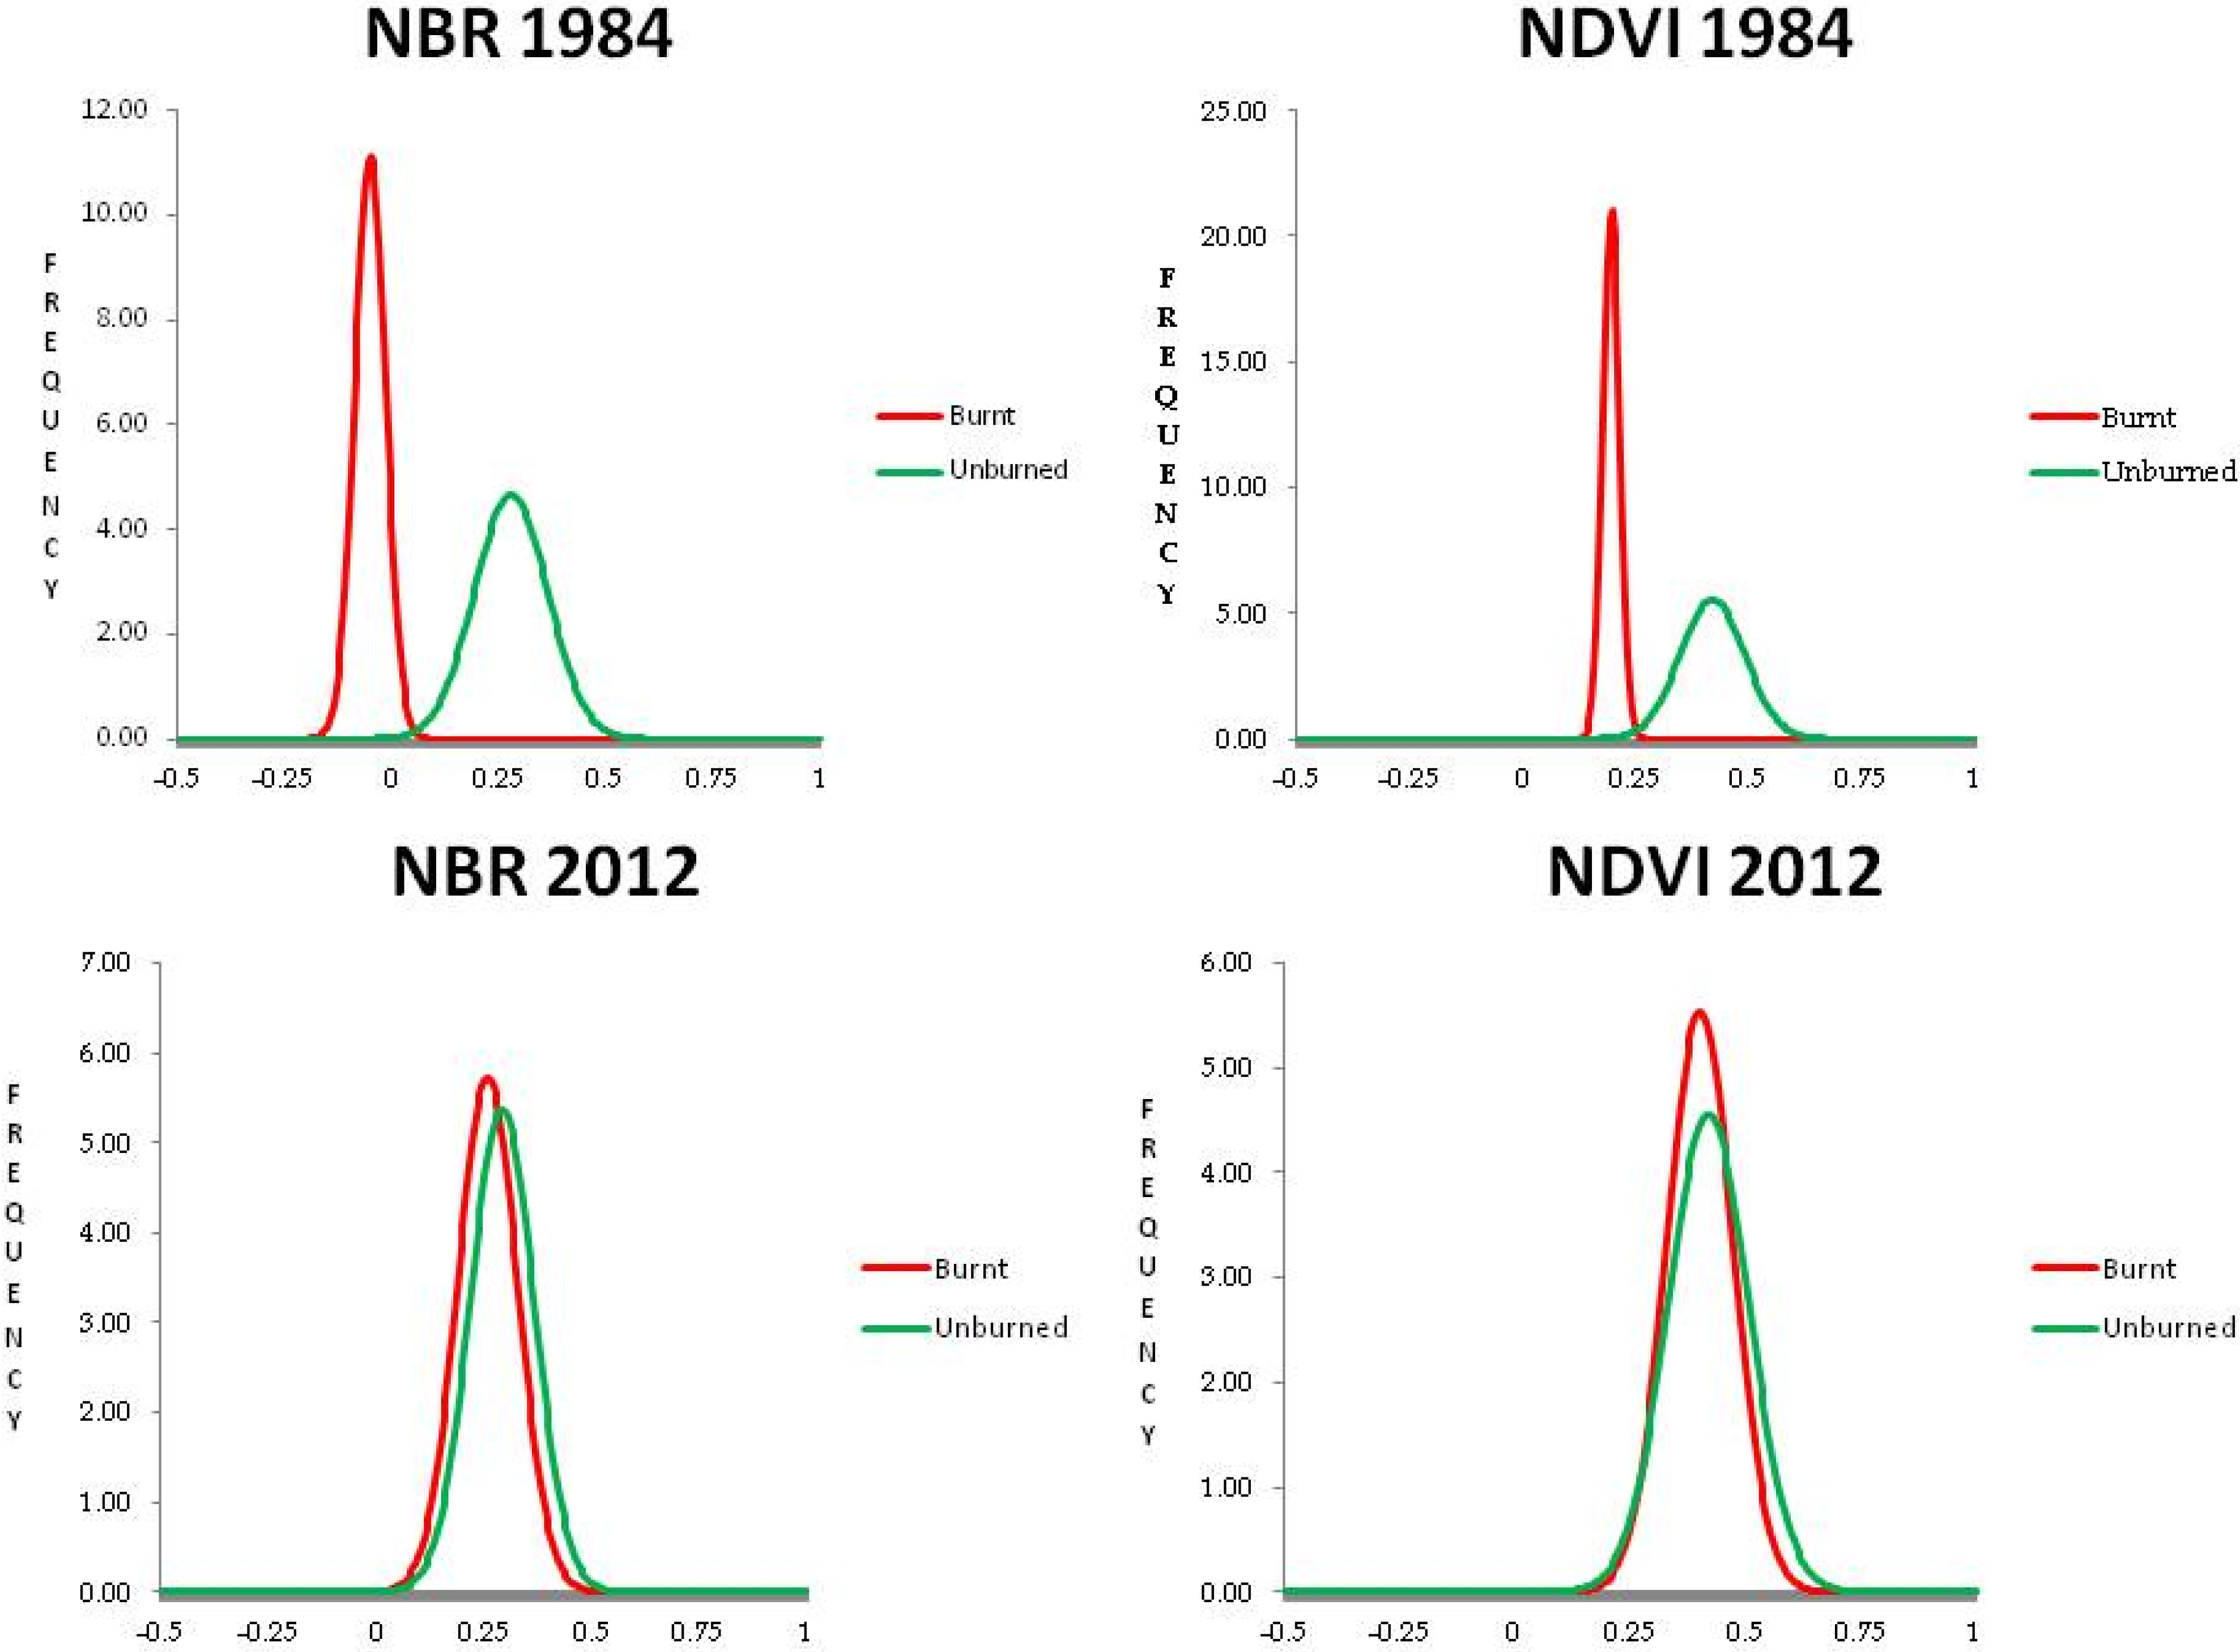
3.1.4. Satellite-Based Vegetation Indices
3.2. Statistical Analyses
3.2.1. Sampling
3.2.2. Cross-Tabulation Analysis
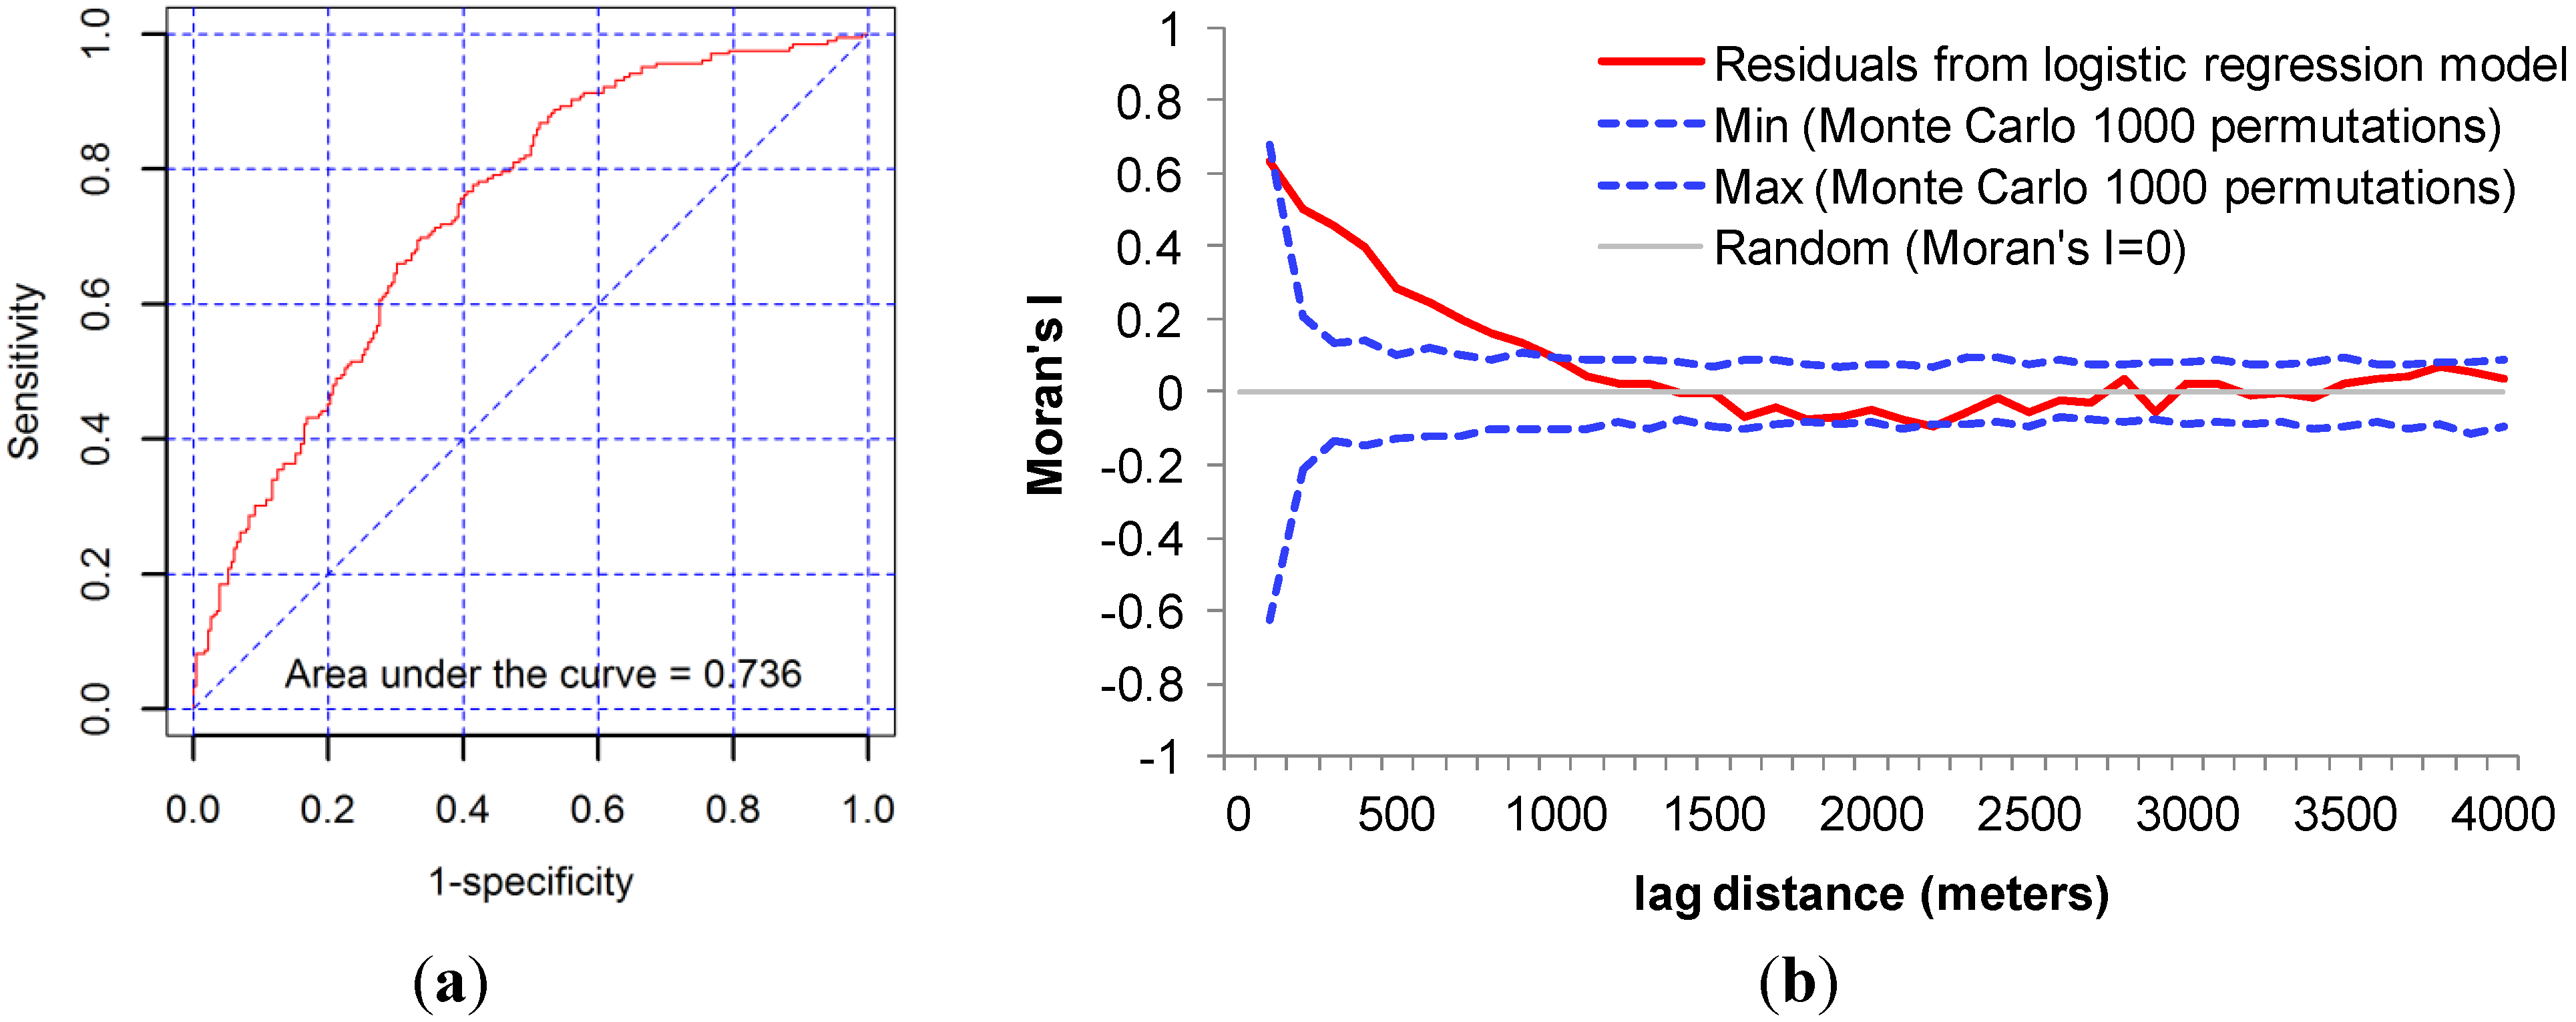
3.2.3. Logistic Regression
3.2.4. Changes of Satellite-Based Vegetation Indices
4. Results
4.1. Vegetation Changes—Cross-Tabulation Analysis
| Post-Fire | Row Total | ||||||
|---|---|---|---|---|---|---|---|
| Dense P. brutia Woodland | Garrigues | Open P. brutia Woodland | Scrubland | ||||
| Pre-fire | Dense P. brutia woodland | Count | 156 | 26 | 2 | 84 | 268 |
| Expected Values | 100.3 | 46.6 | 20.8 | 100.3 | |||
| Chi-square contribution | 30.9 | 9.1 | 17 | 2.6 | |||
| Row Percent | 58.20% | 9.70% | 0.70% | 31.30% | 54.8% | ||
| Column Percent | 85.20% | 30.60% | 5.30% | 45.90% | |||
| Total Percent | 31.90% | 5.30% | 0.40% | 17.20% | |||
| Open P. brutia woodland | Count | 27 | 32 | 21 | 90 | 170 | |
| Expected Values | 63.6 | 29.6 | 13.2 | 63.6 | |||
| Chi-square contribution | 21.1 | 0.2 | 4.6 | 10.9 | |||
| Row Percent | 15.90% | 18.80% | 12.40% | 52.90% | 34.8% | ||
| Column Percent | 14.80% | 37.60% | 55.30% | 49.20% | |||
| Total Percent | 5.50% | 6.50% | 4.30% | 18.40% | |||
| Scrubland | Count | 0 | 27 | 15 | 6 | 48 | |
| Expected Values | 18 | 8.3 | 3.7 | 18 | |||
| Chi-square contribution | 18 | 41.7 | 34.1 | 8 | |||
| Row Percent | 0.00% | 56.20% | 31.20% | 12.50% | 9.8% | ||
| Column Percent | 0.00% | 31.80% | 39.50% | 3.30% | |||
| Total Percent | 0.00% | 5.50% | 3.10% | 1.20% | |||
| Garrigues | Count | 0 | 0 | 0 | 3 | 3 | |
| Expected Values | 1.1 | 0.5 | 0.2 | 1.1 | |||
| Chi-square contribution | 1.1 | 0.5 | 0.2 | 3.1 | |||
| Row Percent | 0.00% | 0.00% | 0.00% | 100.00% | 0.6% | ||
| Column Percent | 0.00% | 0.00% | 0.00% | 1.60% | |||
| Total Percent | 0.00% | 0.00% | 0.00% | 0.60% | |||
| Column Total | 183 | 85 | 38 | 183 | 489 | ||
| 37.4% | 17.4% | 7.8% | 37.4% | ||||
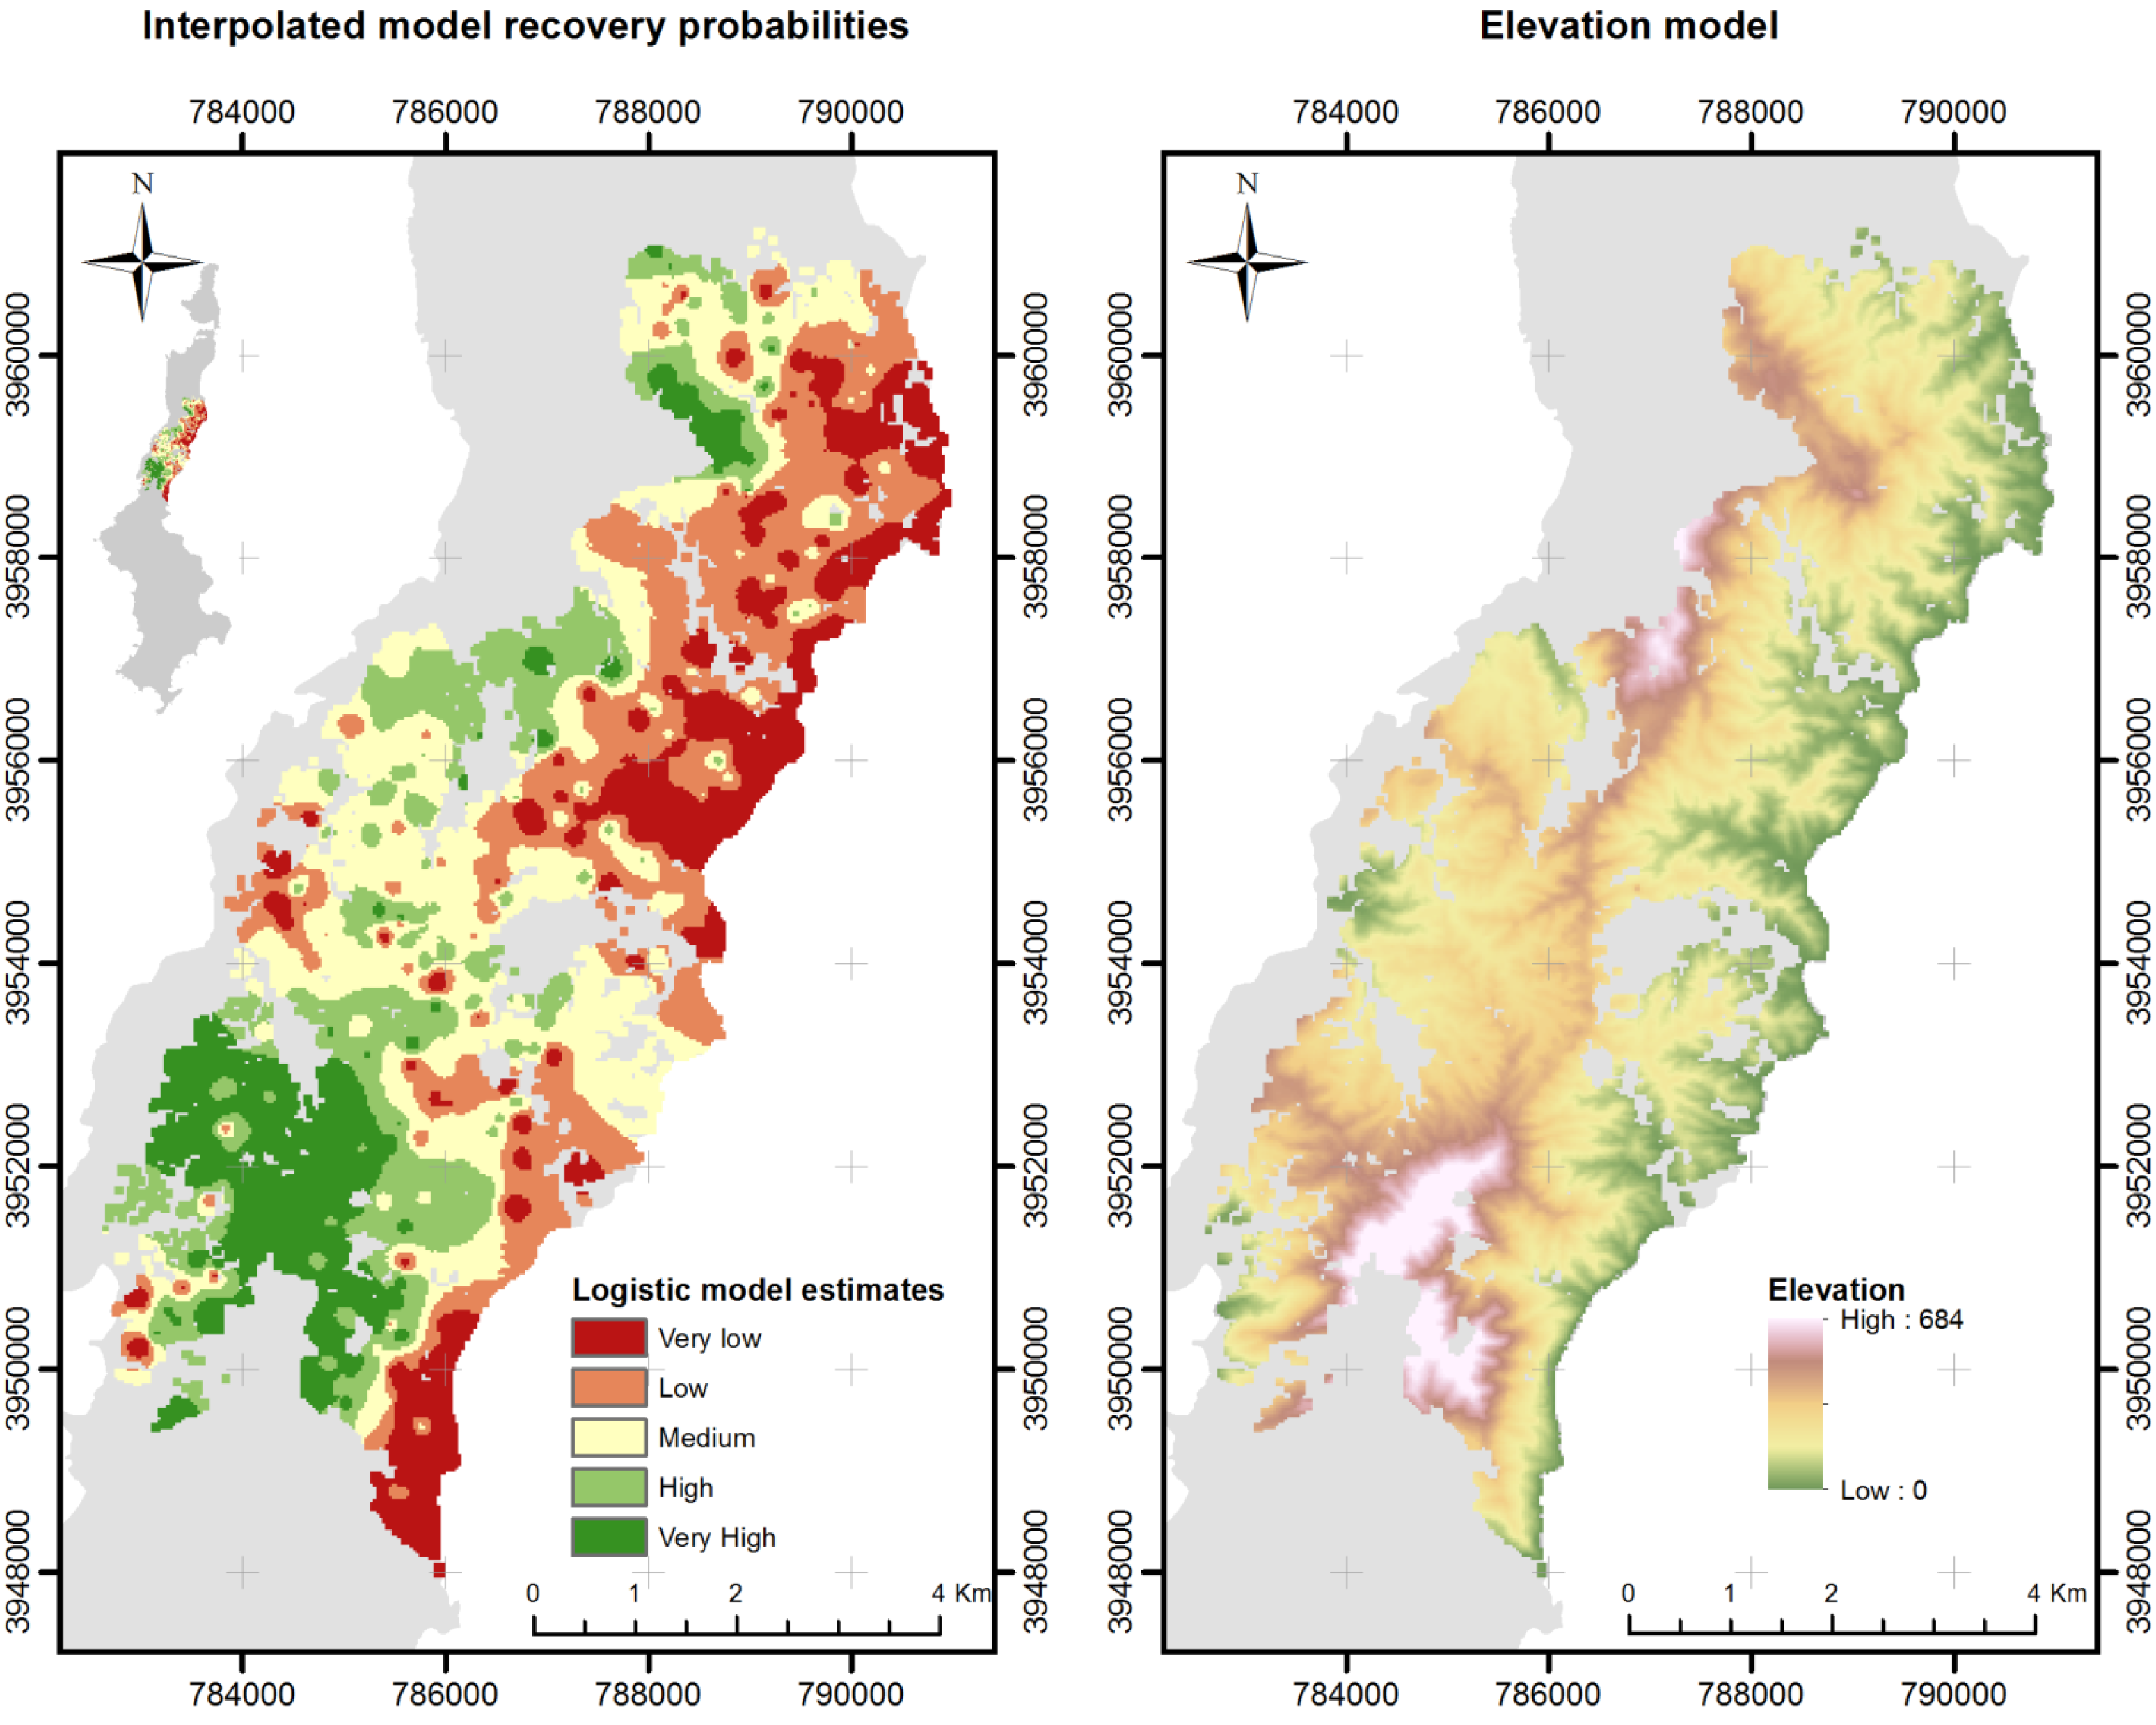
4.2. Recovery of Pinus brutia Woodland—Logistic Regression
| Coefficients | Estimate | Std. Error | z-Value | Pr (>|z|) |
| (Intercept) | 3.637 | 0.982 | 3.705 | 0.000 |
| altitude | 0.006 | 0.001 | 5.482 | 0.000 |
| slope’s inclination | −0.017 | 0.006 | −2.651 | 0.008 |
| incident solar radiation | −2.73E−06 | 6.91E−07 | −3.945 | 0.000 |
| distance from hydrographic network | −0.002 | 0.001 | −2.604 | 0.009 |
| pre-fire vegetation (open stands) | −0.900 | 0.244 | −3.683 | 0.000 |
| Deviance Residuals | ||||
| Min | 1Q | Median | 3Q | Max |
| −1.8869 | −1.0249 | −0.4968 | 1.0215 | 2.2247 |
| Null deviance: 605.65 on 437 degrees of freedom | ||||
| Residual deviance: 522.83 on 432 degrees of freedom | ||||
| AIC: 534.83 | ||||
| Null/Residual deviance difference: 82.820 (5 degrees of freedom) | ||||
| Chi-square p-value: 0.00000000 | ||||
| Pseudo R-Square (optimistic): 0.41642277 | ||||

| Actual | Predicted | |
|---|---|---|
| Frequencies | ||
| no recovery | 151 | 61 |
| recovery | 81 | 145 |
| Percentages | ||
| no recovery | 65.1% | 29.6% |
| recovery | 34.9% | 70.4% |
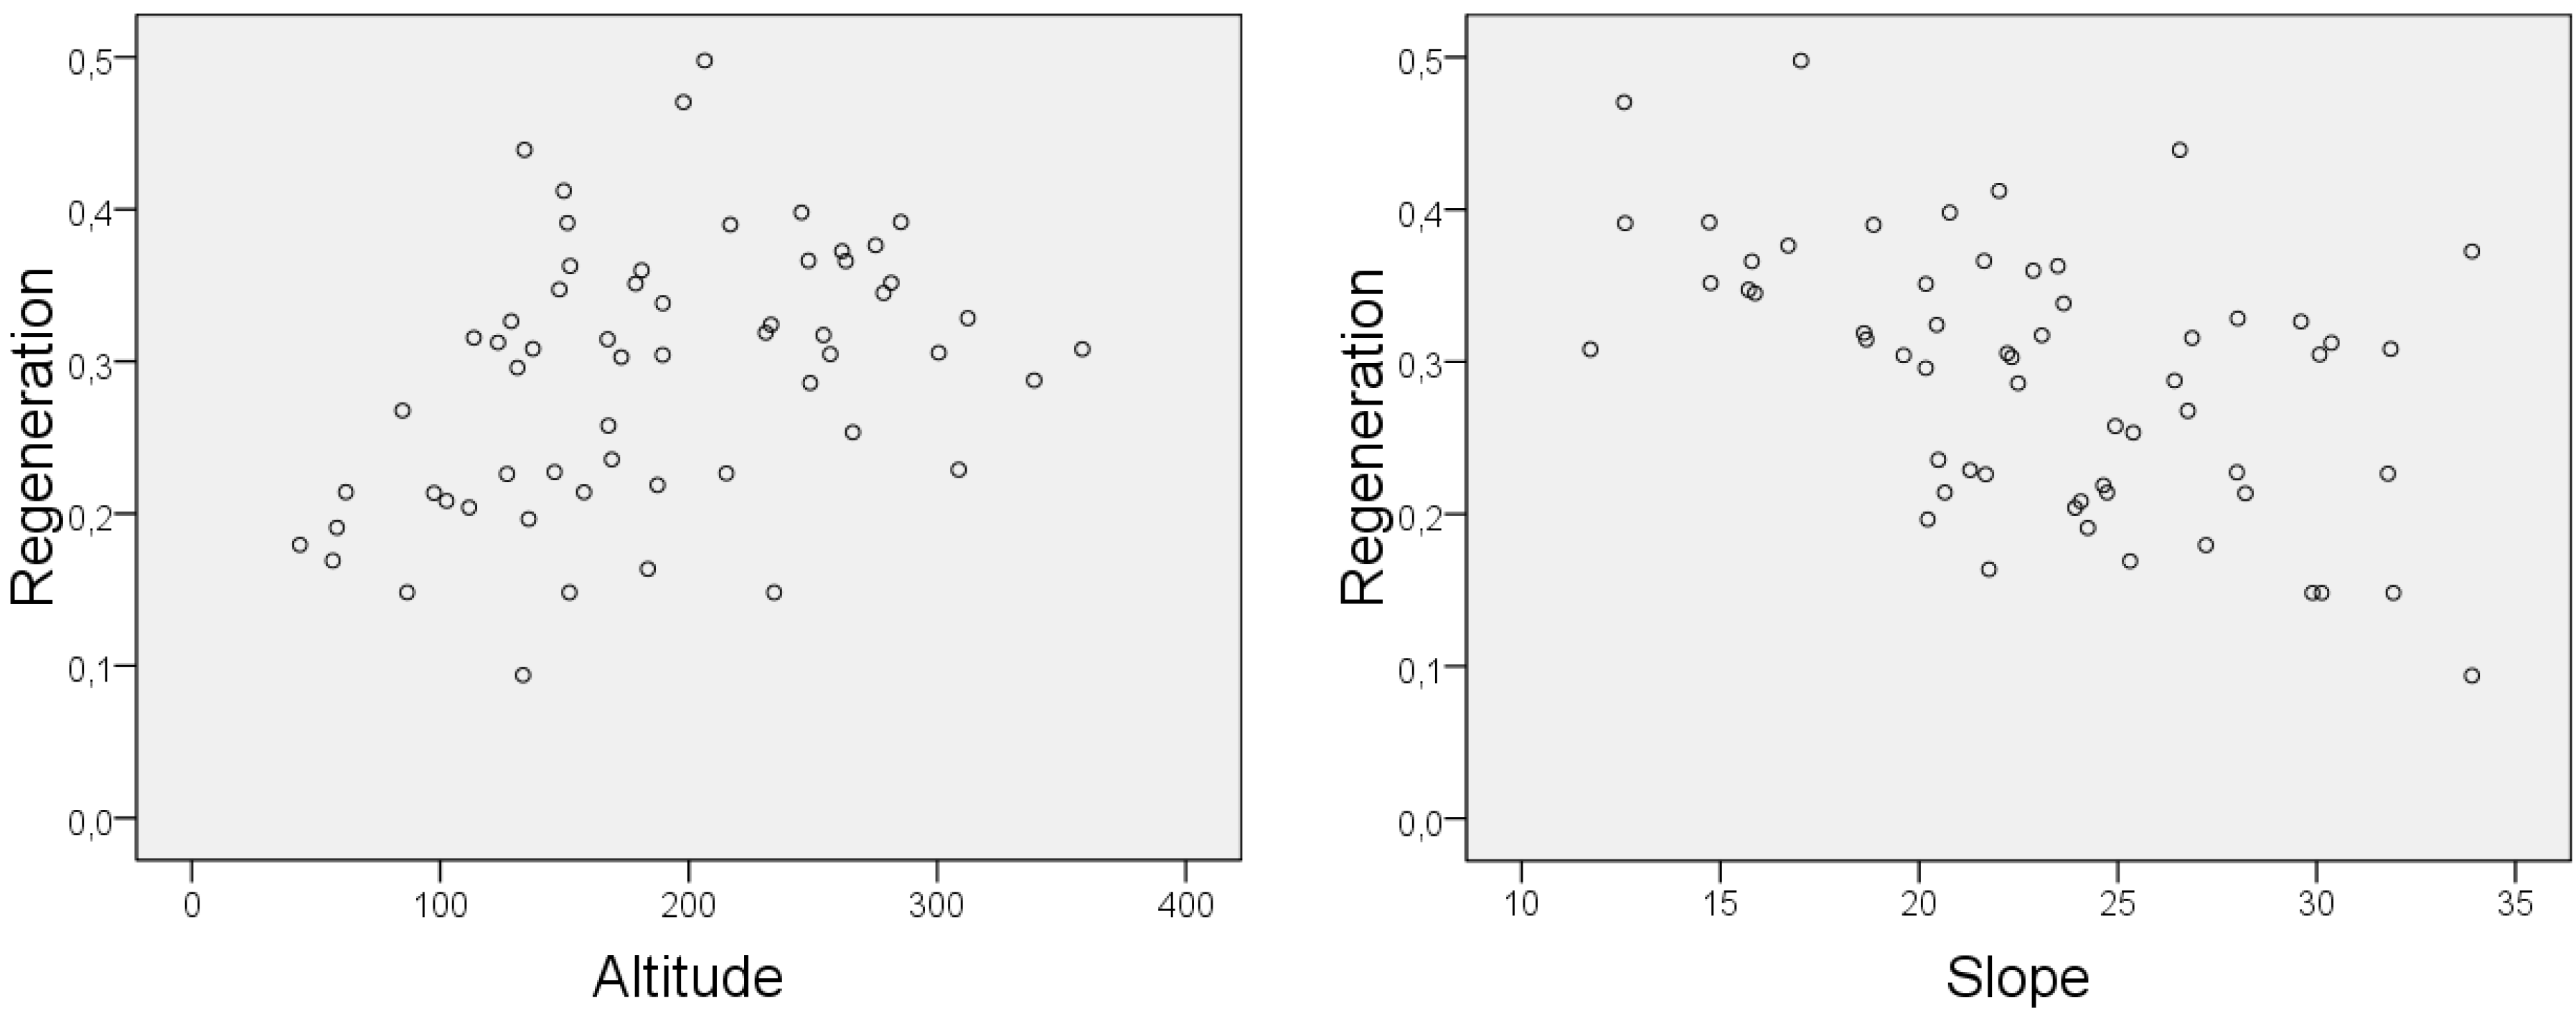
4.3. Changes in Vegetation Indices—Linear Regression
| Independent Value | Coefficient | Beta (s.c.) | p-Value |
|---|---|---|---|
| Altitude | 0.124 | 0.352 | 0.003 |
| Slope | 0.105 | −0.324 | 0.006 |
5. Discussion
6. Conclusions
Acknowledgments
Author Contributions
Conflicts of Interest
References
- Boydak, M. Silvicultural characteristics and natural regeneration of Pinus brutia Ten.—A review. Plant Ecol. 2004, 171, 153–163. [Google Scholar] [CrossRef]
- Distribution Map of Brutia Pine (Pinus Brutia). Available online: www.euforgen.org (accessed on 5 June 2015).
- Dounavi, K.; Koutsias, N.; Panetsos, K. Natural interspecific hybridization between Pinus brutia (Ten.) and Pinus halepensis (Mill.), verified by using the logistic regression modeling on morphological characters. For. Genet. 2001, 8, 151–158. [Google Scholar]
- Thanos, C.A.; Marcou, S. Post-Fire regeneration in Pinus brutia forest ecosystems of Samos island (Greece): 6 Years after. Acta Oecol. 1991, 12, 633–642. [Google Scholar]
- Spanos, I.A.; Daskalakou, E.N.; Thanos, C.A. Postfire, natural regeneration of Pinus brutia forests in Thasos island, Greece. Acta Oecol. Int. J. Ecol. 2000, 21, 13–20. [Google Scholar] [CrossRef]
- Spanos, I.A.; Radoglou, K.M.; Raftoyannis, Y. Site quality effects on post-fire regeneration of Pinus brutia forest on a Greek island. Appl. Veg. Sci. 2001, 4, 229–236. [Google Scholar] [CrossRef]
- Tsitsoni, T.; Ganatsas, P.; Zagas, T. Dynamics of postfire regeneration of Pinus brutia Ten. in an artificial forest ecosystem of northern Greece. Plant Ecol. 2004, 171, 165–174. [Google Scholar] [CrossRef]
- Pausas, J.C.; Llovet, J.; Rodrigo, A.; Vallejo, R. Are wildfires a disaster in the Mediterranean basin?—A review. Int. J. Wildland Fire 2008, 17, 713–723. [Google Scholar] [CrossRef]
- Ganatsas, P.; Zagas, T.; Tsakaldimi, A.; Tsitsoni, T. Postfire regeneration dynamics in a Mediterranean type ecosystem in Sithonia, northern Greece: Ten years after the fire. In Proceedings of the 10th MEDECOS Conference, Rhodes, Greece, 25 April–1 May 2004.
- Kazanis, D.; Arianoutsou, M. Long-term post-fire vegetation dynamics in Pinus halepensis forests of Central Greece: A functional group approach. Plant Ecol. 2004, 171, 101–121. [Google Scholar] [CrossRef]
- Marzano, R.; Lingua, E.; Garbarino, M. Post-fire effects and short-term regeneration dynamics following high-severity crown fires in a Mediterranean forest. iForest 2012, 5, 93–100. [Google Scholar] [CrossRef]
- Diaz-Delgado, R.; Lloret, F.; Pons, X.; Terradas, J. Satellite evidence of decreasing resilience in Mediterranean plant communities after recurrent wildfires. Ecology 2002, 83, 2293–2303. [Google Scholar] [CrossRef]
- Ganatsas, P.; Daskalakou, E.; Paitaridou, D. First results on early post-fire succession in an Abies cephalonica forest (Parnitha National Park, Greece). iForest 2012, 5, 6–12. [Google Scholar] [CrossRef]
- Martínez-Sánchez, J.J.; Marín, A.; Herranz, J.M.; Ferrandis, P.; De las Heras, J. Effects of high-temperatures on germination of Pinus halepensis Mill and P. pinaster Aiton subsp. pinaster seeds in Southeast Spain. Vegetatio 1995, 116, 69–72. [Google Scholar]
- Núñez, M.R.; Calvo, L. Effect of high temperatures on seed germination of Pinus sylvestris and Pinus halepensis. For. Ecol. Manag. 2000, 131, 183–190. [Google Scholar] [CrossRef]
- Pleniou, M.; Xystrakis, F.; Dimopoulos, P.; Koutsias, N. Maps of fire occurrence—Spatially explicit reconstruction of recent fire history using satellite remote sensing. J. Maps 2013, 8, 499–506. [Google Scholar] [CrossRef]
- Baeza, M.J.; Valdecantos, A.; Alloza, J.A.; Vallejo, V.R. Human disturbance and environmental factors as drivers of long-term post-fire regeneration patterns in Mediterranean forests. J. Veg. Sci. 2007, 18, 243–252. [Google Scholar] [CrossRef]
- Broncano, M.J.; Retana, J.; Rodrigo, A. Predicting the recovery of Pinus halepensis and Quercus ilex forests after a large wildfire in northeastern Spain. Plant Ecol. 2005, 180, 47–56. [Google Scholar] [CrossRef]
- Pausas, J.G.; Ribeiro, E.; Vallejo, R. Post-Fire regeneration variability of Pinus halepensis in the eastern Iberian Peninsula. For. Ecol. Manag. 2004, 203, 251–259. [Google Scholar] [CrossRef]
- Buhk, C.; Gotzenberger, L.; Wesche, K.; Gomez, P.S.; Hensen, I. Post-fire regeneration in a Mediterranean pine forest with historically low fire frequency. Acta Oecol. 2006, 30, 288–298. [Google Scholar] [CrossRef]
- Tsitsoni, T. Conditions determining natural regeneration after wildfires in the Pinus halepensis (Miller, 1768) forests of Kassandra peninsula (North Greece). For. Ecol. Manag. 1997, 92, 199–208. [Google Scholar] [CrossRef]
- Koutsias, N.; Xanthopoulos, G.; Founda, D.; Xystrakis, F.; Nioti, F.; Pleniou, M.; Mallinis, G.; Arianoutsou, M. On the relationships between forest fires and weather conditions in Greece from long-term national observations (1894–2010). Int. J. Wildland Fire 2013, 22, 493–507. [Google Scholar] [CrossRef]
- Xystrakis, F.; Kallimanis, A.S.; Dimopoulos, P.; Halley, J.M.; Koutsias, N. Precipitation dominates fire occurrence in Greece (1900–2010): Its dual role in fuel build-up and dryness. Nat. Hazards Earth Syst. Sci. 2014, 14, 21–32. [Google Scholar] [CrossRef]
- Koutsias, N.; Martínez-Fernández, J.; Allgower, B. Do factors causing wildfires vary in space? Evidence from geographically weighted regression. GISci. Remote Sens. 2010, 47, 221–240. [Google Scholar] [CrossRef]
- Sarris, D.; Koutsias, N. Ecological adaptations of plants to drought influencing the recent fire regime in the Mediterranean. Agric. For. Meteorol. 2014, 184, 158–169. [Google Scholar] [CrossRef]
- Lloret, F.; Calvo, E.; Pons, X.; Diaz-Delgado, R. Wildfires and landscape patterns in the Eastern Iberian peninsula. Landsc. Ecol. 2002, 17, 745–759. [Google Scholar] [CrossRef]
- Pérula, V.G.; Cerrillo, R.M.N.; Rebolloo, P.F.; Murillo, G.V. Postfire regeneration in Pinus pinea L. and Pinus pinaster Aiton in Andalucia (Spain). Environ. Manag. 2003, 31, 86–99. [Google Scholar]
- Viedma, O.; Moreno, J.M.; Rieiro, I. Interactions between land use/land cover change, forest fires and landscape structure in Sierra de Gredos (Central Spain). Environ. Conserv. 2006, 33, 212–222. [Google Scholar] [CrossRef]
- Xystrakis, F.; Koutsias, N. Differences of fire activity and their underlying factors among vegetation formations in Greece. iForest 2013, 6, 132–140. [Google Scholar] [CrossRef]
- Nioti, F.; Dimopoulos, P.; Koutsias, N. Correcting the fire scar perimeter of a 1983 wildfire using USGS-archived Landsat satellite data. GISci. Remote Sens. 2011, 48, 600–613. [Google Scholar] [CrossRef]
- Corona, P.; Lamonaca, A.; Chirici, G. Remote sensing support for post fire forest management. iForest 2008, 1, 6–12. [Google Scholar] [CrossRef]
- Raus, T.; Nioti, F.; Koutsias, N.; Dimopoulos, P. Ecology and mapping of post-fire recovery of Pinus brutia forests: A case study in the island of Karpathos, Greece. In Frontiers of Vegetation Science—An Evolutionary Angle; Mucina, L., Kalwij, J.M., Smith, V.R., Chytry, M., White, P.S., Gilliers, S.S., Pillar, V.D., Zobel, M., Sun, I.-F., Eds.; Keith Phillips Images: Somerset West, South Africa, 2008; pp. 149–150. [Google Scholar]
- Kriegler, F.; Malila, W.; Nalepka, R.; Richardson, W. Preprocessing transformations and their effects on multispectral recognition. In Proceedings of the Sixth International Symposium on Remote Sensing of Environment, Ann Arbor, MI, USA, 13–16 October 1969.
- Rouse, J.; Hass, R.; Schell, J.; Deering, D. Monitoring vegetation systems in the Great Plains with ERTS. Remote Sens. Environ. 1973, 44, 117–126. [Google Scholar]
- Viedma, O.; Melia, J.; Segarra, D.; Garcia-Haro, J. Modeling rates of ecosystem recovery after fires by using Landsat TM data. Remote Sens. Environ. 1997, 61, 383–398. [Google Scholar] [CrossRef]
- Key, C.H.; Benson, N.C. Measuring and remote sensing of burn severity: The CBI and NBR. In Proceedings of the Joint Fire Science Conference and Workshop, Boise, ID, USA, 15–17 June 1999.
- Key, C.H.; Benson, N.C. FIREMON-Landscape assessment. In FIREMON: Fire Effects Monitoring and Inventory System; Lutes, D.C., Keane, R.E., Caratti, J.F., Key, C.H., Benson, N.C., Sutherland, S., Gangi, L.J., Eds.; USDA Forest Service, Rocky Mountain Research Station: Ogden, UT, USA, 2006; pp. LA 1–51. [Google Scholar]
- Chuvieco, E.; Martin, M.; Palacios, A. Assessment of different spectral indices in the red-near-infrared spectral domain for burned land discrimination. Int. J. Remote Sens. 2002, 23, 5103–5110. [Google Scholar] [CrossRef]
- Stroppiana, D.; Boschetti, M.; Zaffaroni, P.; Brivio, P.A. Analysis and interpretation of spectral indices for soft multicriteria burned-area mapping in Mediterranean regions. IEEE Geosci. Remote Sens. Lett. 2009, 6, 499–503. [Google Scholar] [CrossRef]
- Baret, F.; Guyot, G. Potentials and limits of vegetation indices for LAI and APAR assessment. Remote Sens. Environ. 1991, 35, 161–173. [Google Scholar] [CrossRef]
- Purevdorj, T.; Tateishi, R.; Ishiyama, T.; Honda, Y. Relationships between percent vegetation cover and vegetation indices. Int. J. Remote Sens. 1998, 19, 3519–3535. [Google Scholar] [CrossRef]
- Huete, A. A soil-adjusted vegetation index (SAVI). Remote Sens. Environ. 1988, 25, 295–309. [Google Scholar] [CrossRef]
- Qi, J.; Chehbouni, A.; Huete, A.; Kerr, Y.; Sorooshian, S. A modified soil adjusted vegetation index. Remote Sens. Environ. 1994, 48, 119–126. [Google Scholar] [CrossRef]
- Kaufman, Y.; Tanre, D. Atmospherically Resistant Vegetation Index (ARVI) for EOS-MODIS. IEEE Trans. Geosci. Remote Sens. 1992, 30, 261–270. [Google Scholar] [CrossRef]
- Pinty, B.; Verstraete, M. GEMI: A nonlinear index to monitor global vagetation from satellites. Vegetatio 1992, 101, 15–20. [Google Scholar] [CrossRef]
- Lopez Garcia, M.J.; Caselles, V. Mapping burns and natural reforestation using Thematic Mapper data. Geocarto Int. 1991, 6, 31–37. [Google Scholar] [CrossRef]
- Koutsias, N.; Karteris, M. Burned area mapping using logistic regression modeling of a single post-fire Landsat-5 Thematic Mapper image. Int. J. Remote Sens. 2000, 21, 673–687. [Google Scholar] [CrossRef]
- Pleniou, M.; Koutsias, N. Sensitivity of spectral reflectance values to different burn and vegetation ratios: Α multi-scale approach applied in a fire affected area. ISPRS J. Photogramm. Remote Sens. 2013, 79, 199–210. [Google Scholar] [CrossRef]
- Pleniou, M.; Koutsias, N. Relationships between vegetation indices and different burn and vegetation ratios. A multi-scale approach applied in a fire affected area. In Proceedings of the 1st International Conference on Remote Sensing and Geoinformation of the Environment, Paphos, Cyprus, 8–10 April 2013.
- Pleniou, M.; Koutsias, N. Sensitivity of vegetation indices to different burn and vegetation ratios using LANDSAT-5 satellite data. In Proceedings of the 1st International Conference on Remote Sensing and Geoinformation of the Environment, Paphos, Cyprus, 8–10 April 2013.
- Stevens, D.L.; Olsen, A.R. Spatially balanced sampling of natural resources. J. Am. Stat. Assoc. 2004, 99, 262–278. [Google Scholar] [CrossRef]
- R Development Core Team. R: A Language and Environment for Statistical Computing; R Development Core Team: Vienna, Austria, 2011. [Google Scholar]
- Mallinis, G.; Koutsias, N.; Tsakiri-Strati, M.; Karteris, M. Object-Based classification using Quickbird imagery for delineating forest vegetation polygons in a Mediterranean test site. ISPRS J. Photogramm. Remote Sens. 2008, 63, 237–250. [Google Scholar] [CrossRef]
- Koutsias, N.; Mallinis, G.; Pleniou, M.; Voukelatou, I.; Paschali, T.; Dimopoulos, P. Object-Based classification using a synergy of high spatial (IKONOS) and high spectral (ASTER) satellite data in a rural NATURA 2000 deltaic area. In Proceedings of the 2nd International Conference on Space Technology, Athens, Greece, 15–17 September 2011.
- Vilar del Hoyo, L.; Martín Isabel, M.; Martínez Vega, F. Logistic regression models for human-caused wildfire risk estimation: Analysing the effect of the spatial accuracy in fire occurrence data. Eur. J. For. Res. 2010. [Google Scholar] [CrossRef]
- Vasconcelos, M.J.P.; Silva, S.; Tome, M.; Alnim, M.; Pereira, J.M.C. Spatial prediction of fire ignition probabilities: Comparing logistic regression and neural networks. Photogramm. Eng. Remote Sens. 2001, 67, 73–81. [Google Scholar]
- Hosmer, D.W.; Lemeshow, S. Applied Logistic Regression, 2nd ed.; Wiley: New York, NY, USA, 2000. [Google Scholar]
- Arianoutsou, M.; Koukoulas, S.; Kazanis, D. Evaluating post-fire forest resilience using GIS and multi-criteria analysis: An example from Cape Sounion national park, Greece. Environ. Manag. 2011, 47, 384–397. [Google Scholar] [CrossRef] [PubMed]
- Gracia, M.; Retana, J.; Roig, P. Mid-Term successional patterns after fire of mixed pine-oak forests in NE Spain. Acta Oecol. Int. J. Ecol. 2002, 23, 405–411. [Google Scholar] [CrossRef]
- Thanos, C.A.; Daskalakou, E.N.; Nikolaidou, S. Early post-fire regeneration of a Pinus halepensis forest on Mount Parnis, Greece. J. Veg. Sci. 1996, 7, 273–280. [Google Scholar] [CrossRef]
- Arianoutsou, M. Landscape changes in Mediterranean ecosystems of Greece: Implications for fire and biodiversity issues. J. Mediterr. Ecol. 2001, 2, 165–178. [Google Scholar]
- Romero-Calcerrada, R.; Perry, G.L.W. The role of land abandonment in landscape dynamics in the SPA Encinares del rio Alberche y Cofio, Central Spain, 1984–1999. Landsc. Urban Plan. 2004, 66, 217–232. [Google Scholar] [CrossRef]
- Keeley, J.E.; Bond, W.J.; Bradstock, R.A.; Pausas, J.G.; Rundel, P.W. Fire in Mediterranean Ecosystems—Ecology, Evolution and Management; Cambridge University Press: New York, NY, USA, 2011; p. 515. [Google Scholar]
- Escuin, S.; Navarro, R.; Fernández, P. Fire severity assessment by using NBR (Normalized Burn Ratio) and NDVI (Normalized Difference Vegetation Index) derived from LANDSAT TM/ETM images. Int. J. Remote Sens. 2007, 29, 1053–1073. [Google Scholar] [CrossRef]
- Gouvas, M.; Sakellariou, N.; Xystrakis, F. The relationship between altitude of meteorological stations and average monthly and annual Precipitation. Stud. Geophys. Geod. 2009, 53, 557–570. [Google Scholar] [CrossRef]
- Gouvas, M.; Sakellariou, N. On the estimation of the monthly and annual values of mean maximum and minimum air temperatures over Greece. In Proceedings of the 6th Hellenic Conference in Meteorology Climatology and Atmospheric Physics, Ioannina, Greece, 25–28 September 2002.
- Röder, A.; Udelhoven, T.; Hill, J.; del Barrio, G.; Tsiourlis, G. Trend analysis of Landsat-TM and -ETM+ imagery to monitor grazing impact in a rangeland ecosystem in Northern Greece. Remote Sens. Environ. 2008, 112, 2863–2875. [Google Scholar] [CrossRef]
- Bennie, J.; Huntley, B.; Wiltshire, A.; Hill, M.O.; Baxter, R. Slope, aspect and climate: Spatially explicit and implicit models of topographic microclimate in chalk grassland. Ecol. Model. 2008, 216, 47–59. [Google Scholar] [CrossRef]
- Röder, A.; Hill, J.; Duguy, B.; Alloza, J.A.; Vallejo, R. Using long time series of Landsat data to monitor fire events and post-fire dynamics and identify driving factors. A case study in the Ayora region (eastern Spain). Remote Sens. Environ. 2008, 112, 259–273. [Google Scholar] [CrossRef]
- Pausas, J.G.; Ouadah, N.; Ferran, A.; Gimeno, T.; Vallejo, R. Fire severity and seedling establishment in Pinus halepensis woodlands, eastern Iberian Peninsula. Plant Ecol. 2003, 169, 205–213. [Google Scholar] [CrossRef]
© 2015 by the authors; licensee MDPI, Basel, Switzerland. This article is an open access article distributed under the terms and conditions of the Creative Commons Attribution license (http://creativecommons.org/licenses/by/4.0/).
Share and Cite
Nioti, F.; Xystrakis, F.; Koutsias, N.; Dimopoulos, P. A Remote Sensing and GIS Approach to Study the Long-Term Vegetation Recovery of a Fire-Affected Pine Forest in Southern Greece. Remote Sens. 2015, 7, 7712-7731. https://doi.org/10.3390/rs70607712
Nioti F, Xystrakis F, Koutsias N, Dimopoulos P. A Remote Sensing and GIS Approach to Study the Long-Term Vegetation Recovery of a Fire-Affected Pine Forest in Southern Greece. Remote Sensing. 2015; 7(6):7712-7731. https://doi.org/10.3390/rs70607712
Chicago/Turabian StyleNioti, Foula, Fotios Xystrakis, Nikos Koutsias, and Panayotis Dimopoulos. 2015. "A Remote Sensing and GIS Approach to Study the Long-Term Vegetation Recovery of a Fire-Affected Pine Forest in Southern Greece" Remote Sensing 7, no. 6: 7712-7731. https://doi.org/10.3390/rs70607712
APA StyleNioti, F., Xystrakis, F., Koutsias, N., & Dimopoulos, P. (2015). A Remote Sensing and GIS Approach to Study the Long-Term Vegetation Recovery of a Fire-Affected Pine Forest in Southern Greece. Remote Sensing, 7(6), 7712-7731. https://doi.org/10.3390/rs70607712