
Self-Adaptive Gradient-Based Thresholding Method for Coal Fire Detection Using ASTER Thermal Infrared Data, Part I: Methodology and Decadal Change Detection


 ,
, 
Abstract
:
1. Introduction
2. Study Area and Data
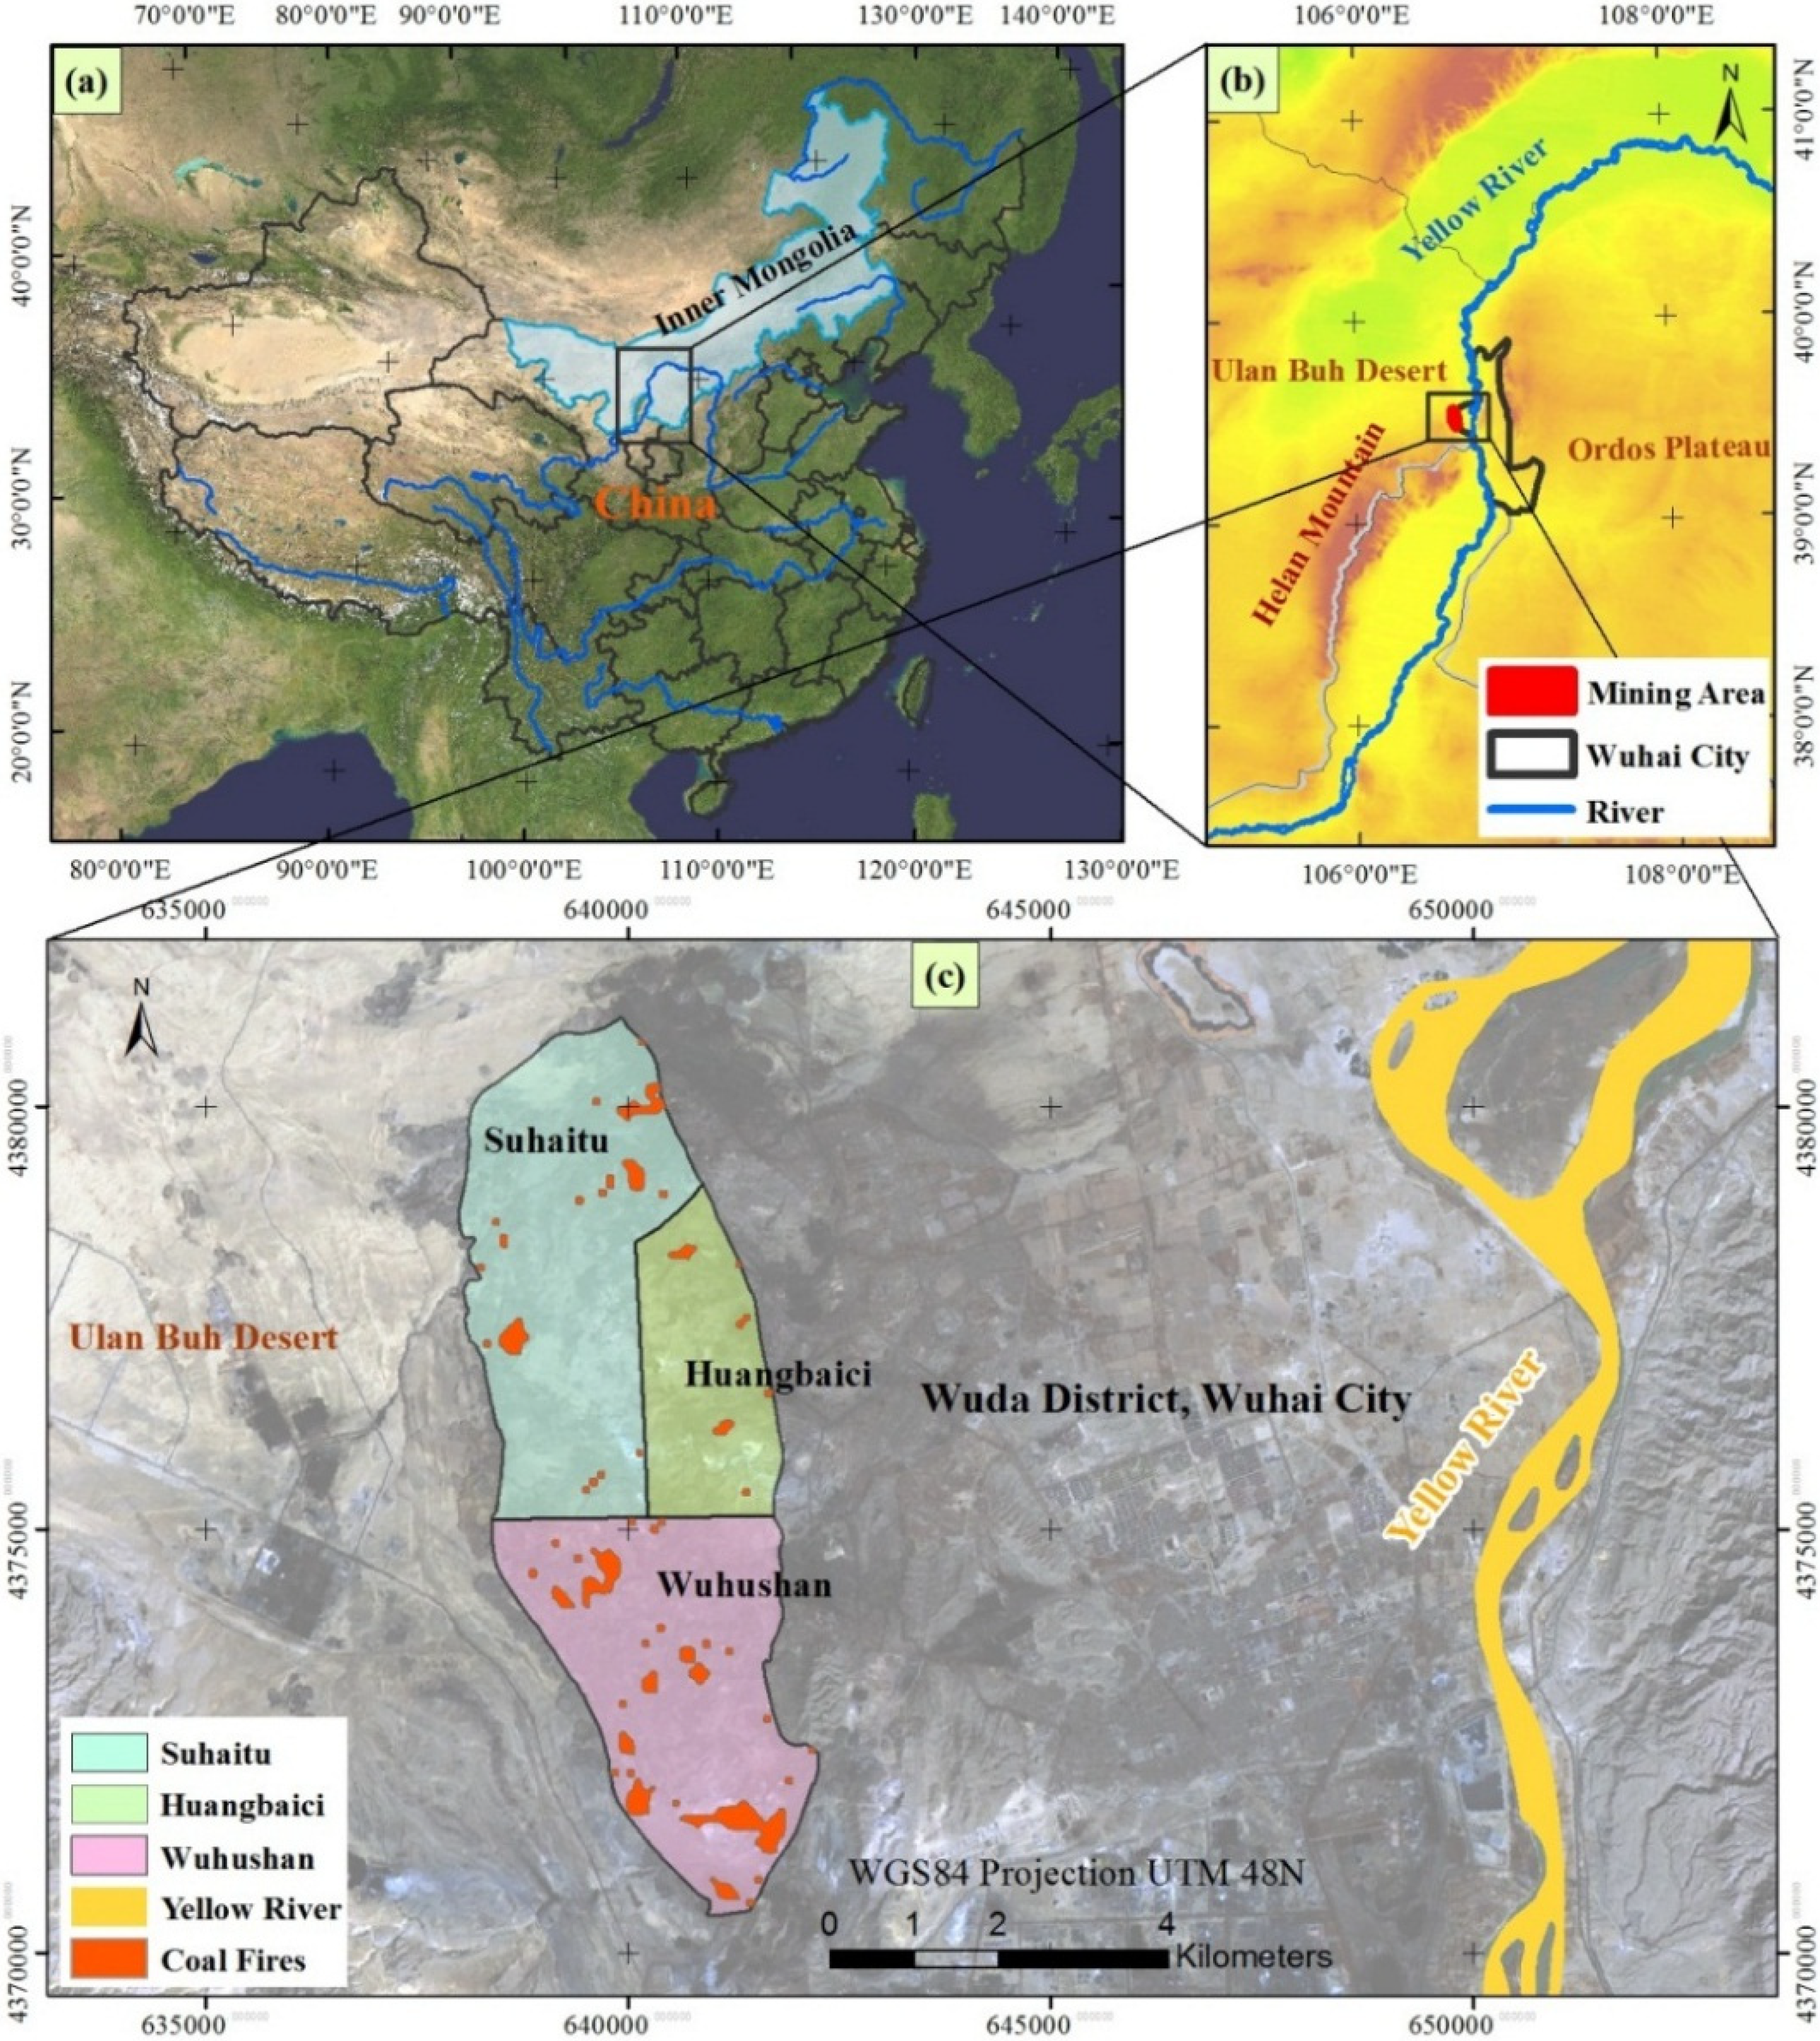
2.1. Study Regions

2.2. Remote Sensing Data for Algorithm Development

| Acquisition Date, Time (month/day/ year time UTC) | Day/Night |
|---|---|
| 03/27/2013 03 | Day |
| 03/27/2013 14 | Night |
| 04/12/2013 14 | Night |
| 06/22/2013 03 | Day |
| 06/22/2013 14 | Night |
| 07/01/2013 14 | Night |
| 11/29/2007 03 | Night |
| 11/29/2007 14 | Day |
| 09/21/2002 14 | Night |
2.3. Remote Sensing Data for Decadal Change Detection (2001 to 2011)
| Aster Scene ID 1 | Acquisition Date (dd/mm/yyyy) | Day/Night |
|---|---|---|
| ASTL1B_0108080402180108190577 | 8 August 2001 | Night |
| ASTL1B_0209211454220210140292 | 21 September 2002 | Night |
| ASTL1B_0309240347540310110308 | 24 September 2003 | Night |
| ASTL1B_0504131458440504160548 2 | 13 April 2005 | Night |
| ASTL1B_0510060353310510080444 | 06 October 2005 | Night |
| ASTL1B_0612280354140701010054 | 28 December 2006 | Night |
| ASTL1B_0711291458560806290389 | 29 November 2007 | Day |
| ASTL1B_0804211459100804240676 | 21 April 2008 | Night |
| ASTL1B_1003260354351003290102 | 26 March 2010 | Night |
| ASTL1B_1101241458341101270384 | 24 January 2011 | Night |
| ASTL1B_0108080402180108190577 | 23 December 2013 | Day |
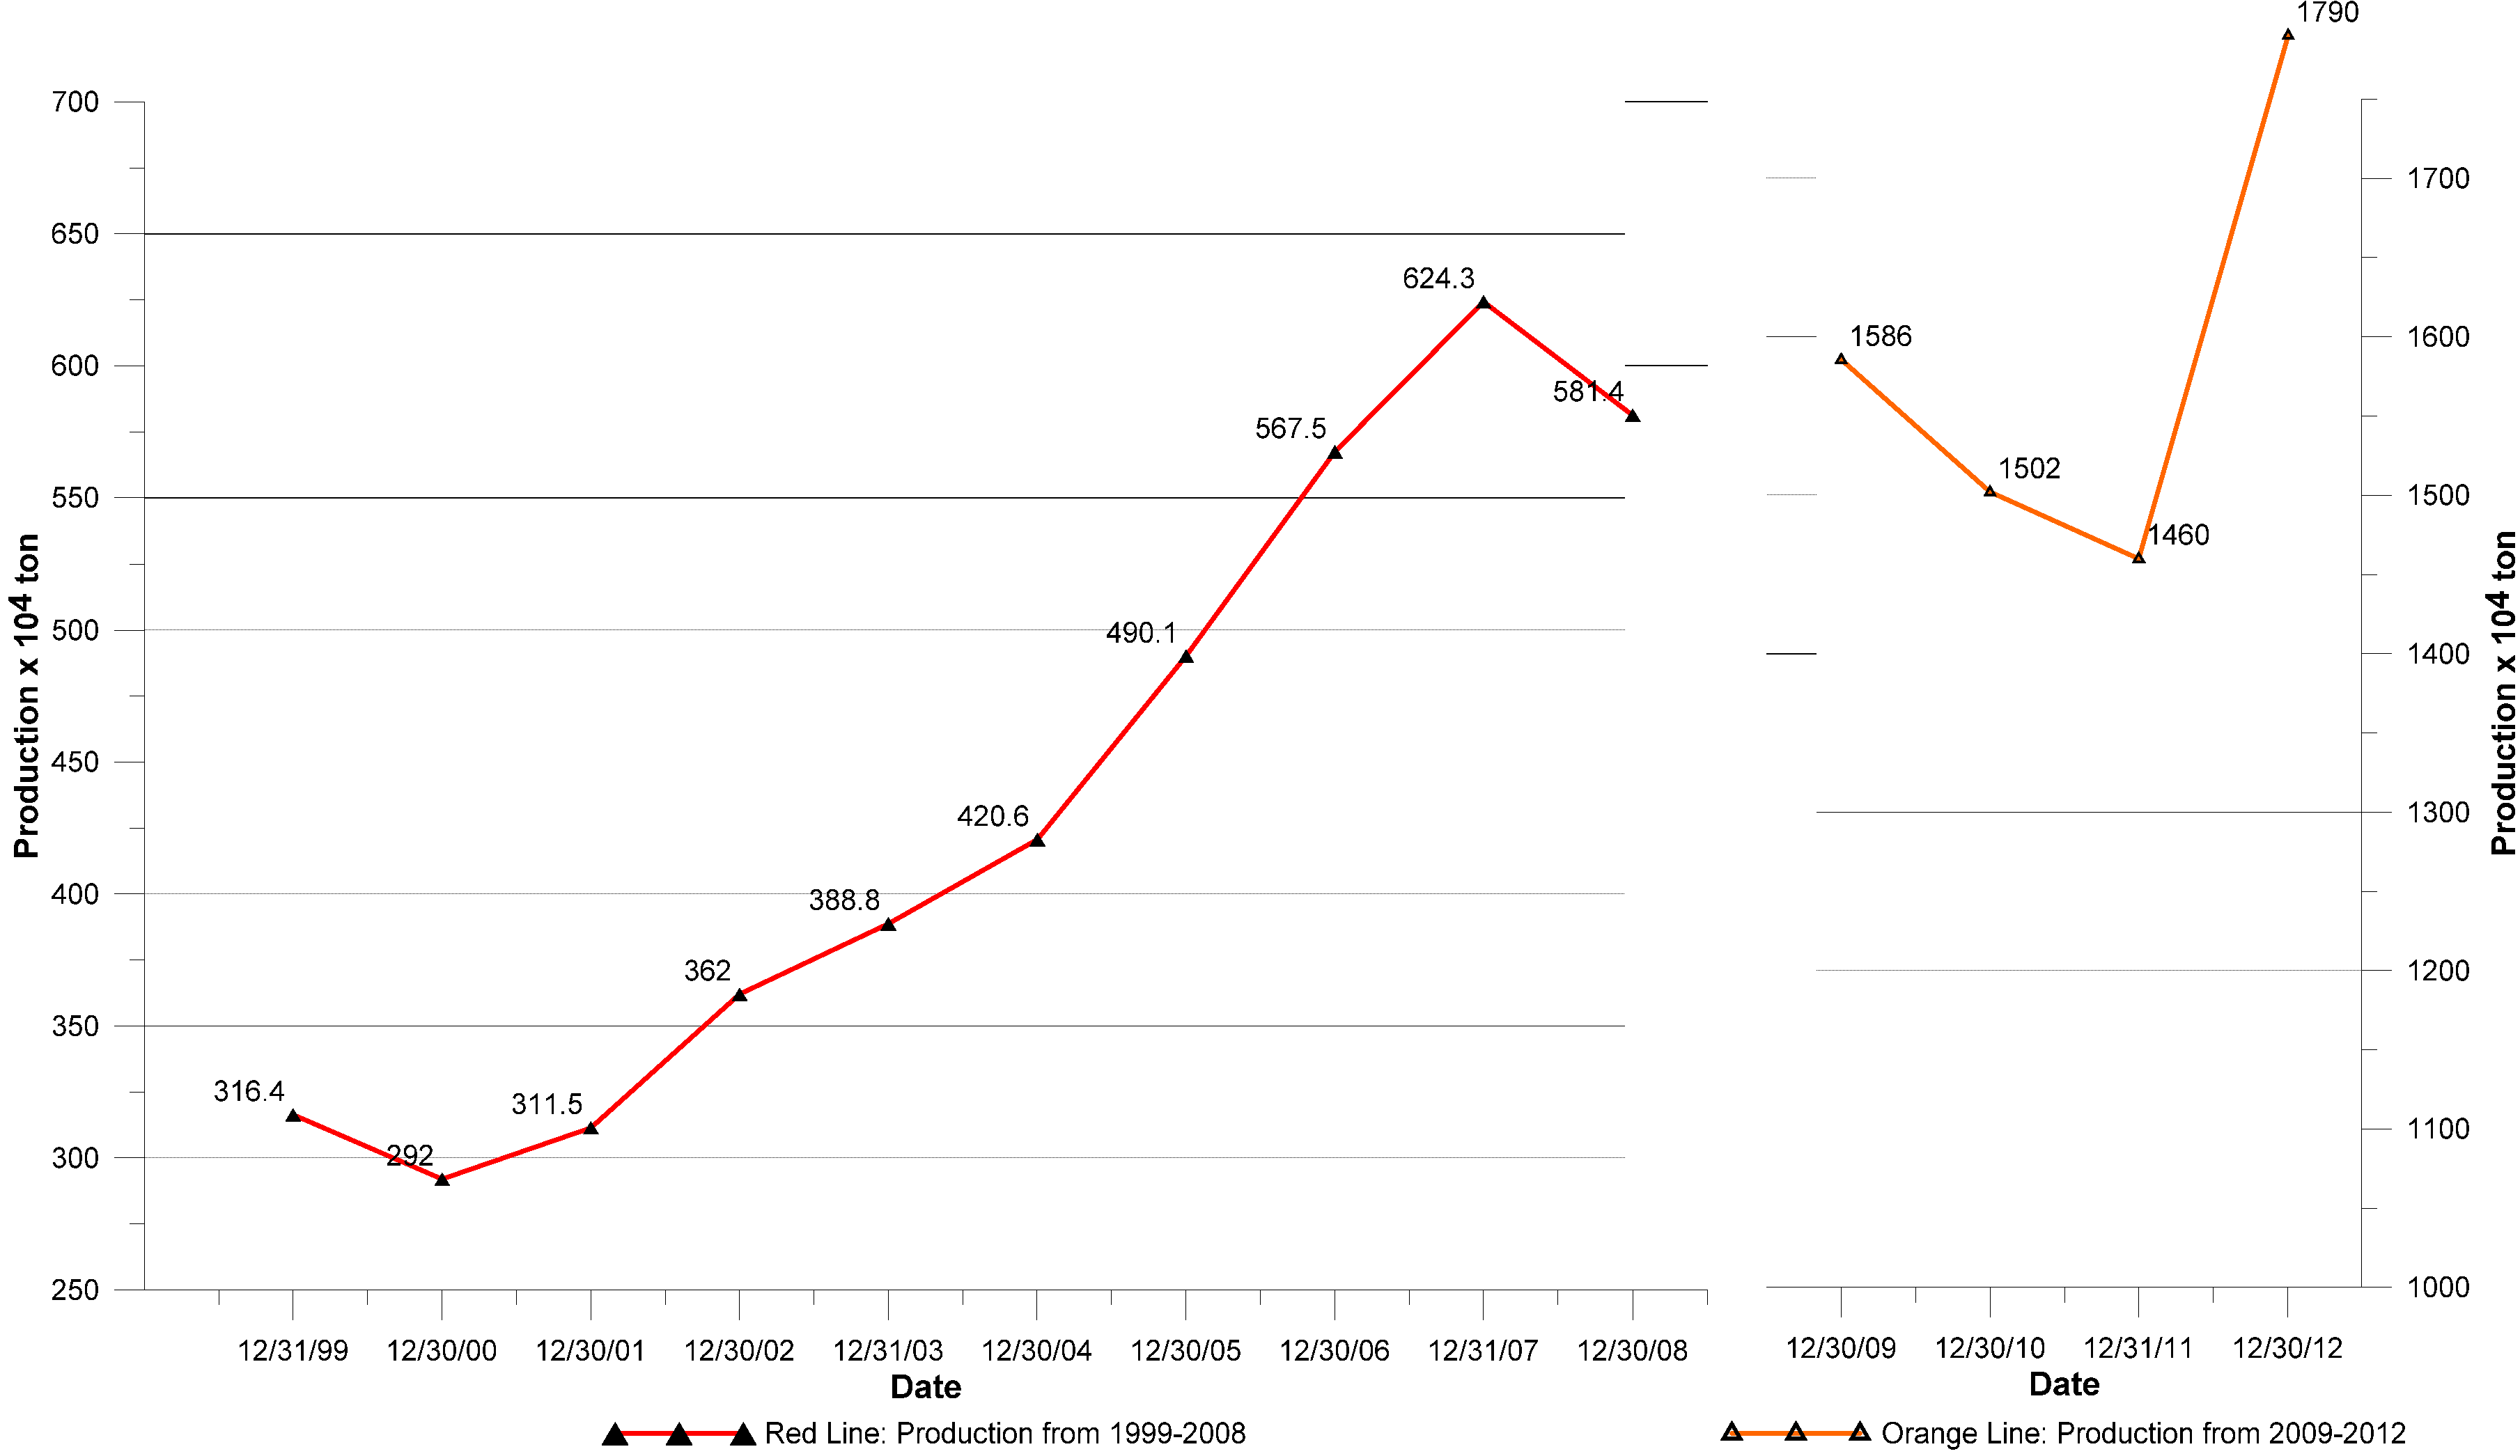
2.4. Coal Production Data for the Wuda Coalfield
3. Preliminary Data Preprocessing and Analysis
3.1. Atmospheric Correction
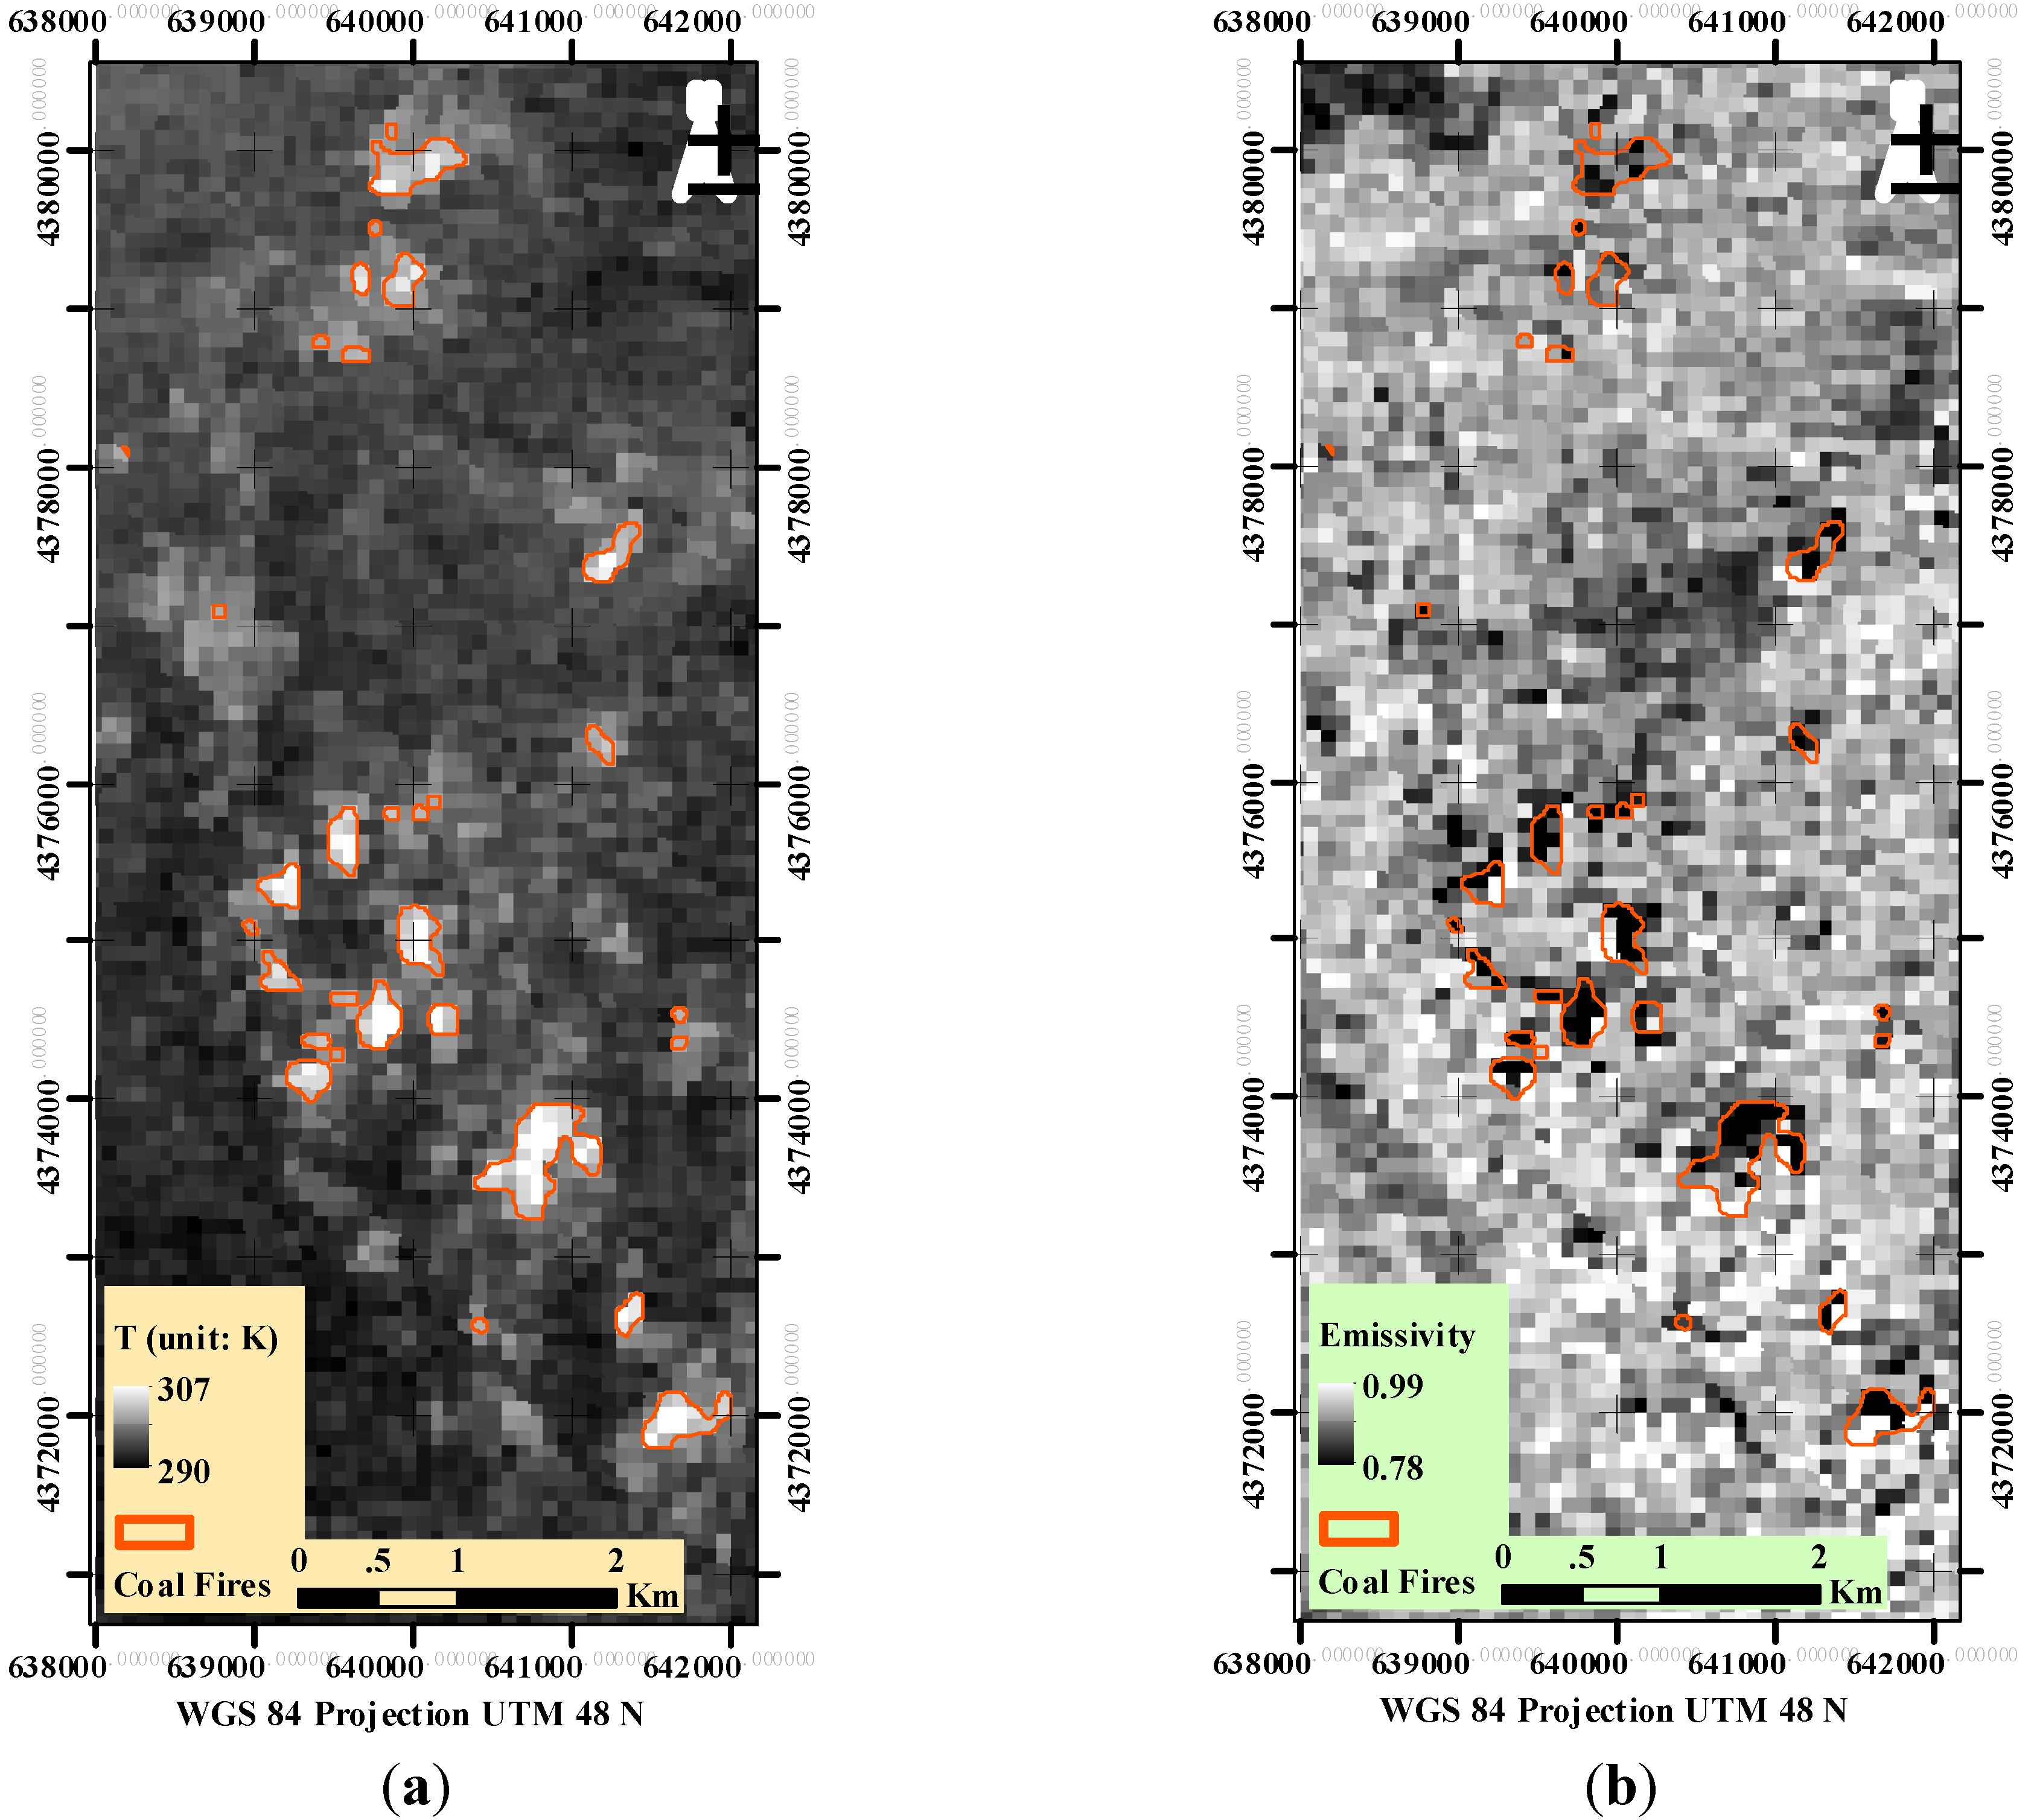
3.2. Land Surface Temperature and Land Surface Emissivity Retrieval
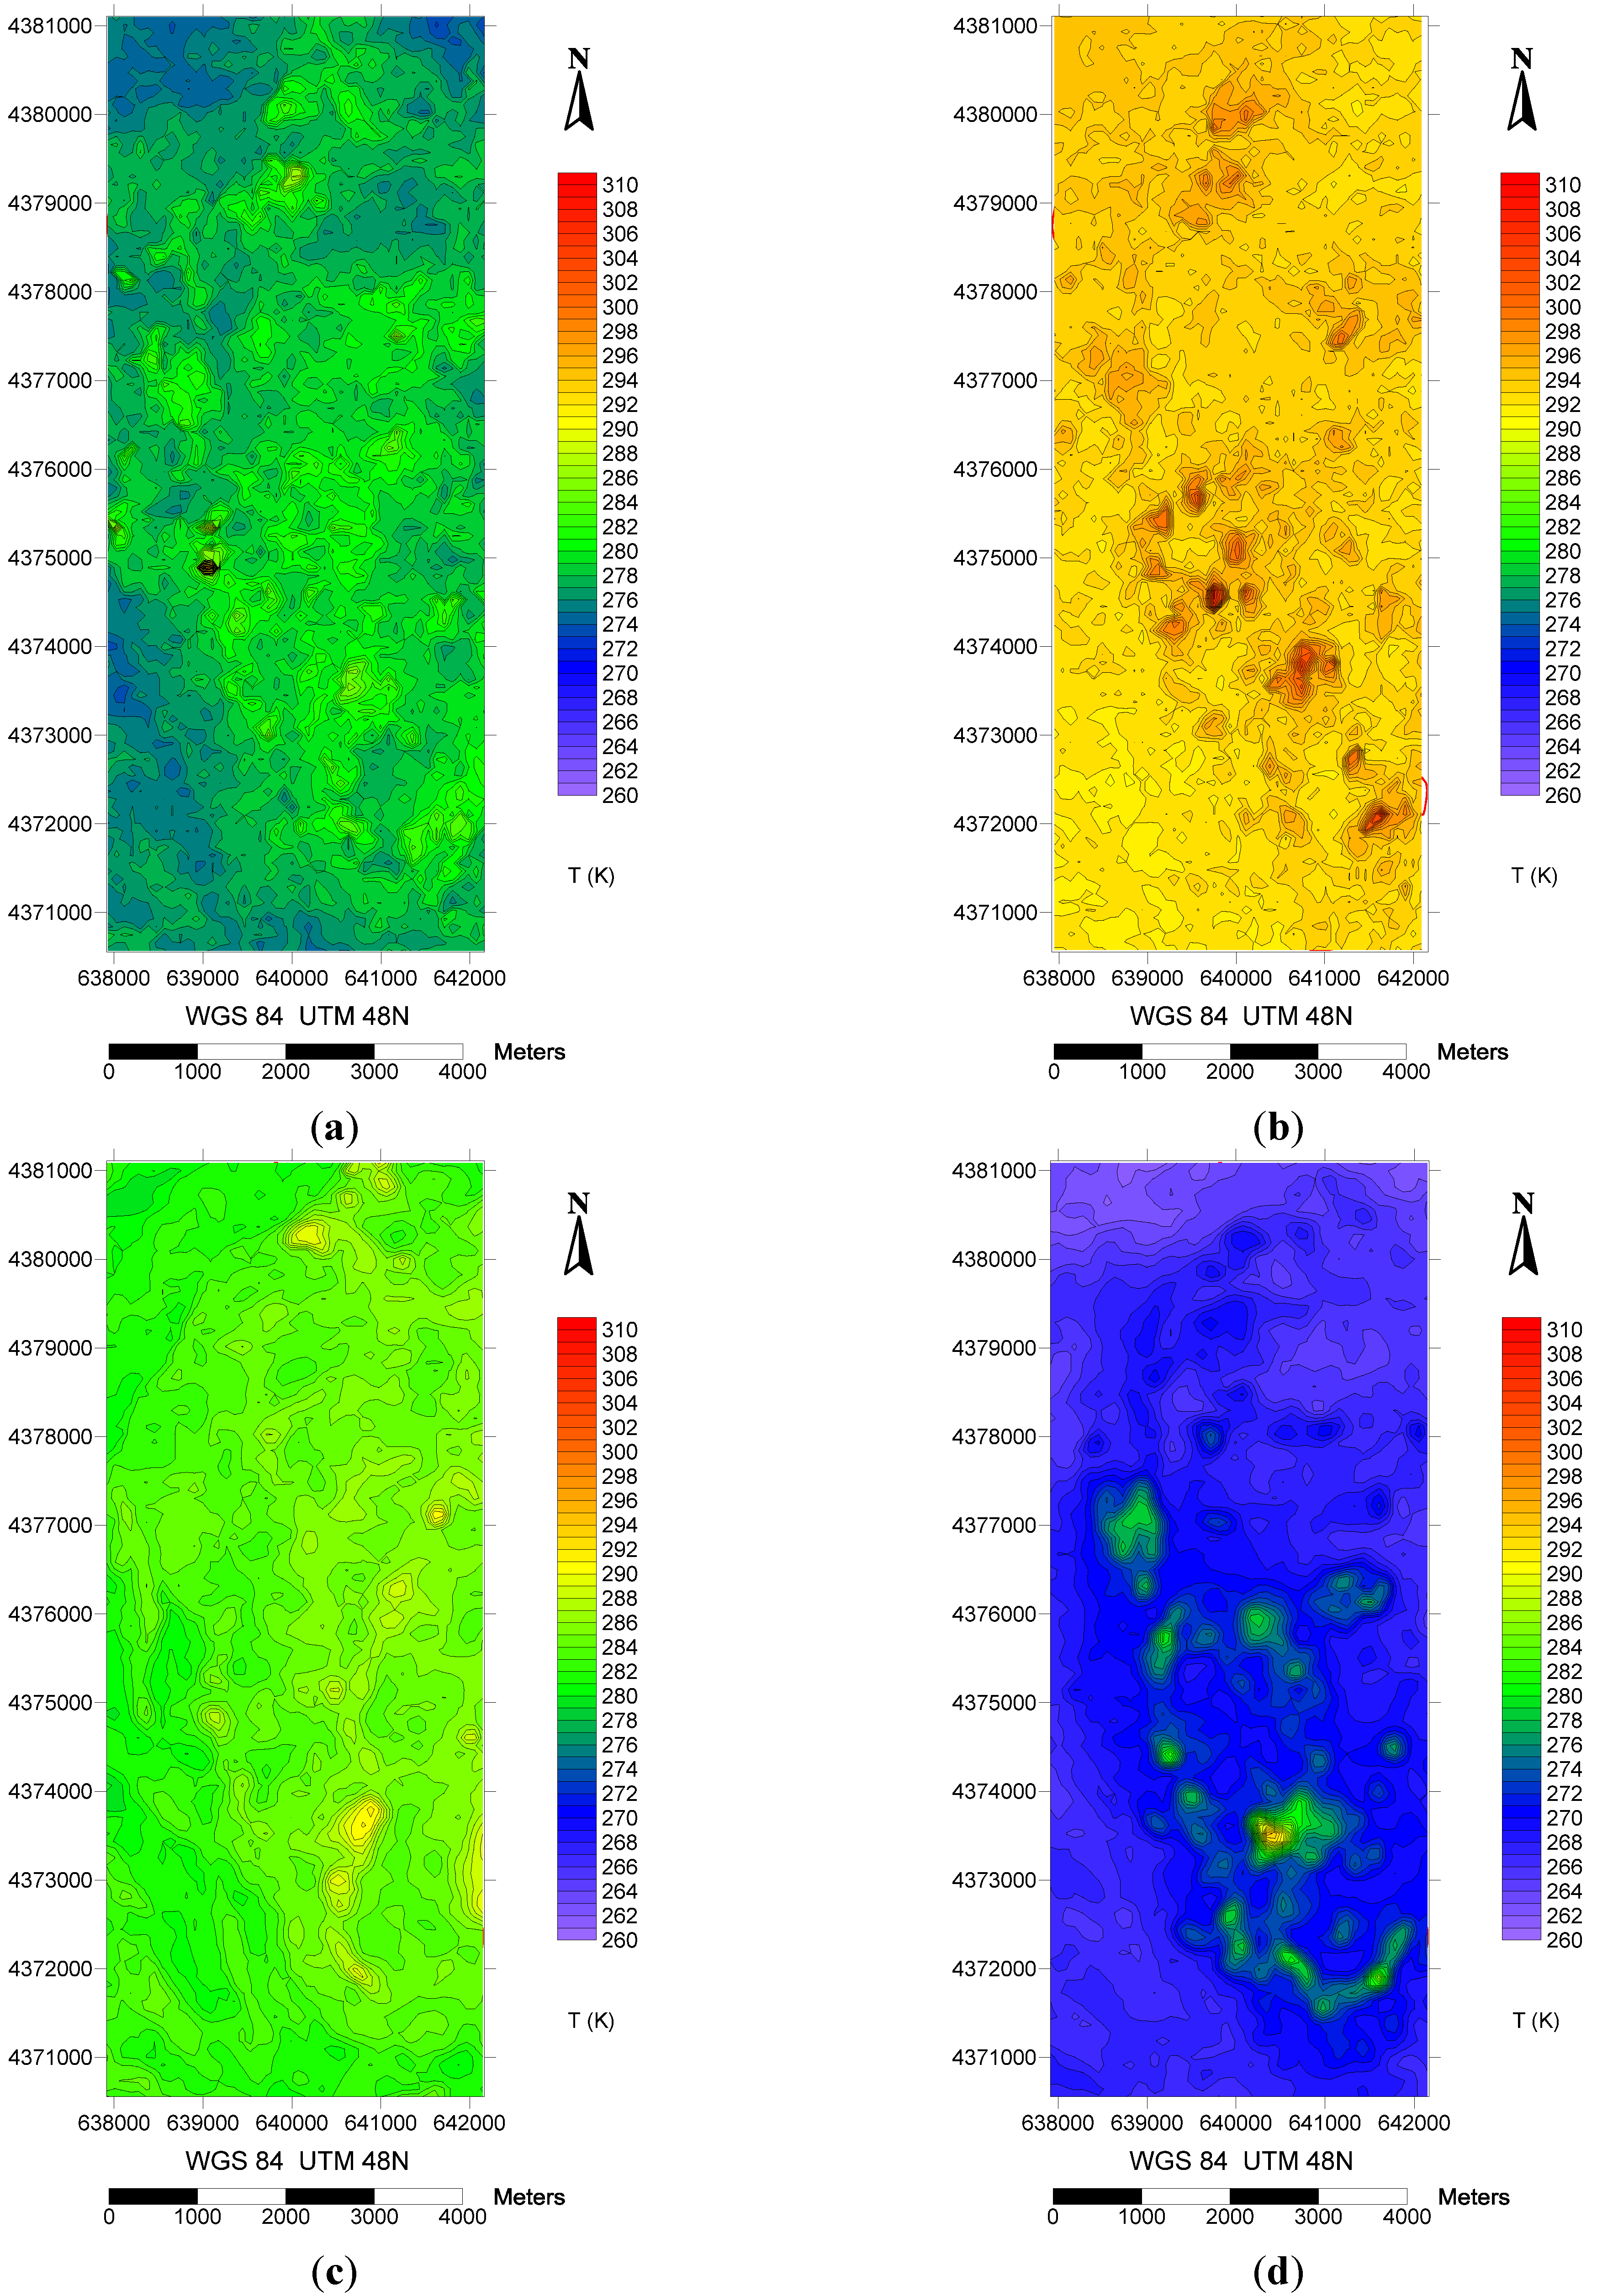
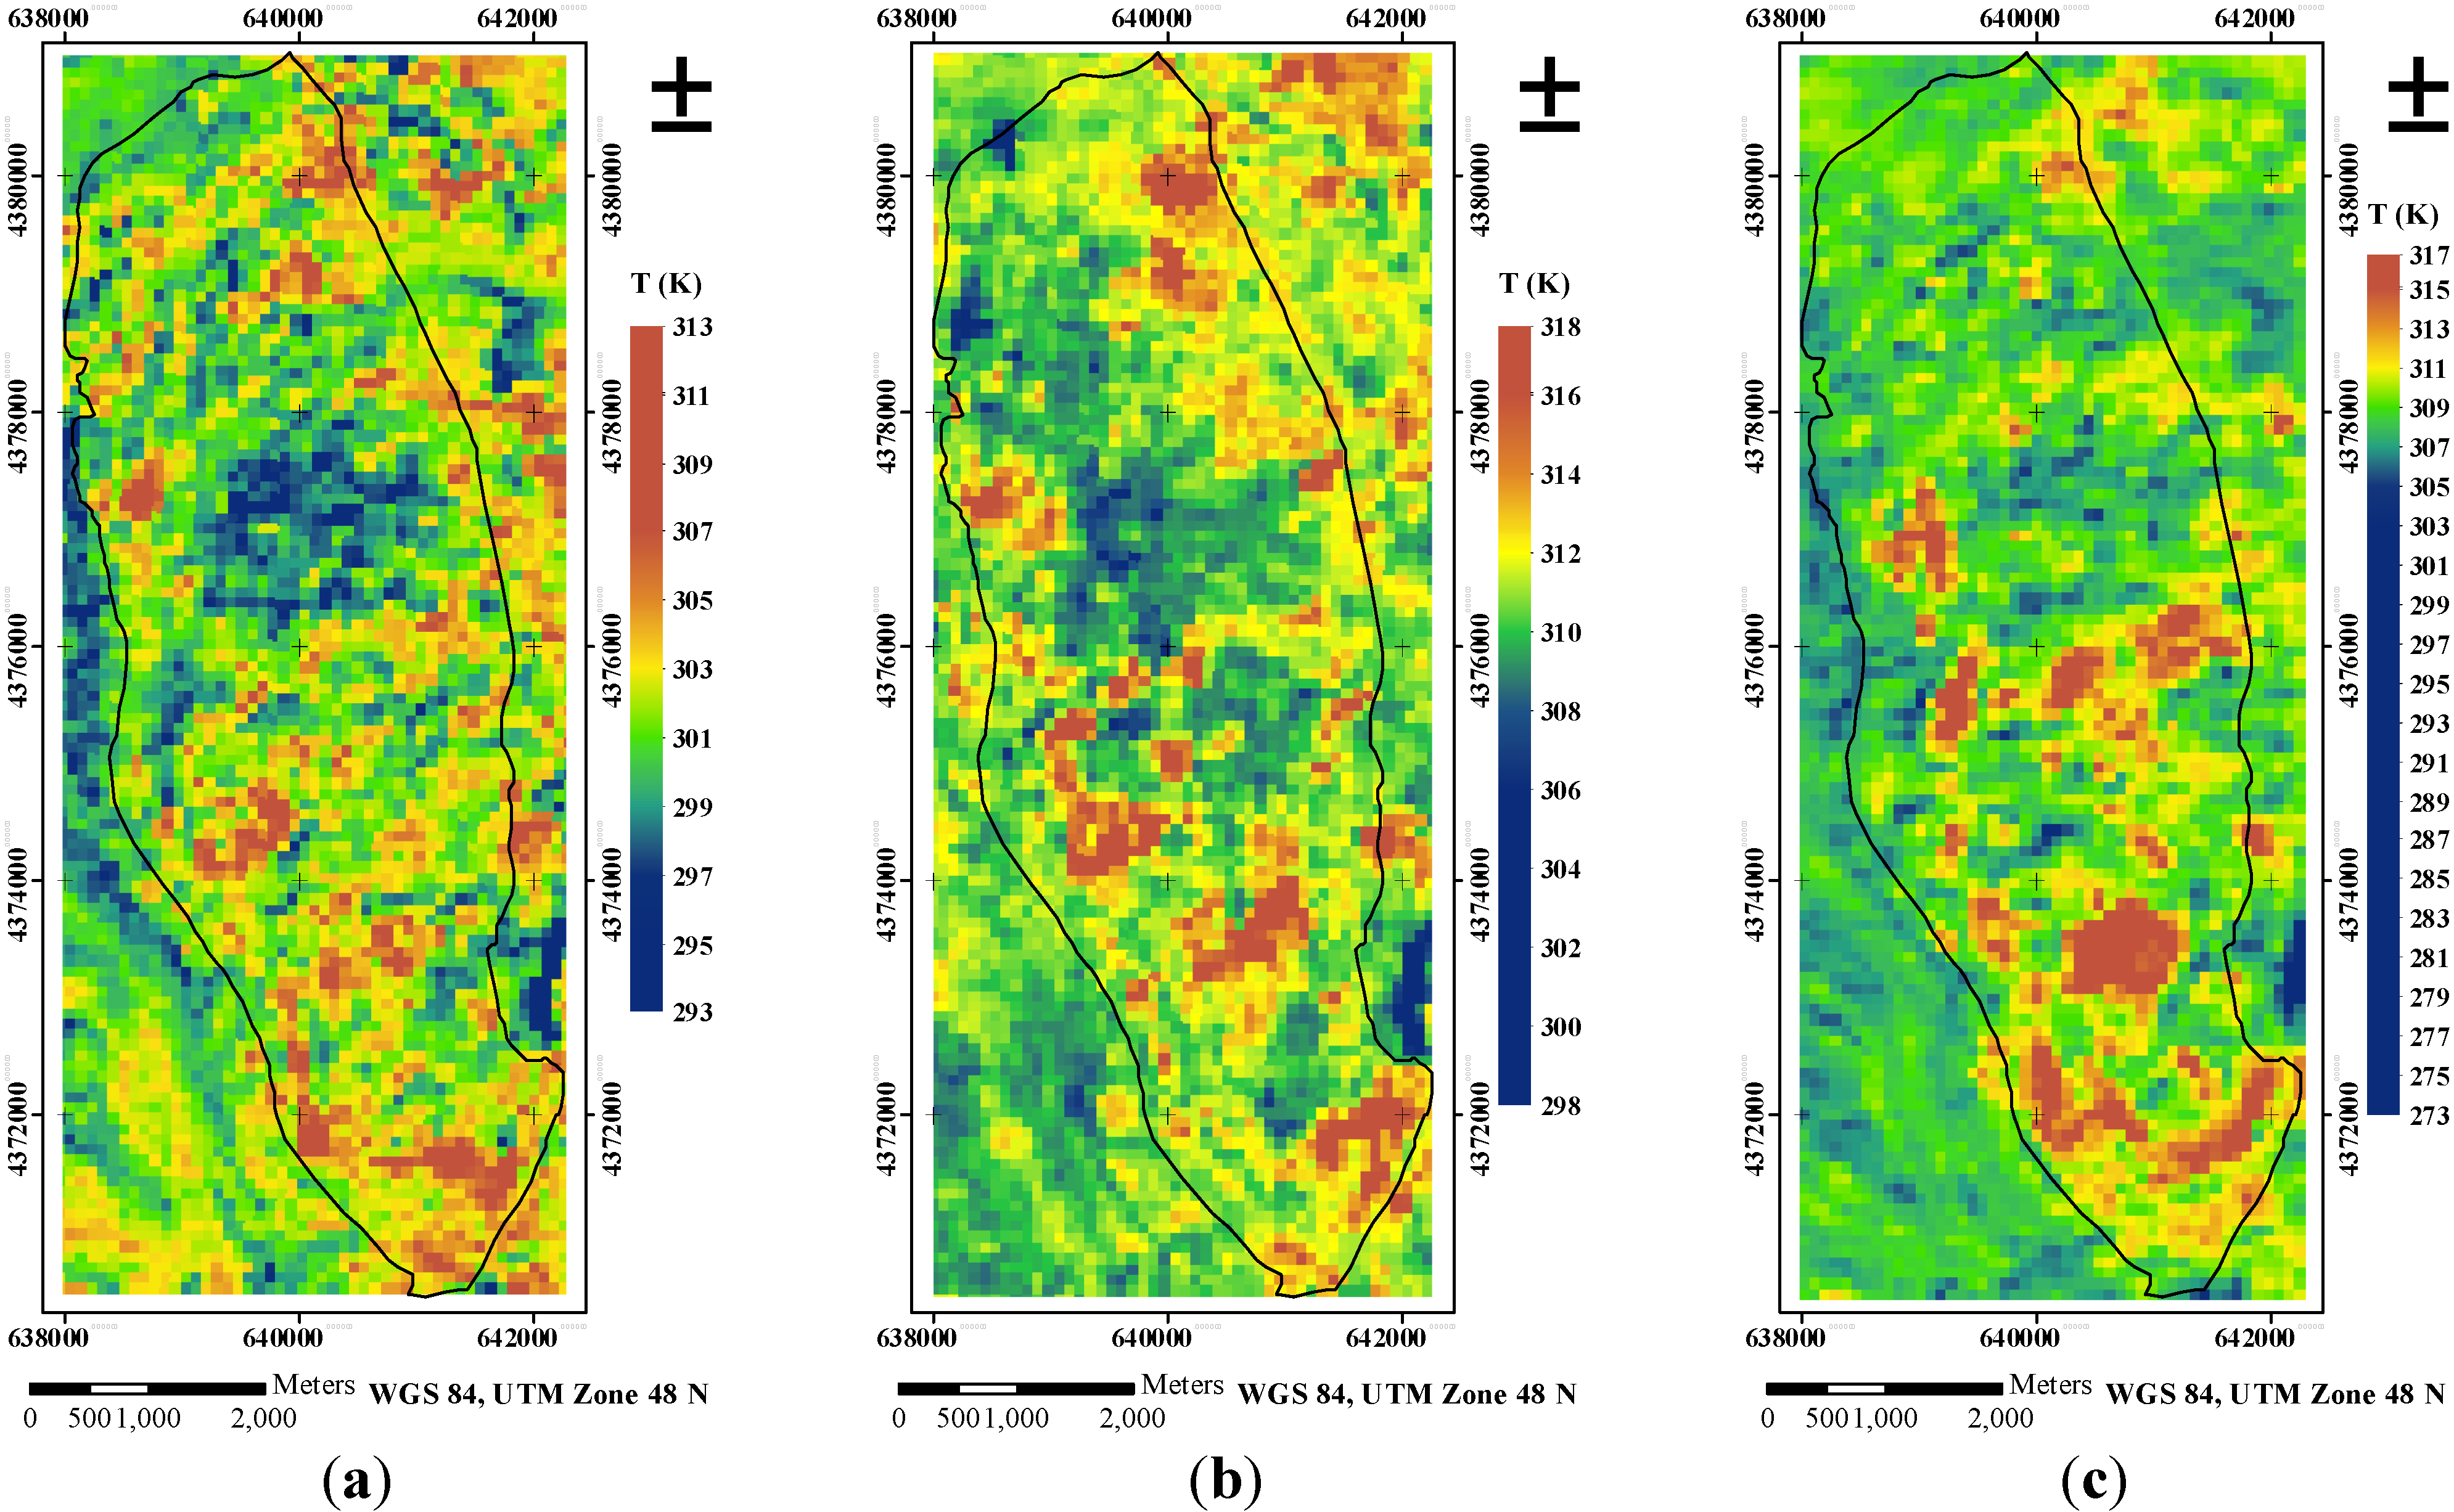
3.3. Reasons for Gradient-Based Thresholding: Seasonal and Diurnal Variations in the Thermal Distribution


3.4. Thermal Anomalies and the Definition of Coal Fire Areas
4. Algorithm of SAGBT
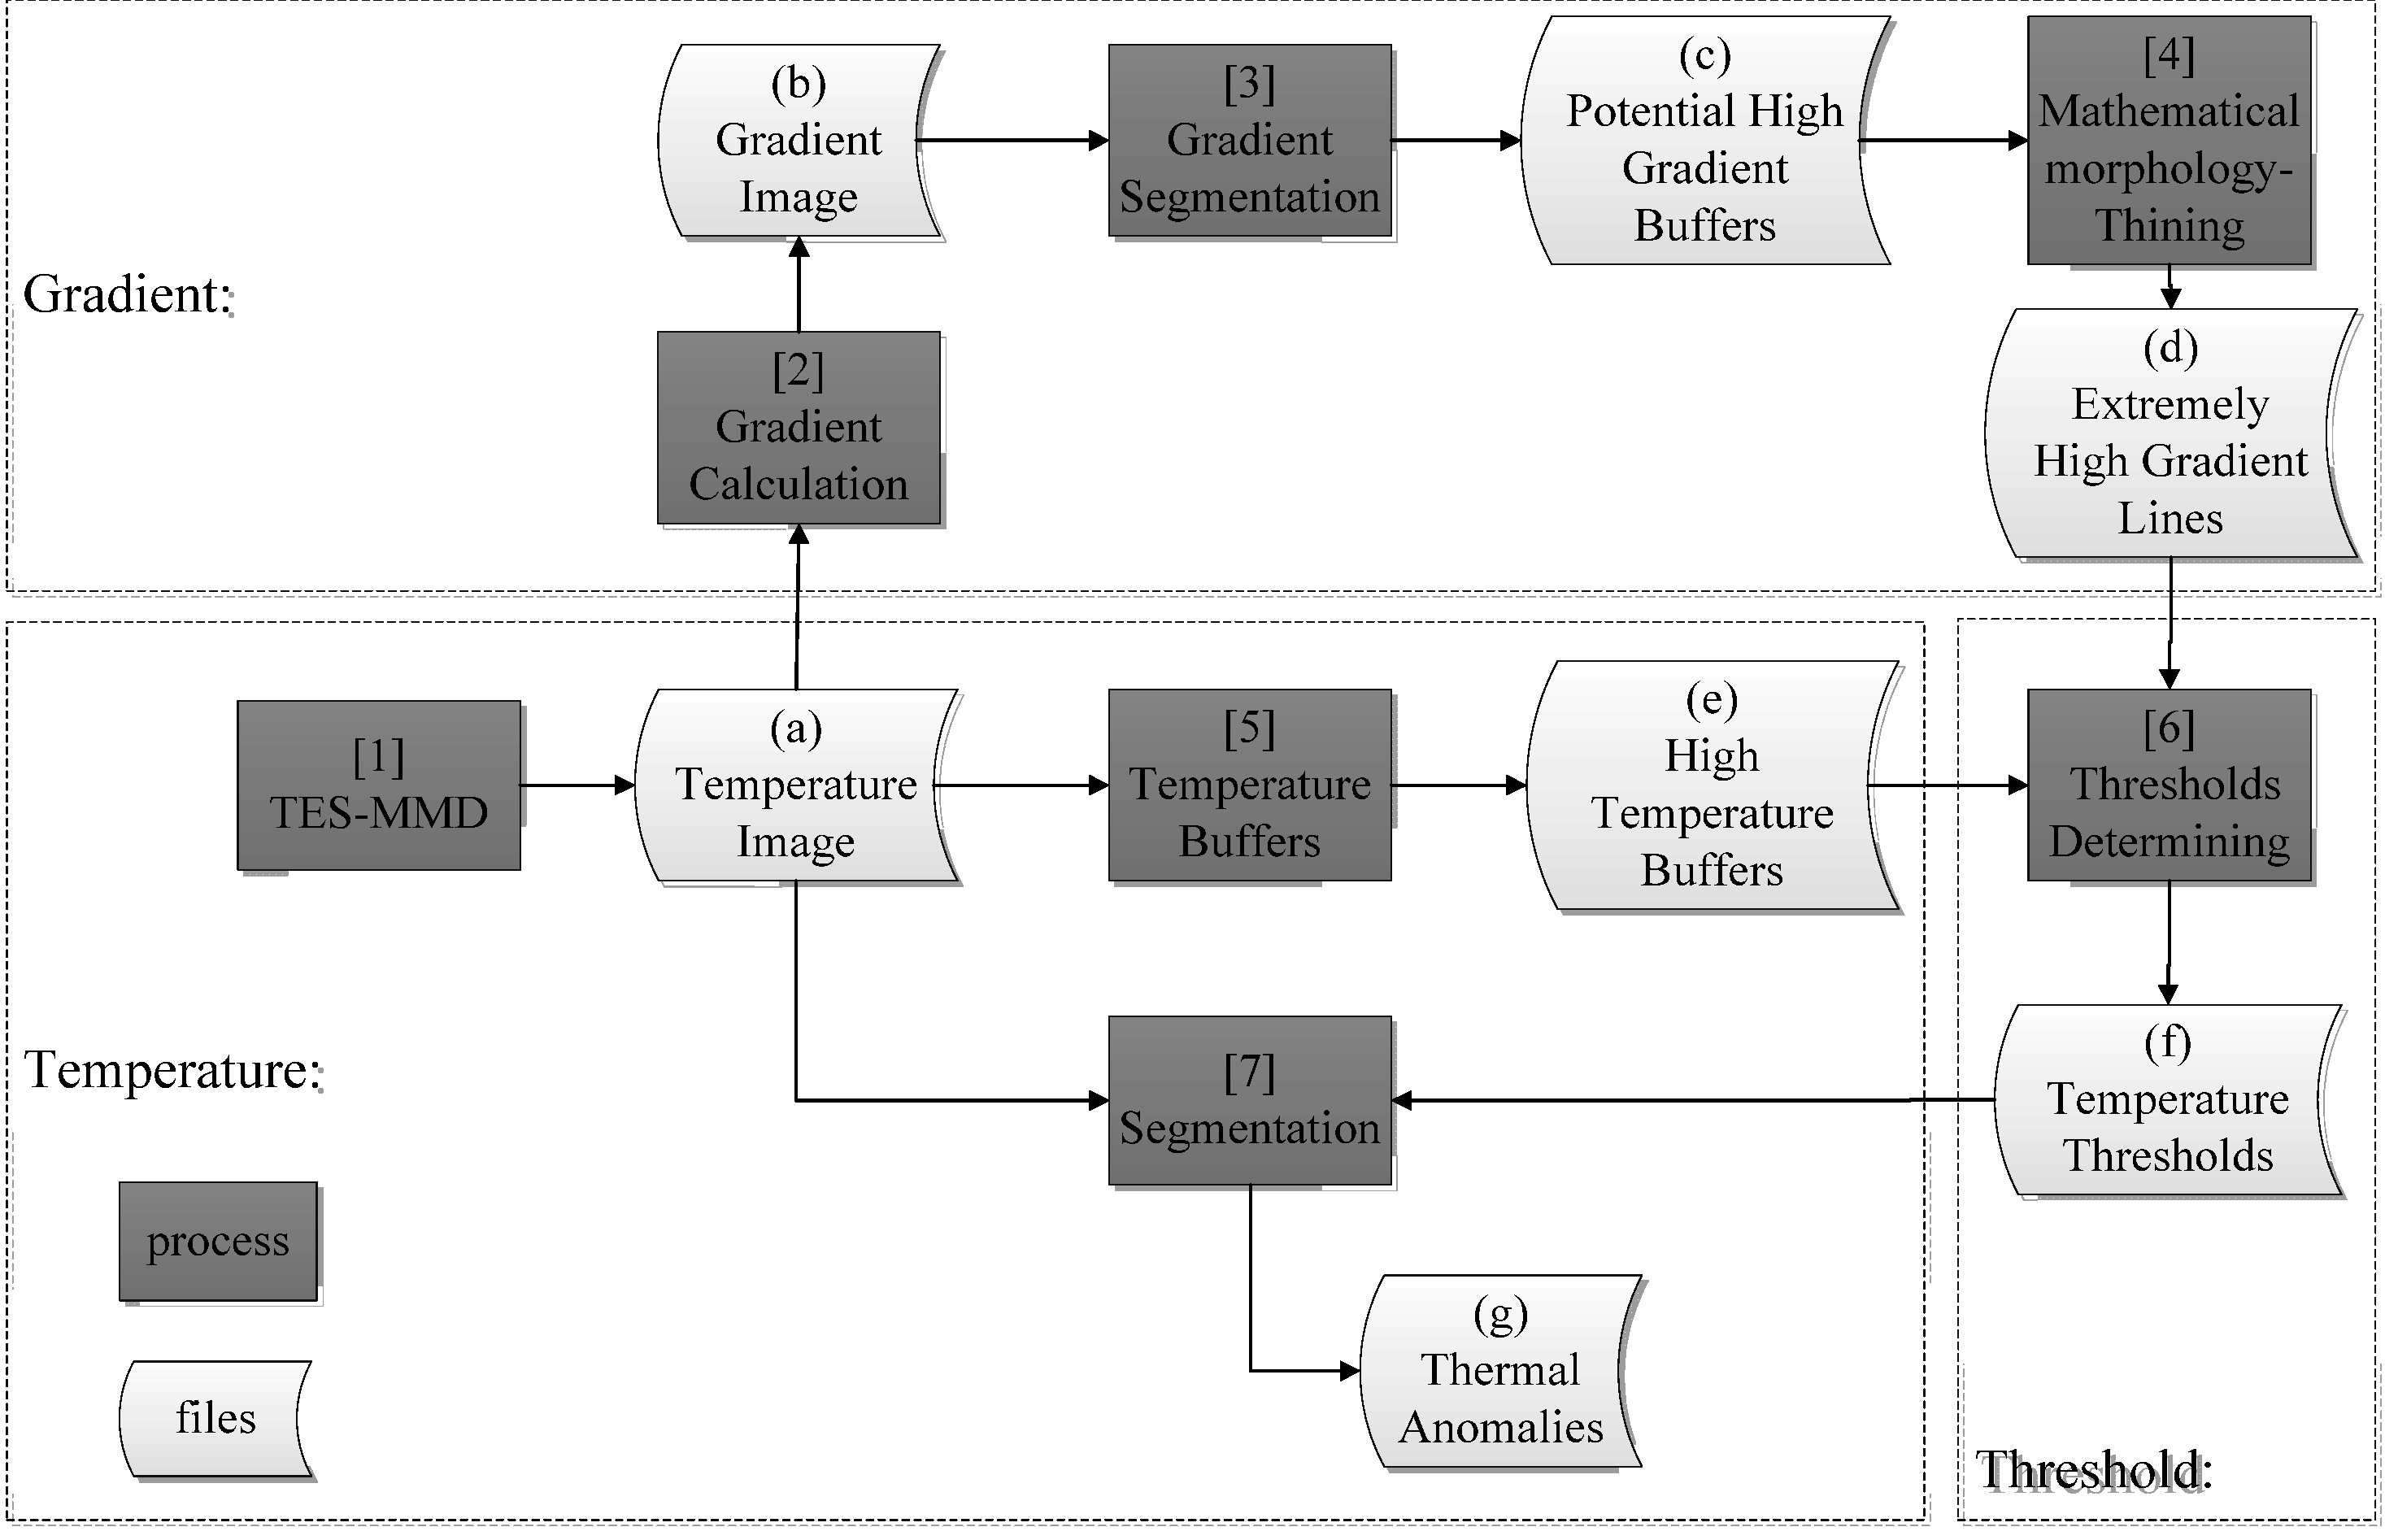
4.1. The Workflow of SAGBT

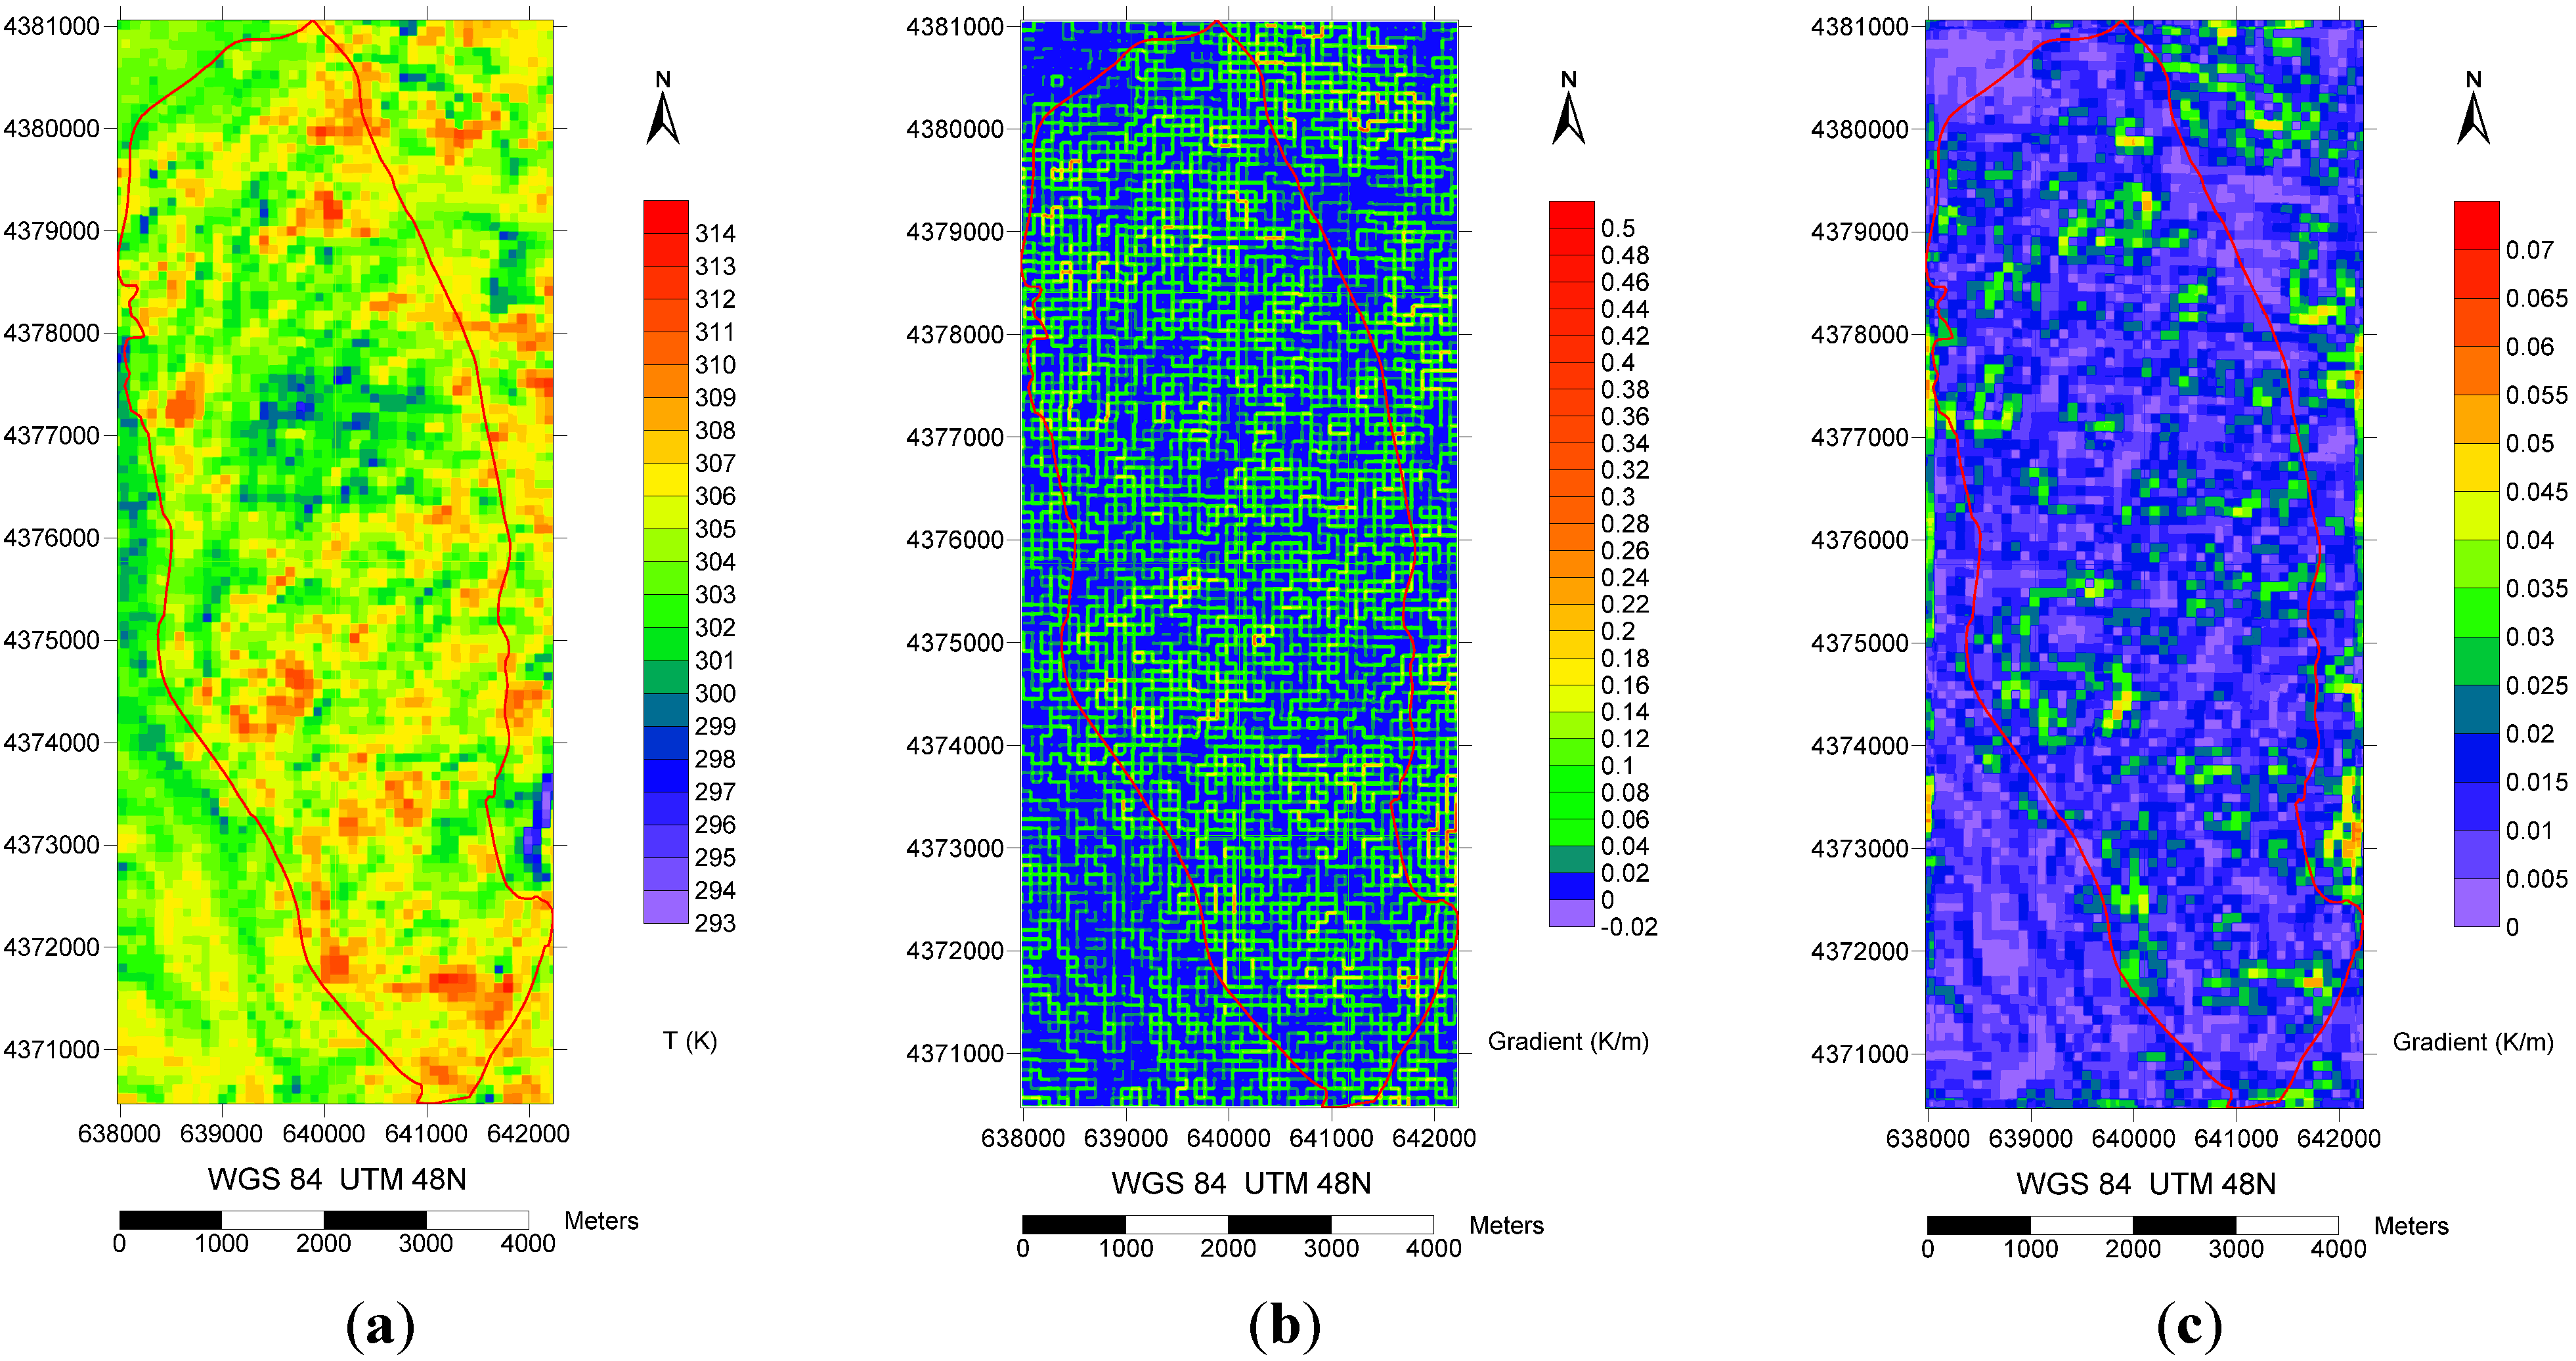
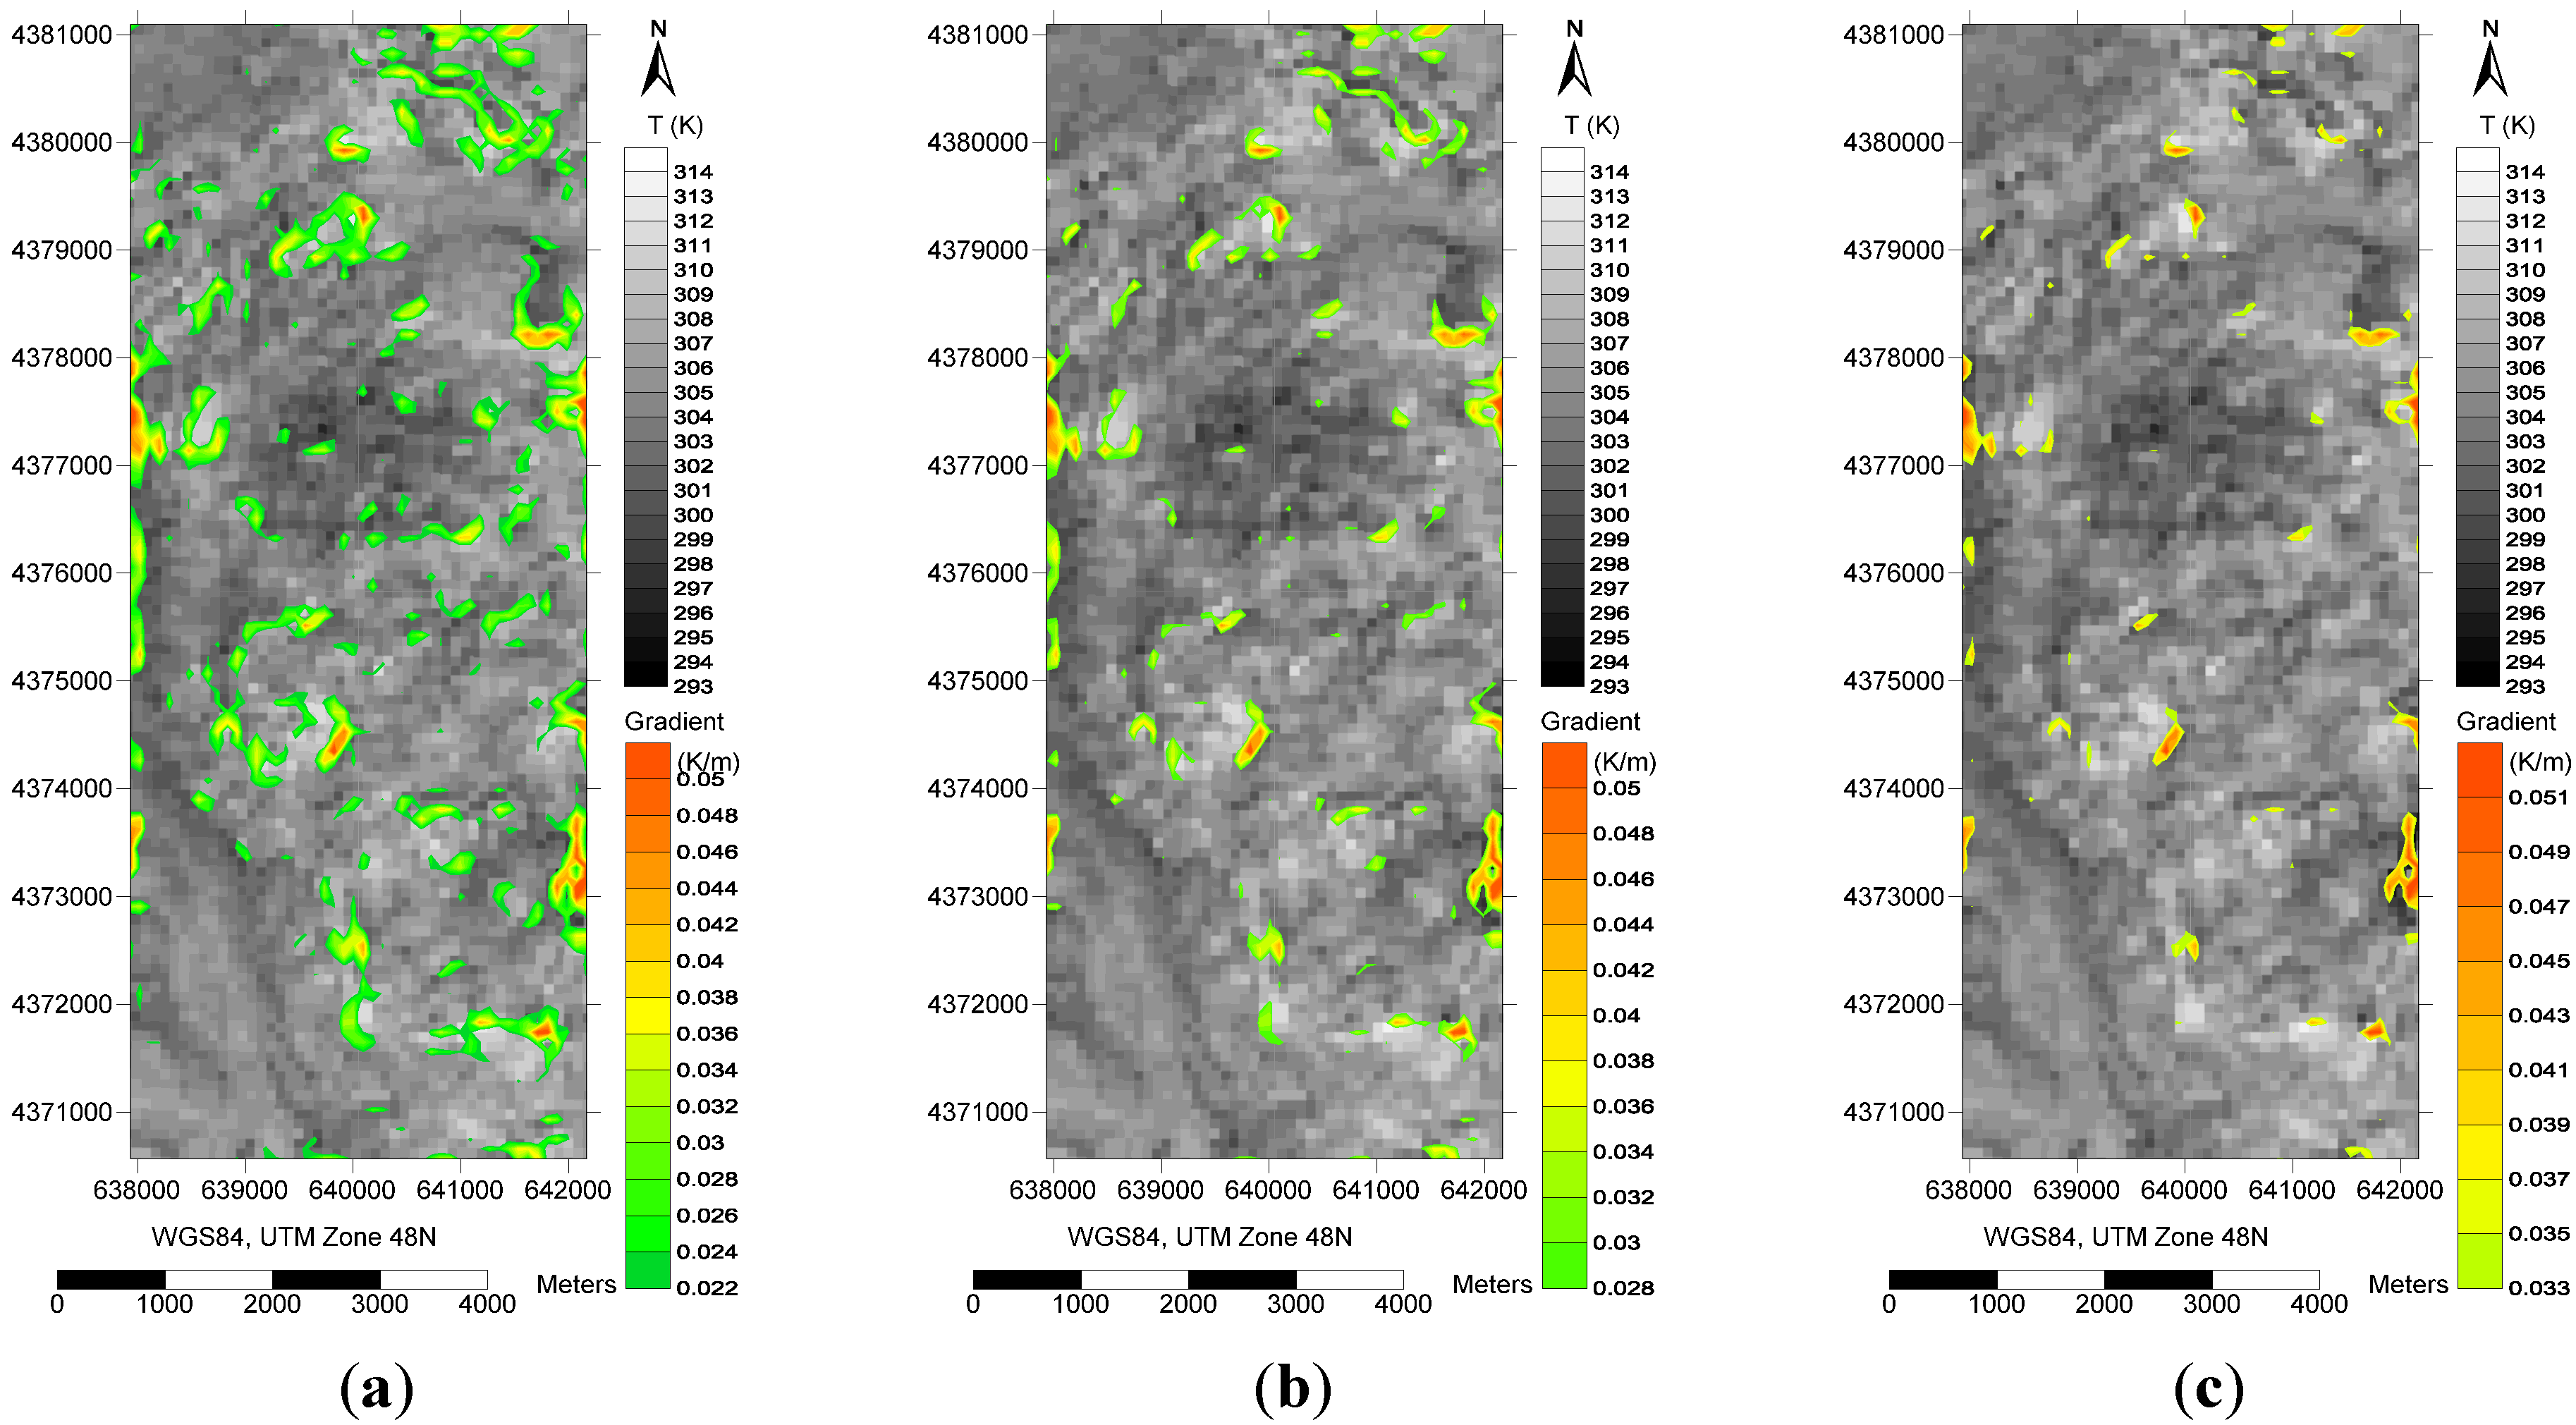
4.2. Gradient Calculation
4.3. Potential High Gradient Buffers
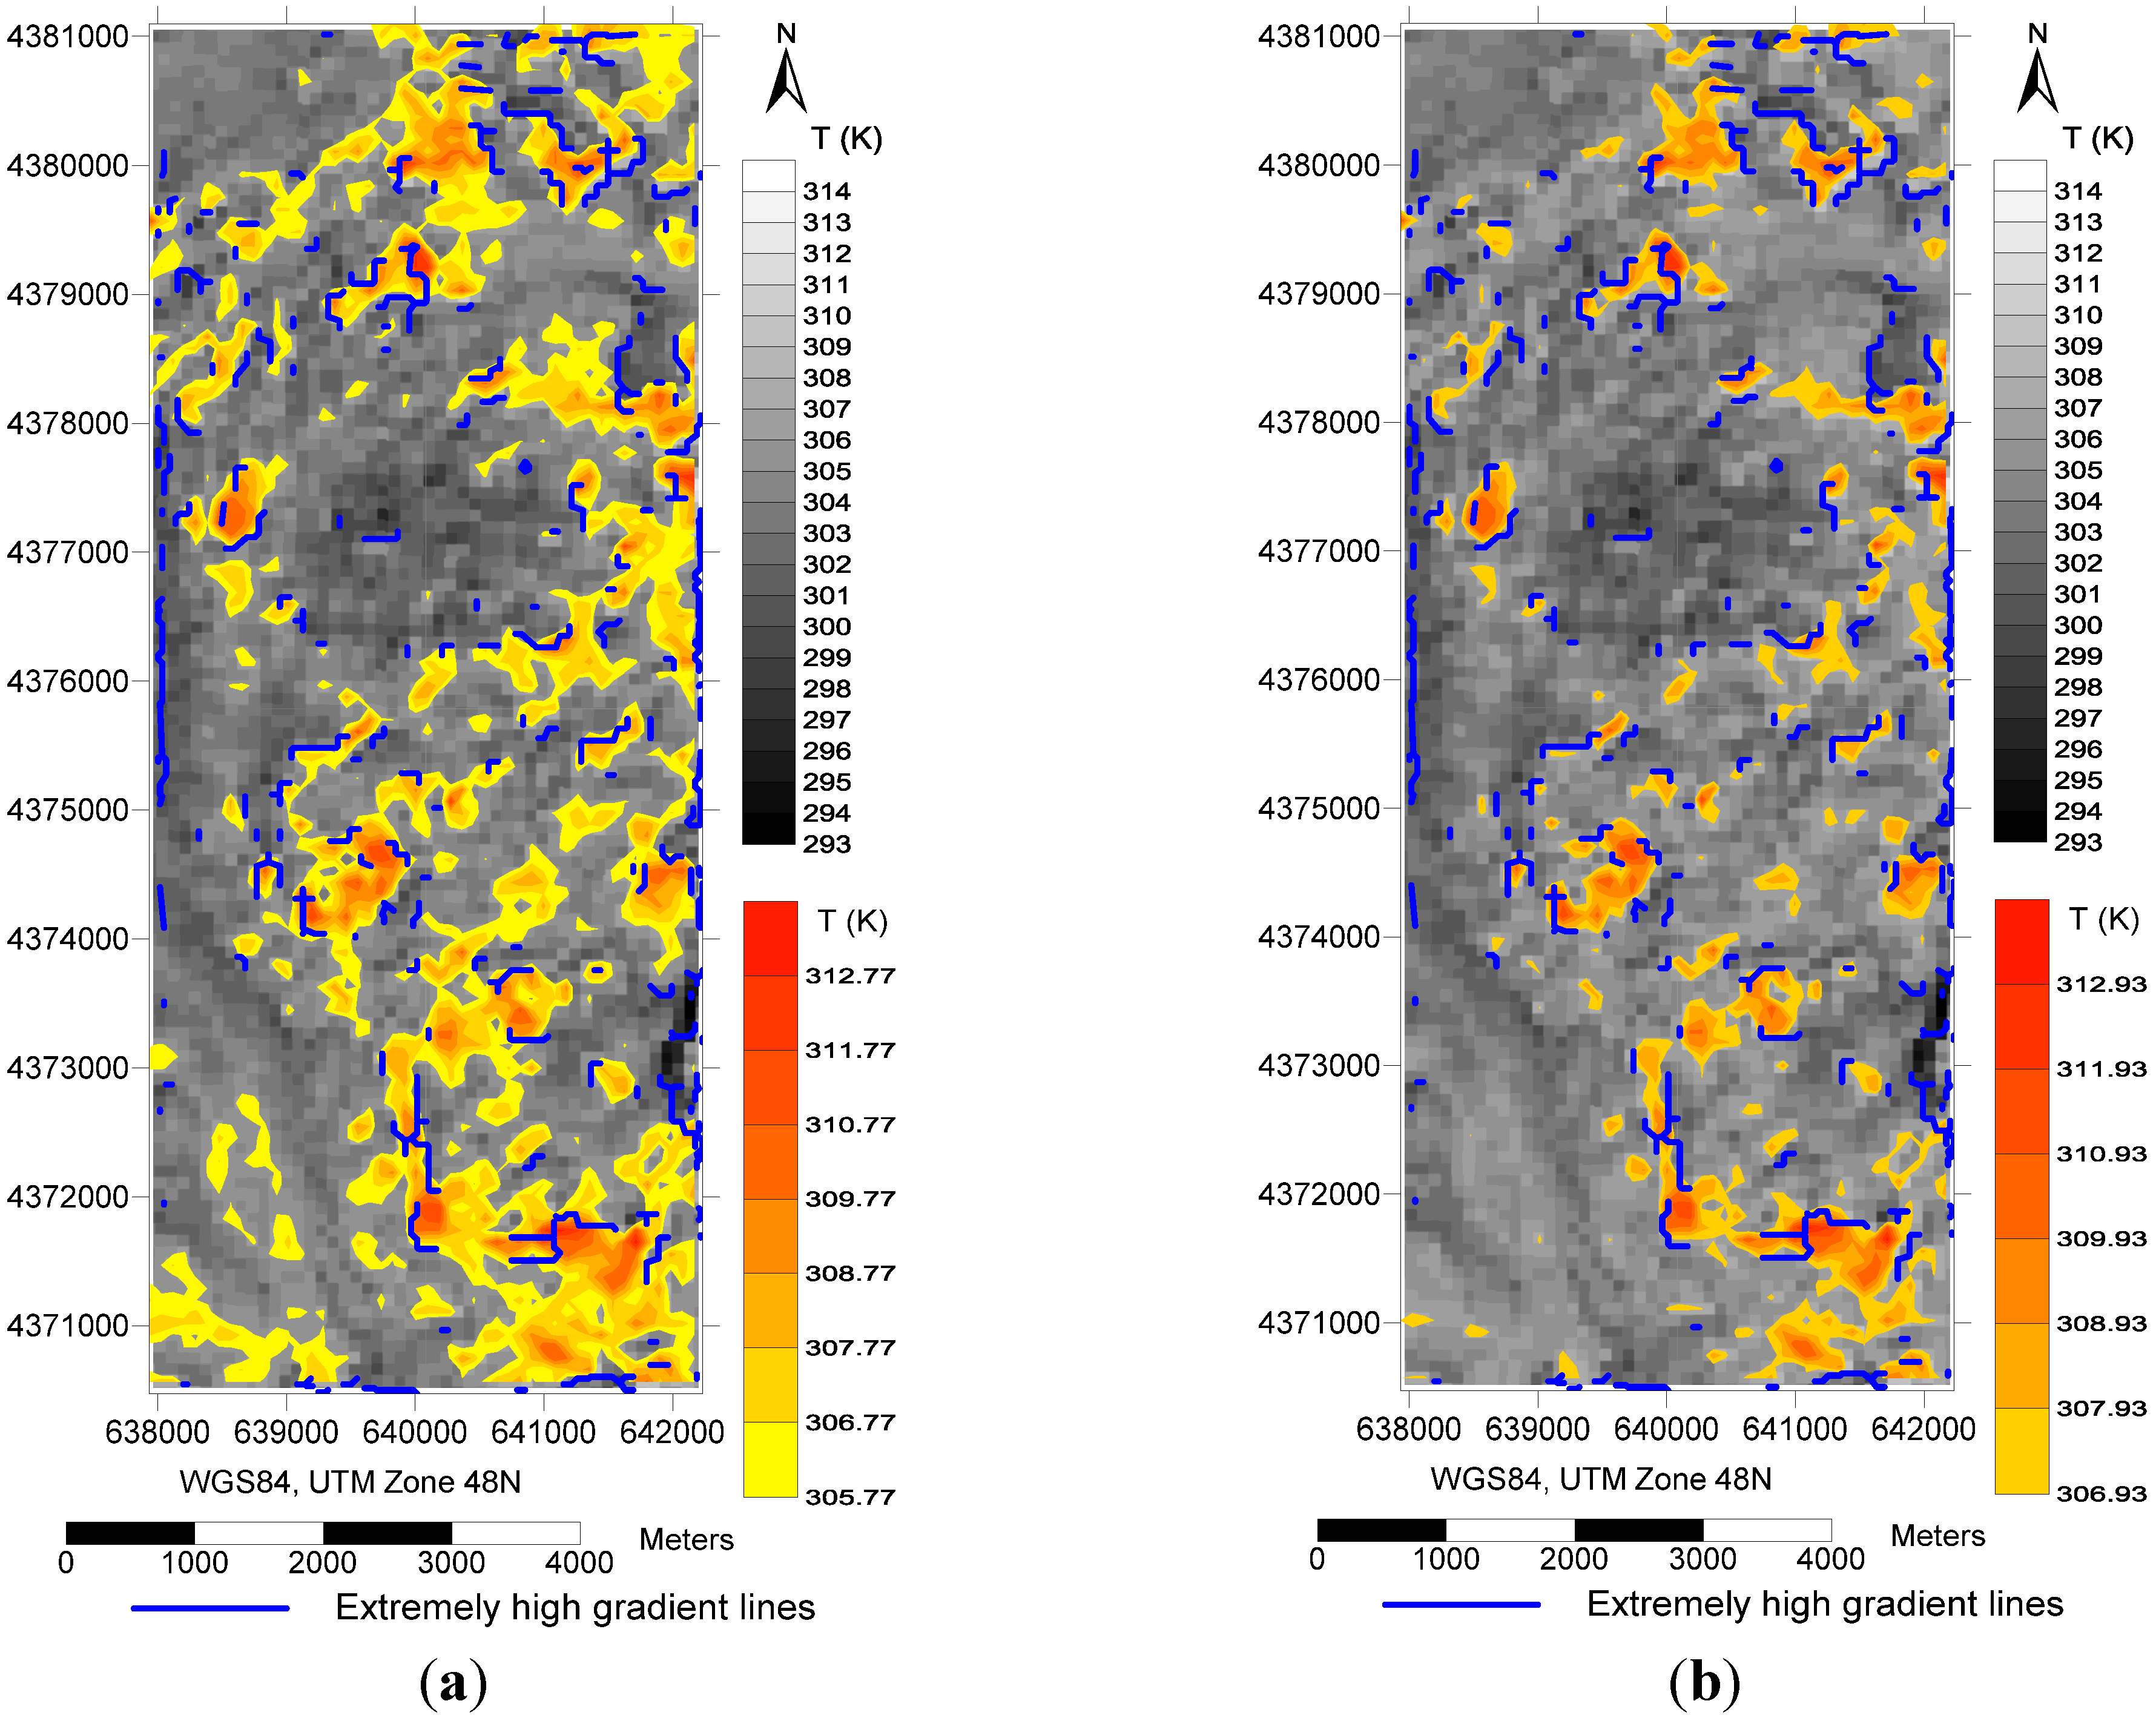
4.4. High Temperature Buffers
| No. | Date Time of Acquisition | Day/Night | MEAN T (K) | STDEV, σ | Mean + 0.5 σ | Mean + 1.0 σ | Mean + 1.6 σ | Mean + 2.0 σ |
|---|---|---|---|---|---|---|---|---|
| 1 | 2013/03/27 03 | Day | 304.61 | 2.31 | 305.77 | 306.93 | 308.32 | 309.25 |
| 2 | 2013/03/27 14 | Night | 278.06 | 1.90 | 279.01 | 279.96 | 281.09 | 281.85 |
| 3 | 2013/04/12 14 | Night | 283.92 | 1.95 | 284.90 | 285.87 | 287.04 | 287.82 |
| 4 | 2013/06/22 03 | Day | 304.68 | 1.91 | 305.63 | 306.59 | 307.73 | 308.50 |
| 5 | 2013/06/22 14 | Night | 293.62 | 1.39 | 294.32 | 295.01 | 295.84 | 296.40 |
| 6 | 2013/07/01 14 | Night | 292.35 | 1.51 | 293.10 | 293.86 | 294.76 | 295.36 |
| 7 | 2007/11/29 03 | Day | 280.18 | 2.46 | 281.41 | 282.64 | 284.12 | 285.10 |
| 8 | 2007/11/29 14 | Night | 269.04 | 3.69 | 270.88 | 272.73 | 274.94 | 276.41 |
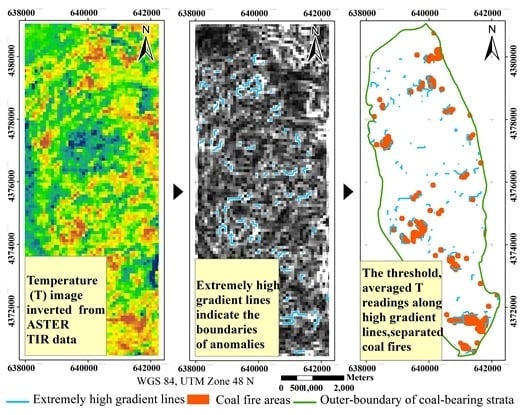
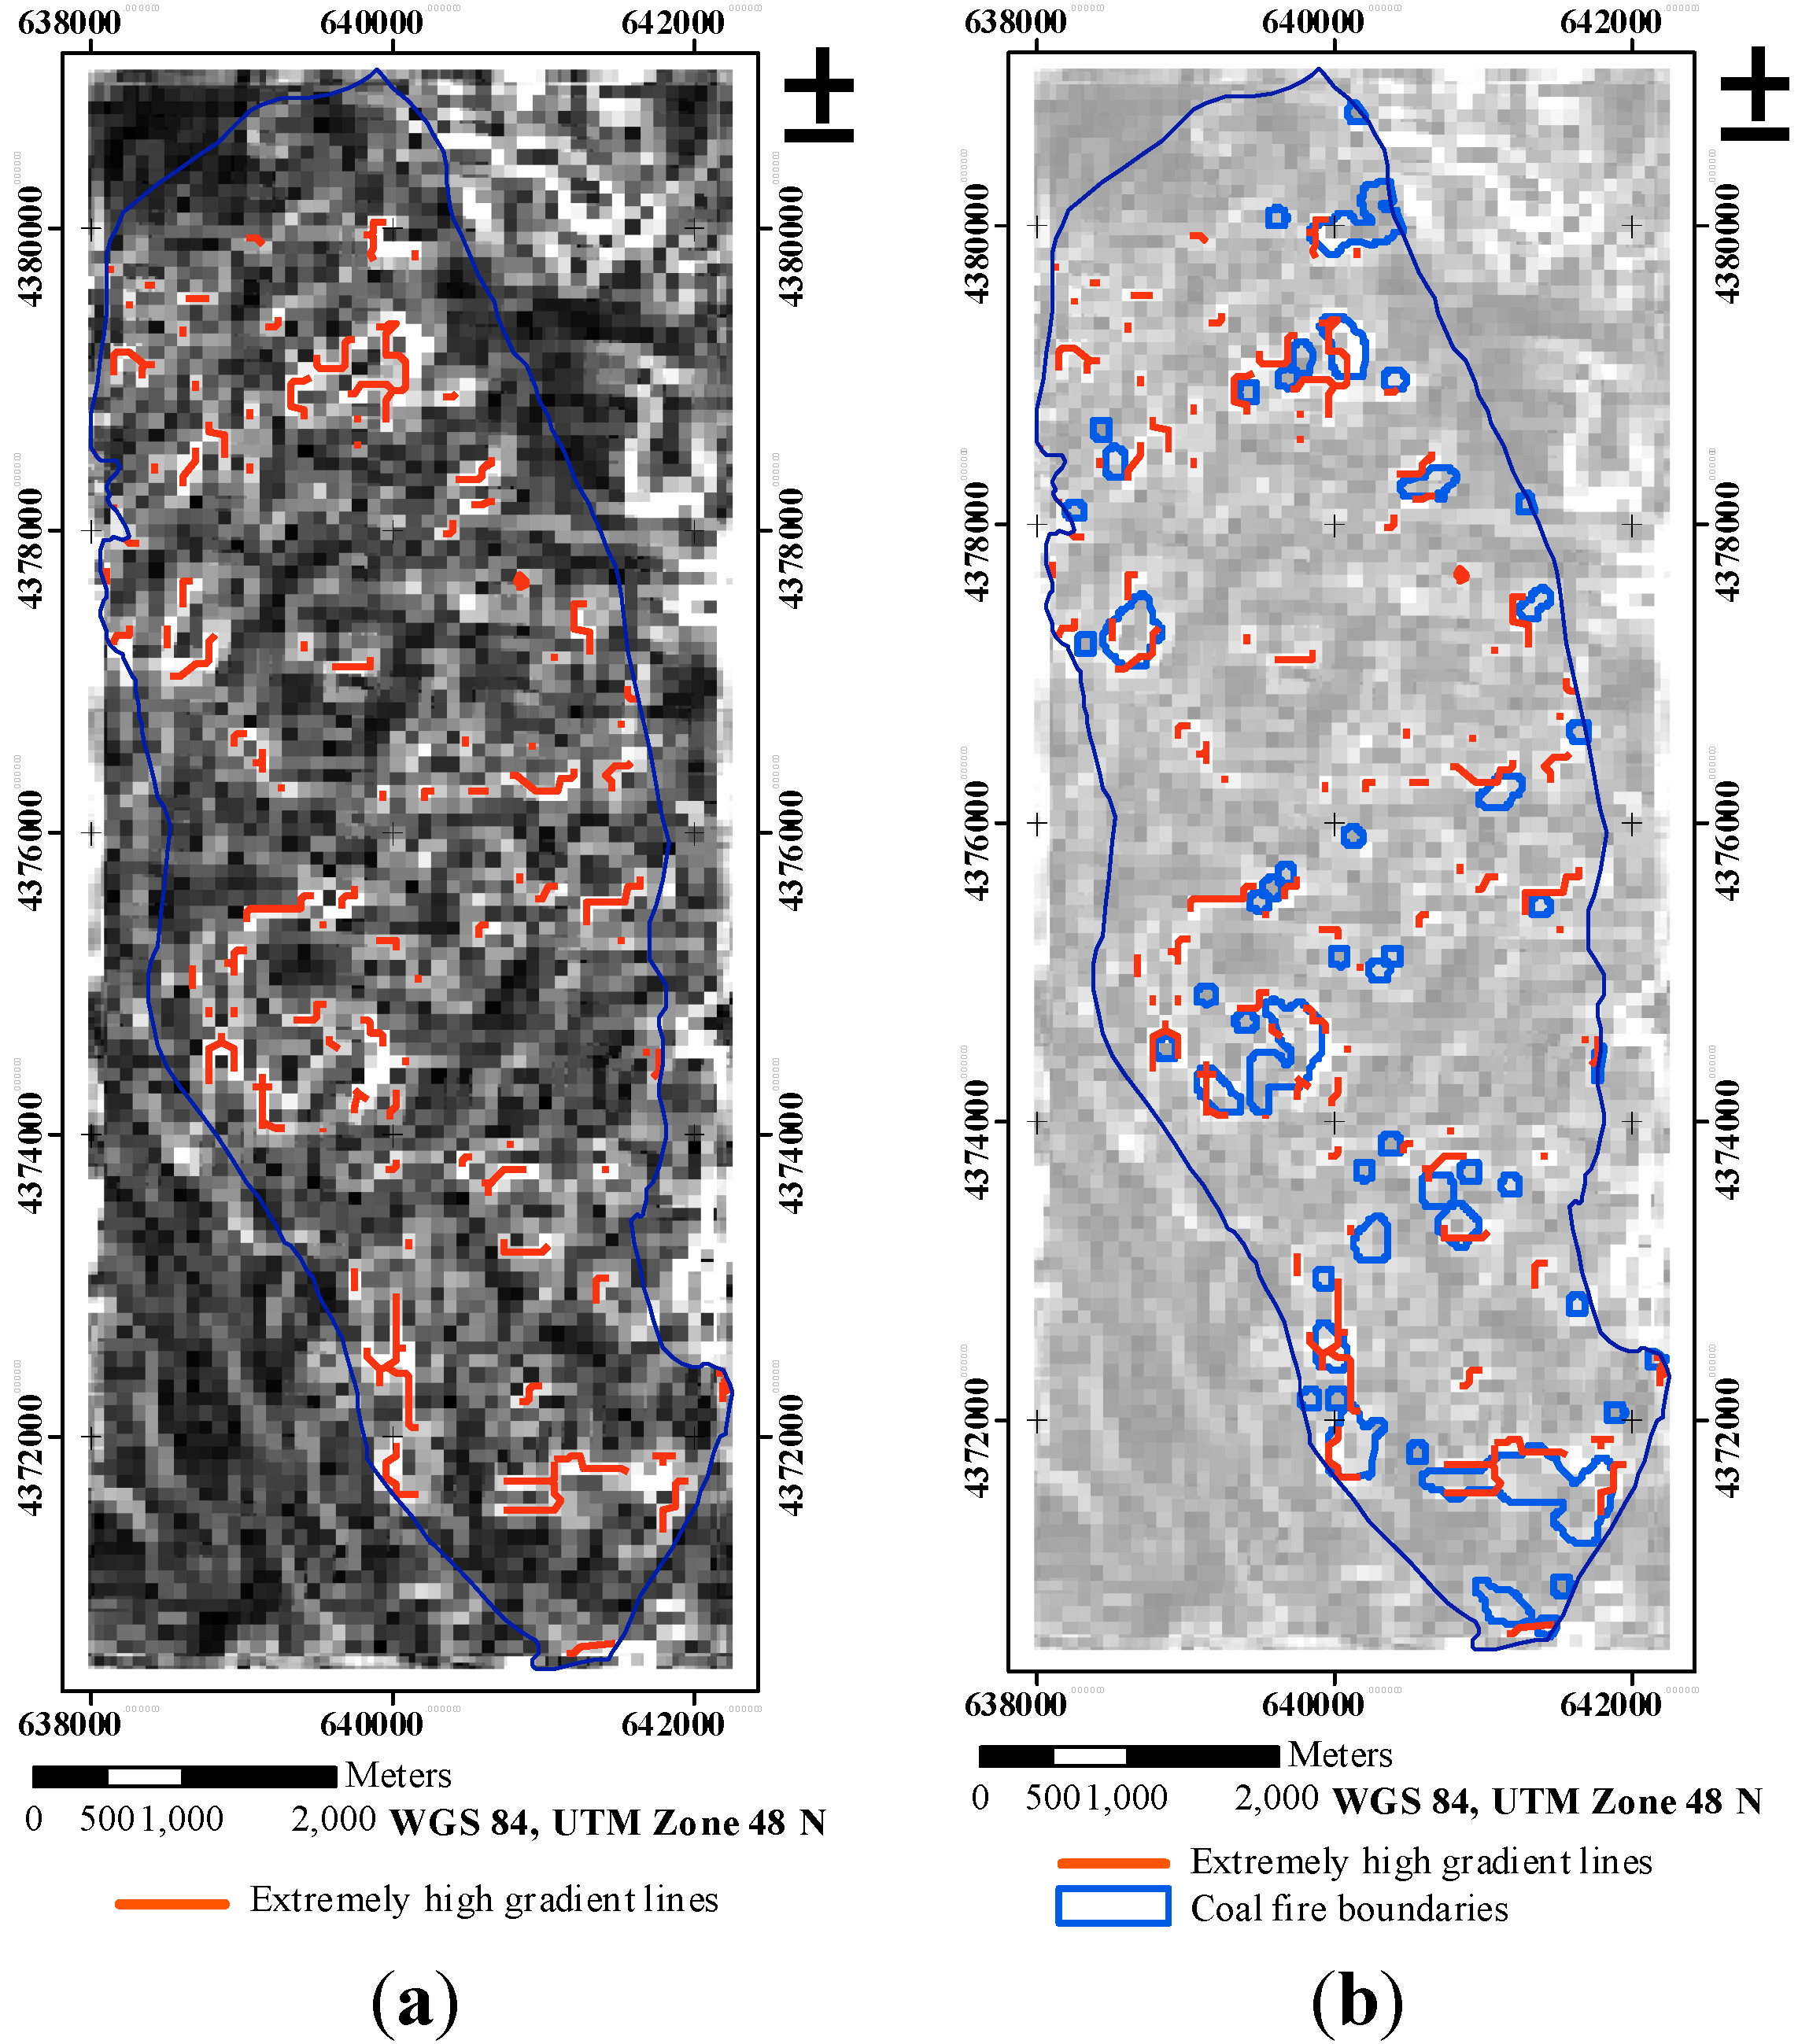
4.5. Mathematical Morphology Thinning and Extremely High Gradient Lines

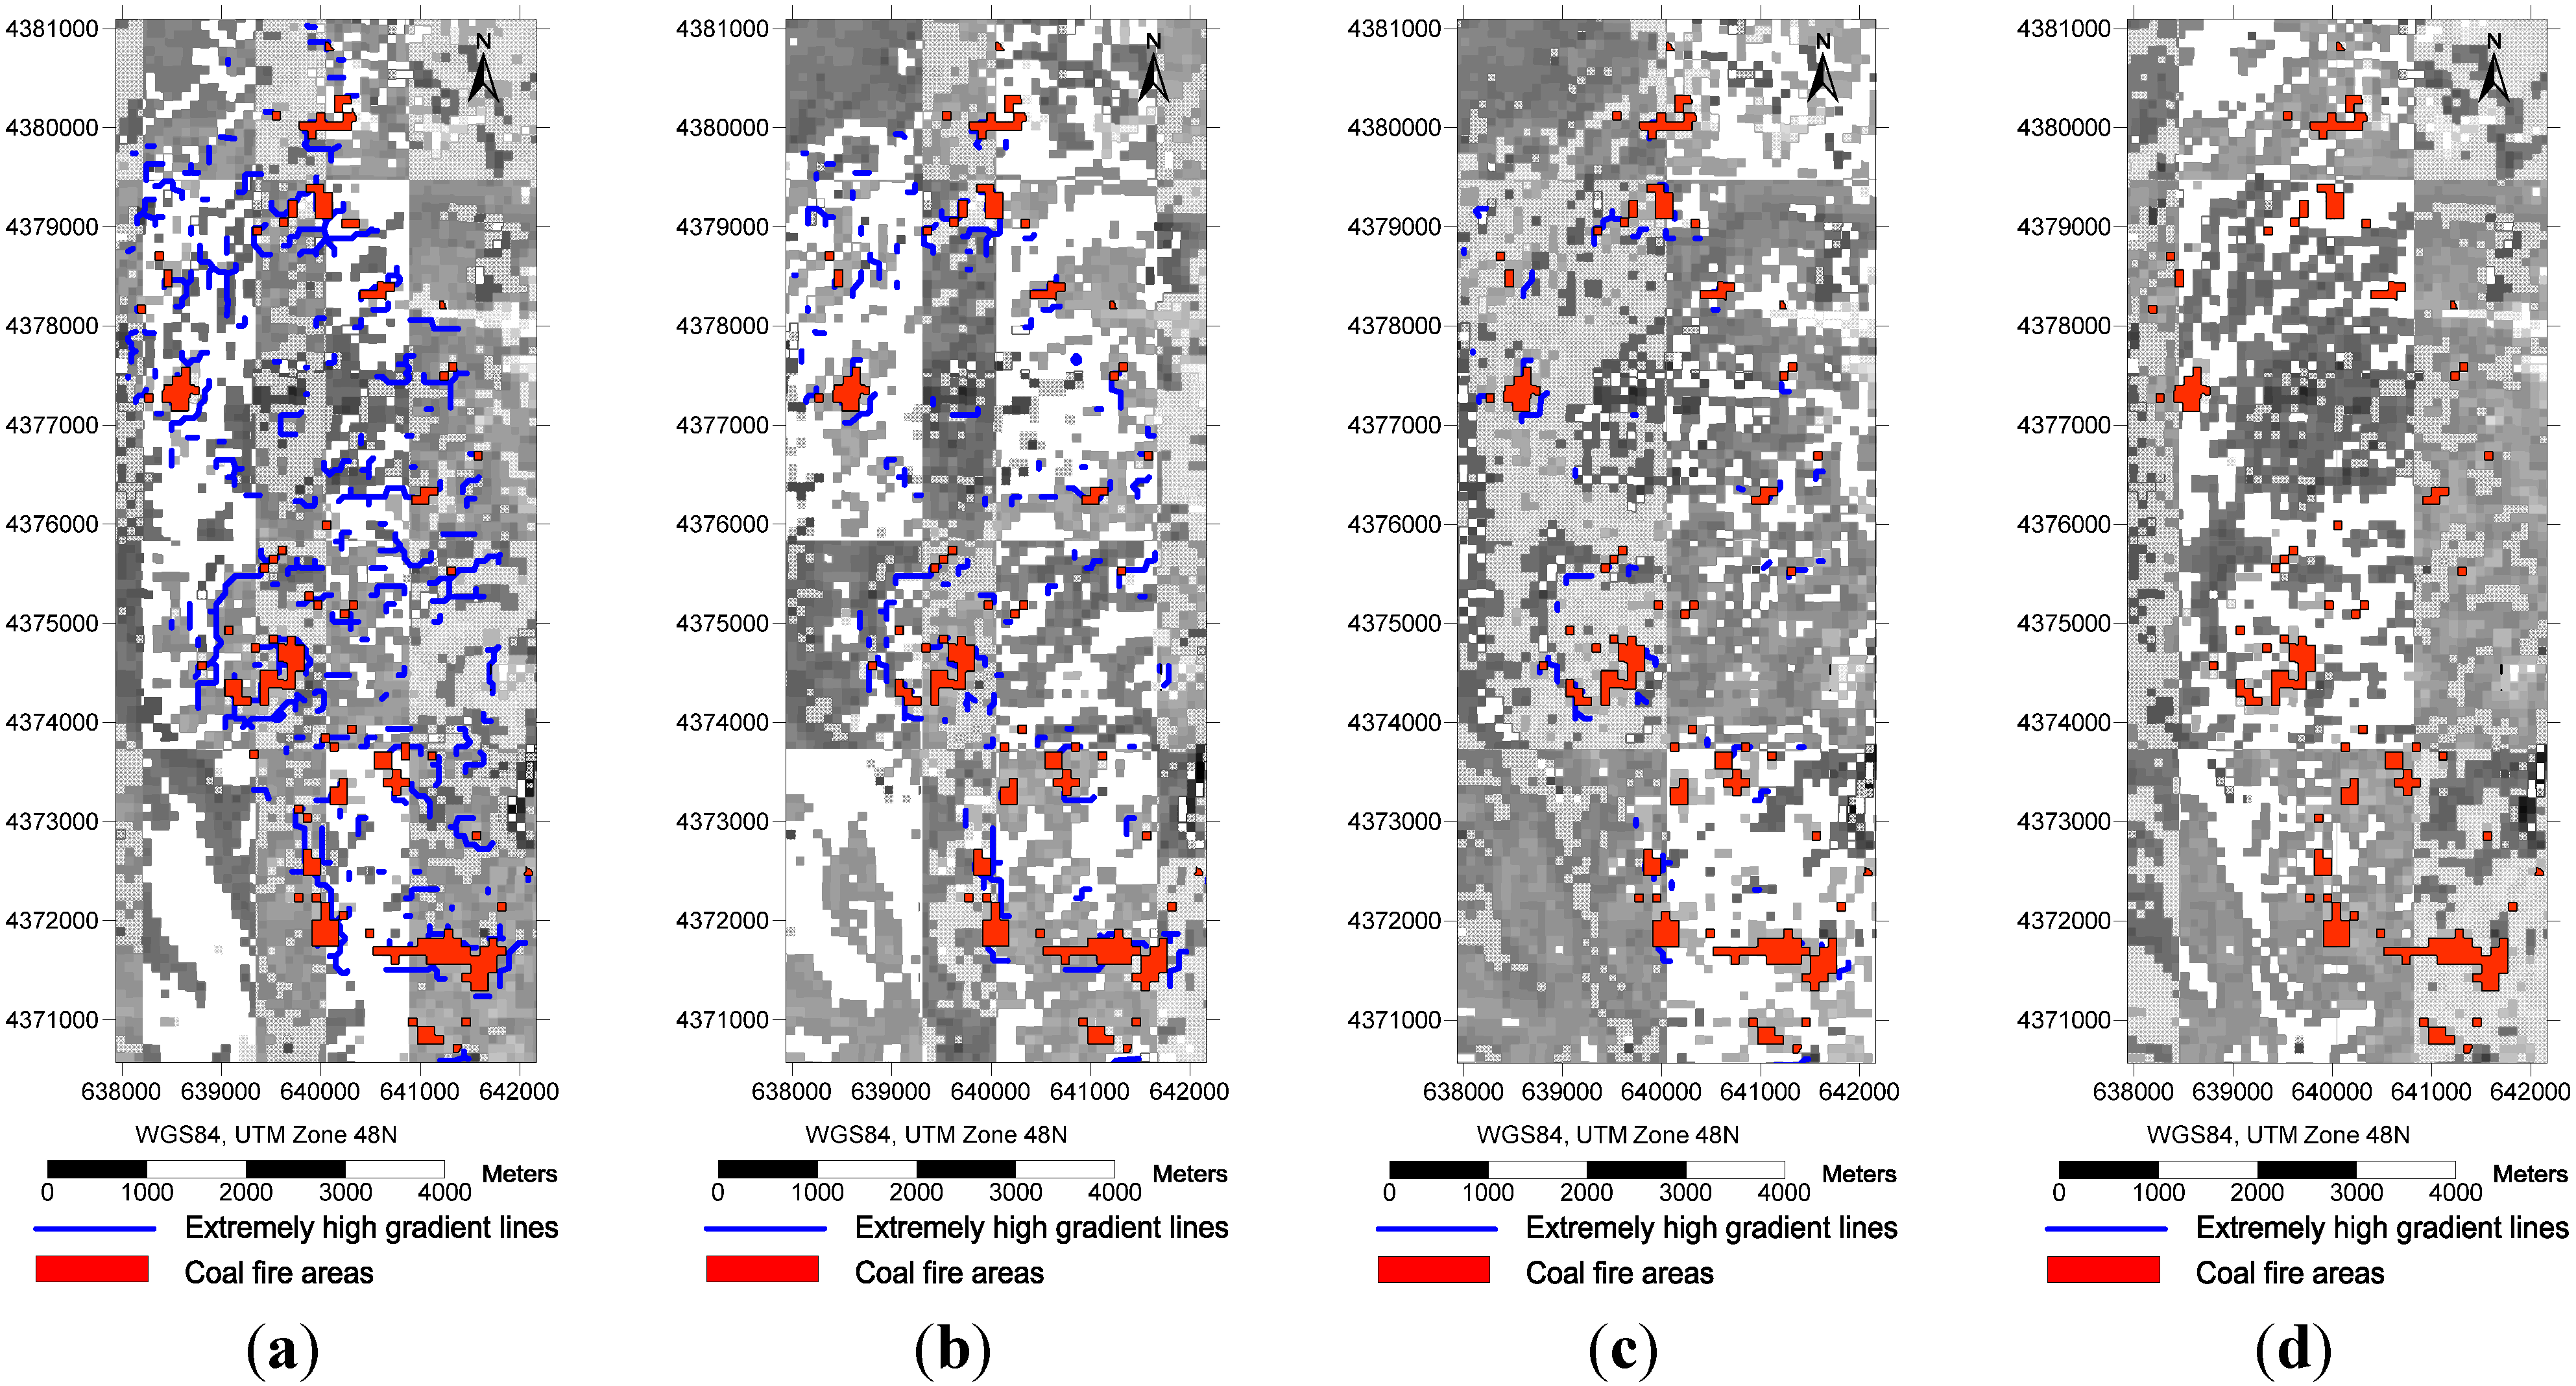
4.6. Fine-Tuning Threshold and Thermal Anomalies
5. Performance of SAGBT
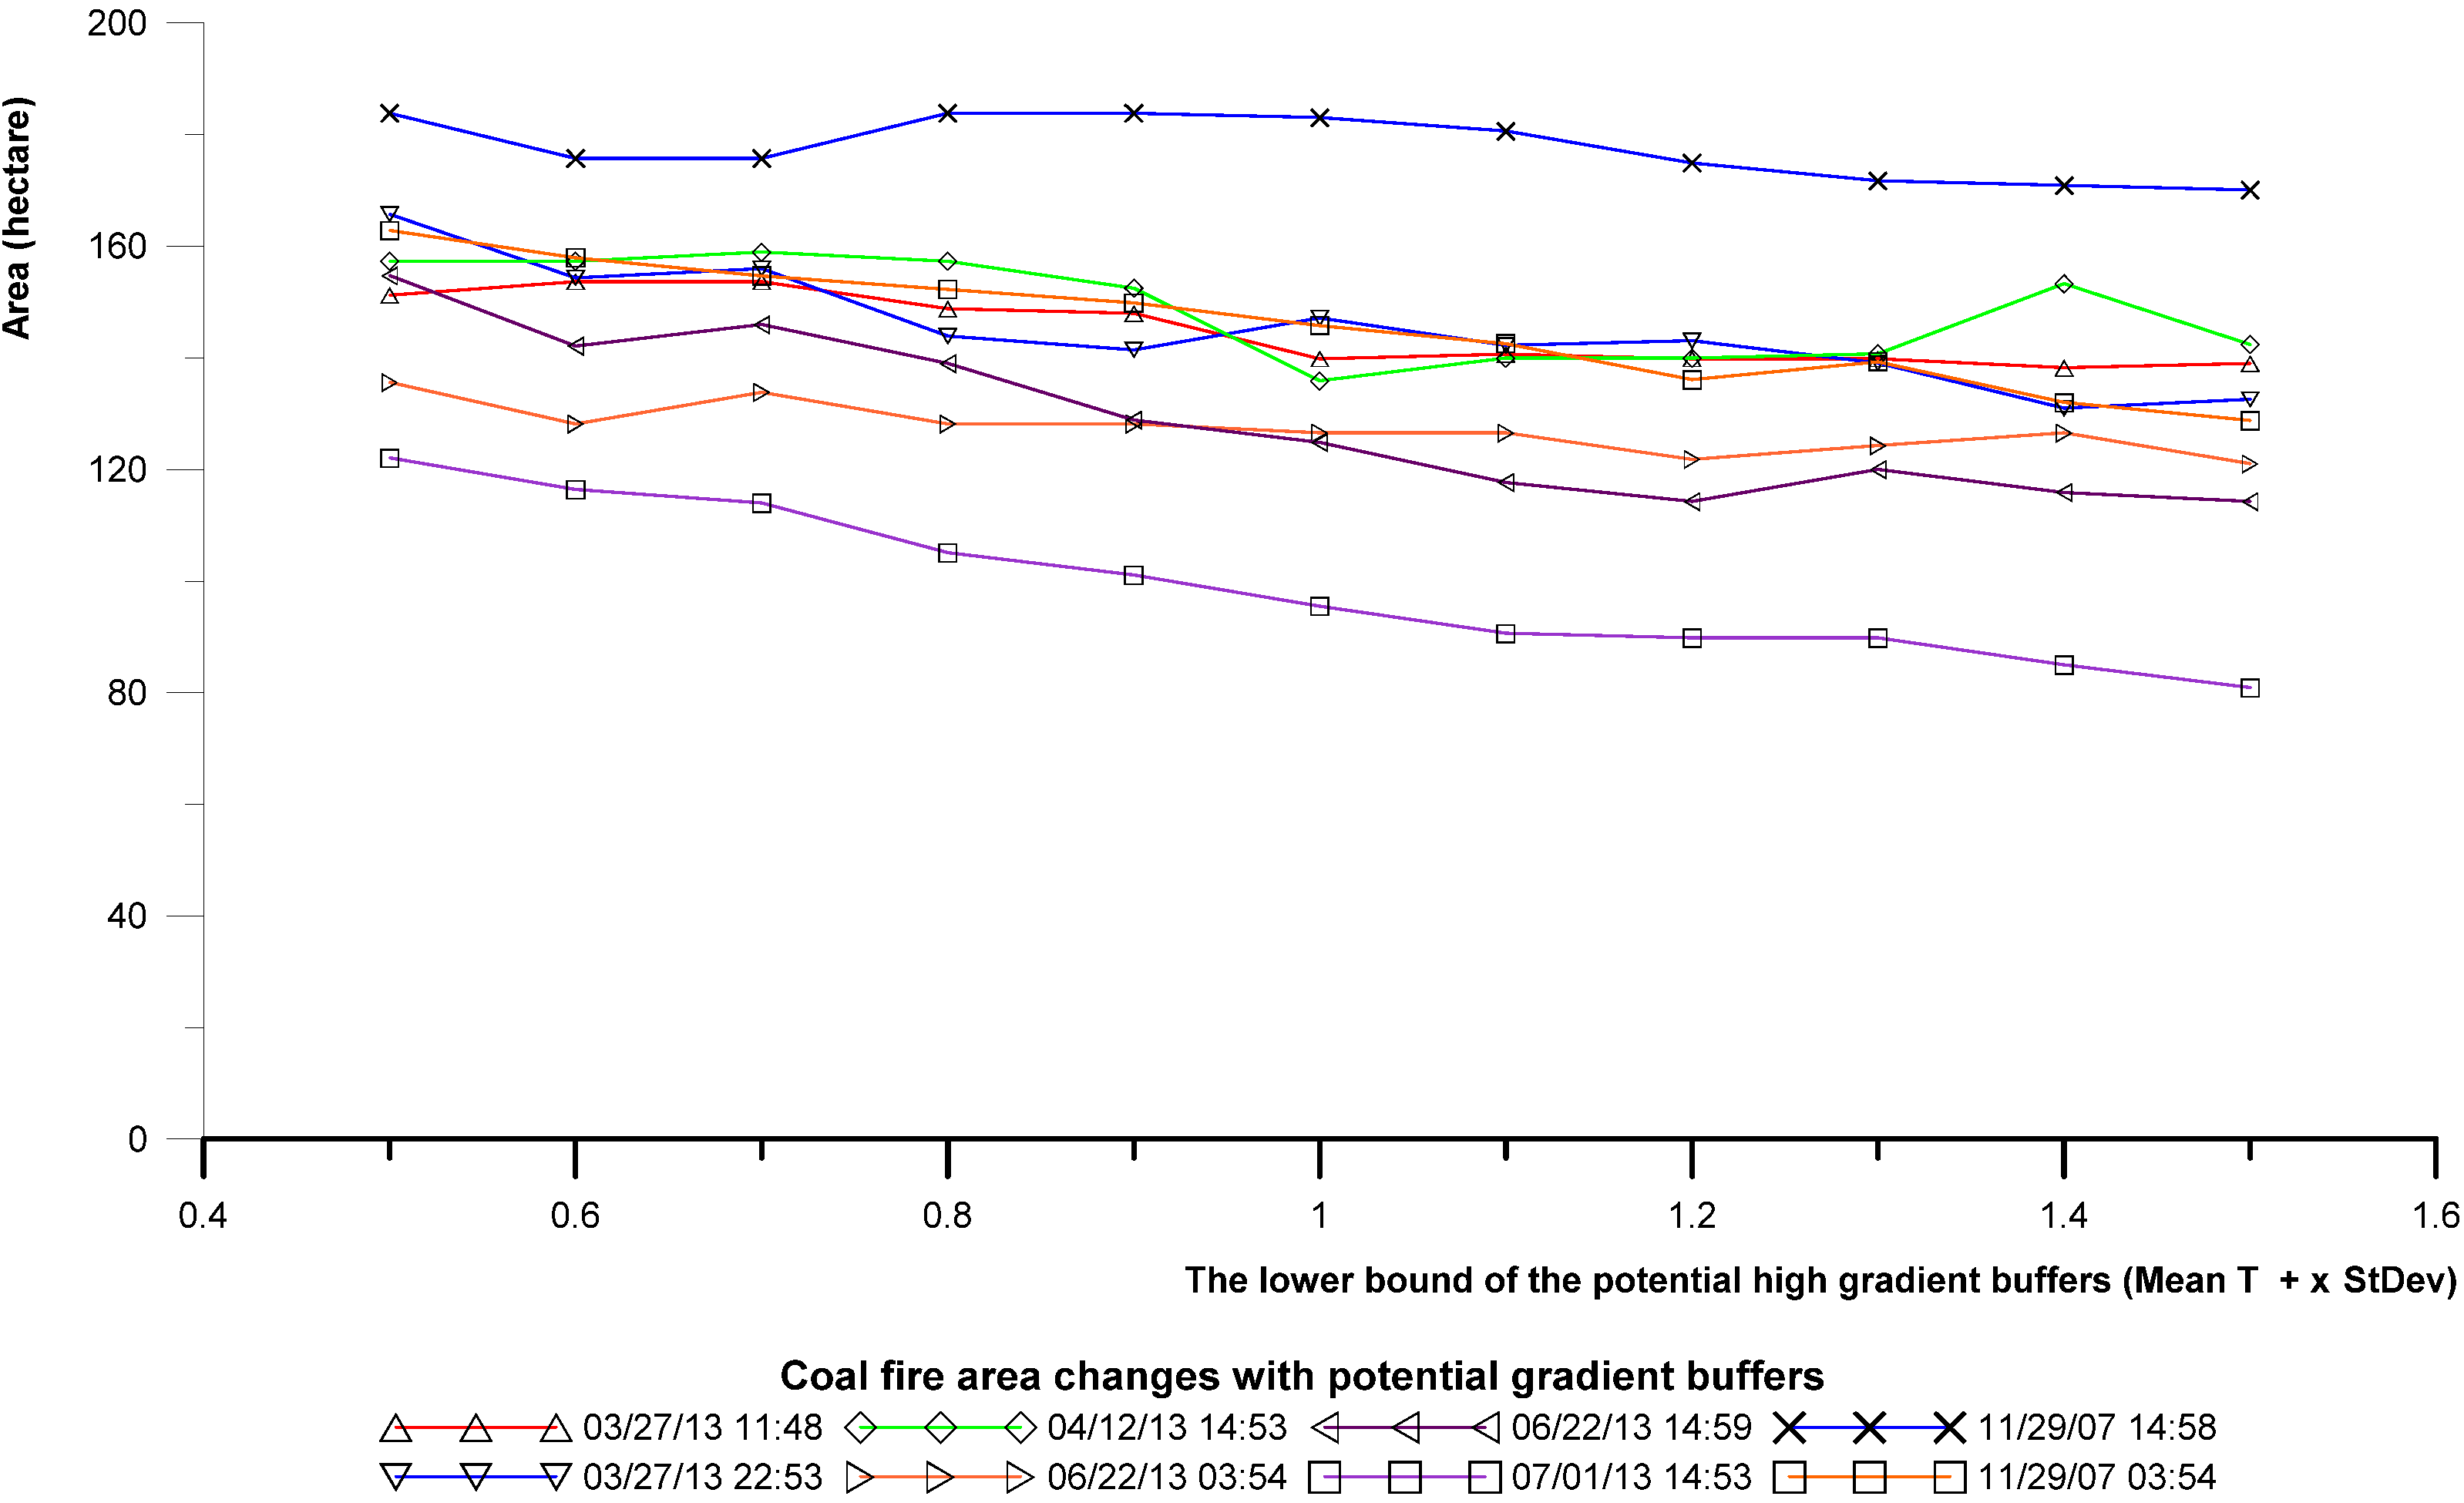
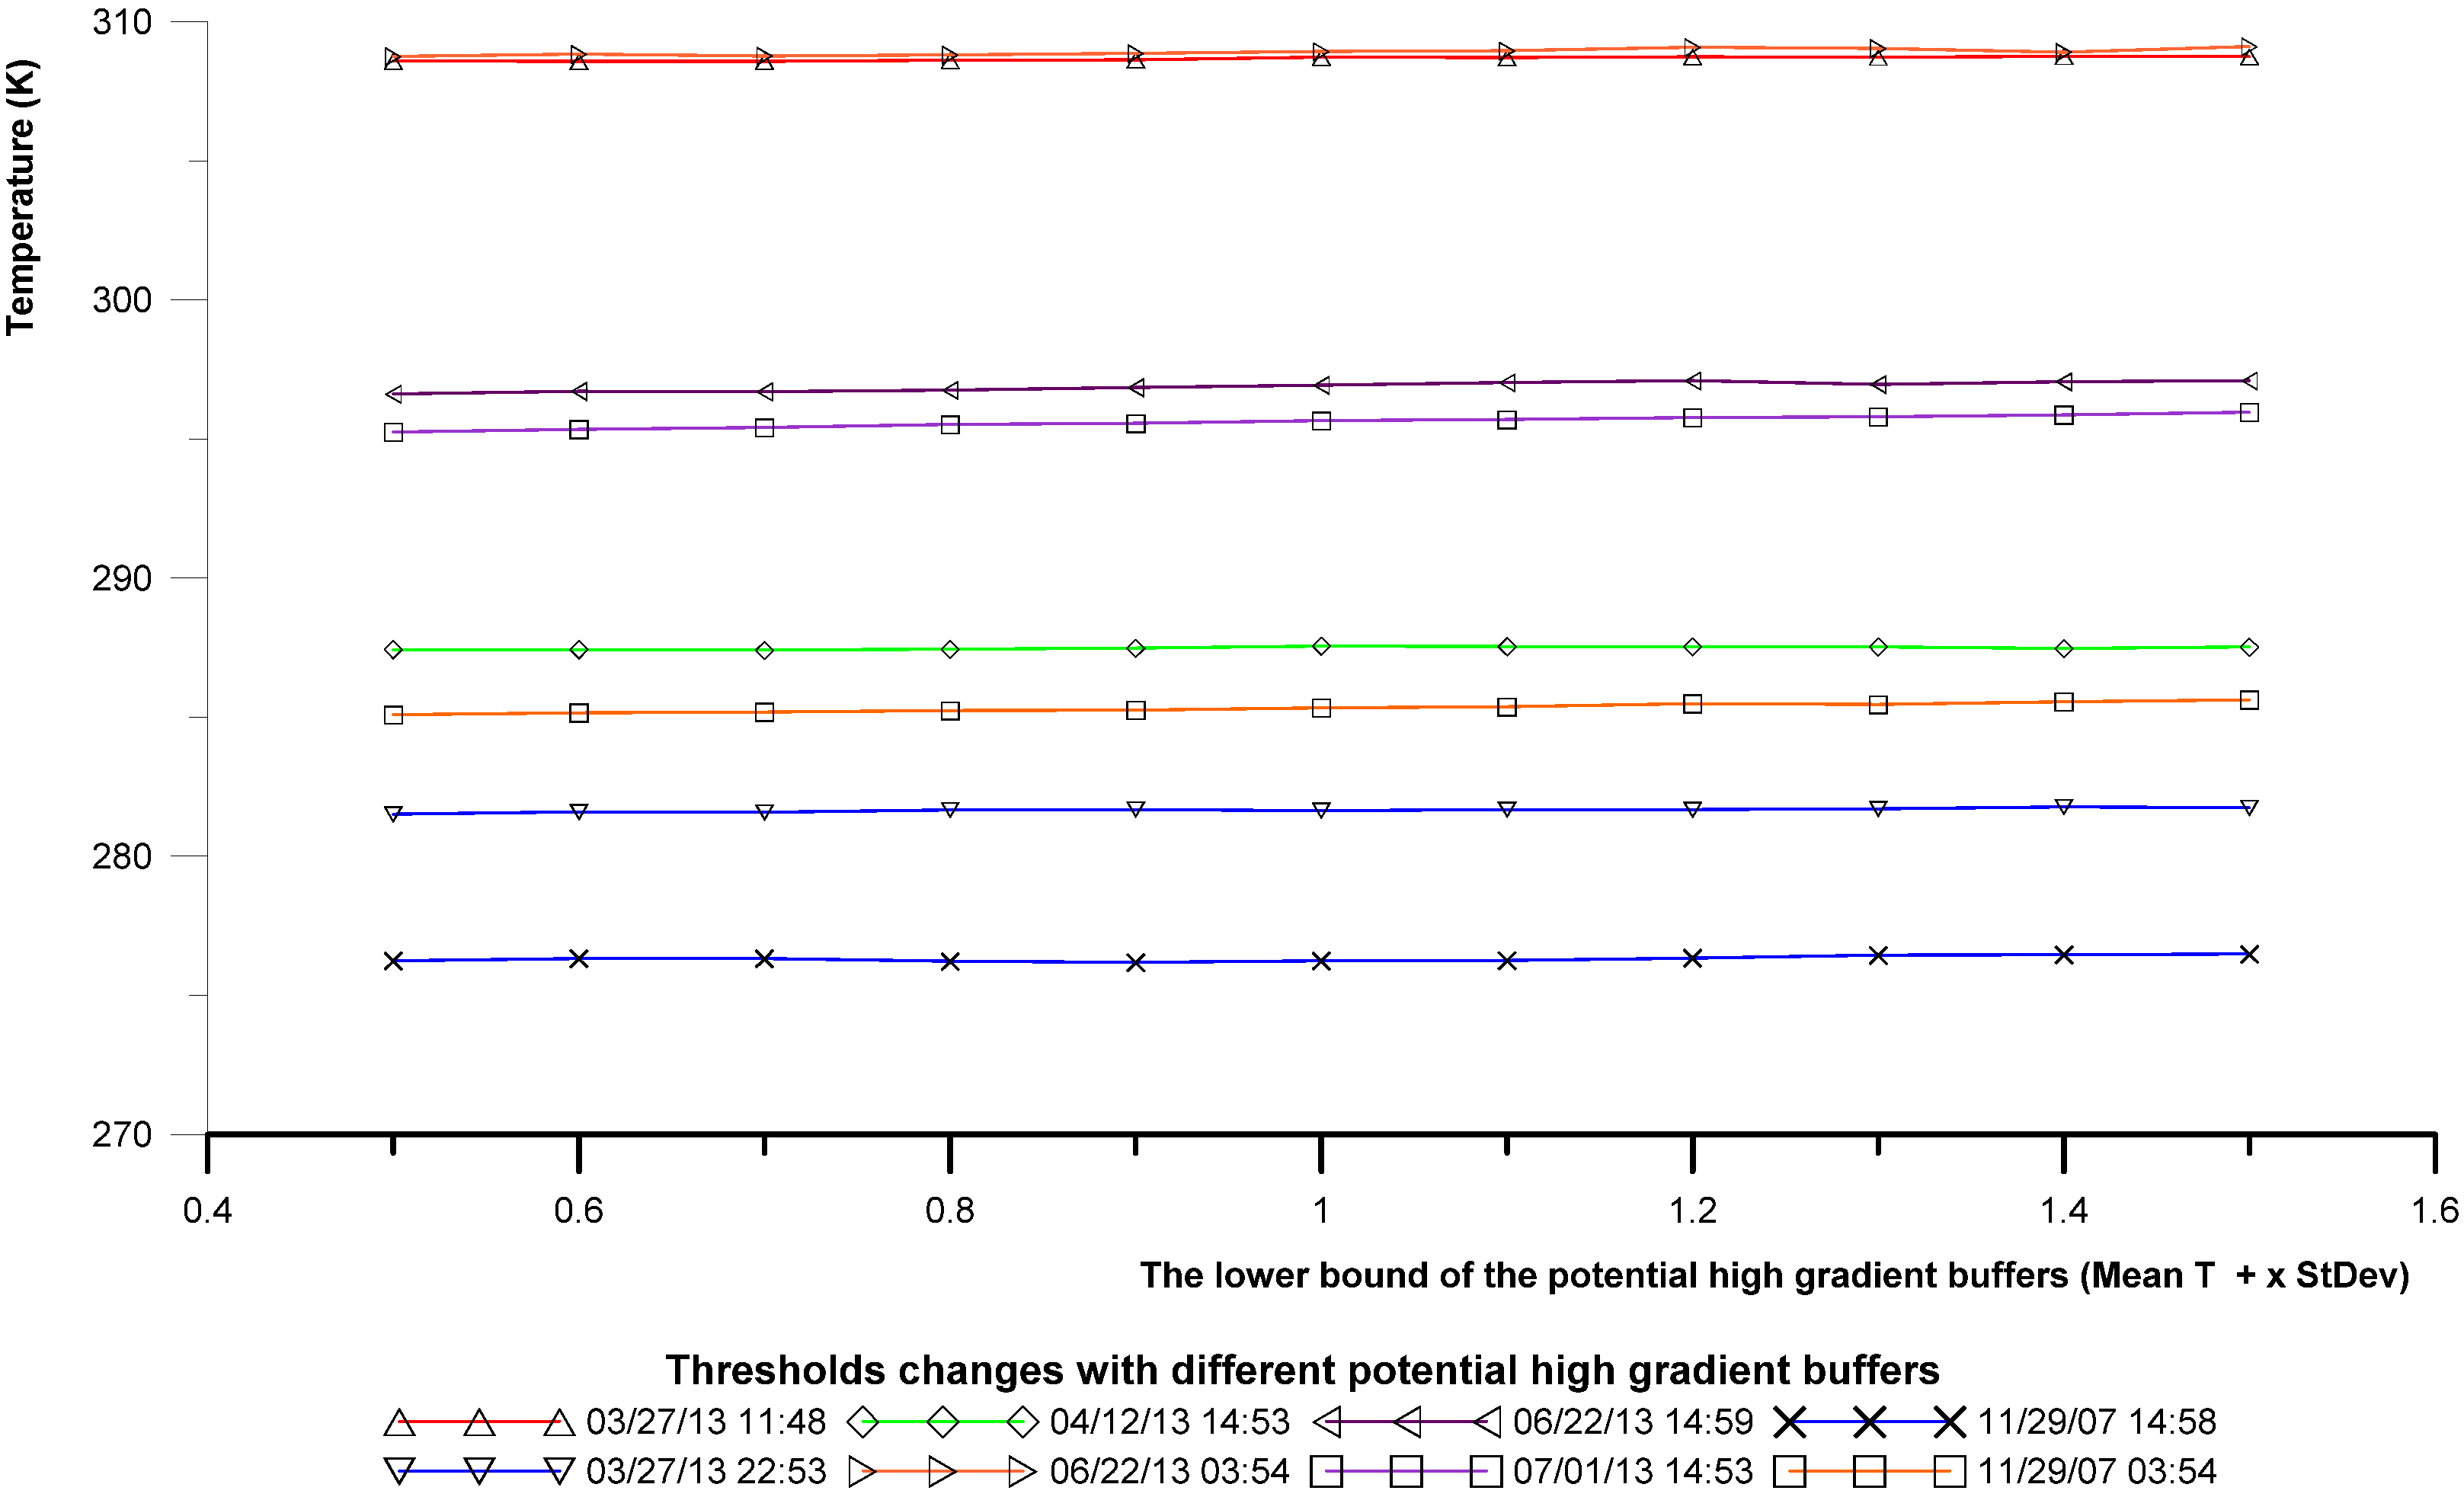
5.1. Convergence Analysis

| Date Time of Acquisition | 0.5σ | 0.6σ | 0.7σ | 0.8σ | 0.9σ | 1.0σ | 1.1σ | 1.2σ | 1.3σ | 1.4σ | 1.5σ | Mean. | STDEV |
|---|---|---|---|---|---|---|---|---|---|---|---|---|---|
| 2013/03/27 03 | 308.58 | 308.57 | 308.57 | 308.61 | 308.62 | 308.72 | 308.71 | 308.74 | 308.72 | 308.75 | 308.75 | 308.67 | 0.0749 |
| 2013/03/27 14 | 281.51 | 281.59 | 281.58 | 281.66 | 281.68 | 281.64 | 281.68 | 281.67 | 281.70 | 281.77 | 281.74 | 281.66 | 0.0753 |
| 2013/04/12 14 | 287.43 | 287.43 | 287.41 | 287.44 | 287.48 | 287.55 | 287.53 | 287.53 | 287.53 | 287.46 | 287.52 | 287.48 | 0.0515 |
| 2013/06/22 03 | 308.75 | 308.83 | 308.77 | 308.80 | 308.86 | 308.92 | 308.95 | 309.07 | 309.04 | 308.90 | 309.10 | 308.91 | 0.1215 |
| 2013/06/22 14 | 296.61 | 296.72 | 296.69 | 296.75 | 296.85 | 296.93 | 297.02 | 297.09 | 296.96 | 297.06 | 297.09 | 296.89 | 0.1727 |
| 2013/07/01 14 | 295.25 | 295.34 | 295.41 | 295.52 | 295.56 | 295.65 | 295.69 | 295.77 | 295.80 | 295.86 | 295.96 | 295.62 | 0.2259 |
| 2007/11/29 03 | 285.08 | 285.16 | 285.18 | 285.23 | 285.25 | 285.33 | 285.37 | 285.48 | 285.45 | 285.55 | 285.62 | 285.34 | 0.1737 |
| 2007/11/29 14 | 276.24 | 276.32 | 276.32 | 276.22 | 276.18 | 276.24 | 276.25 | 276.34 | 276.44 | 276.46 | 276.48 | 276.318 | 0.1038 |
| Date Time of Acquisition | 0.5 σ | 0.6 σ | 0.7 σ | 0.8 σ | 0.9 σ | 1.0 σ | 1.1 σ | 1.2 σ | 1.3 σ | 1.4 σ | 1.5 σ | Mean. | STDEV |
|---|---|---|---|---|---|---|---|---|---|---|---|---|---|
| 2013/03/27 03 | 151.22 | 153.65 | 153.65 | 148.79 | 147.98 | 139.84 | 140.65 | 139.84 | 139.84 | 138.22 | 139.03 | 144.79 | 6.2595 |
| 2013/03/27 14 | 165.76 | 154.37 | 155.99 | 143.89 | 141.46 | 147.13 | 142.27 | 143.08 | 139.07 | 130.97 | 132.59 | 145.14 | 10.2696 |
| 2013/04/12 14 | 157.34 | 157.34 | 158.96 | 157.34 | 152.51 | 135.90 | 139.95 | 139.95 | 140.76 | 153.32 | 142.43 | 148.71 | 8.8575 |
| 2013/06/22 03 | 135.61 | 128.18 | 133.85 | 128.18 | 128.18 | 126.56 | 126.56 | 121.84 | 124.27 | 126.56 | 121.03 | 127.35 | 4.4076 |
| 2013/06/22 14 | 154.73 | 142.13 | 145.96 | 139.01 | 128.88 | 124.85 | 117.70 | 114.28 | 120.02 | 115.90 | 114.28 | 128.88 | 14.3283 |
| 2013/07/01 14 | 122.06 | 116.44 | 114.01 | 105.10 | 101.09 | 95.51 | 90.65 | 89.84 | 89.84 | 85.01 | 80.91 | 99.13 | 13.6938 |
| 2007/11/29 03 | 162.81 | 157.95 | 154.71 | 152.28 | 149.85 | 145.80 | 142.56 | 136.08 | 139.32 | 132.03 | 128.79 | 145.65 | 10.9564 |
| 2007/11/29 14 | 183.87 | 175.77 | 175.77 | 183.87 | 183.87 | 183.06 | 180.63 | 174.96 | 171.72 | 170.91 | 170.10 | 177.68 | 5.5326 |
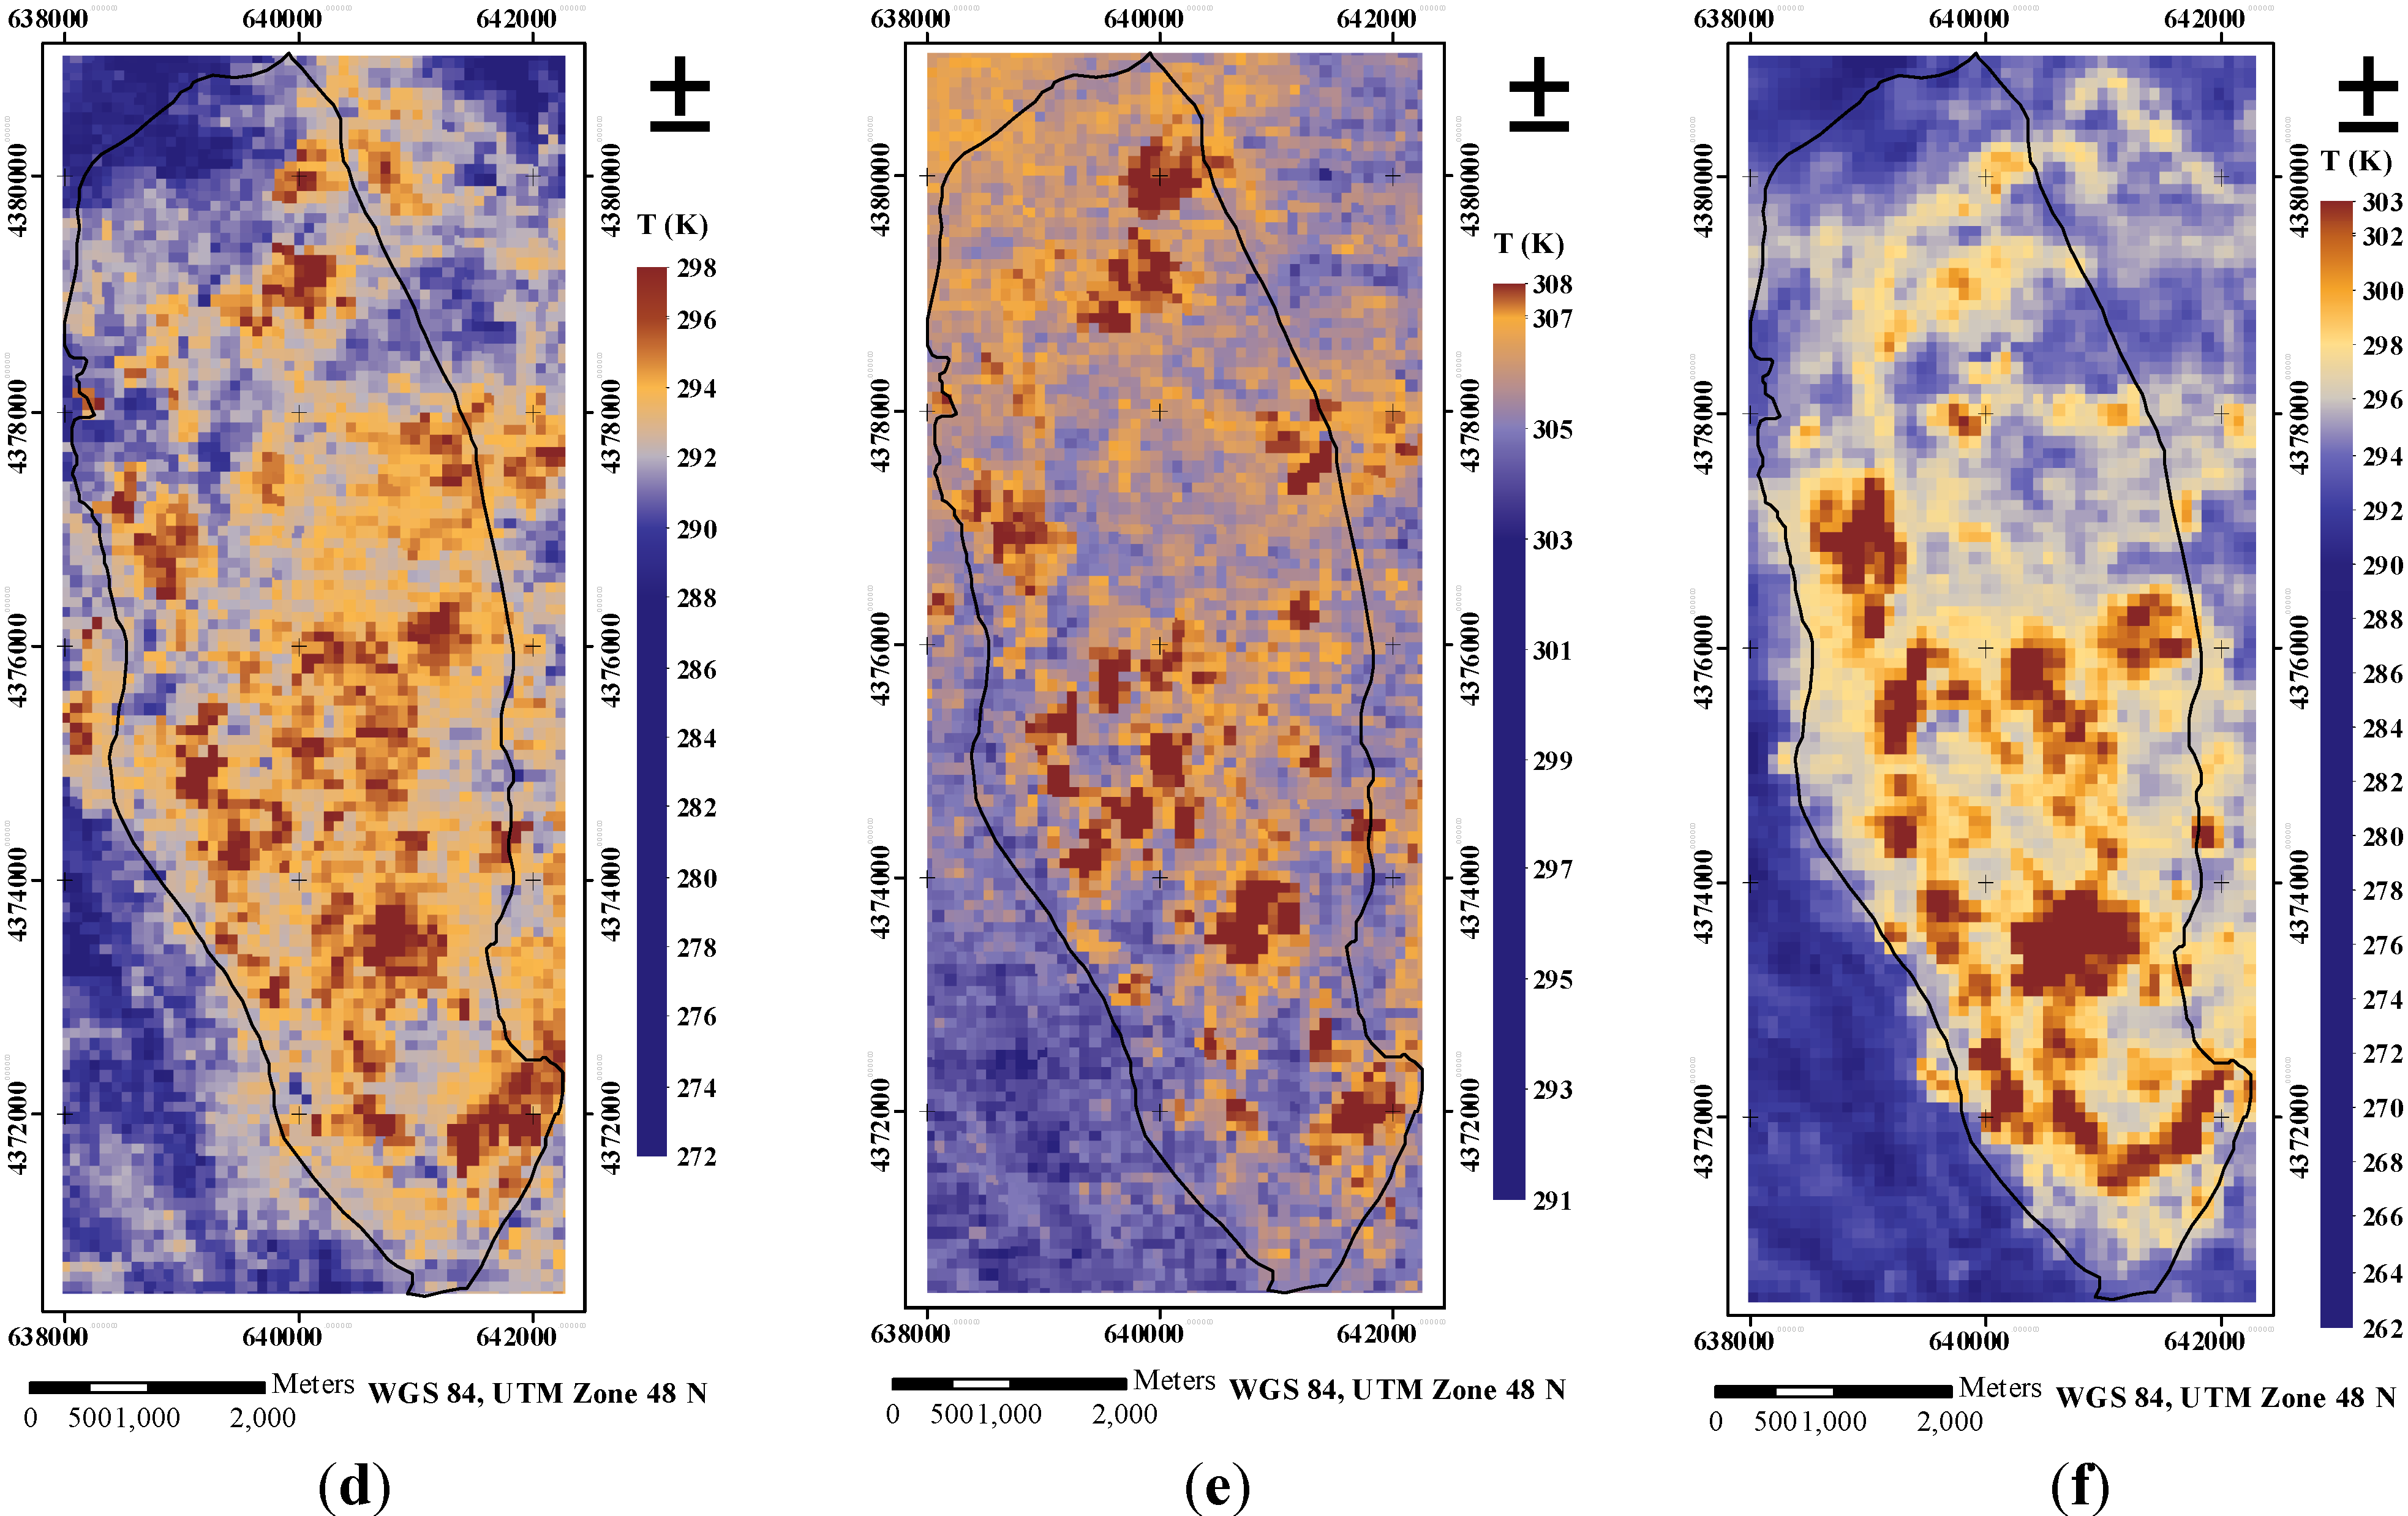
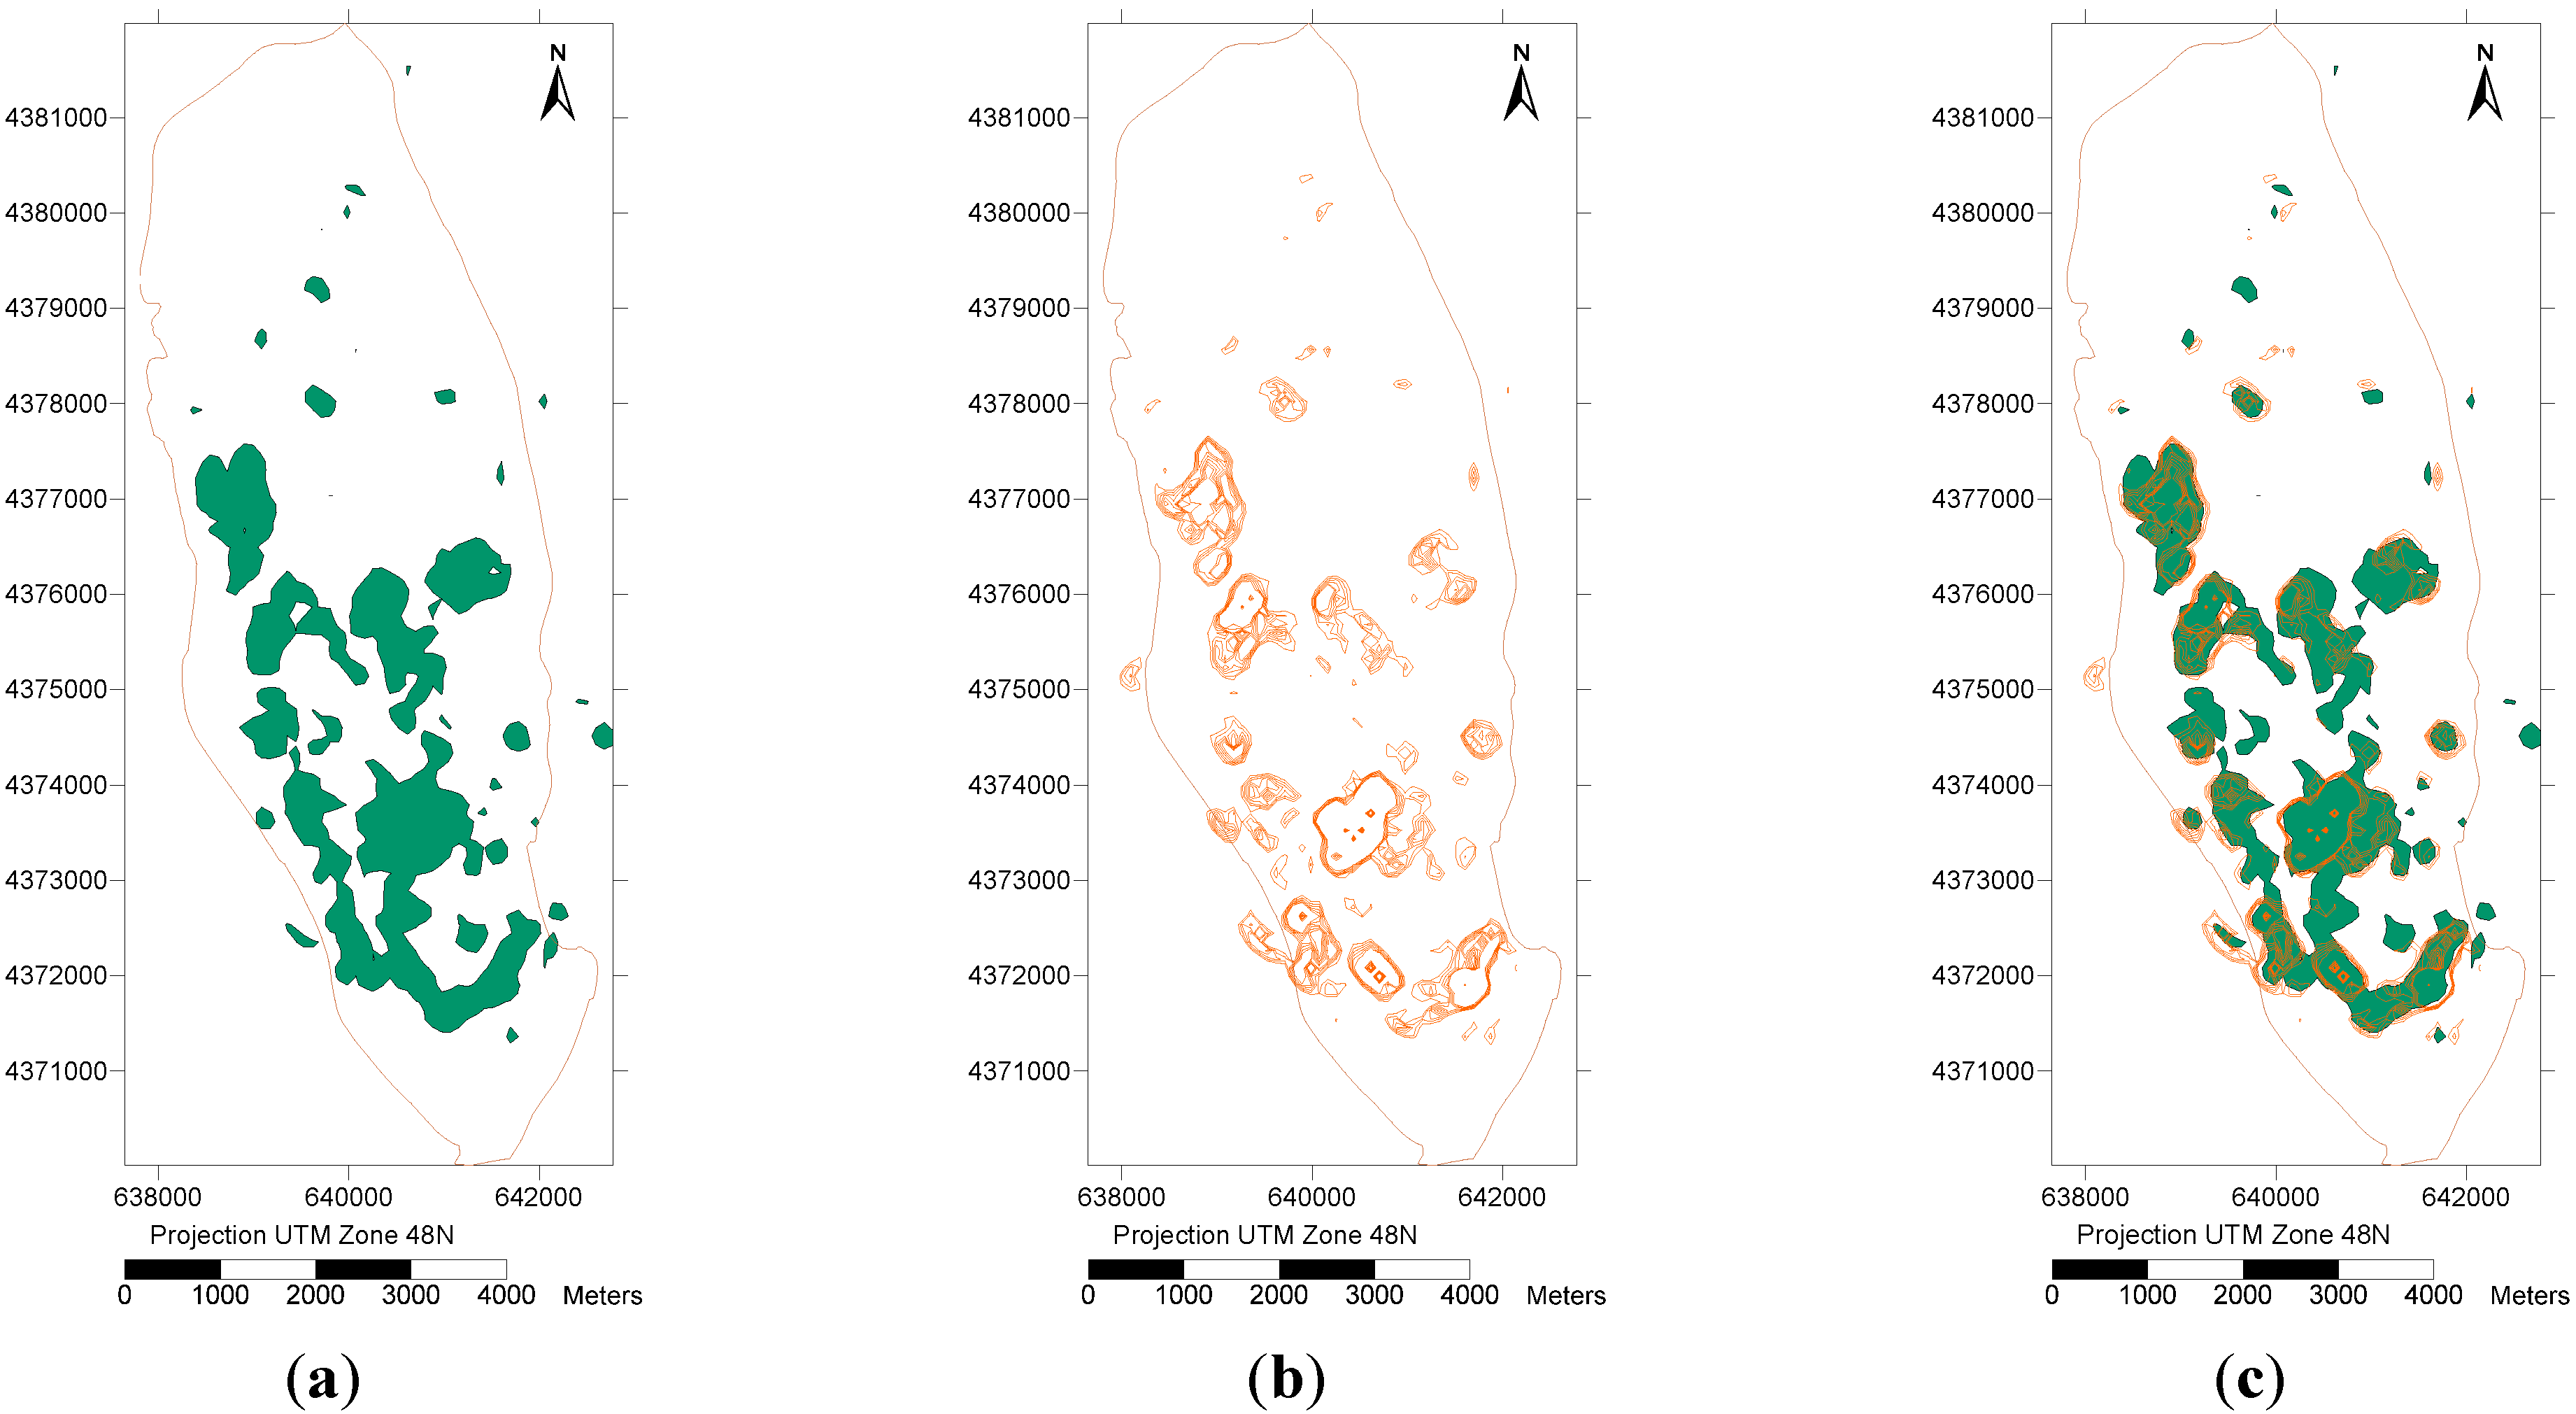
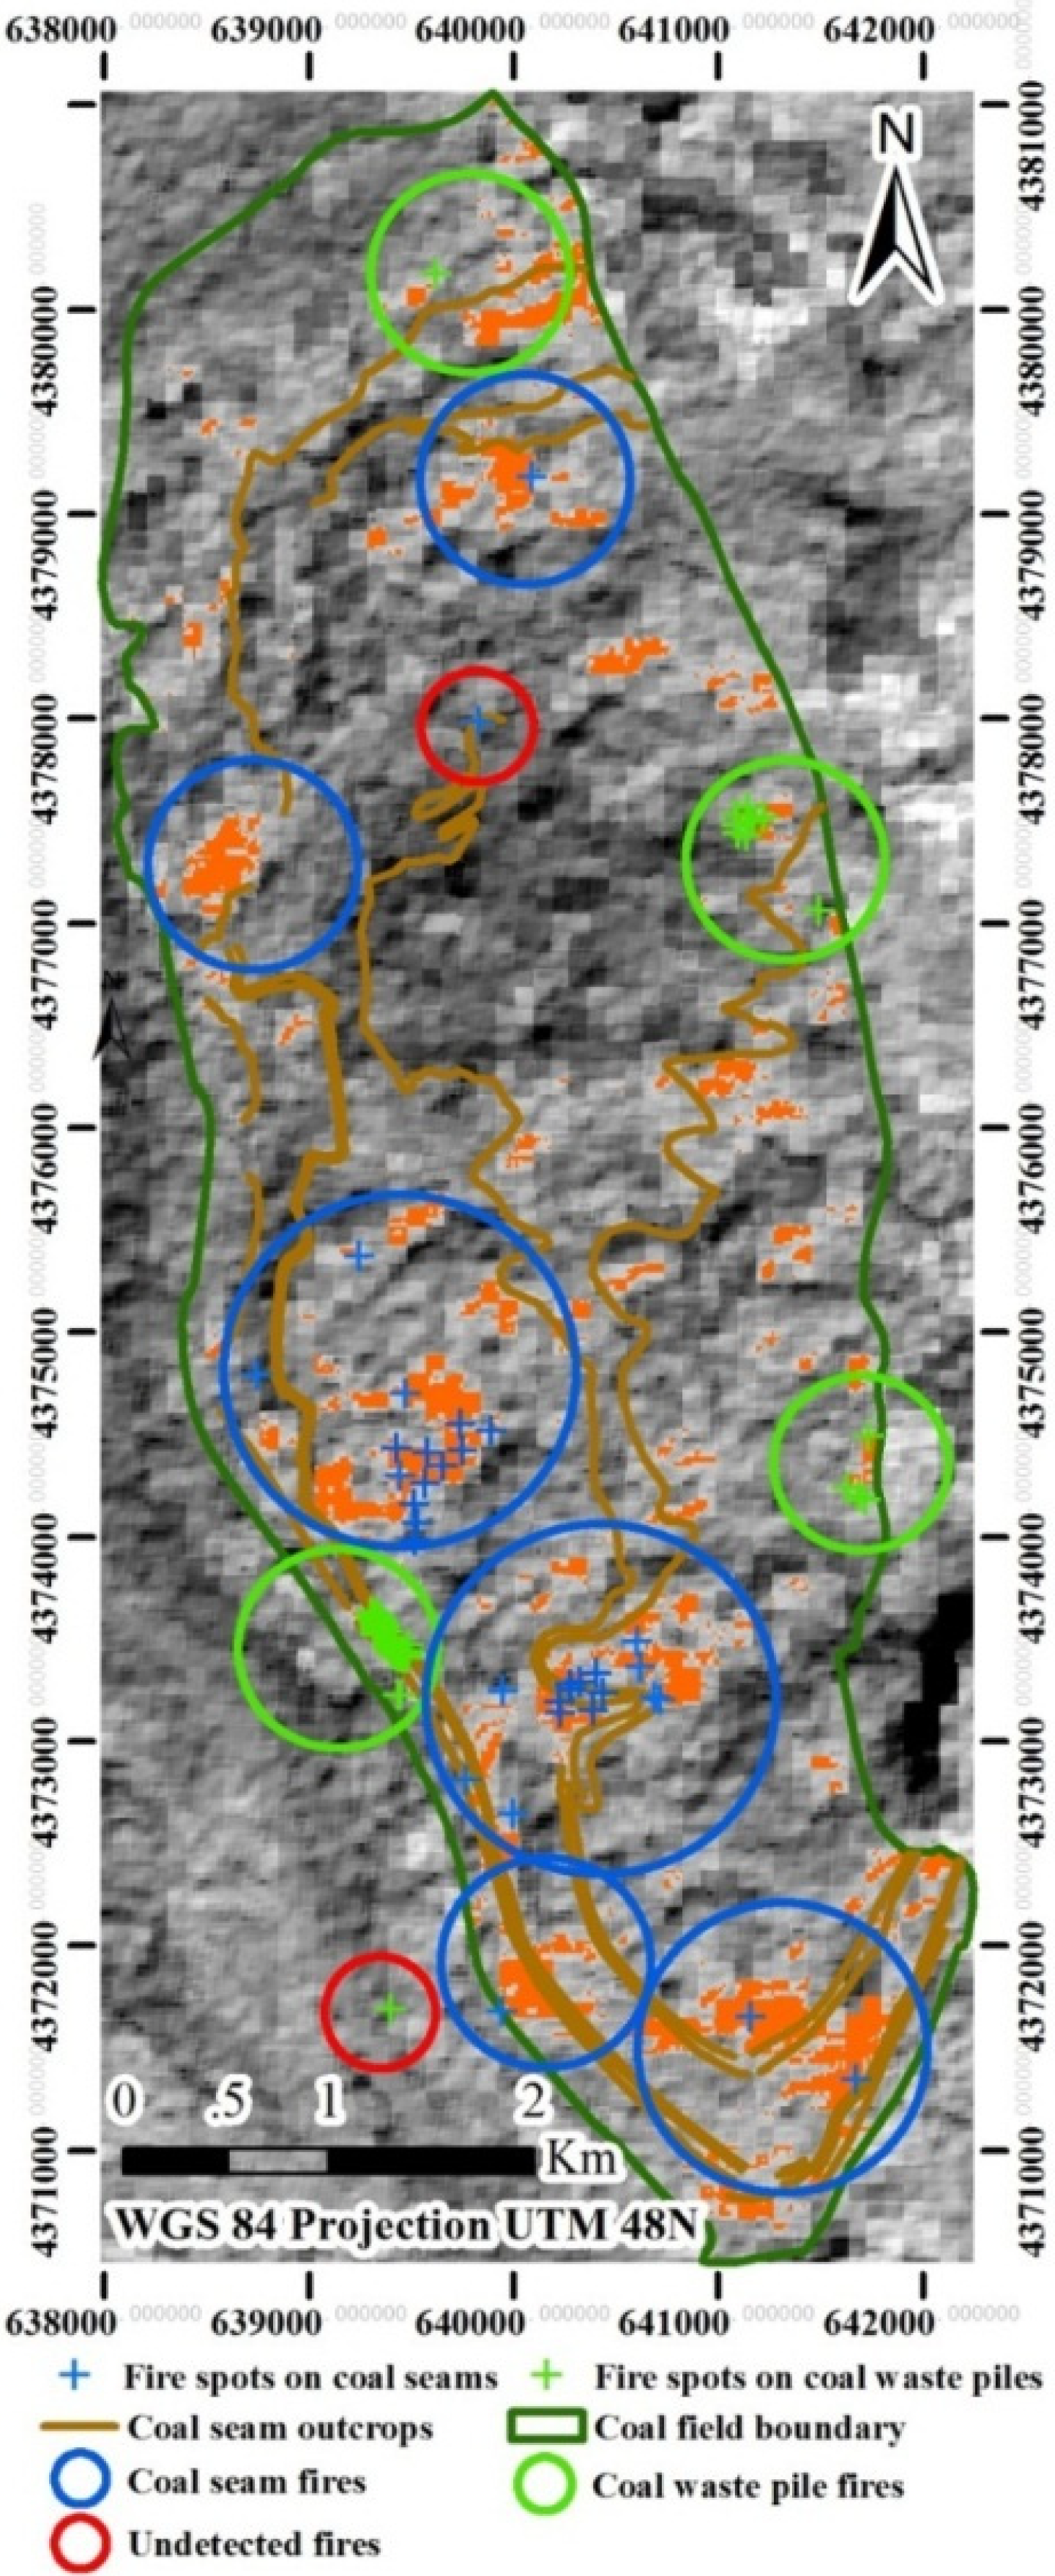
5.2. Coal Fire Mapping and Comparisons
5.3. Uncertainty and Accuracy

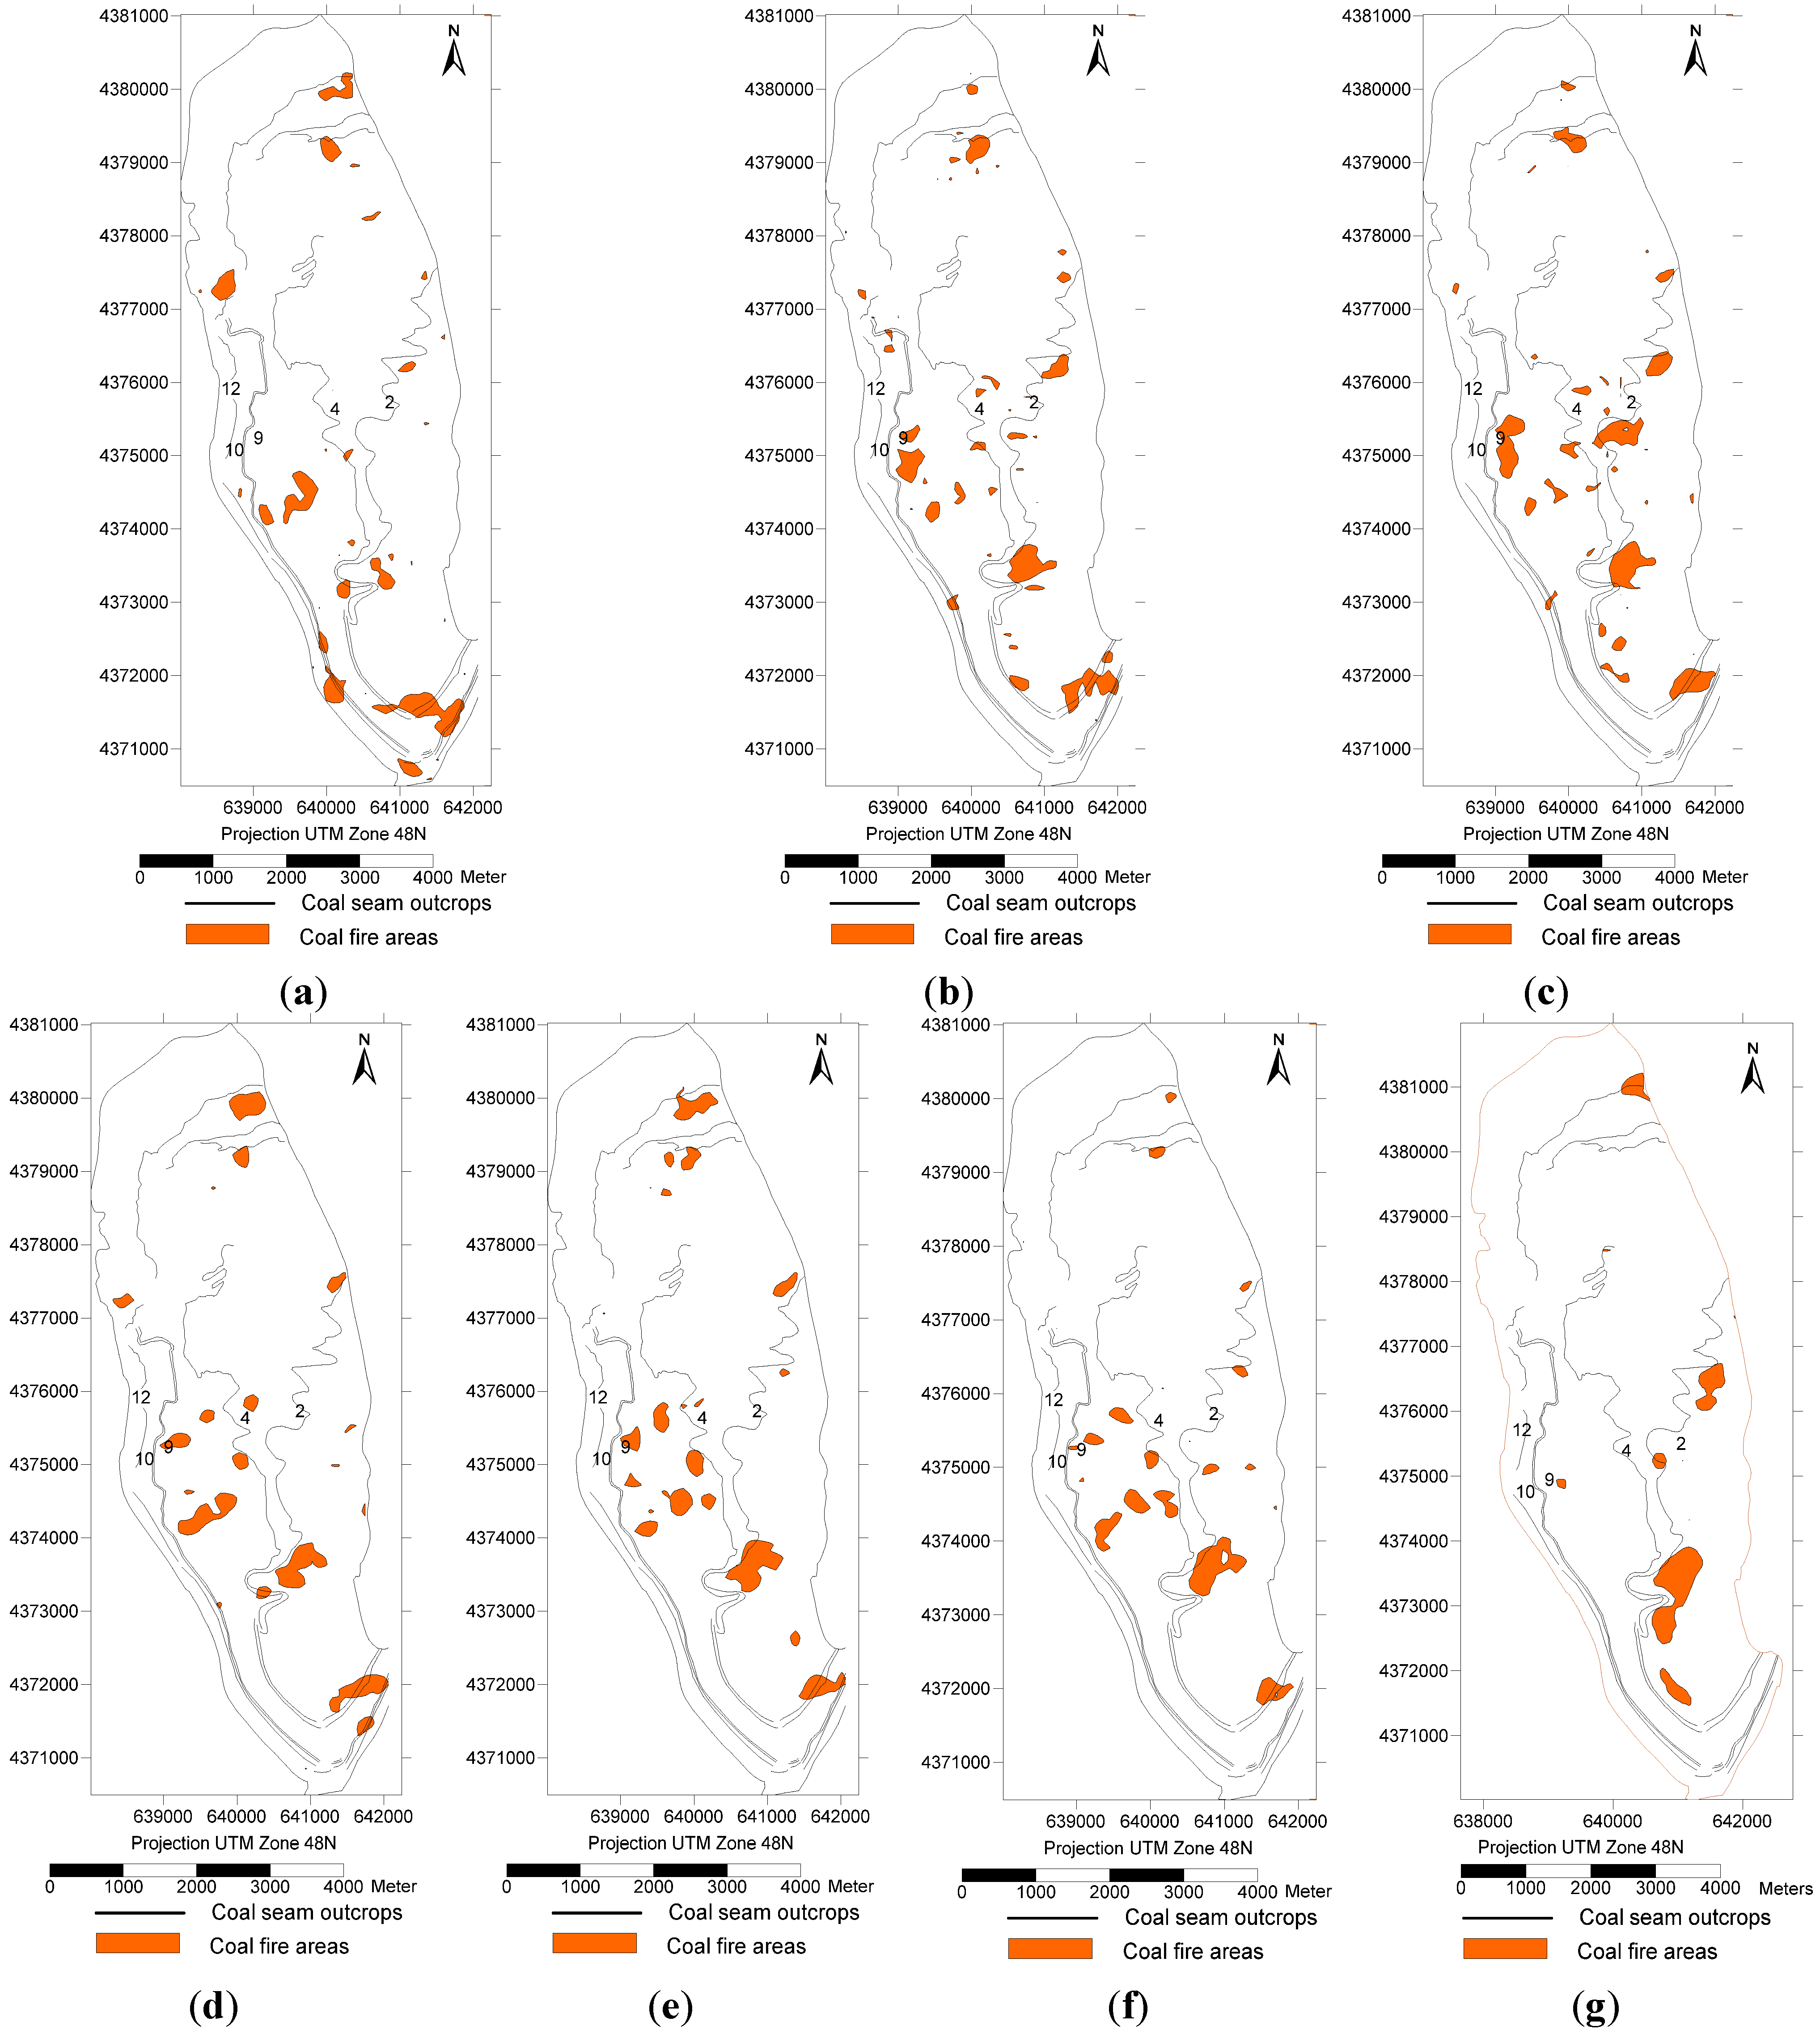
6. Application of SAGBT on Decadal Change Detection
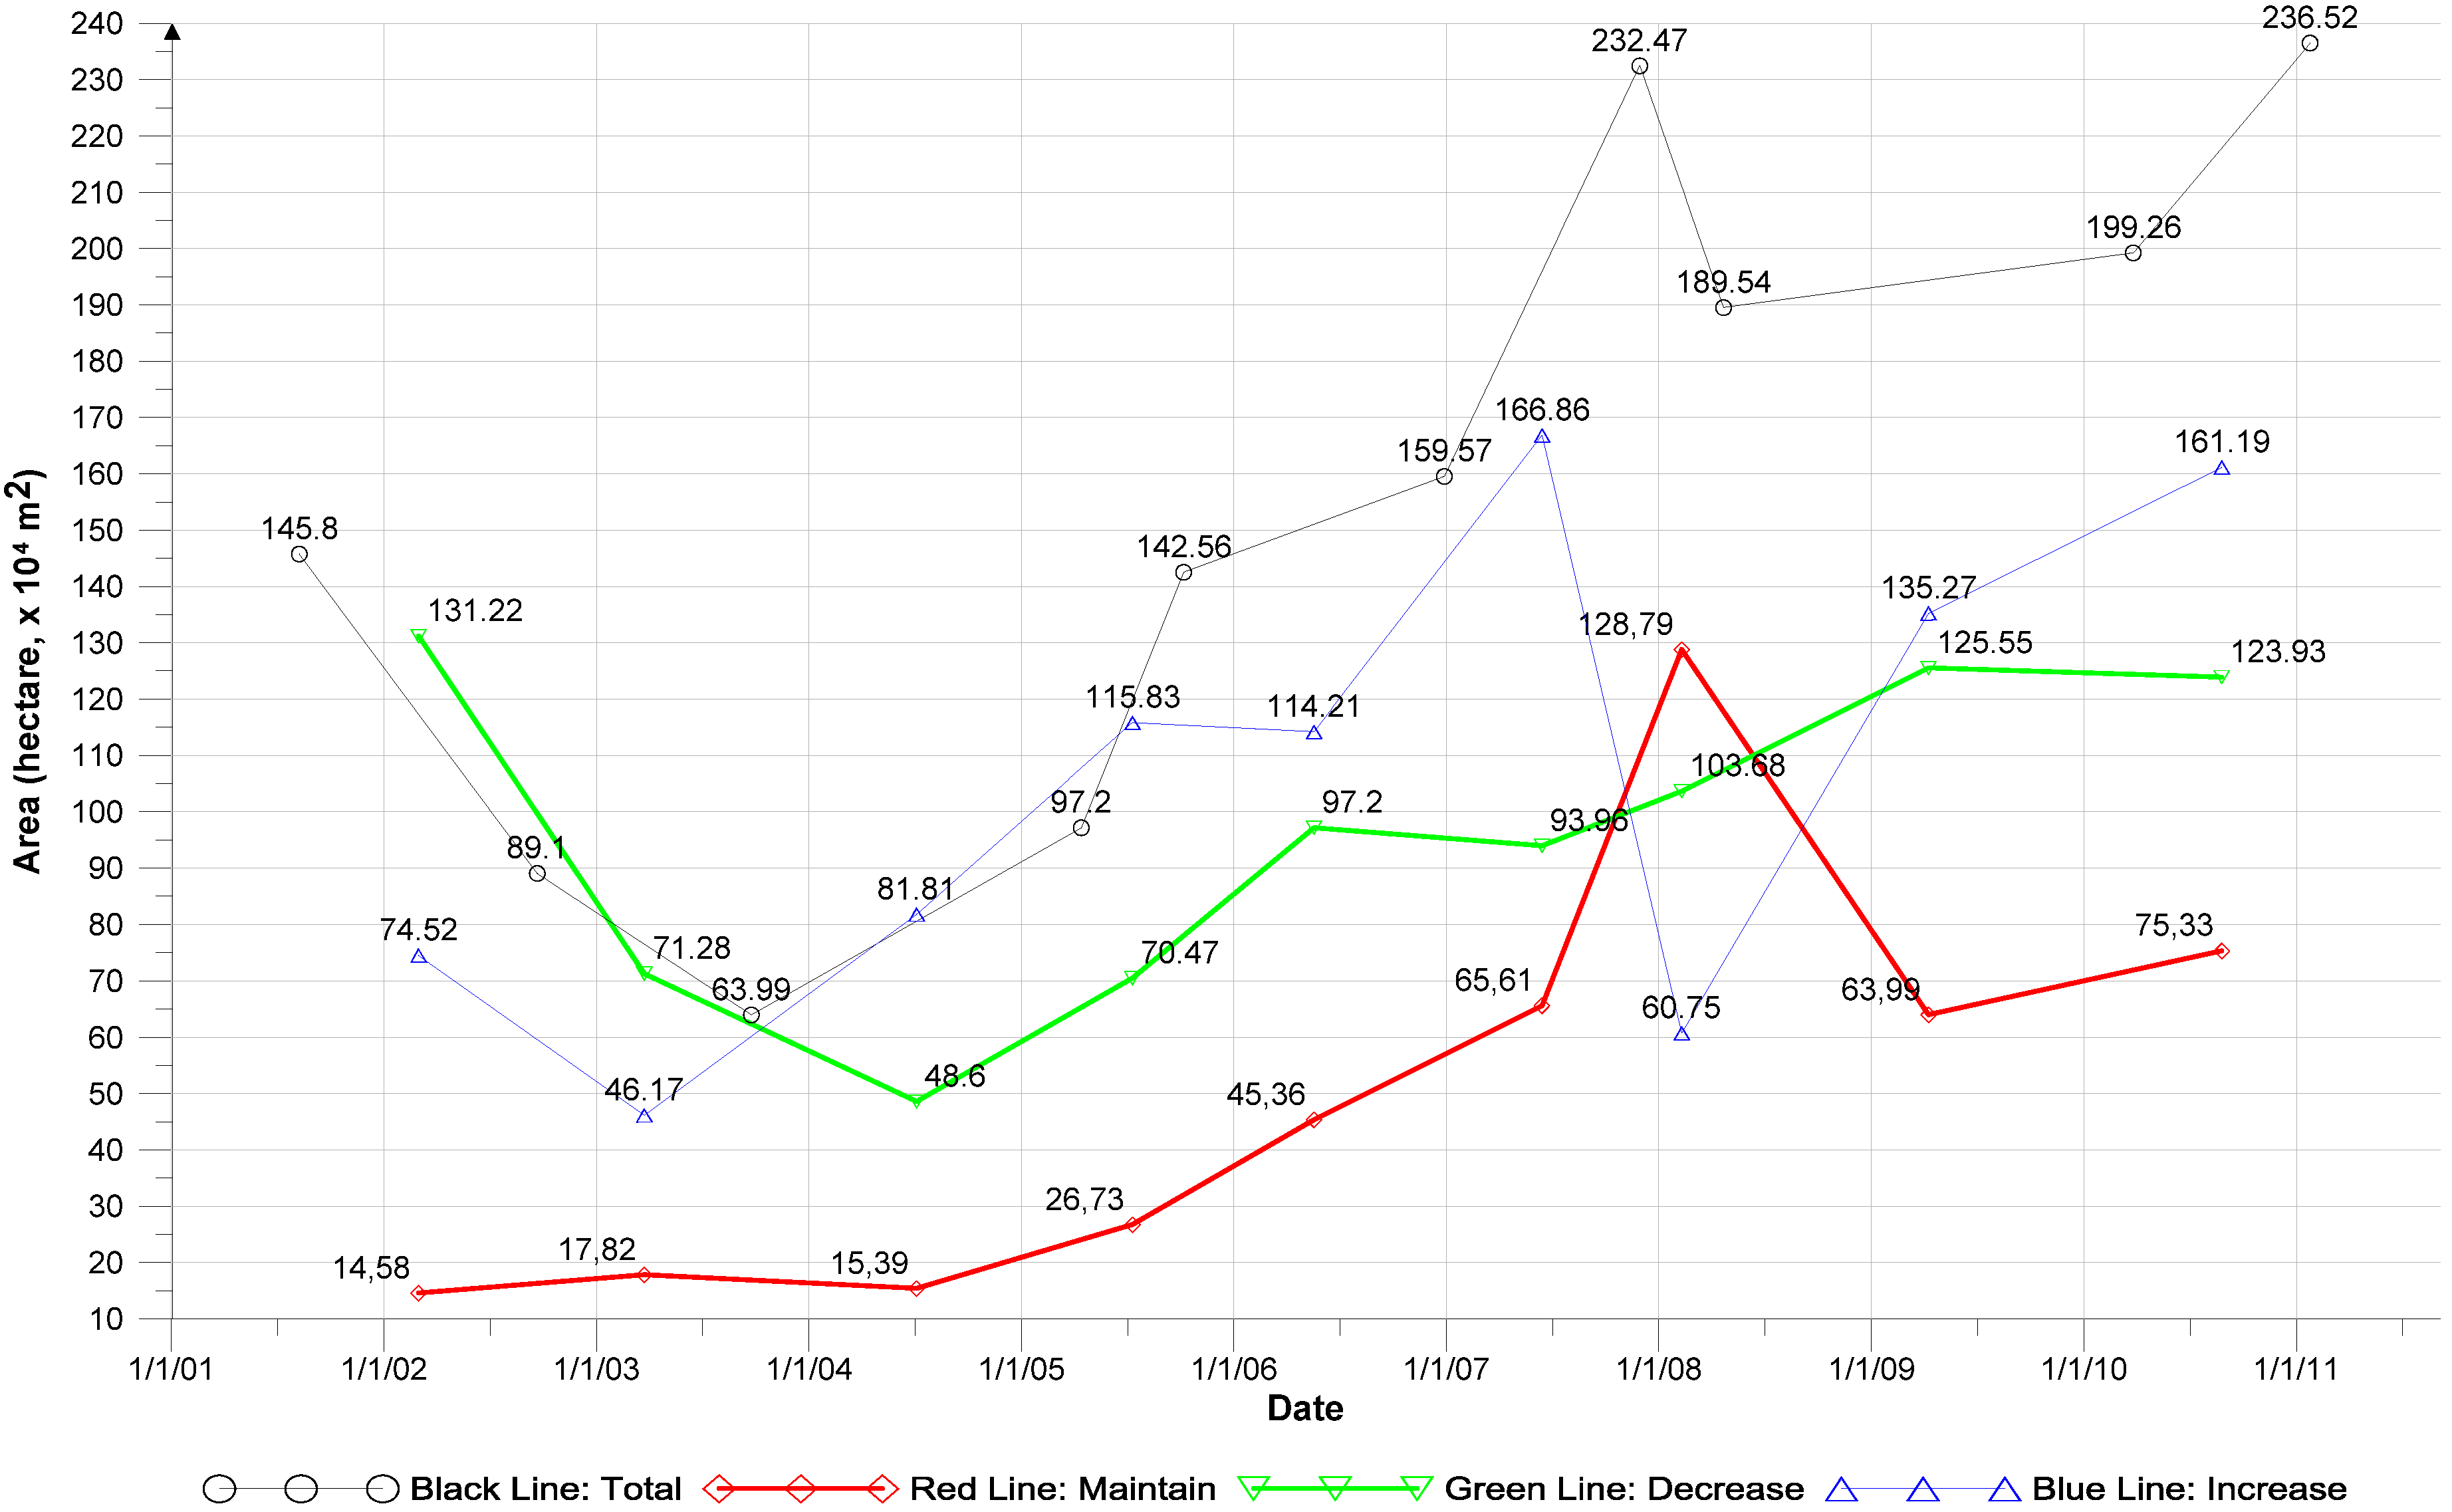
6.1. Changes and Time Series Analysis
| No. | Scene ID 1 A (Initial) | Scene ID 1 B (Final) | Time Interval BETWEEN A&B (Days) | Increase (ha, Blue) | Decrease (ha, Green) | Stable (ha, Orange) | Total Area of B (ha, Black) | Day for Scene B | Day for Midway between Scenes A and B |
|---|---|---|---|---|---|---|---|---|---|
| 0 | -- | ASTL1A_01080804 | -- | -- | -- | -- | 145.8 | 1 | -- |
| 1 | ASTL1A_01080804 | ASTL1A_02092114 | 409 | 74.52 | 131.22 | 14.58 | 89.1 | 410 | 206 |
| 2 | ASTL1A_02092114 | ASTL1A_03092403 | 368 | 46.17 | 71.28 | 17.82 | 63.99 | 778 | 594 |
| 3 | ASTL1A_03092403 | ASTL1A_05041314 | 567 | 81.81 | 48.6 | 15.39 | 97.2 | 1345 | 1062 |
| 4 | ASTL1A_05041314 | ASTL1A_05100603 | 176 | 115.83 | 70.47 | 26.73 | 142.56 | 1521 | 1433 |
| 5 | ASTL1A_05100603 | ASTL1A_06122803 | 448 | 114.21 | 97.2 | 45.36 | 159.57 | 1969 | 1745 |
| 6 | ASTL1A_06122803 | ASTL1A_07112914 | 336 | 166.86 | 93.96 | 65.61 | 232.47 | 2305 | 2137 |
| 7 | ASTL1A_07112914 | ASTL1A_08042114 | 144 | 60.75 | 103.68 | 128.79 | 189.54 | 2449 | 2377 |
| 8 | ASTL1A_08042114 | ASTL1A_10032603 | 704 | 135.27 | 125.55 | 63.99 | 199.26 | 3153 | 2801 |
| 9 | ASTL1A_10032603 | ASTL1A_11012414 | 304 | 161.19 | 123.93 | 75.33 | 236.52 | 3457 | 3305 |
6.2. Comparison of Coal Fire Areas and Coal Production over the Ten-Year Period

7. Conclusions and Vision
Acknowledgments
Author Contributions
Conflicts of Interest
References
- Prakash, A.; Schaefer, K.; Witte, W.K.; Collins, K.; Gens, R.; Goyette, M.P. A remote sensing and GIS based investigation of a boreal forest coal fire. Int. J. Coal Geol. 2011, 86, 79–86. [Google Scholar] [CrossRef]
- Chatterjee, R.S. Coal fire mapping from satellite thermal IR data—A case example in Jharia Coalfield, Jharkhand, India. ISPRS J. Photogramm. Remote Sens. 2006, 60, 113–128. [Google Scholar] [CrossRef]
- Pone, J.D.N.; Hein, K.A.; Stracher, G.B.; Annegarn, H.J.; Finkleman, R.B.; Blake, D.R.; McCormack, J.K.; Schroeder, P. The spontaneous combustion of coal and its by-products in the Witbank and Sasolburg coalfields of South Africa. Int. J. Coal Geol. 2007, 72, 124–140. [Google Scholar] [CrossRef]
- Zhang, J. Underground Coal Fires in China: Origin, Detection, Fire-Fighting, and Prevention; China Coal Industry Publishing House: Beijing, China, 2008. [Google Scholar]
- Jiang, L.; Lin, H.; Ma, J.; Kong, B.; Wang, Y. Potential of small-baseline SAR interferometry for monitoring land subsidence related to underground coal fires: Wuda (Northern China) case study. Remote Sens. Environ. 2011, 115, 257–268. [Google Scholar] [CrossRef]
- Prakash, A. Coal fires—A Natural or Man Made Hazard? Available online: http://www2.gi.alaska.edu/~prakash/coalfires/coalfires.html (accessed on 20 May 2015).
- van Dijk, P.; Zhang, J.; Jun, W.; Kuenzer, C.; Wolf, K.H. Assessment of the contribution of in-situ combustion of coal to greenhouse gas emission; based on a comparison of Chinese mining information to previous remote sensing estimates. Int. J. Coal Geol. 2011, 86, 108–119. [Google Scholar] [CrossRef]
- Kuenzer, C.; Hecker, C.; Zhang, J.; Wessling, S.; Wagner, W. The potential of multidiurnal MODIS thermal band data for coal fire detection. Int. J. Remote Sens. 2008, 29, 923–944. [Google Scholar] [CrossRef]
- Slavecki, R.J. Detection and location of subsurface coal fires. In Proceedings of the Third Symposium on Remote Sensing of Environment, Ann Arbor, MI, USA, 14–16 October, 1964; pp. 537–547.
- Greene, G.W.; Moxham, R.M.; Harvey, A.H. Aerial infrared surveys and borehole temperature measurements of coal mine fires in Pennsylvania. Remote Sens. Environ. 1969, 1, 517–525. [Google Scholar]
- Bhattacharya, A.; Reddy, S.; Mukherjee, T. Multi-tier remote sensing data analysis for coalfire mapping in Jharia Coalfield of Bihar, India. In Proceedings of the Twelfth Asian Conference on Remote Sensing, Singapore, 30 October–5 November 1991; pp. 21–22.
- Cracknell, A.; Mansor, S. Detection off sub-surface coal fires using Landsat Thematic Mapper data. Int. Arch. Photogramm. Remote Sens. 1993, 29, 750–753. [Google Scholar]
- Saraf, A.K.; Prakash, A.; Sengupta, S.; Gupta, R.P. Landsat TM data for estimating ground temperature and depth of subsurface coal fire in the Jharia Coalfield, India. Int. J. Remote Sens. 1995, 16, 2111–2124. [Google Scholar] [CrossRef]
- Prakash, A.; Gupta, R. Surface fires in Jharia coalfield, India-their distribution and estimation of area and temperature from TM data. Int. J. Remote Sens. 1999, 20, 1935–1946. [Google Scholar] [CrossRef]
- Gangopadhyay, P.K.; Maathuis, B.; Van Dijk, P. ASTER-derived emissivity and coal-fire related surface temperature anomaly: A case study in Wuda, North China. Int. J. Remote Sens. 2005, 26, 5555–5571. [Google Scholar] [CrossRef]
- Jiang, W.; Gu, L.; Yang, B.; Chen, Q. Monitoring method of underground coal fire based on night thermal infrared remote sensing technology. Spectrosc. Spectral Anal. 2011, 31, 357–361. [Google Scholar]
- Tetzlaff, A. Coal Fire Quantification using ASTER, ETM and BIRD Satellite Instrument Data. Ph.D. Thesis, Ludwig-Maximilians-Universität München (LMU), Munich, Germany, 2004. [Google Scholar]
- Chen, Y.; Jing, L.; Bo, Y.; Shi, P.; Zhang, S. Detection of coal fire location and change based on multi‐temporal thermal remotely sensed data and field measurements. Int. J. Remote Sens. 2007, 28, 3173–3179. [Google Scholar] [CrossRef]
- Prakash, A.; Gupta, R.; Saraf, A. A Landsat TM based comparative study of surface and subsurface fires in the Jharia Coalfield, India. Int. J. Remote Sens. 1997, 18, 2463–2469. [Google Scholar] [CrossRef]
- Zhang, X.; Cassells, C.; Van Genderen, J. Multi-sensor data fusion for the detection of underground coal fires. Geol. Mijnb. 1998, 77, 117–128. [Google Scholar] [CrossRef]
- Yang, B.; Chen, Y.; Li, J.; Gong, A.; Kuenzer, C.; Zhang, J. Simple normalization of multi-temporal thermal IR data and applied research, on the monitoring of typical coal fires in northern China. In Proceedings of the 2005 IEEE International Geoscience and Remote Sensing Symposium Proceedings(25th) (IGARSS 2005), Seoul, Korea, 25–29 July 2005; pp. 5725–5728.
- Dozier, J. A method for satellite identification of surface temperature fields of subpixel resolution. Remote Sens. Environ. 1981, 11, 221–229. [Google Scholar] [CrossRef]
- Voigt, S.; Tetzlaff, A.; Zhang, J.; Künzer, C.; Zhukov, B.; Strunz, G.; Oertel, D.; Roth, A.; van Dijk, P.; Mehl, H. Integrating satellite remote sensing techniques for detection and analysis of uncontrolled coal seam fires in North China. Int. J. Coal Geol. 2004, 59, 121–136. [Google Scholar] [CrossRef]
- Kuenzer, C.; Zhang, J.; Li, J.; Voigt, S.; Mehl, H.; Wagner, W. Detecting unknown coal fires: Synergy of automated coal fire risk area delineation and improved thermal anomaly extraction. Int. J. Remote Sens. 2007, 28, 4561–4585. [Google Scholar] [CrossRef]
- Zhang, J. Spatial and Statistical Analysis of Thermal Satellite Imagery for Extraction of Coal Fire Related Anomalies. Ph.D. Thesis, Technical University Vienna, Vienna, Austria, 2004. [Google Scholar]
- Lasaponara, R.; Cuomo, V.; Macchiato, M.; Simoniello, T. A self-adaptive algorithm based on AVHRR multitemporal data analysis for small active fire detection. Int. J. Remote Sens. 2003, 24, 1723–1749. [Google Scholar] [CrossRef]
- Kuenzer, C.; Zhang, J.; Hirner, A.; Bo, Y.; Jia, Y.; Sun, Y. Multitemporal in-situ mapping of the Wuda coal fires from 2000 to 2005-assessing coal fire dynamics. In Spontaneous Coal Seam Fires: Mitigating a Global Disaster; UNESCO: Beijing, China, 2008; ERSEC ecological book serie 4; pp. 132–148. [Google Scholar]
- Kuenzer, C.; Zhang, J.; Tetzlaff, A.; Voigt, S.; Wagner, W. Automated demarcation, detection and quantification of coal fires in China using remote sensing data. In Spontaneous Coal Seam Fires: Mitigating a Global Disaster; Tsinghua University Press: Beijing, China, 2008; pp. 362–380. [Google Scholar]
- Kuenzer, C.; Zhang, J.; Sun, Y.; Jia, Y.; Dech, S. Coal fires revisited: The Wuda coal field in the aftermath of extensive coal fire research and accelerating extinguishing activities. Int. J. Coal Geol. 2012, 102, 75–86. [Google Scholar] [CrossRef]
- Guney, M. Oxidation and spontaneous combustion of coal: review of individual factors. Colliery Guard. 1968, 216, 105–110. [Google Scholar]
- Cao, D.; Fan, X.; Guan, H.; Wu, C.; Shi, X.; Jia, Y. Geological models of spontaneous combustion in the Wuda Coalfield, Inner Mongolia, China. Rev. Eng. Geol. 2007, 18, 23–30. [Google Scholar]
- Zhang, J.; Kuenzer, C. Thermal surface characteristics of coal fires 1 results of in-situ measurements. J. Appl. Geophys. 2007, 3, 117–134. [Google Scholar] [CrossRef]
- Kuenzer, C.; Strunz, G.; Voigt, S.; Wagner, W. Multitemporal landcover investigations in a semi-arid mining environment: Coal fire areas in Northern China. In Proceedings of the Conference of the EARSeL Special Interest Group on Land Use and Land Cover, Dubrovnik, Croatia, 25–27 May 2004; pp. 47–57.
- Li, J.; Voight, S.; Kunzer, C.; Yang, B.; Zhang, J.; Zhang, Y.; Kong, B.; Zhange, S. The progress in detecting of coal fire on remote sensing the first result of the joint Sino-German research project on innovative technologies for exploration, extinction and monitoring of coal fires in North China. In Proceedings of the 2005 Dragon Symposium “Mid-Term Results”, Santorini, Greece, 27 June–1 July 2005; Volume 27.
- Yang, B.; Chen, Y.; Li, J.; Gong, A.; Kuenzer, C.; Zhang, J. Simple Normalization of Multi-temporal Thermal IR Data and Applied Research on the Monitoring of Typical Coal Fires in Northern China; Beijing Normal University: Beijing, China, 2005. [Google Scholar]
- Chen, Y.; Jing, L.; Bo, Y.; Shi, P.; Zhang, S. Detection of coal fire location and change based on multi-temporal thermal remotely sensed data and field measurements. Int. J. Remote Sens. 2007, 28, 3173–3179. [Google Scholar] [CrossRef]
- Jiang, W.; Wu, J.; Gu, L.; Liu, X.; Li, X. Change monitoring in Wuda Coalfield fire area based on remote sensing. J. China Coal Soc. 2010, 35, 964–968. (In Chinese) [Google Scholar]
- Peng, S.; Zhang, J. Coal Bearing Strata Sedimentary Environment and its Influence in the Wuda Coal Mining Area; Mining Coal Industry Publishing House: Beijing, China, 1995. (In Chinese) [Google Scholar]
- Yu, Z.; Li, F.; Tian, F.; Sun, T.; Du, X. The influence of NDVI for land surface temperature retrieval from Landsat 5 in the Wuda District, China. In Proceedings of the 2012 Second International Conference on Electric Information and Control Engineering (ICEICE), Lushan, China, 6–8 April 2012; Volume 7, pp. 5396–5404.
- China Coal Information Research Institute, State Administration of Coal Mine Safety. China Coal Industry Yearbook (2001–2011); China Coal Industry Publishing House: Beijing, China, 2002–2012. (In Chinese) SACMS (2001 to 2011) [Google Scholar]
- Zhang, Y.; Shi, W. Shenhua Wuhai Energy: Mortality Rate Per Million Tons Declined to Zero. Inner Mongolia Daily for 5 January 2013, the Third Page. Available online: http://szb.northnews.cn/nmgrb/page/52/2013-01-05/03/57071357354841420.pdf (accessed on 20 May 2015). (In Chinese)
- Young, S.J.; Johnson, B.R.; Hackwell, J.A. An in-scene method for atmospheric compensation of thermal hyperspectral data. J. Geophys. Res.: Atmos. 2002, 107. [Google Scholar] [CrossRef]
- DiStasio, R.J., Jr.; Resmini, R.G. Atmospheric compensation of thermal infrared hyperspectral imagery with the emissive empirical line method and the in-scene atmospheric compensation algorithms: A comparison. In Proceedings Algorithms and technologies for multispectral, hyperspectral, and ultraspectral imagery XVI, Orlando, Florida, USA, 12 May 2010.
- Sobrino, J.A.; Li, Z.L.; Soria, G.; Jiménez, J.C. Land surface temperature and emissivity retrieval from remote sensing data. Recent Res. Dev. Geophys. 2002, 4, 21–44. [Google Scholar]
- Dash, P.; Göttsche, F.-M.; Olesen, F.-S.; Fischer, H. Land surface temperature and emissivity estimation from passive sensor data: Theory and practice-current trends. Int. J. Remote Sens. 2002, 23, 2563–2594. [Google Scholar] [CrossRef]
- Kerr, Y.H.; Lagouarde, J.P.; Nerry, F.; Ottlé, C. Land surface temperature retrieval techniques and applications. In Thermal remote sensing in land surface processes; CRC Press: Boston, MA, USA, 2004; pp. 33–109. [Google Scholar]
- Ottlé, C.; Vidal-Madjar, D. Estimation of land surface temperature with NOAA9 data. Remote Sens. Environ. 1992, 40, 27–41. [Google Scholar] [CrossRef]
- Prata, A.J. Land surface temperatures derived from the advanced very high resolution radiometer and the along-track scanning radiometer: 1. Theory. J. Geophys. Res.: Atmos. 1993, 98, 16689–16702. [Google Scholar] [CrossRef]
- Sobrino, J.A.; Cuenca, J. Angular variation of thermal infrared emissivity for some natural surfaces from experimental measurements. Appl. Opt. 1999, 38, 3931–3936. [Google Scholar] [CrossRef] [PubMed]
- Kahle, A.B.; Madura, D.P.; Soha, J.M. Middle infrared multispectral aircraft scanner data: Analysis for geological applications. Appl. Opt. 1980, 19, 2279–2290. [Google Scholar] [CrossRef] [PubMed]
- Gillespie, A.R. Lithologic mapping of silicate rocks using TIMS. In Proceedings of the Thermal Infrared Multispectral Scanner (TIMS) Data Users' Workshop, Pasadena, CA, USA, 1 November 1986; pp. 29–44.
- Kealy, P.S.; Gabell, A.R. Estimation of emissivity and temperature using alpha coefficients. In Proceedings of the 2nd Thermal Infrared Multispectral Scanner (TIMS) Workshop, Pasadena, CA, USA, 6 June 1990; pp. 11–15.
- Becker, F.; Li, Z.L. Temperature-independent spectral indices in thermal infrared bands. Remote Sens. Environ. 1990, 32, 17–33. [Google Scholar] [CrossRef]
- Watson, K. Spectral ratio method for measuring emissivity. Remote Sens. Environ. 1992, 42, 113–116. [Google Scholar] [CrossRef]
- Gillespie, A.; Rokugawa, S.; Matsunaga, T.; Cothern, J.S.; Hook, S.; Kahle, A.B. A temperature and emissivity separation algorithm for advanced spaceborne thermal emission and reflection radiometer (aster) images. IEEE Trans. Geosci. Remote Sens. 1998, 36, 1113–1126. [Google Scholar] [CrossRef]
- Soille, P. Morphological Image Analysis: Principles and Applications; Springer-Verlag Inc.: New York, NY, USA, 2003. [Google Scholar]
- Thinning. Available online: http://homepages.inf.ed.ac.uk/rbf/HIPR2/thin.htm (accessed on 20 May 2015).
- Wessling, S.; Kuenzer, C.; Kessels, W.; Wuttke, M.W. Numerical modeling for analyzing thermal surface anomalies induced by underground coal fires. Int. J. Coal Geol. 2008, 74, 175–184. [Google Scholar] [CrossRef]
- Du, X.; Cao, D.; Yang, G. Estimating typical four-season thermal distribution and self-adaptive gradient based thresholding parameters over coal fire areas in China using ASTERand LDCM TIRS-a case study in the Wuda Coalfield, China. In Proceeding of the ASPRS 2014 Conferennce, Louisville, KY, USA, 23–28 March 2014.
- Kong, B.; Ma, J.; Chen, H.; Zhang, X. The application of 3S technology to assessment of the flood risk in the Wuda Coal Mine, Inner Mongolia. Remote Sens. Land Resour. 2010, 2, 80–85. (In Chinese) [Google Scholar]
- Du, X.; Peng, S.; Wang, H.; Bernardes, S.; Yang, G.; Li, Z. Annual change detection by ASTER TIR data and an estimation of the annual coal loss and CO2 emission from coal seams spontaneous combustion. Remote Sens. 2015, 7, 319–341. [Google Scholar] [CrossRef]
© 2015 by the authors; licensee MDPI, Basel, Switzerland. This article is an open access article distributed under the terms and conditions of the Creative Commons Attribution license (http://creativecommons.org/licenses/by/4.0/).
Share and Cite
Du, X.; Cao, D.; Mishra, D.; Bernardes, S.; Jordan, T.R.; Madden, M. Self-Adaptive Gradient-Based Thresholding Method for Coal Fire Detection Using ASTER Thermal Infrared Data, Part I: Methodology and Decadal Change Detection. Remote Sens. 2015, 7, 6576-6610. https://doi.org/10.3390/rs70606576
Du X, Cao D, Mishra D, Bernardes S, Jordan TR, Madden M. Self-Adaptive Gradient-Based Thresholding Method for Coal Fire Detection Using ASTER Thermal Infrared Data, Part I: Methodology and Decadal Change Detection. Remote Sensing. 2015; 7(6):6576-6610. https://doi.org/10.3390/rs70606576
Chicago/Turabian StyleDu, Xiaomin, Daiyong Cao, Deepak Mishra, Sergio Bernardes, Thomas R. Jordan, and Marguerite Madden. 2015. "Self-Adaptive Gradient-Based Thresholding Method for Coal Fire Detection Using ASTER Thermal Infrared Data, Part I: Methodology and Decadal Change Detection" Remote Sensing 7, no. 6: 6576-6610. https://doi.org/10.3390/rs70606576
APA StyleDu, X., Cao, D., Mishra, D., Bernardes, S., Jordan, T. R., & Madden, M. (2015). Self-Adaptive Gradient-Based Thresholding Method for Coal Fire Detection Using ASTER Thermal Infrared Data, Part I: Methodology and Decadal Change Detection. Remote Sensing, 7(6), 6576-6610. https://doi.org/10.3390/rs70606576