Article

Exploring the Vertical Distribution of Structural Parameters and Light Radiation in Rice Canopies by the Coupling Model and Remote Sensing

Jiangsu Key Laboratory for Information Agriculture, National Engineering and Technology Center for Information Agriculture, Nanjing Agricultural University, Nanjing 210095, China
*
Author to whom correspondence should be addressed.
Remote Sens. 2015, 7(5), 5203-5221; https://doi.org/10.3390/rs70505203
Submission received: 1 March 2015 / Revised: 16 April 2015 / Accepted: 20 April 2015 / Published: 24 April 2015
(This article belongs to the Special Issue Recent Advances in Remote Sensing for Crop Growth Monitoring)

Abstract

:
Canopy structural parameters and light radiation are important for evaluating the light use efficiency and grain yield of crops. Their spatial variation within canopies and temporal variation over growth stages could be simulated using dynamic models with strong application and predictability. Based on an optimized canopy structure vertical distribution model and the Beer-Lambert law combined with hyperspectral remote sensing (RS) technology, we established a new dynamic model for simulating leaf area index (LAI), leaf angle (LA) distribution and light radiation at different vertical heights and growth stages. The model was validated by measuring LAI, LA and light radiation in different leaf layers at different growth stages of two different types of rice (Oryza sativa L.), i.e., japonica (Wuxiangjing14) and indica (Shanyou63). The results show that the simulated values were in good agreement with the observed values, with an average RRMSE (relative root mean squared error) between simulated and observed LAI and LA values of 14.75% and 21.78%, respectively. The RRMSE values for simulated photosynthetic active radiation (PAR) transmittance and interception rates were 14.25% and 9.22% for Wuxiangjing14 and 15.71% and 4.40% for Shanyou63, respectively. In addition, the corresponding RRMSE values for red (R), green (G) and blue (B) radiation transmittance and interception rates were 16.34%, 15.96% and 15.36% for Wuxiangjing14 and 5.75%, 8.23% and 5.03% for Shanyou63, respectively. The results indicate that the model performed well for different rice cultivars and under different cultivation conditions.

Graphical Abstract

1. Introduction

Crop canopy structure depends on the crop’s genetic characteristics and its physiological and biochemical processes, as well as its planting pattern and growth status. As crop canopies represent an integrated photosynthetic and matter production system, the structure of a crop canopy plays an important role in its function [1]. Canopy structure, which is directly related to the ability of within-canopy light interception, is the most important factor influencing light radiation distribution and light use efficiency [2]. Leaf angle (LA) and leaf area index (LAI) distribution are the principle factors that determine light radiance distribution and leaf physiological characteristic in crop canopies [3,4]. Employing crop varieties with compact plant types is beneficial for improving middle and bottom canopy light conditions, which enhances light use efficiency. Developing quantitative models of crop canopy structure is an important aspect of light energy use and balance research [5,6].
The simulation of canopy light distribution is based on the simulation of canopy structure parameters, such as the number of leaves characterized by the LAI and the distribution of leaves characterized by the leaf inclination angle. Since Monsi and Saeki [7] first applied the Beer–Lambert law describing the random distribution of light in a medium to predict light transmission in the plant canopy, many studies have focused on modeling canopy light transmission in crops, such as wheat, rice, maize and cotton [8,9,10]. The most classical approach is to utilize the extinction coefficient (K) and cumulative LAI values to simulate vertical light distribution in the crop canopy, when the larger LAI, the larger K under the same conditions and the canopy intercepted more sunlight. K values are affected by many other factors, such as structural parameters and solar elevation angle [11]. Some researchers calculated extinction coefficients through the function of canopy projected area (G) [12], while Nilson [13] and Ross [14] simulated the G function by determining the probability density function of the leaf angle, which downplays the relationship between canopy structure and K. Campbell [15] proposed a method that uses an elliptic function to describe leaf angle probability density, while Verhoef [16] tried to use a linear combination of trigonometric functions to describe the probability density distribution of leaf angle. The rapid development of three dimensional (3D) graphics technology and virtual simulation technology has led to the development of a plant canopy radiation distribution model for accurate simulation within the 3D space using irradiance and ray tracing techniques [17,18]. To date, few studies have focused on the characteristics of radiation transfer in the canopy and on modeling its spatial and temporal distribution. Several published studies have neglected the inhomogeneity of crop canopy level distribution and the differences in different wavelength radiation [8,10]. Moreover, the derivation of developing models is particularly complicated, and it is difficult to obtain input parameters, especially when simulating the intensity of radiation at different canopy heights. These problems have restricted the simulation accuracy of crop canopy light distribution and photosynthetic production [2]. In rice, two questions arise in this respect: first, how can Lambert-Beer’s law be expanded to account for radiation at different canopy heights of rice, and second, where do radiative transfer differences occur between different wavelength radiations.
To this end, dedicated experiments were established, which contained two rice varieties of high yield with different morphologies and varied planting densities and nitrogen rates. The objective of this study was to develop a novel dynamic model for simulating the spatial and temporal distribution characteristics of LAI, LA and light radiation by the coupling model and remote sensing. As a precise, nondestructive and rapid method, hyperspectral remote sensing was used to estimate agronomic parameters, such as LAI [11,19,20]. This anticipated outcome would help to improve the understanding of yield formation and to identify key structural parameters for rice breeding programs.

2. Materials and Methods

2.1. Experiments

Two rice (Oryza sativa L.) field experiments were conducted to test the performance of the dynamic models developed in this study. These experiments involved different cultivars, planting densities and nitrogen fertilization rates during different years (Table 1), as described below.
Table 1. Treatment and sampling information. N1, Nitrogen Rate 1.
ExperimentYearSite LocationCultivarNitrogen Rate (kg∙ha−2)Planting DensitySampling DatePlanting Data
12012Rugao
120°19ʹE
32°14ʹN
Wuxiangjing14 (WXJ14, V1)
Shanyou63
(SY63, V2)
150 (N1)
250 (N2)
350 (N4)
22.2 plants/m2 (D1)
13.3 plants/m2 (D2)
7/22, 8/6, 8/19
8/30, 9/15, 9/24
6/18
22013Rugao
120°19ʹE
32°14ʹN
Wuxiangjing14 (WXJ14, V1)
Shanyou63
(SY63, V2)
150 (N1)
300 (N3)
22.2 plants/m2 (D1)
13.3 plants/m2 (D2)
7/9, 7/19, 7/30
8/8, 8/18, 8/30
9/10, 9/17
6/21
Experiment 1 was conducted in 2012 at the Rugao experiment station of the national engineering and technology center for information agriculture, Nantong city, China (120°19′E, 32°14′N). Two rice cultivars, japonica (Wuxiangjing14, V1, with inclined leaves) and indica (Shanyou63, V2, with erect leaves), were sown on 18 May and transplanted on 18 June with row and plant spacings of 30 cm and 15 cm (D1) and 50 cm and 15 cm (D2), respectively. The plot area was 42 m2, and the plots were 7 m long and 6 m wide. Three nitrogen (N) fertilization rates (150 (N1), 250 (N2) and 350 (N4) kg N∙ha−1) were applied in the form of urea at a rate of 50% at preplanting, 10% at tillering, 20% at panicle initiation and 20% at spikelet initiation. For all treatments, 135 kg∙ha−1 P2O5 (as monocalcium phosphate (Ca(H2PO4)2)) and 190 kg∙ha−1 K2O (as KCl) were applied prior to transplanting. The experiment employed a two-way factorial arrangement of treatments within a randomized complete block design with three replications.
Experiment 2 was conducted in 2013 using the same cultivars and location as Experiment 1. The cultivars were sown on 19 May and transplanted on 21 June with row and plant spacings of 30 cm and 15 cm (D1) and 50 cm and 15 cm (D2), respectively. The plot area was 30 m2, with plots 6 m long and 5 m wide. Two N rates (150 (N1) and 300 (N3) kg N∙ha−1) were applied in the form of urea at a rate of 40% at preplanting, 10% at tillering, 20% at panicle initiation and 30% at spikelet initiation. Phosphate and potassium fertilizers were applied as described for Experiment 1.
In these experiments, different N rates and application times in different experiments were conducted according to basal soil fertility, the growth status of rice and the weather during various growth periods. Pest management and other management procedures follow.

2.2. Spectral Measurements of Canopy Leaves

Canopy reflectance values were acquired with A FieldSpec 3 (Analytical Spectral Devices, Boulder, CO, USA). This instrument recorded reflectance between 350 and 1000 nm, with a sampling interval of 1.40 nm and a resolution of 3 nm, and reflectance between 1000 and 2500 nm, with a sampling interval of 2 nm and a resolution of 10 nm. The spectroradiometer, with a 25° field of view (FOV), was positioned 1 m above the rice canopy. The radiance was measured at five positions within each plot to cover the entire plot and to characterize variability. Three scans were performed for each position and averaged to produce the final canopy spectra, and the average of five positions was used as the measurement for the plot. All spectral measurements were performed during cloud-free periods at midday (between 10:00 and 14:00). A white Spectralon reference panel (Labsphere, North Sutton, NH, USA) was used under the same illumination conditions to convert the spectral radiance measurements to reflectance.
Figure 1. Sketch map for measuring irradiance in the rice canopy.
Remotesensing 07 05203 g001

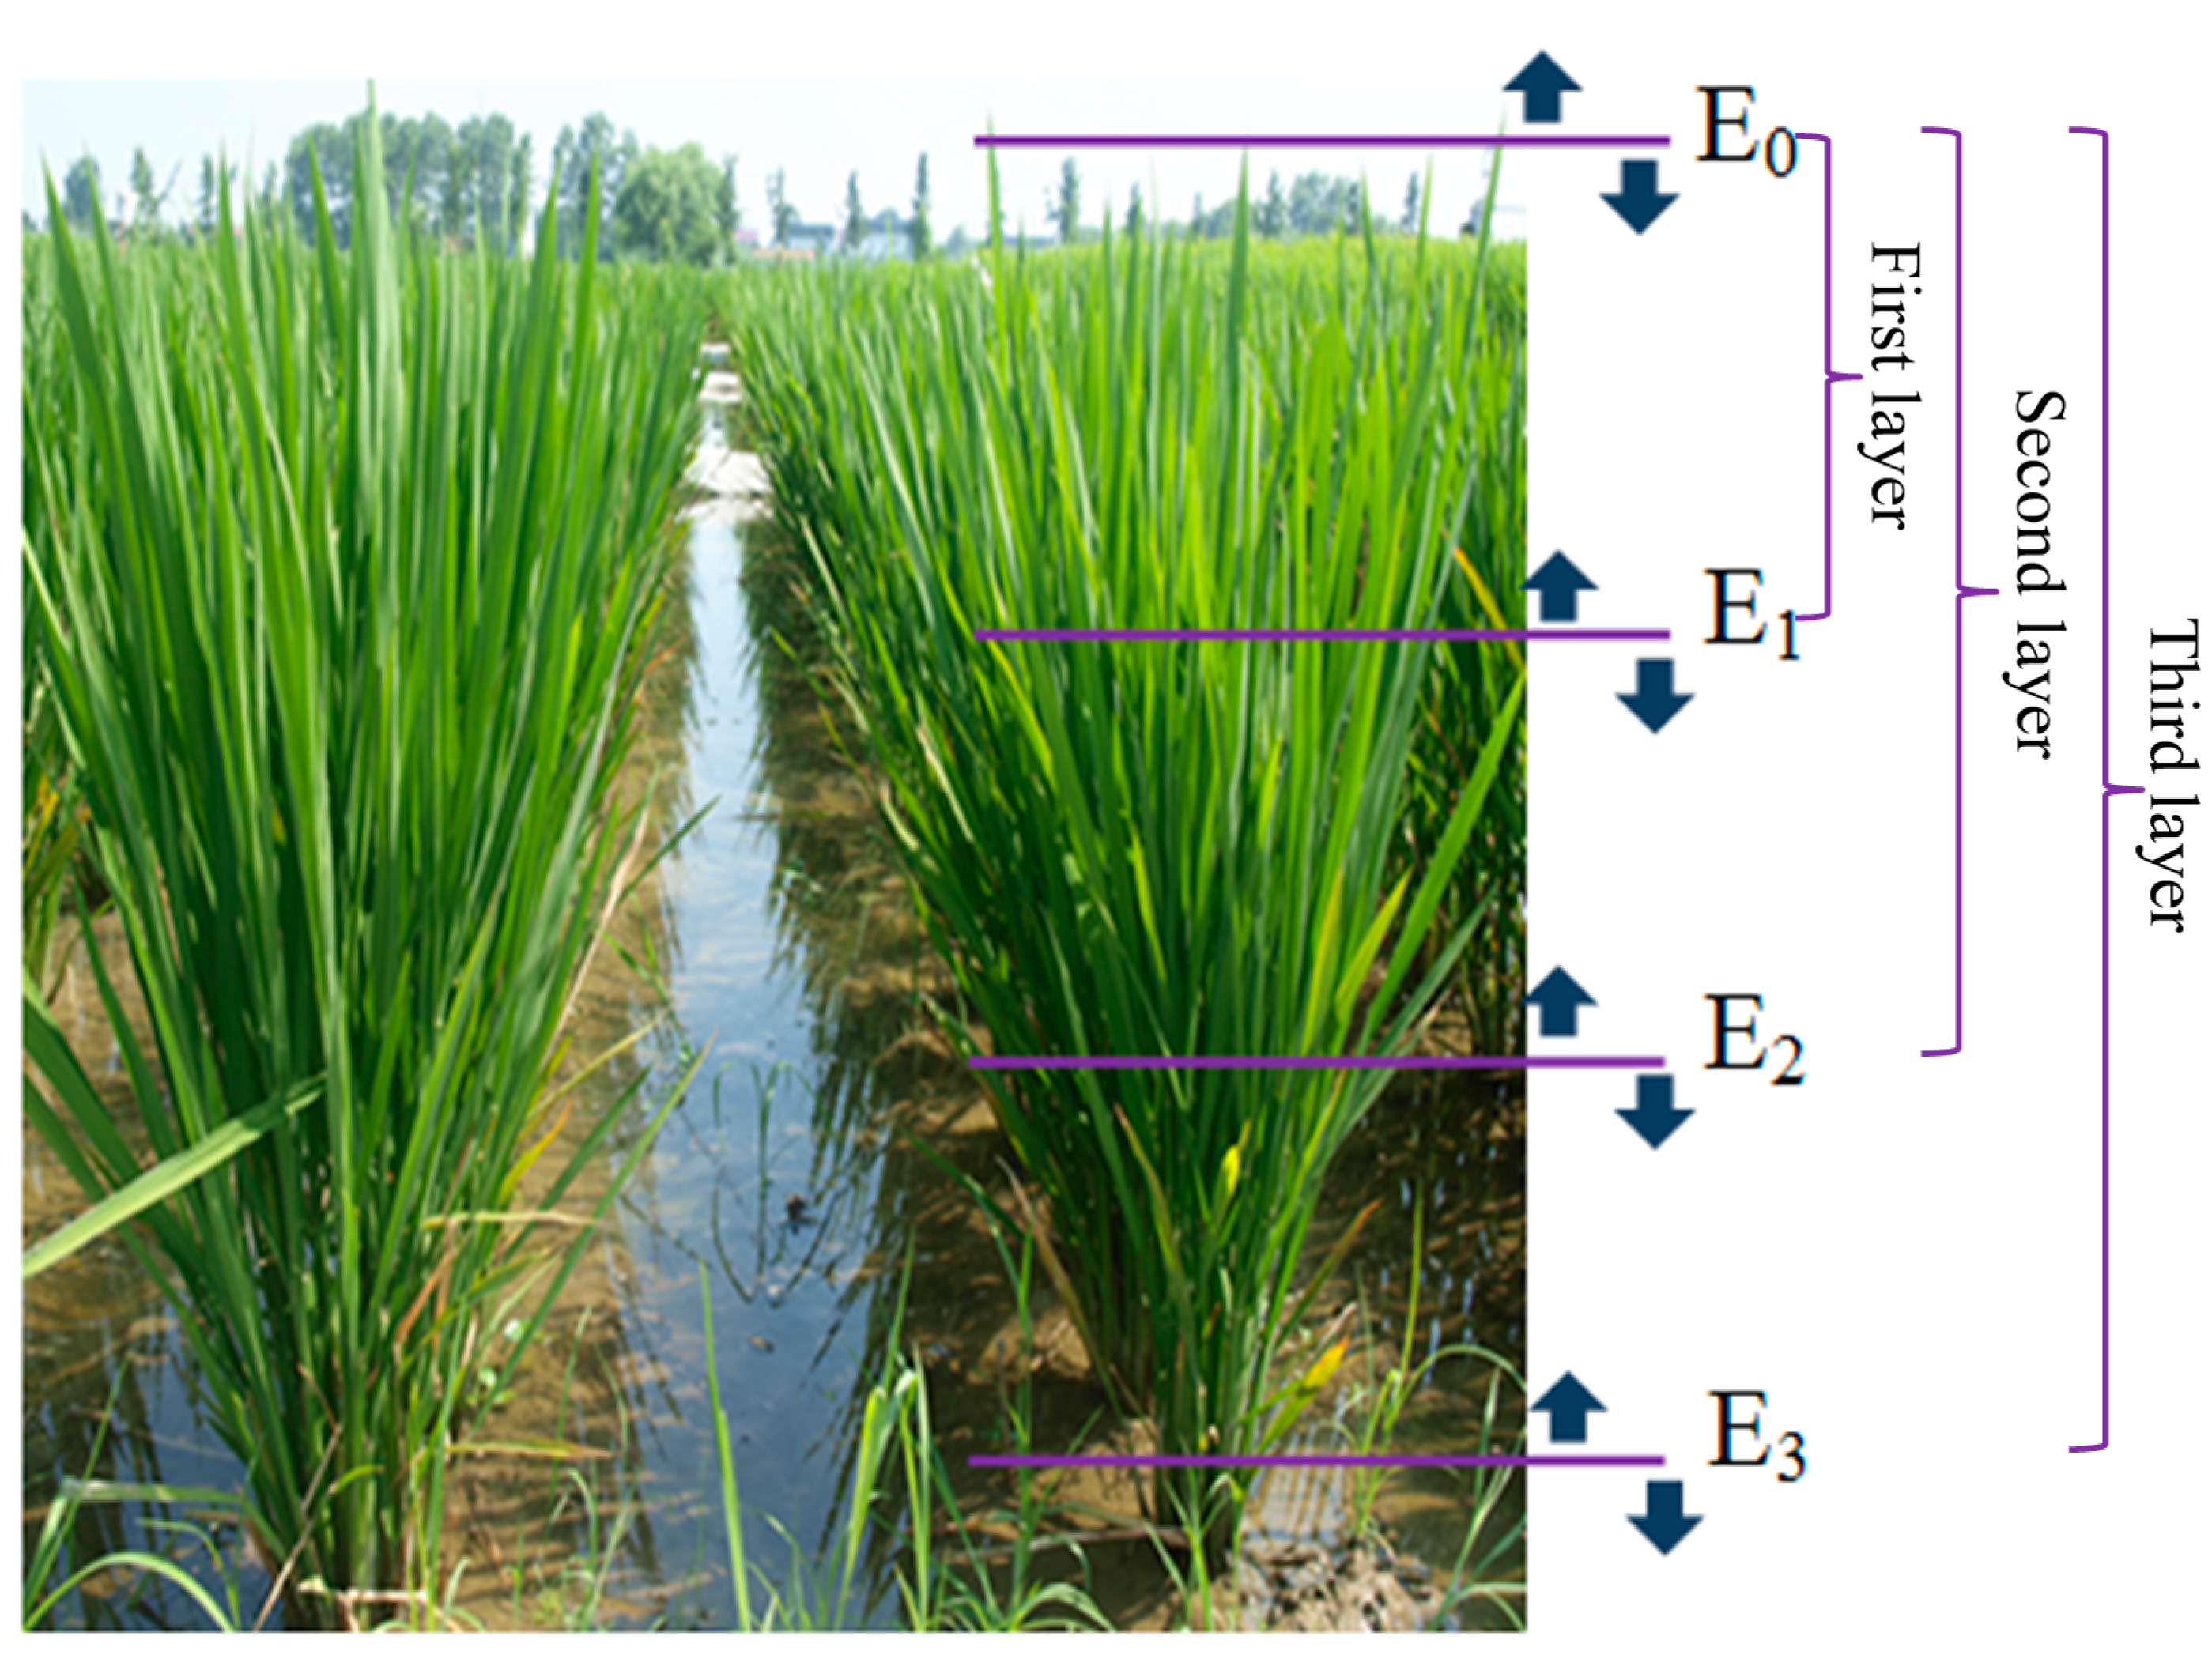
2.3. Irradiance Measurements

The spectroradiometer (FieldSpec 3) and its cosine correctors were used to measure the vertical downward and upward irradiance (W∙m−2∙nm−1) at three different rice canopy observation depths (rice canopy depth was averaged and divided into three layers; Figure 1). The irradiance was measured at five positions within each plot. Three scans were performed for each position and averaged to produce the final canopy irradiance, and the average of five positions was used as the measurement for the plot. The transmittance and interception of each canopy layer were calculated as follows [21]:
Interception of the i-th layer:
I i = ( E 0       E 0     E i   ) E 0  
Transmittance of the i-th layer:
T i = E i   E 0  
where E 0   is incident solar radiation of the top canopy (W∙m−2∙nm−1), E 0   is reflected solar radiation of the top canopy (W∙m−2∙nm−1) and E i   is incident solar radiation of the i-th layer (W∙m−2∙nm−1).

2.4. Determination of Agronomic Parameters

During the 2012 and 2013 growing seasons, repeated destructive samplings were carried out in each plot. After each measurement of canopy spectra and irradiance, three plants from each experimental plot were randomly selected to determine leaf area and leaf angle. For each sample, the plants were equally divided into three layers in the direction from the ground to the canopy top. The green leaves from each layer were separated from the stems and immediately scanned using an LI-3000A. Then, the leaf area (L) of each layer was obtained, and the LAI for each layer and each plot (the sum of different layers) was calculated. The LAI represents the product of the number of plants per square area surveyed in a field and the L. The L of 10 randomly-selected rice stems from each experimental plot was measured using an inclinometer, the leaf angle was averagely divided into 6 parts in the range of 0–90° in the natural state, and the curved leaves were divided into 3 parts for testing, which recorded the horizontal as 0°, measuring the leaf area of each leaf piece at the same time.

2.5. Meteorological Data

Meteorological data were collected by an automatic meteorological station (Dynamet, Bellevue, WA, USA) installed in the experimental field. The average temperature (°C) and photosynthetic active radiation energy (kW∙m−2) value per hour were recorded.

2.6. Calculation

2.6.1. Growing Degree Day Calculation

GDD (growing degree days) values were calculated as follows [22]:
G D D = ( T i T b )
where Ti is the average temperature throughout the experiment and Tb is the base temperature, which is usually set to 12 °C for rice.
Fitting analysis of the test data was performed using SPSS and Origin statistics software. Programming calculation and drawing were performed using MATLAB 7.11. Relative root mean square error (RRMSE) was used to calculate the fitness between the estimated and observed values [23] and to evaluate the overall performance of the model.

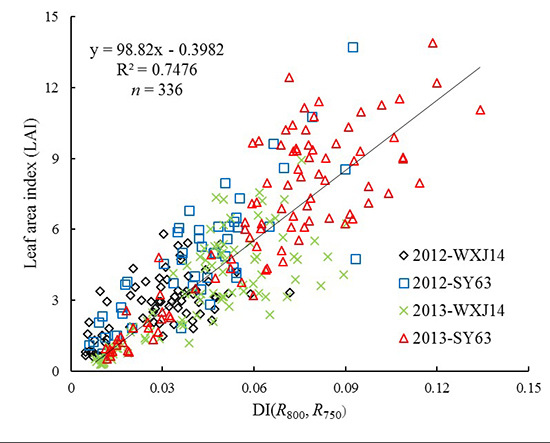
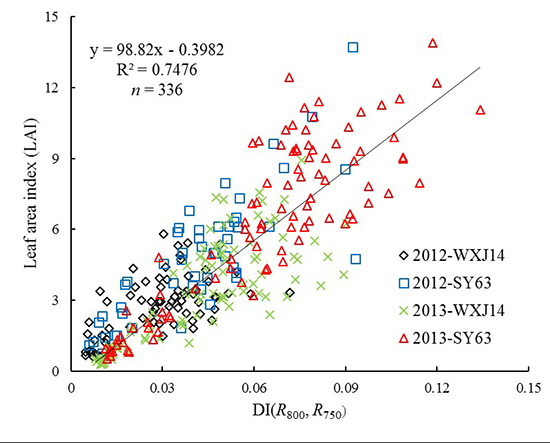
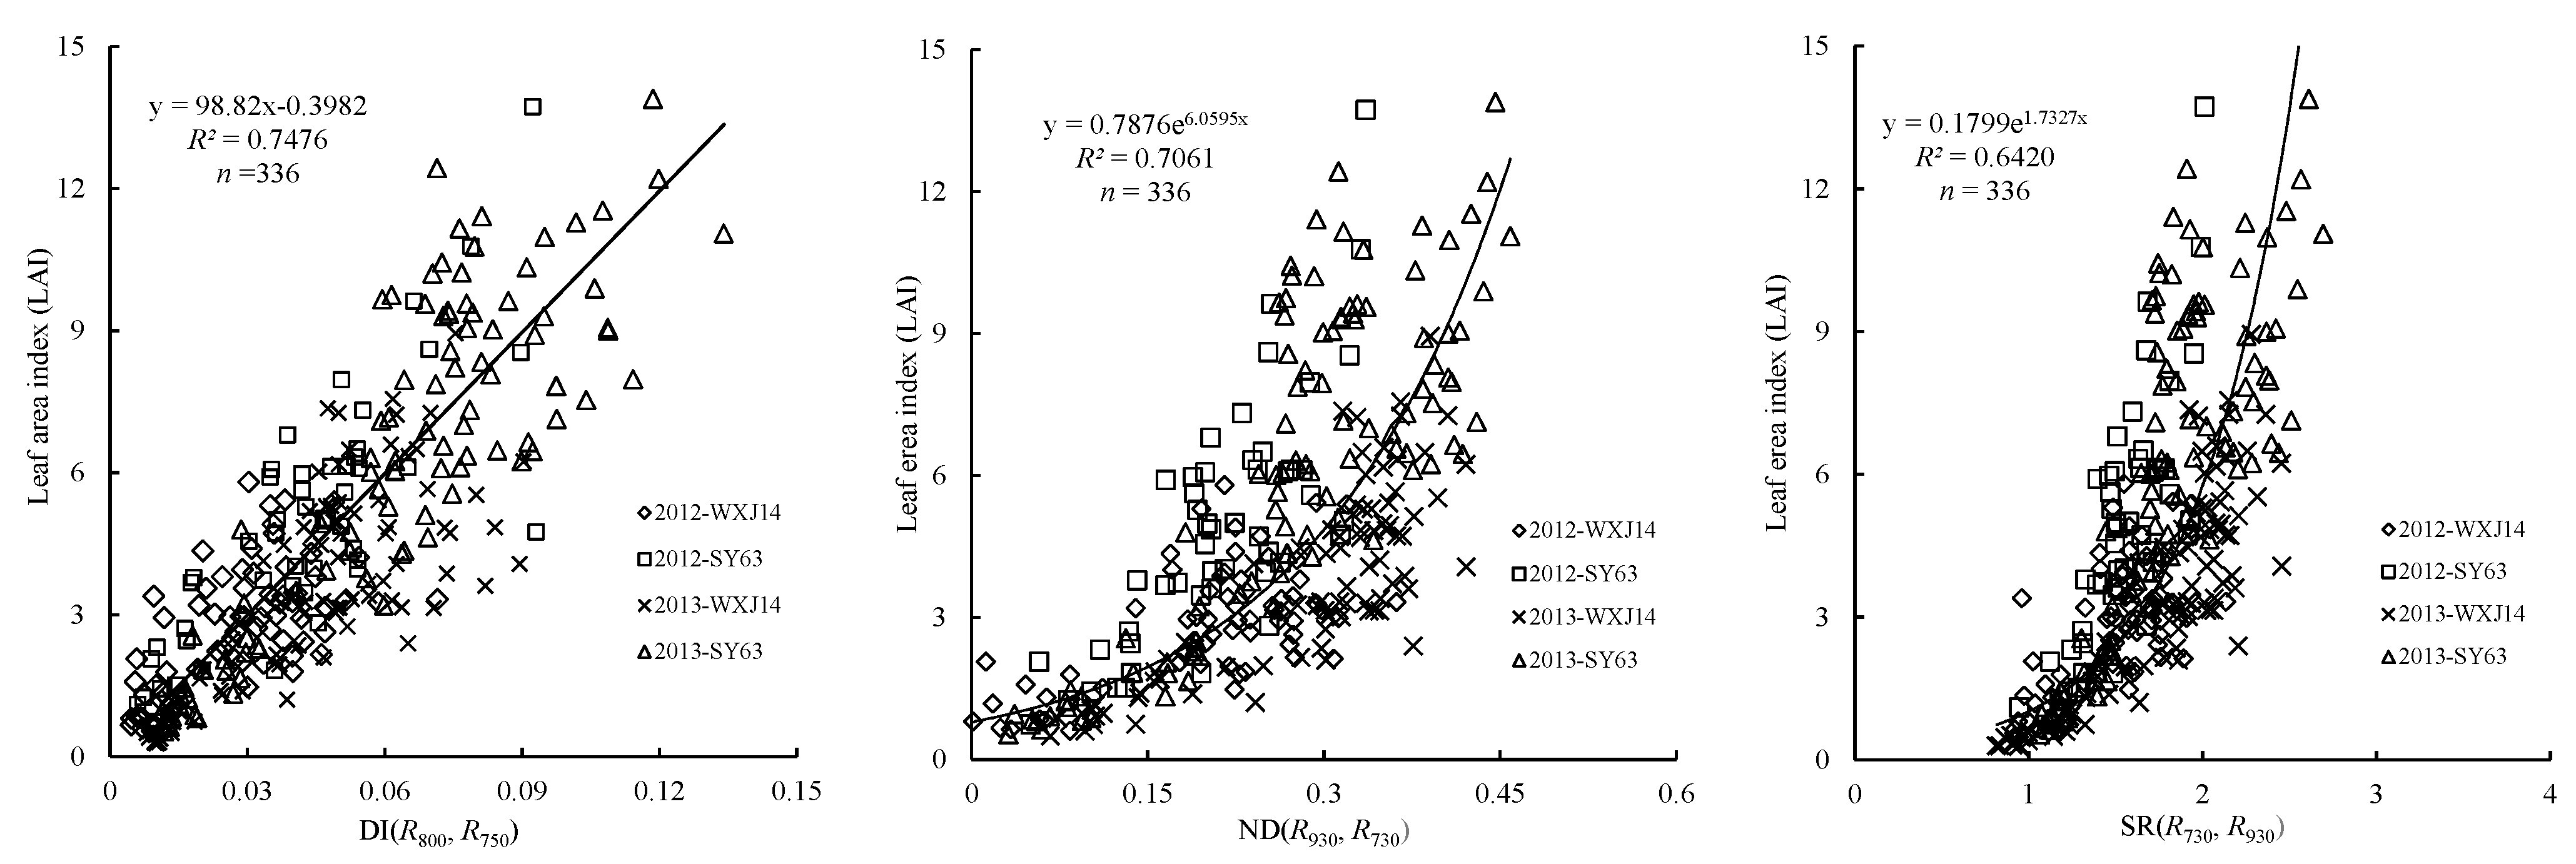
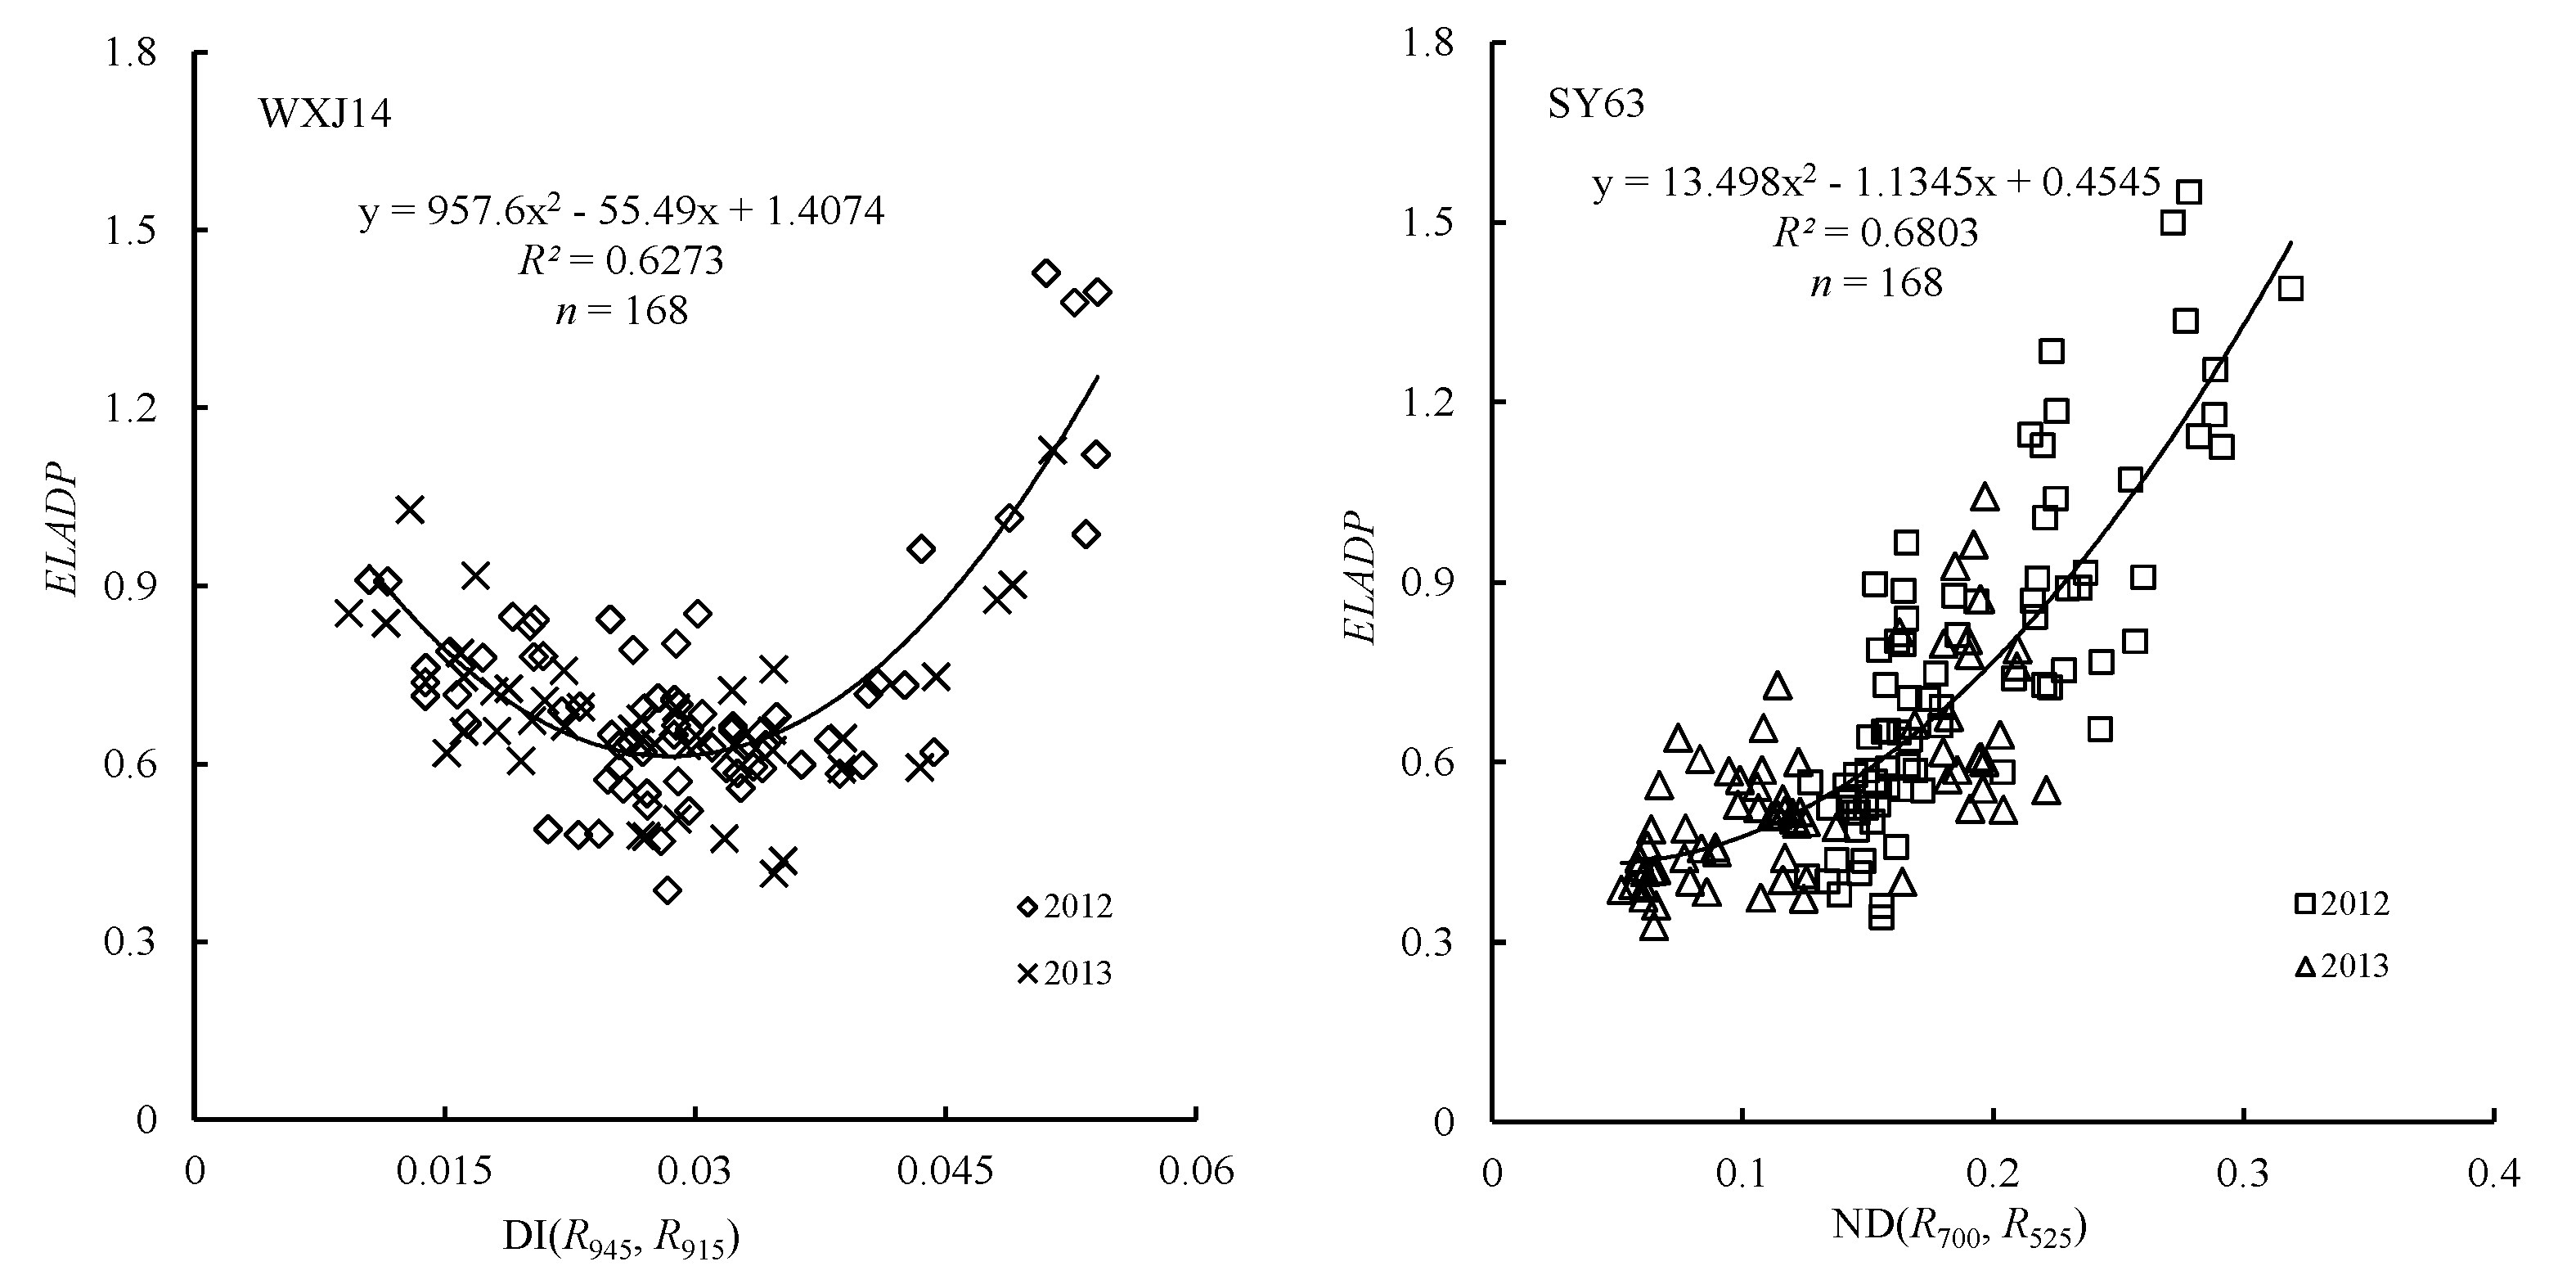
2.6.2. Spectral Index Calculation

In this study, three types of two-band indices were calculated: (1) normalized difference index (ND); (2) simple ratio index (SR); and (3) difference index (DI). These values were calculated using the original reflectance and the first derivative values from all available two-waveband (λ1 and λ2) combinations in the 350–2500 nm region to select the best two-band indices or the effective two-band combination regions for model parameter estimating. SR, ND and DI values were calculated as follows [24]:
SR  ( R λ 1 , R λ 2 ) = R λ 1 R λ 2
ND  ( R λ 1 , R λ 2 ) = | R λ 1 R λ 2 | R λ 1 + R λ 2
DI (Rλ1, Rλ2) = Rλ1 Rλ2

2.6.3. Leaf Area Index Vertical Distribution Model

The logistic model can be used to simulate the vertical distribution of rice leaf area index quite well, but it cannot be used to simulate dynamic changes in LAI vertical distribution during different growth stages [25]. In this study, using the canopy depth (h) parameter to modify the logistic model, a dynamic simulation model of the downward accumulation leaf area index in rice was built. The model is expressed as follows:
L A I ( h ) = L A I L A I 1 + b × e c   ( 1     h )
where h is the relative depth of top-downward accumulation in the rice canopy (whole canopy depth is set to 1, h ≤ 1), LAI is the leaf area index of the whole canopy and b, c are two structural adjustment parameters. Different b and c values represent different vertical structures, and greater b and c values mean less and more proportions of leaves under rice canopy, respectively. Thus, a vertical distribution dynamic model of rice canopy LAI was developed.

2.6.4. Leaf Angle Distribution Simulation Model

The leaf angle distribution function (LADF) is an important factor in describing canopy structure. In the radiation transfer theory (RT), leaf inclination angles and their distribution are key functions for solving RT problems in vegetative canopies. The ellipsoidal function [15] is based on the assumption that the canopy leaf area has inclination angles distributed parallel to the surface of a prolate or oblate ellipsoid. This function is described as:
f ( θ ) = 2 ( E L A D P ) 3 sin θ Λ [ cos 2 θ + ( E L A D P ) 2 sin 2 θ ] 2
where ELADP (the ellipsoidal leaf angle distribution parameter) is the ratio of the horizontal semi-axis length (l) to the vertical semi-axis length (a) of an ellipsoid, i.e., ELADP = l/a, where θ is the leaf inclination angle and Λ is a parameter defined by ELADP.
In this study, the canopy relative depth parameter h was added to the ellipsoid function model. Assuming that the canopy of downward accumulation relative depth h is an ellipsoid-structured layer, all values conform to the Campbell ellipsoid distribution function. We can calculate the horizontal semi-axis length (l) as l × 1 ( 1 - h ) 2 using the elliptic equations and the vertical semi-axis length (a) as a h ; the ELADPh. The new ellipsoidal functions are written as follows:
E L A D P h = l h a h = l × 1 ( 1 h ) 2 a h = 1 ( 1 h ) 2 h E L A D P
f ( θ ) = 2 ( E L A D P h ) 3 sin θ Λ [ cos 2 θ + ( E L A D P h ) 2 sin 2 θ ] 2
When ELADP = 1, the ellipsoidal distribution becomes spherical, and Λ = 2 . For vertical distributions, ELADPh < 1, and therefore:
Λ = E L A D P h + sin 1 ε ε
with:
ε = 1 [ a × h l × 1 ( 1 h ) 2 ] 2
Finally, when ELADPh > 1, the distribution is horizontal and:
Λ = E L A D P h + ln ( 1 + ε ) / ( 1 - ε ) 2 ε E L A D P h
with:
ε = 1 [ l × 1 ( 1 h ) 2 a × h ] 2

2.6.5. Rice Canopy Radiation Vertical Distribution Model

Nilson and Ross’s algorithm was employed, assuming uniform leaf azimuthal distribution [13,14]. The extinction coefficient K is calculated from the mean projection of unit leaf area on the plane perpendicular to the beam direction as follows:
K = G c o s ϕ
with:
G = 0 π 2 A ( θ , ϕ ) f ( θ ) d θ
and:
A ( θ , ϕ ) = { cos θ cos ϕ θ + ϕ π 2 cos θ cos ϕ [ 1 + 2 π ( tan δ δ ) ] θ + ϕ > π 2
δ = cos 1 ( cot θ cot ϕ )
Then, based on the Beer-Lambert law [7], the solar transmittance at the top-downward relative depth h can be calculated using the canopy structure parameters model and the extinction coefficient model; the equation is as follows:
T ( i , h ) = e L A I ( h )   ×   K ( i , h )
where T(i, h), k(i, h) is the transmittance and extinction coefficient of wavelength light i at the top-downward relative depth h. LAI(h) is LAI at the top-downward relative depth h.
Finally, the interception corresponding to transmittance is calculated as follows [26]:
f A P A R = 0.95 × ( 1 e K   ×   L A I )

3. Results

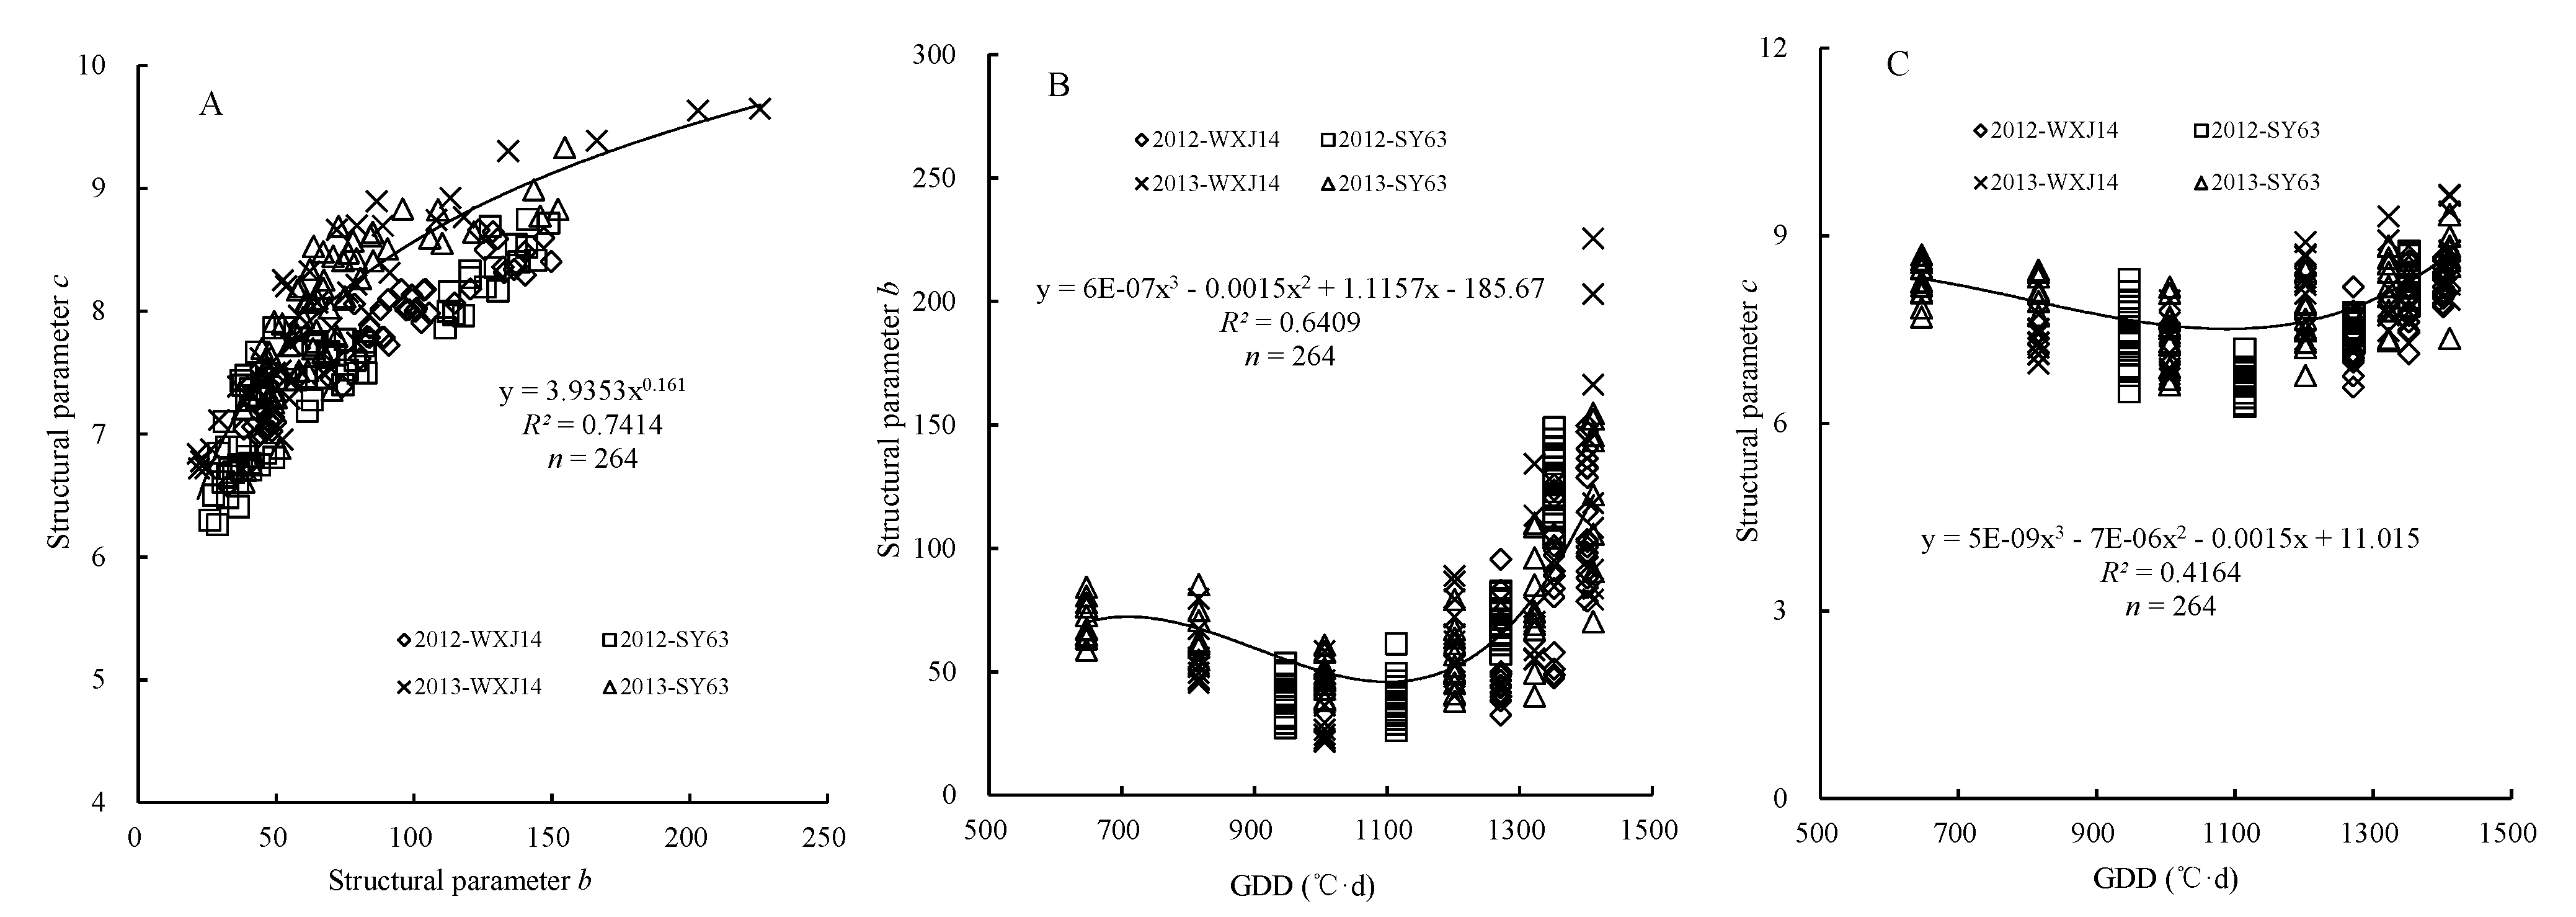
3.1. Determination Partial Model Parameters Using RS and GDD

In the LAI vertical distribution model (Formula 1), LAI was estimated by a hyperspectral vegetation index. The best two-band ND, SR and difference VIs for estimating LAI is plotted in Figure 2. LAI had a linear relationship with DI(R800, R750) and an exponential relation with ND(R930, R730) and SR(R730, R930). The differential spectral index DI(R800, R750) could best predict the LAI values of different rice varieties (japonica and indica) under different cultivation conditions (Figure 2). Moreover, ELADP values (Equation (4)) under different experimental conditions were estimated by using the measured canopy radiation transmission values and a nonlinear least squares fitting method. The quantitative relationships between ELADP and spectral indices (Figure 3) were also analyzed. The results show that the parameter ELADP could be successfully estimated by the hyperspectral vegetation index. However, different rice varieties had different optimal vegetation indices; the differential index DI(R945, R915) and normalized differential index ND(R700, R525) were used to develop corresponding monitoring models for ELADP estimation in japonica and indica rice, respectively (Figure 3).
Figure 2. Relationship between the canopy leaf area index and spectral index in rice.
Remotesensing 07 05203 g002
In addition, using data from two years of experiments to fit the LAI vertical distribution model, b was found to have significant correlation with c (Figure 4A); the parameters b and c could successfully be simulated by GDD (Figure 4). Canopy structure changes over time, and different canopy structure corresponds to varied b and c values; thus, the dynamic changes of the canopy structure can be calculated by GDD values.
Figure 3. Relationship between the ellipsoidal leaf angle distribution parameter (ELADP) and the spectral index in rice. DI, difference index; ND, normalized difference index.
Remotesensing 07 05203 g003
Figure 4. Relationship between rice canopy structure parameters b and c (A), growing degree days (GDD) and b (B), c (C).
Remotesensing 07 05203 g004

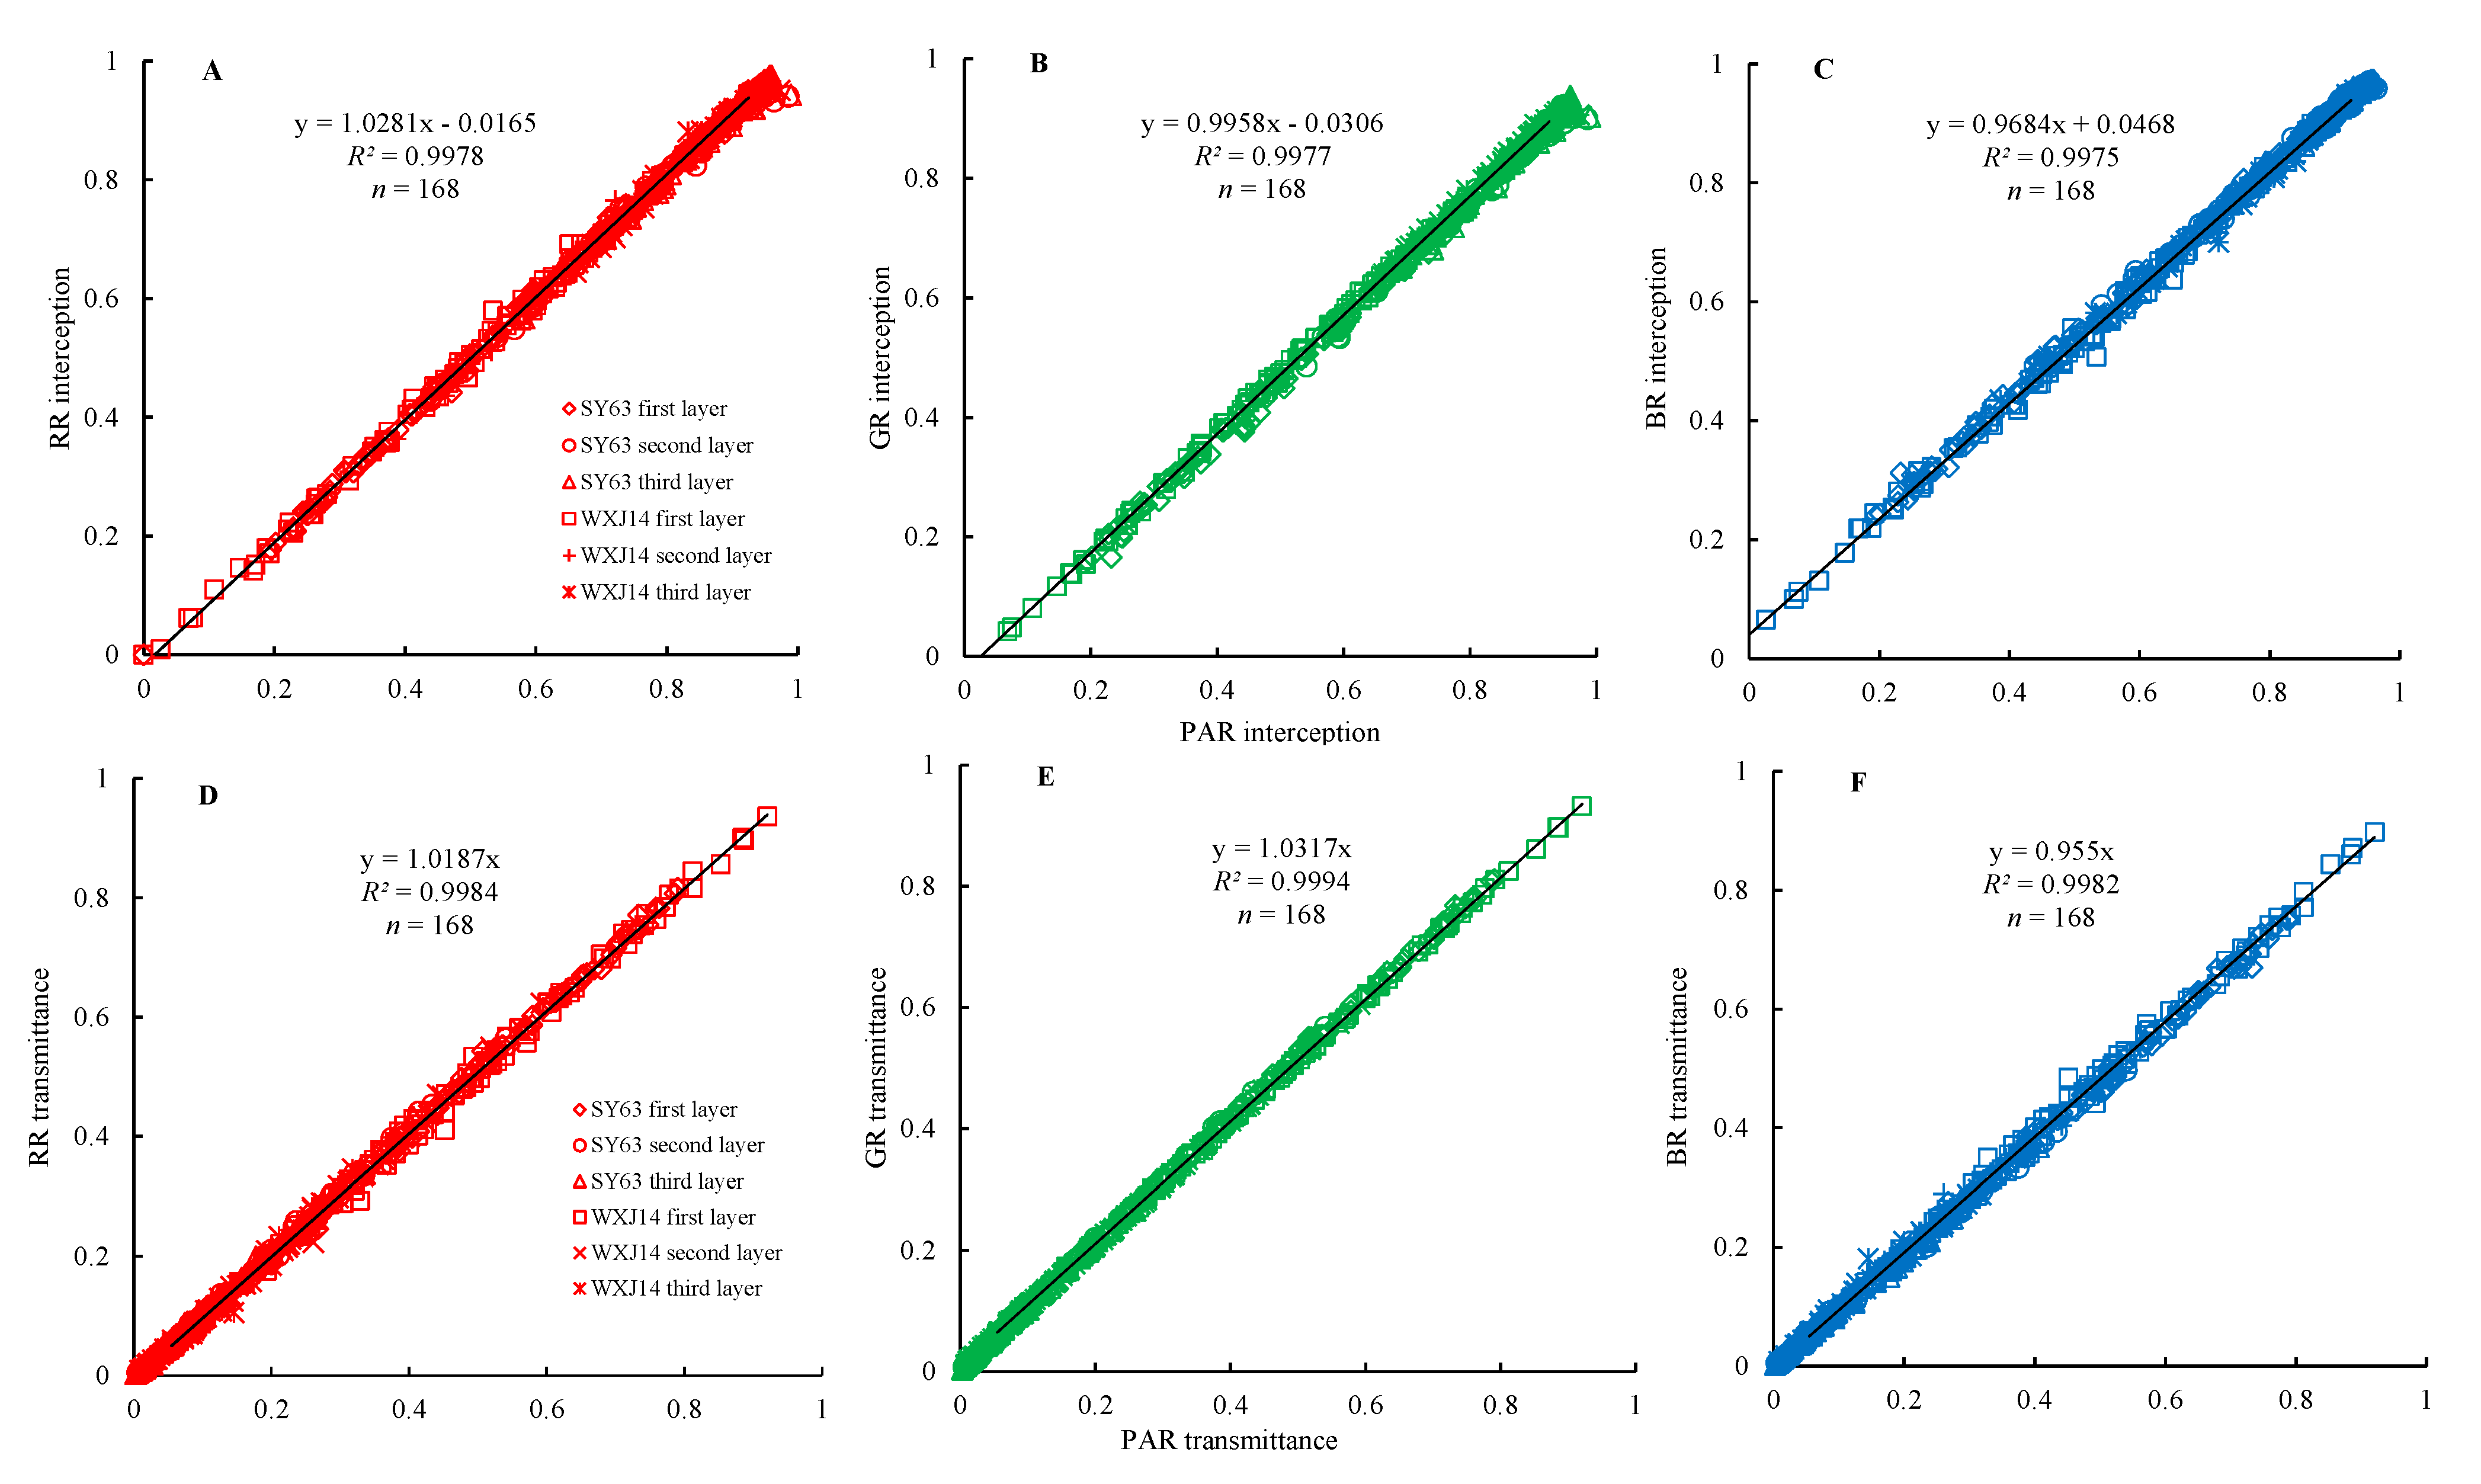
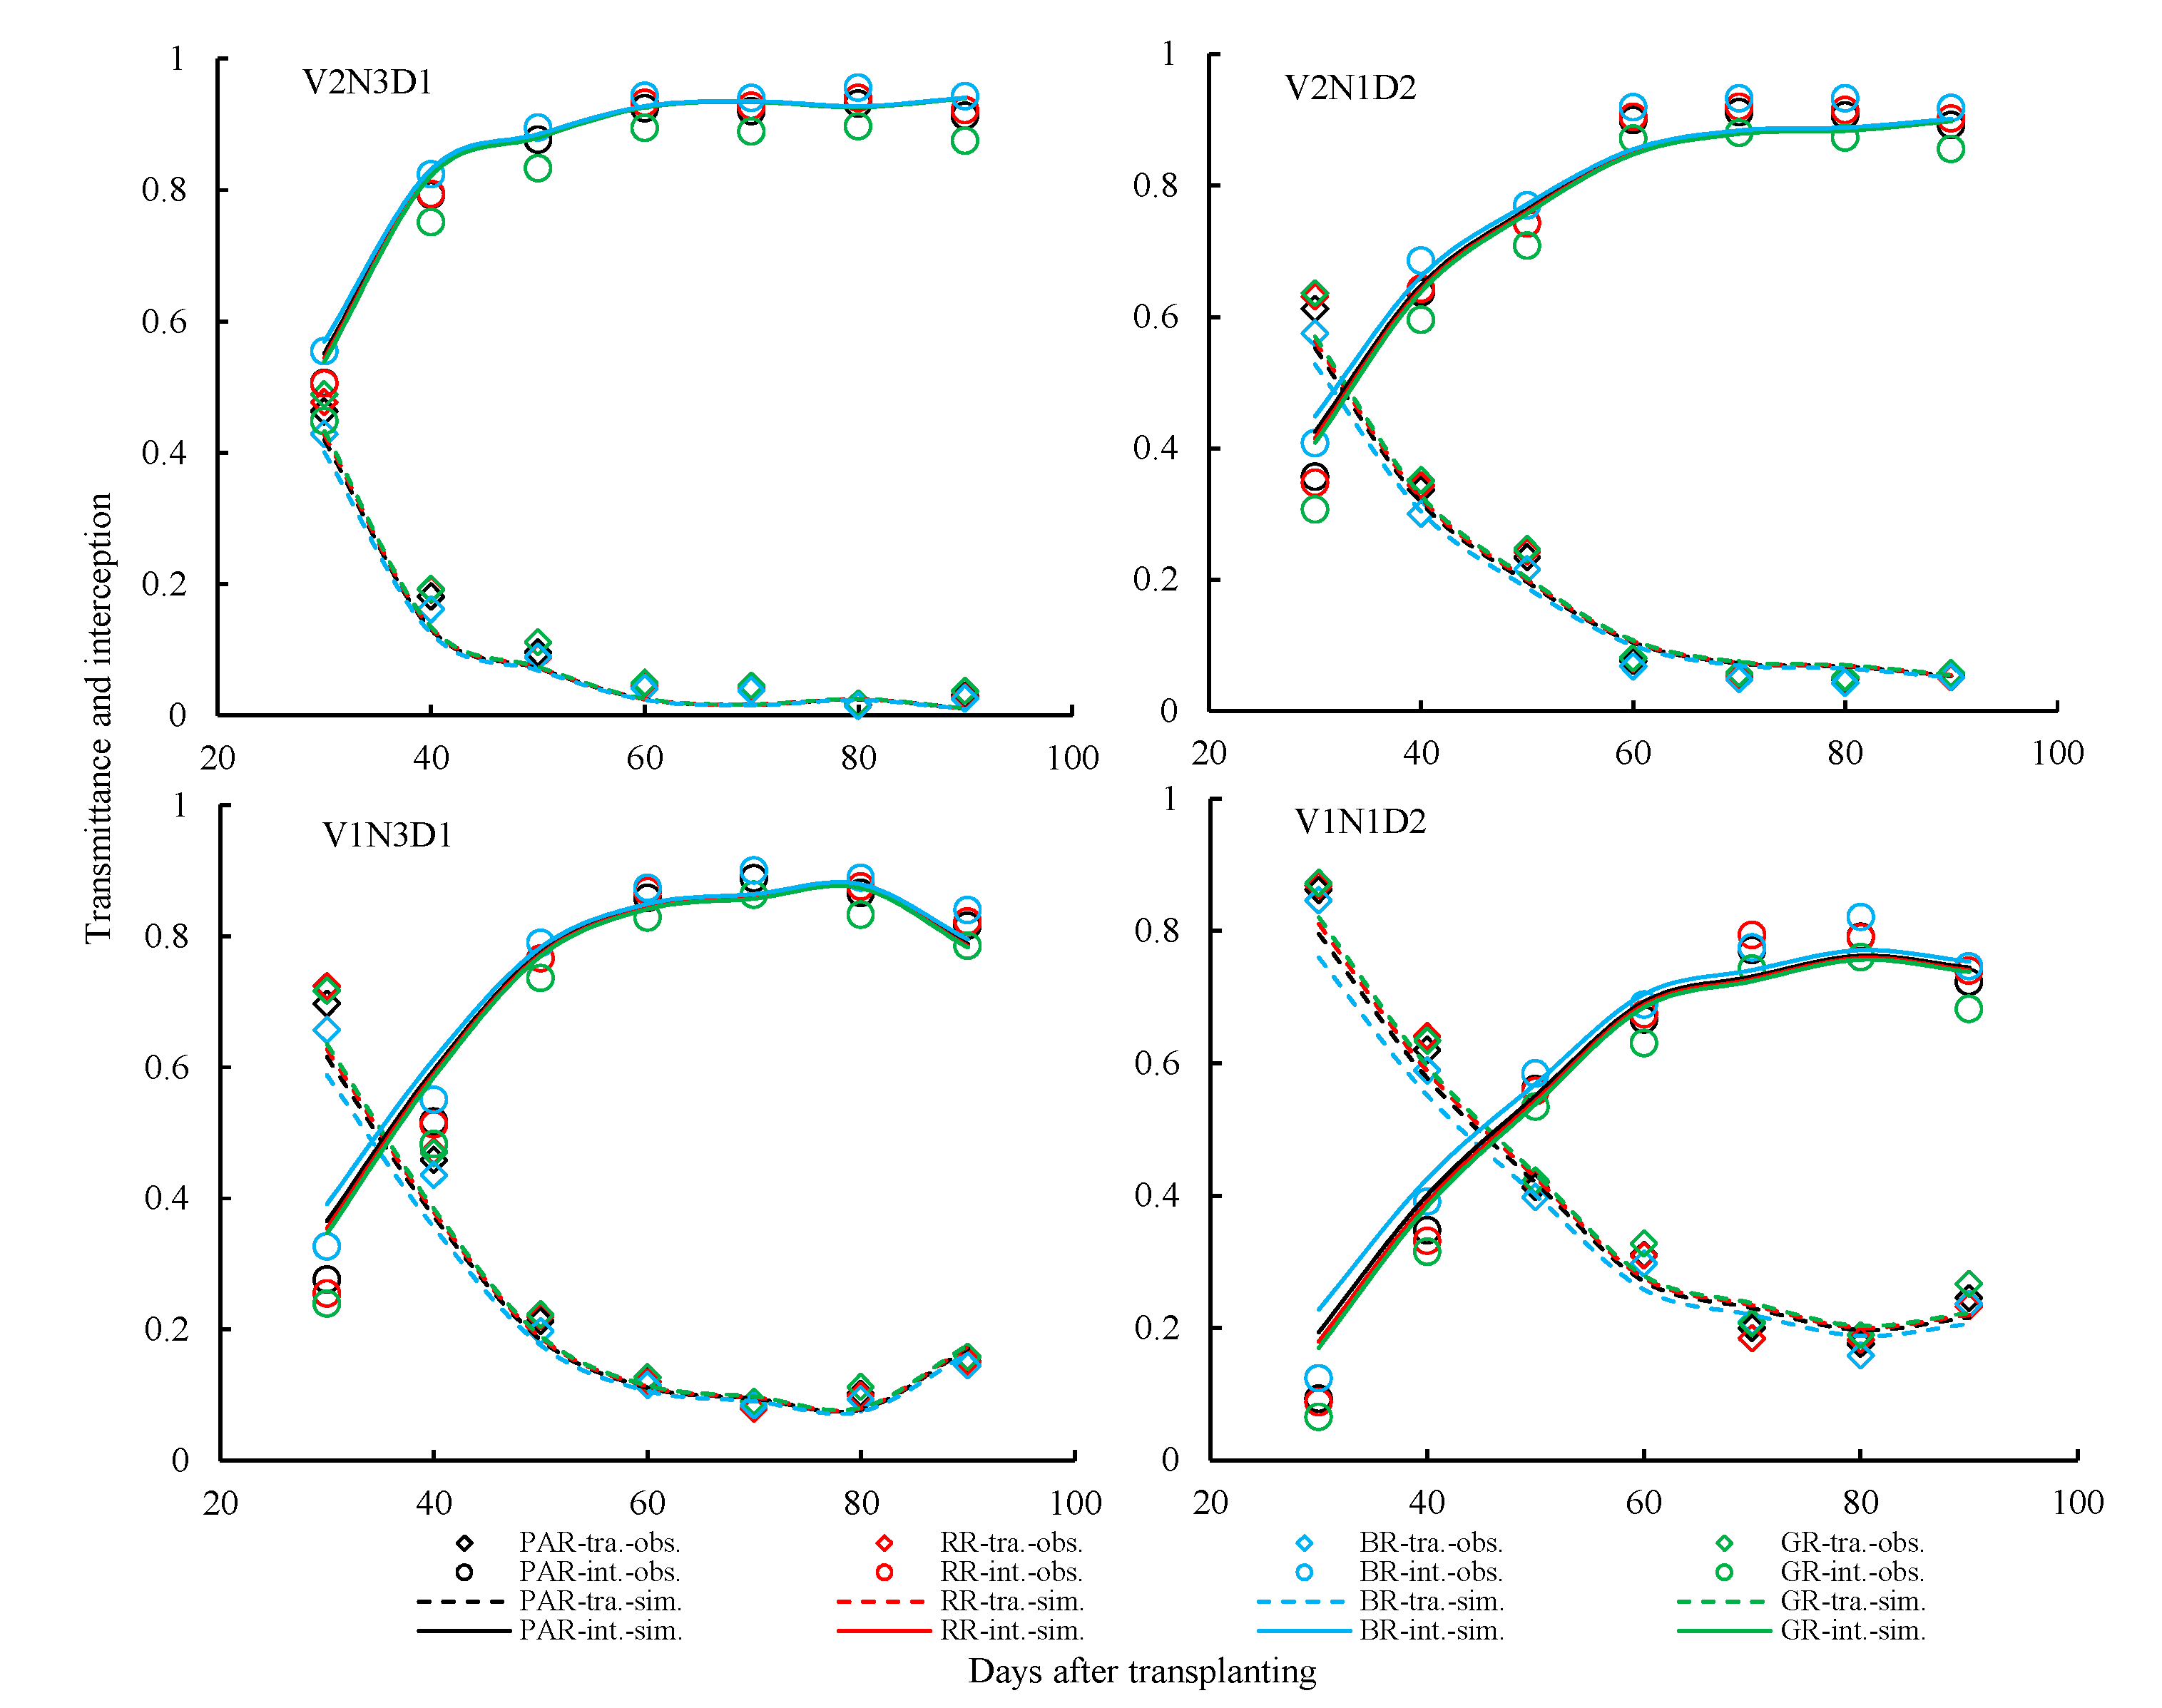
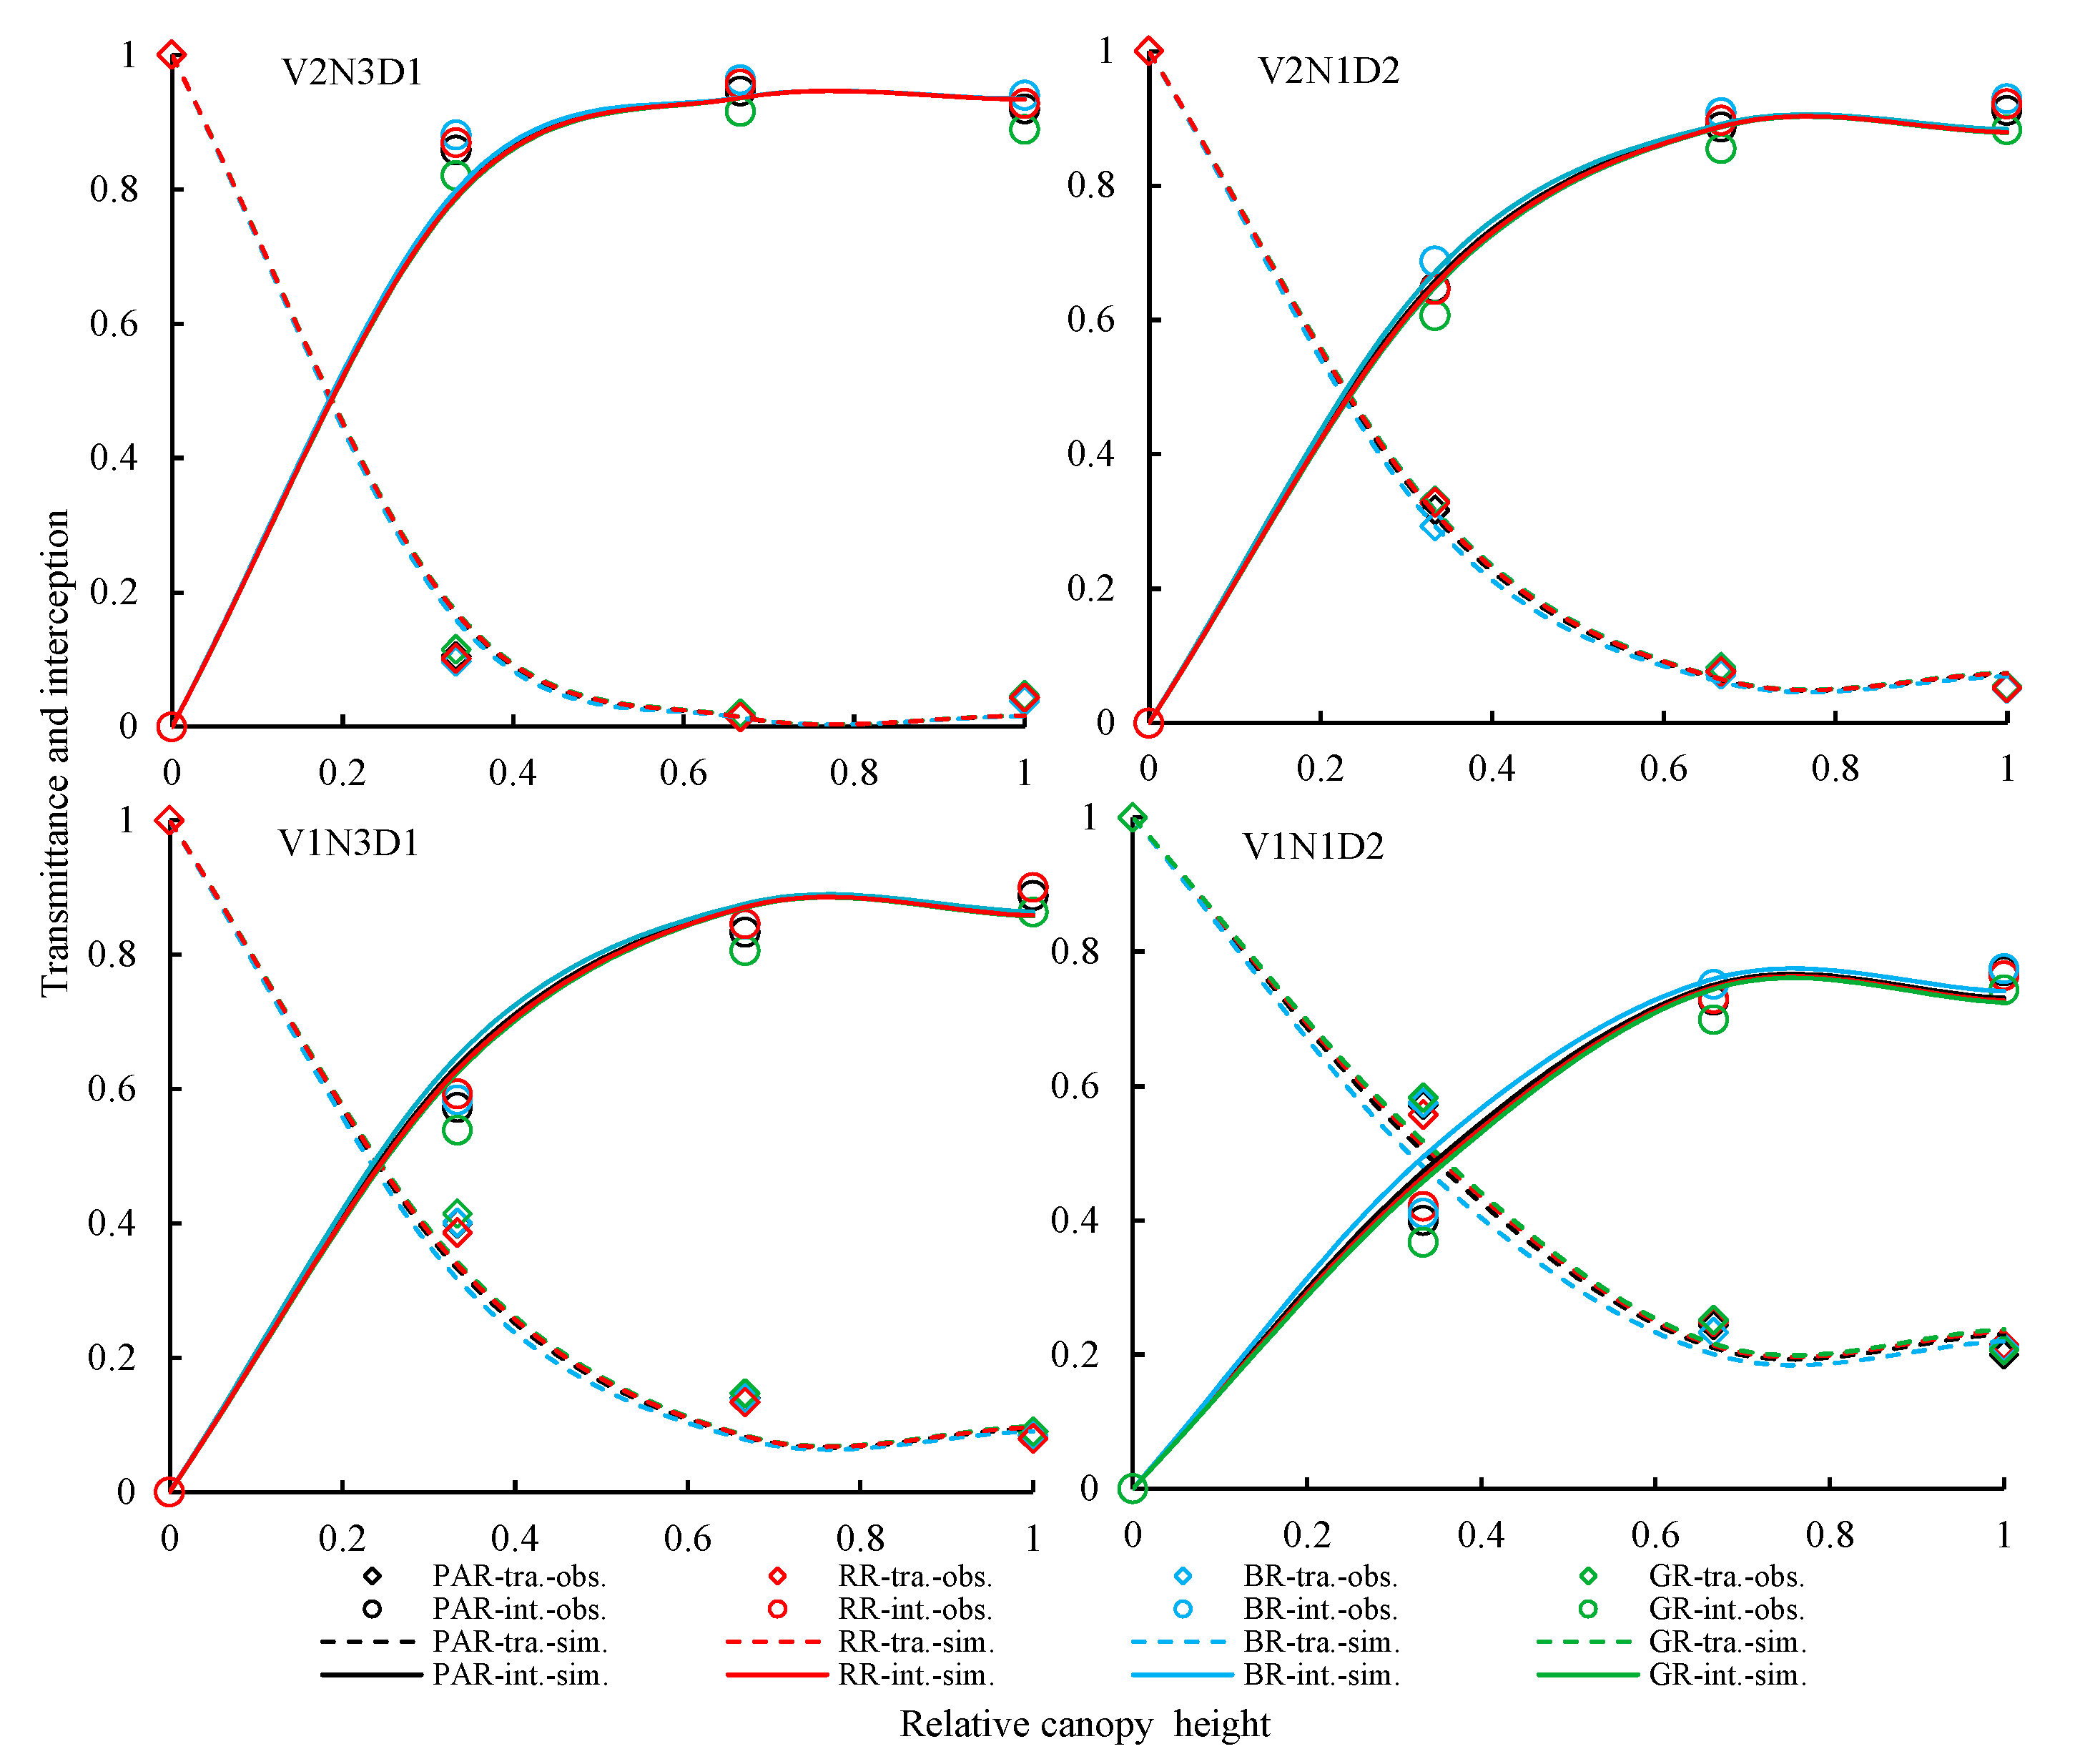
3.2. Radiation Transfer of Different Light Qualities (Wavelengths)

Green vegetable organs have selective absorption characteristics for solar radiation. The quantitative relationship between the interception and transmission of blue (B), green (G) and red (R) radiation and photosynthetic active radiation (PAR) were analyzed based on the experimental data. The results show that good correlation existed between these values despite the use of different rice varieties, cultivation conditions and canopy heights (Figure 5). Thus, the radiation transmittance of different wavelengths (light quality) at relative depth h of the rice canopy could be calculated based on its relationship to PAR transmittance.
Figure 5. Relationship between transmittance and interception of different wavelengths of light and photosynthetic active radiation (PAR). (A) Red radiation interception; (B) green radiation interception; (C) blue radiation interception; (D) red radiation transmittance; (E) green radiation transmittance; (F) bule radiation transmittance.
Remotesensing 07 05203 g005

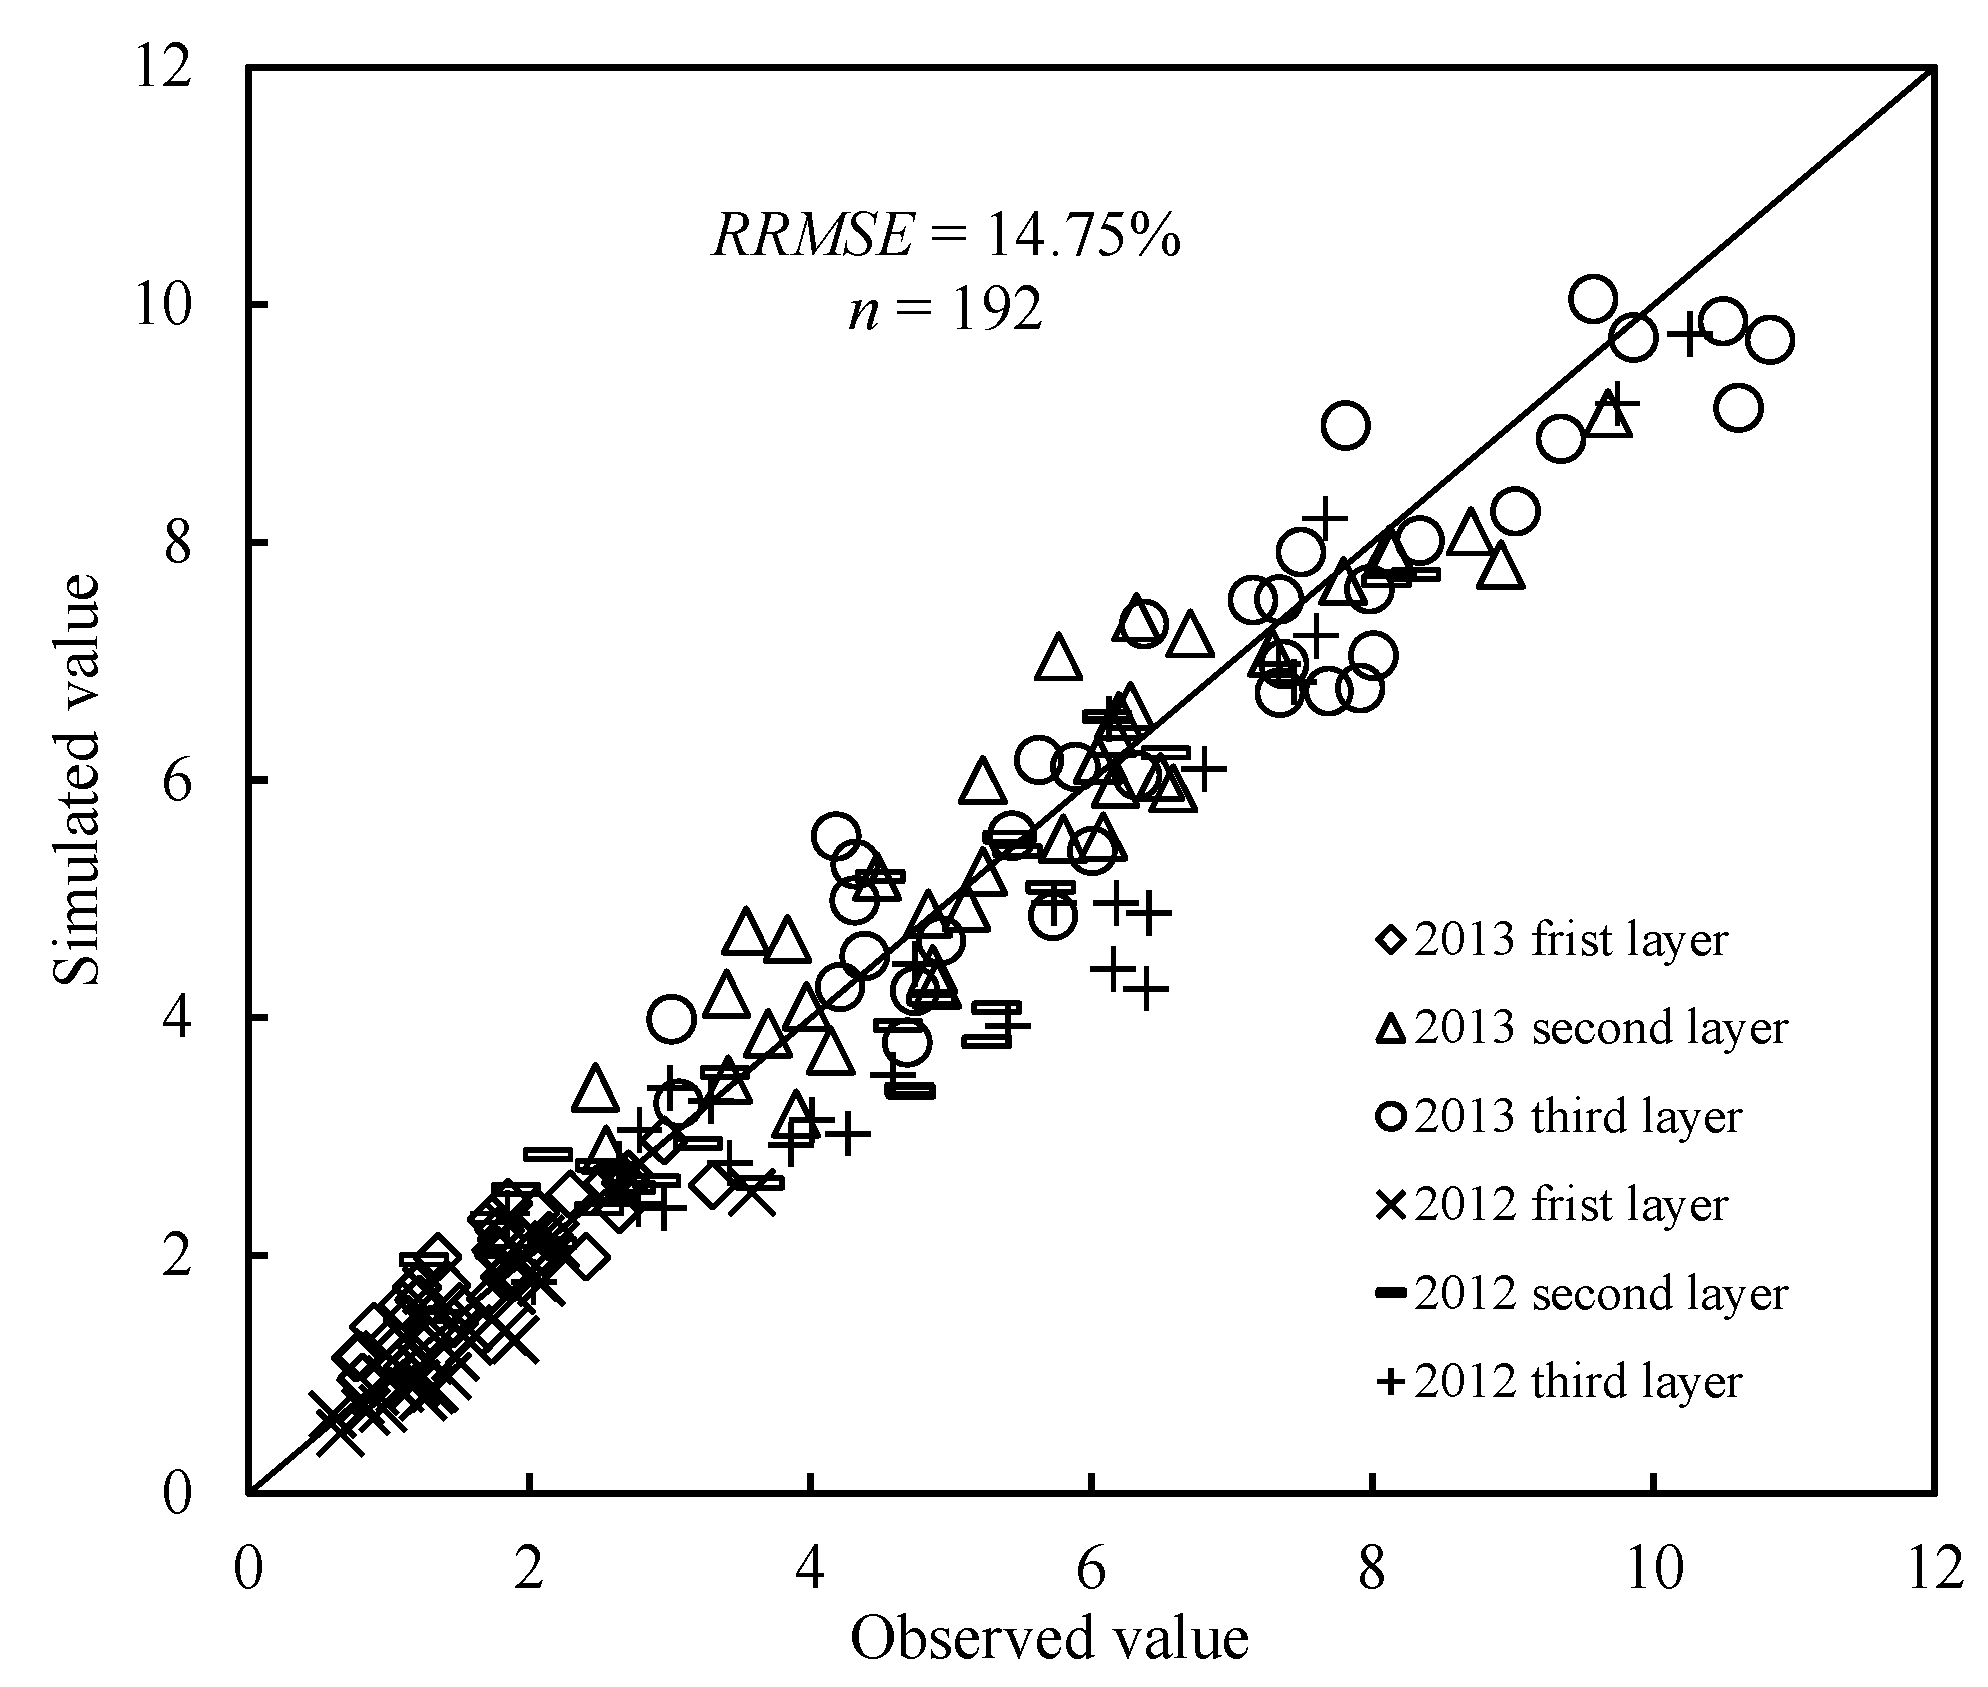
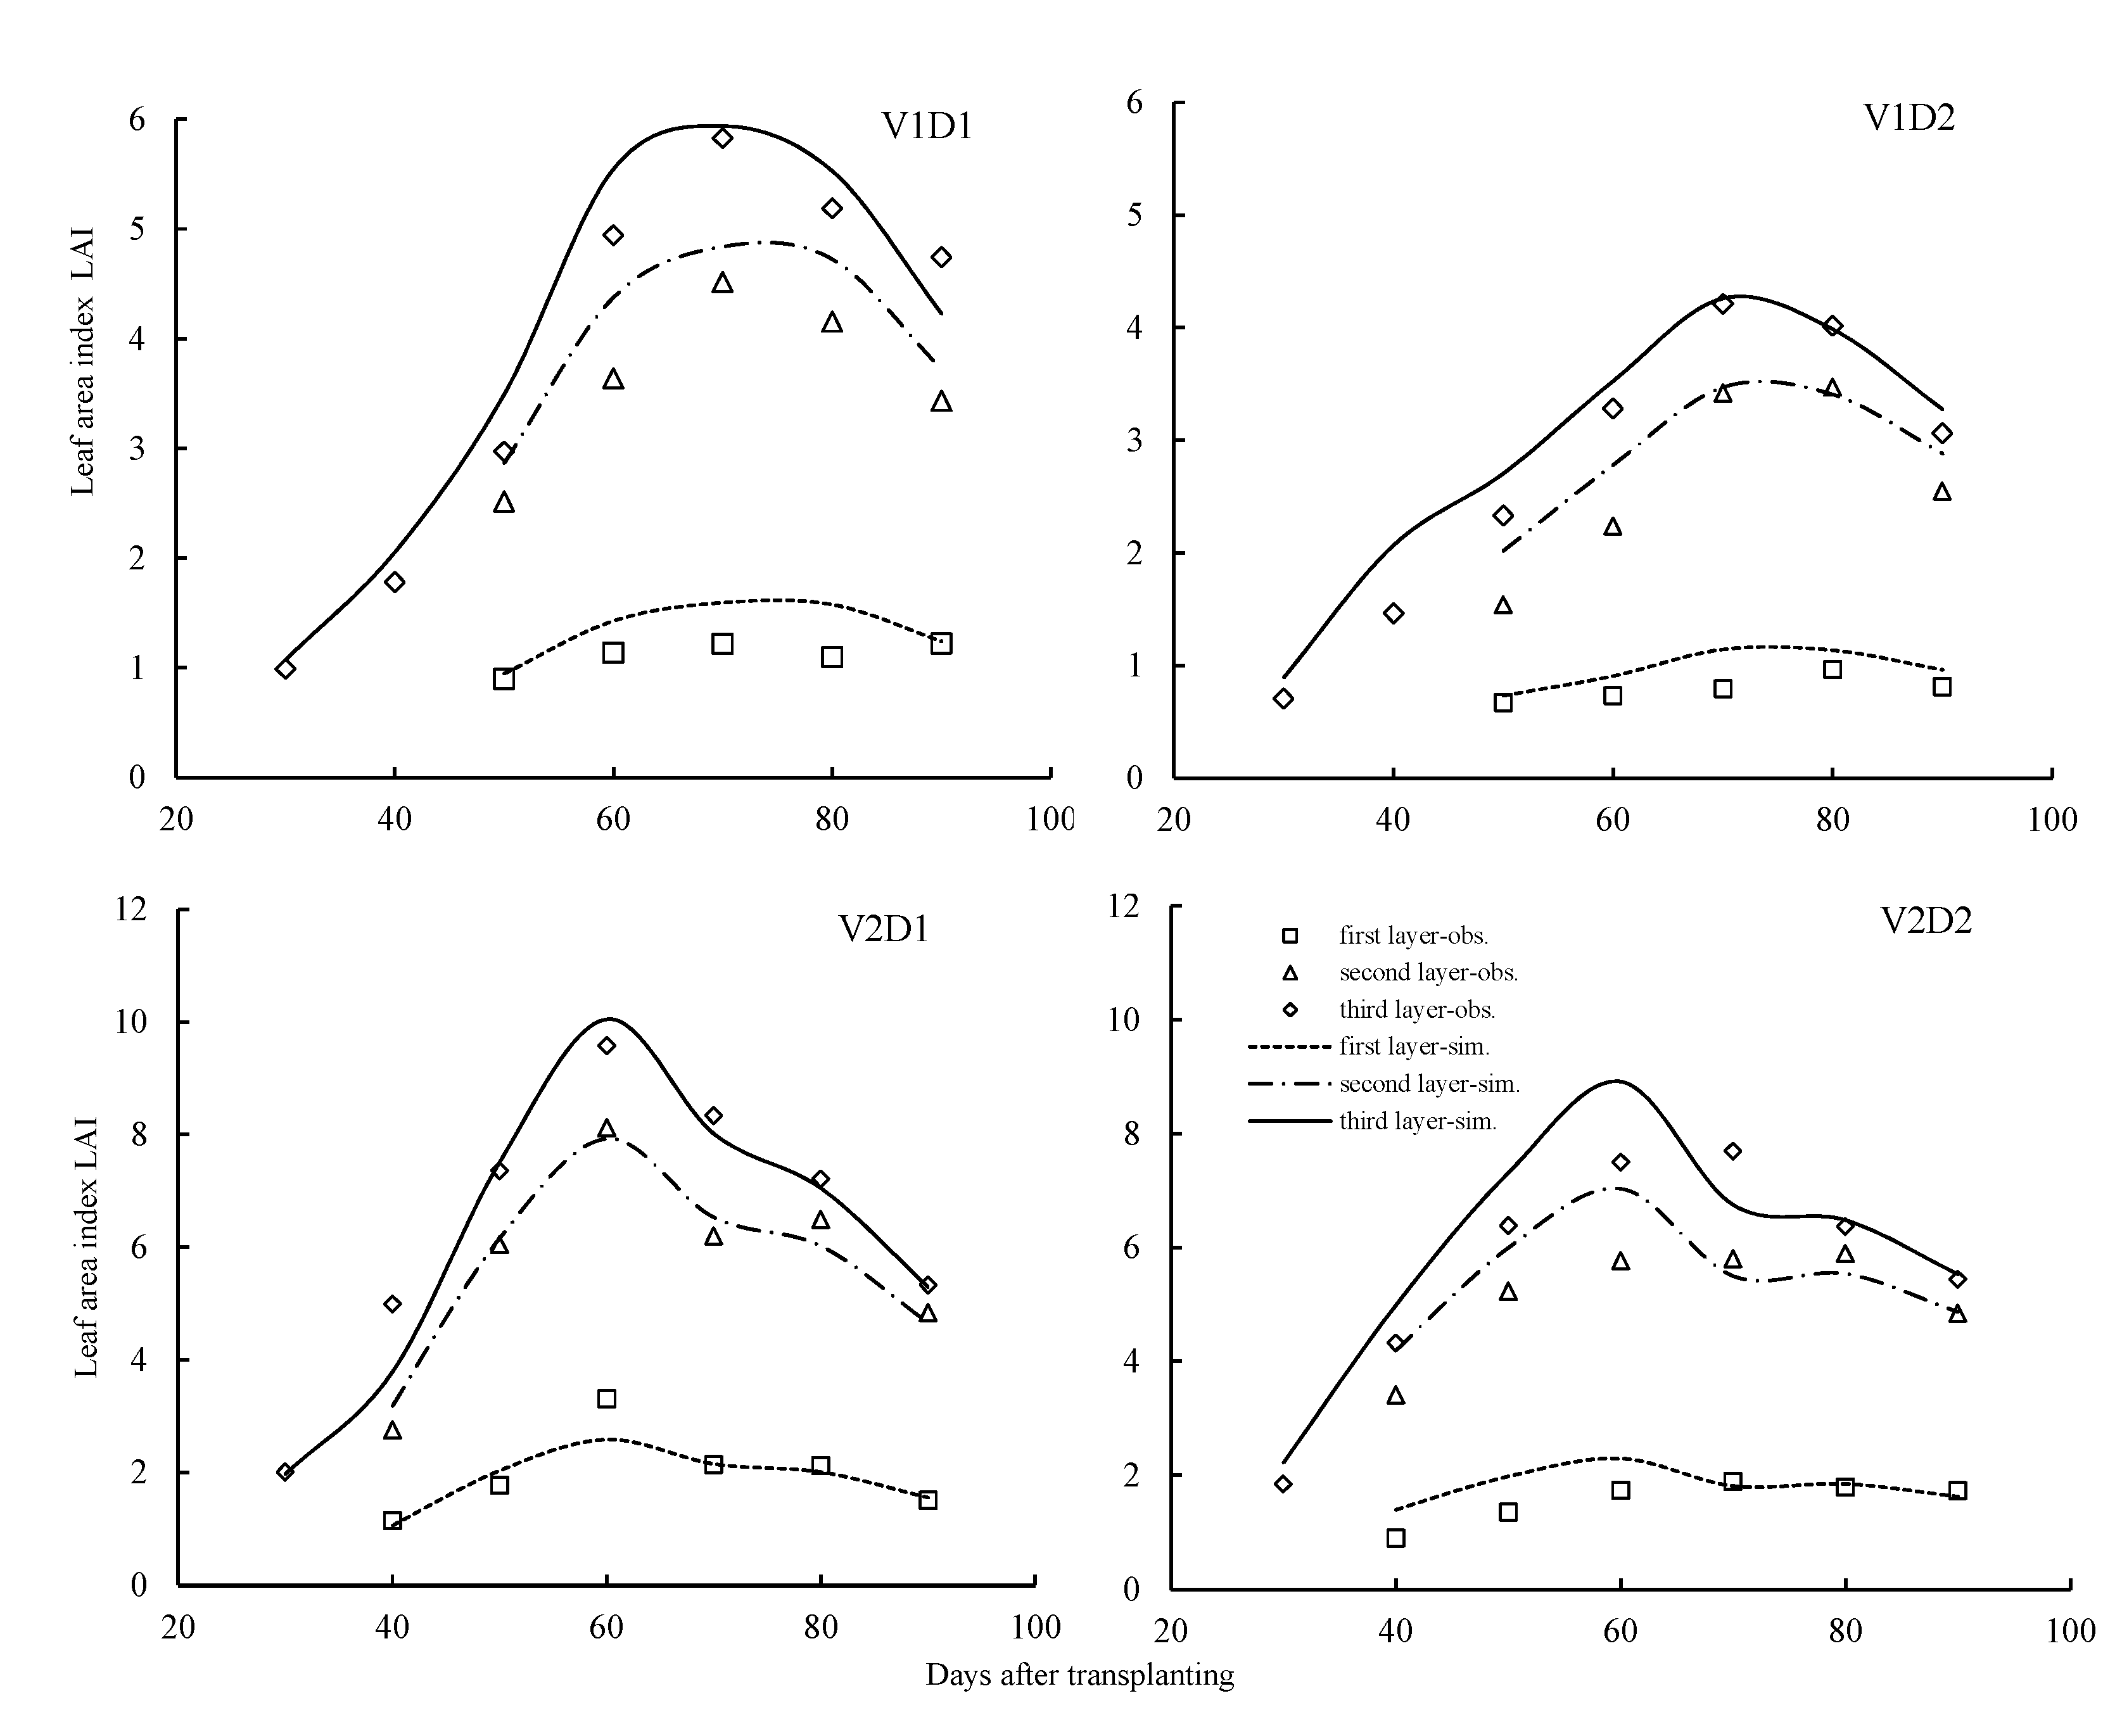
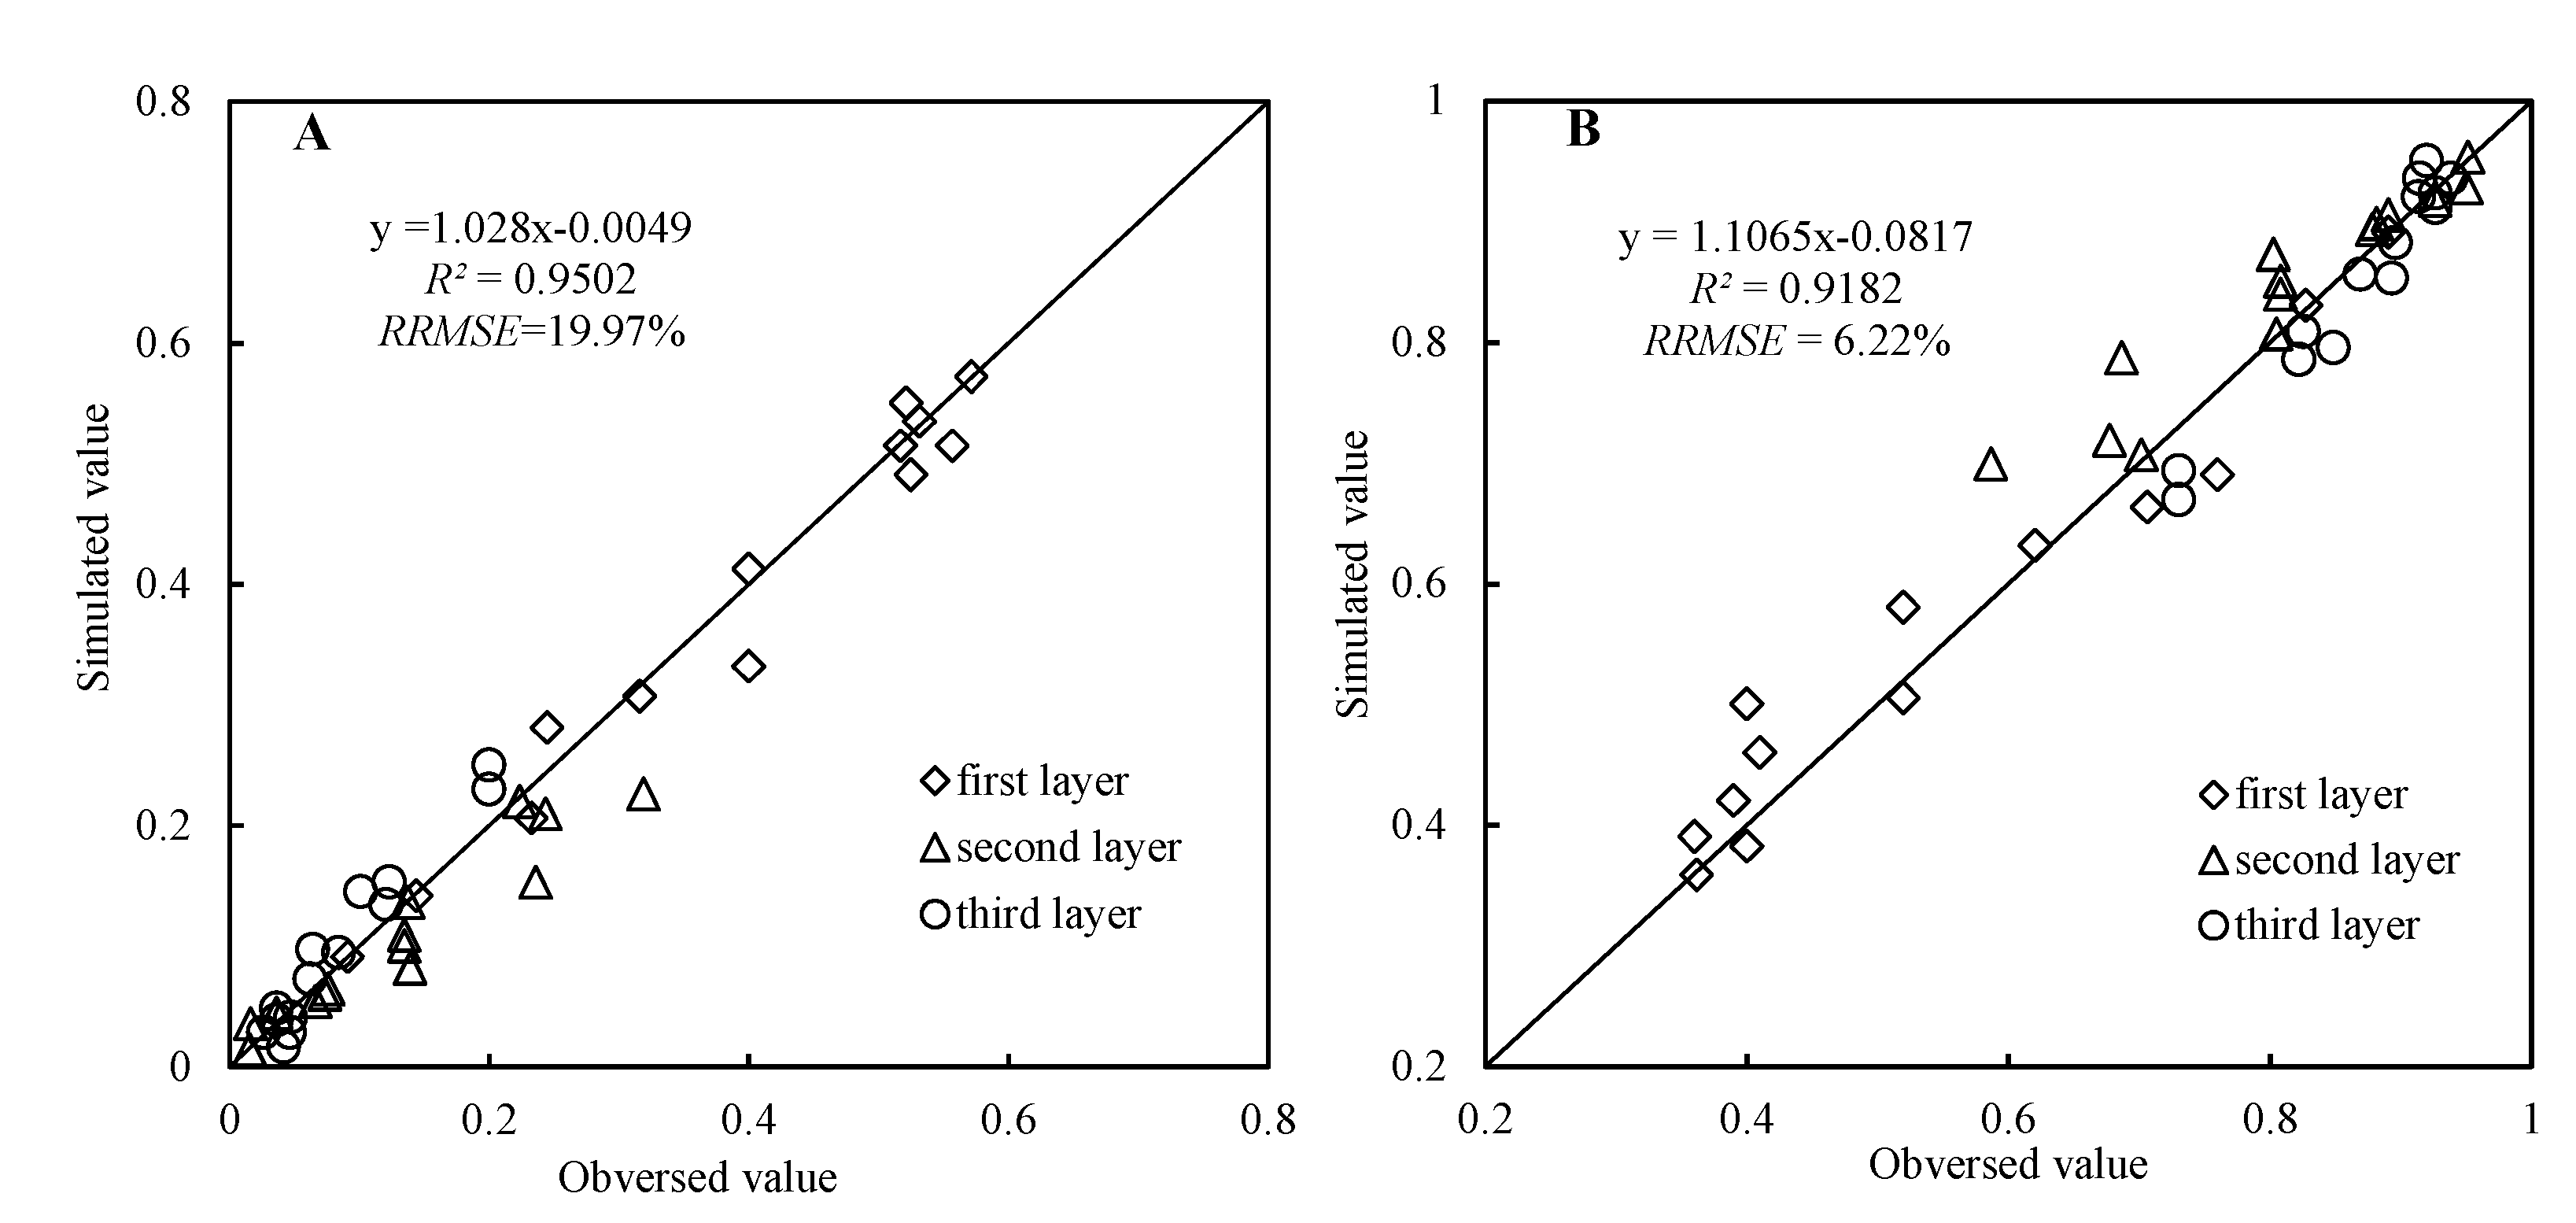
3.3. Validation of LAI Vertical Distribution Model

The LAI of different canopy height layers in different treatments and growth stages was simulated using the developed vertical LAI distribution model based on 2012 and 2013 experimental conditions. The result show (Figure 6; 2013, for example) that the simulated values closely matched the measured values and complied with the laws of different cultivation treatments and different growth stages. The RRMSE values derived from model simulation of the first, second and third layers of the rice canopy were 20.81%, 14.89% and 15.21% in 2012 and 18.97%, 10.53% and 10.48% in 2013, respectively, which indicates that the model could successfully simulate LAI in different rice canopy layers. The total mean RRMSE value of the model simulating different canopy layers of rice LAI was 14.75%. Better simulation results could be obtained under normal planting density conditions (RRMSE of 10.21%) than under lower planting density conditions (RRMSE of 16.26%; Figure 7). Large deviation existed between the simulated and measured LAI values in the group of V2D2 due to the measurement errors for SY63 (indica rice) that was planted in large row spacing and grew with inclined leaves. On the whole, this model is suitable for simulating the spatial and temporal distribution characteristics of canopy LAI in rice.
Figure 6. Comparison of simulated and observed downward cumulative LAI in rice, 2013.
Remotesensing 07 05203 g006
Figure 7. Comparison of simulated and observed downward cumulative LAI in rice, 2012 and 2013.
Remotesensing 07 05203 g007

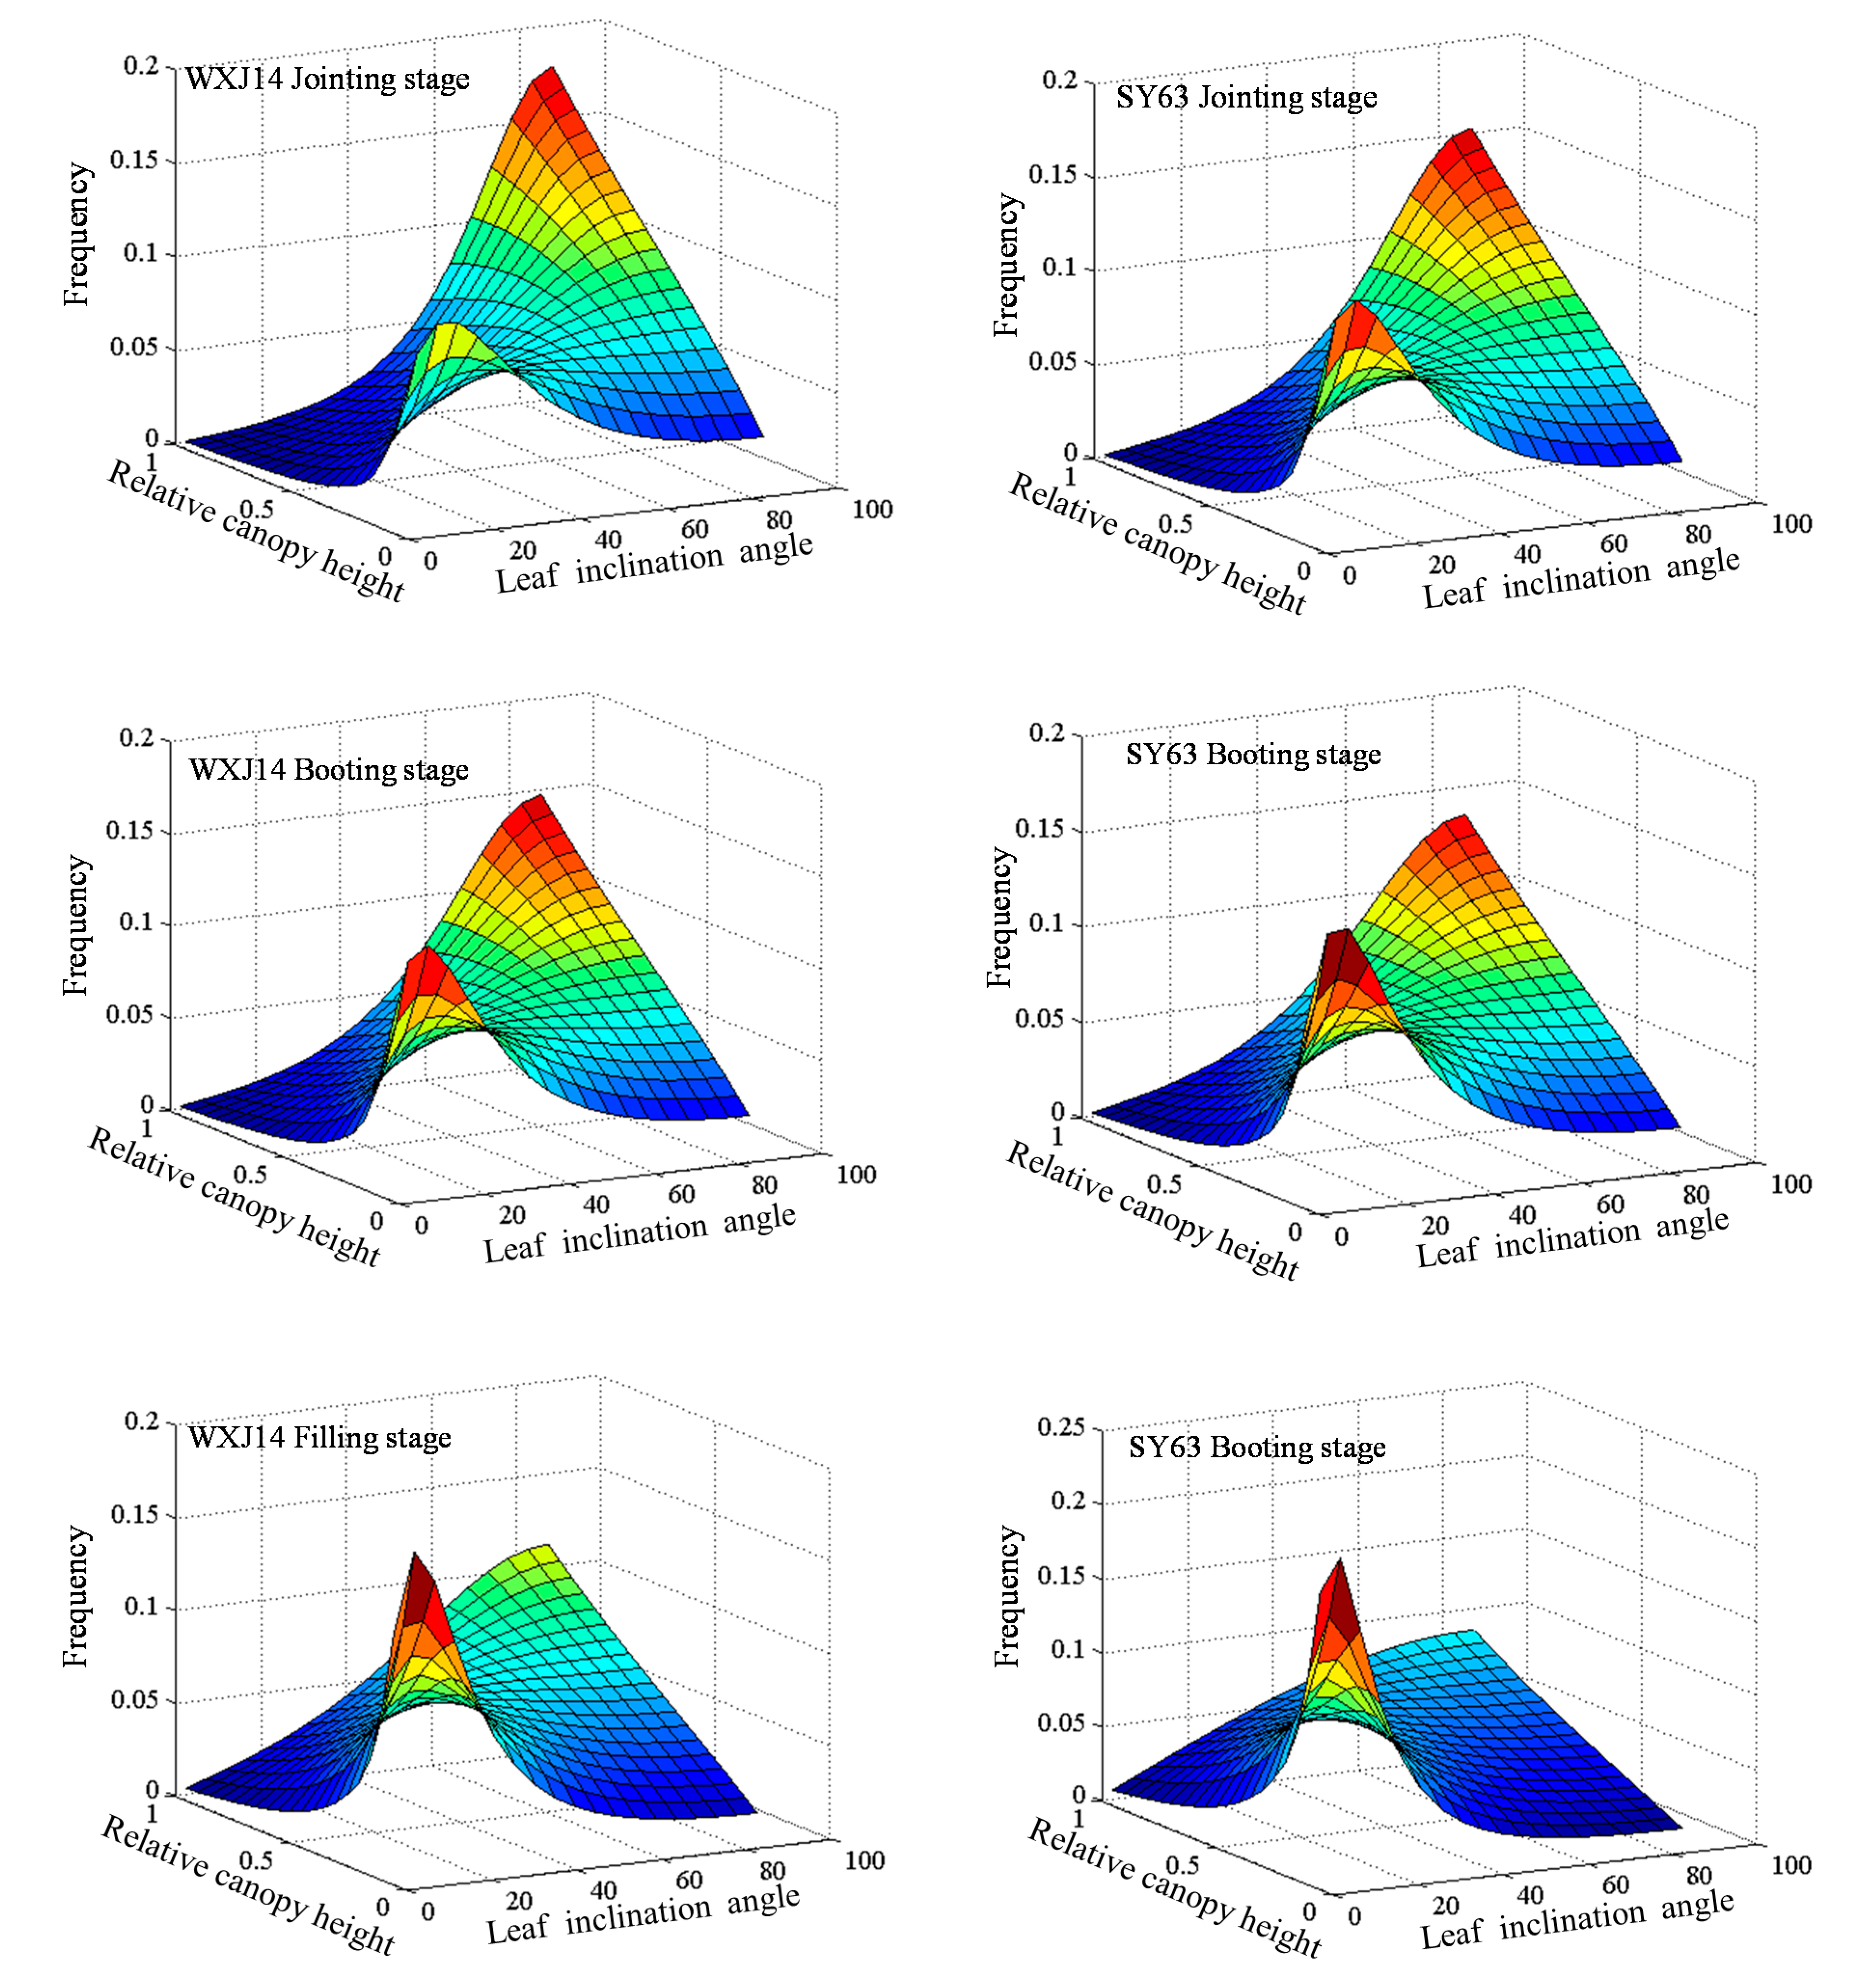
3.4. Simulation Analysis of Leaf Angle Distribution

The developed LA distribution function model was used to simulate LA at h height within the rice canopy during different growth stages. The results show that there were large differences in leaf angle distribution in the japonica versus indica rice varieties at different growth stages; however, these varieties exhibited similar patterns of spatial distribution of LA within the crop canopy. Overall, the leaf angles at the top of the canopy were smaller than those in the lower canopy for both rice varieties. For leaves in the upper part of the canopy, the LA values were within 20°–50° for Wuxiangjing14 (japonica rice) and 20°–40° for Shanyou63 (indica rice). For leaves in the lower part of the canopy, the LA values were within 50°–90° for Wuxiangjing14 and 40°–90° for Shanyou63 (Figure 8; N1D1 treatment in 2013, for example). The RRMSE value for simulated rice canopy LA was 21.78%, which indicates that the model developed in this study has a good prediction ability for rice LA (Figure 9).
Figure 8. Frequency of leaf angle distribution of different canopy layers of rice at the jointing, booting and filling stage.
Remotesensing 07 05203 g008
Figure 9. Comparison of simulated and measured leaf inclination angle distribution in the rice canopy.
Remotesensing 07 05203 g009

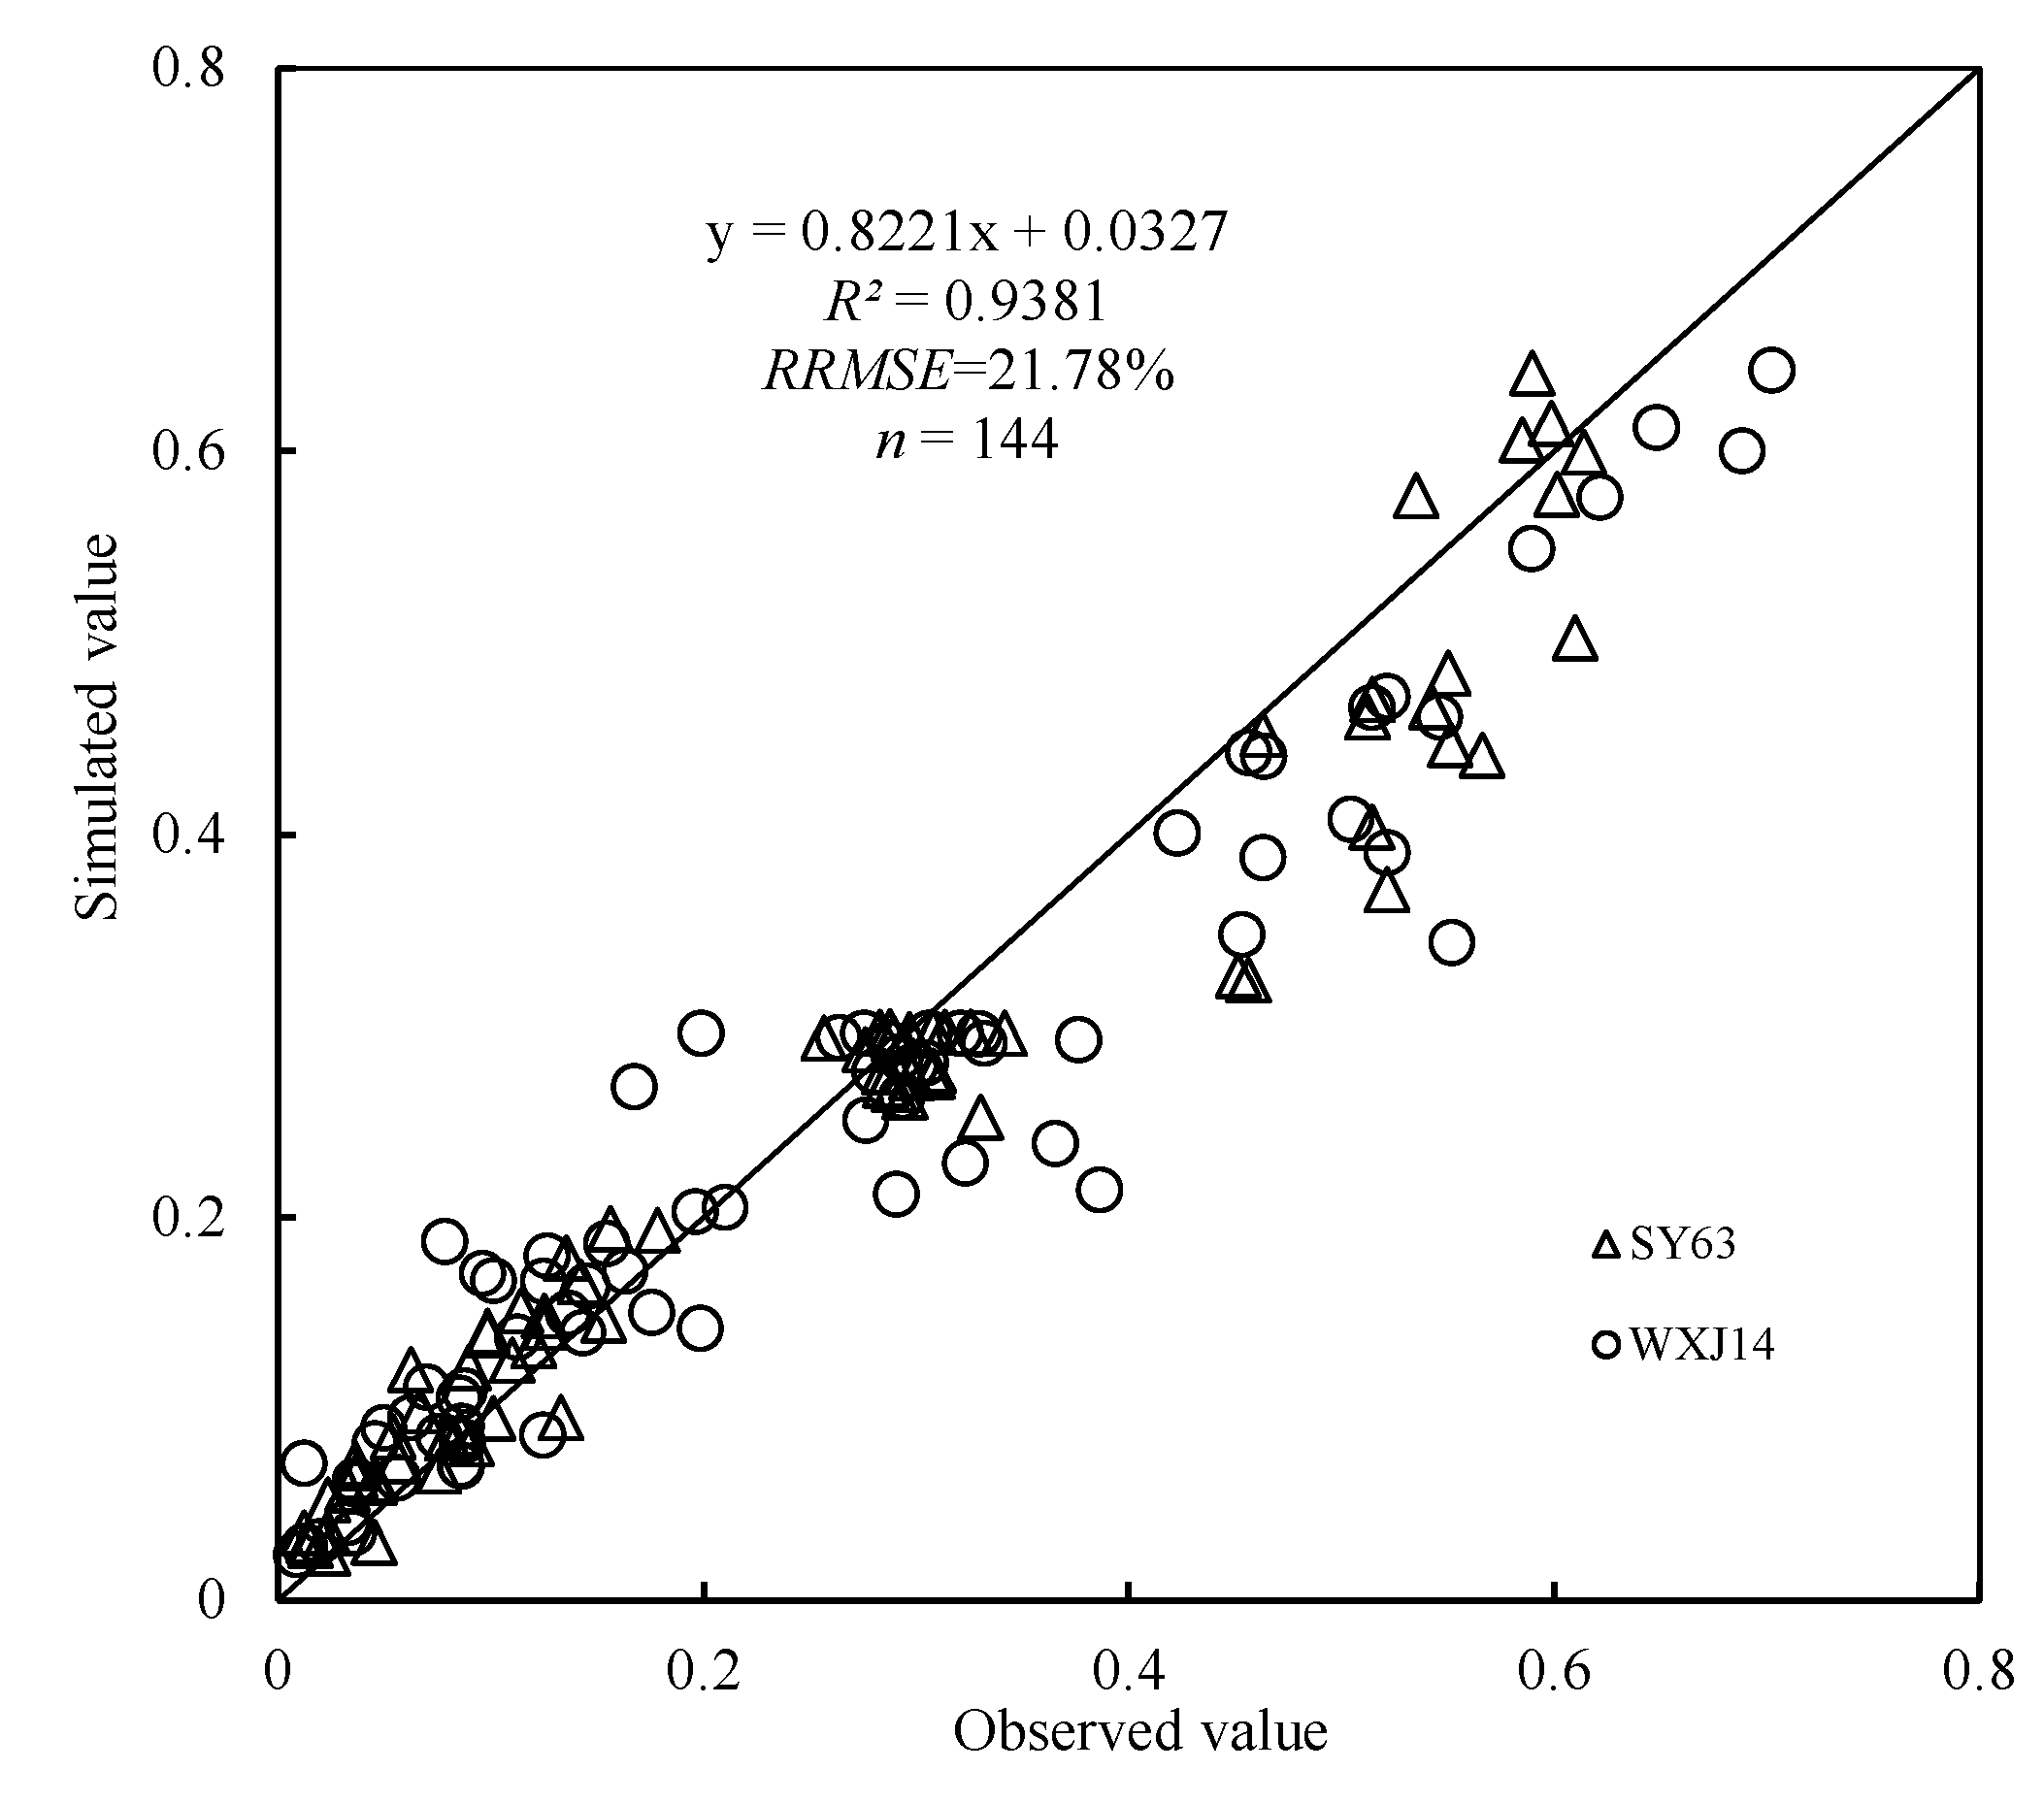
3.5. Validation of Rice Canopy Light Radiation Vertical Distribution Model

The transmittance and interception of two rice varieties under different growth stages and treatment conditions (Figure 10) were simulated using the developed rice canopy optical light radiation vertical distribution model, and the corresponding measured values were used to validate the model. The results show that for the two rice varieties examined, the simulated and measured values of transmittance and optical radiation interception rates were consistent. Over the entire growth period, the mean RRMSE values of rice canopy PAR transmittance and interception were 13.62% and 7.61% for Wuxiangjing14 and 18.69% and 3.61% for Shanyou63, respectively. The average RRMSE values for different qualities of light radiation (R, G and B) at different growth stages were 16.34%, 15.96% and 15.36% (transmittance) and 5.75%, 8.23% and 5.03% (interception), respectively.
The simulation results for canopy layers at different heights show that PAR transmittance and interception changed quickly in the upper part of the rice canopy, exhibiting an approximately linear trend, which began to slow down when the relative depth (h) reached approximately 0.4. There was little change when the h reached 0.7 (Figure 11), which indicates that most of the solar radiation was absorbed by the top 70% of the rice canopy. Validation results using the measured optical radiation data from different canopy layers show that the average RRMSE values in the first, second and third layers of the rice canopy were 8.49%, 16.98% and 26.06% (PAR transmittance) and 10.88%, 4.39% and 4.76% (PAR interception), respectively. For radiation of different light qualities (R, G and B), the RRMSE values were 23.58%, 23.77% and 26.92% (transmittance) and 6.73%, 8.02% and 6.88% (interception), respectively (Figure 12). These results demonstrate that the model performed well in simulating the spatial and temporal distribution of optical radiation in the rice canopy.
Figure 10. Comparison of simulated and observed radiation transmittance at different growth stages and under different nitrogen rates and planting densities for two rice varieties. V1, Wuxiangjing14; V2, Shanyou63.
Remotesensing 07 05203 g010
Figure 11. Comparison of simulated and observed radiation transmittance and interception in different relative canopy depths under different nitrogen rates and planting densities for two rice varieties, heading stage; V1, Wuxiangjing14; V2, Shanyou63.
Remotesensing 07 05203 g011
Figure 12. Comparison of simulated and observed PAR transmittance and interception values. (A) Transmittance and (B) interception.
Remotesensing 07 05203 g012

4. Discussion

LAI and LA distributions greatly influence the absorption and transmission of solar radiation in plant populations [27,28]. Hu et al. [27] simulated the canopy structure index based on the plant-type factor, but the plant-type factor was difficult to obtain, and its continuous changes throughout the growth period could not be simulated. Crop LAI was successfully estimated by RS technology [20,29]. However, it is difficult to invert crop LAI in the vertical direction using the RS method. Therefore, in the current study, we estimated rice canopy LAI values in different growth stages using hyperspectral vegetation indices, and we developed a canopy LAI vertical distribution model based on the logistic equation, to which we added the canopy depth factor h. In addition, the results of this study show that the model adjustment parameters b and c could be successfully simulated by GDD. Thus, we successfully performed dynamic simulation of rice canopy LAI in different canopy layers and at different growth stages.
The Campbell ellipsoidal distribution function is the most commonly-used function in the study of LA distribution simulation [15]. This model is highly versatile for different plant vegetation types [12], but it cannot simulate the temporal and spatial variation of vegetation canopy LA distribution [15]. In the study, the Campbell ellipsoidal distribution function was improved to simulate the probability of LA distribution at different canopy height levels using the canopy vertical depth parameter h. Moreover, this study shows that rice canopy hyperspectral vegetation indices ND(R700, R525) and DI (R945, R915) had good correlations with the input parameter ELADP of the LA distribution model for both Shanyou63 and Wuxiangjing14 rice; this input parameter was estimated by hyperspectral RS, which helped us obtain the model parameters. The results show that the model has good descriptive and predictive value for modeling the spatial and temporal distribution of rice canopy LA.
Mathematical functions and three-dimensional structures of computer simulation modeling methods are commonly used to simulate the light radiation distribution in the crop canopy [30,31,32]. The Beer-Lambert law proposed by Monsi and Saeki [7] is one of the most popular classical models for simulating light radiation distribution. Some studies have employed ray tracing techniques [33], radiosity [34] and other methods to simulate canopy light distribution. These models can accurately simulate light radiation intensity at any point within a canopy, but they require huge amounts of calculations, and input parameters are also difficult to obtain, which limits their application. Therefore, by combining the Beer-Lambert law and the hyperspectral RS technique, we developed a dynamic model of the vertical distribution of light in a rice canopy. This simplified model, with improved input parameter acquisition, provided good simulations of light radiation transmission and interception in canopy layers at different heights and growth stages. This model does not require the input of various agronomic parameters that are difficult to obtain, and it requires a small amount of computation and yields highly accurate results. In addition, two rice varieties (japonica and indica) with compact and loose canopy structures were studied in this paper. Different N treatments induced the significant differences in LAI and LA. The good performance of the newly proposed model suggested its strong applicability and predictability to simulate spatial and temporal distribution characteristics of LAI, LA and light radiation in rice.
Crop canopy leaves have selective absorption characteristics for different wavelengths of light radiation, and the transmittance and interception of different wavelengths of light radiation in the crop canopy differ; R and B radiation exhibit the minimum and maximum differences with PAR, respectively [35]. This observation was confirmed in the current study. Previous studies have primarily focused on PAR transport simulation and utilization efficiency, while studying the temporal and spatial distribution of different wavelengths of light radiation and its simulation models is necessary for improving radiation use efficiency in crop production [36]. Thus, we analyzed the relationships between different wavelengths of light (R, G, B) radiation and PAR, and we simulated the radiation transmission characteristics of different wavelengths of light radiation in canopy layers at different heights and at different growth stages.
The vertical distribution of canopy LAI is uneven, and stems have a greater impact on light radiation in the lower part of the canopy. The impact of the stem on light transmission was not considered in the current model, which leads to relatively low accuracy of simulation in the lower part of the canopy. Therefore, the stem factor should be considered in further studies by separating LAI from the stem area index (SAI) [37]. In addition, the influence of the physiological and biochemical parameters of rice leaves on differential light radiation transfer requires further study.

5. Conclusions

In this study, we developed a dynamic model of the vertical distribution of light radiation in the rice canopy based on the Beer-Lambert law coupled with hyperspectral RS technology. Based on the logistic equation and the Campbell ellipsoidal distribution model, we introduced the canopy height parameter h, assuming that the canopy of downward accumulation relative depth h is an ellipsoid-structured layer, and combined RS inversion of model input parameters to develop LAI and LA vertical distribution dynamic models. The extinction coefficients of photosynthetic active radiation under different experimental conditions were simulated by the G function, and then, the relationship between radiation transmission of PAR and different wavelengths radiation (R, G, B) were quantified, which enabled us to simulate the spatial and temporal distribution of different wavelengths’ radiation in the rice canopy. This model represents a new tool for simulating crop canopy photosynthetic production and light use efficiency and for evaluating the photosynthetic efficiency of different rice plant types.

Acknowledgments

This research was supported by the National Natural Science Foundation of China (31371535), the National 863 High-tech Program (2013AA102301 and 2011AA100703), the Special Fund for Agro-scientific Research in the Public Interest (201303109), the Science and Technology Support Program of China (2013BAD20B05), the Science and Technology Support Program of Jiangsu (BE2011351 and BE2012302), the Jiangsu Collaborative Innovation Center for Modern Crop Production and the Priority Academic Program Development of Jiangsu Higher Education Institutions, China.

Author Contributions

Yongjiu Guo designed the experiments, measured field spectral data, analyzed the data, interpreted the results and wrote the manuscript. Ling Zhang and Yehui Qin carried out the spectral measurements during field work and assisted with the results interpretation. The idea for the study and the basic structure of the manuscript were developed by Yan Zhu, Weixing Cao and Yongchao Tian. Yongchao Tian proposed the research design and manuscript revision.

Conflicts of Interest

The authors declare no conflict of interest.

References

  1. Hirose, T. Development of the monsi-saeki theory on canopy structure and function. Ann. Bot. 2005, 95, 483–494. [Google Scholar]
  2. Yu, Q.; Wang, T.D.; Liu, J.D.; Sun, F. A mathematical study on crop architecture and canopy photosynthesis I. Model. Sci. Agric. Sin. 1998, 24, 7–15. [Google Scholar]
  3. Sassenrath-Cole, G.F. Dependence of canopy light distribution on leaf and canopy structure for two cotton (gossypium) species. Agric. For. Meteorol. 1995, 77, 55–72. [Google Scholar] [CrossRef]
  4. Stewart, D.W.; Costa, C.; Dwyer, L.M.; Smithc, D.L.; Hamiltona, R.I.; Ma, B.L. Canopy structure, light interception, and photosynthesis in maize. Agron. J. 2003, 95, 1465–1474. [Google Scholar] [CrossRef]
  5. Tappeiner, U.; Cernusca, A. Model simulation if spatial distribution of photosynthesis in structurally differing plant communities in the central Caucasus. Ecol. Model. 1998, 24, 272–279. [Google Scholar]
  6. Wang, W.M.; Li, Z.L.; Su, H.B. Comparison of leaf angle distribution functions: Effects on extinction coefficient and fraction of sunlit foliage. Agric. For. Meteorol. 2007, 143, 106–122. [Google Scholar] [CrossRef]
  7. Monsi, M.; Saeki, T. Uber den lichtfaktor in den pflanzengesellschaften und seine bedeutung fur die stoffproduktion. Jpn. J. Bot. 1953, 14, 22–52. [Google Scholar]
  8. Li, Y.D.; Tang, L.; Zhang, Y.P.; Liu, L.L.; Cao, W.X.; Zhu, Y. Spatiotemporal distribution of photosynthetically active radiation in rice canopy. Chin. J. Appl. Ecol. 2010, 21, 952–958. [Google Scholar]
  9. Liu, R.Y.; Huang, W.J.; Ren, H.Z.; Yang, G.J.; Xie, D.H.; Wang, J. Photosynthetically active radiation vertical distribution model in maize canopy. Trans. Chin. Soc. Agric. Eng. 2011, 27, 115–121. [Google Scholar]
  10. Tang, L.; Li, Y.D.; Zhang, Y.P.; Zhu, X.C.; Liu, X.J.; Cao, W.X.; Zhu, Y. Simulation of canopy light distribution and application in rice. Rice Sci. 2011, 4, 427–434. [Google Scholar]
  11. Wang, F.M.; Huang, J.F.; Tang, Y.L.; Wang, X.Z. New vegetation index and its application in estimating leaf area index of rice. Rice Sci. 2007, 14, 195–203. [Google Scholar] [CrossRef]
  12. Campbell, G.S. Extinction coefficients for radiation in plant canopies calculated using an ellipsoidal inclination angle distribution. Agric. For. Meteorol. 1986, 36, 317–321. [Google Scholar] [CrossRef]
  13. Nilson, T. A theoretical analysis of the frequency of gaps in plant stands. Agric. For. Meteorol. 1971, 8, 25–38. [Google Scholar] [CrossRef]
  14. Ross, J. The Radiation Regime and Architecture of Plant Stands; Springer Science & Business Media: Boston, MA, USA, 1981. [Google Scholar]
  15. Campbell, G.S. Derivation of an angle density function for canopies with ellipsoidal leaf angle distributions. Agric. For. Meteorol. 1990, 49, 173–176. [Google Scholar] [CrossRef]
  16. Verhoef, W. Theory of Radiative Transfer Models Applied in Optical Remote Sensing of Vegetation Canopies. Ph.D. Thesis, Wageningen Agricultural University, Wageningen, The Netherlands, 1998. [Google Scholar]
  17. Wang, X.Y.; Guo, Y.; Li, B.G. Evaluating a three dimensional model of diffuse radiation in maize canopies. Int. J. Biometeorol. 2006, 50, 349–357. [Google Scholar] [CrossRef] [PubMed]
  18. Zheng, B.Y.; Shi, L.J.; Ma, Y.T. Comparison of architecture among different cultivars of hybrid rice using a spatial light model based on 3d digitizing. Funct. Plant Biol. 2008, 35, 900–910. [Google Scholar] [CrossRef]
  19. Tian, Y.C.; Yang, J.; Yao, X.; Zhu, Y.; Cao, W.X. Quantitative relationships between hyperspectral vegetation indices and leaf area index of rice. Chin. J. Appl. Ecol. 2009, 20, 1685–1690. [Google Scholar]
  20. Viña, A.; Gitelson, A.A.; Nguy-Robertson, A.L.; Peng, Y. Comparison of different vegetation indices for the remote assessment of green leaf area index of crops. Remote Sens. Environ. 2011, 115, 3468–3478. [Google Scholar] [CrossRef]
  21. Gallo, K.P.; Daughtry, C.S.T. Techniques for measuring intercepted and absorbed photosynthetically active radiation in corn canopies. Agron. J. 1986, 78, 752–756. [Google Scholar] [CrossRef]
  22. McMaster, G.S.; Wilhelm, W.W. Growing degree-days: One equation, two interpretations. Agric. For. Meteorol. 1997, 87, 291–300. [Google Scholar] [CrossRef]
  23. Wallach, D.; David, M.; Jones, J.W. Working with Dynamic Crop Models; Elsevier BV: Boston, MA, USA, 2006. [Google Scholar]
  24. Tian, Y.C.; Yao, X.; Yang, J.; Cao, W.X.; Hannaway, D.B.; Zhu, Y. Assessing newly developed and published vegetation indices for estimating rice leaf nitrogen concentration with ground- and space-based hyperspectral reflectance. Field Crops Res. 2011, 120, 299–310. [Google Scholar] [CrossRef]
  25. Li, Y.D.; Tang, L.; Zhang, Y.P.; Zhu, X.C.; Cao, W.X.; Zhu, Y. Relationship of par interception of canopy to leaf area and yield in rice. Sci. Agric. Sin. 2010, 43, 3296–3305. [Google Scholar]
  26. Ruimy, A.; Kergoat, L.; Bondeau, A. Comparing global models of terrestrial net primary productivity (NPP): Analysis of differences in light absorption and light-use efficiency. Glob. Chang. Biol. 1999, 5, 56–64. [Google Scholar] [CrossRef]
  27. Hu, N.; Yao, K.M.; Zhang, X.C.; Lv, C.G. Effect and simulation of plant type on canopy structure and radiation transmission in rice. Rice Sci. 2011, 25, 535–543. [Google Scholar]
  28. Zhou, Y.H.; Xiang, Y.Q.; Lin, Z.H. Radiation interception by erectophile maize colony. Chin. J. Appl. Ecol. 1997, 8, 21–25. [Google Scholar]
  29. Liu, Q.; Liang, S.; Xiao, Z.; Fang, H. Retrieval of leaf area index using temporal, spectral, and angular information from multiple satellite data. Remote Sens. Environ. 2014, 145, 25–37. [Google Scholar] [CrossRef]
  30. Wang, X.P.; Guo, Y.; Wang, X.Y. Estimating photosynthetically active radiation distribution in maize canopies by a three-dimensional incident radiation model. Funct. Plant Biol. 2008, 35, 867–876. [Google Scholar] [CrossRef]
  31. Evers, J.B.; Vos, J.; Yin, X.; Romero, P.; van der Putten, P.E.; Struik, P.C. Simulation of wheat growth and development based on organ-level photosynthesis and assimilate allocation. J. Exp. Bot. 2010, 61, 2203–2216. [Google Scholar] [CrossRef] [PubMed]
  32. Sarlikioti, V.; de Visser, P.H.; Marcelis, L.F. Exploring the spatial distribution of light interception and photosynthesis of canopies by means of a functional-structural plant model. Ann. Bot. 2011, 107, 875–883. [Google Scholar] [CrossRef] [PubMed]
  33. Ross, J.K.; Marshak, A.L. Calculation of canopy bidirectional reflectance using the Monte Carlo method. Remote Sens. Environ. 1988, 24, 213–225. [Google Scholar] [CrossRef]
  34. Chelle, M.; Andrieu, B. The nested radiosity model for the distribution of light within plant canopies. Ecol. Model. 1998, 111, 75–91. [Google Scholar] [CrossRef]
  35. Awad, M.A.; Wsgenmakers, P.S.; de Jager, A. Effect of light on flavonoid and chlorugenic acid levels in the skin of “jonagold” apples. Sci. Hortic. 2001, 88, 289–298. [Google Scholar] [CrossRef]
  36. Yang, C.M.; Yang, L.Z.; Wei, C.L.; Ding, C.C. Canopy spectral characteristics of different rice varieties. Chin. J. Appl. Ecol. 2002, 13, 689–692. [Google Scholar]
  37. Fang, H.; Li, W.; Wei, S.; Jiang, C. Seasonal variation of leaf area index (LAI) over paddy rice fields in NE China: Intercomparison of destructive sampling, LAI-2200, digital hemispherical photography (DHP), and AccuPAR methods. Agric. For. Meteorol. 2014, 198–199, 126–141. [Google Scholar] [CrossRef]

