Article

Modeling and Mapping Soil Moisture of Plateau Pasture Using RADARSAT-2 Imagery

Institute of Remote Sensing and Digital Earth, Chinese Academy of Sciences, 100101 Beijing, China
*
Author to whom correspondence should be addressed.
Remote Sens. 2015, 7(2), 1279-1299; https://doi.org/10.3390/rs70201279
Submission received: 16 September 2014 / Accepted: 20 January 2015 / Published: 23 January 2015

Abstract

:
Accurate soil moisture retrieval of a large area in high resolution is significant for plateau pasture. The object of this paper is to investigate the estimation of volumetric soil moisture in vegetated areas of plateau pasture using fully polarimetric C-band RADARSAT-2 SAR (Synthetic Aperture Radar) images. Based on the water cloud model, Chen model, and Dubois model, we proposed two developed algorithms for soil moisture retrieval and validated their performance using experimental data. We eliminated the effect of vegetation cover by using the water cloud model and minimized the effect of soil surface roughness by solving the Dubois equations. Two experimental campaigns were conducted in the Qinghai Lake watershed, northeastern Tibetan Plateau in September 2012 and May 2013, respectively, with simultaneous satellite overpass. Compared with the developed Chen model, the predicted soil moisture given by the developed Dubois model agreed better with field measurements in terms of accuracy and stability. The RMSE, R2, and RPD value of the developed Dubois model were (5.4, 0.8, 1.6) and (3.05, 0.78, 1.74) for the two experiments, respectively. Validation results indicated that the developed Dubois model, needing a minimum of prior information, satisfied the requirement for soil moisture inversion in the study region.

1. Introduction

Soil moisture content (SMC) is a crucial parameter in the water cycle and energy exchange of the earth’s surface. It has great influence in various applications such as natural risk assessment, hydrology, climatology, ecology, and agronomy, especially in areas like plateau pasture, where the spatial and temporal distribution of SMC changes a lot, leading to numerous ecological and environmental problems. Due to these reasons, the retrieval of spatial distribution of SMC on a large scale is an important research topic.
However, SMC has not been widely used to improve research into the water cycle and energy exchange, owing to the difficulty of accurate and efficient SMC estimation of larger areas in high resolution. Microwave remote sensing, especially SAR (Synthetic Aperture Radar), has demonstrated potential for deriving SMC on a large scale in high resolution with SAR data [1,2,3,4,5,6,7,8,9,10]. Due to the complexity of natural surfaces, the backscattering of SAR is significantly affected by the roughness of the soil surface (i.e., the standard deviation of surface height, the correlation length), the dielectric constant of the soil, and the presence of vegetation (vegetation water content, shape, plant height, and so on) [11]. Numerous methods have been proposed to solve these problems [1,6,7,8,12,13,14]. The most famous methods are proposed by Oh et al. and Dubois et al. Oh et al. [6] established an experimental relationship linking ratios of measured backscattering coefficients in different polarizations to soil surface moisture. Dubois et al. [8] related backscattering coefficients in HH and VV polarizations to soil moisture and surface roughness. Srivastava et al. [12] indicated that the depolarization ratio of backscattering in VH and VV polarizations is a good indicator of surface roughness derived from multi-polarized SAR data. Topp et al. [13] developed an empirical model to present the relation between the surface dielectric constant and soil volumetric water content regardless of soil type, soil density, or soil temperature. Hallikainen et al. [14] evaluated the microwave dielectric behavior of soil-water mixtures, and also proposed a polynomial expression for the relation between the dielectric constant and SMC. Dobson et al. [1] presented a theoretical four-component mixing model that explicitly accounts for the presence of bound water. Empirical or semi-empirical models have been widely used for soil moisture estimation due to their simplicity. Several physical approaches based on backscattering models have been developed, such as the small perturbation model (SPM), the physical optics model (POM), and the geometrical optics model (GOM), which are capable of reproducing the radar backscattering coefficient from radar configuration and soil surface parameters, but their restricted roughness range limits their validity domains [6,15]. The Integral Equation Model (IEM), developed by Fung et al., covers a wider roughness range and has been widely used to retrieve SMC and roughness parameters. Despite this, studies showed that a good agreement between measurements and simulations reproduced by the model is rare [16,17]; in addition, the complexity of IEM limits its application.
All of the above approaches work fine for bare soil, but they are not adequate for vegetated surfaces. Vegetation has a significant impact on the radar backscattering coefficient on account of vegetation water content, shape, and scatter size, which increase the difficulty of SMC retrieval. Due to various contributions of vegetation characteristics, the empirical calibration relationship between backscattering coefficient and measurement turns to be unstable; this is also the case for simulations reproduced by these physical models. Thus, separating the scattering contributions of vegetation from the radar signal is quite a challenge for retrieval of SMC from vegetated regions. Advances have been made towards reducing the effect of vegetation and improving soil moisture models [18]. For retrieval of SMC from vegetated surfaces, there is no theoretical model that can be directly applied, as most of these models focus on the retrieval of vegetation parameters [19,20,21], but these algorithms describe the scatters regardless of some characteristics caused by diversity of canopy (such as different growth stage) or encounter difficulties due to their numerous variables and parameters [22]. A good number of efforts based on different multi-configuration radar data have been made to eliminate the contribution of vegetation [16,23,24,25]. Srivastava et al. [24] offered a simple soil moisture retrieval model by using multi-incidence angle radar data, which incorporates the effects of surface roughness, crop cover, and soil texture, without any assumption or prior knowledge. Jagdhuber et al. [25] combined multi-angular polarimetric SAR data and decomposition techniques to estimate soil moisture under vegetation, investigating the potential of soil moisture retrieval in vegetated areas through decomposition of the scattering signature. In spite of the improvements, these approaches based on different multi-configuration radar data also encounter a practical problem: a number of multi-angular data are difficult to acquire, limiting the wide application of these algorithms. In order to avoid the difficulties, a semi-empirical water cloud model was proposed, which has been widely used to estimate soil moisture or vegetation parameters in vegetated surfaces because of its simplicity [18]. As a first-order radiative transfer solution, the water-cloud algorithm models the canopy as a cloud of water droplets held in place by the vegetation matter, neglecting higher order scattering. Subsequently, several authors improved this model [26,27,28]. Bindlish et al. [22] applied the water cloud model to derive the necessary vegetation parameters to confirm the vegetation backscattering effects. Yang et al. [29] eliminated the backscattering effects of vegetation in order to estimate the temporal and spatial distribution of relative soil moisture change information by using multi-angular and multi-temporal RADARSAT data. Gherboudj et al. [30] combined the water cloud model and Oh model to retrieve crop height, soil surface roughness, crop water content, and soil moisture.
For soil moisture estimation in vegetated areas, another key problem is the frequency band. Previous research indicated that long wavelength microwave L-band is better able to penetrate vegetation than C-band [31]. The SAR signal at L-band is sensitive to soil moisture in spite of the increment of vegetation; therefore, L-band is more suitable for soil moisture retrieval than C-band [30,32]. However, most orbiting sensors operate at higher frequencies, and the SAR signal at L-band is still affected by vegetation, which should also be corrected [33,34,35]. Thus, it is still necessary to conduct research at high frequencies. In this paper, we put an effort to investigate the potential of RADARSAT-2 SAR data in vegetated areas of plateau pasture.
Although a good number of studies have been undertaken to investigate the retrieval of SMC based on SAR data, some issues still need further research. Most of the previously mentioned research focused on the retrieval of SMC for cropland, such as wheat, rape, soybeans, and corn. Retrieval of soil moisture in typical mountain and plateau areas is rarely reported in the literature [36,37,38]. Paloscia et al. [37] proposed a method for soil moisture retrieval in mountainous areas using ENVISAT/ASAR images based on the Artificial Neural Network (ANN), but only images in VV polarization were taken into account. Pasolli et al. [38] analyzed different feature extraction strategies for the exploitation of fully polarimetric RADARSAT-2 SAR data in the retrieval of soil moisture content in Alpine meadows and pastures, whereas the proposed method was not extended to a relatively wide area. Bertoldi et al. [39] assessed the capability of RADARSAT-2 products to reproduce surface soil moisture patterns in mountain grassland areas, which could improve spatial parameterization and validation of distributed hydrological models in mountain grassland areas. In mountain and plateau areas, the high heterogeneity of vegetation cover enhances the difficulty of separating the scattering contributions of vegetation from the radar signal [36]. Topographic effects caused by local terrain enhance the challenge of such studies. Further work is necessary to improve the retrieval of SMC in mountain and plateau areas.
Besides vegetation and surface roughness, topography is another important factor to be taken into consideration. SMC retrieval approaches that eliminate the effect of vegetation and surface roughness based on multi-angle or time series radar data are inapplicable in mountain and plateau areas, owing to layover and shadowing effects caused by topography [39]. The complexity and specific requirements of a number of SAR data also impose restriction on their applications in such areas. Some studies retrieved SMC with Artificial Neural Network methodology (ANN), which is accurate and fast compared with other methods, even in mountain areas. A large number of ground measurements are needed to obtain robust ANN model, which restricts its application for mountain and plateau areas that are difficult to access [37]. Severe environmental conditions restrict the acquisition of plenty of ground experimental data. Consequently, the implementation of complicated theoretical models (e.g., MIMICS, IEM) is also problematic because of the lack of input parameters and prior information. Thus, the water cloud model was chosen to eliminate the effect of vegetation on radar signal in plateau areas. In order to overcome the lack of a good quantity of field measured data, especially surface roughness, the Chen model and Dubois model were used to retrieve SMC in this study area. The Chen model is a simple algorithm based on rough surface scattering model, which could decouple the effects of surface roughness. In addition, the Dubois model could be used to obtain the dielectric constant of soil as a function of HH and VV backscattering coefficients to minimize the effects of surface roughness.
This study aims to: (1) evaluate the potential use of RADARSAT-2 SAR images for soil moisture estimation in plateau pasture regions; (2) investigate whether the water cloud model, Chen model, and Dubois model could be used in plateau pasture regions; and (3) compare the performance of the Chen model and Dubois model in such areas.

2. Study Area and Dataset
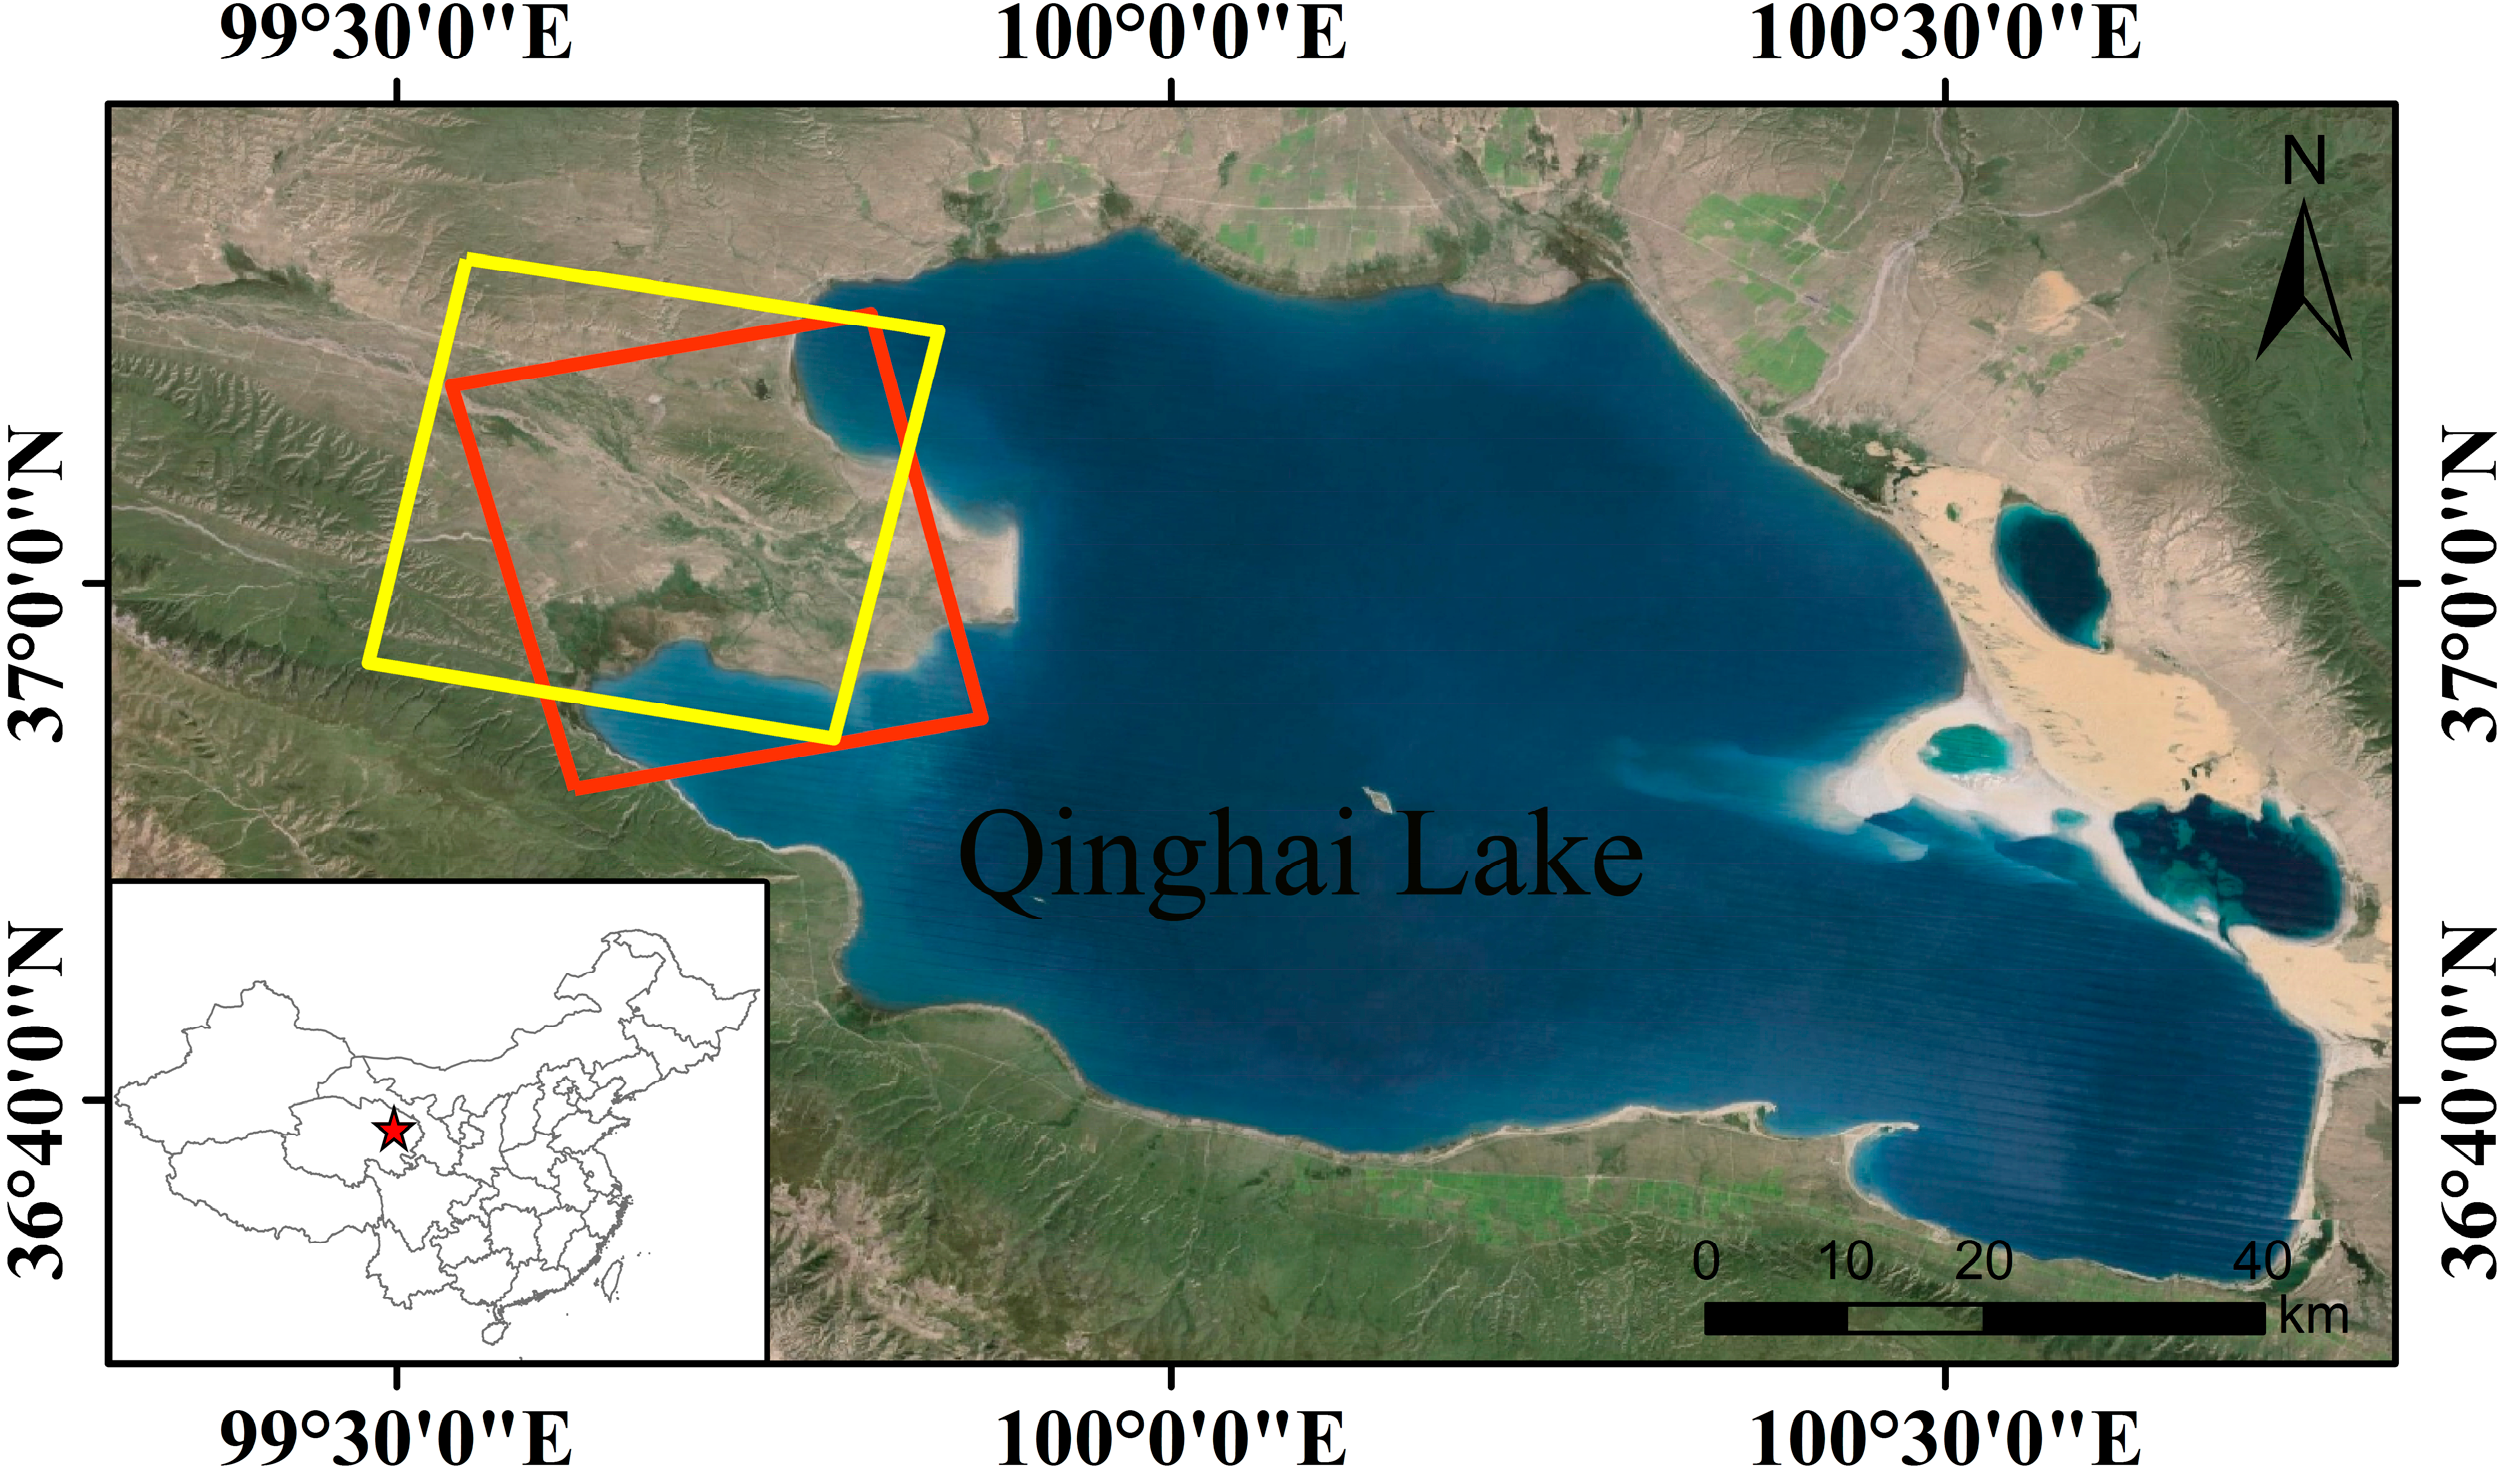
2.1. Study Area

The study area is a plateau pasture region located in the county of Gangcha (latitude 36°59ʹ, longitude 99°40ʹ) in the northeastern Tibetan Plateau, China (Figure 1). It is part of the Qinghai Lake watershed, the largest salt water lake in China, which covers an area of about 180 km2 with altitudes ranging from 3195 m above sea level (a.s.l.) to 3330 m.a.s.l. Seven kinds of soil are distributed in this area, including chestnut soil, alpine meadow soil, boggy soil, aeolian sandy soil, mountain meadow soil, chernozem, and solonchak; the main soil type is chestnut soil. The soil is alkaline because of the presence of readily soluble salts.
Natural grassland, which consists of grassland pasture and meadow pasture, is the main land cover type of this study area. A variety of vegetation types (Achnatherum splendens, Poa crymophila, Pedicularis resupinata, and Stipa capillata) widely exist here; their spatial distributions are the result of hydrothermal conditions, which can be affected by climate and topography, and thus the distribution of the grassland in this region is inhomogeneous. Based on the seasonal pattern, the grassland can be divided into northern summer pasture and southern autumn pasture.
Figure 1. Location of the study area in the Qinghai Lake watershed, northeastern Tibetan Plateau, China. Red and yellow rectangles indicate the location of the RADARSAT-2 images (full-polarimetric, fine quad mode) acquired on 29 September 2012 and 13 May 2013, respectively.
Remotesensing 07 01279 g001
The climate of this region is plateau semi-arid, with cool summers and cold winters. The annual amount of rainfall is about 300–400 mm; 90% of rainfall concentrates from May to September. Spatial and temporal changes of SMC in this period are significant for the growth conditions of pasture in this region.
The Qinghai Lake watershed is an important animal husbandry base in China. Nevertheless, a series of ecological and environmental problems severely threatened the ecological safety and economic development of this region in recent years, including grassland degeneration, lake withering, and soil desertification. SMC is a key variable for these ecological and environmental problems. Therefore the SMC of the Qinghai Lake watershed has been a research hotspot recently.

2.2. SAR Data

In this study, we used C-band (5.3 GHz) RADARSAT-2 SAR data in fine quad polarization (fully polarimetric mode) with an incidence angle ranging from 18° to 30° and a nominal spatial resolution of 8 m. Two images with nominal image coverage 25 km × 25 km comprising the study area were acquired on 29 September 2012 and 13 May 2013, during the two field campaigns (Table 1). NEST (Next Esa Sar Toolbox), which is developed by ESA, and ENVI were used to pre-process the SAR images. Through radiometric calibration, the backscattering coefficient (σ°) in decibels (dB) was transformed from the DN (digital number) of each pixel of original SLC (Single Look Complex) products. A 5 × 5 Enhanced Lee filter window was applied to the SAR data to reduce the speckle noise. Then the data were geometrically corrected and transferred from slant range to ground range. The final pixel spacing of RADARSAT-2 images is 3.13 m. Figure 2 shows the pre-processing results of SAR data; different polarimetric configurations were combined in these images to highlight the different information of the surface.
Table 1. List of the RADARSAT-2 images collected over the study area.
Acquisition DateAcquisition Time (UTC)Scene CentreBeam ModeIncidence Angle (°)OrbitPolarization
29 September 201211:07:5699:07:56r 29,2Fine quad-pol18.5–20.3Asc.Full-pol
13 May 201323:31:2299:31:22013ol2Fine quad-pol28.1–29.8Des.Full-pol
Figure 2. RADARSAT-2 composite false RGB images (HH = red, HV = green, VV = blue) acquired at different dates: (a) 29 September 2012; (b) 13 May 2013. Both images were acquired in fine quad polarization mode, fully polarimetric. Red and yellow circles indicate the locations of the field measurements in September 2012 and May 2013, respectively.
Remotesensing 07 01279 g002

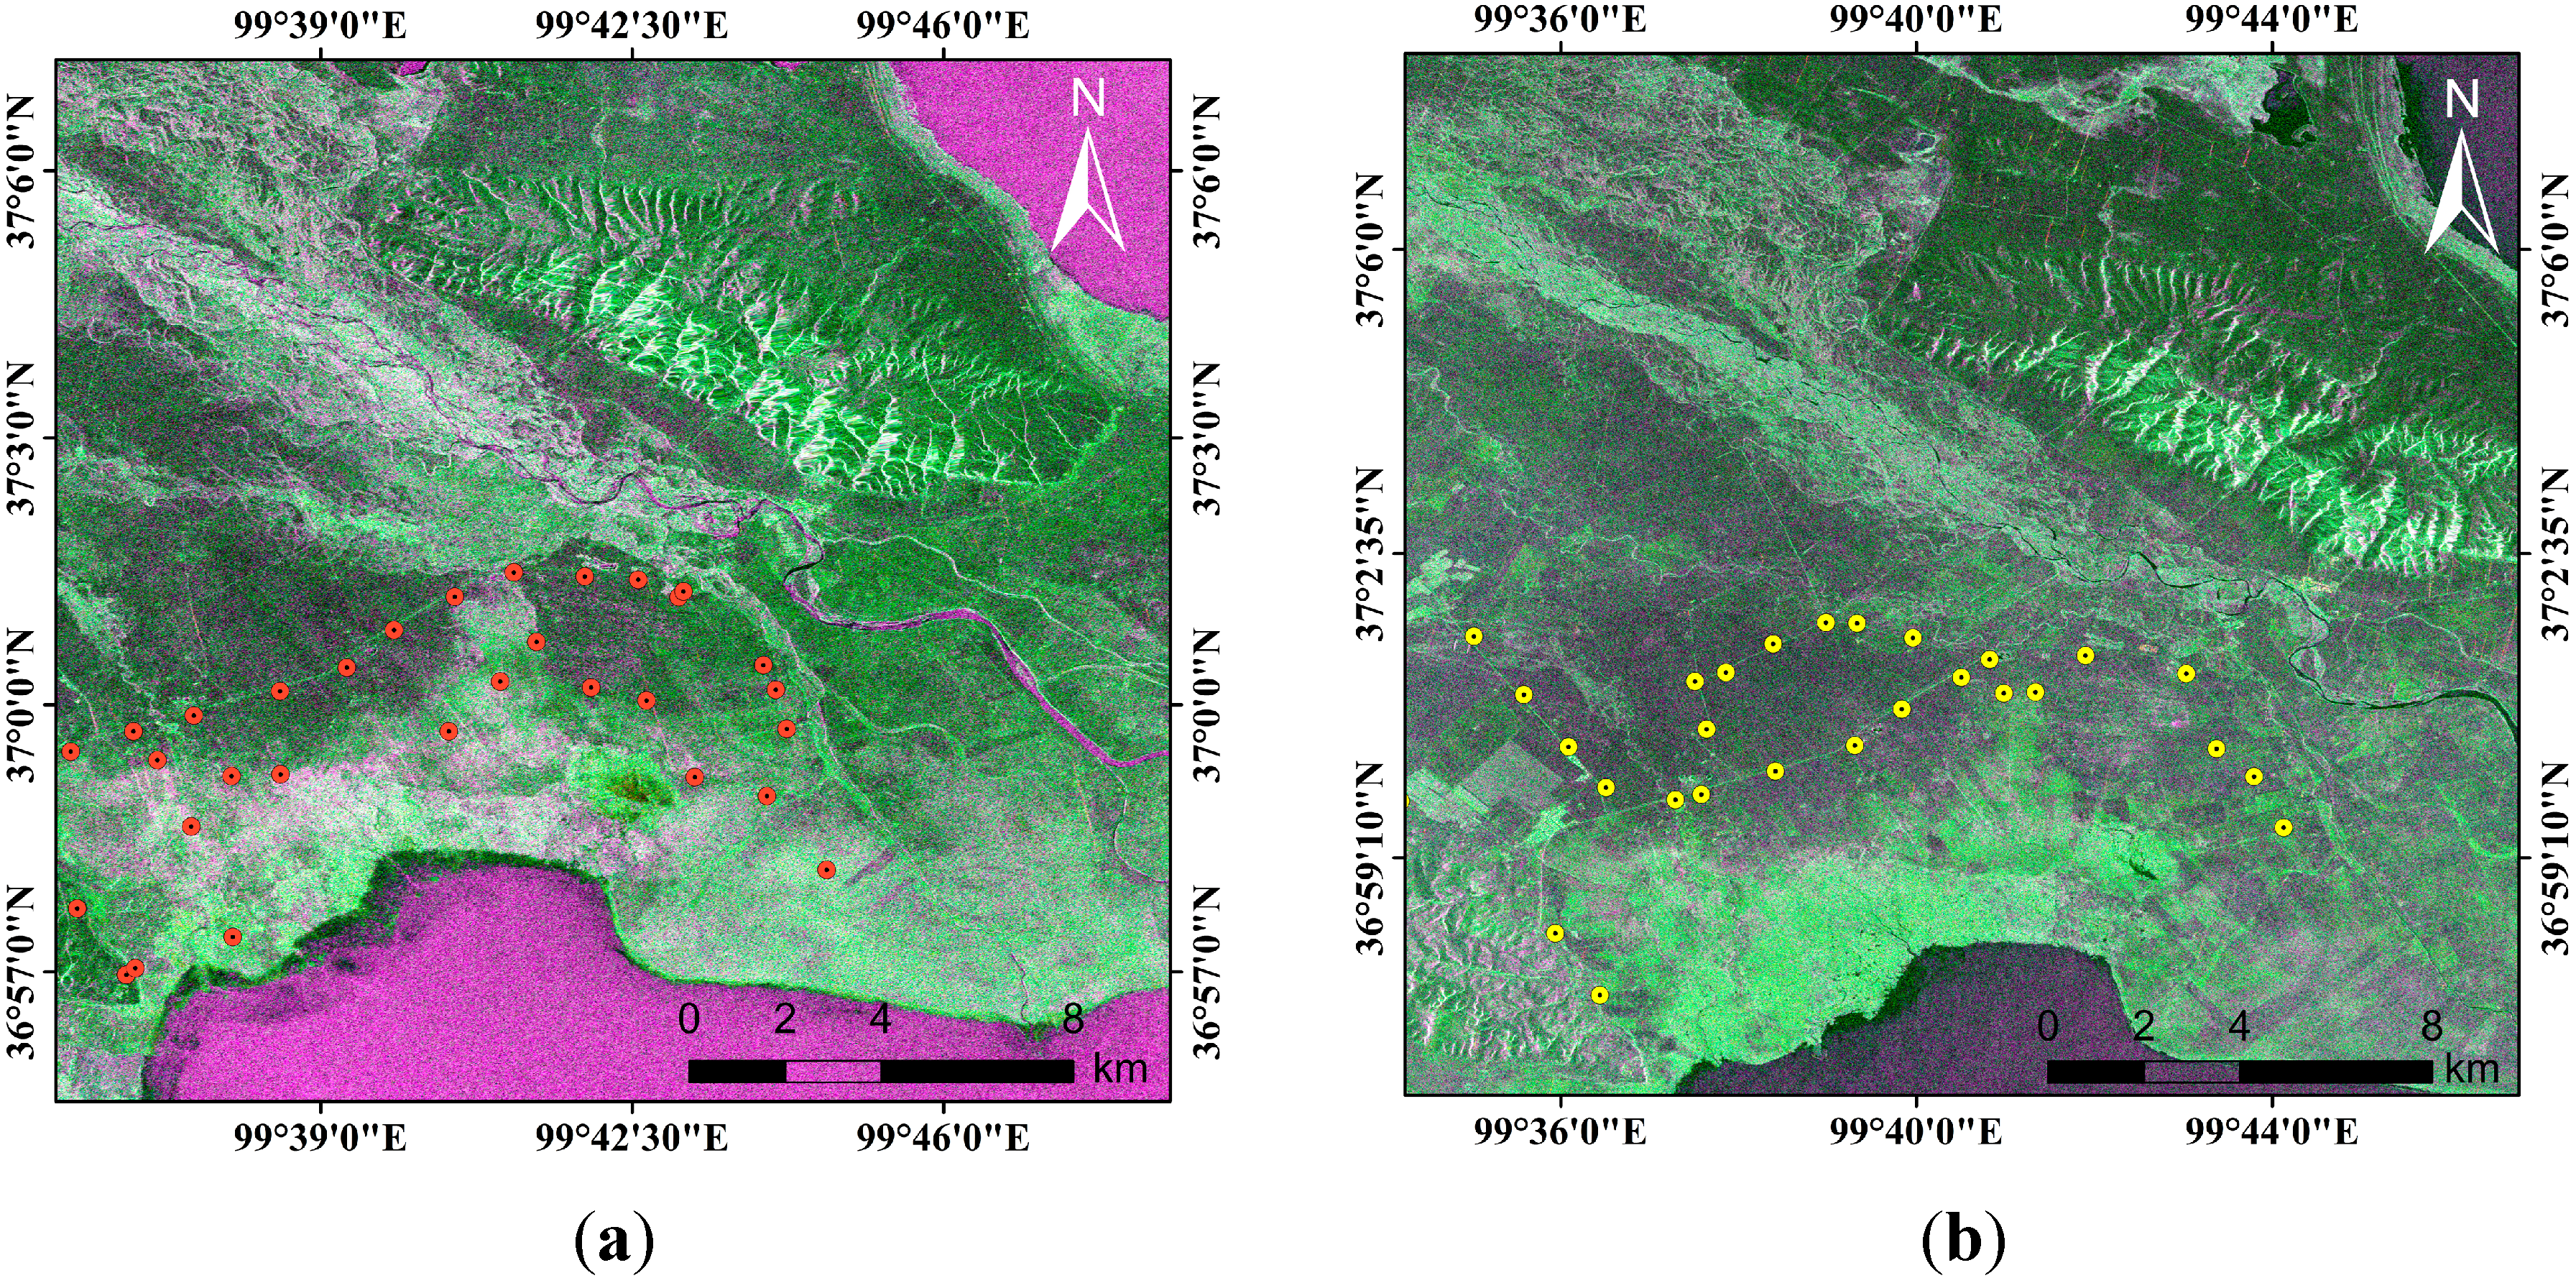
2.3. Experimental Measurements

Simultaneously with the acquisition of RADARSAT-2 images, field campaigns of soil surface roughness, moisture, bulk density, and dielectric constant were carried out over the study area in September 2012 and May 2013. The timing of field campaigns is due to the rainfall concentration period (from May to September), which has been mentioned in the previous section. For the two RADARSAT-2 satellite overpasses, 33 and 32 sampling sites were selected, respectively, for their representativeness in terms of land cover, topography, and vegetation type to collect ground data. For each sampling site, 3 sampling points were selected within an area of 100 m × 100 m as the representative. The distance between the sampling points is about 30 m. In addition, a Garmin GPS (global positioning system) was used to identify and register the active sampling positions at 1 m accuracy.
Soil surface roughness was measured using a 2-meter needle profiler and a digital camera with a tripod. Six field photographs of soil surface roughness at each sampling point were subsequently processed using an IDL application to calculate root mean square (rms) height (h) and correlation length (l); 3 of these photographs were along the row direction and the others were across the row direction. The rms height(s) range from 0.4 to 5.1 cm with the correlation length (l) ranging from 9 to 65 cm in September 2012; while, in May 2013, s and l are from 0.2 to 1.6 cm and from 28.5 to 51.5 cm, respectively (Table 2).
Table 2. Roughness measurements in study areas.
DateSoil Surface ParametersMinMaxAverage
September 2012RMS height (cm)0.45.11.2
Correlation length (cm)9.06524.1
May 2013RMS height (cm)0.21.60.7
Correlation length (cm)28.551.541.3
Soil moisture is assumed to be equal to the mean value calculated from 9 samples acquired from the top 5 cm of soil for each site (3 samples per point and 3 points per site), using a gravimetric method. Meanwhile, the soil bulk density of each site was also measured (six measurements per site). The volumetric soil moisture (mv) was then obtained by multiplying the gravimetric soil moisture by the dry soil bulk density. The collection of soil samples was almost simultaneous with the satellite overpass. According to the statistics, the volumetric soil moisture of September 2012 ranges from 10.5% to 42.3%, with a standard deviation of about 8.2, and the volumetric soil moisture of May 2013 varied from 13% to 38.5%, with a standard deviation of about 5.9 (Table 3). The soil dielectric constant at 5 cm depth was acquired using a Agilent Technologies 85070E Dielectric Probe Kit through calculating the mean value of 9 measurements per sampling point.
Table 3. Volumetric soil moisture (%) in study areas.
DateMinMaxAverageStandard Deviation
September 201210.542.324.48.2
May 201313.038.521.05.9

2.4. Ancillary Data

In order to reduce the significant effect on backscattering of the satellite sensor caused by vegetation status and topography, ancillary data were applied in this study. Two SRTM DEM images covering the study area were used to obtain the local terrain information and geometrically corrected the SAR data. An ETM+ image and a TM image on the same day or within a few days after the RADARSAT-2 overpasses were also acquired (Table 4). After a series of preprocessing steps, two NDWI (Normalized Difference Water Index) images were obtained from these two optical images. Auxiliary data were geometrically rectified to the same project of SAR data and resampled with a bilinear convolution method to match the SAR images. In addition, land cover data of the study region were used to assist the masking of the water and urban area in SAR images.
Table 4. List of the optical images collected over the study area.
Acquisition DateAcquisition Time(UTC)Scene CentreSensor Type
12 September 20123:51:32100°24′E/37°30′NLandsat ETM+
18 May 20133:58:07100°22′E/37°29′NLandsat TM

3. Methods Development

The aim of this section is to put forward an applicable inversion algorithm of SMC for the plateau pasture of the Qinghai Lake watershed, based on the data described in the previous section. After a variety of tests, the water cloud model and two semi-empirical models were implemented in SMC retrieval in this region.

3.1. Parameterization of Vegetation Effect

Vegetation canopy reduces the sensitivity of the response of the radar measurements to soil moisture, which biases its estimation. Rigorous theoretical models can be applied to simulate the effect of vegetation canopy in a variety of sceneries with different vegetation and soil conditions. Nevertheless, numerous parameters and mathematical complexity hampered the wide application of these physical models. To separate the vegetation contribution from radar signal, the water cloud model was applied in this study [18,22,32], which is a first-order correction solution.
The water cloud model was developed based on the following assumptions: (1) Canopy is modeled as a homogeneous water cloud comprised of identical uniformly distributed water particles; (2) multiple scattering between the canopy and soil surface can be neglected; and (3) the vegetation height and cloud intensity, a function of volumetric water content of the vegetation, are the most significant variables. Thus the total backscattering coefficient in the water-cloud model is described as follows:
σ 0 = σ v e g 0 + τ 2 σ s o i l 0 ,
where σ° is the total backscattering from vegetated surface, σ°veg is the volume scattering from vegetation itself, σ°soil is the direct scattering from soil surface, and τ2 is two-way transmissivity of the vegetation layer. τ2 can be expressed as:
τ 2 = exp ( 2 b V W C secθ )
and σ°veg is expressed as a function of vegetation water content:
σ v e g 0   = a V W C cosθ ( 1 τ 2 ) ,
where θ is the incident angle, VWC is the vegetation water content (kg/m2), and a and b are parameters depending on vegetation type and incident angle [27]. Accurate estimation of a and b requires prior knowledge about vegetation, such as vegetation water content, biomass, etc. Thus, fitting the model against experimental datasets is used to determine a and b parameters. Moreover, VWC can be calculated from the NDVI (Normalized Difference Vegetation Index) by using an empirical model [27,29]. However, according to previous research [40,41,42,43], NDVI is based on the red (RED) and near-infrared (NIR) bands, which are located in the strong chlorophyll absorption region and high reflectance plateau of vegetation canopies respectively. Thus NDVI represents chlorophyll rather than water content. Compared with NDVI, the NDWI-based method for VWC estimation was found to be superior based upon a quantitative analysis of bias and standard error. Thus, VWC can be calculated from NDWI by the following equation:
V W C = e 1 NDW I 2 + e 2 NDWI ,
where e1 and e2 are model empirical parameters. NDWI, which was developed by Gao [41], is expressed as:
NDWI = R NIR R SWIR R NIR + R SWIR .
Based on the previous equations, the full expression of the water cloud model can be written as:
σ 0 = a V W C cosθ ( 1 exp ( 2 b V W C secθ ) ) + σ s o i l 0 exp ( 2 b V W C secθ ) .
Subsequently, the bare soil backscattering coefficients can be computed from Equations (4) and (6).

3.2. Soil Moisture Retrieval Models for Bare Soil

3.2.1. Dubois Model

Dubois et al. [8] developed a semi-empirical algorithm based on scatterometer data to model the radar backscattering coefficients σ°HHsoil and σ°VVsoil, which are radar backscattering coefficients of bare soil. The Dubois model is optimized for bare soil; it gives best results for kh ≤ 2.5, mv ≤ 35%, and θ ≥ 30°. This model can be expressed as:
σ H H s o i l 0 = 10 2.75 ( cos 1.5 θ sin 5 θ ) 10 0.028 εtanθ ( k h s i n θ ) 1.4 λ 0.7
σ V V s o i l 0 = 10 2.35 ( cos 3 θ sin 3 θ ) 10 0.046 εtanθ ( k h s i n θ ) 1.1 λ 0.7 ,
where θ is the incidence angle, ɛ is the real part of the dielectric constant, h is the RMS surface height, λ is the wavelength in cm, and k is the wave number given as k = 2π/λ. The radar configuration and geographic characteristics of this study area meet the applicable conditions of the Dubois model. Compared with in situ data, this model can infer soil moisture with an accuracy of 4.2% when applied to areas where the model was not developed.

3.2.2. Chen Model

Chen et al. [7] developed a simple soil moisture retrieval algorithm for bare soil based on the Monte Carlo method and IEM. To choose the optimal radar parameter ranges for soil moisture inversion, the Monte Carlo method was used to perform sensitivity analysis, which ignored less important parameters associated with the inversion of soil moisture. Subsequently, an empirical soil moisture retrieval algorithm was obtained by multivariate linear regression analysis on the basis of numerous samples generated with the IEM, which can be expressed as:
ln m v = C 1 σ H H s o i l 0 σ V V s o i l 0 + C 2 θ + C 3 f + C 4 ,
where σ°HHsoil°VVsoil is the ratio of co-polarized backscattering coefficients of bare soil in dB, θ is incidence angle in degrees, f is the frequency in GHz, and C1, C2, C3, and C4 are fitting parameters. This model was applied to estimate the soil moisture from experimental data obtained by Oh et al. [6], which included three frequencies (1.5 GHz, 4.75 GHz, and 9.5 GHz) and angles from 10 to 50 degrees, and good retrieval was achieved.

3.3. Soil Moisture Retrieval Models for Vegetated Soil

Based on RADARSAT-2 and NDWI data, we combined the water cloud model with the Dubois model and Chen model to present new retrieval algorithms of soil moisture for vegetated areas.

3.3.1. Development Based on Dubois Model

In the Dubois model, the co-polarized backscattering coefficient can be described as functions of incidence angle, wavelength, wave number, dielectric constant, and surface roughness parameter. Thus soil moisture can be acquired by inverting this model dependent on the sufficient information of soil surface roughness. Nevertheless, obtaining prior knowledge of surface roughness enhances the difficulty of soil moisture retrieval. To overcome this difficulty, fine quad polarization, which is one kind of fully polarimetric mode, was selected as the acquisition mode in this study. Based on these multiple polarized data, Equations (7) and (8) of the Dubois model can be inverted to obtain Equation (10), a function of dielectric constant and other known parameters of sensor configuration, independent to surface roughness, which can be written as:
ε = 1 0.024 tanθ log 10 ( 10 0.19 λ 0.15 σ H H s o i l 0 ( cosθ ) 1.82 ( sinθ ) 0.93 σ V V s o i l 0 0.786 ) .
Therefore, the dielectric constant of near surface soil can be calculated by Equation (10) based on the Dubois model. Subsequently, soil moisture content can be obtained by using the empirical model developed by Topp et al. [13], a function of the dielectric constant and the volumetric soil moisture content, which is independent of soil type, soil density, soil temperature, and soluble salt content. It can be expressed as:
m v = 5.3 × 10 2 + 2.92 × 10 2 ε 5.5 × 10 4 ε 2 + 4.3 × 10 6 ε 3 .
However, σ°HHsoil and σ°VVsoil in Equation (10) are backscattering coefficients of bare soil in HH- and VV-polarization, which should be acquired from total backscattering coefficients of images by using the water cloud model. Equation (6) can be inverted in the following expression:
σ s o i l 0 = 1 + σ i m a g e 0 a V W C cosθ exp ( 2 b V W C secθ ) ,
where a and b are different in HH-and VV- polarization, hence σ°HHsoil can be described as:
σ H H s o i l 0 = 1 + σ H H i m a g e 0 a h V W C cosθ exp ( 2 b h V W C secθ )
and σ°VVsoil can be written as:
σ V V s o i l 0 = 1 + σ V V i m a g e 0 a v V W C cosθ exp ( 2 b v V W C secθ ) ,
where σ°HHimage and σ°VVimage are total backscattering coefficients of images in HH- and VV-polarization. Subsequently, the volumetric soil moisture content can be acquired by combining Equations (4), (10), (11), (13), and (14).

3.3.2. Development Based on Chen Model

The Chen model is easy to use on account of its simplicity; it also takes σ°HHsoil°Vvsoil, incidence angle and frequency into consideration. The Chen model can be solved to provide the inversion model of volumetric soil moisture content, after the elimination of vegetation effect, by using the water-cloud model; σ°HHsoil and σ°VVsoil in Equation (9) are also backscattering of bare soil in HH- and VV-polarization as well as Equations (13) and (14). Therefore, volumetric soil moisture content will be computed with RADARSAT-2 and NDWI data on the basis on Equations (4), (9), (13), and (14). It is noted that σ°HHsoil°VVsoil in Equation (9) is in dB.

3.4. Evaluation Indexes

The performance of the two models was investigated using the following indexes: Root Mean Square Error (RMSE) and the ratio of (standard error of) prediction to standard deviation (RPD):
RMSE = 1 N i = 1 N ( P i O i ) 2
RPD = S D R M S E ,
where N is the number of samples data, Pi is the predicted value of sample i, and Oi is the measured value of sample i. Moreover, RPD is a guideline for evaluating the robustness and effectiveness of environmental property model calibrations such as soil, sediments, animal manure, and compost, which have been used by many researchers [44,45]. The categorization of Chang et al. [45] was adopted in this study. Calibrations can be classified as good if RPD > 2 and satisfactory if 0.8 < R2 < 1.0, can be improved by using different calibration strategies if 1.4 ≤ RPD ≤ 2.0 and 0.5 < R2 ≤ 0.8, and are classified as not useful if RPD < 1.4 and R2 < 0.5.

4. Results and Discussion

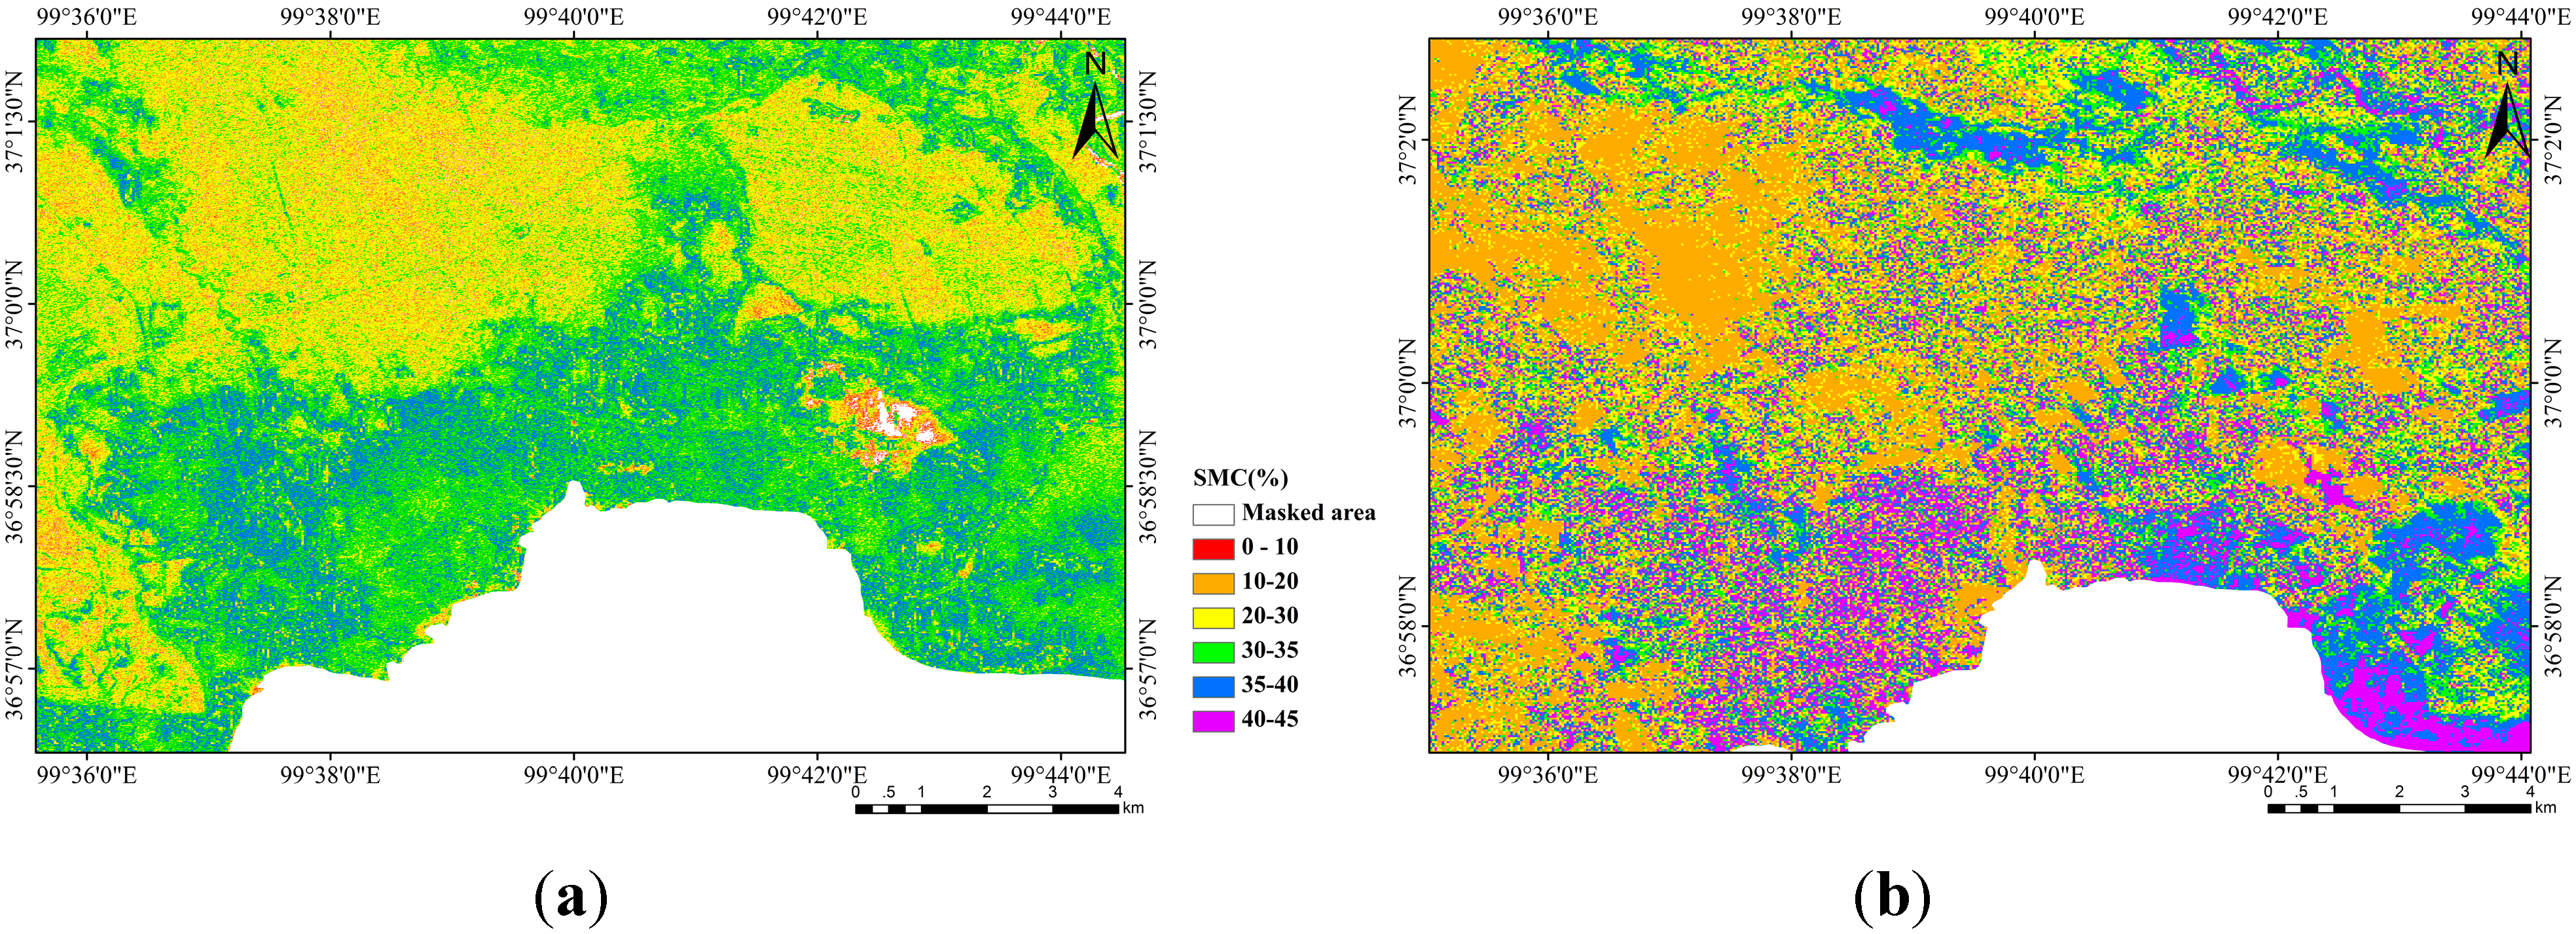
4.1. Soil Moisture Retrieval
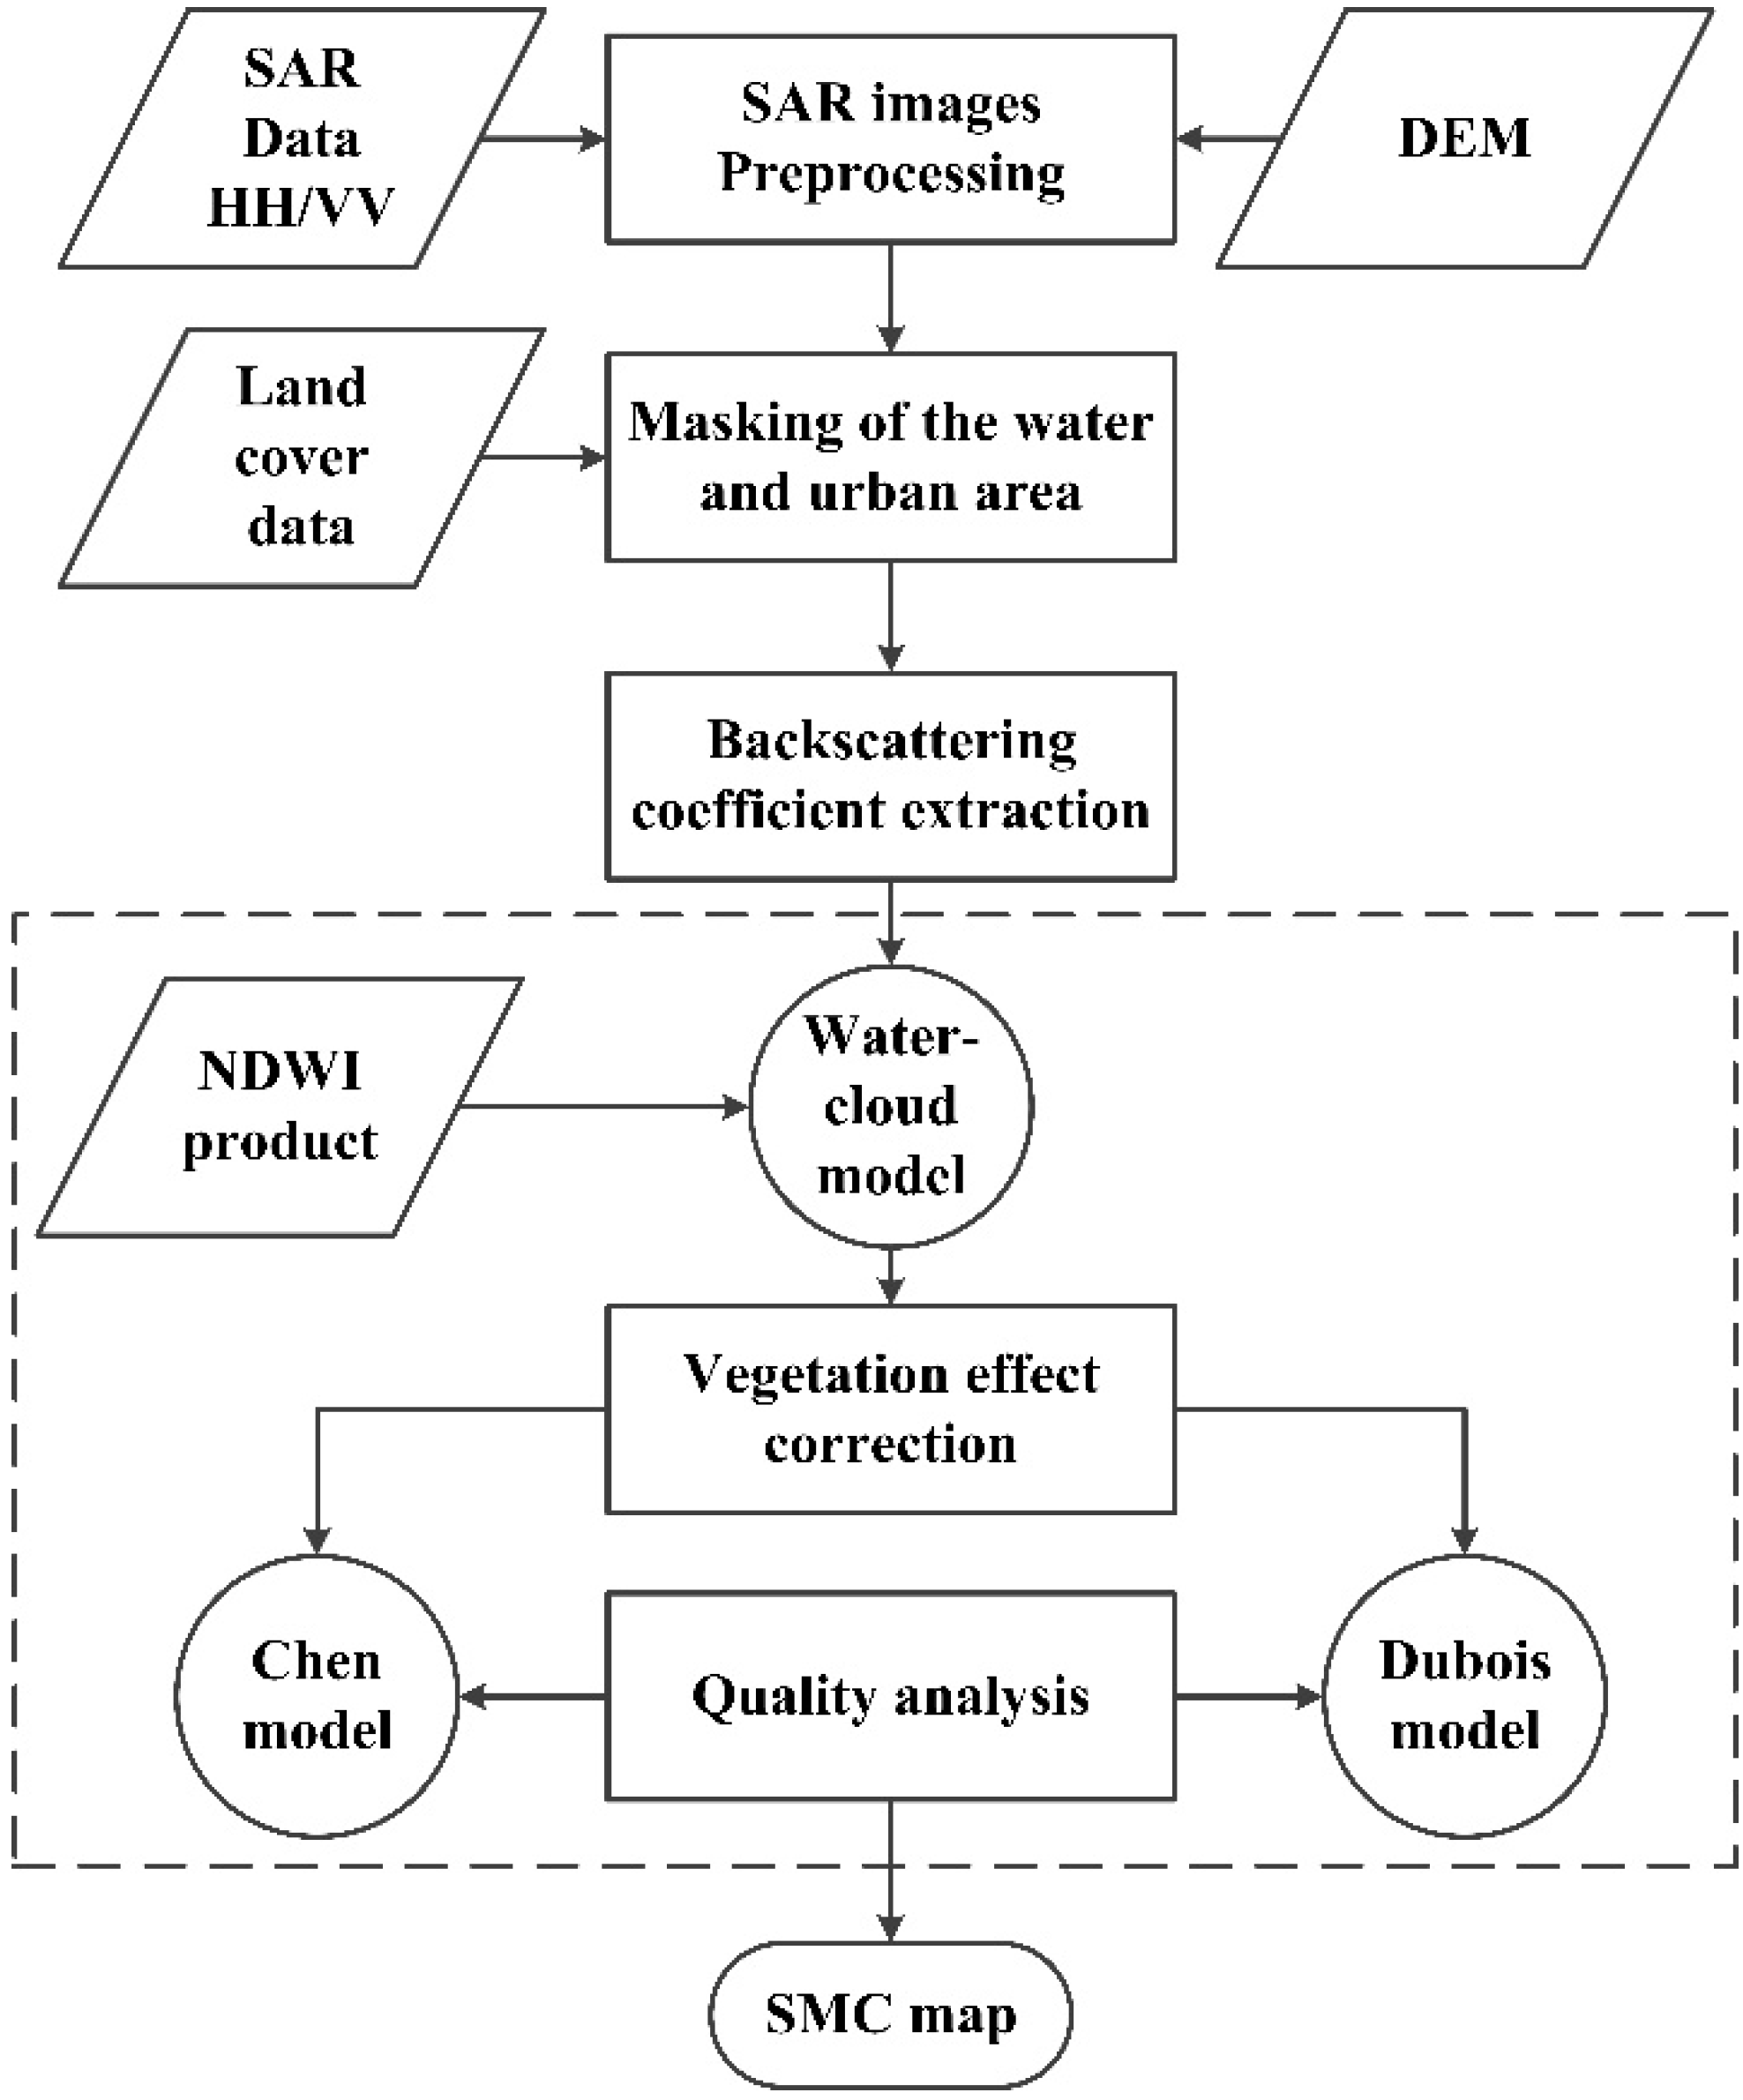
Based on the combination of previous empirical models of vegetation parameters and semi-empirical models of soil moisture for bare soil, new soil moisture retrieval methods are proposed. The flowchart of soil moisture retrieval in the vegetated areas is presented in Figure 3. The complete procedure can be described by the following steps:
(1)
Pre-processing, classification, and masking of SAR data.
(2)
Parameterization of vegetation contribution in backscattering, based on NDWI, the water cloud model, the empirical relationship between VWC and NDWI, and development of new soil moisture.
(3)
Fitting of parameters in new soil moisture algorithms for vegetated areas on the basis of experiment data.
(4)
Generation of soil moisture map.
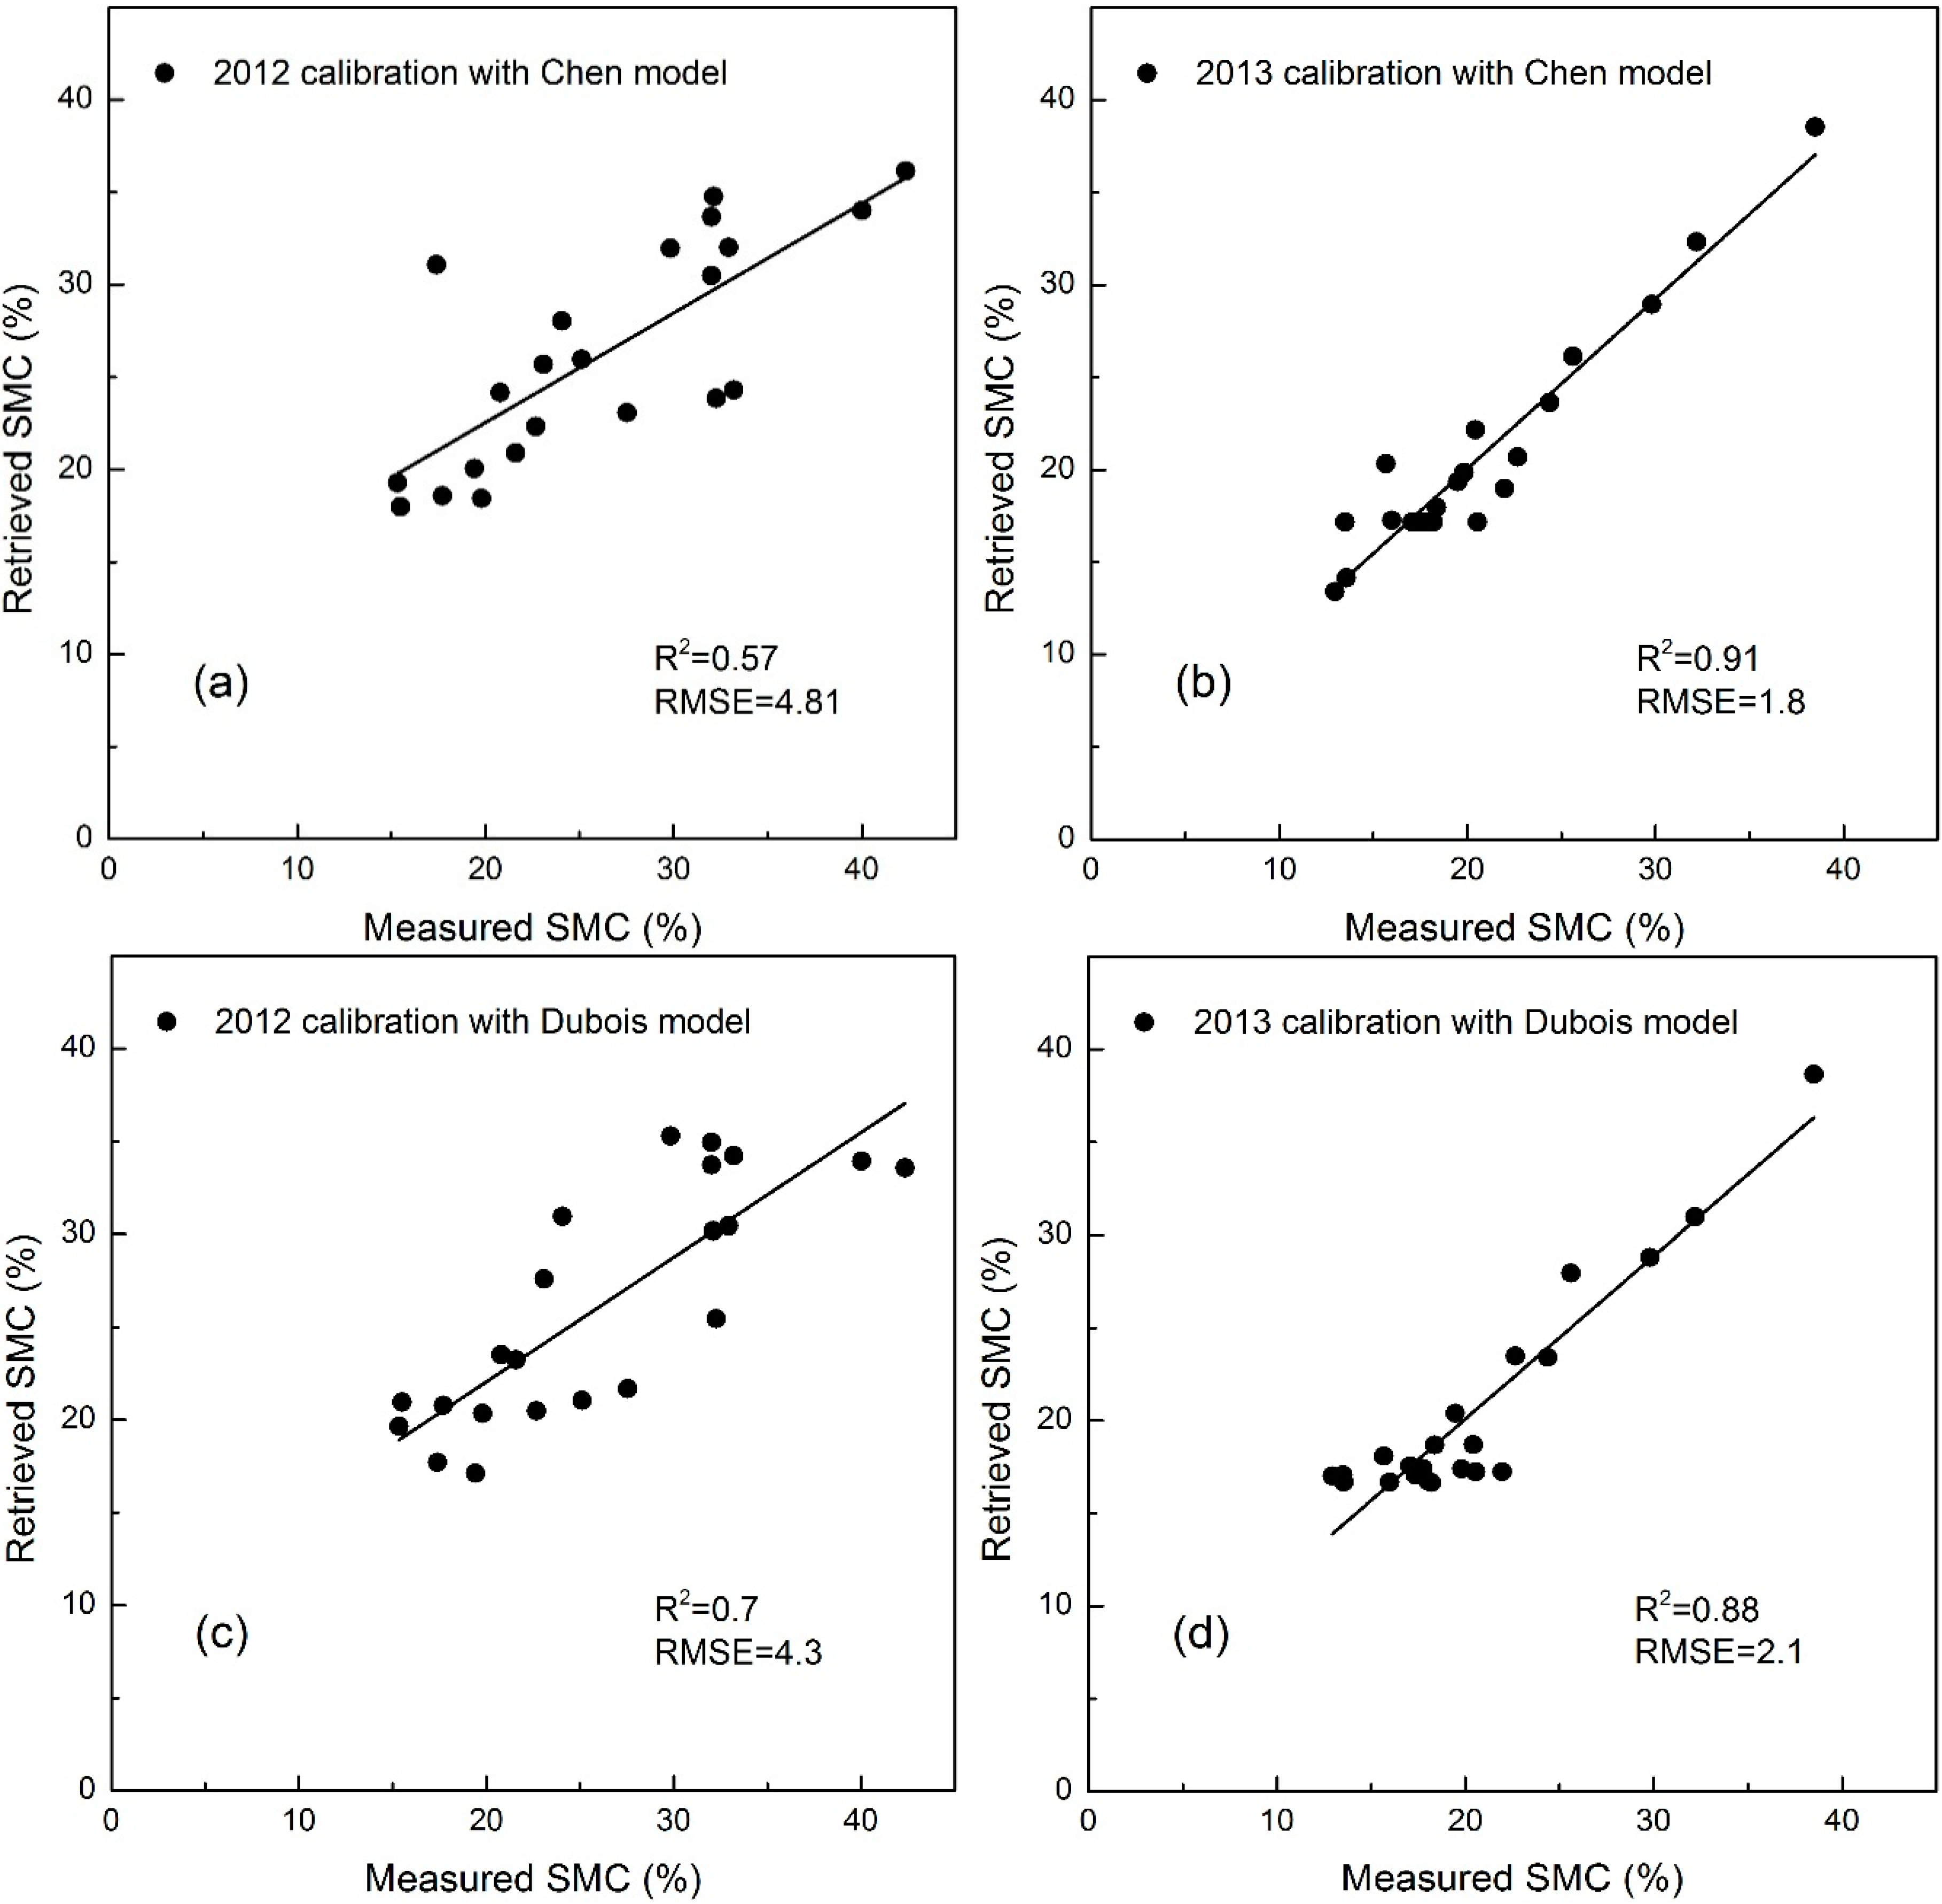
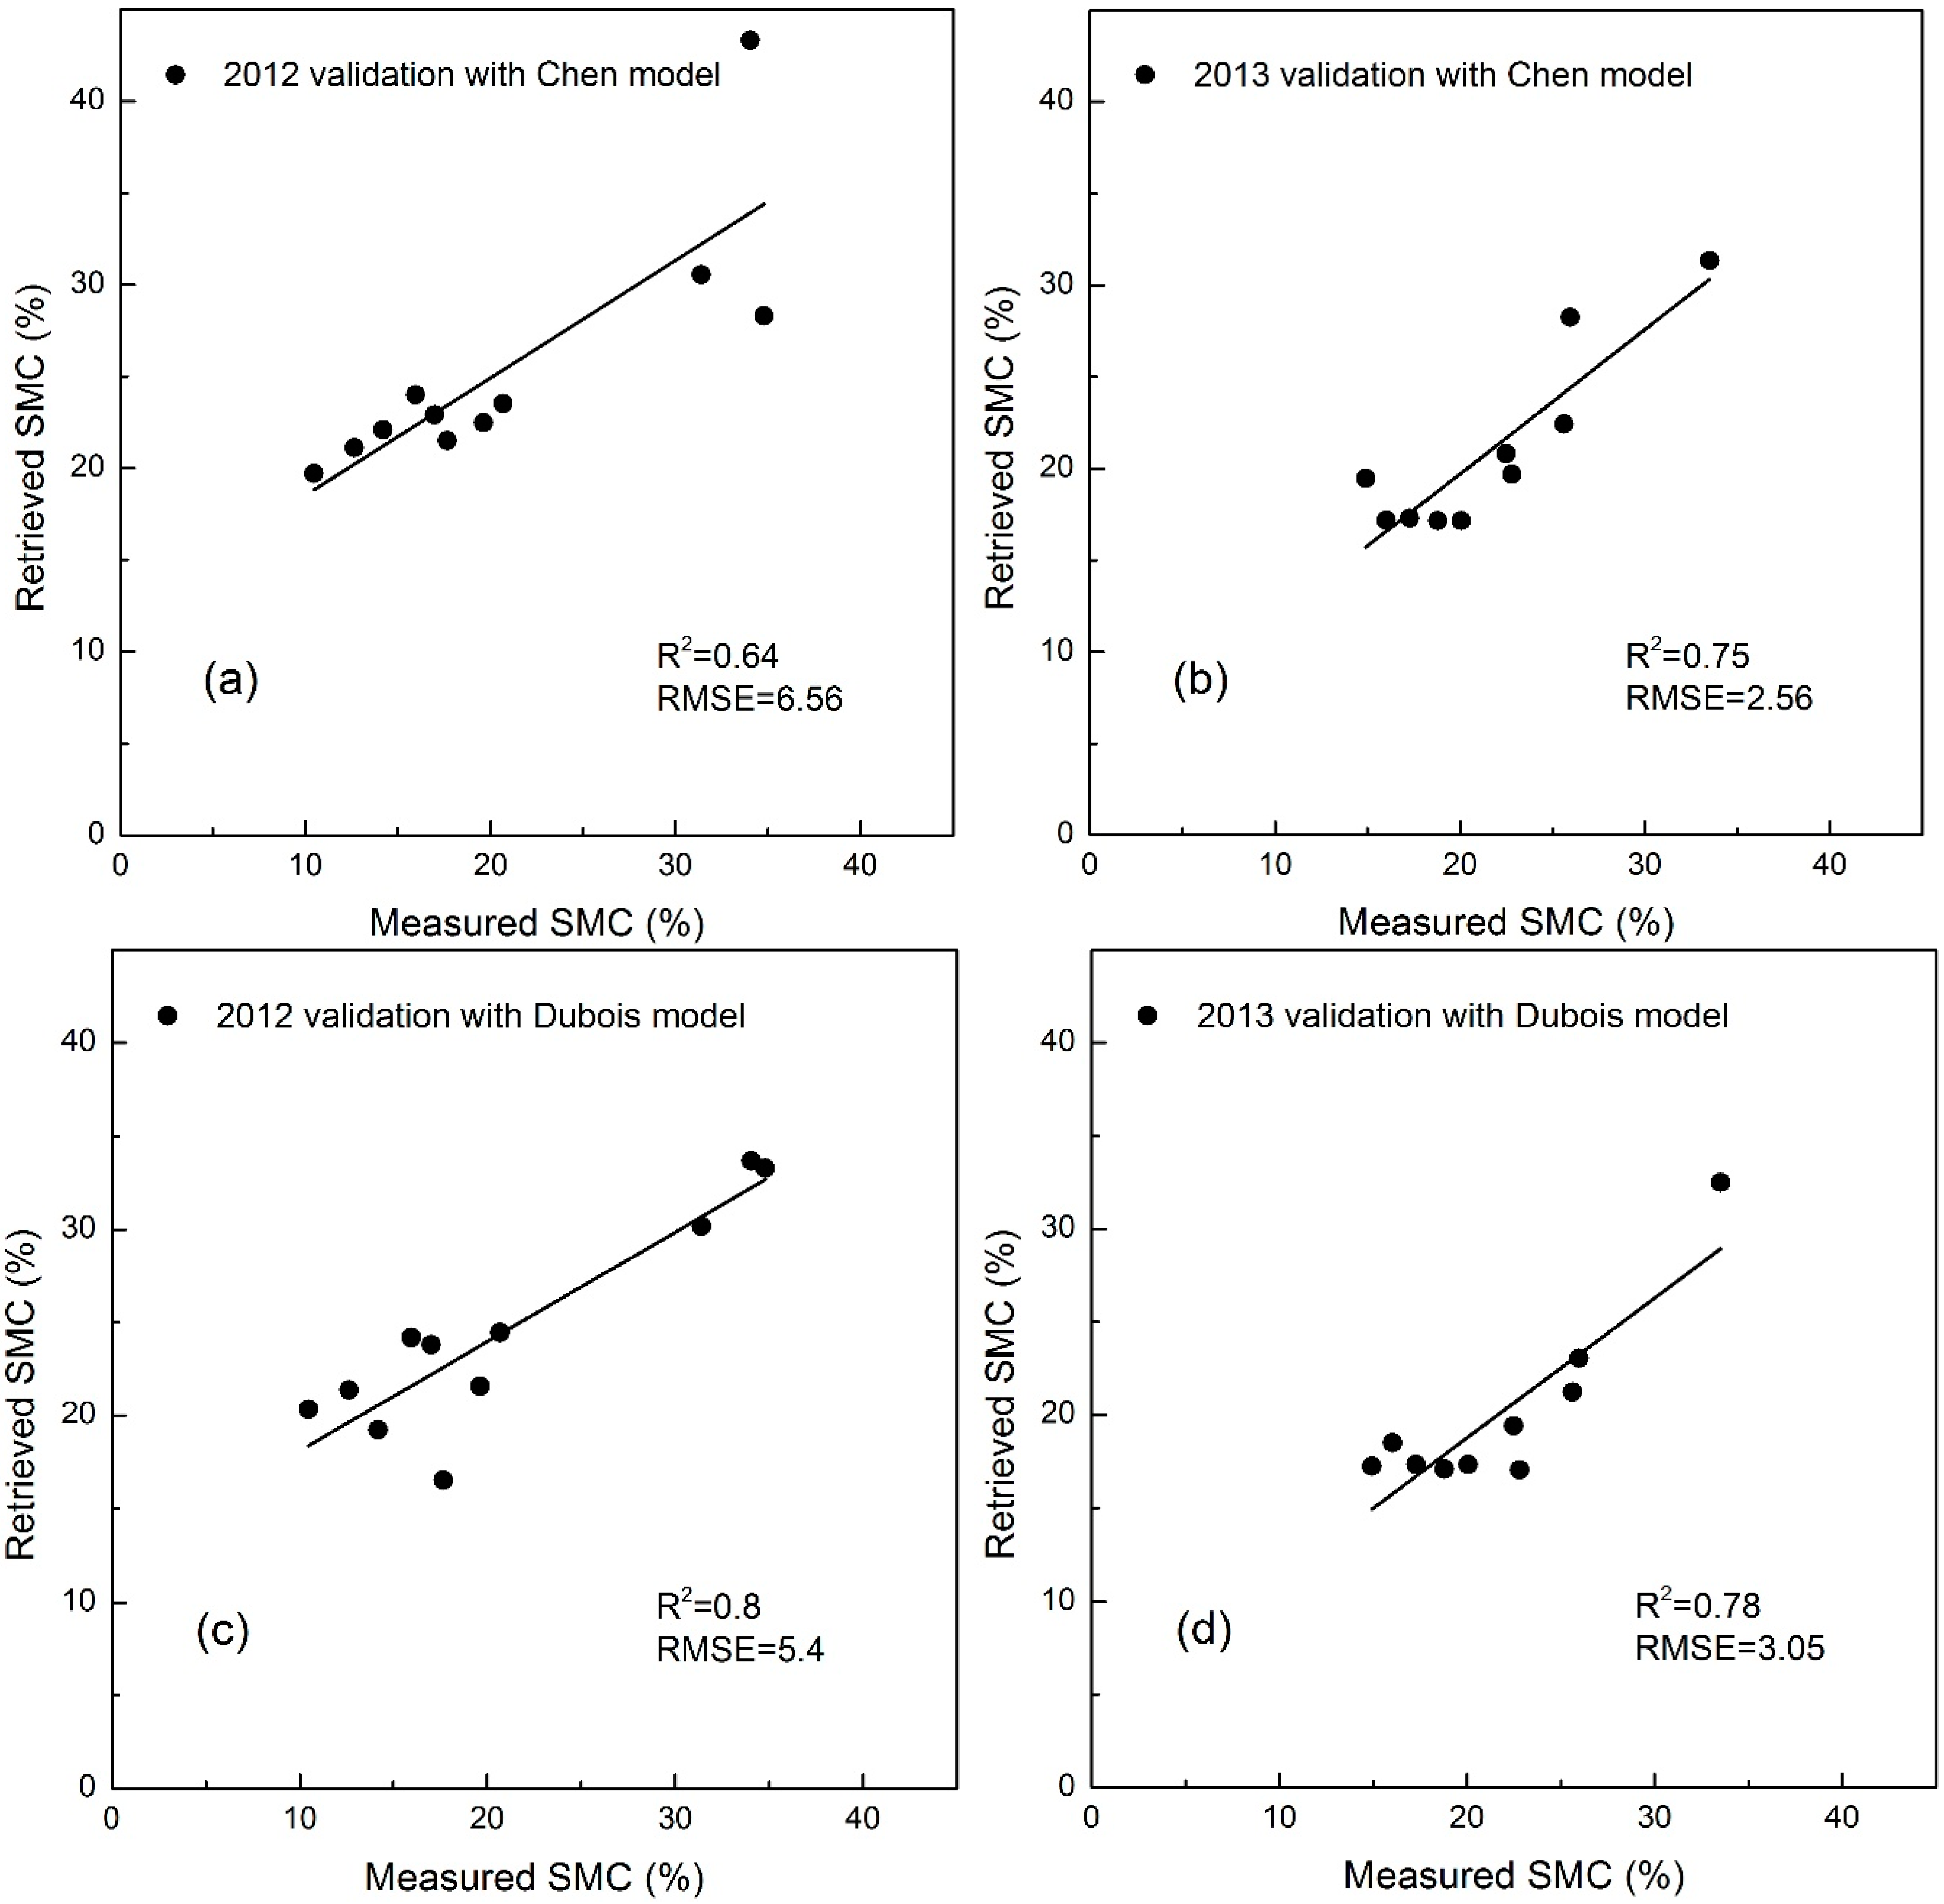
Figure 3. Flowchart of soil moisture retrieval.
Remotesensing 07 01279 g003
After soil moisture retrieval models were proposed, they were applied in the study area to assess the performance of soil moisture inversion. A total of 33 samples were acquired in 2012, of which 22 random samples were used to build models for SMC retrieval, and the remainder applied to validate the performance of models. For data in 2013, 32 samples were obtained in total, of which 22 random samples were selected to build models and the remaining 10 samples used to validate models. The inputs of models are RADARSAT-2 configuration parameters (incidence angle, frequency), mean values of field data (volumetric soil moisture content), NDWI, and backscattering coefficients for each field. Quasi-Newton methods, an adoptive optimization algorithm for finding the local maxima and minima of functions, are used to fit the empirical parameters of two algorithms in the fitting process. Newton’s method assumes that the function can be locally approximated as a quadratic in the region around the optimum, and uses the first and second derivatives to find the stationary point. The result shown in Figure 4 represents the comparisons between measured and retrieval volumetric soil moisture obtained through two developed approaches, and Table 5 provides the statistical results.
The determination coefficients R2 and RMSE of retrieval volumetric soil moisture based on the Chen model for the first experiment are 0.59 and 4.81, and 0.92 and 1.76 for the second experiment (Figure 4a,b), while the R2 and RMSE values of the developed Dubois model are (0.7, 4.3) and (0.88, 2.2) for the two experiments, respectively (Figure 4c,d). Compared with the Chen model, the retrieval of volumetric soil moisture based on the Dubois model agrees better with field measurements for the first experiment in September 2012. The performance of the two developed models is similar for the second experiment in May 2013. Calibration results indicate that the performances of the two models in May 2013 were both better than in September 2012. Therefore, the developed Dubois model gives the best compromise in terms of stability and accuracy.
Figure 4. Comparison between measured and retrieved soil moisture using the two developed models for calibration: (a) Chen model in September 2012 (R2 = 0.57, RMSE = 4.81); (b) Chen model in May 2013 (R2 = 0.91, RMSE = 1.8); (c) Dubois model in September 2012 (R2 = 0.7, RMSE = 4.3); and (d) Dubois model in May 2013 (R2 = 0.88, RMSE = 2.1).
Remotesensing 07 01279 g004
Table 5. Summary of validation results of the two models for soil moisture retrieval.
DateModelPerformanceRMSER2RPD
September 2012Chencalibration4.810.571.57
validation6.60.641.25
Duboiscalibration4.320.701.74
validation5.400.801.60
May 2013Chencalibration1.760.933.5
validation2.560.751.84
Duboiscalibration2.160.882.87
validation3.050.781.74

4.2. Validation of Methods

To investigate the performance of the developed models, validation is undertaken using the validation dataset that was not used to fit the two algorithms. The fitting results from the inversion dataset were applied in the validation dataset; subsequently, soil moisture values can be calculated from RADARSAT-2 configuration parameters, NDWI, and backscattering coefficients using the developed models. Relationships between the predicted soil moisture values and field measurements are provided in Figure 5, and the summary of RMSE, R2, and RPD is given in Table 5. In accordance with the previous results, the validation results of the developed Dubois model are more stable than those of the Chen model; the RMSE, R2, and RPD values of the developed Dubois model are (5.4, 0.8, 1.6) and (3.05, 0.78, 1.74) for the two experiments, respectively, and (6.6, 0.64, 1.25) and (2.56, 0.75, 1.84) for the developed Chen model. The validation results from May 2013 are better than those of September 2012 for both models. According to the calibration and validation results, the developed Dubois model is the suitable method for practical application in this study area.
Figure 5. Comparison between measured and retrieved soil moisture using the two models for validation: (a) Chen model in September 2012 (R2 = 0.64, RMSE = 6.56); (b) Chen model in May 2013 (R2 = 0.75, RMSE = 2.56); (c) Dubois model in September 2012 (R2 = 0.8, RMSE = 5.4); and (d) Dubois model in May 2013 (R2 = 0.78, RMSE = 3.05).
Remotesensing 07 01279 g005
Error assessment of the models indicates that the water cloud model and Dubois model outperformed the other model, with RPD = 1.6 and R2 = 0.8 for the first experiment in September 2012 and RPD = 1.74 and R2 = 0.78 for the second experiment in May 2013. According to the categorization of Chang et al., this model belongs to Category B, which can satisfy the accuracy and stability requirements for soil moisture inversion in the study area, though it can be improved by using different calibration strategies.

4.3. Discussion

Two developed models for soil moisture that combine the water cloud model, Chen model, and Dubois model have been proposed and performed on fully polarimetric C-band data acquired by RADARSAT-2 within two campaigns conducted in September 2012 and May 2013 in the Qinghai Lake watershed. Evaluation results indicate that the developed Dubois model is promising in this study area. Thus the developed model can be reliably extended to produce soil moisture maps of vegetated areas in plateau pasture regions on the basis of optical satellite data and fully polarimetric SAR data. Soil moisture content maps over the study area produced by this developed model are illustrated in Figure 6; they cover different areas due to different sampling locations. The areas in which SMC retrieval was impossible are masked according to the land cover data of the study region. Figure 6 demonstrates that SMC in May 2013 was relatively lower than in September 2012, from 10% to 20% in most of the study area except for a few areas close to rivers or lakes. In September 2012, the SMC was from 20% to 35% in most of the study area. The peak value of SMC was usually in September. Such a moisture condition is a result of rainfall and meltwater. Here 90% of rainfall is concentrated from May to September, and melting of snow and ice starts in spring. The water holding capacity and grow stage of different grass types enhance this phenomenon. In addition, lakes and rivers also affect the distribution of SMC. From Figure 6, it can be seen that the SMC is basically inversely proportional to the distance to water. According to the SMC maps of the study area, growth conditions of pasture can be predicted, which is significant for solving pasture degradation in this region.
Figure 6. SMC maps of the extended area (28 × 12 km2) produced by the developed Dubois model using two RADARSAT-2 images acquired at different dates: (a) 29 September 2012; (b) 13 May 2013. Water and urban areas are masked in white.
Remotesensing 07 01279 g006
Compared with the developed Dubois model, the developed Chen model is unstable for SMC retrieval in this study area. The main reason is that the Chen model was built using only the single scattering term of the IEM, thus the surface slope for which the Chen model is applicable is limited to less than about 0.4, owing to the neglect of multiple scattering. While terrain change in the study area is obvious, the surface slopes of many areas cannot satisfy this condition.
The predicted SMC of the developed Dubois model agreed better with field measurements in terms of accuracy and stability than the Chen model, due to decoupling the effect of surface roughness from radar backscattering. Soil surface roughness affects the response of radar backscattering. To solve this problem, it is assumed that the overall temporal variation of soil surface roughness is tiny or constant during the field campaign period because the study area is relatively large. Subsequently, solving the Dubois equation can minimize the effect of soil surface roughness in part. The Dubois model is usually applied in croplands, which are bare soil or covered by relatively homogeneous crops [8,46,47,48]. Combining the water cloud model and the Dubois model, we proposed the model and applied it in a plateau pasture region for the first time. It demonstrates satisfactory accuracy and stability compared with the conventional application of this model in cropland or plains. In addition, the simplicity of this model improves the effectiveness of soil moisture retrieval in this region. It should be noted that the theoretical backscattering models have difficulty of retrieving the soil moisture or simulating the surface features due to the complexity of the surface conditions (high heterogeneity of vegetation cover and terrain changes).
Therefore, the developed Dubois model is a suitable model for SMC estimation of the study area in terms of accuracy and stability, while inversion and validation results demonstrated that the experiment results of May 2013 were better than those from September 2012, no matter which model. The major problem is heterogeneous vegetation cover of plateau pasture, which also explains why the previous performance of the Dubois model in croplands [8,46,47,48] was slightly better than its application in this study area. In the water cloud model, the vegetation is modeled as a homogeneous horizontal cloud of identical water spheres, uniformly distributed throughout the space defined by the soil surface and the vegetation height [22]. Multiple scattering between canopy and soil is neglected. Nevertheless, from May to September, vegetation parameters of the study area have changed substantially, including plant height, vegetation water content, vegetation density, and vegetation coverage. In May, pastures have similar characteristics because plant height is short and vegetation water content is low, which can be considered as homogeneous in the water cloud model. However, in September, the ground surface becomes highly heterogeneous, owing to different growing conditions of various vegetation types and grazing of cattle and sheep. The results indicated that the performance of water-cloud modeling was influenced by the vegetation coverage.
Paloscia et al. [37] also proposed a method for SMC estimation of vegetated areas in challenging environmental conditions, using C-band SAR data. They generated three pixel-by-pixel soil moisture maps of their test site in mountainous areas from C-band Environment Satellite Advanced Synthetic Aperture Radar (ENVISAT/ASAR) images by using feedforward MLP NN whatever the vegetation coverage. Although the obtained results are satisfactory, the method’s applicability is restricted due to the limited representativeness of the study area. Compared with their research, the parameters of our developed model, based on semi-empirical models, have physical significance. One drawback of our model is that the backscattering coefficients of HH and VV polarizations, which are available only with the quad polarization data, are required. The monitoring coverage is limited.

5. Conclusions

In this paper, two SMC retrieval methods over vegetated areas in plateau pasture regions are developed. The methods are based on the water cloud model, Chen model, and Dubois model, with a combination of RADARSAT-2 SAR and optical satellite data. Validation results prove that the developed Dubois model with minimum prior information needed was the suitable SMC retrieval algorithm for the challenging environment of plateau pasture regions in terms of its accuracy and stability compared with the developed Chen model.
In the developed models, the vegetation effect on the radar measurements was eliminated by using the water cloud model on the basis of NDWI produced from optical images. Moreover, the empirical relationship between NDWI and the water content of vegetation with the models could be built with different types and coverage of vegetation. NDWI data used to acquire vegetation water content was calculated from Landsat optical images. Temporal resolution of Landsat may limit its applicability. The potential of estimating vegetation water content in the study area with MODIS data could be investigated to overcome these limitations.
The developed Dubois model can decrease the surface roughness effect by solving Dubois equations. In the areas where surface roughness is not available, the models are promising. However, further analysis and more experiments in wider moisture and environmental conditions are indispensable. For areas where roughness data are easily obtained, improved modeling of the backscattering coefficient will be tried to integrate surface roughness to enhance the accuracy. To exploit the quad polarimetric SAR data of RADARSAT-2, polarimetric decomposition will be investigated to improve the SMC estimation in the study area. Other methods (e.g., ANN) are also expected to improve the precision.

Acknowledgments

The authors are grateful to several institutions for support in sampling, experiments, and data interpretation. This work was supported by the CAS Knowledge Innovation Program (KZCX2-EW-320), the NSFC Project Fund (41301394, U1303285, 41431174, 61471358), Key technology studies on soil and water environmental parameters in the Qinghai Lake watershed (Grant No. 2012BAH31B02-03) provided by the Department of Science and Technology of Qinghai Province, the fund of the State Key Laboratory of Remote Sensing Science (Y1Y00201KZ), and Special Project of Science and Technology foundation work provided by the Ministry of Science and Technology (2014FY210500).

Author Contributions

Xun Chai was responsible for the development of soil moisture retrieval models and data analysis. Yun Shao, Tingting Zhang, and Huaze Gong conceived and designed experiments. Xun Chai and Tingting Zhang performed field experiments. Long Liu and Kaixin Xie contributed analysis tools.

Conflicts of Interest

The authors declare no conflict of interest.

References

  1. Dobson, M.C.; Ulaby, F.T.; Hallikainen, M.T.; El-Rayes, M.A. Microwave dielectric behavior of wet soil-part II: Dielectric mixing models. IEEE Trans. Geosci. Remote Sens. 1985. [Google Scholar] [CrossRef]
  2. Ulaby, F.; Moore, R.; Fung, A. Microwave Remote Sensing: Active and Passive, Vol. III: Scattering and Emission Theory, Advanced Systems and Applications; Artech House, Inc.: Dedham, MA, USA, 1986. [Google Scholar]
  3. Giacomelli, A.; Bacchiega, U.; Troch, P.A.; Mancini, M. Evaluation of surface soil moisture distribution by means of SAR remote sensing techniques and conceptual hydrological modelling. J. Hydrol. 1995, 166, 445–459. [Google Scholar] [CrossRef]
  4. Fung, A.K.; Li, Z.; Chen, K.S. Backscattering from a randomly rough dielectric surface. IEEE Trans. Geosci. Remote Sens. 1992, 30, 356–369. [Google Scholar] [CrossRef]
  5. Baghdadi, N.; Zribi, M.; Loumagne, C.; Ansart, P.; Anguela, T.P. Analysis of TerraSAR-X data and their sensitivity to soil surface parameters over bare agricultural fields. Remote Sens. Environ. 2008, 112, 4370–4379. [Google Scholar] [CrossRef]
  6. Oh, Y.; Sarabandi, K.; Ulaby, F.T. An empirical model and an inversion technique for radar scattering from bare soil surfaces. IEEE Trans. Geosci. Remote Sens. 1992, 30, 370–381. [Google Scholar] [CrossRef]
  7. Chen, K.S.; Yen, S.K.; Huang, W.P. A simple-model for retrieving bare soil-moisture from radar-scattering coefficients. Remote Sens. Environ. 1995, 54, 121–126. [Google Scholar] [CrossRef]
  8. Dubois, P.C.; Van Zyl, J.; Engman, T. Measuring soil moisture with imaging radars. IEEE Trans. Geosci. Remote Sens. 1995, 33, 915–926. [Google Scholar] [CrossRef]
  9. Ulaby, F.T.; Dubois, P.C.; van Zyl, J. Radar mapping of surface soil moisture. J. Hydrol. 1996, 184, 57–84. [Google Scholar] [CrossRef]
  10. Baghdadi, N.; Aubert, M.; Cerdan, O.; Franchistéguy, L.; Viel, C.; Eric, M.; Zribi, M.; Desprats, J. Operational mapping of soil moisture using synthetic aperture radar data: Application to the touch basin (France). Sensors 2007, 7, 2458–2483. [Google Scholar] [CrossRef]
  11. Du, J.Y.; Shi, J.C.; Sun, R.J. The development of HJ SAR soil moisture retrieval algorithm. Int. J. Remote Sens. 2010, 31, 3691–3705. [Google Scholar] [CrossRef]
  12. Srivastava, H.S.; Patel, P.; Navalgund, R.R.; Sharma, Y. Retrieval of surface roughness using multi-polarized ENVISAT-1 ASAR data. Geocarto Int. 2007, 23, 67–77. [Google Scholar] [CrossRef]
  13. Topp, G.C.; Davis, J.L.; Annan, A.P. Electromagnetic determination of soil water content: Measurements in coaxial transmission lines. Water Resour. Res. 1980, 16, 574–582. [Google Scholar] [CrossRef]
  14. Hallikainen, M.T.; Ulaby, F.T.; Dobson, M.C.; El-Rayes, M.A.; Lil-Kun, W. Microwave dielectric behavior of wet soil-part 1: Empirical models and experimental observations. IEEE Trans. Geosci. Remote Sens. 1985. [Google Scholar] [CrossRef]
  15. Fung, A.K. Microwave Scattering and Emission Models and their Applications; Artech House: Boston, MA, USA/London, UK, 1994. [Google Scholar]
  16. Zribi, M.; Dechambre, M. A new empirical model to retrieve soil moisture and roughness from C-band radar data. Remote Sens. Environ. 2003, 84, 42–52. [Google Scholar] [CrossRef]
  17. Baghdadi, N.; Abou Chaaya, J.; Zribi, M. Semiempirical calibration of the integral equation model for SAR data in C-band and cross polarization using radar images and field measurements. IEEE Geosci. Remote Sens. Lett. 2011, 8, 14–18. [Google Scholar] [CrossRef]
  18. Attema, E.P.W.; Ulaby, F.T. Vegetation modeled as a water cloud. Radio Sci. 1978, 13, 357–364. [Google Scholar] [CrossRef]
  19. Ulaby, F.T.; Sarabandi, K.; McDonald, K.; Whitt, M.; Dobson, M.C. Michigan microwave canopy scattering model. Int. J. Remote Sens. 1990, 11, 1223–1253. [Google Scholar] [CrossRef]
  20. Yueh, S.H.; Kong, J.A.; Jao, J.K.; Shin, R.T.; le Toan, T. Branching model for vegetation. IEEE Trans. Geosci. Remote Sens. 1992, 30, 390–402. [Google Scholar] [CrossRef]
  21. Picard, G.; le Toan, T.; Mattia, F. Understanding C-band radar backscatter from wheat canopy using a multiple-scattering coherent model. IEEE Trans. Geosci. Remote Sens. 2003, 41, 1583–1591. [Google Scholar] [CrossRef]
  22. Bindlish, R.; Barros, A.P. Parameterization of vegetation backscatter in radar-based, soil moisture estimation. Remote Sens. Environ. 2001, 76, 130–137. [Google Scholar] [CrossRef]
  23. Baghdadi, N.; Holah, N.; Zribi, M. Soil moisture estimation using multi-incidence and multi-polarization ASAR data. Int. J. Remote Sens. 2006, 27, 1907–1920. [Google Scholar] [CrossRef]
  24. Srivastava, H.S.; Patel, P.; Sharma, Y.; Navalgund, R.R. Large-area soil moisture estimation using multi-incidence-angle RADARSAT-1 SAR data. IEEE Trans. Geosci. Remote Sens. 2009, 47, 2528–2535. [Google Scholar] [CrossRef]
  25. Jagdhuber, T.; Hajnsek, I.; Bronstert, A.; Papathanassiou, K.P. Soil moisture estimation under low vegetation cover using a multi-angular polarimetric decomposition. IEEE Trans. Geosci. Remote Sens. 2013, 51, 2201–2215. [Google Scholar] [CrossRef]
  26. Ulaby, F.; Allen, C.; Eger Iii, G.; Kanemasu, E. Relating the microwave backscattering coefficient to leaf area index. Remote Sens. Environ. 1984, 14, 113–133. [Google Scholar] [CrossRef]
  27. Jackson, T.; Schmugge, T. Vegetation effects on the microwave emission of soils. Remote Sens. Environ. 1991, 36, 203–212. [Google Scholar] [CrossRef]
  28. De Roo, R.D.; Du, Y.; Ulaby, F.T.; Dobson, M.C. A semi-empirical backscattering model at L-band and C-band for a soybean canopy with soil moisture inversion. IEEE Trans. Geosci. Remote Sens. 2001, 39, 864–872. [Google Scholar]
  29. Yang, H.; Shi, J.; Li, Z.; Guo, H. Temporal and spatial soil moisture change pattern detection in an agricultural area using multi-temporal Radarsat ScanSAR data. Int. J. Remote Sens. 2006, 27, 4199–4212. [Google Scholar] [CrossRef]
  30. Gherboudj, I.; Magagi, R.; Berg, A.A.; Toth, B. Soil moisture retrieval over agricultural fields from multi-polarized and multi-angular RADARSAT-2 SAR data. Remote Sens. Environ. 2011, 115, 33–43. [Google Scholar] [CrossRef]
  31. Jiancheng, S.; Wang, J.; Hsu, A.Y.; O’Neill, P.E.; Engman, E.T. Estimation of bare surface soil moisture and surface roughness parameter using L-band SAR image data. IEEE Trans. Geosci. Remote Sens. 1997, 35, 1254–1266. [Google Scholar] [CrossRef]
  32. Joseph, A.T.; van der Velde, R.; O’Neill, P.E.; Lang, R.; Gish, T. Effects of corn on C- and L-band radar backscatter: A correction method for soil moisture retrieval. Remote Sens. Environ. 2010, 114, 2417–2430. [Google Scholar] [CrossRef]
  33. Balenzano, A.; Mattia, F.; Satalino, G.; Davidson, M.W.J. Dense temporal series of C- and L-band SAR data for soil moisture retrieval over agricultural crops. IEEE J. Sel. Top. Appl. Earth Obs. Remote Sens. 2011, 4, 439–450. [Google Scholar] [CrossRef]
  34. Hasan, S.; Montzka, C.; Rüdiger, C.; Ali, M.; Bogena, H.R.; Vereecken, H. Soil moisture retrieval from airborne L-band passive microwave using high resolution multispectral data. ISPRS J. Photogramm. Remote Sens. 2014, 91, 59–71. [Google Scholar] [CrossRef]
  35. Ballester Berman, J.D.; Vicente Guijalba, F.; López Sánchez, J.M. Polarimetric SAR model for soil moisture estimation over vineyards at C-band. Prog. Electromagn. Res. 2013, 142, 639–665. [Google Scholar] [CrossRef]
  36. Luckman, A.J. The effects of topography on mechanisms of radar backscatter from coniferous forest and upland pasture. IEEE Trans. Geosci. Remote Sens. 1998, 36, 1830–1834. [Google Scholar] [CrossRef]
  37. Paloscia, S.; Pampaloni, P.; Pettinato, S.; Santi, E. Generation of soil moisture maps from ENVISAT/ASAR images in mountainous areas: A case study. Int. J. Remote Sens. 2010, 31, 2265–2276. [Google Scholar] [CrossRef]
  38. Pasolli, L.; Notarnicola, C.; Bruzzone, L.; Bertoldi, G.; Chiesa, S.D.; Niedrist, G.; Tappeiner, U.; Zebisch, M. Polarimetric RADARSAT-2 imagery for soil moisture retrieval in alpine areas. Can. J. Remote Sens. 2011, 37, 535–547. [Google Scholar] [CrossRef]
  39. Bertoldi, G.; Della Chiesa, S.; Notarnicola, C.; Pasolli, L.; Niedrist, G.; Tappeiner, U. Estimation of soil moisture patterns in mountain grasslands by means of SAR RADARSAT2 images and hydrological modeling. J. Hydrol. 2014, 516, 245–257. [Google Scholar] [CrossRef]
  40. Gamon, J.A.; Field, C.B.; Goulden, M.L.; Griffin, K.L.; Hartley, A.E.; Joel, G.; Penuelas, J.; Valentini, R. Relationships between NDVI, canopy structure, and photosynthesis in three Californian vegetation types. Ecol. Appl. 1995, 5, 28–41. [Google Scholar] [CrossRef]
  41. Gao, B.-C. NDWI—A normalized difference water index for remote sensing of vegetation liquid water from space. Remote Sens. Environ. 1996, 58, 257–266. [Google Scholar] [CrossRef]
  42. Jackson, T.J.; Chen, D.; Cosh, M.; Li, F.; Anderson, M.; Walthall, C.; Doriaswamy, P.; Hunt, E.R. Vegetation water content mapping using landsat data derived normalized difference water index for corn and soybeans. Remote Sens. Environ. 2004, 92, 475–482. [Google Scholar] [CrossRef]
  43. Chen, D.; Huang, J.; Jackson, T.J. Vegetation water content estimation for corn and soybeans using spectral indices derived from MODIS near- and short-wave infrared bands. Remote Sens. Environ. 2005, 98, 225–236. [Google Scholar] [CrossRef]
  44. Dunn, B.; Batten, G.; Beecher, H.; Ciavarella, S. The potential of near-infrared reflectance spectroscopy for soil analysis—A case study from the Riverine Plain of south-eastern Australia. Anim. Prod. Sci. 2002, 42, 607–614. [Google Scholar] [CrossRef]
  45. Chang, C.-W.; Laird, D.A.; Mausbach, M.J.; Hurburgh, C.R. Near-infrared reflectance spectroscopy–Principal components regression analyses of soil properties. Soil Sci. Soc. Am. J. 2001, 65, 480–490. [Google Scholar] [CrossRef]
  46. Baghdadi, N.; Zribi, M. Evaluation of radar backscatter models IEM, OH and Dubois using experimental observations. Int. J. Remote Sens. 2006, 27, 3831–3852. [Google Scholar] [CrossRef]
  47. Merzouki, A.; McNairn, H.; Pacheco, A. Mapping soil moisture using RADARSAT-2 data and local autocorrelation statistics. IEEE J. Sel. Top. Appl. Earth Obs. Remote Sens. 2011, 4, 128–137. [Google Scholar] [CrossRef]
  48. Prakash, R.; Singh, D.; Pathak, N.P. A fusion approach to retrieve soil moisture with SAR and optical data. IEEE J. Sel. Top. Appl. Earth Obs. Remote Sens. 2012, 5, 196–206. [Google Scholar] [CrossRef]

