Article

Field Spectroscopy in the VNIR-SWIR Region to Discriminate between Mediterranean Native Plants and Exotic-Invasive Shrubs Based on Leaf Tannin Content

by
Jan Rudolf Karl Lehmann
1,*,
André Große-Stoltenberg
1,
Meike Römer
2 and
Jens Oldeland
3
1
Institute of Landscape Ecology, University of Münster, Heisenbergstr. 2, Münster 48149, Germany
2
Institute of Pharmaceutical Technology and Biopharmacy, University of Münster, Corrensstr. 48, Münster 48149, Germany
3
Biodiversity, Evolution and Ecology of Plants, University of Hamburg, Ohnhorststr. 18, Hamburg 22609, Germany
*
Author to whom correspondence should be addressed.
Remote Sens. 2015, 7(2), 1225-1241; https://doi.org/10.3390/rs70201225
Submission received: 13 October 2014 / Accepted: 21 January 2015 / Published: 23 January 2015
(This article belongs to the Special Issue Field Spectroscopy and Radiometry)

Abstract

:
The invasive shrub, Acacia longifolia, native to southeastern Australia, has a negative impact on vegetation and ecosystem functioning in Portuguese dune ecosystems. In order to spectrally discriminate A. longifolia from other non-native and native species, we developed a classification model based on leaf reflectance spectra (350–2500 nm) and condensed leaf tannin content. High variation of leaf tannin content is common for Mediterranean shrub and tree species, in particular between N-fixing and non-N-fixing species, as well as within the genus, Acacia. However, variation in leaf tannin content has not been studied in coastal dune ecosystems in southwest Portugal. We hypothesized that condensed tannin concentration varies significantly across species, further allowing for distinguishing invasive, nitrogen-fixing A. longifolia from other vegetation based on leaf spectral reflectance data. Spectral field measurements were carried out using an ASD FieldSpec FR spectroradiometer attached to an ASD leaf clip in order to collect 750 in situ leaf reflectance spectra of seven frequent plant species at three study sites in southwest Portugal. We applied partial least squares (PLS) regression to predict the obtained leaf reflectance spectra of A. longifolia individuals to their corresponding tannin concentration. A. longifolia had the lowest tannin concentration of all investigated species. Four wavelength regions (675–710 nm, 1060–1170 nm, 1360–1450 nm and 1630–1740 nm) were identified as being highly correlated with tannin concentration. A spectra-based classification model of the different plant species was calculated using a principal component analysis-linear discriminant analysis (PCA-LDA). The best prediction of A. longifolia was achieved by using wavelength regions between 1360–1450 nm and 1630–1740 nm, resulting in a user’s accuracy of 98.9%. In comparison, selecting the entire wavelength range, the best user accuracy only reached 86.5% for A. longifolia individuals.

Graphical Abstract

1. Introduction

Tannins are phenolic compounds abundantly produced by plants in leaves or bark. One of their main functions is to act as a biochemical defense against herbivores [1]. Shrub and tree species in the Mediterranean Basin can differ significantly in their tannin leaf content [2,3,4,5,6]. Some species show clear seasonal differences [5] explained by their phenology [3]. In particular, nitrogen fixing shrubs have lower contents of condensed tannins (CT), while non-nitrogen fixing shrubs usually have higher leaf CT contents [3]. The vegetation of the Mediterranean Basin is known for a high variation in leaf tannin content across species and plant functional types, e.g., nitrogen-fixing legumes.
In general, interspecific variation in CT is high for species of the Mediterranean Basin. Ammar et al. [2] found relatively high amounts of condensed tannins for Pistacia lentiscus (383 g/kg dry matter) and relatively low amounts for Phillyrea angustifolia (11 g/kg dry matter) in the uplands of Tunisia. Similar values were confirmed by Perevolotsky [6] for a hilly woodland in Israel. Differences between Juniperus phoenicea and Pistacia lentiscus were observed by Rogosic et al. [7] in a coastal maquis in Croatia. Salem et al. [8] found obvious differences of CT content between Acacia cyanophylla and Pistacia lentiscus. Gallardo and Merino [4] found the highest tannin content in Halimium halimifolium in an open shrubland in southern Spain. A high variation in leaf tannin content is also observed for Australian Mediterranean shrub species from the genus, Acacia. In a study by Kumara et al. [9], Acacia saligna, which is also invasive in Portugal, had the lowest tannin content. All of these species occur in a coastal dune ecosystem in southwest Portugal, but have not been studied there, nor concerning their CT content.
Along the Portuguese coast, protected dune ecosystems have been affected by the invasion of trees and shrubs of the genus, Acacia [10]. Acacia longifolia (Andrews) Willd. (Fabaceae), a tree from southeast Australia, was introduced for dune stabilization and as an ornamental plant at the beginning of the 20th century. This species has been recognized to be among the most problematic invaders in Portugal [11] and other parts of the world [11,12]. A. longifolia has a negative impact on the coastal dune ecosystem in Portugal by reducing the richness and abundance of native species [13,14]. Further, A. longifolia is able to alter ecosystem structure and functioning, making this species a strong competitor for native species [12,15,16]. Seigler [17] stated that not much is known about the biochemistry of the majority of Acacia species. Various Acacia species are known for secondary metabolites, with condensed tannins among the most evident and best known [17]. Some Acacia species have a high CT content, such as A. nilotica (L.) Wild. ex Delile, and some increase the CT content as a defense agent against defoliation, such as A. nigrescens Miller [18]. For Acacia longifolia ssp. sophorae, the use of bark tannins has been reported by Maiden [19]. To our knowledge there has not been any research conducted about the CT content of Acacia longifolia, nor at its native, nor at invaded sites.
Tannins have various ecological functions, such as nutrient cycling, herbivore and pathogen defense, drought resistance or plant growth regulating activities [20]. Barradas et al. [21] concluded that high tannin concentrations for Halimium halimifolium might cause a decrease in microbial biomass and the immobilization of nitrogen in the litter. This was also concluded by Gallardo and Merino [4] in a study focusing on several Mediterranean species, including H. halimifolium. Barbehenn and Constable [22] state that plants that grow under nutrient-poor conditions may inhibit high levels of CT, though they can show some plasticity. Concerning the link between increased tannin concentrations and ecosystem functions, Frutos et al. [3] concluded that plant defense against herbivory might be explained by different mechanisms apart from increased CT content alone. Though the role of tannins in particular processes, such a plant-herbivore interaction, is still debatable, it is reasonable to assume that tannins have an impact on various ecological processes.
Measuring tannins, first in the field and then in the lab, is costly and labor intensive. Thus, methods allowing an easier determination of tannin contents for a high number of samples is desirable. Portable field spectrometers allow collecting hyperspectral leaf reflectance spectra of living vegetation directly in the field, yet still comparable to spectra obtained under lab conditions [23]. These sensors provide optimal conditions for quantifying in situ leaf biochemistry [24]. To our knowledge, no study using field spectroscopy to determine in situ leaf tannin content for any non-commercial plant species exists. In addition, the leaf tannin concentration of non-native, invasive Acacia and native species in the Portuguese dune ecosystems is unknown. Furthermore, little information is known about the absorption wavelengths of tannins in field spectral data. As a consequence, there is no model based on spectral information for a quick determination of leaf tannin content, and no study analyzed the possibility of discriminating Acacia species from other shrubs based on leaf tannin concentration. This would deliver baseline information for fast determination of tannins at larger scales and could be a pre-study for upscaling the results to the landscape scale [25].
In this study, we aim to identify leaf spectral features that correspond to leaf tannin content of the non-native, invasive A. longifolia and six other abundant and common native and non-native shrub and tree species, namely Acacia cyanophylla Lindl. (non-native), Corema album (L.) D. Don ex Steud., Halimium halimifolium Willk., Juniperus phoenicea subsp. turbinata (Guss.) Parl., Pistacia lentiscus L. and Pinus pinea L. Furthermore, we want to distinguish non-native, invasive A. longifolia from the other species based on leaf spectral reflectance related to variation in tannin content in order to verify the potential for upscaling our results to airborne hyperspectral imagery.

2. Material and Methods

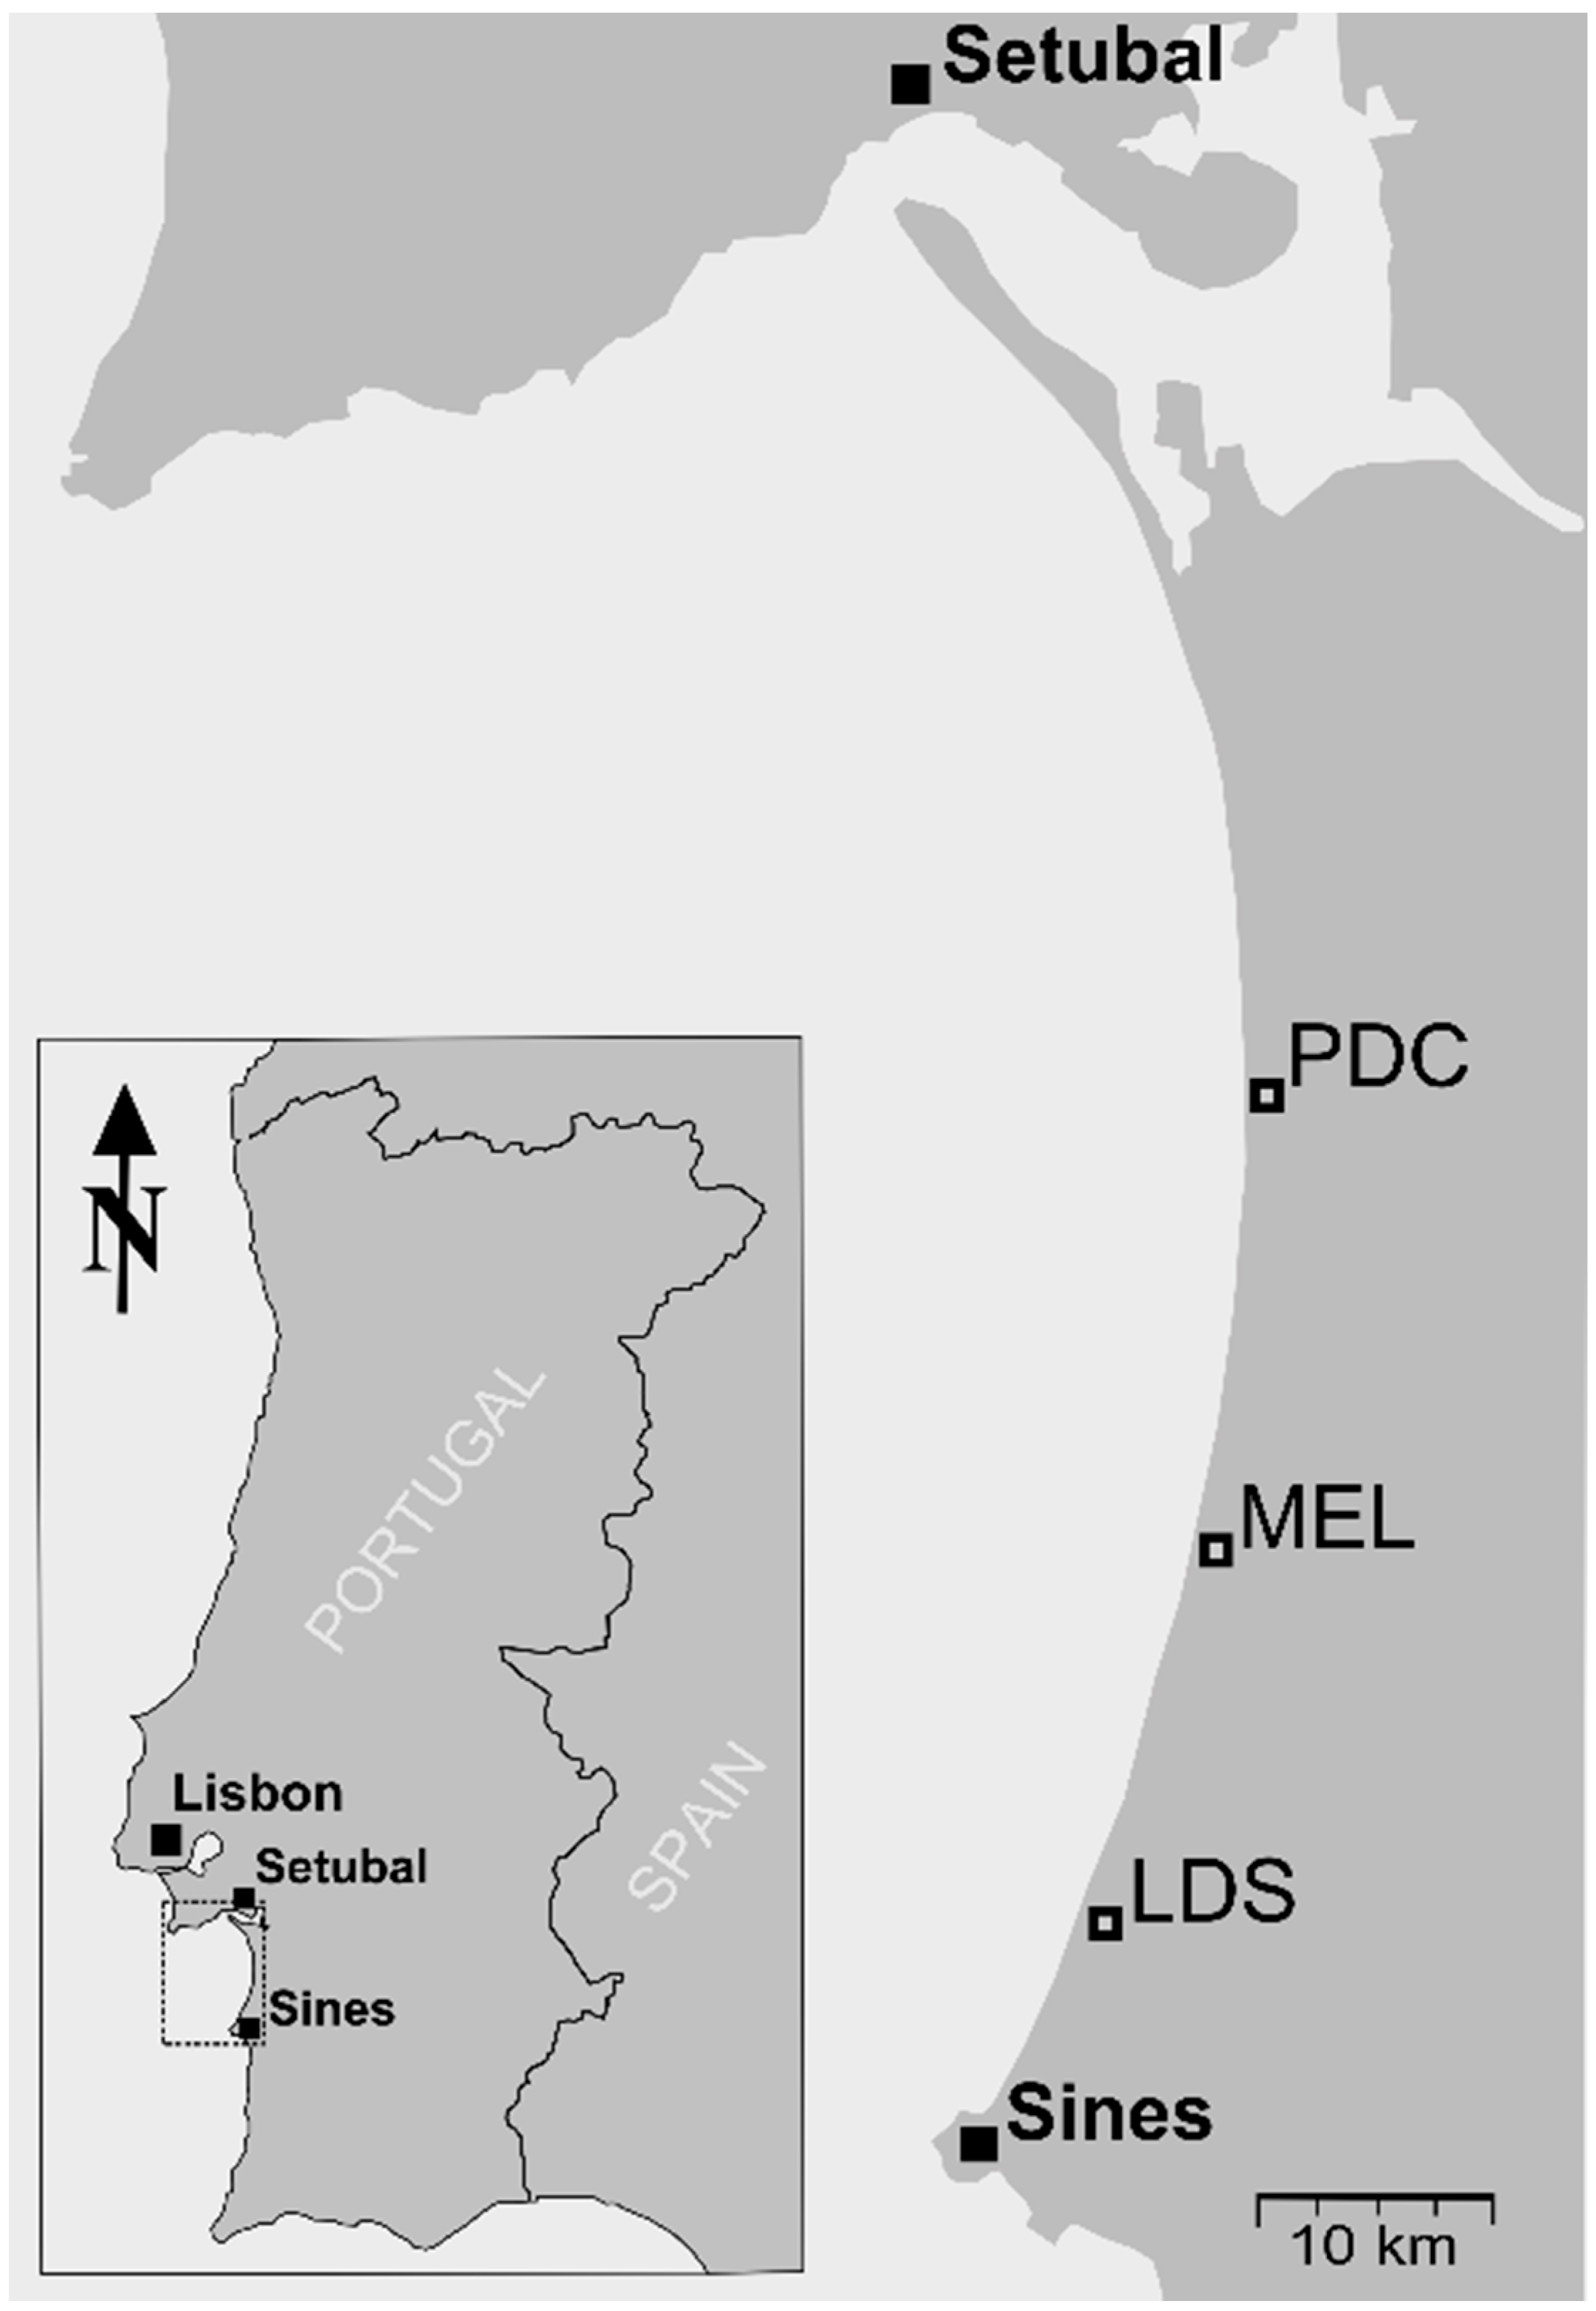
2.1. Site Description

The study area is located at the Atlantic coast of southwest Portugal in the Alentejo region between Sines (37° 57′ N, 8° 52′ W) and Pinheiro da Cruz (38° 15′ N, 8° 46′ W). One 1-km2 plot was established in open sand dunes at three study sites running from south to north along the coast: Lagoa da Sancha (LDS), Melides (MEL) and Pinheiro da Cruz (PDC) (Figure 1). The local climate is Mediterranean with Atlantic influence. The mean annual temperature is 16.1 °C, and average yearly precipitation is 735 mm (meteorological station at Setubal, 38° 31′ N, 08° 54′ W, for the period between 1960 and 1990). The summer periods are generally dominated by drought and high temperatures. The native plant communities in the open dunes are mostly characterized by xerophytic plants, predominantly by sclerophyllous shrubs and isolated pine trees [16,26]. Furthermore, the study site is an important area for local endemic plant species [26,27] and protected by the NATURA 2000 habitats directive as “Comporta/Galé”.
Figure 1. Location of the three study sites in southwest Portugal. They are located at Pinheiro da Cruz (PDC), Melides (MEL) and Lagoa da Sancha (LDS).
Remotesensing 07 01225 g001
In the study sites described, the invasive A. longifolia forms isolated, but dense monospecific stands, either as large shrubs or small trees [26,27]. Other dominant shrub or tree species in this area are Acacia cyanophylla Lindl. (non-native), Corema album (L.) D. Don ex Steud., Halimium halimifolium Willk., Juniperus phoenicea subsp. turbinata (Guss.) Parl., Pistacia lentiscus L. and Pinus pinea L.

2.2. Spectral Data and Leaf Collection

The field sampling took place during springtime in April, 2011. The leaf reflectance of the selected plant species was measured between 350 and 2500 nm with an ASD FieldSpec FR 3 spectroradiometer attached to an external ASD single-leaf clip and contact probe device. The ASD Field Spectrometer had a sampling interval of 1.4 nm between 350 and 1000 nm and 2 nm between 1000 and 2500 nm. The spectral resolution (FWHM) was 3 nm @ 700 nm, 10 nm @ 1400, 12 nm @ 2100 nm. Using the leaf clip allowed for collecting the leaf reflectance spectra of living vegetation directly in the field without transporting the samples to a laboratory. Compared to canopy measurements, the application of the leaf clip and contact probe device reduces interferences, such as atmospheric disturbances (e.g., strong water absorption or other aerosol features), wind effects or unstable light conditions, due to a trigger lock/release gripping system and a self-contained light source. The integrated pre-calibrated white reference panel of the ASD leaf clip was used for calibration purposes between the measurements. For each plant individual, three leaves were measured in reflectance mode. In order to minimize internal measurement inaccuracy and to capture the natural variations of tannin concentration within the leaves, the leaf clip was repositioned on the same leaf between each scan at five different locations. The internal spectrum comprised an average of 25 scans per spectrum. Overall, 750 leaf reflectance spectra of seven species were gathered (Table 1). The mean, maximum and minimum spectral signatures of each species are presented in Figure 2.
Figure 2. Leaf reflectance spectra of the analyzed plant species.
Remotesensing 07 01225 g002
Table 1. Overview of the leaf reflectance measurements with the ASD single-leaf clip. The study sites are Pinheiro da Cruz (PDC), Melides (MEL) and Lagoa da Sancha (LDS).
SpeciesLeaf TypeLeaf Size Length and WidthLeaf SamplingStudy SiteNumber of IndividualsNumber of Leaf SpectraUsed for CalibrationUsed for Prediction
A. longifoliaPhyllodeLarge (>5 cm)Broad (1–5 cm)Several leavesPDC, MEL, LDS1522515570
A. cyanophyllaPhyllodeLargeBroadSeveral leavesMEL5755025
C. albumNeedleSmall (<1 cm)Thin (<1 cm)Leaves stackedPDC5755520
H. halimifoliumLeafMedium (1–5 cm)BroadSeveral leavesMEL, LDS1015010050
J. phoeniceaNeedleSmallThinLeaves stackedMEL5755025
P. pineaNeedleLargeThinLeaves stackedPDC5755025
P. lentiscusLeafMediumBroadLeaves stackedPDC57547 a25
Total50750507240
a Three erroneous leaf reflectance spectra of Pistacia lentiscus were removed based on visual verification (see Section 2.4).
Leaf samples were taken from each spectrally-measured individual to determine the tannin concentration (see Section 2.3). In order to consider the variation of the tannin concentration within one shrub or tree, leaves were harvested from the upper, middle and lower part of the individual, both from the sunny and the shaded side. Only mature leaves and phyllodes from the latest growth period were collected.

2.3. Chemical Analysis of Tannin Concentration

All leaf samples were oven-dried at 52 °C for 48 h and pulverized with a sample mill (Tecator’s cyclotec, Foss, Hillerød, Denmark). The tannin concentration (was determined by the hide-powder method following Roux [28] in accordance with the European pharmacopoeia (Ph. Eur. 7.0/2.8.14). The powdered leaf samples of selected plant species were weighed in a flask, and all polyphenolic compounds, also containing tannins, were extracted with boiling water. After filtration, the filtrate was divided. The first aliquot was treated with hide powder (standardized, powdered skin) and incubated for 60 min. Since tannins adsorb on hide powder, they were separated by a subsequent, second filtration. Both parts of the filtrate were treated with sodium tungstate and phosphoric acid reagent. The polyphenols formed blue complexes with phosphotungstic acid, the reaction product being the sodium tungstate and phosphoric acid. In the second aliquot, the total polyphenol content, including tannins, was detected. The amount of tannin was estimated by subtracting the amount of free polyphenols (first aliquot) from the total amount of polyphenols (second aliquot). The colored complex was measured photometrically using a UV-Vis spectrometer (Perkin-Elmer Lambda 11, Überlingen, Germany) at 760 nm against water as a control. All samples were analyzed as duplicates. In order to guarantee that the tannin concentrations within A. longifolia did not differ between the sampling sites, we compared the tannin concentration between the sites using a non-parametric Kruskal-Wallis test. Furthermore, we tested all species for differences in tannin concentration with a Wilcox rank sum test pairwise comparison. Multiple testing was corrected using the Holm procedure.

2.4. Data Pre-Processing

Raw spectra are often affected by high-frequency noise and, thus, not suitable for direct analysis. Therefore, pre-processing algorithms are applied to modify the spectral data and improve them for further analysis [29]. In this study, the pre-processing steps and the analysis were conducted using the Unscrambler X Software (Version 10.2, Camo Software, Oslo, Norway): First, sample outliers were detected by visual examination and removed. Outliers may be due to measurement errors and cannot be corrected by pre-processing methods. Secondly, wavelengths were limited to 400–2400 nm, because of the high noise levels outside of these regions. Thirdly, sensor shifts at 1000 nm and 1800 nm were pre-processed using a jump correction followed by a first-derivative Savitzky-Golay smoothing [30] with a second polynomial order and a filter width of nine points in order to reduce the spectral noise. Finally, a standard normal variate (SNV) correction was applied, reducing the visible scattering effects. SNV correction normalizes the spectra by removing multiplicative effects, like scaling and offset effects.

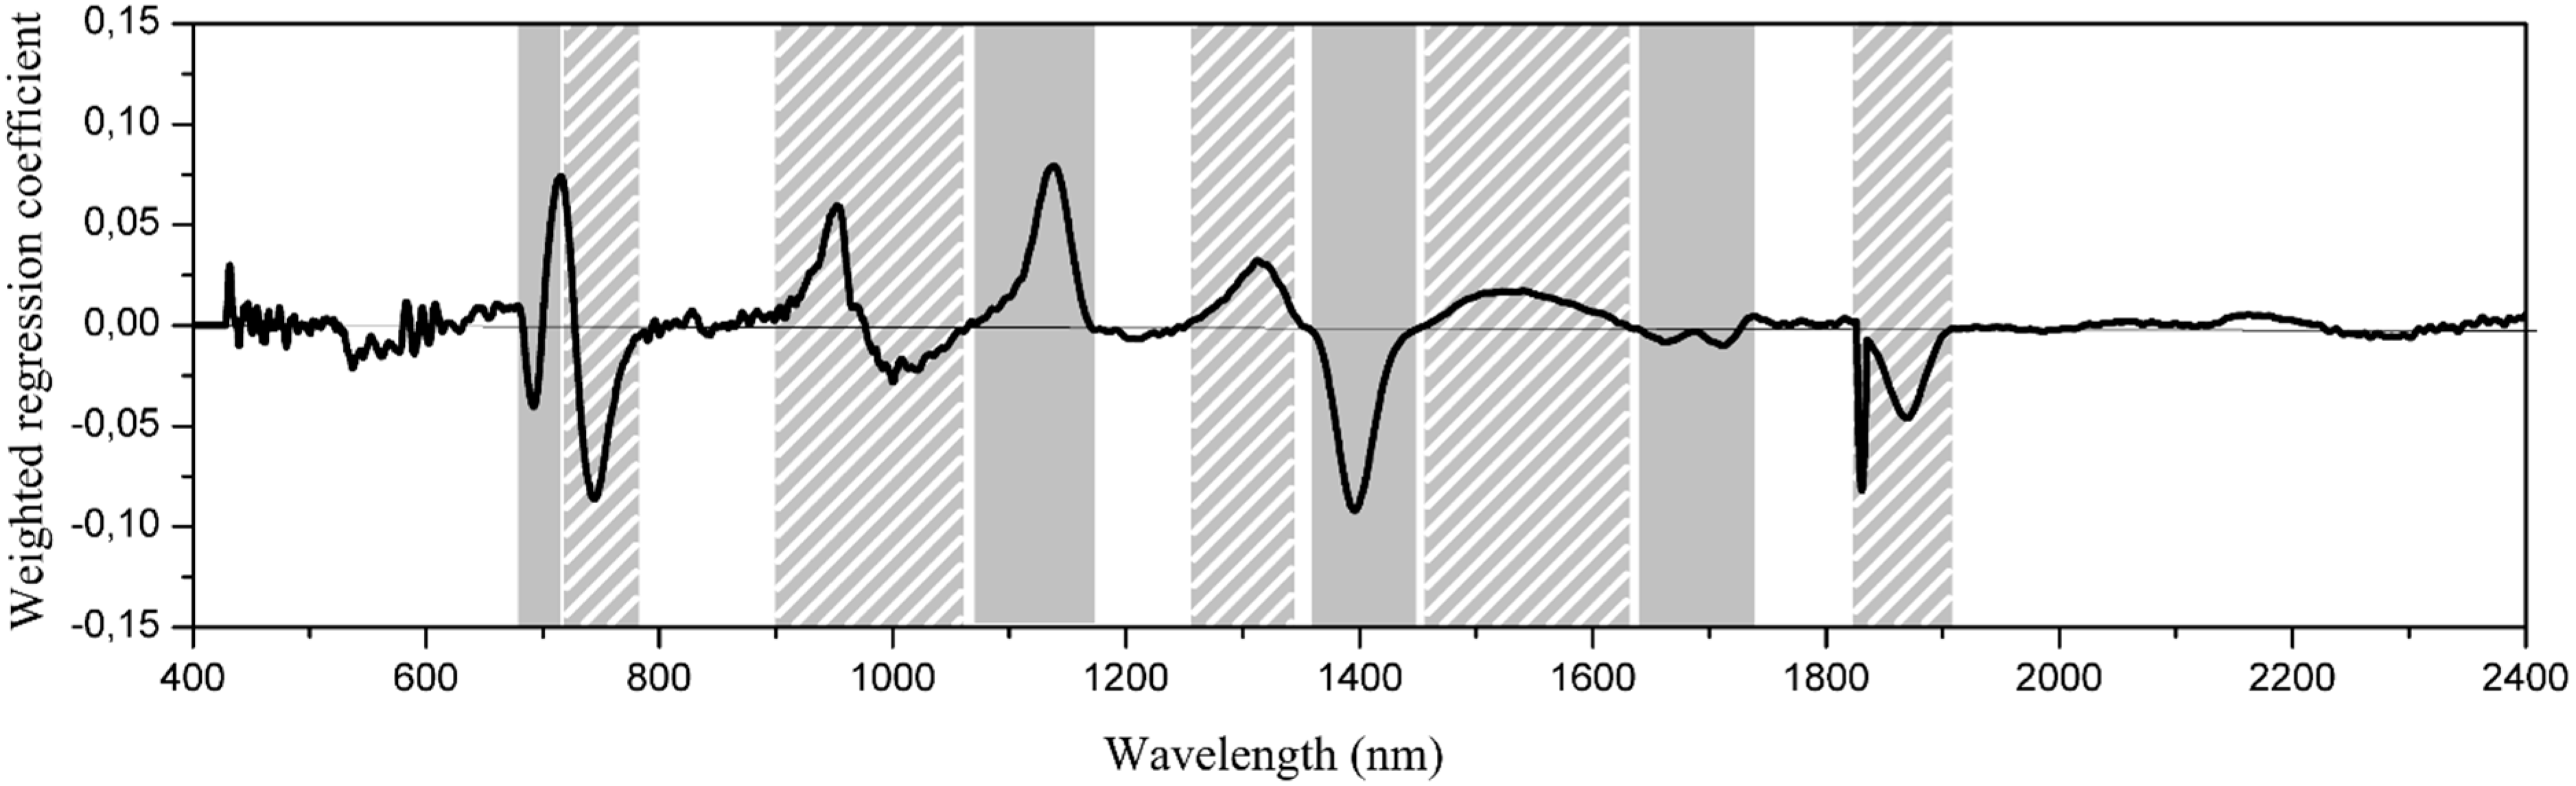
2.5. Determination of Important Wavelength Regions

Partial least squares (PLS) regression is an established method for linking spectroscopic reflectance signatures to biochemical data (e.g., [31,32,33]). PLS allows the detection of wavelengths highly correlated with biochemical features; in this case, the tannin concentration of A. longifolia. The major advantage of PLS is that the continuous spectrum is treated as a single measurement, rather than performing a band-by-band analysis. This makes PLS regression a superior method compared to univariate or bivariate analyses [34].
PLS regression consists of two steps. The first one is a decomposition step, comparable to principal component analysis (PCA). It is used to compress the large spectral dataset by explaining the variance in factors, called latent variables. Latent variables are not sorted according to the amount of variance that they comprise, but according to their correlation to the concentration of the targeted constituent (Y matrix), thus seeking an underlying structure between the X and the Y matrix. The second step is the correlation of these factors (X matrix) to the concentration of the targeted constituent (Y matrix).
In order to avoid overfitting, the optimal number of factors required for an estimation can be determined by analyzing the prediction residual error sum of squares (PRESS) statistic, which is calculated by a cross-validation procedure [35,36]. During that procedure, samples of the dataset are separated into subsets. The performance of the achieved model can be quantified using these subsets to determine the root mean square error of calibration (RMSEC) or root mean square error of cross-validation (RMSECV) and the coefficient of determination (R2). Consequently, the divergence between RMSEC and RMSECV should be minimized (otherwise, the model may be overfitted), while the value for RMSEC and RMSECV should be as small as possible so that the model is not underfitted, i.e., still showing a high R2. It is also possible to determine the root mean square error of prediction (RMSEP), calculated as the root mean squared difference between predictions and reference values.
In this study, we calculated a PLS regression model with a random cross-validation and 19 spectra per segment, including wavelengths from 400 to 2400 nm to identify the tannin-related wavelengths of A. longifolia.

2.6. Discrimination of Species
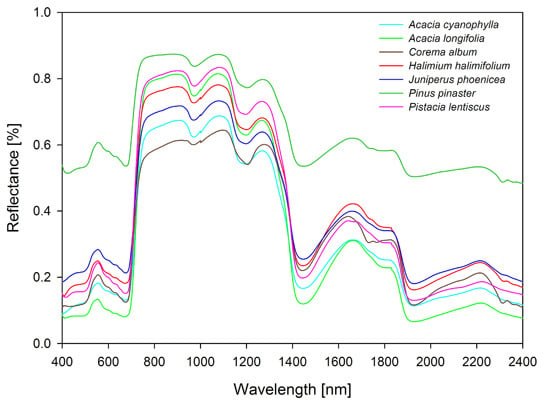
Linear discriminant analysis (LDA) is a supervised classification method widely used in the field of remote sensing for classifying plant species into groups (e.g., [32,33,37]). The different a priori defined (supervised) classes are separated by maximizing the variance between the groups and minimizing the variance within the groups in order to determine the best fit of parameters for the classification.
However, LDA requires independent variables, i.e., the number of components must be smaller than the number of objects in each class [38]. Consequently, large spectral datasets with few samples cannot be analyzed using LDA. Combining an LDA with a principal component analysis (PCA) overcomes this problem. PCA reduces the dimensions of the spectral dataset by explaining a large part of the variance using synthetic factors, called principal components. Therefore, the whole range of wavelengths can be compressed into the first few principal components (PC), which explain a large amount of the variance of the spectral dataset. In this study, the first three PCs explained nearly 99% of the variability of the spectral data, provided the highest factor loadings and were therefore selected for PCA-LDA classification.
In order to test the classification ability of the tannin-related wavelength regions, the entire spectral dataset was pre-processed as described above and randomly separated into a calibration dataset of 507 spectra and a validation dataset of 240 spectra by selecting leaf measurements of each species (Table 1). Subsequently, different calibration models were tested, using different tannin-related wavelength regions, either separately or in combination. Since the applied distance measure in the PCA-LDA, i.e., the Euclidean distance, can have an influence on the classification results, we tested two other commonly-applied distance measures for spectral analysis: the squared Euclidean distance and the Mahalanobis distance.

3. Results

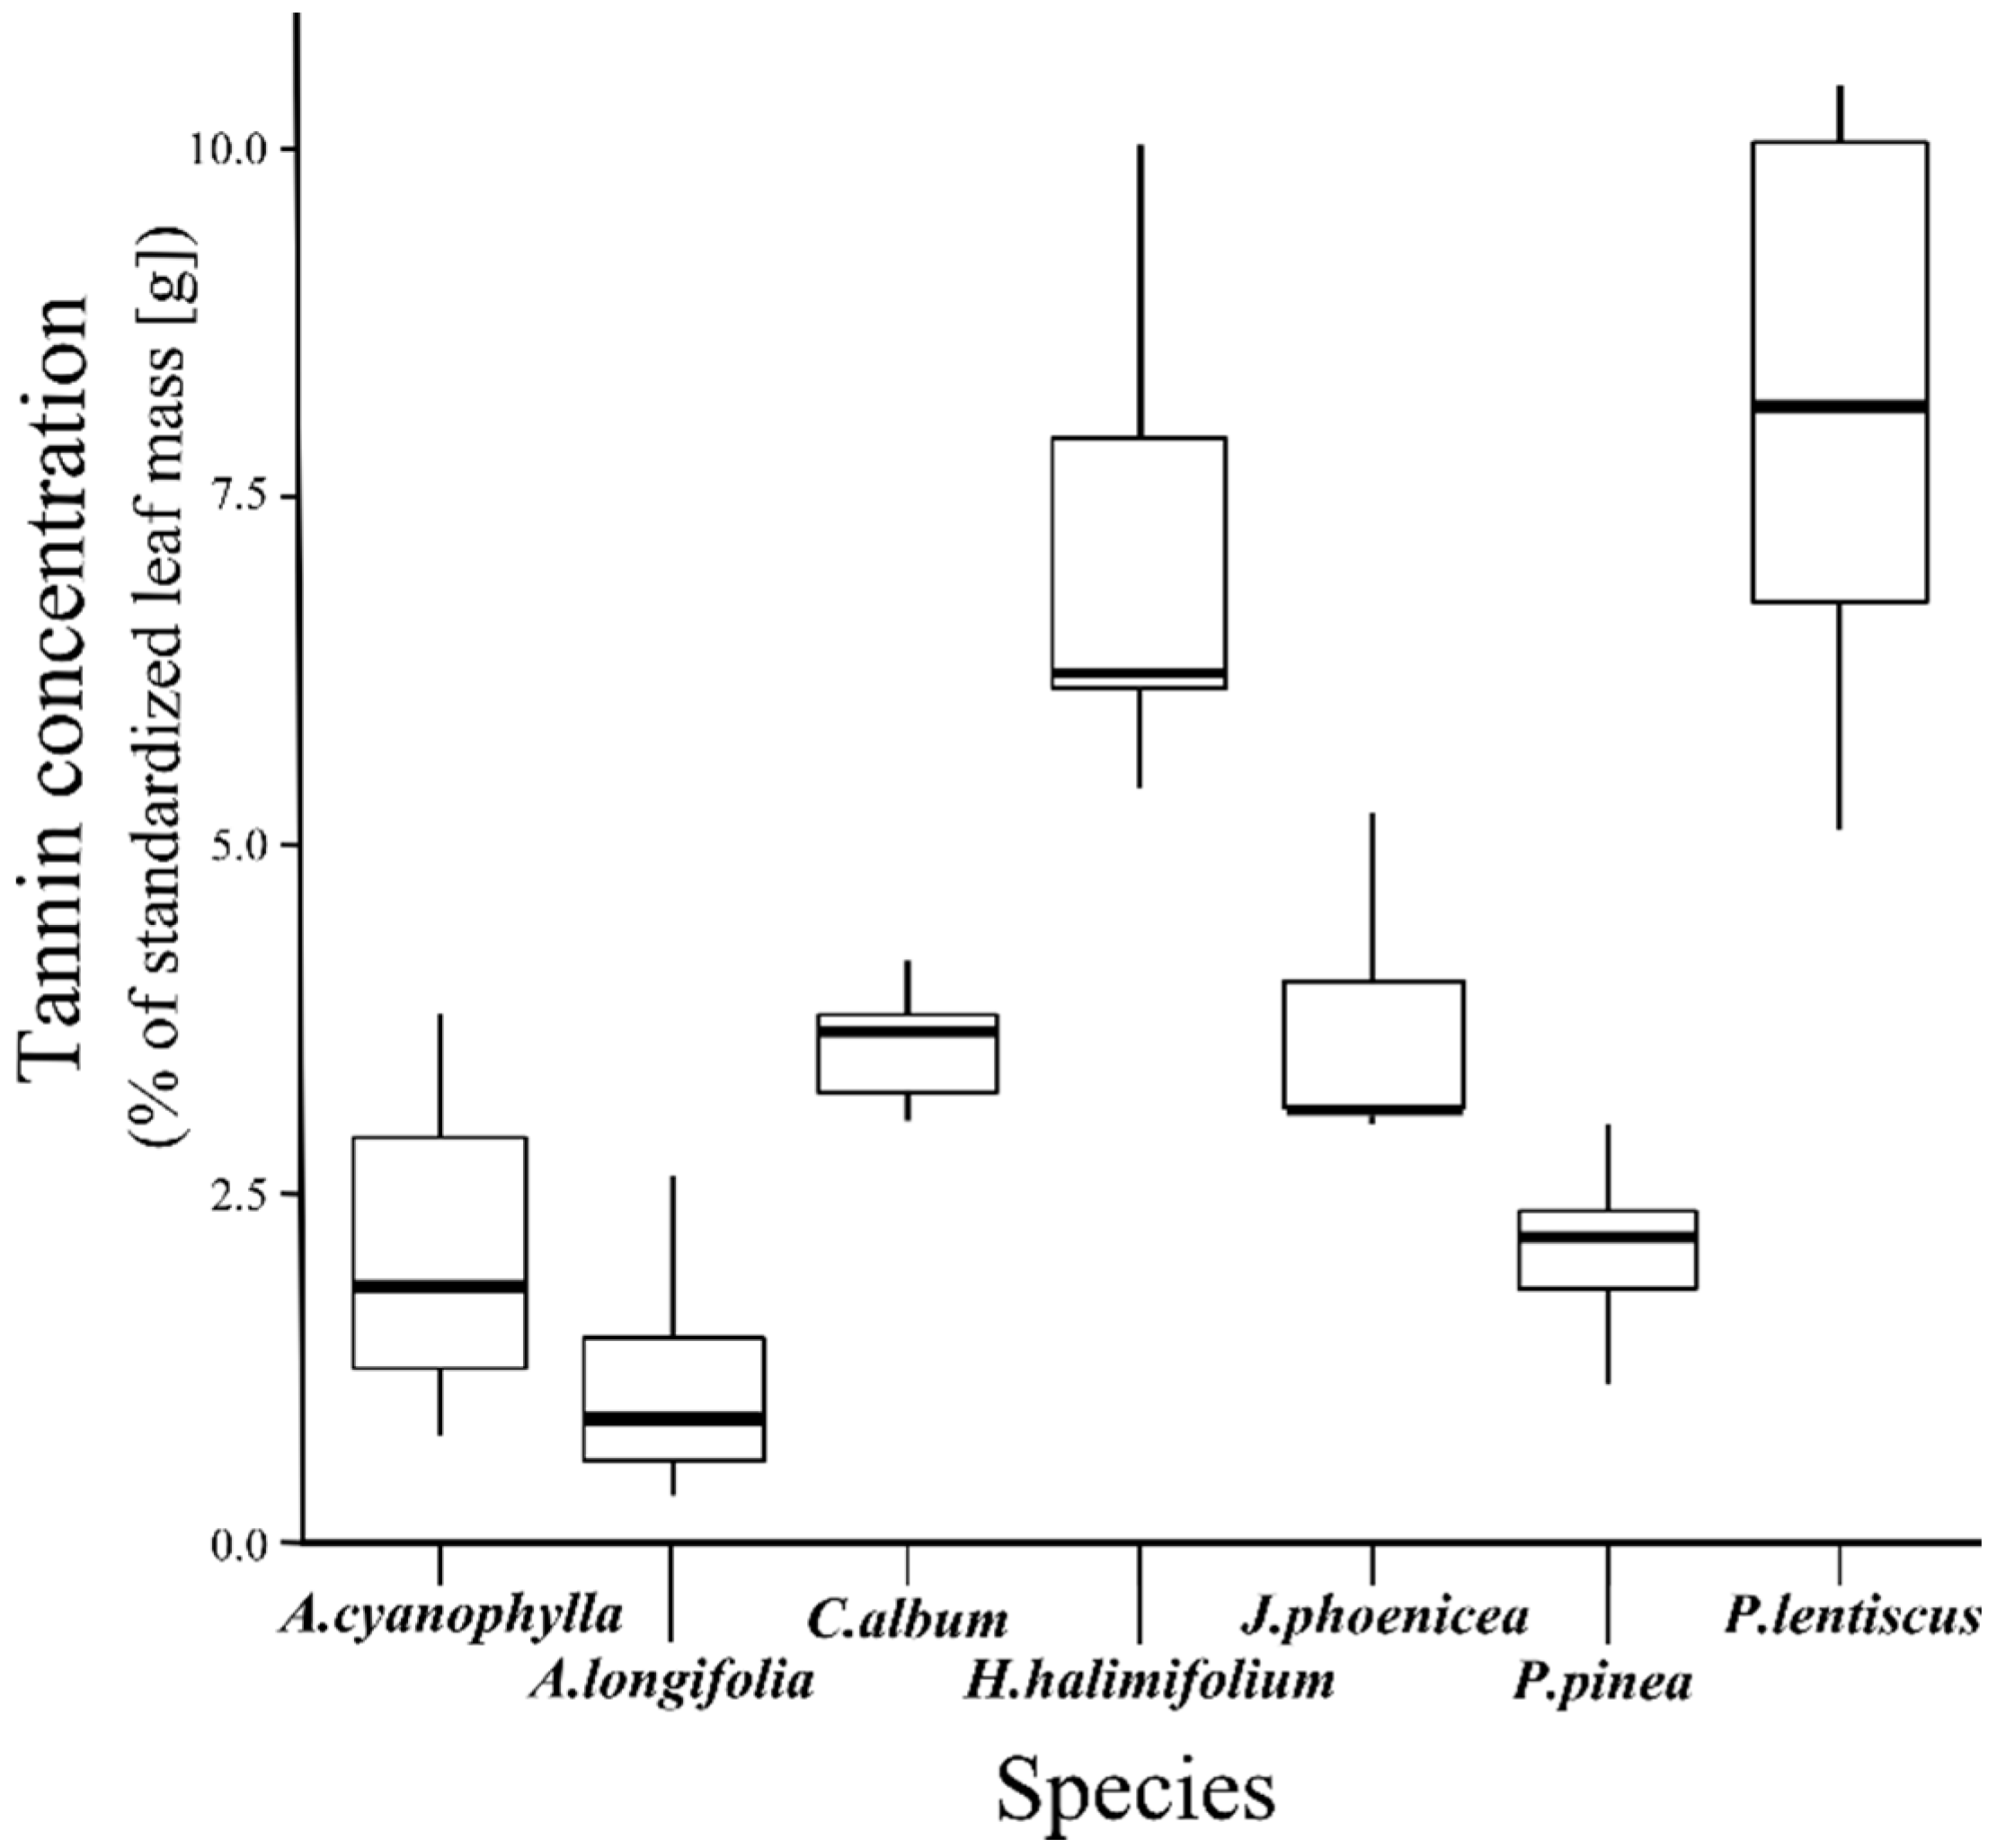
3.1. Tannin Concentration

The results of the chemical analysis are presented in Figure 3. The selected individuals of A. longifolia are characterized by low tannin concentrations (median value: 0.9%) in comparison to the other measured plant species. Similar low tannin concentrations were obtained for Acacia cyanophylla (median value: 1.8%). The highest tannin concentrations were reached by individuals of Pistacia lentiscus (median value: 8.2%), followed by individuals of Halimium halimifolium (median value: 6.2%). According to the Kruskal-Wallis test, no significant differences in tannin concentration were found for A. longifolia between the three study sites, MEL, PDC and LDS. The Wilcox rank sum pairwise comparison revealed that only A. longifolia and H. halimifolium differed from most of the other species (Table 2).
Figure 3. The boxplots show the tannin concentration of the selected plant species. The box represents the lower and upper quartiles and the median (black centered line), while the whiskers represent the maximum and minimum values.
Remotesensing 07 01225 g003
Table 2. Pairwise comparison of tannin concentration between each species using the Wilcox rank sum test. The Holm correction was applied for adjusting the p-value. Cell values are corrected p-values. Grey shading indicates significant differences with p < 0.05.
SpeciesA. cyanophyllaA. longifoliaC. albumH. halimifoliumJ. phoeniceaP. pinea
A. longifolia0.476-----
C. album0.4760.021----
H. halimifolium0.0130.0010.013---
J. phoenicea0.3830.0211.0000.037--
P. pinea1.0000.3830.1030.0130.107-
P. lentiscus0.1030.0210.1030.8100.1690.103

3.2. Wavelength Selection for Classification

In order to identify appropriate wavelengths for later classification steps, we analyzed the weighted regression coefficients of the PLS, i.e., the loadings, which link the regression model and the spectral information. The wavelengths of great impact are those that strongly differ from zero and are therefore likely to be highly correlated with tannin concentration (Figure 4). The importance of each identified wavelength region was tested by leaving out one region at a time. Thus, wavelength regions of low impact on the calibration model show only a subtle change in RMSEC and RMSECV using the same number of factors. These wavelength regions were consequently discarded from the classification model.
The remaining wavelength regions showed a significant decrease in R2 and were left out if the corresponding RMSEC was one. PLS regression identified the following wavelength regions to be related to the tannin concentration: 675–710 nm, 1060–1170 nm, 1360–1450 nm and 1630–1740 nm. These regions were chosen for the subsequent classification step.
Figure 4. Weighted regression coefficients of the first derivative. The wavelengths of strong impact on the regression model are the ones with regression coefficients differing from zero and, therefore, are likely to be highly correlated with the tannin concentration. The importance of each identified region was tested by leaving out one region at a time. Regions of low impact on the calibration model were discarded for the classification model. Solid shading, selected wavelength regions for PCA-LDA. Striped shading, wavelength regions with low impact on the calibration model.
Remotesensing 07 01225 g004

3.3. Discrimination of Species by PCA-LDA Classification

The results of the different classification set-ups tested using PCA-LDA are presented in Table 3. The calibration and validation datasets were separated into A. longifolia and non-A. longifolia. Using all wavelengths from 400 nm to 2400 nm, the classification model distinguished between the two classes at an overall Kappa coefficient of agreement of 0.67 (Euclidean), 0.73 (squared Euclidean) and 0.65 (Mahalanobis). The combination of all identified tannin regions (675–710 nm, 1060–1170 nm, 1360–1450 nm and 1630–1740 nm) showed better classification performance than using all wavelengths. Overall Kappa statistics achieved 0.7 (Euclidean), 0.79 (squared Euclidean) and 0.73 (Mahalanobis), respectively. Testing each tannin-related wavelength region separately, the best overall results were reached using the region 1360–1450 nm with Kappa coefficients of 0.81 (Euclidean) and 0.82 (squared Euclidean). However, these wavelengths failed in the prediction using the Mahalanobis distance (Kappa 0.75). The remaining wavelength regions (675–710 nm, 1060–1170 nm and 1630–1740 nm) showed different performance for all tested distance metrics. The wavelength region 675–710 nm achieved an overall Kappa coefficient of 0.78 using squared Euclidean distance, but only 0.69 when Euclidean distance was applied. For the wavelengths 1060–1170 nm, the best overall prediction results were reached with the Mahalanobis distance metric (Kappa 0.77), compared to 0.68 (Euclidean) and 0.75 (squared Euclidean). Regarding the wavelength region 1630–1450 nm, neither Euclidean, squared Euclidean nor the Mahalanobis distance classification model resulted in a suitable overall prediction (Euclidean 0.69; squared Euclidean 0.65; Mahalanobis 0.53). Judged by user’s accuracy, the best prediction performance of A. longifolia was achieved using wavelength regions 1360–1450 nm and 1630–1740 nm (both with Euclidean distance) with 98.9% of the samples classified correctly, respectively. Both wavelength regions performed slightly similar using squared Euclidean distance, resulting in user’s accuracies of 96.3% and 96.9%. However, the wavelengths 1630–1740 nm fail in the prediction of non-A. longifolia (68.6% with Euclidean and 70.6% with sq. Euclidean). In contrast, the best prediction for the non-A. longifolia class was reached using the wavelength region 1060–1170 nm, with 95.7% correctly classified.
Table 3. Performance of the three different types of validation PCA-LDA models in separating Acacia longifolia from all other sampled shrub species. All tannin regions, including wavelengths 675–710 nm, 1060–1170 nm, 1360–1450 nm and 1630–1740 nm.
Wavelengths Overall KappaOverall Accuracy %User’s Accuracy %Producer’s Accuracy %User’s Accuracy %Producer’s Accuracy %
A. longifoliaA. longifolianon-A. longifolianon-A. longifolia
Euclidean
400–2400 nm0.6783.390.079.476.688.5
675–710 nm0.6984.389.181.479.488.0
1060–1170 nm0.6883.991.779.476.090.1
1360–1450 nm0.8190.698.984.882.398.6
1630–1740 nm0.6984.798.977.170.698.4
all Tannin regions0.7085.095.479.074.694.3
sq. Euclidean
400–2400 nm0.7386.693.782.079.492.7
675–710 nm0.7889.189.189.289.189.2
1060–1170 nm0.7587.491.185.083.790.4
1360–1450 nm0.8290.996.386.985.495.8
1630–1740 nm0.6582.796.975.668.695.6
all Tannin regions0.7989.393.786.184.9 93.1
Mahalanobis
400–2,400 nm0.6582.677.786.187.479.7
675–710 nm0.7386.380.990.791.782.8
1060–1170 nm0.7788.681.495.095.783.8
1360–1450 nm0.7587.383.190.691.484.5
1630–1740nm0.5376.355.794.696.968.6
all Tannin regions0.7386.380.990.791.782.8

4. Discussion

Testing optically-measured spectral information for its ability to discriminate between plant species is an active field of research in the remote sensing community. For example, for detecting and mapping invasive plant species, optical remote sensing, including spectroscopy, in combination with biochemical and physiological properties, has been used successfully to distinguish invasive species from surrounding native vegetation [39,40]. We applied partial least squares regression and PCA-LDA classification in order to first identify spectral wavelengths related to tannin concentration and then tested their discriminatory power for distinguishing between native and invasive shrub species. We found that tannin concentration may provide a promising class of plant biochemicals for distinguishing Acacia from non-Acacia plant species using field spectroscopic methods.
The inspected A. longifolia individuals in the Portuguese dune ecosystems are characterized by a low tannin concentration of below 2% compared to other Acacia species [41]. They might be considered a low tannin content species even among Acacias according to the classification by Furstenburg and van Hoven [18], whose study included seven Acacia species and who defined a threshold for determining low tannin species based on the range of 0–4% CT of dried leaf weight. Factors influencing tannin concentration are mostly climatic and seasonal effects, as well as protection against herbivory [42,43,44,45]. We assume that with the absence of specialist herbivores or pathogens in the Portuguese coastal dunes, A. longifolia is able to change the resource allocation from defense to increased growth or reproduction. This reduced secondary plant metabolism (in particular, with respect to tannins) of invasive plant species introduced into a new range was also reported by the studies of Peñuelas et al. [46], Wang et al. [47] and Omelchuk et al. [48]. This would support the evolution of increased competitive ability (EICA) hypothesis by Blossey and Nötzold [49], which states that invasive species can alter their metabolism, so that the competitive ability is increased and the amount of resources needed for defense is reduced in absence of enemies. Other invasive traits that support the EICA hypothesis, such as huge seed production [10] and tall growth [16], have already been observed in the Portuguese dunes. On the other hand, Carvalho et al. [50] observed spectral variation of plant defense components in different plant organs, e.g., leaves and flowers, of a weed species using field spectroscopy, indicating that the seasonal variation in defense components should not be neglected. Nevertheless, further studies are required to confirm our findings for A. longifolia, but also in general for other invasive species, including the genus, Acacia.
Furthermore, in addition to the effects of interspecific variation in tannin concentration, it is also possible that the examined species contain different compositions of substances belonging to the larger group of tannins [51]. Yet, the available literature does not report the exact biochemical composition of tannins in A. longifolia. Hence, chemical analyses are required to describe the specific tannin components in order to better understand differences in chemical composition between the species. An easy and quick method is to apply PLS regression for determining wavelength regions correlated to the specific composition of tannins in A. longifolia.
We postulate that tannin-related substances are responsible for the correlation of our observed tannin concentration with the wavelength region 675–710 nm. This region, part of the so-called red-edge region (680–750 nm), is characteristic for the absorption maxima of anthocyanins [52], together with other typical plant pigments, such as chlorophyll and carotenoids [53]. The condensed tannins (synonym: proanthocyanidins) form a chemical precursor of anthocyanidins, which are chemically related to anthocyanins [51]. This similarity in chemical structure between condensed tannins and anthocyanidins may have influenced the correlation of tannins within the red-edge region. However, the spectral region is mainly dominated by chlorophyll absorption bands, resulting in difficulties in analyzing anthocyanins properly [54]. Thus, it is difficult to relate the 675–710 nm range solely to tannin concentration.
In general, most of the tannin-related wavelengths are connected to molecular vibrations, i.e., bending and stretching of C-H, C-O and O-H bonds and their overtones [55,56,57]. PCA-LDA with (squared) Euclidean distance resulted in the best classification for A. longifolia individuals (Kappa 0.82) using wavelengths between 1360 nm and 1450 nm. This region of the spectrum is potentially correlated with the bending of O-H bonds, as these show maximum absorption at 1400 nm [55], and the C-H stretching absorption peak located at 1450 nm [57]. Both bonds are characteristic for the molecular structure of tannins [58], making the results of our prediction reasonable. Spectral studies on red grapes also identified a similar spectral region to be related to condensed tannin concentration [59]. Unfortunately, reflectance in this region is influenced by water absorbance features. Thus, although these regions are suitable for CT determination at the leaf level using field spectroscopy, they will not be applicable for airborne hyperspectral missions. The remaining wavelength regions (1060–1170 nm and 1630–1740 nm) also showed high correlation to tannin concentration. Yet, the reason for this correlation is uncertain. Possibly, different bands in the range 1635–1675 nm can be linked to the first overtone of C-H stretching [55,56,57,60] and, thus, are sensitive to the tannin features of A. longifolia. For the wavelength region 1060–1170 nm, the correlation could not be explained by recent biochemical or spectral studies. The wavelengths selected in this study do not exactly match the wavelengths identified by previous studies, but are in most cases within a close distance to the wavebands described previously. This difference may occur due to the overlap with other similar biochemical signals in selected bonds [56] or to different experimental settings.

5. Conclusion

The non-native and invasive Acacia longifolia had a lower condensed tannin concentration than native shrub species and can be classified as a low tannin content species, according to the scheme of Furstenburg and van Hoven [18]. Based on tannin concentration-related wavelength regions, we successfully discriminated A. longifolia individuals from other Acacia and native plant species. We identified two spectral regions linked to tannin concentration, i.e., the range of 1360–1450 nm and the range of 1630–1740 nm, which are promising for detecting A. longifolia in the studied dune ecosystems based on leaf spectral information. Future studies are required to test the suitability of these two spectral regions in combination with additionally remote sensing methods (e.g., LIDAR) for mapping A. longifolia using hyperspectral remote sensing data.

Acknowledgments

We acknowledge the assistance of Peter Burai (Károly Róbert College, Research Institute of Remote Sensing, Hungary), Lenart Csaba (Head of the UN SPIDER Regional Support Office at United Nations OOSA SPIDER RSO) and Christine Hellmann (AgroEcosystem Research, BAYCEER, University Bayreuth) during the field campaign. A special thanks to Keturah Smithson, who always helped to find the right way of writing things and for her correction assistance and Aiko Huckauf for a professional final language check. We also acknowledge support by Deutsche Forschungsgemeinschaft (DFG) and the Open Access Publication Fund of the University of Muenster. Funding for André Große-Stoltenberg was provided by DFG (TH 1295/4-1), by the German Academic Exchange Service DAAD (Short-term scholarship for doctoral students) and by EUFAR (DeInVader, EUFAR11-06). Jens Oldeland was supported by DFG (QUEEN, OL 417/1-1).

Author Contributions

Jan Rudolf Karl Lehmann carried out the leaf sampling, conducted the laboratory analysis, analysed the spectral data together with Meike Römer and wrote the large parts of the manuscript. André Große-Stoltenberg and Jens Oldeland carried out the spectral measurements during field work and provided assistance to Jan Rudolf Karl Lehmann with the analysis of the dataset. The idea for the study was developed by Jens Oldeland, Jan Rudolf Karl Lehmann and André Große-Stoltenberg. All authors contributed to the manuscript by writing, editing, layouting and proofreading.

Conflicts of Interest

The authors declare no conflict of interest.

References

  1. Hassanpour, S.; Maherisis, N.; Eshratkhah, B.; Mehmandar, F.B. Plants and secondary metabolites (Tannins): A review. IJFSE 2011, 1, 47–53. [Google Scholar]
  2. Ammar, H.; López, S.; González, J.S. Assessment of the digestibility of some Mediterranean shrubs by in vitro techniques. Anim. Feed Sci. Tech. 2005, 119, 323–331. [Google Scholar] [CrossRef]
  3. Frutos, P.; Hervás, G.; Ramos, G.; Giráldez, F.J.; Mantecón, A.R. Condensed tannin content of several shrub species from a mountain area in northern Spain, and its relationship to various indicators of nutritive value. Anim. Feed Sci. Tech. 2002, 95, 215–226. [Google Scholar] [CrossRef]
  4. Gallardo, A.; Merino, J. Nitrogen immobilization in leaf litter at two Mediterranean ecosystems of SW Spain. Biogeochemistry 1992, 15, 213–228. [Google Scholar] [CrossRef]
  5. Landau, S.; Perevolotsky, A.; Bonfil, D.; Barkai, D.; Silanikove, N. Utilization of low quality resources by small ruminants in Mediterranean agro-pastoral systems: The case of browse and aftermath cereal stubble. Livest. Prod. Sci. 2000, 64, 39–49. [Google Scholar] [CrossRef]
  6. Perevolotsky, A. Tannins in Mediterranean woodland species: Lack of response to browsing and thinning. Oikos 1994, 71, 333–340. [Google Scholar] [CrossRef]
  7. Rogosic, J.; Pfister, J.; Provenza, F.; Grbesa, D. Sheep and goat preference for and nutritional value of Mediterranean Maquis shrubs. Small Ruminant Res. 2006, 64, 169–179. [Google Scholar] [CrossRef]
  8. Ben Salem, H.; Nefzaoui, A.; Ben Salem, L.; Tisserand, J.L. Deactivation of condensed tannins in Acacia cyanophylla Lindl. foliage by polyethylene glycol in feed blocks: Effect on feed intake, diet digestibility, nitrogen balance, microbial synthesis and growth by sheep. Livest. Prod. Sci. 2000, 64, 51–60. [Google Scholar]
  9. Kumara Mahipala, M.B.P.; Krebs, G.L.; McCafferty, P.; Gunaratne, L.H.P. Chemical composition, biological effects of tannin and in vitro nutritive value of selected browse species grown in the West Australian Mediterranean environment. Anim. Feed Sci. Tech. 2009, 153, 203–215. [Google Scholar]
  10. Marchante, E.; Kjøller, A.; Struwe, S.; Freitas, H. Short- and long-term impacts of Acacia longifolia invasion on the belowground processes of a Mediterranean coastal dune ecosystem. Appl. Soil Ecol. 2008, 40, 210–217. [Google Scholar] [CrossRef]
  11. Richardson, D.M.; Rejmánek, M. Trees and shrubs as invasive alien species—A global review. Divers. Distrib. 2011, 17, 788–809. [Google Scholar] [CrossRef]
  12. Le Maitre, D.C.; Gaertner, M.; Marchante, E.; Ens, E.-J.; Holmes, P.M.; Pauchard, A.; O’Farrell, P.J.; Rogers, A.M.; Blanchard, R.; Blignaut, J.; et al. Impacts of invasive Australian acacias: Implications for management and restoration. Divers. Distrib. 2011, 17, 1015–1029. [Google Scholar] [CrossRef]
  13. Rascher, K.G.; Große-Stoltenberg, A.; Máguas, C.; Meira-Neto, J.A.A.; Werner, C. Acacia longifolia invasion impacts vegetation structure and regeneration dynamics in open dunes and pine forests. Biol. Invasions 2011, 13, 1099–1113. [Google Scholar] [CrossRef]
  14. Werner, C.; Zumkier, U.; Beyschlag, W.; Máguas, C. High competitiveness of a resource demanding invasive Acacia under low resource supply. Plant Ecol. 2010, 206, 83–96. [Google Scholar] [CrossRef]
  15. Christine Hellmann, R.S. Influence of an exotic N2-fixing Acacia on community composition and N status of native Mediterranean species. Acta Oecologica 2011, 37, 43–50. [Google Scholar] [CrossRef]
  16. Rascher, K.G.; Große-Stoltenberg, A.; Máguas, C.; Werner, C. Understory invasion by Acacia longifolia alters the water balance and carbon gain of a Mediterranean pine forest. Ecosystems 2011, 14, 904–919. [Google Scholar] [CrossRef]
  17. Seigler, D.S.; Hernandez, J.F. Comparative tanning ability of extracts from four North American species of Acacia. J. Am. Leather Chem. Assoc. 1989, 84, 315–322. [Google Scholar]
  18. Furstenburg, D.; van Hoven, W. Condensed tannin as anti-defoliate agent against browsing by giraffe (Giraffa camelopardalis) in the Kruger National Park. Comp. Biochem. Physiol. A 1994, 107, 425–431. [Google Scholar] [CrossRef]
  19. Maiden, J.H. The Useful Native Plants of Australia, (Including Tasmania); Turner and Henderson: Sydney, Australia, 1889. [Google Scholar]
  20. Kraus, T.E.C.; Dahlgren, R.A.; Zasoski, R.J. Tannins in nutrient dynamics of forest ecosystems: A review. Plant Soil 2003, 256, 41–66. [Google Scholar] [CrossRef]
  21. Barradas, M.C.D.; Zunzunegui, M.; Novo, F.G. Autecological traits of Halimium halimifolium in contrasting habitats under a Mediterranean type climate—A review. Folia Geobot. 1999, 34, 189–208. [Google Scholar] [CrossRef]
  22. Barbehenn, R.V.; Peter Constabel, C. Tannins in plant-herbivore interactions. Phytochemistry 2011, 72, 1551–1565. [Google Scholar] [CrossRef] [PubMed]
  23. Milton, E.J.; Schaepman, M.E.; Anderson, K.; Kneubühler, M.; Fox, N. Progress in field spectroscopy. Remote Sens. Environ. 2009, 113, S92–S109. [Google Scholar] [CrossRef]
  24. Asner, G.P.; Jones, M.O.; Martin, R.E.; Knapp, D.E.; Hughes, R.F. Remote sensing of native and invasive species in Hawaiian forests. Remote Sens. Environ. 2008, 112, 1912–1926. [Google Scholar] [CrossRef]
  25. Calviño-Cancela, M.; Méndez-Rial, R.; Reguera-Salgado, J.; Martín-Herrero, J. Alien plant monitoring with ultralight airborne imaging spectroscopy. PLoS One 2014, 9. [Google Scholar] [CrossRef]
  26. Costa, J.C.; Espirito Santo, M.D.; Lousa, M. The vegetation of dunes of southwest Portugal. Silva Lusitana 1994, 2, 51–68. [Google Scholar]
  27. Carlos Silva Neto, J.C.C. Phytosociological associations and Natura 2000 habitats of Portuguese coastal dunes. Fitosociologia 2008, 44, 29–35. [Google Scholar]
  28. Roux, D.G. Photometric methods of tannin analysis for black wattle tannin. J. Soc. Leather Trades Chem. 1951, 35, 322–337. [Google Scholar]
  29. Rinnan, Å.; Berg, F. van den; Engelsen, S.B. Review of the most common pre-processing techniques for near-infrared spectra. TrAC Trends in Analytical Chemistry 2009, 28, 1201–1222. [Google Scholar] [CrossRef]
  30. Savitzky, A.; Golay, M.J.E. Smoothing and differentiation of data by simplified least squares procedures. Anal. Chem. 1964, 36, 1627–1639. [Google Scholar] [CrossRef]
  31. Féret, J.-B.; François, C.; Gitelson, A.; Asner, G.P.; Barry, K.M.; Panigada, C.; Richardson, A.D.; Jacquemoud, S. Optimizing spectral indices and chemometric analysis of leaf chemical properties using radiative transfer modeling. Remote Sens. Environ. 2011, 115, 2742–2750. [Google Scholar] [CrossRef]
  32. Song, S.; Gong, W.; Zhu, B.; Huang, X. Wavelength selection and spectral discrimination for paddy rice, with laboratory measurements of hyperspectral leaf reflectance. ISPRS J. Photogramm. Remote Sens. 2011, 66, 672–682. [Google Scholar] [CrossRef]
  33. Asner, G.P.; Martin, R.E.; Suhaili, A.B. Sources of canopy chemical and spectral diversity in lowland bornean forest. Ecosystems 2012, 15, 504–517. [Google Scholar] [CrossRef]
  34. Asner, G.P.; Martin, R.E. Spectral and chemical analysis of tropical forests: Scaling from leaf to canopy levels. Remote Sens. Environ. 2008, 112, 3958–3970. [Google Scholar] [CrossRef]
  35. Svante Wold, M.S. PLS-regression: A basic tool of chemometrics. Chemometr. Intell. Lab. Syst. 2001, 58, 109–130. [Google Scholar] [CrossRef]
  36. Abdi, H. Partial least squares regression and projection on latent structure regression (PLS Regression). Comp. Stat. 2010, 2, 97–106. [Google Scholar]
  37. Clark, M.L.; Roberts, D.A.; Clark, D.B. Hyperspectral discrimination of tropical rain forest tree species at leaf to crown scales. Remote Sens. Environ. 2005, 96, 375–398. [Google Scholar] [CrossRef]
  38. Naes, T.; Isaksson, T.; Fearn, T.; Davies, T. A user Friendly guide to Multivariate Calibration and Classification; NIR Publications: Chichester, UK, 2002. [Google Scholar]
  39. Pu, R.; Gong, P.; Tian, Y.; Miao, X.; Carruthers, R.I.; Anderson, G.L. Invasive species change detection using artificial neural networks and CASI hyperspectral imagery. Environ. Monit. Assess. 2008, 140, 15–32. [Google Scholar] [CrossRef] [PubMed]
  40. He, K.S.; Rocchini, D.; Neteler, M.; Nagendra, H. Benefits of hyperspectral remote sensing for tracking plant invasions. Divers. Distrib. 2011, 17, 381–392. [Google Scholar] [CrossRef]
  41. Devi, S.R.; Prasad, M.N.V. Tannins and related polyphenols from ten common Acacia species of India. Bioresour. Tech. 1991, 36, 189–192. [Google Scholar] [CrossRef]
  42. Humphries, S.G. The biosynthesis of tannins. In Biogenesis of Natural Compounds,, 2nd ed.; Pergamon Press: Oxford, UK, 1963; pp. 801–823. [Google Scholar]
  43. Hagerman, A.E.; Riedl, K.M.; Jones, G.A.; Sovik, K.N.; Ritchard, N.T.; Hartzfeld, P.W.; Riechel, T.L. High molecular weight plant polyphenolics (Tannins) as biological antioxidants. J. Agr. Food Chem. 1998, 46, 1887–1892. [Google Scholar] [CrossRef]
  44. Chalker-Scott, L. Environmental significance of anthocyanins in plant stress responses. Photochem. Photobiol. 1999, 70, 1–9. [Google Scholar] [CrossRef]
  45. Dixon, R.A.; Xie, D.-Y.; Sharma, S.B. Proanthocyanidins—A final frontier in flavonoid research? New Phytol. 2005, 165, 9–28. [Google Scholar] [CrossRef] [PubMed]
  46. Peñuelas, J.; Sardans, J.; Llusia, J.; Owen, S.M.; Silva, J.; Niinemets, U. Higher allocation to low cost chemical defenses in invasive species of Hawaii. J. Chem. Ecol. 2010, 36, 1255–1270. [Google Scholar] [CrossRef] [PubMed]
  47. Wang, Y.; Siemann, E.; Wheeler, G.S.; Zhu, L.; Gu, X.; Ding, J. Genetic variation in anti-herbivore chemical defences in an invasive plant. J. Ecol. 2012, 100, 894–904. [Google Scholar] [CrossRef] [Green Version]
  48. Omelchuk, O. The Content of Phenolics and Tannins in Native and Invasive Solidago Species. Available online: http://phytomorphology.org/PDF/MP4/04091092.pdf (accessed on 13 October 2014).
  49. Blossey, B.; Notzold, R. Evolution of increased competitive ability in invasive nonindigenous plants: A hypothesis. J. Ecol. 1995, 83, 887–889. [Google Scholar] [CrossRef]
  50. Carvalho, S.; Schlerf, M.; van der Putten, W.H.; Skidmore, A.K. Hyperspectral reflectance of leaves and flowers of an outbreak species discriminates season and successional stage of vegetation. Int. J. Appl. Earth Obs. Geoinf. 2013, 24, 32–41. [Google Scholar] [CrossRef]
  51. Hagerman, A.E. Tannin Handbook; Miami University: Oxford, OH, USA, 2002. [Google Scholar]
  52. Gitelson, A.A.; Merzlyak, M.N.; Chivkunova, O.B. Optical properties and nondestructive estimation of anthocyanin content in plant leaves. Photochem. Photobiol. 2001, 74, 38–45. [Google Scholar] [CrossRef] [PubMed]
  53. Gamon, J.A.; Surfus, J.S. Assessing leaf pigment content and activity with a reflectometer. New Phytol. 1999, 143, 105–117. [Google Scholar] [CrossRef]
  54. Blackburn, G.A. Hyperspectral remote sensing of plant pigments. J. Exp. Bot. 2007, 58, 855–867. [Google Scholar] [CrossRef] [PubMed]
  55. Curran, P.J. Remote sensing of foliar chemistry. Remote Sens. Environ. 1989, 30, 271–278. [Google Scholar] [CrossRef]
  56. Soukupova, J.; Rock, B.N.; Albrechtova, J. Spectral characteristics of lignin and soluble phenolics in the near infrared: A comparative study. Int. J. Remote Sens. 2002, 23, 3039–3055. [Google Scholar] [CrossRef]
  57. Ferwerda, J.G.; Skidmore, A.K.; Stein, A. A bootstrap procedure to select hyperspectral wavebands related to tannin content. Int. J. Remote Sens. 2006, 27, 1413–1424. [Google Scholar] [CrossRef]
  58. Porter, L.J. Structure and chemical properties of the condensed tannins. In Plant Polyphenols; Hemingway, R.W., Laks, P.E., Eds.; Springer: New Your, NY, USA, 1992; pp. 245–258. [Google Scholar]
  59. Daniel Cozzolino, W.U.C. Measurement of condensed tannins and dry matter in red grape homogenates using near infrared spectroscopy and partial least squares. J. Agr. Food Chem. 2008, 56, 7631–7636. [Google Scholar] [CrossRef]
  60. Kokaly, R.F.; Clark, R.N. Spectroscopic determination of leaf biochemistry using band-depth analysis of absorption features and stepwise multiple linear regression. Remote Sens. Environ. 1999, 67, 267–287. [Google Scholar] [CrossRef]

