1. Introduction
The active layer overlying permafrost generally undergoes drastic seasonal changes due to large temperature variations between the summer and winter seasons. The freeze/thaw transition of the active layer affects biological activities, water and energy exchange mechanisms. Seasonal freeze/thaw states can be spatially and temporally complex depending on landscape heterogeneity and local-scale variations in geocryological processes. Radar remote sensing, including synthetic aperture radar (SAR), has great potential to provide spatially-distributed information on permafrost ecosystem dynamics with its ability to penetrate cloud and independence from solar illumination. A number of studies using the space-borne radar measurements have been conducted to extract information regarding the freeze/thaw cycle [
1,
2,
3,
4,
5,
6,
7], taiga forests [
8,
9,
10,
11,
12,
13,
14], wetlands [
15,
16,
17] and geological features [
18,
19,
20].
Radar backscattering properties can be strongly sensitive to the freeze/thaw state of the land surface due to the large contrast in the dielectric constant of frozen and liquid water at microwave frequencies. Studies of seasonal variations of C-band radar signals with ERS and ENVISAT SAR data [
1,
2,
3,
4,
5,
6,
7,
8,
9] showed a decrease in the backscattering coefficient of about 3 dB during the transition of trees from a thawed to a frozen state almost independently of tree species. A greater decrease in backscattering coefficients can be observed when tundra areas froze than when forested areas froze [
1,
3].
To characterize seasonal backscattering signatures at L-band frequency, a series of JPL airborne SAR (AIRSAR) images over Alaskan taiga forests were investigated [
10,
11,
12]. Changes in backscattering intensities show about a 3–5 dB decrease in co-polarization channels (
and
) and about a 6 dB decrease in the cross-polarization channel (
) between the thawed and frozen conditions. Backscatter changes in the space-borne L-band SAR observations show similar temporal patterns to those of airborne SAR [
13]. Some studies applied vegetation scattering models, e.g., the radiative transfer model [
12] and the water cloud model [
14], in order to understand changes in the scattering mechanism involved in the temporal SAR observations. The seasonal backscattering changes can primarily be caused by decreases in the direct scattering from the canopy under frozen conditions.
Although physical scattering models can successfully explain scattering mechanisms in the radar observation, they are usually complex and require many input parameters. Therefore, the applicability of those models is limited to a few test areas. Polarimetric SAR (POLSAR) remote sensing can be an effective tool to monitor a spatially- and temporally-heterogeneous permafrost landscape since the fully-polarimetric scattering measurement offers a unique opportunity to estimate actual scattering mechanisms without
in situ information. Kwok
et al. [
11] demonstrated the usability of the co- and cross-polarization signature for characterizing changes in the relative scattering contributions in the radar signal between frozen and thawed conditions. Recently, several studies applied polarimetric processing techniques to characterize wetland classes in Canada [
16] and to estimate the growing stock volume in Siberian forest [
21,
22].
This study aims to evaluate L-band microwave scattering characteristics of different land cover classes in the eastern Siberian permafrost area by using polarimetric scattering mechanisms indicators. The Phased Array L-band SAR (PALSAR) data of the Japanese Advanced Land Observing Satellite (ALOS) acquired in winter and spring seasons over Eastern Siberia are used in this study to investigate the variations of backscattering in forested and non-forested permafrost ecosystems. In the following section, the study area and a description of the acquired SAR data used for this paper are discussed. In
Section 3, a brief introduction to the methods for describing target scattering characteristics is presented. Furthermore, experimental results on the changes of scattering properties related to the freeze/thaw transition are discussed. A summary and concluding remarks are presented in
Section 4.
2. Study Area and Data
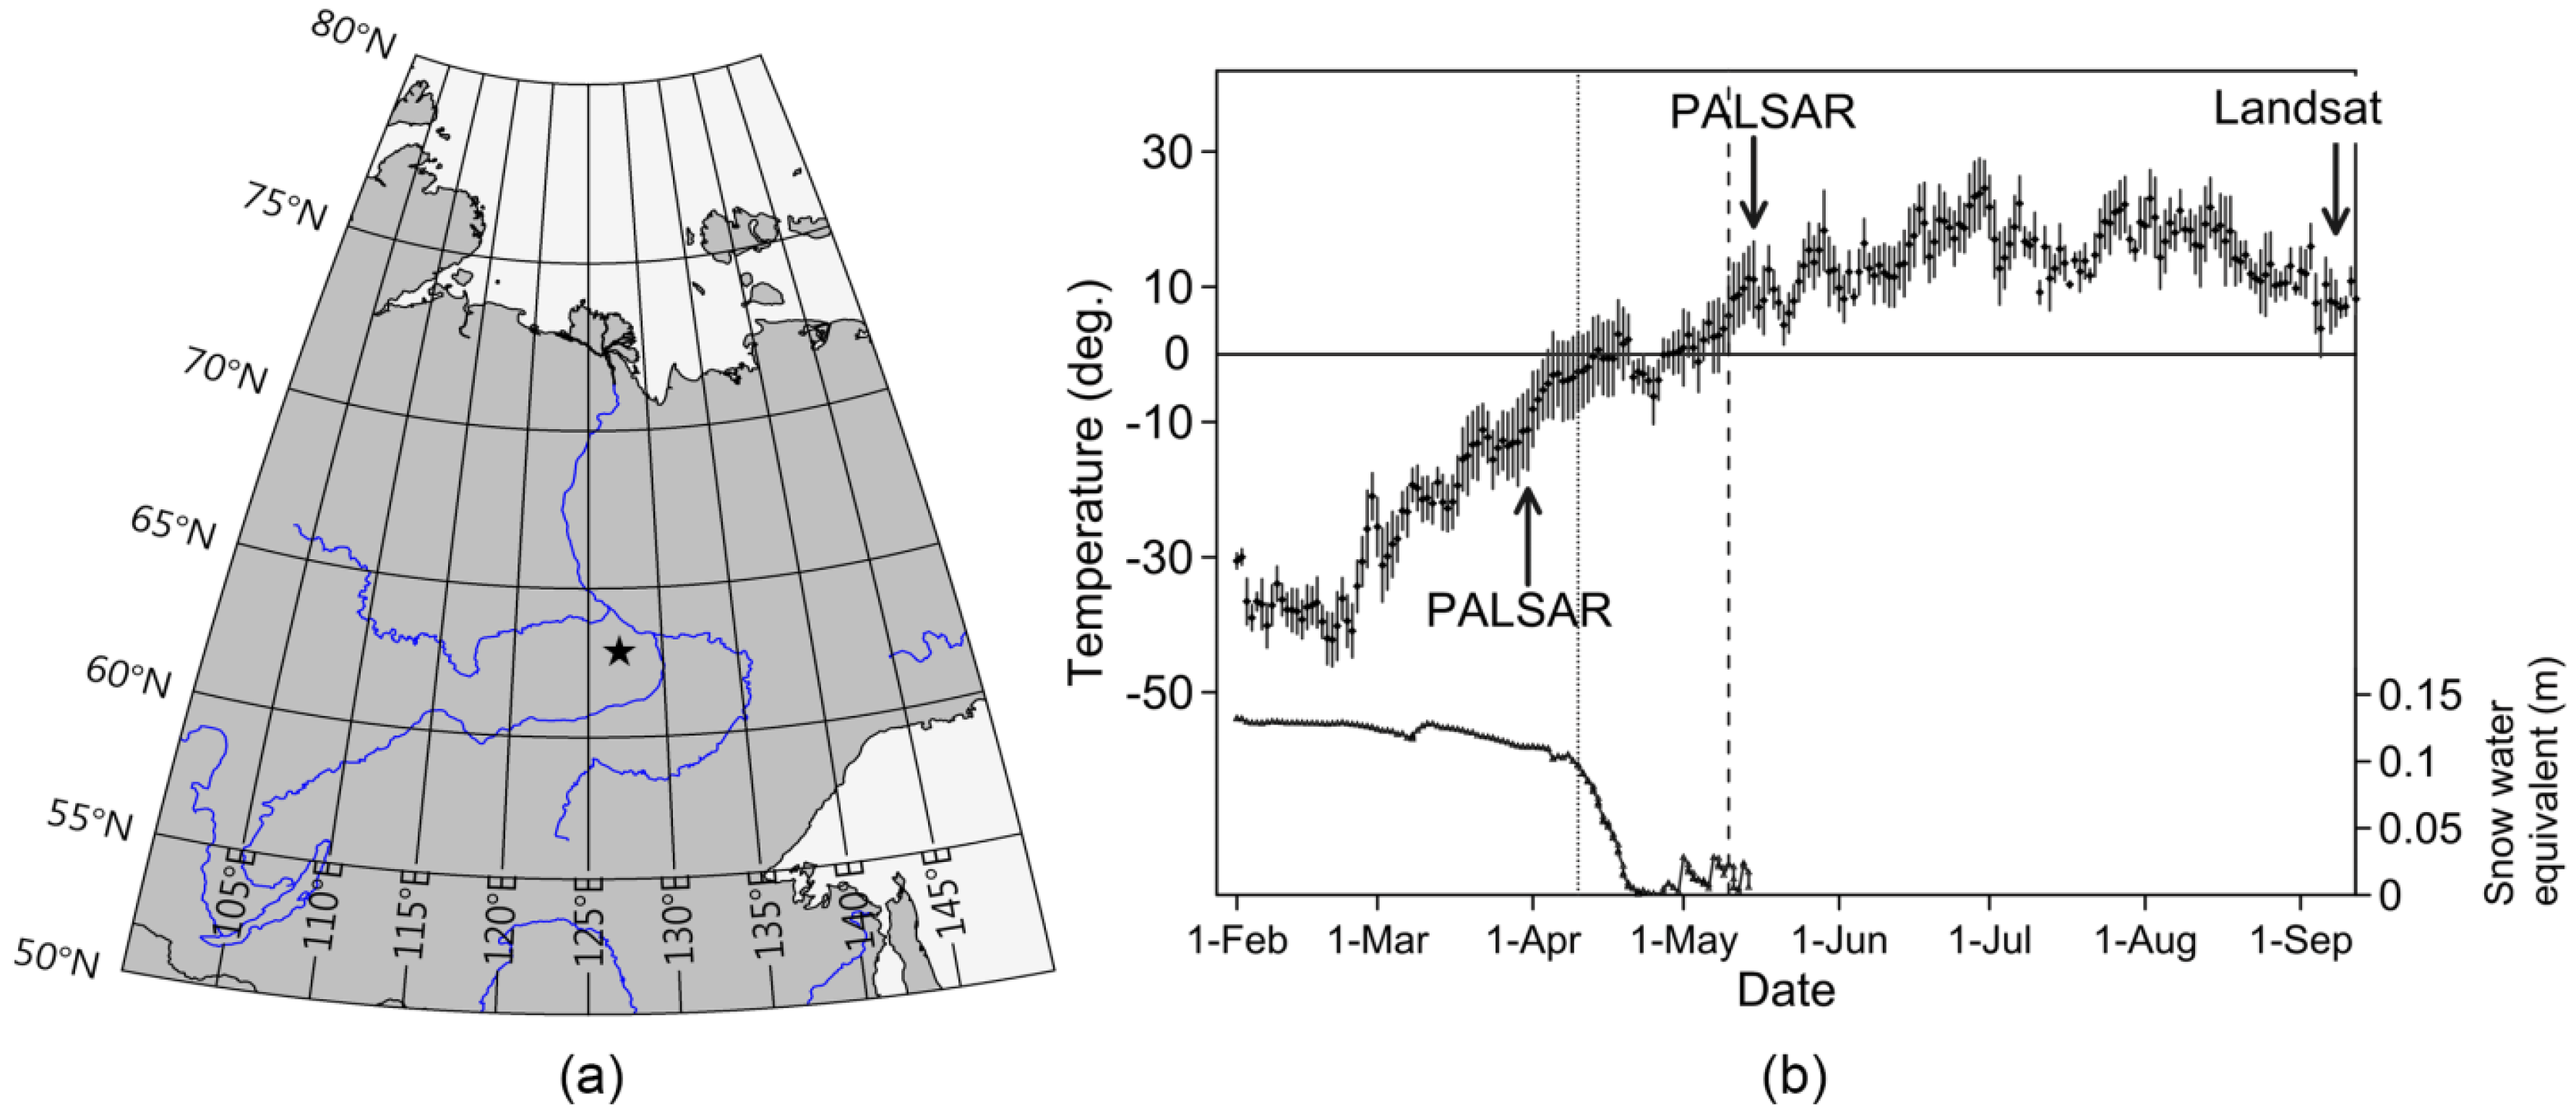
The study site is located about 180 km northwest of Yakutsk city in eastern Siberia (
Figure 1a). The central Yakutia area was investigated in a previous study on mapping freeze/thaw cycles from ENVISAT ASAR [
7]. In this study, a small part of the area showing distinctive differences in the radar-derived spring transition date is selected for further investigation of microwave scattering properties. The permafrost characteristics in the Yakutsk area have been relatively well studied as compared to other high-latitude regions [
23,
24,
25,
26,
27]. This region is covered with forests, grasslands and thermokarst features underlain by continuous permafrost. The terrain is nearly flat, and the taiga forest consists of mixed stands of larch, birch and pine. Icy deposits are located at depths of 1–3 m below the surface and exceed 20–25 m in thickness. Average monthly temperatures range from 19 °C in July to −40 °C in January, and annual precipitation is 190–230 mm, mainly in the summer season.
Two ALOS PALSAR polarimetric mode data acquired on 31 March 2007 and 16 May 2007 over the Yakutia study site are investigated in this study. The off-nadir angle of the polarimetric mode is 21.5° corresponding to a 22.8°–25.2° incidence angle range. In this study, single-look complex (Level 1.1) data with the nominal slant range resolution of 9.5 m and the azimuth resolution of 4.5 m are used in this study. In order to identify environmental conditions during SAR data acquisitions, the daily air temperature and snow water equivalent information were obtained from the nearest grid point (about 25 km away from the study site) of the global atmospheric reanalysis product of the European Centre for Medium-Range Weather Forecasts (ECMWF) [
28], as shown in
Figure 1b. In addition to the ECMWF reanalysis data, snowmelt timing information can be obtained from the diurnal changes of QuikScat time-series data [
7,
8]. The start and end dates of the snowmelt period of the study area derived from the QuikScat data are also illustrated in
Figure 1b.
Figure 1.
(
a) Location of the study area; (
b) meteorological data (air temperature and snow water equivalent) from the nearest European Centre for Medium-Range Weather Forecasts (ECMWF) point (25 km distance). The dotted and dashed vertical lines mark respectively the date of the start and the end of the snowmelt derived from the QuikScat data [
6].
According to the meteorological data, the air temperature changed significantly from frozen condition (−3–−18 °C) on 31 March to thawed condition (4–11 °C) on 16 May. The daily mean temperature had remained above freezing from 4 May to the second PALSAR data acquisition. The very thin snow layer in the beginning of May disappeared about three days before the second PALSAR data acquisition. According to the QuikScat snowmelt time product, the second PALSAR data were acquired about six days after the end of snowmelt. Since soil thawing starts as soon as snow disappears [
27], it is possible to assume that the second PALSAR data (16 May) was acquired under thawed ground conditions. An optical image taken on a cloud-free day (8 September 2007) by the Landsat TM sensor is also obtained to support the interpretation of SAR data.
The polarimetric mode provides a
complex scattering matrix
or equivalently a scattering vector
, which enables full polarimetric characterization of the scattering process occurring at the target of interest, expressed as:
where
is the scattering element in
polarizations and the superscript
denotes the transpose. In natural surfaces, the received wave in the SAR system is the coherent sum of the waves scattered from all individual scattering centers. Therefore, several measurements are often added to reduce statistical variations, such as the speckle filtering, as well as the multilook averaging. An ensemble average of the complex scattering matrix leads to the so-called covariance matrix. In the monostatic backscattering case, when
by reciprocity, the covariance matric
is expressed as [
29]:
where
![Remotesensing 07 15874 i002]()
represents the ensemble averaging and the superscript * denotes the complex conjugate. Diagonal elements of the covariance matrix correspond to the conventional backscattering coefficients, while off-diagonal elements describe correlation properties between co- and cross-polarization channels. In addition, the trace of the covariance matrix represents the total scattered power in a POLSAR measurement.
Figure 2a,b shows the total power images of multilook-processed ALOS PALSAR data acquired under frozen and thawed conditions with a multilook factor
(azimuth×range), which corresponds to an approximately
spatial resolution on the ground. Drastic seasonal changes in the total scattered power can be easily observed in
Figure 2. The total power obtained in thawed conditions shows significantly higher values than those obtained in frozen conditions.
Figure 2.
ALOS PALSAR total power images acquired on (a) 16 March 2007 (frozen conditions) and (b) 16 May 2007 (thawed conditions); (c) a Landsat TM image (Bands 3, 2, 1 in RGB) acquired on 8 September 2007. F, forest; G, open ground; S, shrubland.
Figure 2.
ALOS PALSAR total power images acquired on (a) 16 March 2007 (frozen conditions) and (b) 16 May 2007 (thawed conditions); (c) a Landsat TM image (Bands 3, 2, 1 in RGB) acquired on 8 September 2007. F, forest; G, open ground; S, shrubland.
Although no ground-truth information was available for this study, six test sites or regions of interest (ROI) showing distinctive scattering features were selected based on visual interpretation of Landsat TM (
Figure 2c) and PALSAR images, as well as investigation of the current literature. Each region contains more than 1000 pixels to obtain statistically-significant results. The selected test sites consist of forested areas (F1,F2), shrublands (S1,S2) and open grounds (G1,G2), as shown in
Figure 2b. Two test sites from taiga forests, F1 and F2, were selected to have different types of trees based on the Landsat image in autumn. They are identified as evergreen trees, such as pine (F1), and deciduous trees, such as larch (F2) [
23,
24,
25,
26]. According to the literature [
25,
30], two sites in the upper right quadrant of the image, S1 and G1, correspond to the recently-burnt taiga (three years or less) covered with shrub (S1) and low or no vegetation (G1), respectively. On the other hand, shrublands (S2) and open ground (G2) in the lower left quadrant of the image are probably related to the thermokarst feature, such as Alas [
23,
26]. Note that the S2 and G2 sites in the lower left quadrant are hardly distinguishable from the S1 and G1 sites in the optical image. Therefore, differences in radar scattering characteristics between test sites in the lower left quadrant and the upper right quadrant would be a consequence of the differences in soil properties, e.g., density, moisture content and heat capacity, and active layer structures.
3. Experimental Results and Discussion
Two ALOS PALSAR images acquired under frozen and thawed conditions were co-registered before analysis. In addition, polarimetric speckle filtering based on the Intensity-Driven Adaptive-Neighborhood (IDAN) filter was applied to multilook-processed PALSAR data to obtain unbiased estimates of polarimetric parameters and better performance in the change detection [
31,
32].
Table 1 summarizes seasonal changes in the mean backscattering intensities over six regions of interest, showing an apparent increase in all polarization channels by more than 4 dB with thawing. Among the different polarization channels, HV polarization shows the largest seasonal variations by about 7–8 dB with little dependency on land cover types. Backscattering intensities in co-polarization channels (HH and VV) exhibit nearly identical temporal patterns across all test sites. There are relatively greater seasonal variations in the non-forested areas (7–8 dB) than forested areas (5 dB). In order to understand underlying scattering processes that cause these seasonal trends in SAR measurements, variations of polarimetric parameters were examined in this section.
Table 1.
Measured mean backscattering intensity (in dB) of ALOS PALSAR data acquired under frozen and thawed conditions.
Table 1.
Measured mean backscattering intensity (in dB) of ALOS PALSAR data acquired under frozen and thawed conditions.
| ROI | SAR Signal Frozen | SAR Signal Thawed | Differences (Thawed-Frozen) |
|---|
| HH | VV | HV | HH | VV | HV | HH | VV | HV |
|---|
| F1 | −10.5 | −12.1 | −19.4 | −5.4 | −7.1 | −12.5 | 5.1 | 5.0 | 6.9 |
| F2 | −11.9 | −12.6 | −21.4 | −6.9 | −8.1 | −14.4 | 5.0 | 4.5 | 7.0 |
| S1 | −8.7 | −9.3 | −19.1 | −2.8 | −3.4 | −12.4 | 5.9 | 5.9 | 6.7 |
| S2 | −8.9 | −9.6 | −21.6 | −1.7 | −2.7 | −13.4 | 7.2 | 6.9 | 8.2 |
| G1 | −11.9 | −13.1 | −24.5 | −3.6 | −5.1 | −17.2 | 8.3 | 8.0 | 7.3 |
| G2 | −11.3 | −12.6 | −26.4 | −4.2 | −5.7 | −18.0 | 7.1 | 6.9 | 8.4 |
3.1. Model-Based Polarimetric Decomposition
Polarimetric target decomposition techniques provide a possibility of separating different scattering mechanisms within the SAR measurement. Among the target decomposition approaches, the model-based decomposition methods [
33,
34,
35] have been widely used in POLSAR applications because they are based on the physical scattering models and offer easy-to-interpret scatter type discrimination. The model-based decomposition technique aims to separate the observed covariance matrix as a linear combination of elementary scattering matrices related to specific scattering models. A more extensive review of different model–based decomposition methods and evaluation of their performance can be found in [
36].
In this study, the Yamaguchi decomposition method with orientation compensation [
35] was used to characterize scattering processes involved in the ALOS PALSAR observations of frozen and thawed landscapes. According to the Yamaguchi decomposition, the measured covariance matrix after applying orientation compensation can be decomposed into a combination of the surface (
), double-bounce (
), volume (
) and helix scattering (
) contributions to the total backscattered return. Since the helix scattering power is usually much lower than others, it was omitted in the analysis.
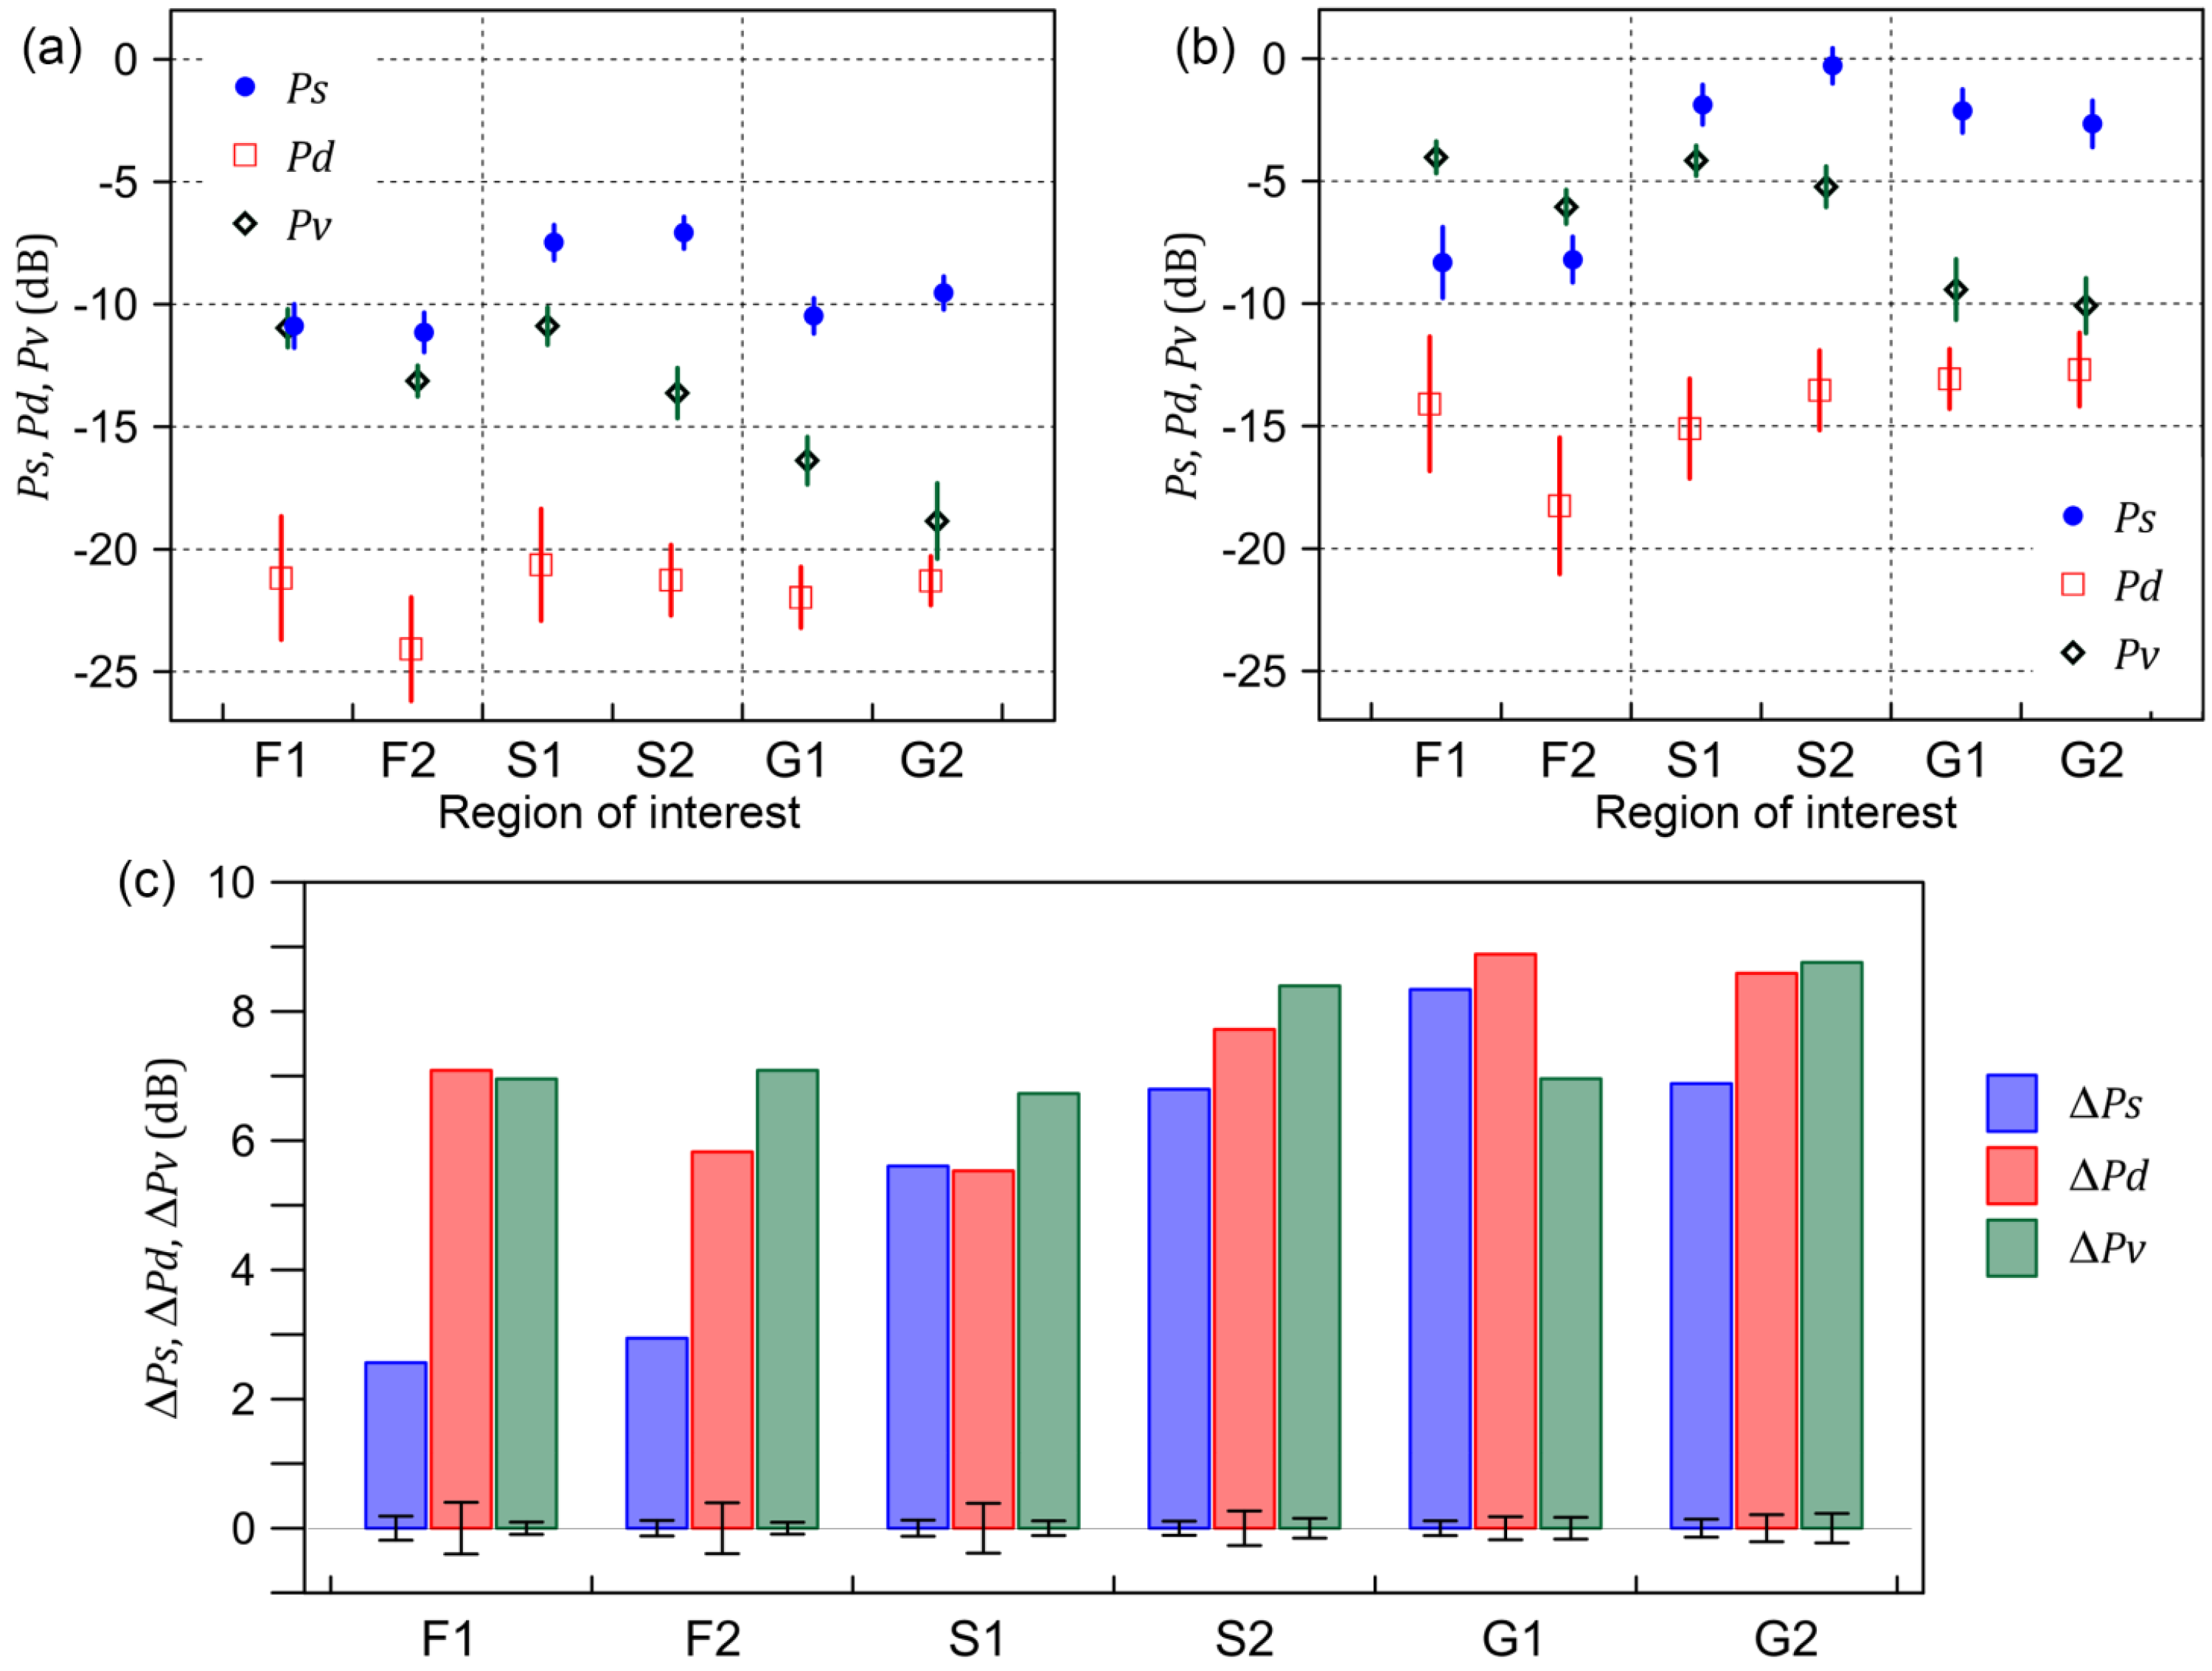
Figure 3a,b shows the surface, double-bounce and volume scattering components for each test site observed under frozen and thawed conditions, respectively. In forested areas, F1 and F2, the dominant scattering mechanism under thawed conditions is the volume scattering followed by the surface and double-bounce scattering contributions. When these areas freeze, both the volume scattering and the double-bounce scattering contributions decrease significantly, resulting in decreases of the scattering intensities. On the other hand, the surface scattering component in shrublands, S1 and S2, is higher than the volume scattering component for both frozen and thawed conditions. The decomposition results for open ground covered with low or no vegetation, G1 and G2, show a dominant surface scattering contribution to the total scattered power. The double-bounce scattering component is smaller than others for all test sites for both frozen and thawed conditions and shows no significant variations over different land cover types.
Figure 3c shows the seasonal changes of mean scattering components between the frozen and thawed conditions (
). In non-forested areas, apparent increases of the surface, double-bounce and volume scattering powers with thawing can be observed. The double-bounce and volume scattering powers in forested areas also show significant seasonal changes. However, the seasonal changes of the surface scattering power is much smaller than others, and it is unclear whether there is a statistically-significant difference between the observed mean scattering powers under frozen and thawed conditions. To compare the two mean scattering powers between the frozen and thawed conditions, the hypothesis test of:
can be examined. The acceptance region for the null hypothesis at the 99% significance level is represented as the vertical error bars in
Figure 3c. Since the differences between mean values belong to the rejection region for all scattering components, it is possible to conclude that the observed model-based decomposition components, including surface scattering power, are significantly changed by the seasonal freeze/thaw transitions. On the other hand, there are only 1–2 dB differences in the seasonal changes of different scattering components.
Figure 3.
Estimated mean scattering components in the model-based decomposition for the test sites observed in (a) frozen and (b) thawed conditions. The vertical line indicates one standard deviation; (c) the difference between two mean scattering components under frozen and thawed conditions (). The vertical error bars indicate the 99% confidence interval for the null hypothesis .
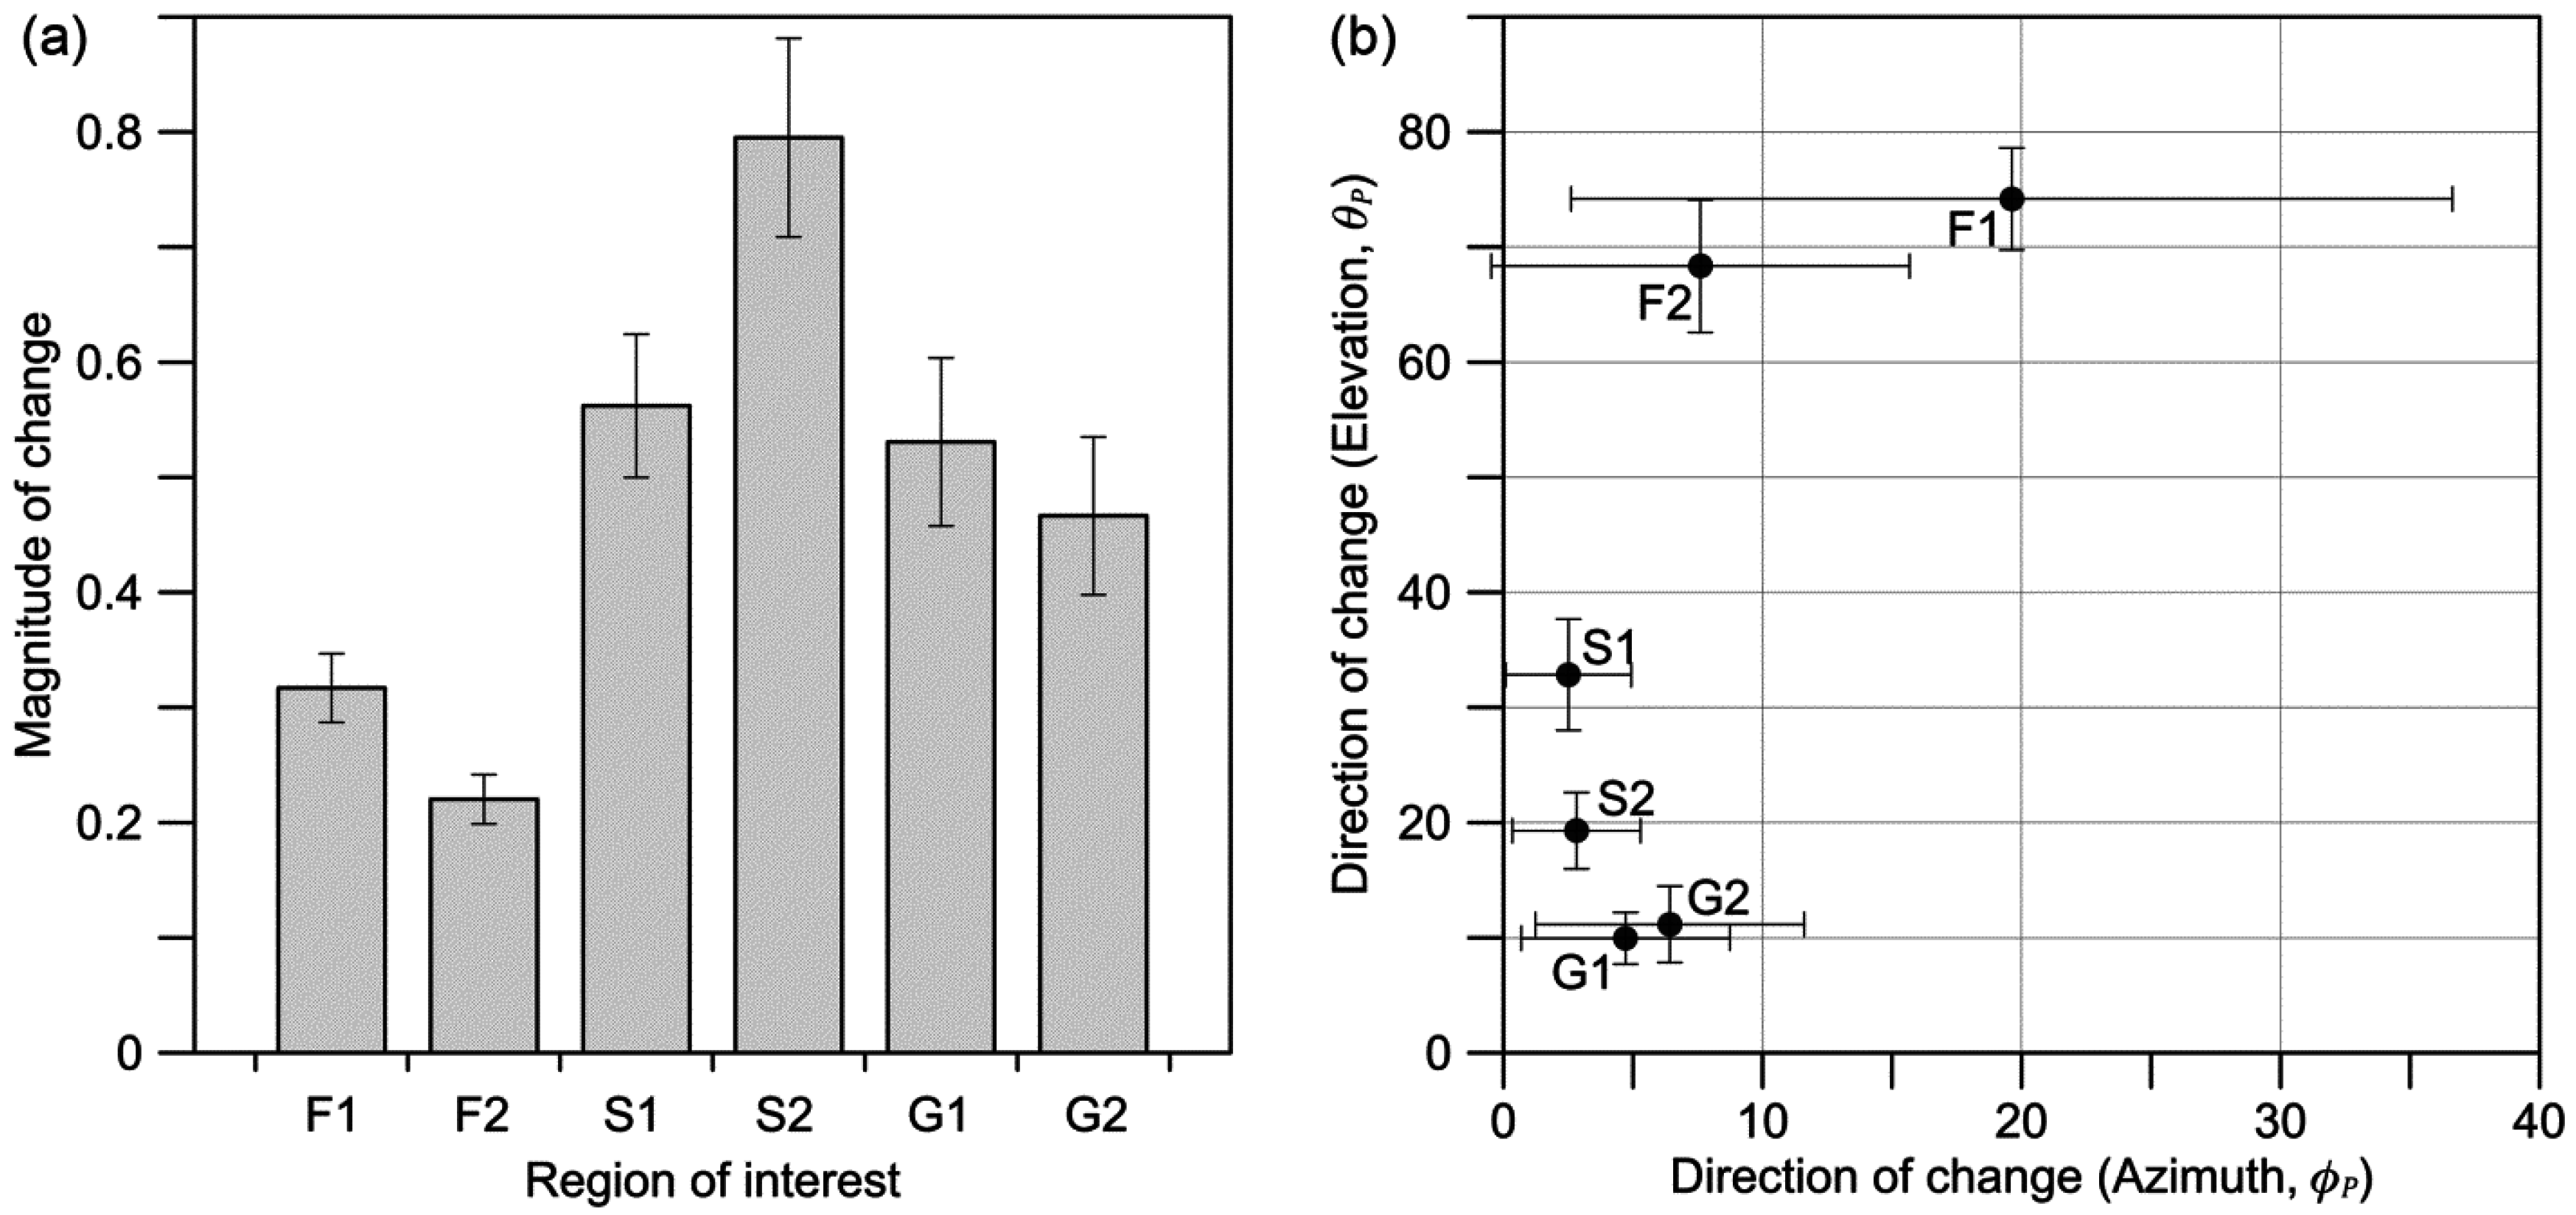
In order to better clarify the variations of scattering mechanisms related to the frozen and thawed states, the magnitude and direction of change of a scattering power vector
are presented in this study. Let
and
be scattering power vectors of a pixel under frozen and thawed conditions, respectively, which are defined in the Cartesian space with the axes being the decomposed surface, double-bounce and volume scattering powers. The change vector
of a pixel can be represented by the magnitude
and angle
of change. The magnitude of change corresponds to the changes in the total scattered power, which can be obtained by:
The azimuth angle
and the elevation angle
indicate the changes of the relative contribution of the scattering mechanisms, defined as in Equations (5) and (6):
The azimuth angle represents the double-bounce to surface scattering ratio, which increases with the increase of the double bounce scattering contribution. On the other hand, the elevation angle is the angle from plane, which can represent the amount of volume scattering contribution. Note that the direction of changes can be associated with the variations of the scattering center between frozen and thawed conditions.
Figure 4 shows how the magnitude and direction of changes between two scattering power vectors in frozen and thawed states vary with the permafrost landscape. In forested areas, significant increases of the volume scattering mechanisms with thawing can be observed in both sites. Changes in backscattering intensities are caused by the shift of scattering mechanisms rather than the magnitude changes. By comparison, evergreen forest shows a greater increase of the double-bounce scattering contribution. Backscatter changes in shrublands can be caused by changes in the scattering mechanism, as well as the total backscattered power. Changes in the scattering mechanisms with thawing occur mainly in the direction of increasing the volume scattering contributions. Open grounds covered with low or no vegetation show minor changes in the relative contribution of scattering mechanisms. The measured total backscattered powers, however, are increased significantly by landscape thawing. The amount of magnitude change can be associated with the dynamic range of the signals from the ground surface with varying dielectric constants.
Figure 4.
(a) Magnitude and (b) direction of changes between the mean scattering power vectors in frozen and thawed conditions.
Figure 4.
(a) Magnitude and (b) direction of changes between the mean scattering power vectors in frozen and thawed conditions.
3.2. Eigenvalue-Eigenvector-Based Polarimetric Decomposition
Another group of polarimetric target decompositions is based on the eigenvalue-eigenvector analysis of the coherency matrix, which contains the same information as the covariance matrix, but with a reordering of the product terms [
29,
37]. Among several polarimetric parameters that can be derived from the eigenvalues and eigenvectors, two rotational invariant parameters, the polarimetric entropy (
) and the mean alpha parameter (
), have been widely used for analyzing POLSAR data. The polarimetric entropy can be derived from the three eigenvalues, providing useful information on the randomness of the scattering process, which is zero for the single scattering (zero depolarization) and one for the random scattering (maximum depolarization). On the other hand, the alpha parameter, derived from the eigenvector, indicates a type of scattering mechanism with a range from 0°–90° (0° for a symmetric specular scattering, 45° for a dipole scattering and 90° for a dihedral scattering). The pair
has been used for identifying the underlying mean scattering mechanisms of the measured coherency matrix [
38].
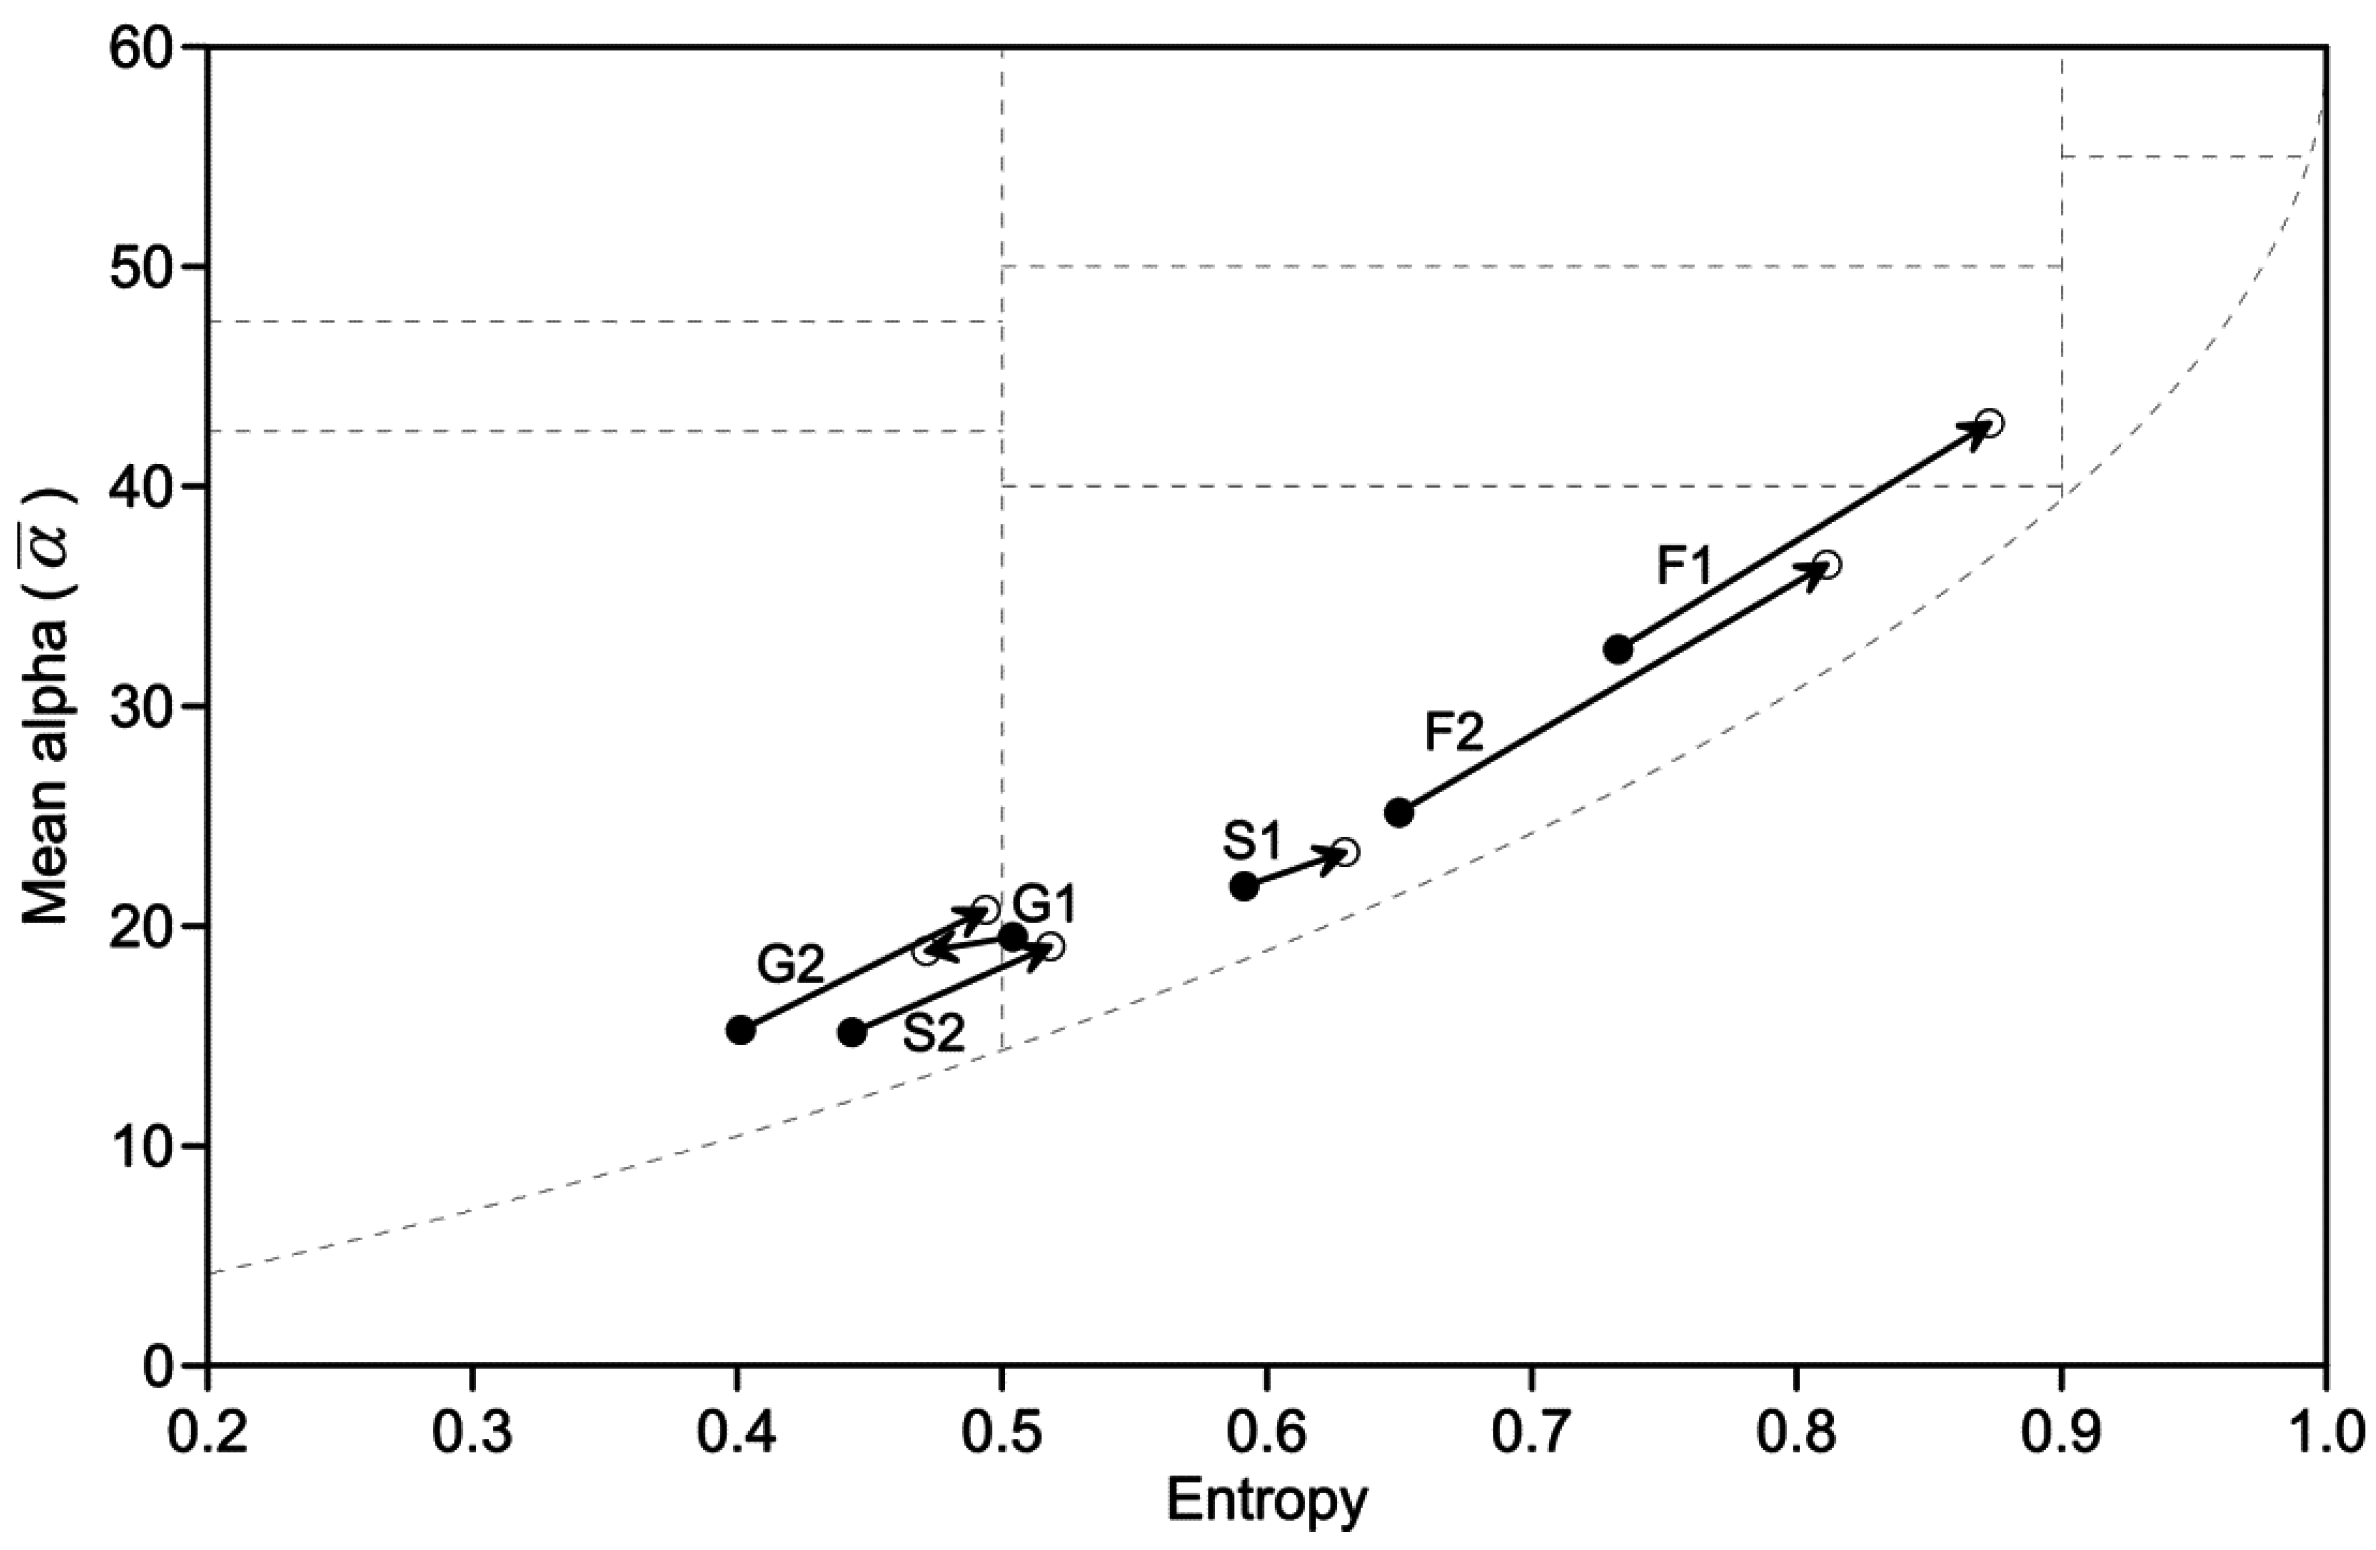
Figure 5 shows calculated mean
and
values of the test sites under frozen (closed circle) and thawed (open circle) conditions. In general, both
and
values increase with thawing. A greater increase in scattering randomness can be found in forested areas. By comparison, F1 shows higher entropy than F2 in both frozen and thawed conditions, while F2 exhibits slightly greater seasonal changes than F1. The
values in the S2 and G2 sites are much smaller than other sites in frozen conditions and exhibit increasing trends with thawing. The least seasonal variations in the scattering randomness can be found in two test sites in the upper right quadrant of the image, S1 and G1. Particularly, in the case of open ground G1, the entropy is rather decreased by the thawing of the landscape as opposed to other sites.
Figure 5.
Movement of mean and values of the test sites between frozen (closed circle) and thawed (open circle) conditions.
Figure 5.
Movement of mean and values of the test sites between frozen (closed circle) and thawed (open circle) conditions.
The results in
Figure 5 illustrate that the eigenvalue and eigenvector parameters may provide additional information on the soil properties of the permafrost active layer, as distinct from the model-based decomposition parameters. Nonetheless, it is not easy to distinguish different scattering properties with the
plane, since they are distributed in a narrow region along the azimuthal symmetry line (lower bounding curve in the
plane). This can be attributed to the averaging inherent in the
parameters. To improve the distinguishability of different scatterers, seasonal variations of the dominant scattering mechanism, which can be identified via extraction of the largest eigenvalue (
), are further investigated.
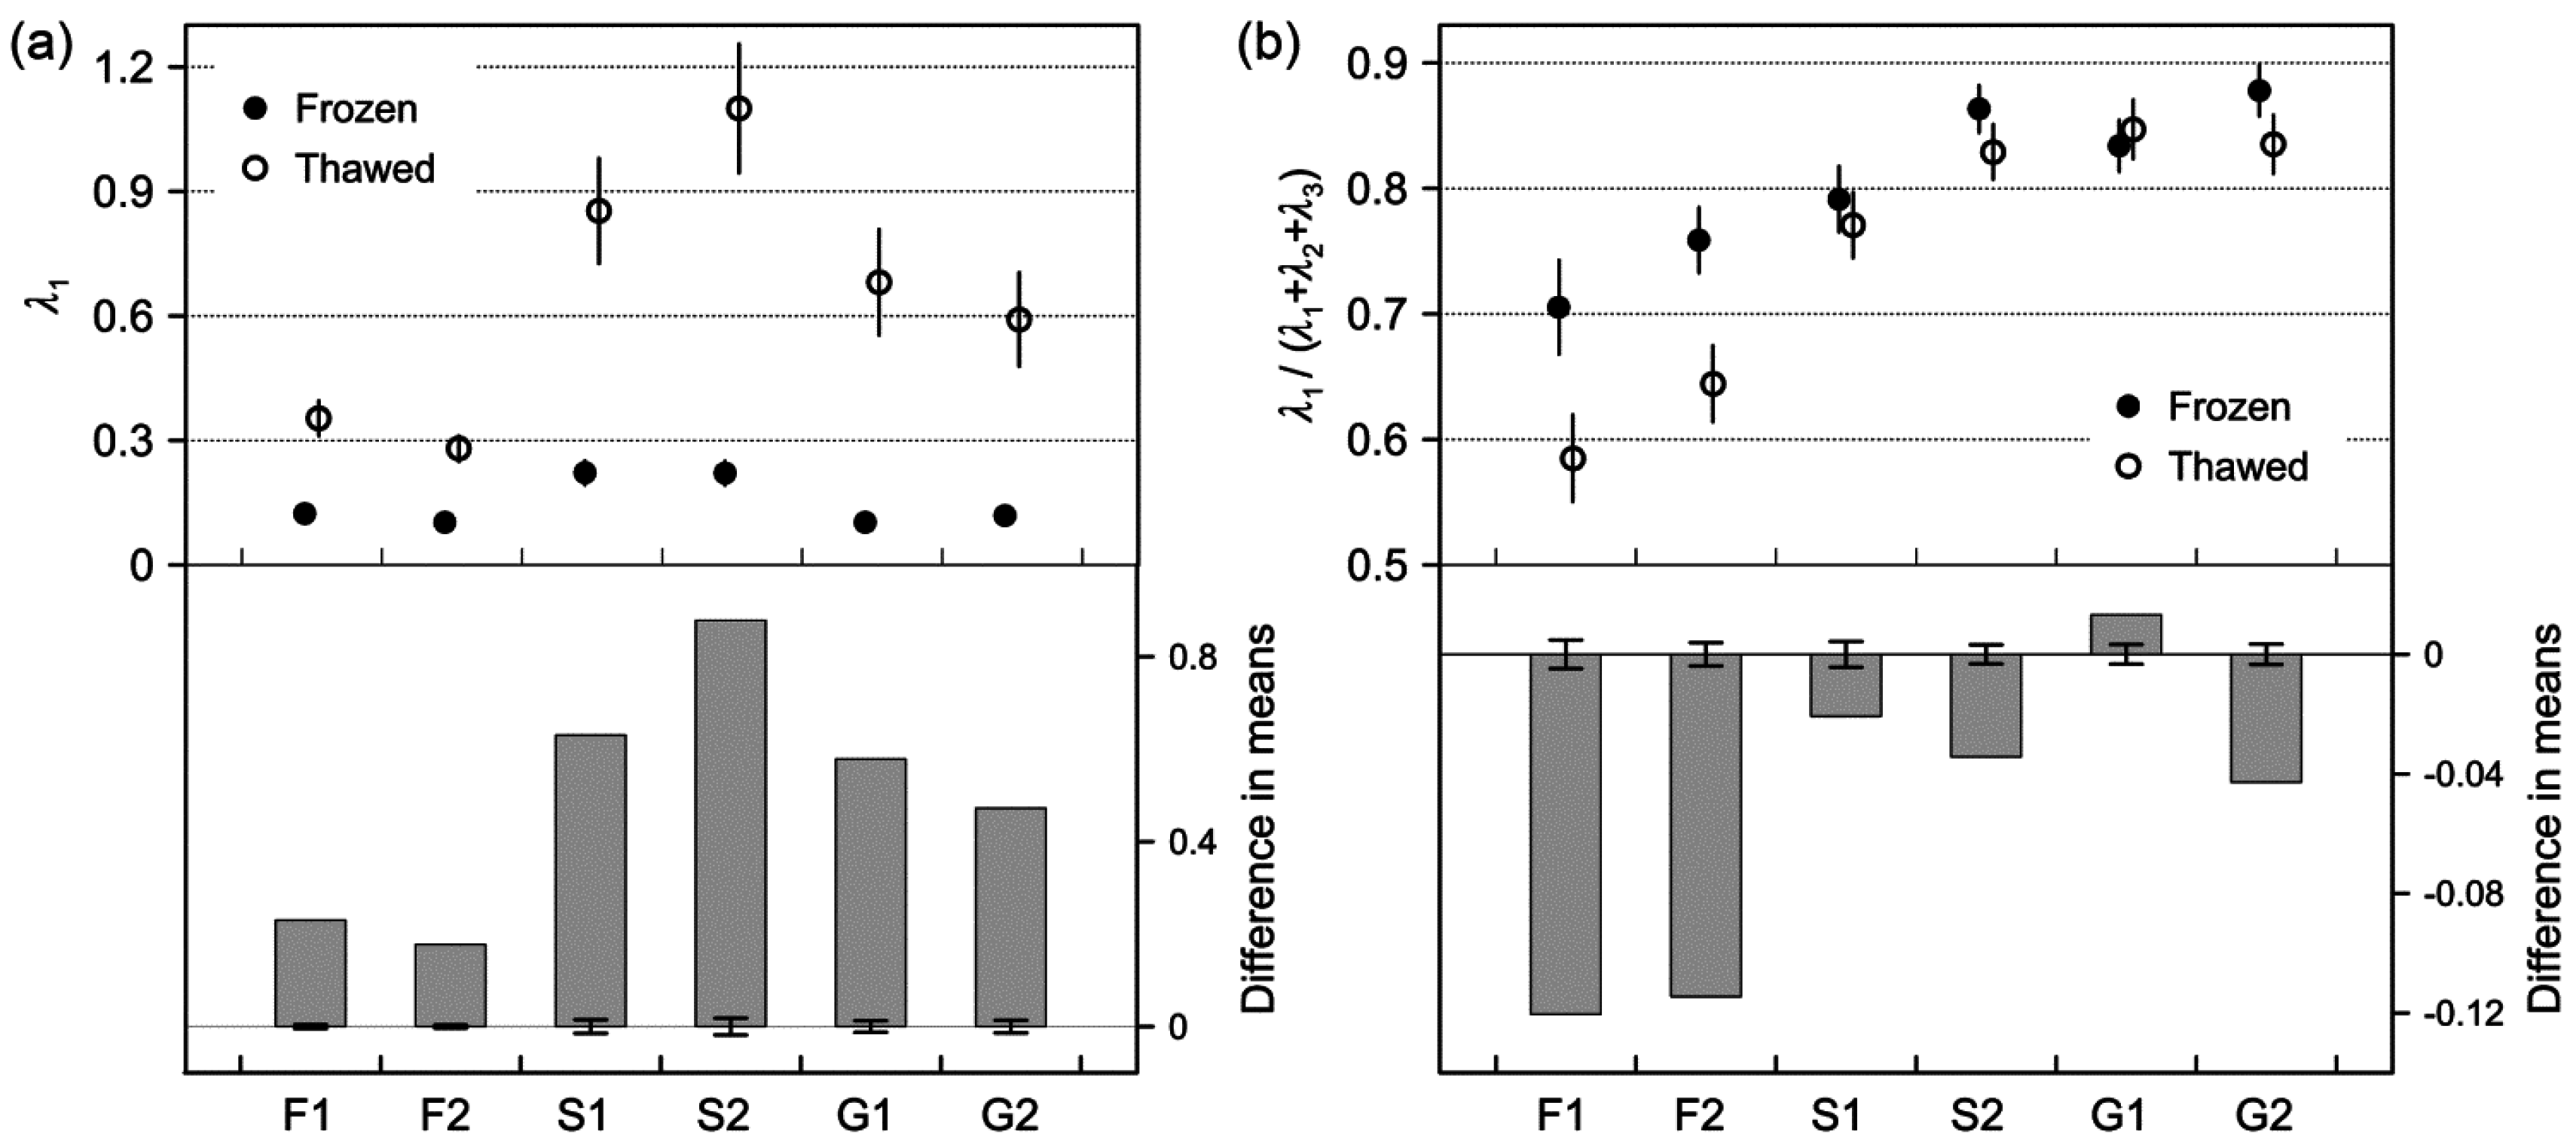
Figure 6 shows the changes of the largest eigenvalue and its relative amplitude,
. Here,
and
represent the dominant scattering power and relative strength of the dominant scattering mechanism in the total power, respectively. The dominant scattering power follows a similar temporal pattern to the magnitude changes of the scattering power vector shown in
Figure 4a,
i.e., an increasing trend with thawing for all test sites and relatively little changes in forested areas.
The relative amplitude of the dominant scattering mechanism generally decreases with the thawed landscape, leading to an increase of the entropy. A greater decrease in can be found in forested areas. The seasonal and values indicate that variations of the scattering mechanisms by the freeze/thaw transition in forested areas are attributed to increases in the depolarization level in backscattered signals from a frozen to thawed state.
The seasonal changes of
in nonforested areas are much smaller than forested areas, which indicate that seasonal variations in the backscattered signal are caused by the extreme seasonal changes in the dielectric properties of the scattering surface rather than the changes of scattering mechanisms. Nonetheless, differences between mean
values in frozen and thawed states are statistically significant according to the similar hypothesis test discussed in
Section 3.1. In addition, seasonal variations of
in nonforested areas exhibit a possibility to distinguish burnt forest and thermokarst areas. Backscattered signals from the thermokarst region (S2 and G2) can be characterized by higher
values in frozen states, resulting in greater decreases of
than in burnt forest (S1 and G1).
Figure 6.
Seasonal variations of (a) the largest eigenvalue () and (b) its relative contribution to the total backscatter, . Vertical error bars in the lower plot indicate 99% confidence interval for the hypothesis test .
Figure 6.
Seasonal variations of (a) the largest eigenvalue () and (b) its relative contribution to the total backscatter, . Vertical error bars in the lower plot indicate 99% confidence interval for the hypothesis test .
3.3. Co-Polarization Coherence
In addition to the polarimetric target decomposition techniques, several studies have reported that the coherence measure between the two co-polarization channels can provide useful information on the scattering process [
39,
40,
41,
42,
43]. The co-polarization coherence on the HV-polarization basis (
) and the circular-polarization basis (
) can be expressed as [
29]:
The magnitude of
can be another good indicator of depolarization. It will be zero for a completely random signal and one for a pure polarized signal. A high degree of coherence between HH and VV can be found in the single surface scattering case, while the multiple or volume scattering results in low coherence values. Consequently,
can be a useful scatter type discriminator between forested or built–up areas and bare surfaces [
22,
39,
43].
In contrast, the circular polarization coherence is not appropriate to distinguish surface and volume scattering, since lower
values can be found in both scattering types. A high coherence rather indicates the dominance of double-bounce scattering [
39,
40]. In addition,
has been found to be very sensitive to surface roughness [
39,
42].
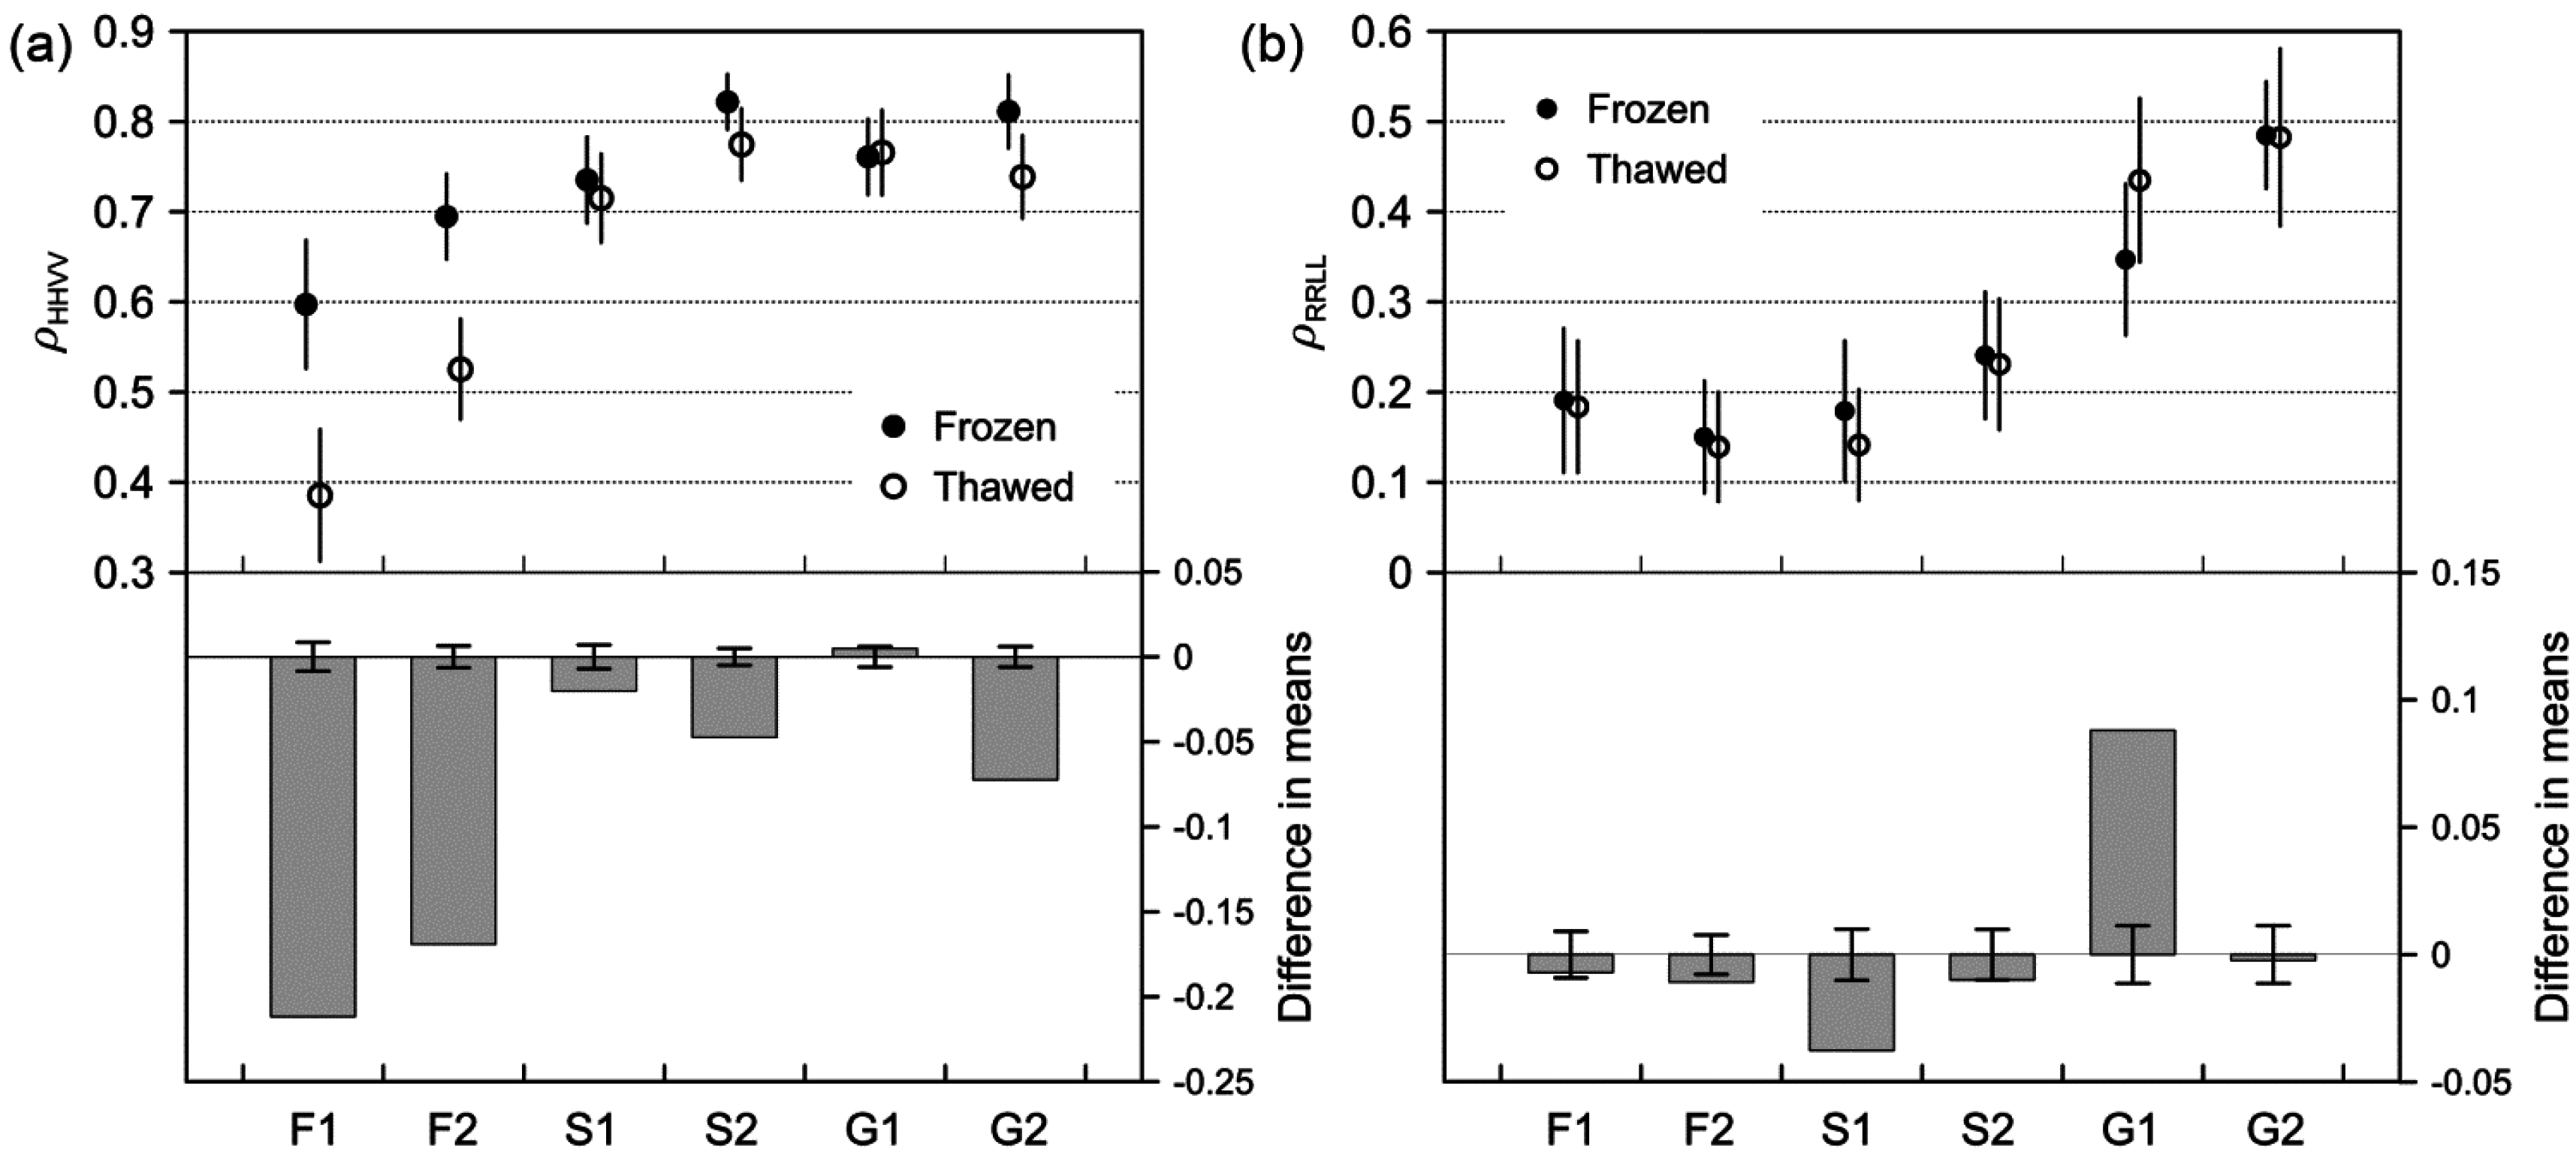
Figure 7 shows the variations of
and
between frozen and thawed conditions. The spatial and temporal trends of the
values are similar to those of the relative amplitude of the dominant scattering mechanism
in
Figure 5, since both
and
can be a measure of the depolarization level in the backscattered signal. Greater seasonal changes can be observed in forested areas, while
shows smaller or almost no changes in the S1 and G1 sites. Particularly, differences between mean values in frozen and thawed states show statistically no significance in the G1 site. Higher
values in the S2 and G2 sites in the frozen condition lead to greater seasonal variations than those in burnt forests.
In the case of , spatial and temporal patterns are quite distinct from those in other polarimetric parameters. While shows enhanced contrast between different scattereres in nonforested areas, there are statistically no differences between mean values in frozen and thawed states, except for the seasonal changes in the S1 and G1 sites. Results indicate a great potential to differentiate permafrost surficial features almost independently with extreme seasonal changes in the dielectric properties of the scattering medium.
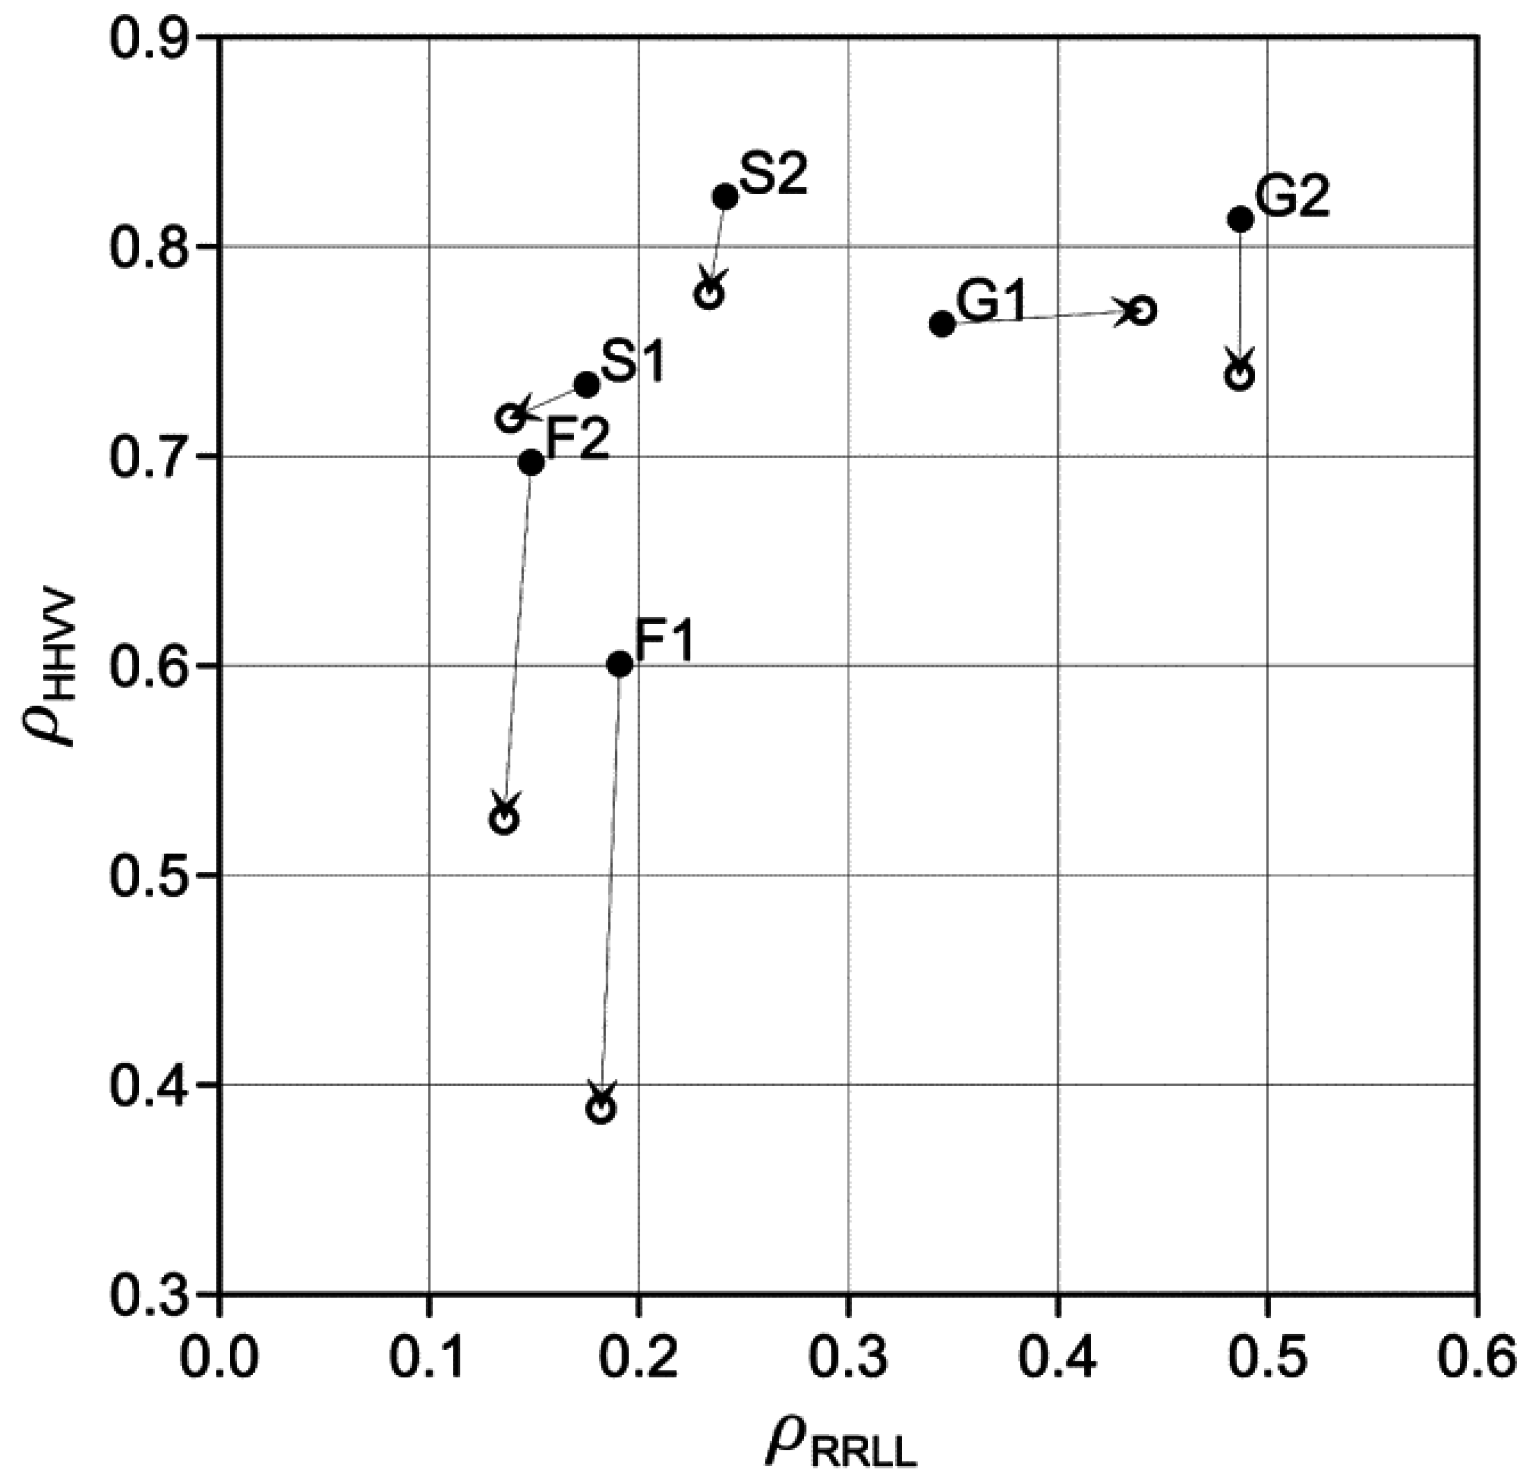
The co-polarization coherences on the HV-polarization basis and the circular-polarization basis offer complementary information on the scattering properties.
Figure 8 displays the movement of the mean
versus values between frozen and thawed conditions to aid the discrimination of different scattering types in the permafrost active layer. Two forest sites show a greater magnitude of changes than others. Their locations on the
plane move along the
axis with thawing. Change vectors of nonforested areas have similar magnitudes, but different directions and locations on the
plane. The
versus points of two sites in the lower left quadrant of the image, which are probably situated on the thermokarst region (S2 and G2), also move along the
axis. They are distinguished from forests by higher
values, while
discriminates scattering properties between shrublands and sparsely-vegetated areas. However, change vectors of the two test sites situated on the burnt forests, S1 and G1, are aligned with the
axis, but point in the opposite direction:
increases in sparsely-vegetated areas, while it decreases in shrubby areas. Although these results should be justified with appropriate
in situ information, it is clear that certain differences between permafrost surficial features can be captured by the co-polarization coherences.
Figure 7.
Seasonal variations of (a) and (b) for the test sites. Vertical error bars in the lower plot indicate the 99% confidence interval for the hypothesis test .
Figure 7.
Seasonal variations of (a) and (b) for the test sites. Vertical error bars in the lower plot indicate the 99% confidence interval for the hypothesis test .
Figure 8.
Change vectors of the test sites between frozen (closed circle) and thawed (open circle) conditions displayed in the plane.
Figure 8.
Change vectors of the test sites between frozen (closed circle) and thawed (open circle) conditions displayed in the plane.
4. Summary and Conclusions
Seasonal freezing and thawing patterns of the permafrost active layer are spatially and temporally heterogeneous, resulting in a large range of seasonal or annual variability of permafrost ecosystems and periglacial landforms. In addition, recurrent fire disturbance changes land cover, the surface energy balance and other geophysical and biophysical processes. Spaceborne SAR remote sensing is one of the most adequate monitoring systems for understanding spatial heterogeneity and for mapping active layer dynamics with high spatial resolution. However, the interpretation of SAR signals from spatially heterogeneous targets with variable dielectric properties can be limited without understanding the actual scattering processes. In order to maximize the usability of SAR data in permafrost monitoring, this study aims to evaluate scattering properties in different land cover types and their variabilities associated with the freeze/thaw transition of the active layer.
Most previous studies characterizing seasonal variations of L-band signals have been conducted in the taiga forests areas [
10,
11,
12,
13,
14]. They have focused primarily on the interpretation of observed freeze/thaw-related changes in the HH-, HV- and VV-polarization intensities. Based on the simulation results by forward scattering models, they have provided an interpretation of the seasonal backscatter changes. The frozen state of the ground and the canopy decreases primarily the canopy scattering component and, to a minor extent, the ground scattering component.
The seasonal variations of VV and HV responses observed in this study for forested areas are in good agreement with the observations given in the previous studies. However, there is a slight difference between the seasonal variations of the HH response observed in this study (about 5 dB) and that of previous studies (about 3 dB). These characteristic seasonal variations of the backscattered signal can be attributed to the coupled effect of changes in total backscattered energy and signal penetration properties caused by the large contrast in the dielectric constant of frozen and thawed scattering medium. Since snow in winter data could be dry according to the meteorological data, the influence of the seasonal snow layer on the backscattered signal is neglected in this study. In order to evaluate scattering mechanisms involved in the observed scattering intensities, this study places focus on utilization of the fully-polarimetric scattering observation. According to the polarimetric scattering type indicators, characteristic changes in backscattering coefficients are attributed to variations of relative scattering contributions rather than total backscatter powers. In addition, the scattering mechanism changes between frozen and thawed conditions in forested areas are characterized by a significant increase of the volume scattering contribution among the received signals. The seasonal changes of the double-bounce scattering contribution and the HHVV polarization coherence further provide the possibility to discriminate tree species.
In this study, variations of scattering properties are also examined for non-forested areas. Since there have been few studies on this issue in non-forested areas, a detailed analysis on seasonal scattering characteristics in such areas is an important contribution of this study. Four possible categories that may cover non-forested parts of the study area are selected based on the vegetation types (shrub versus low or no vegetation) and underlying soil property (recently burnt forests versus open areas most likely situated on the thermokarst regions).
Shrublands located in the burnt forests show similar temporal backscatter trends to those of forested areas, but have much fewer increases of the volume scattering contribution with thawing. In addition, it shows almost no change in the relative contribution of the dominant eigenvalue, while backscattered power increases with thawing due to increases of the roughness and dielectric constant of the scattering surface. The scattering properties of the other shrublands situated on the thermokarst region can be characterized by a greater surface scattering contribution in both frozen and thawed conditions than shrublands in burnt forests. The relative amplitude of the surface scattering is higher under frozen conditions. In frozen conditions, microwave signals can penetrate deeper into the vegetation and organic layers, and radar scattering can be more related to the soil property and active layer structure. Therefore, differences in polarimetric scattering characteristics between two shrublands may involve differences in not only the vegetation, but also the soil properties.
In cases of open ground covered with low to no vegetation, both sites show almost no seasonal variations in the relative scattering contributions of the model-based decomposition, but significant increases of the total backscattered power. However, some polarimetric parameters, including the dominant eigenvalue and co-polarization coherences exhibit characteristic differences between two ground sites only in frozen conditions. According to the literature [
23,
24,
25,
26,
27], soils and active layers in forested areas are distinctive from those in open areas by the thermal condition, active layer thickness, infiltration and evaporation rates, salinity and thickness of the shielding layer. Consequently, although the causal mechanisms about these characteristic scattering properties cannot be confirmed at this stage, polarimetric scattering analysis also reveals the possibility of obtaining a spatially-detailed distribution of the surficial features.
Experimental results demonstrate that fully-polarimetric radar observations, particularly at the L-band frequency, can be a very useful tool for mapping land cover types and surficial geocryological characteristics of the permafrost active layer. Therefore, follow-up studies on the development of classification algorithms will be carried out based on the characteristic seasonal changes of the polarimetric parameters supported by ground-truth verification. The availability of in situ measurements is, however, restricted because of sparse measurement stations, limited data accessibility and a lack of regional details in the documentation. The physical model-based simulation of polarimetric parameters can be helpful to partly overcome this problem and to effectively design the classification algorithm. In particular, further theoretical evaluations on the polarimetric coherences may play an important role in the surficial mapping of permafrost environments with SAR observations.


 represents the ensemble averaging and the superscript * denotes the complex conjugate. Diagonal elements of the covariance matrix correspond to the conventional backscattering coefficients, while off-diagonal elements describe correlation properties between co- and cross-polarization channels. In addition, the trace of the covariance matrix represents the total scattered power in a POLSAR measurement.
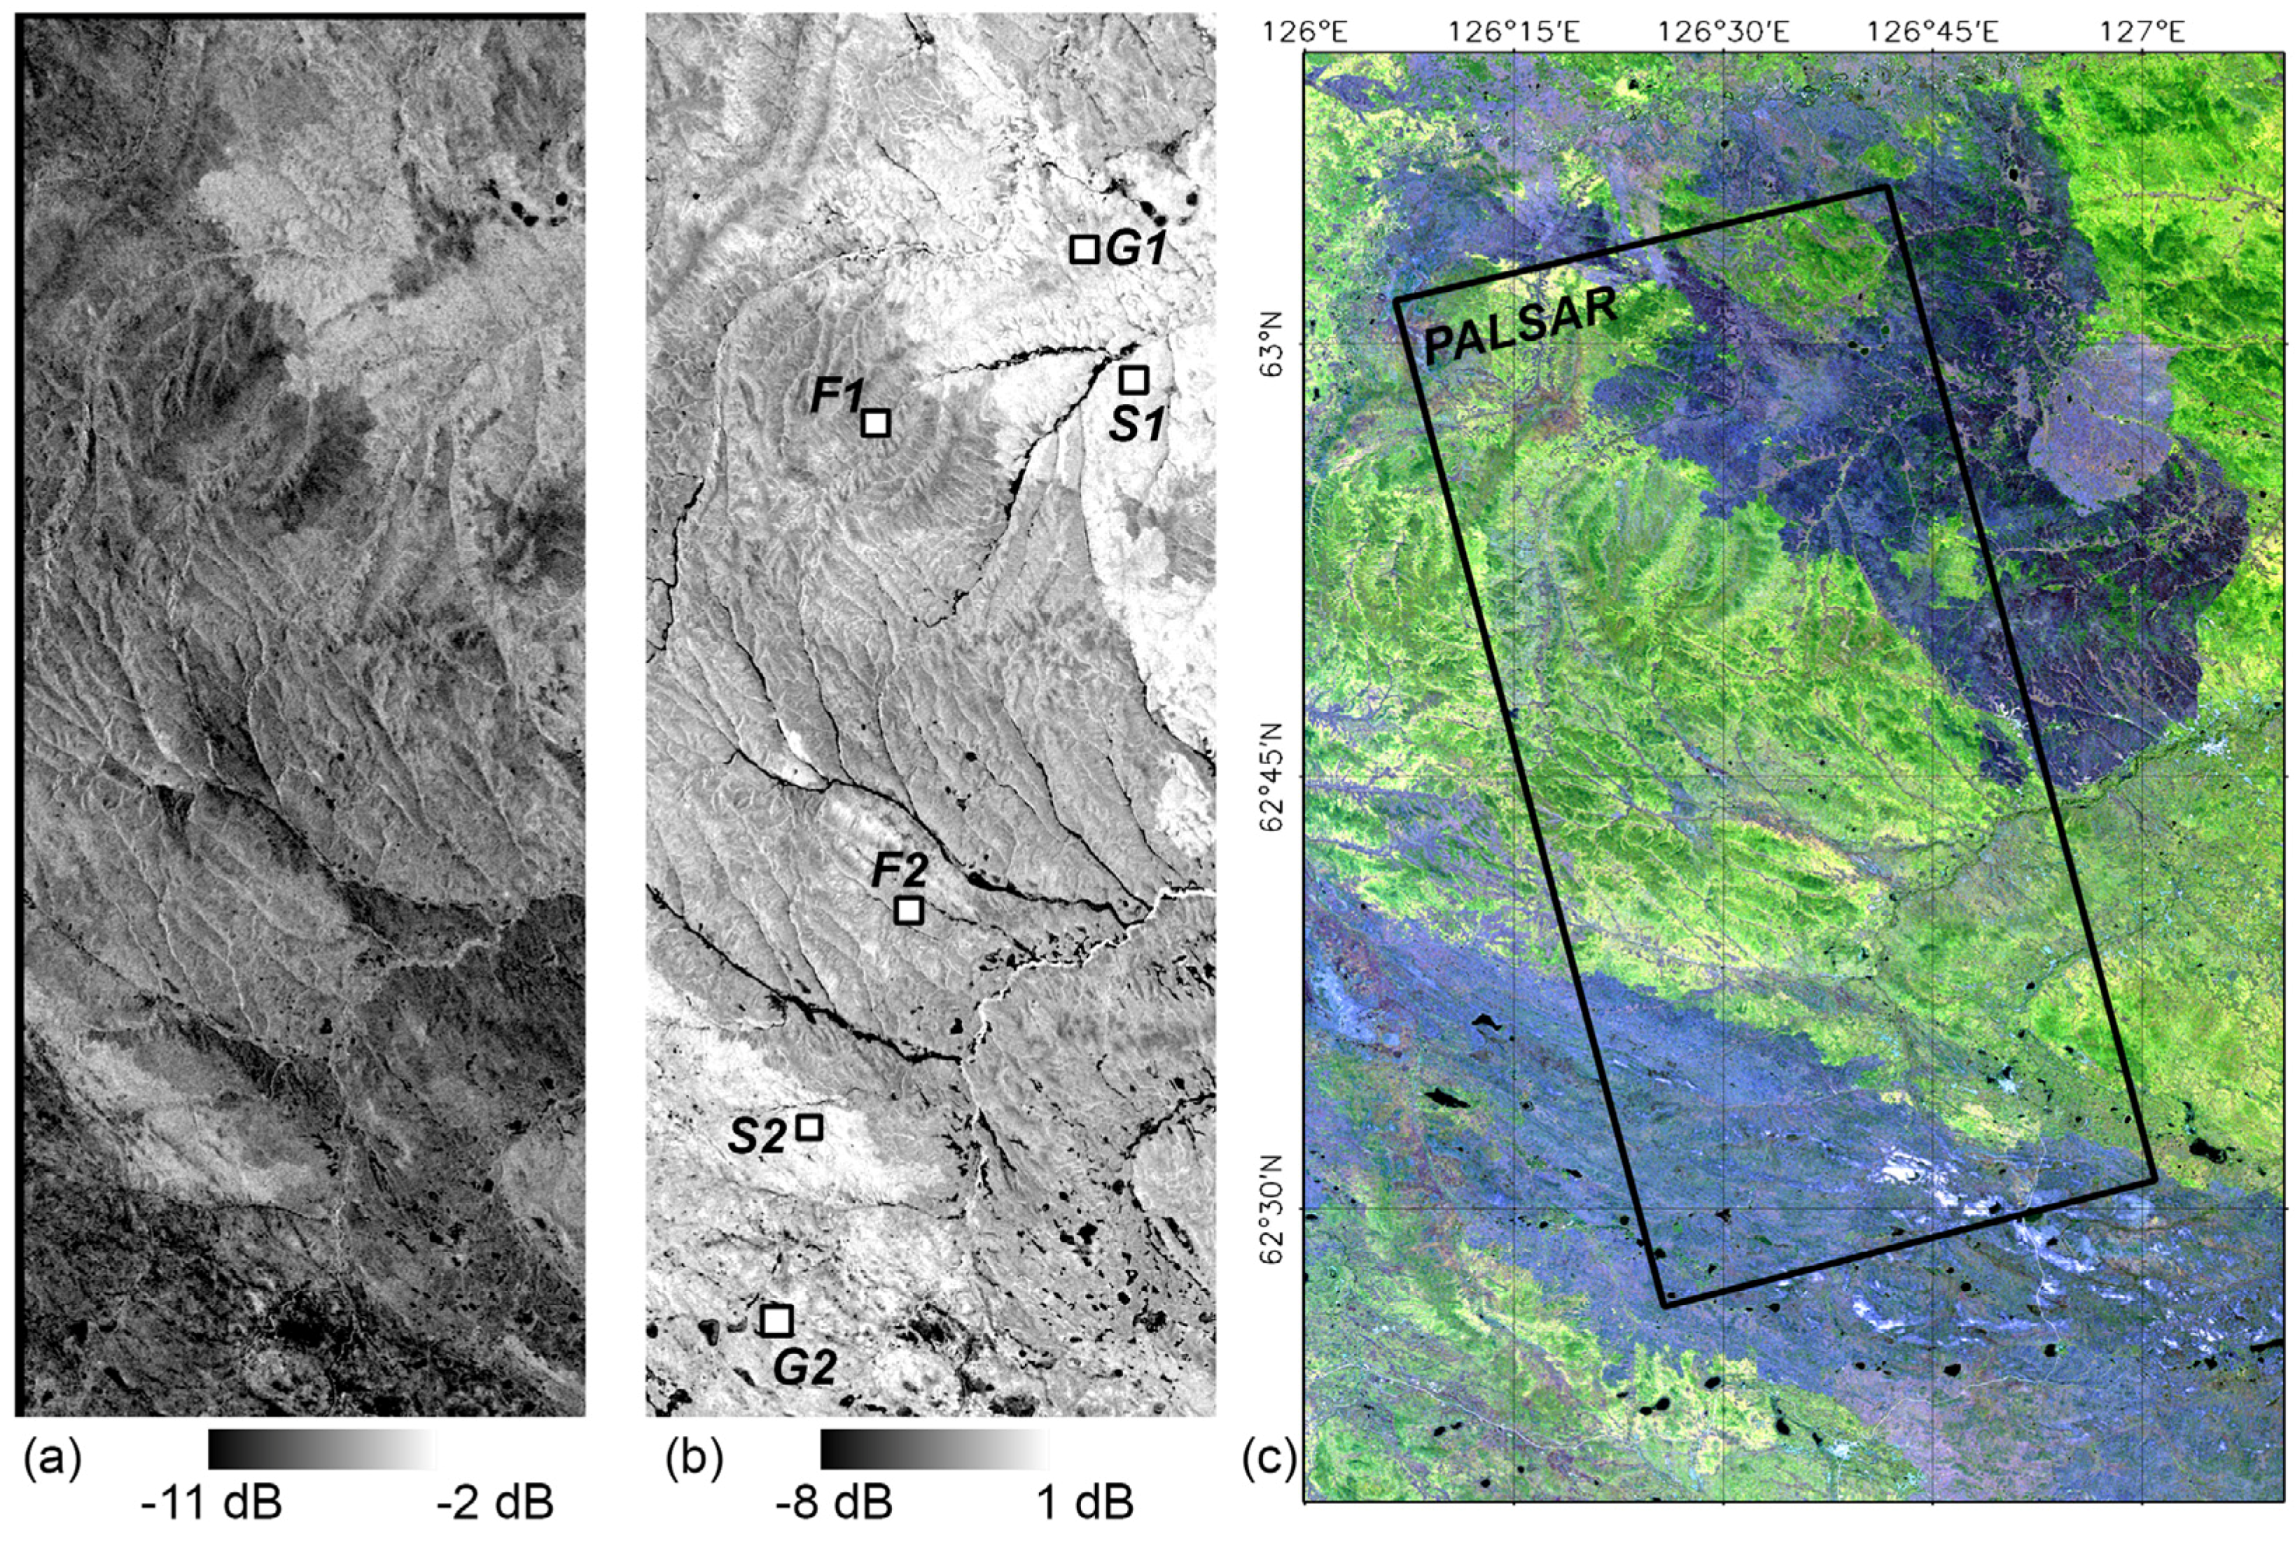
