
Mapping Cropping Practices of a Sugarcane-Based Cropping System in Kenya Using Remote Sensing


Abstract
:
1. Introduction
2. Material and Methods
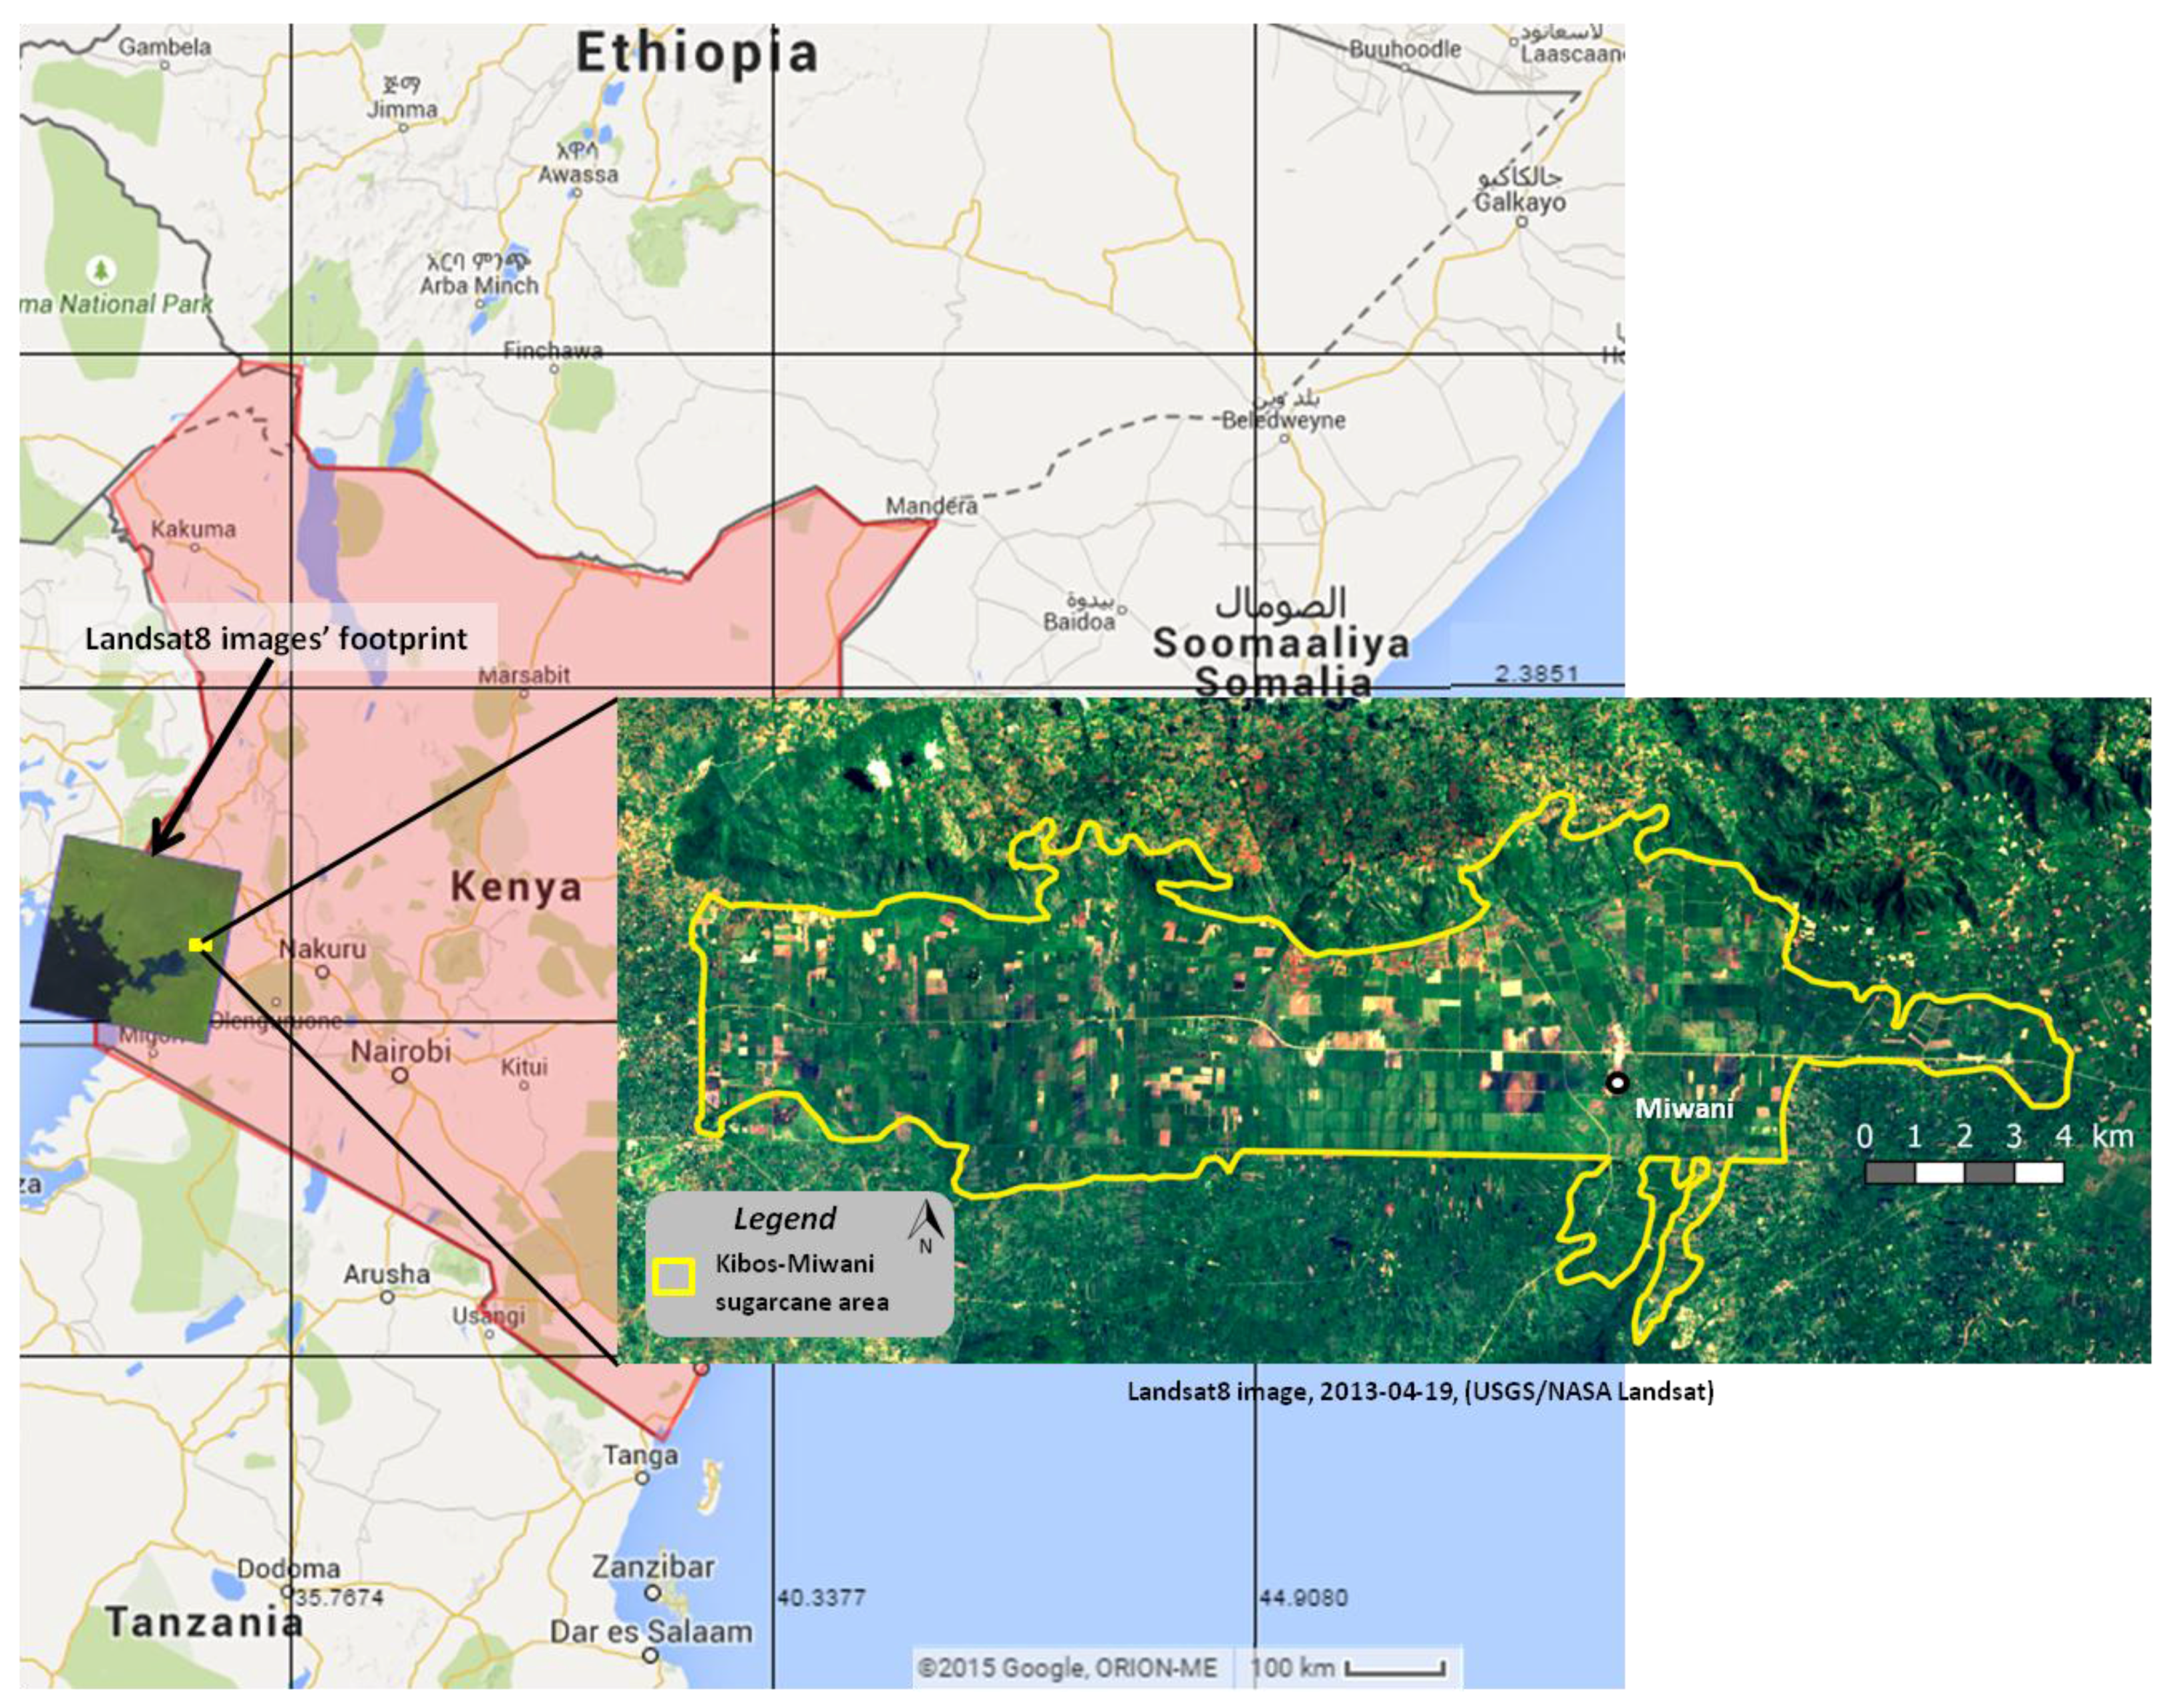
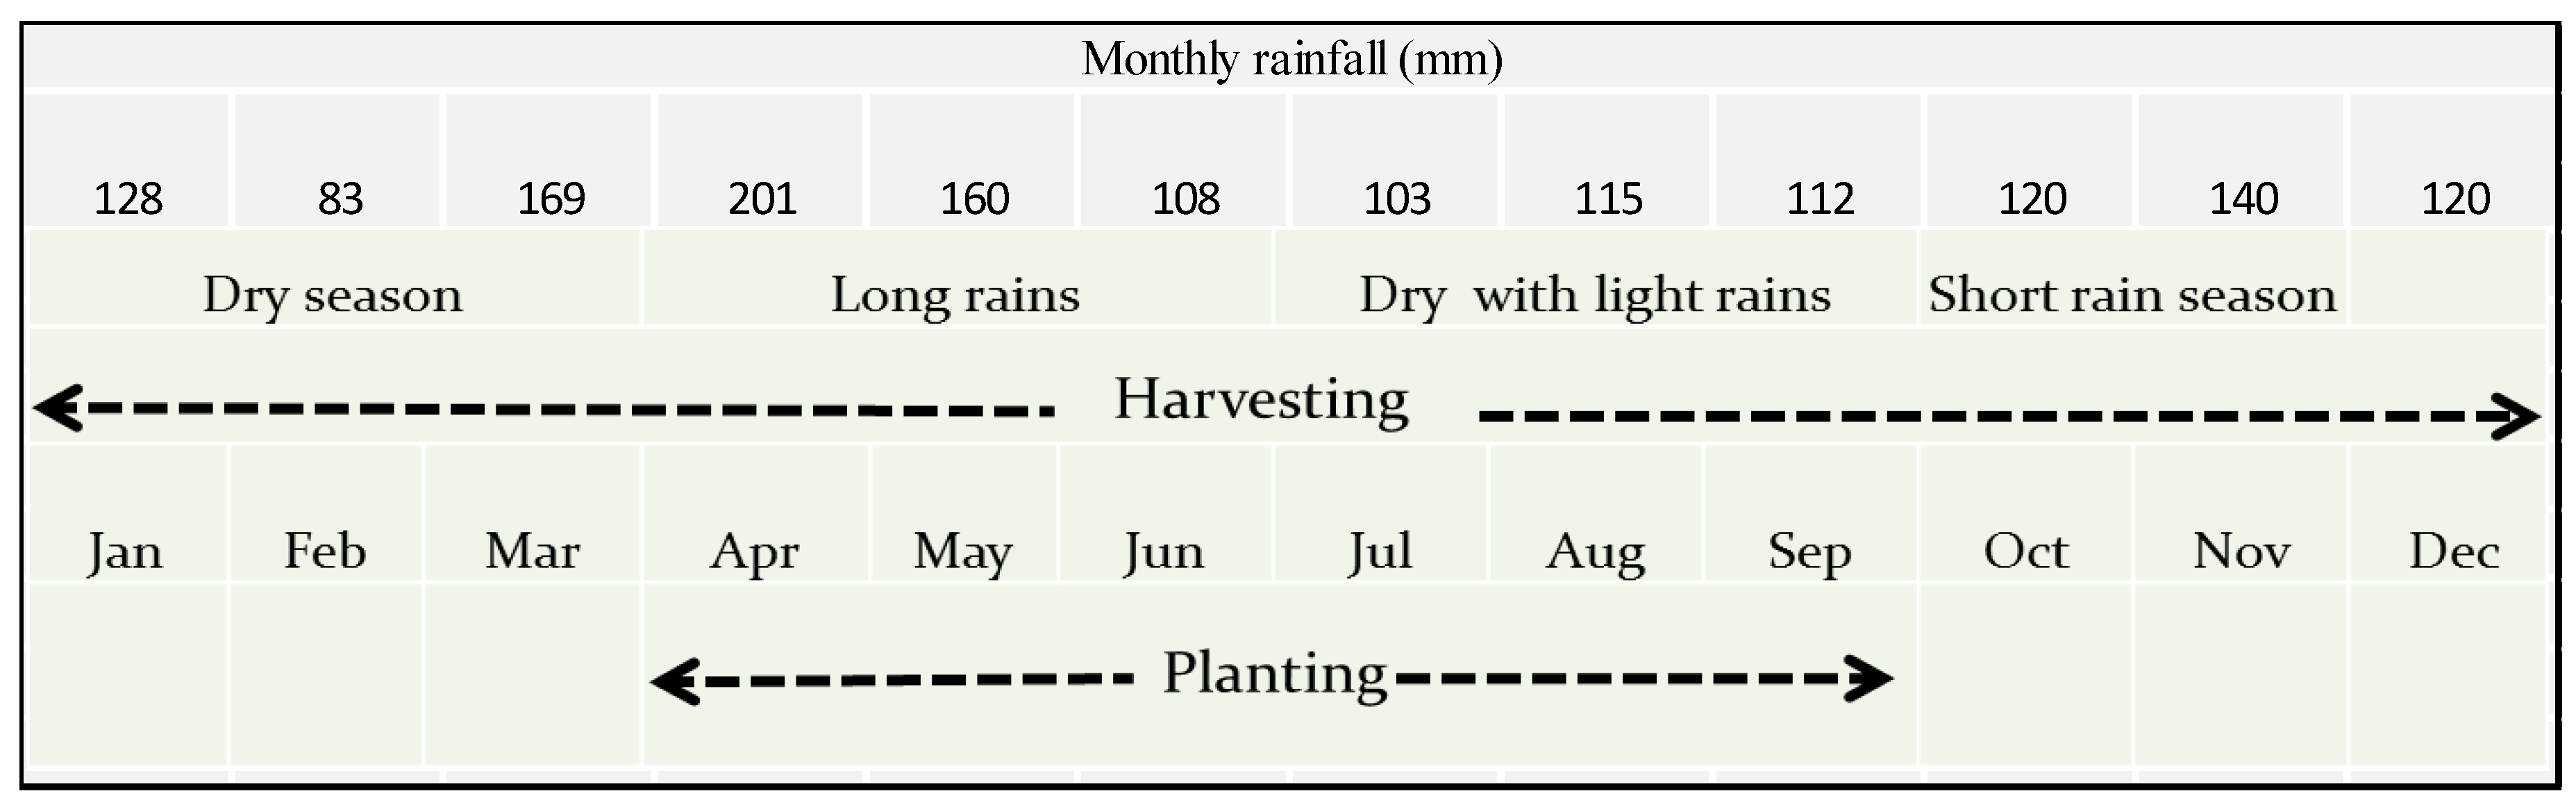
2.1. Study Area
2.2. Data
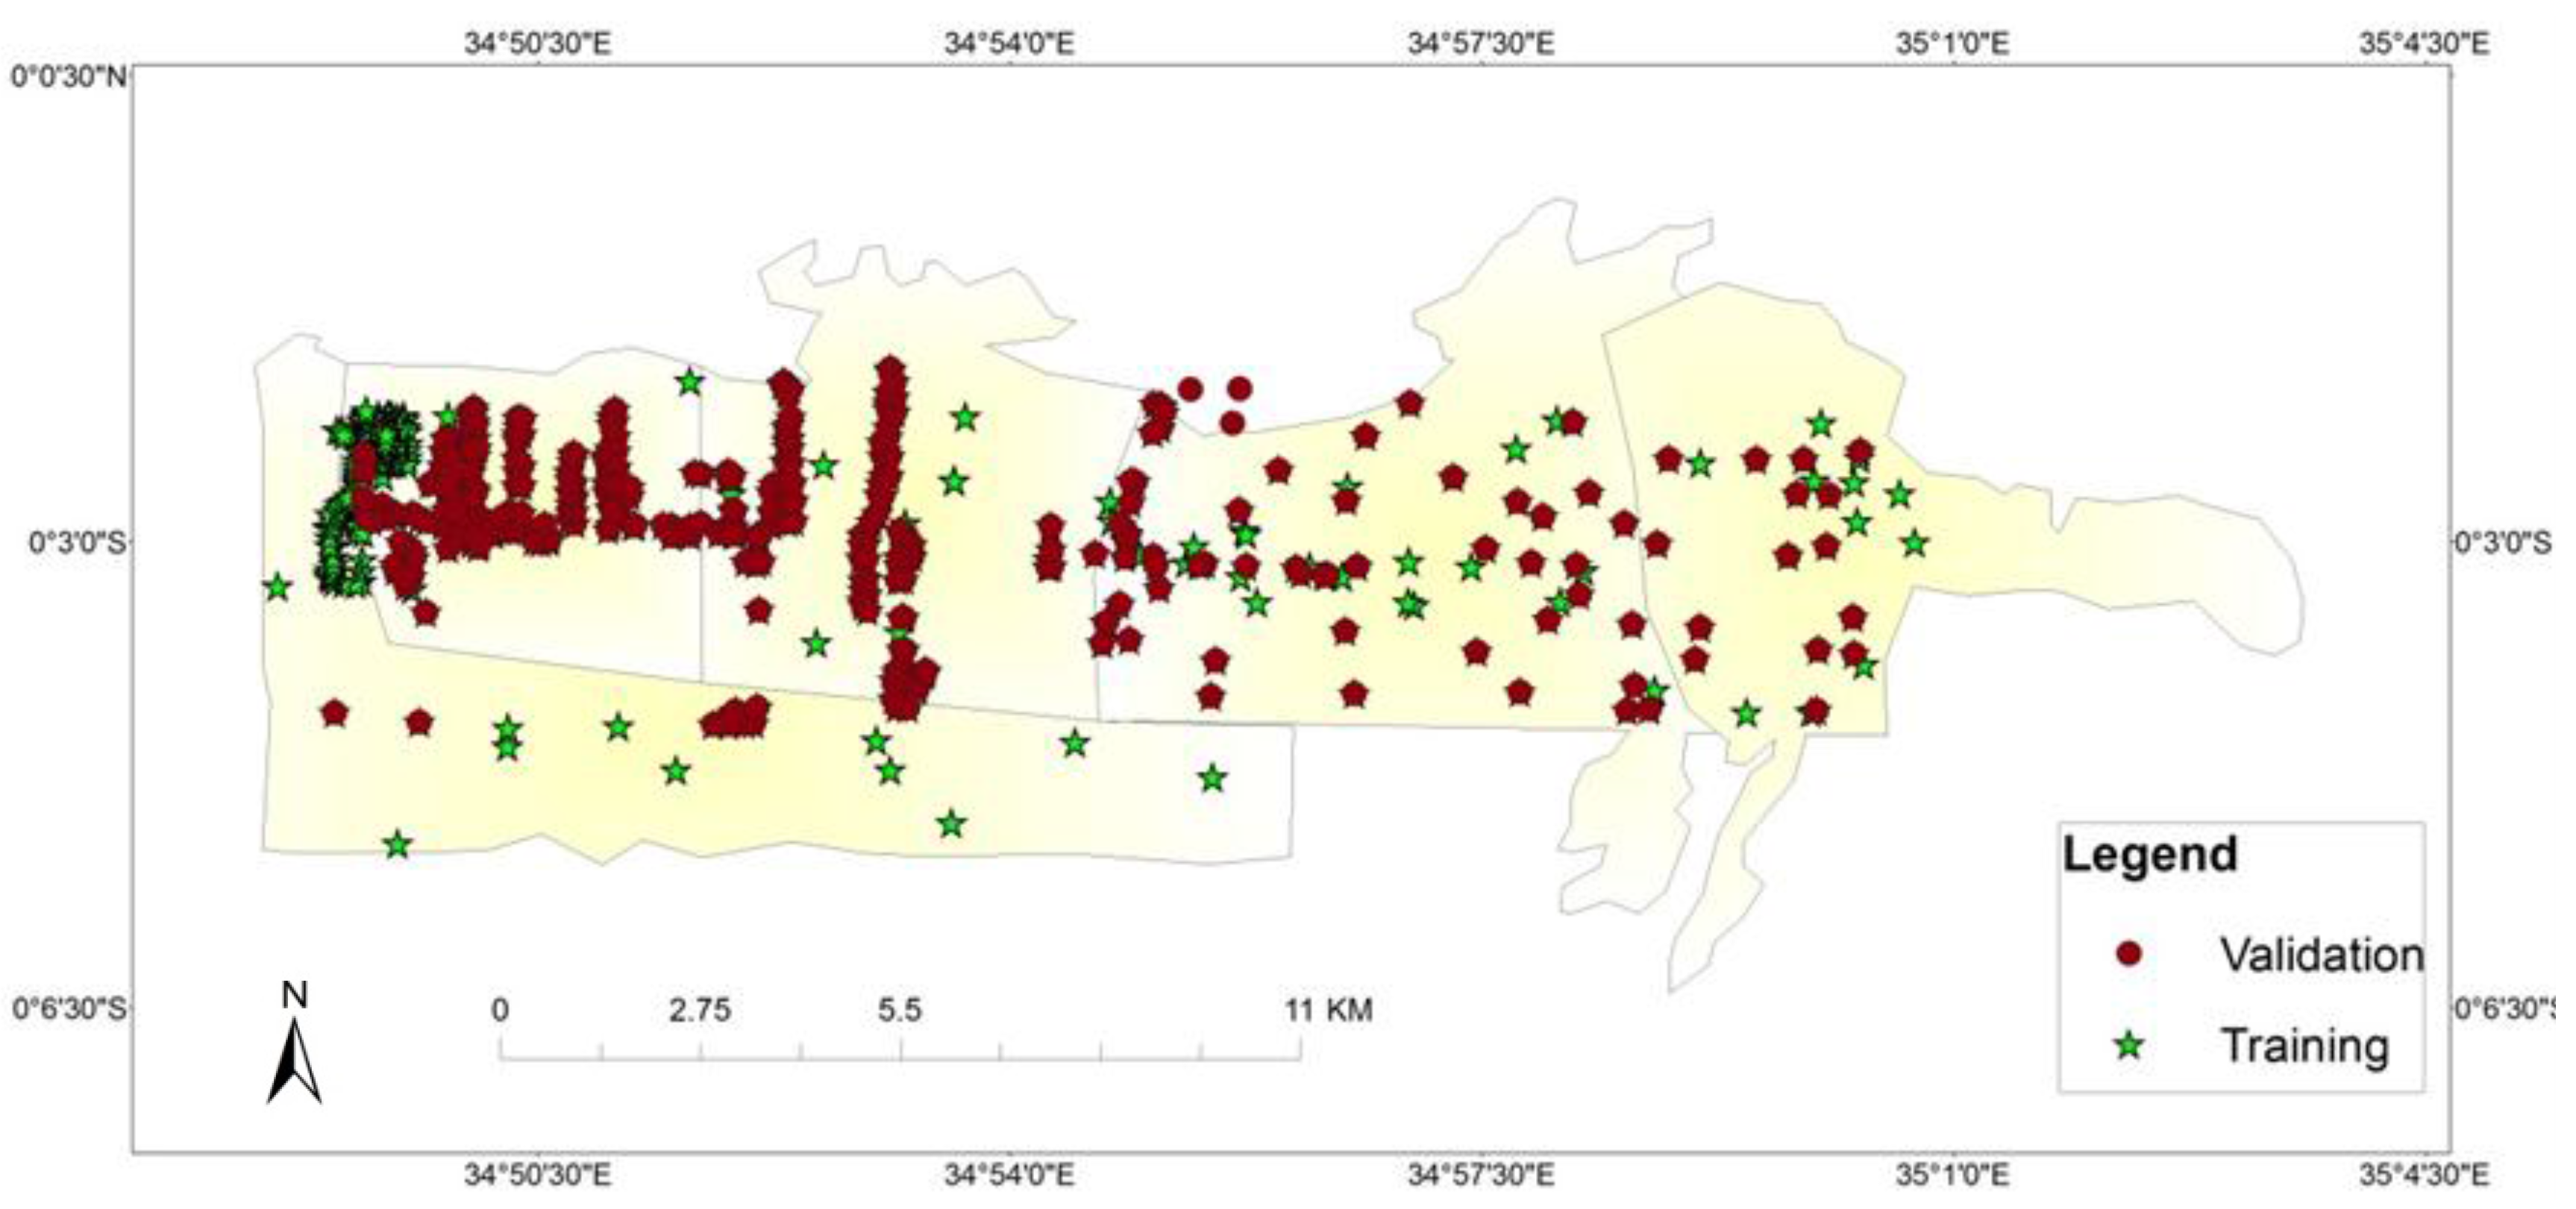
2.2.1. Ground Survey Data
- n0 = sample size;
- Z2 = abscissa of the normal curve that cuts off an area of desired confidence level at the tails;
- e = desired level of precision;
- p = maximum variability of farmers that will be studied;
- q = 1 − p.
- -
- The ground survey data were composed of 831 observations, where 530 fields were sugarcane and 301 fields were other land cover. These fields were encoded during a ground survey conducted between 14 and 18 October 2013. Figure 3 illustrates the location of the surveyed fields in Kibos-Miwani zone, showing location of those used for training (75%) and those used for validation (25%).
- -
- The Kibos Sugar Factory database was composed of 449 fields, where 270 fields were sugarcane fields and 179 fields were other land cover. These data were adopted from the existing land use data set compiled on 15 August 2013 by Kibos Sugar factory. Attributes for these fields (planting and harvesting date) were entered in our database in accordance with the factory office record. The factory data was relevant since it was collected within the study time frame of this research.

2.2.2. Satellite Data and Preprocessing

| Bands | Wavelength (micrometers) | Resolution (m) |
|---|---|---|
| Band 4–Red | 0.64–0.67 | 30 |
| Band 5-Near Infrared (NIR) | 0.85–0.88 | 30 |
| Band 6-ShortWave InfraRed (SWIR 1) | 1.57–1.65 | 30 |
| Band 8-Panchromatic | 0.50–0.68 | 15 |
2.3. Methods
2.3.1. Landsat 8 Image Analysis
2.3.2. Mapping Cropping Practices
| Class Name | Age (Months) | Number of Points |
|---|---|---|
| Sugarcane #1 | 0–2 | 131 |
| Sugarcane #2 | 3–5 | 129 |
| Sugarcane #3 | 6–8 | 150 |
| Sugarcane #4 | 9–11 | 100 |
| Sugarcane #5 | Over 12 | 90 |
| Other | -- | 360 |
| All | -- | 960 |
- -
- For the sugarcane map, we evaluated accuracy of the classification by creating a confusion matrix based on the 25% of the unused ground data (320 points).
- -
- For the harvest mode map, we evaluated accuracy of the classification by creating a confusion matrix based on the 25% of the unused ground data (200 points).
3. Results and Discussion
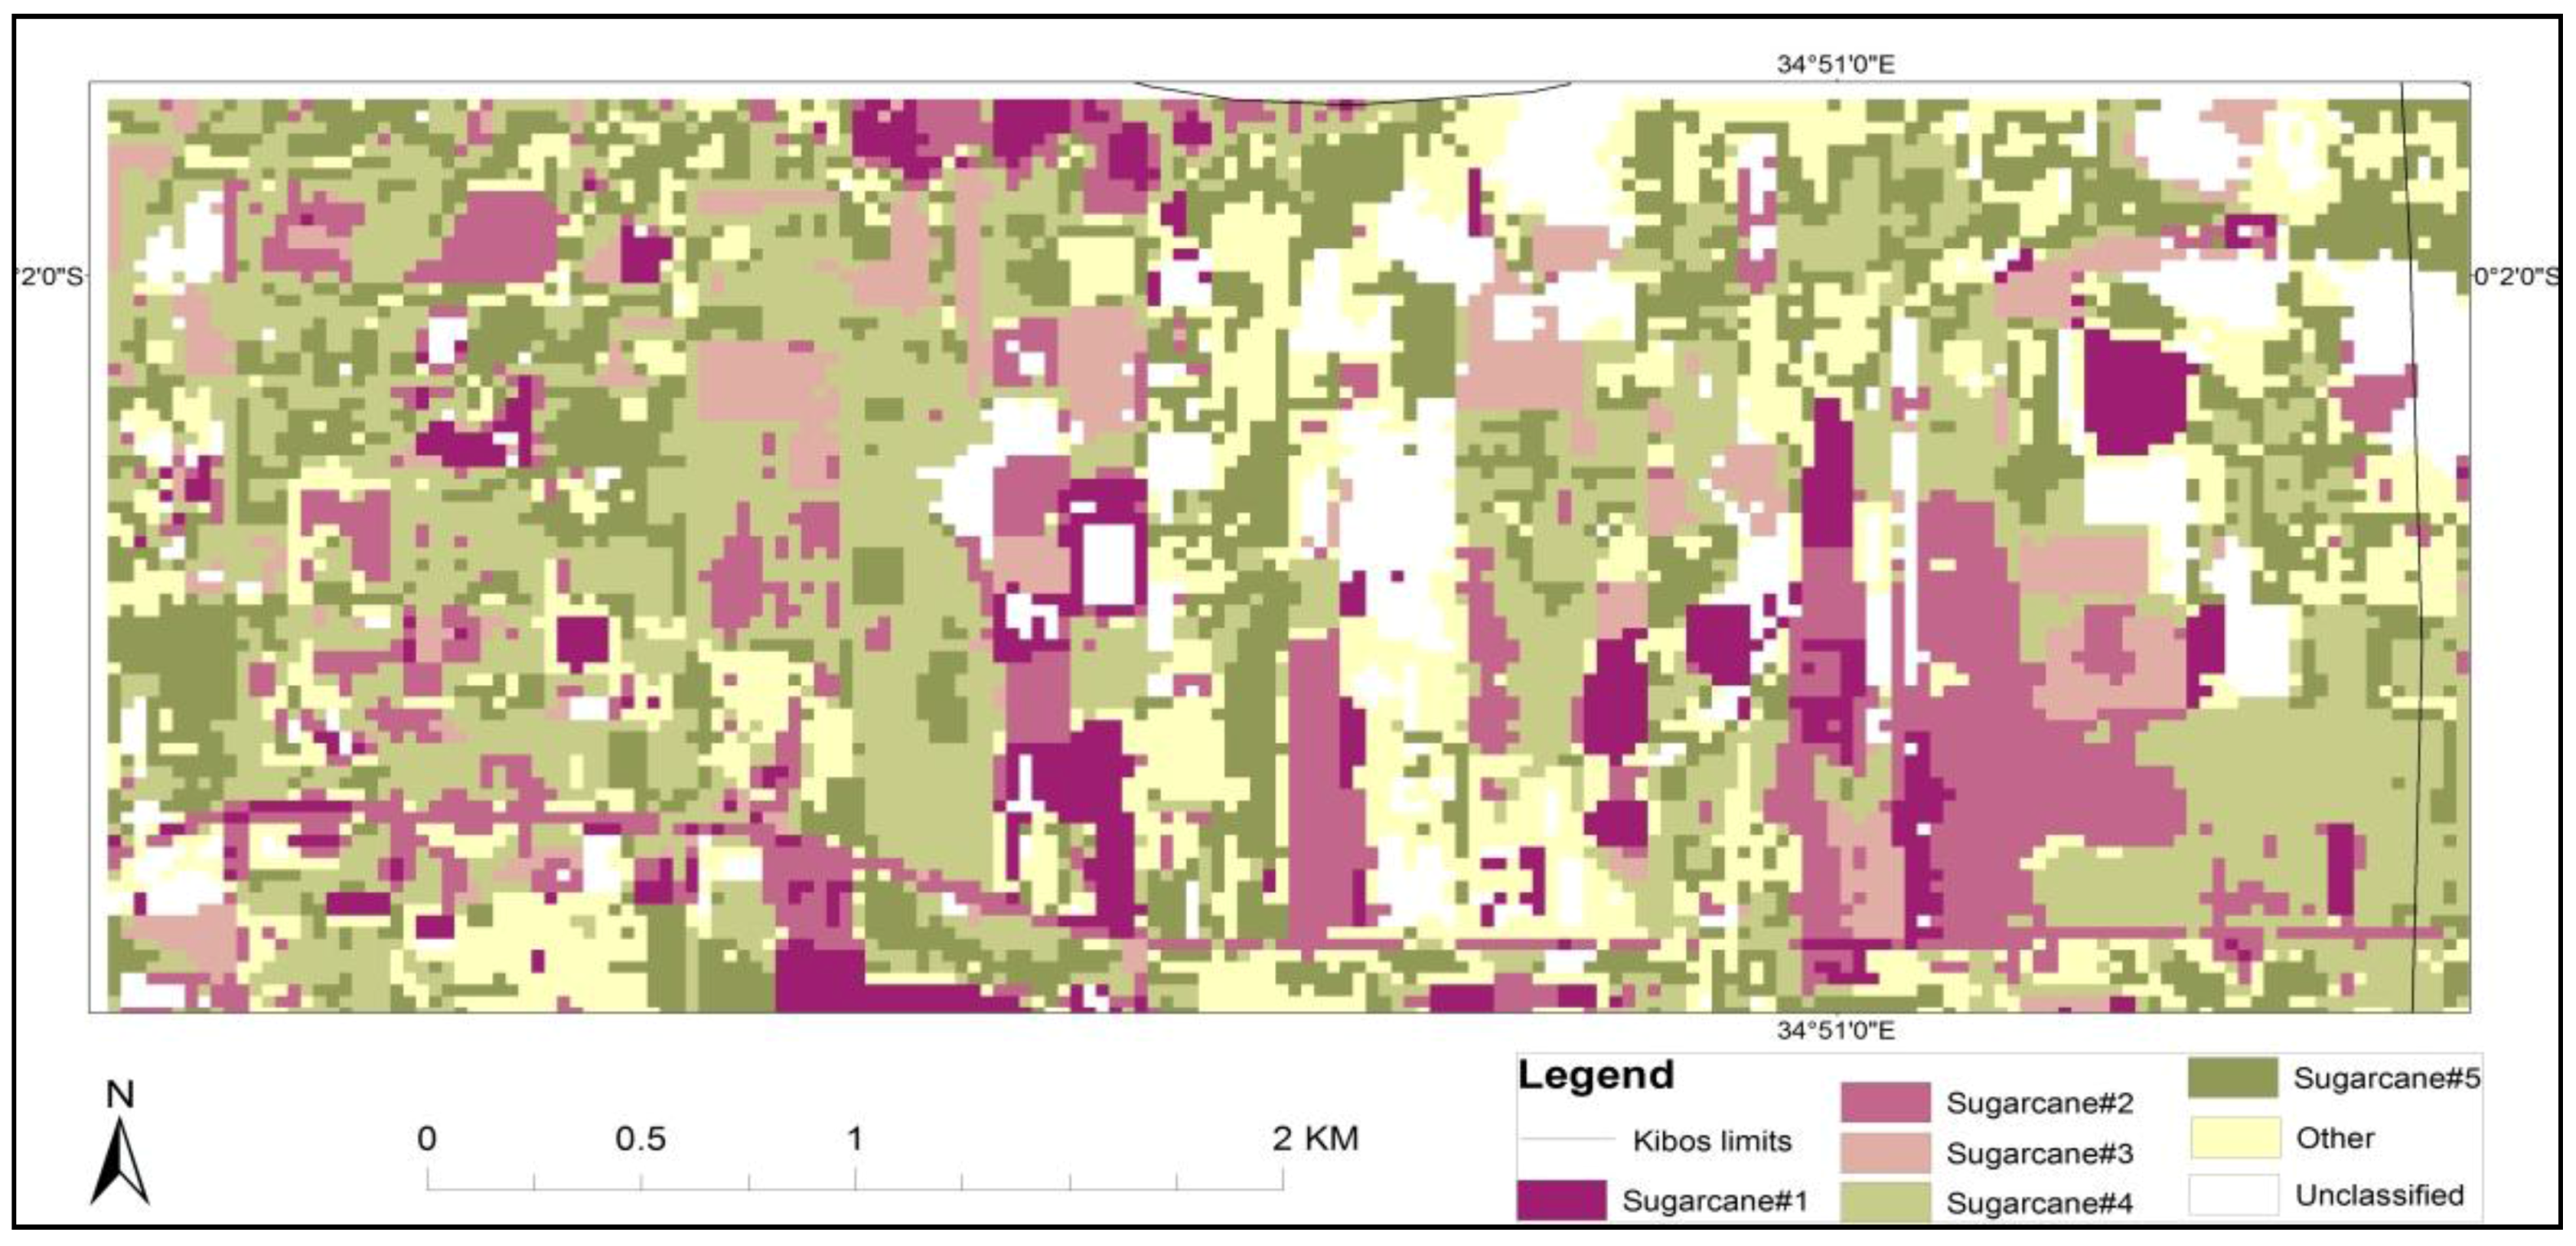
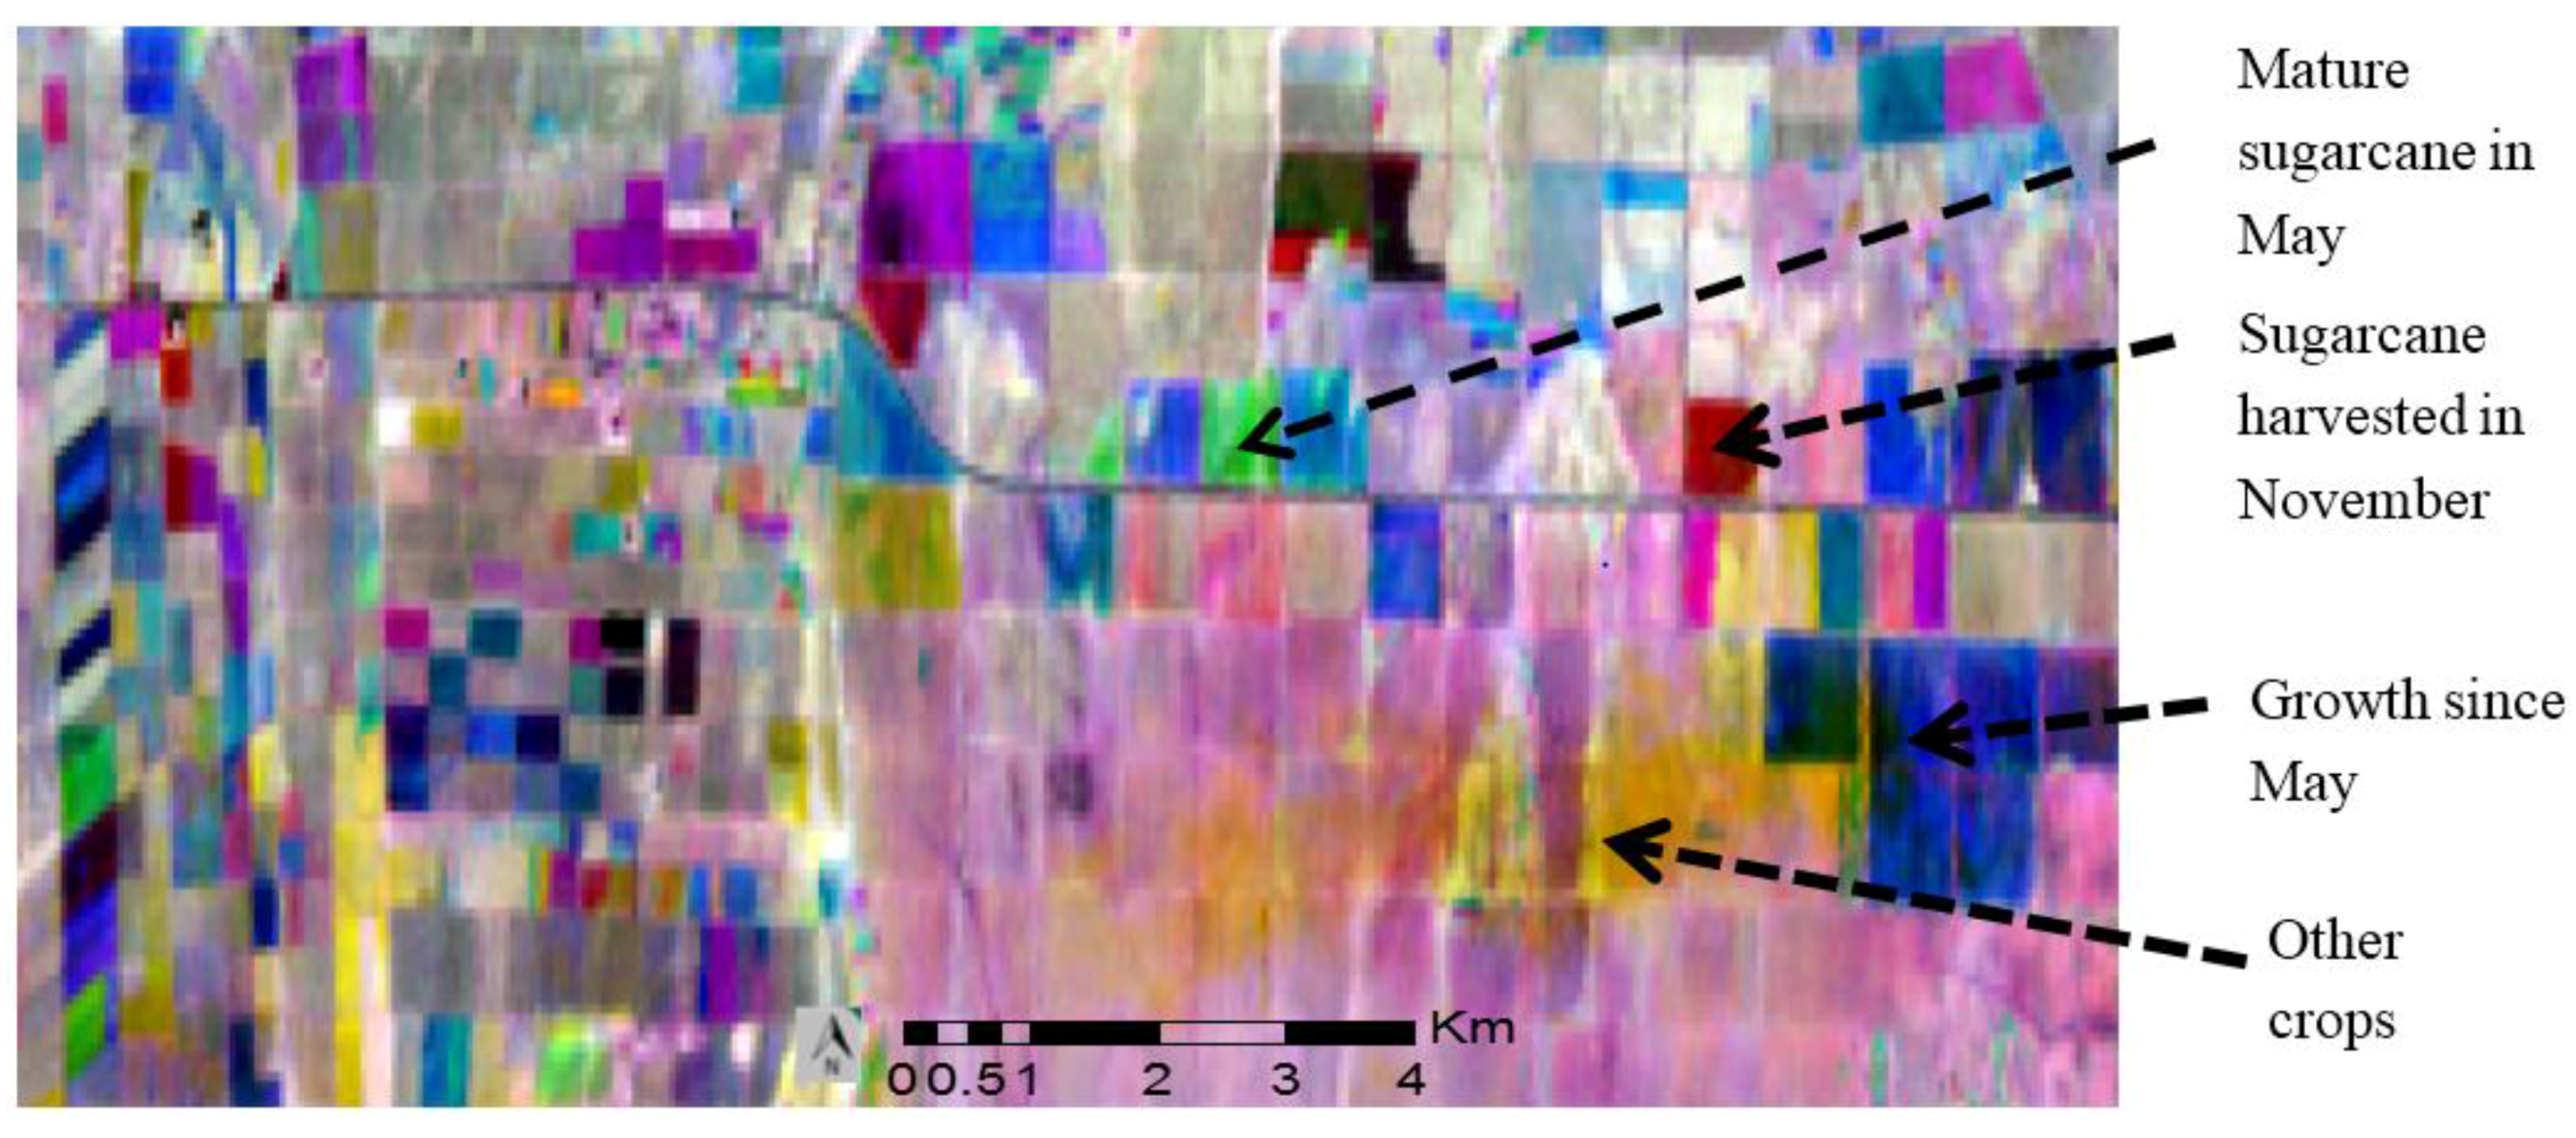
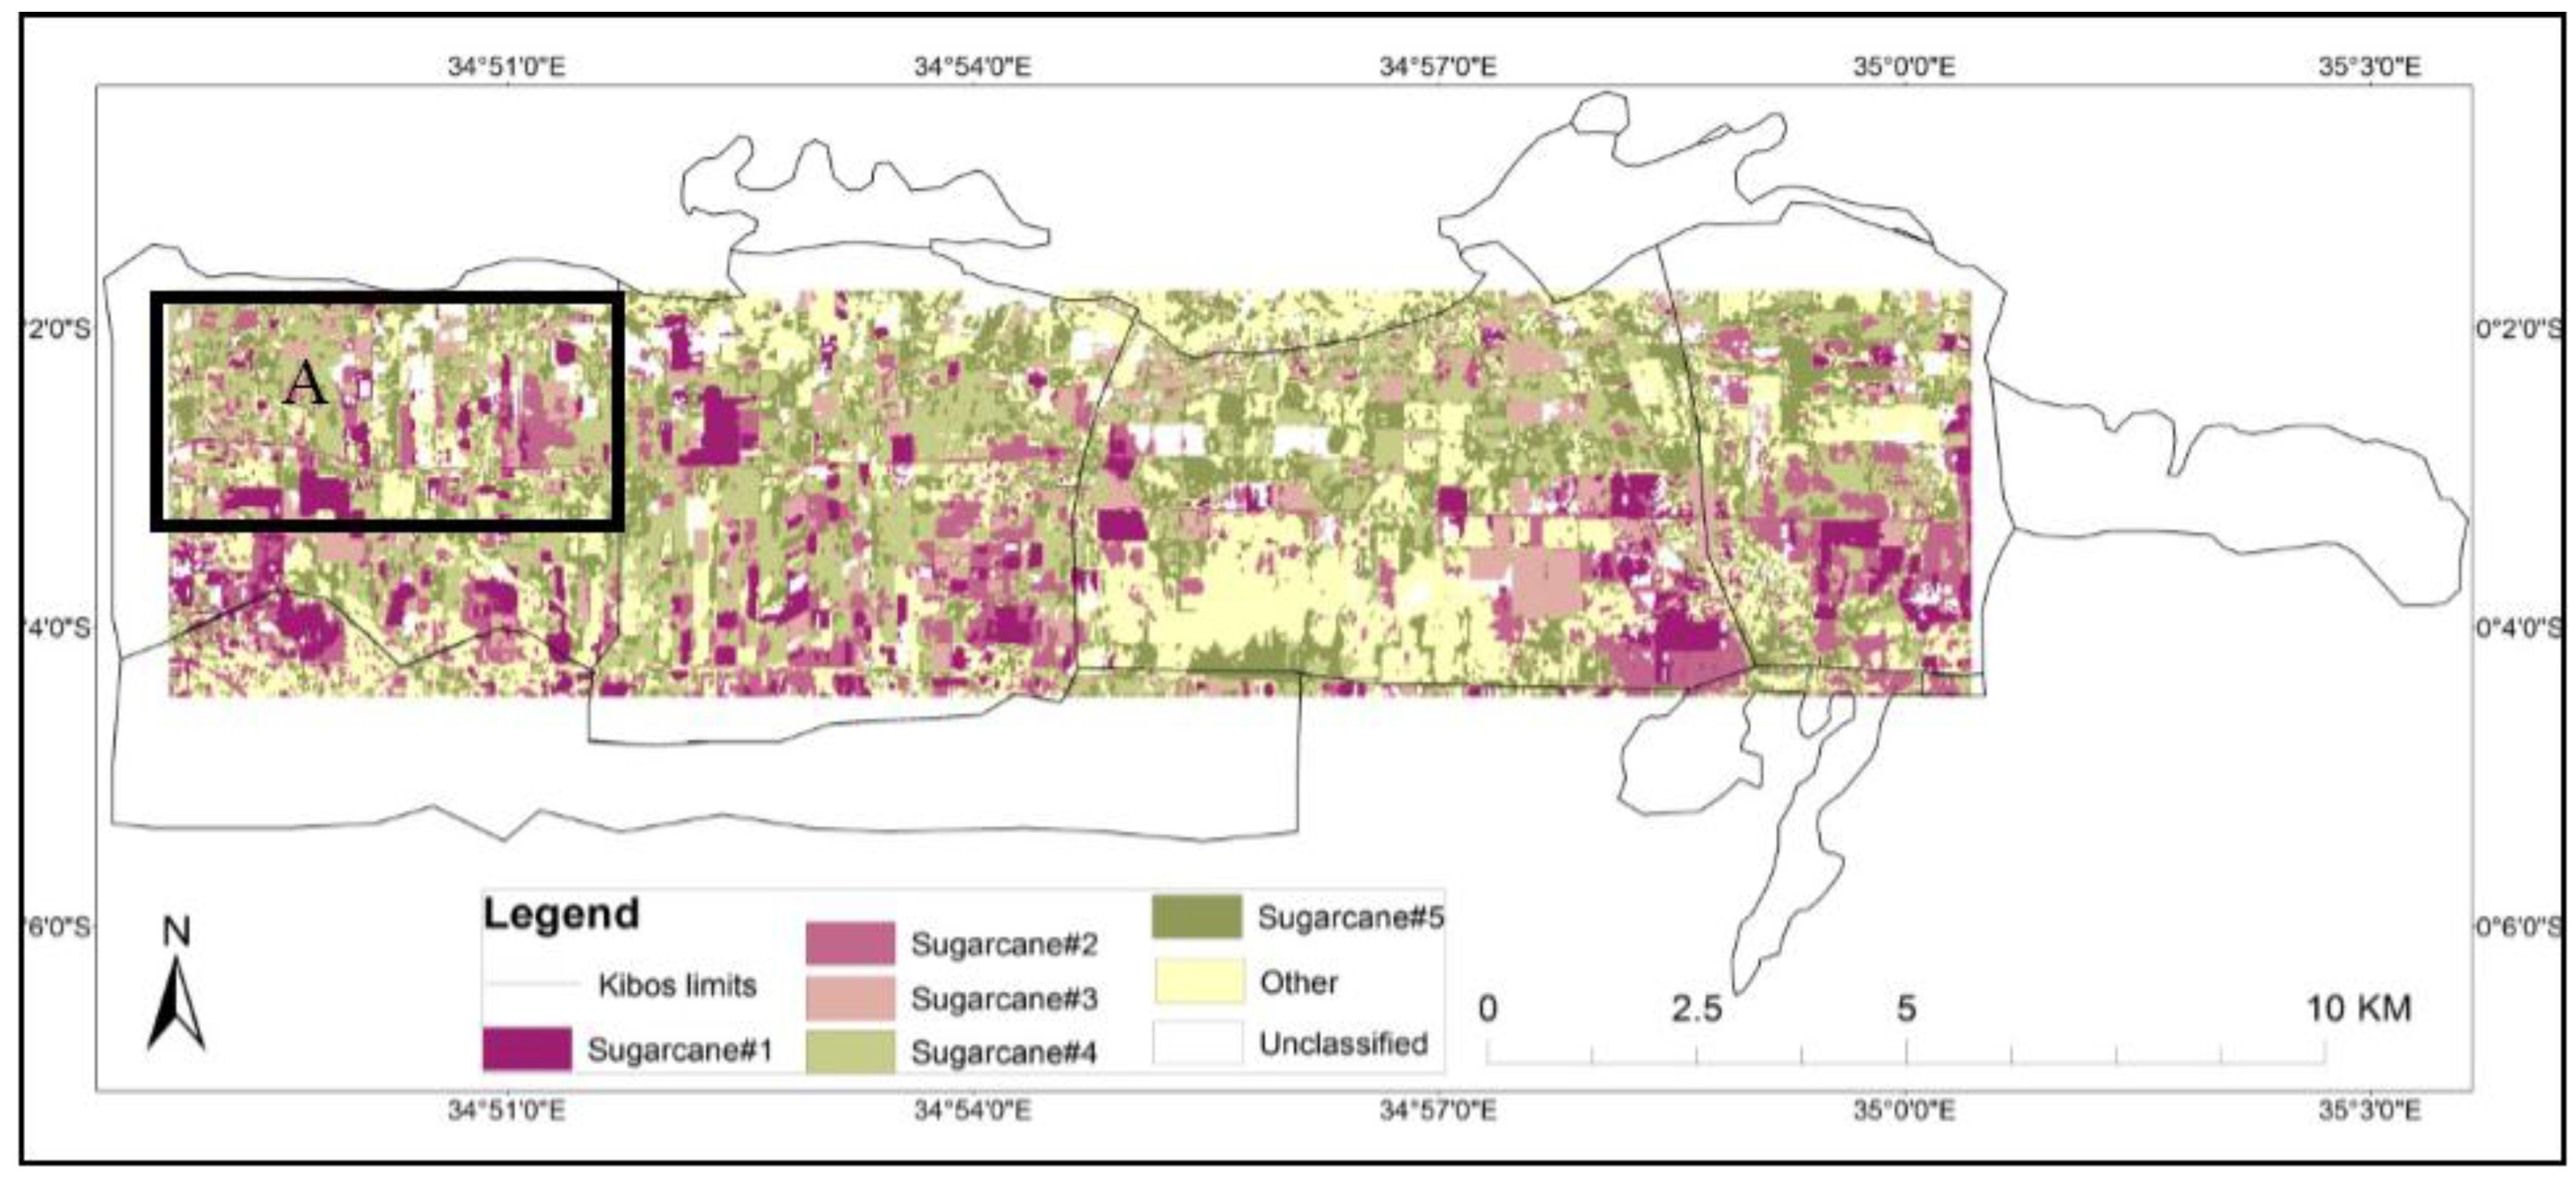
3.1. Spatial Variability
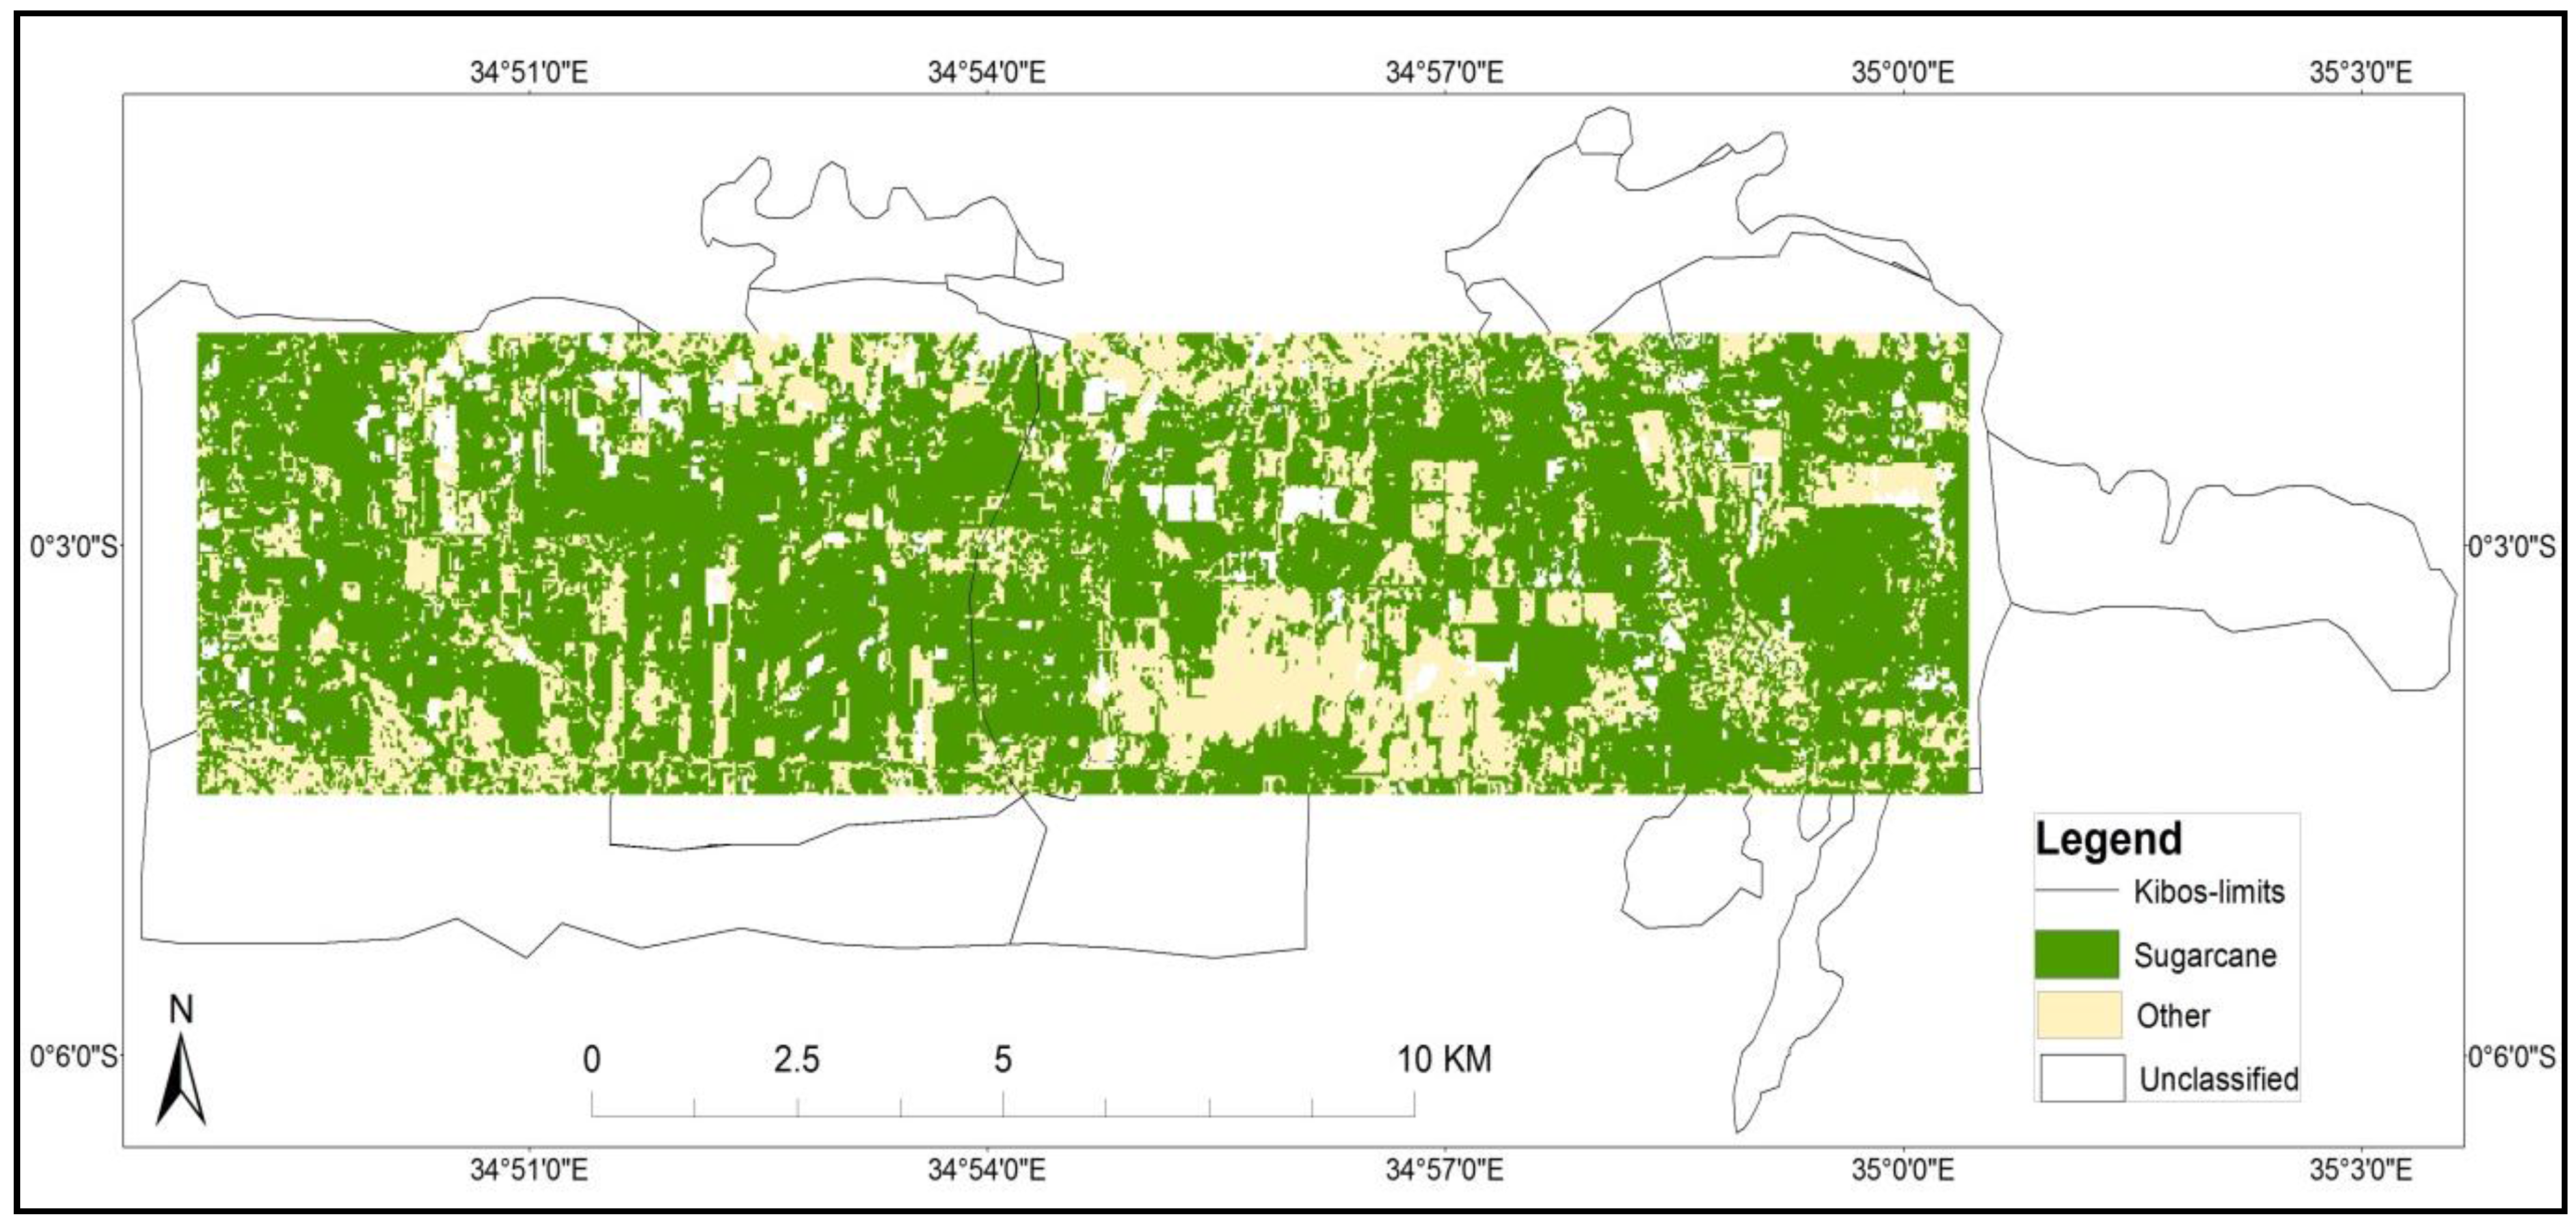
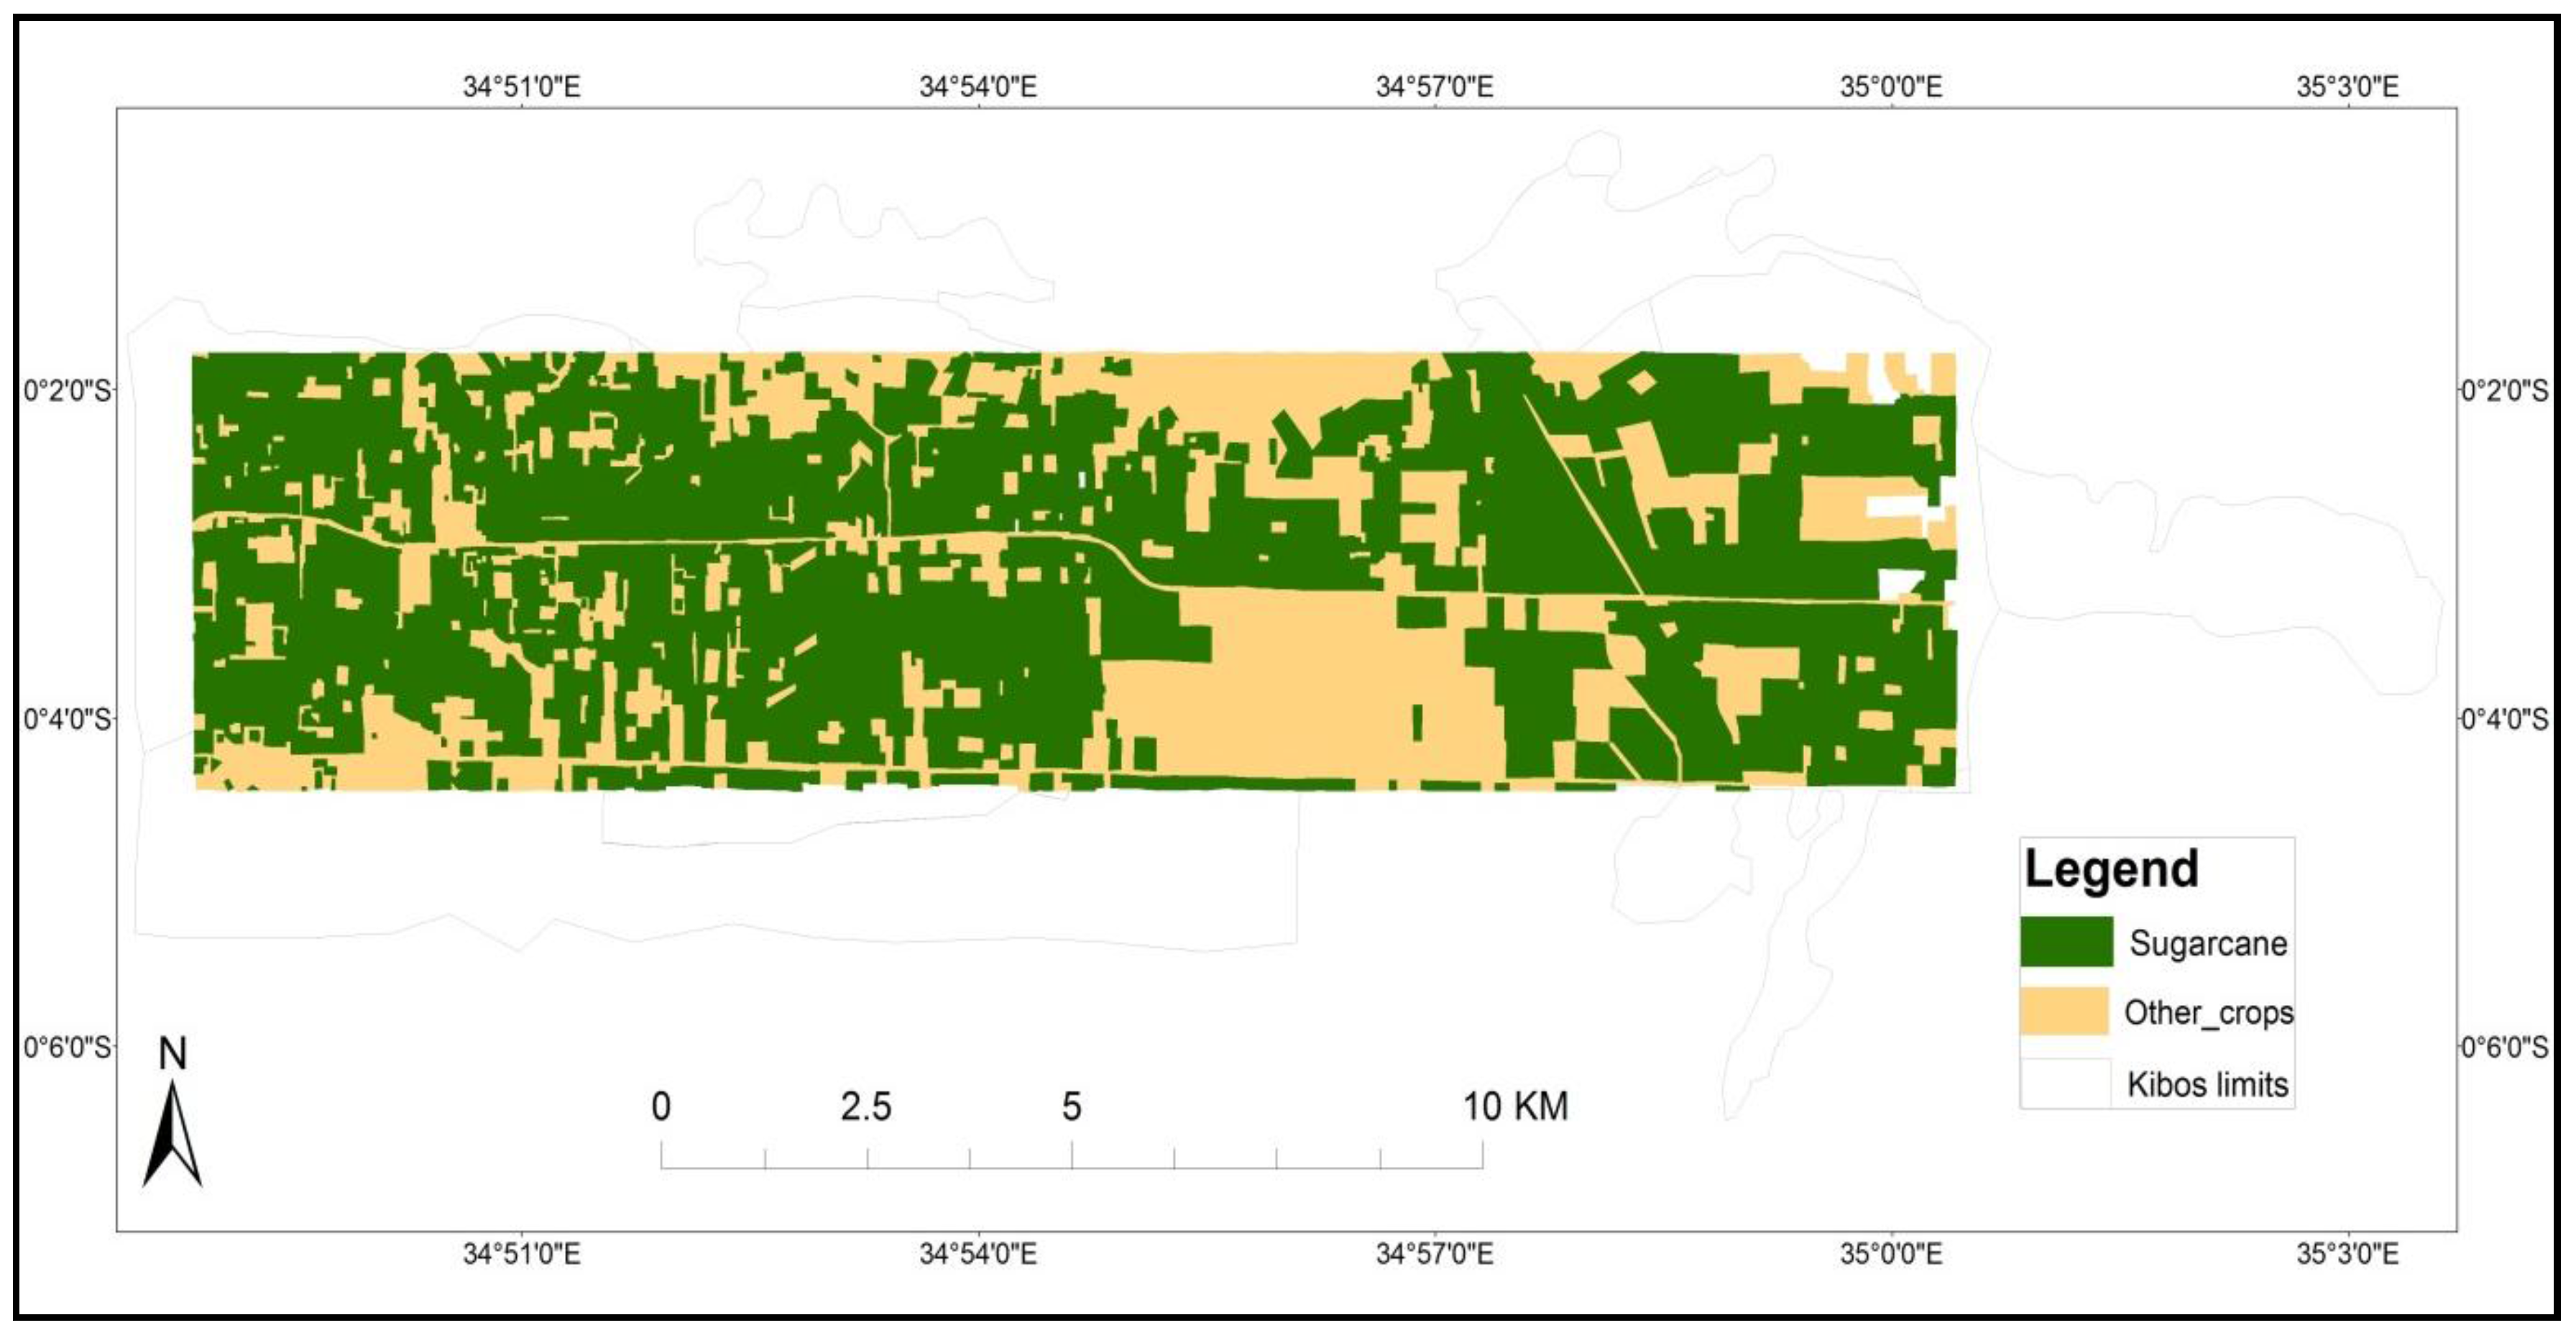
3.2. Sugarcane Classification
| -- | Classification | ||||||
|---|---|---|---|---|---|---|---|
| Sugarcane | Other | Unclassified | Line Total | Producer’s Accuracy | Omission Error | ||
| Ground Truth | Sugarcane | 160 | 22 | 18 | 200 | 80.0% | 20.0% |
| Other | 7 | 108 | 5 | 120 | 90.0% | 10.0% | |
| Row total | 167 | 130 | 23 | 320 | -- | -- | |
| User’s accuracy | 95.8% | 83.1% | -- | -- | 83.8% | -- | |
| Commission error | 4.2% | 16.9% | -- | -- | -- | -- | |

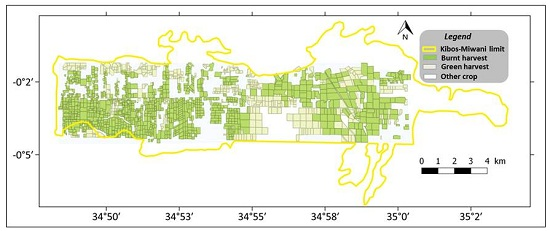
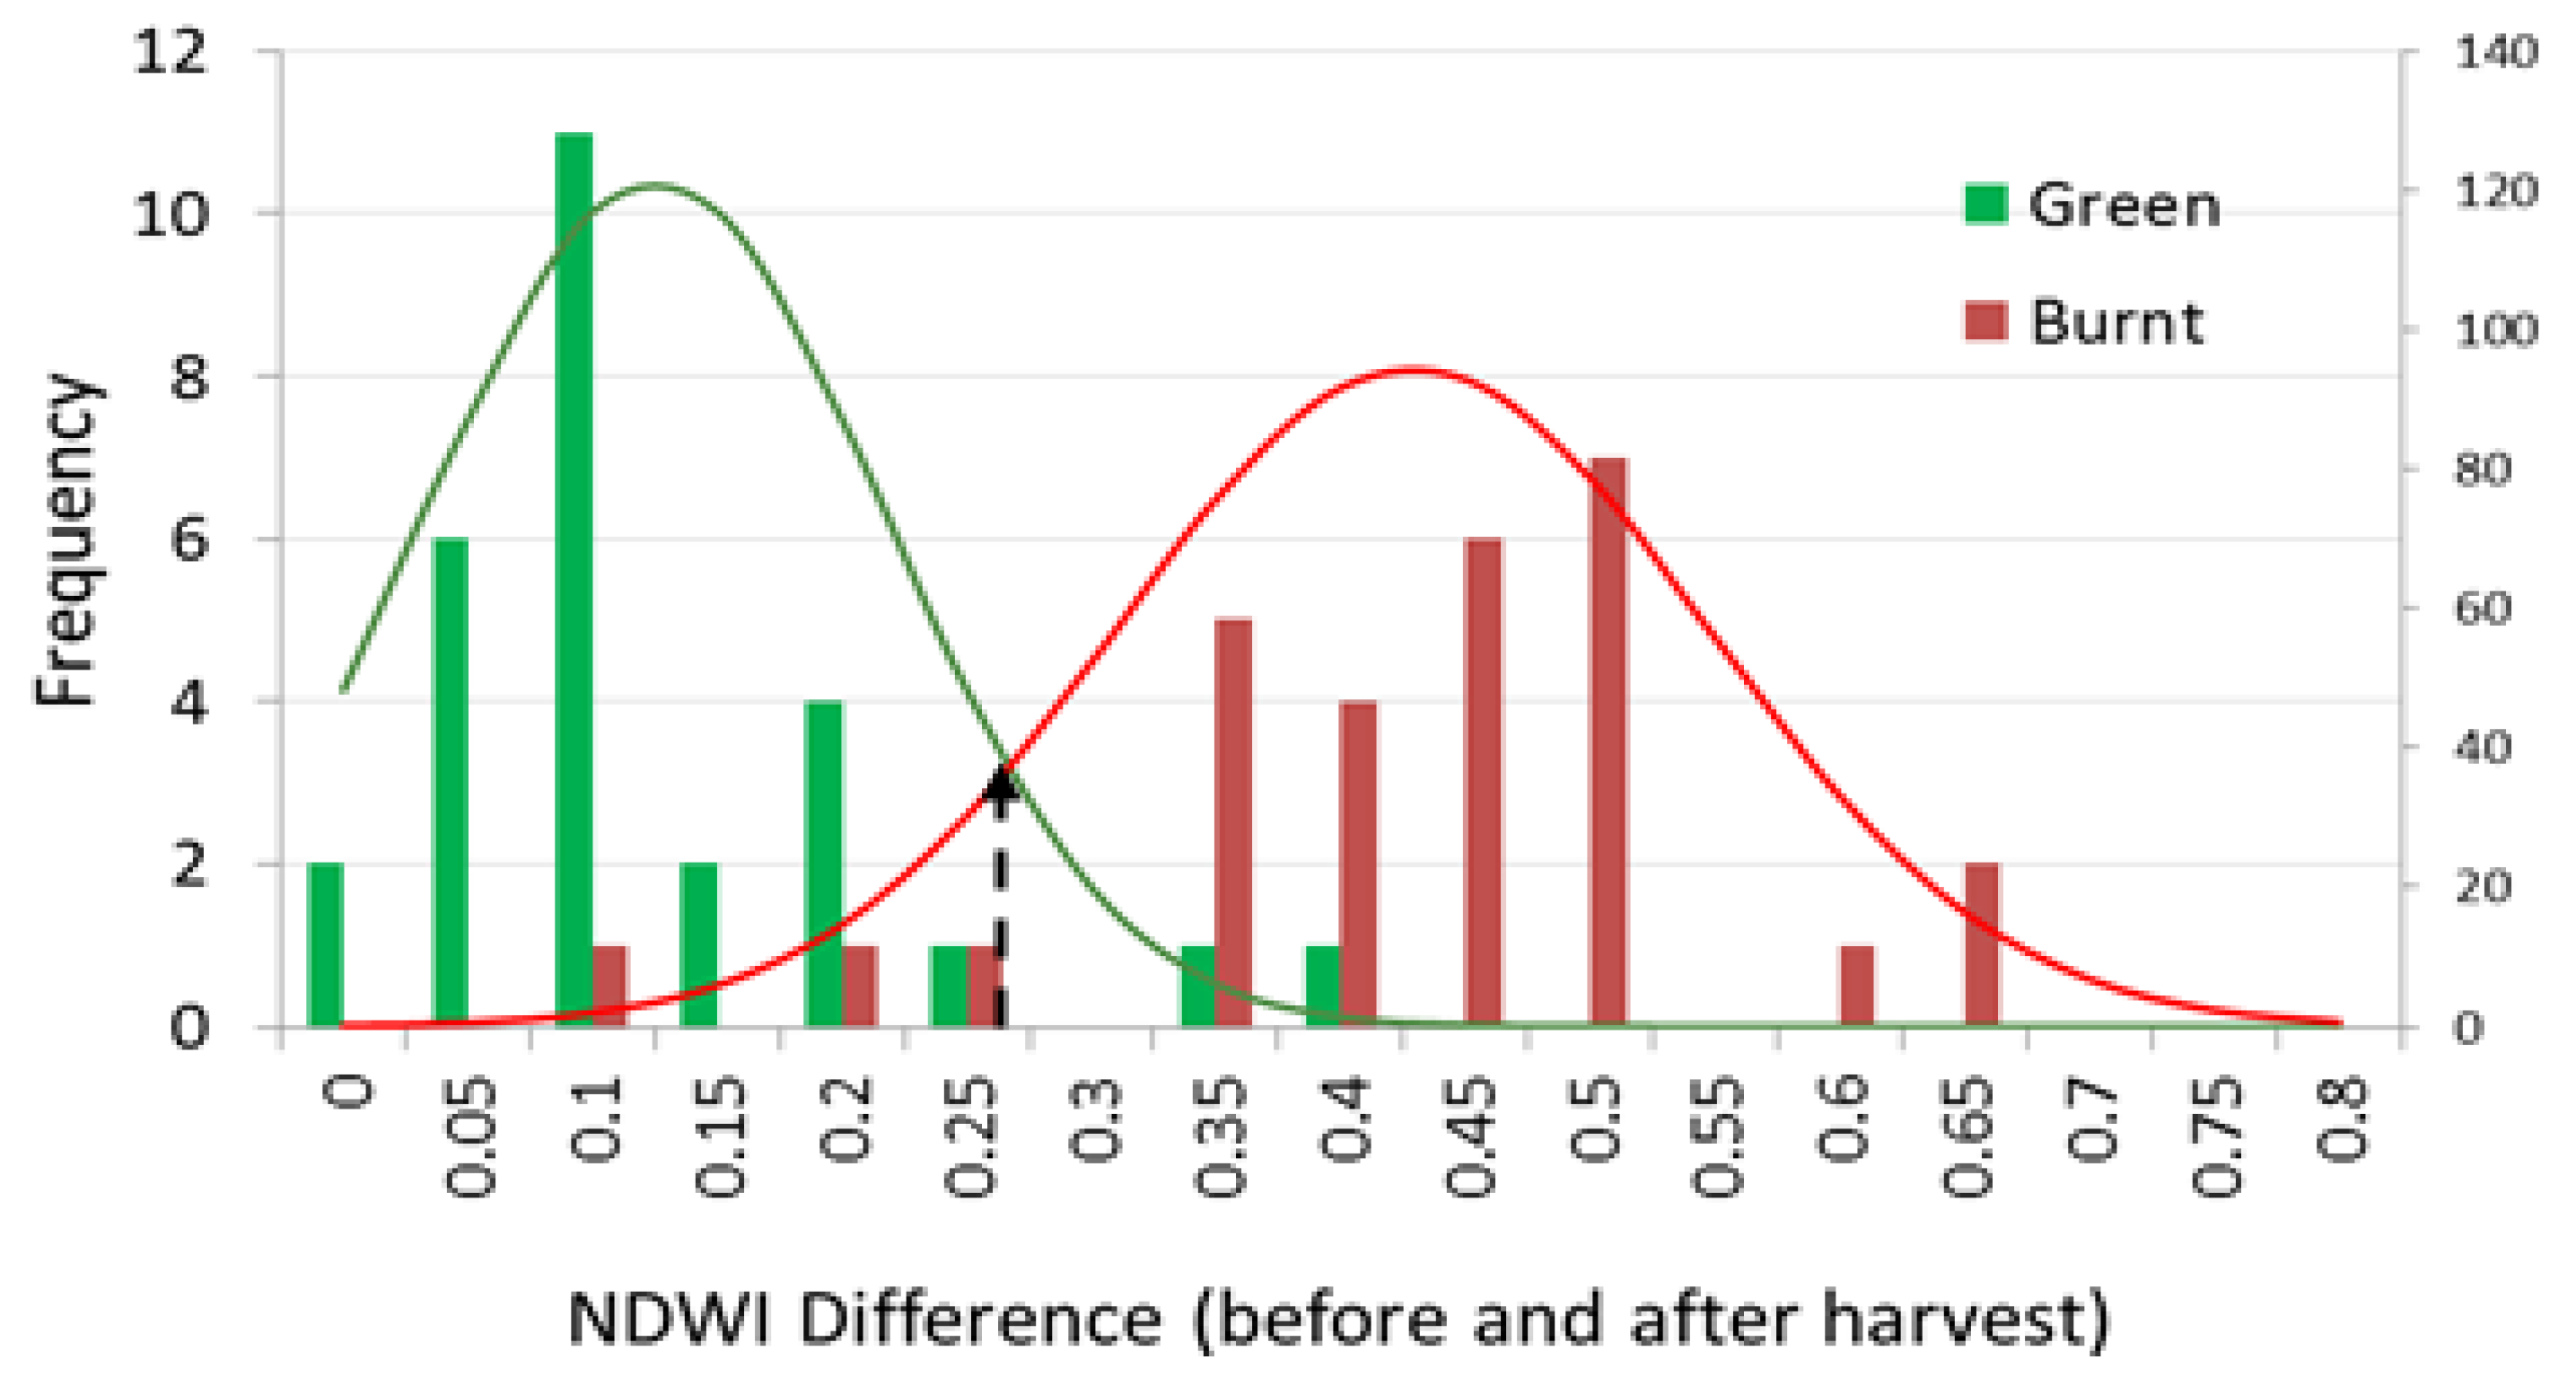
3.3. Sugarcane Harvest Mode Classification
| -- | NDWI_Diff | NDVI_Diff |
|---|---|---|
| Mean Green harvest | 0.10 | 0.26 |
| Std Green harvest | 0.06 | 0.08 |
| Mean Burnt harvest | 0.41 | 0.24 |
| Std Burnt harvest | 0.12 | 0.07 |
| p-value (difference Green/Burnt harvest) | 0.000 | 0.345 |
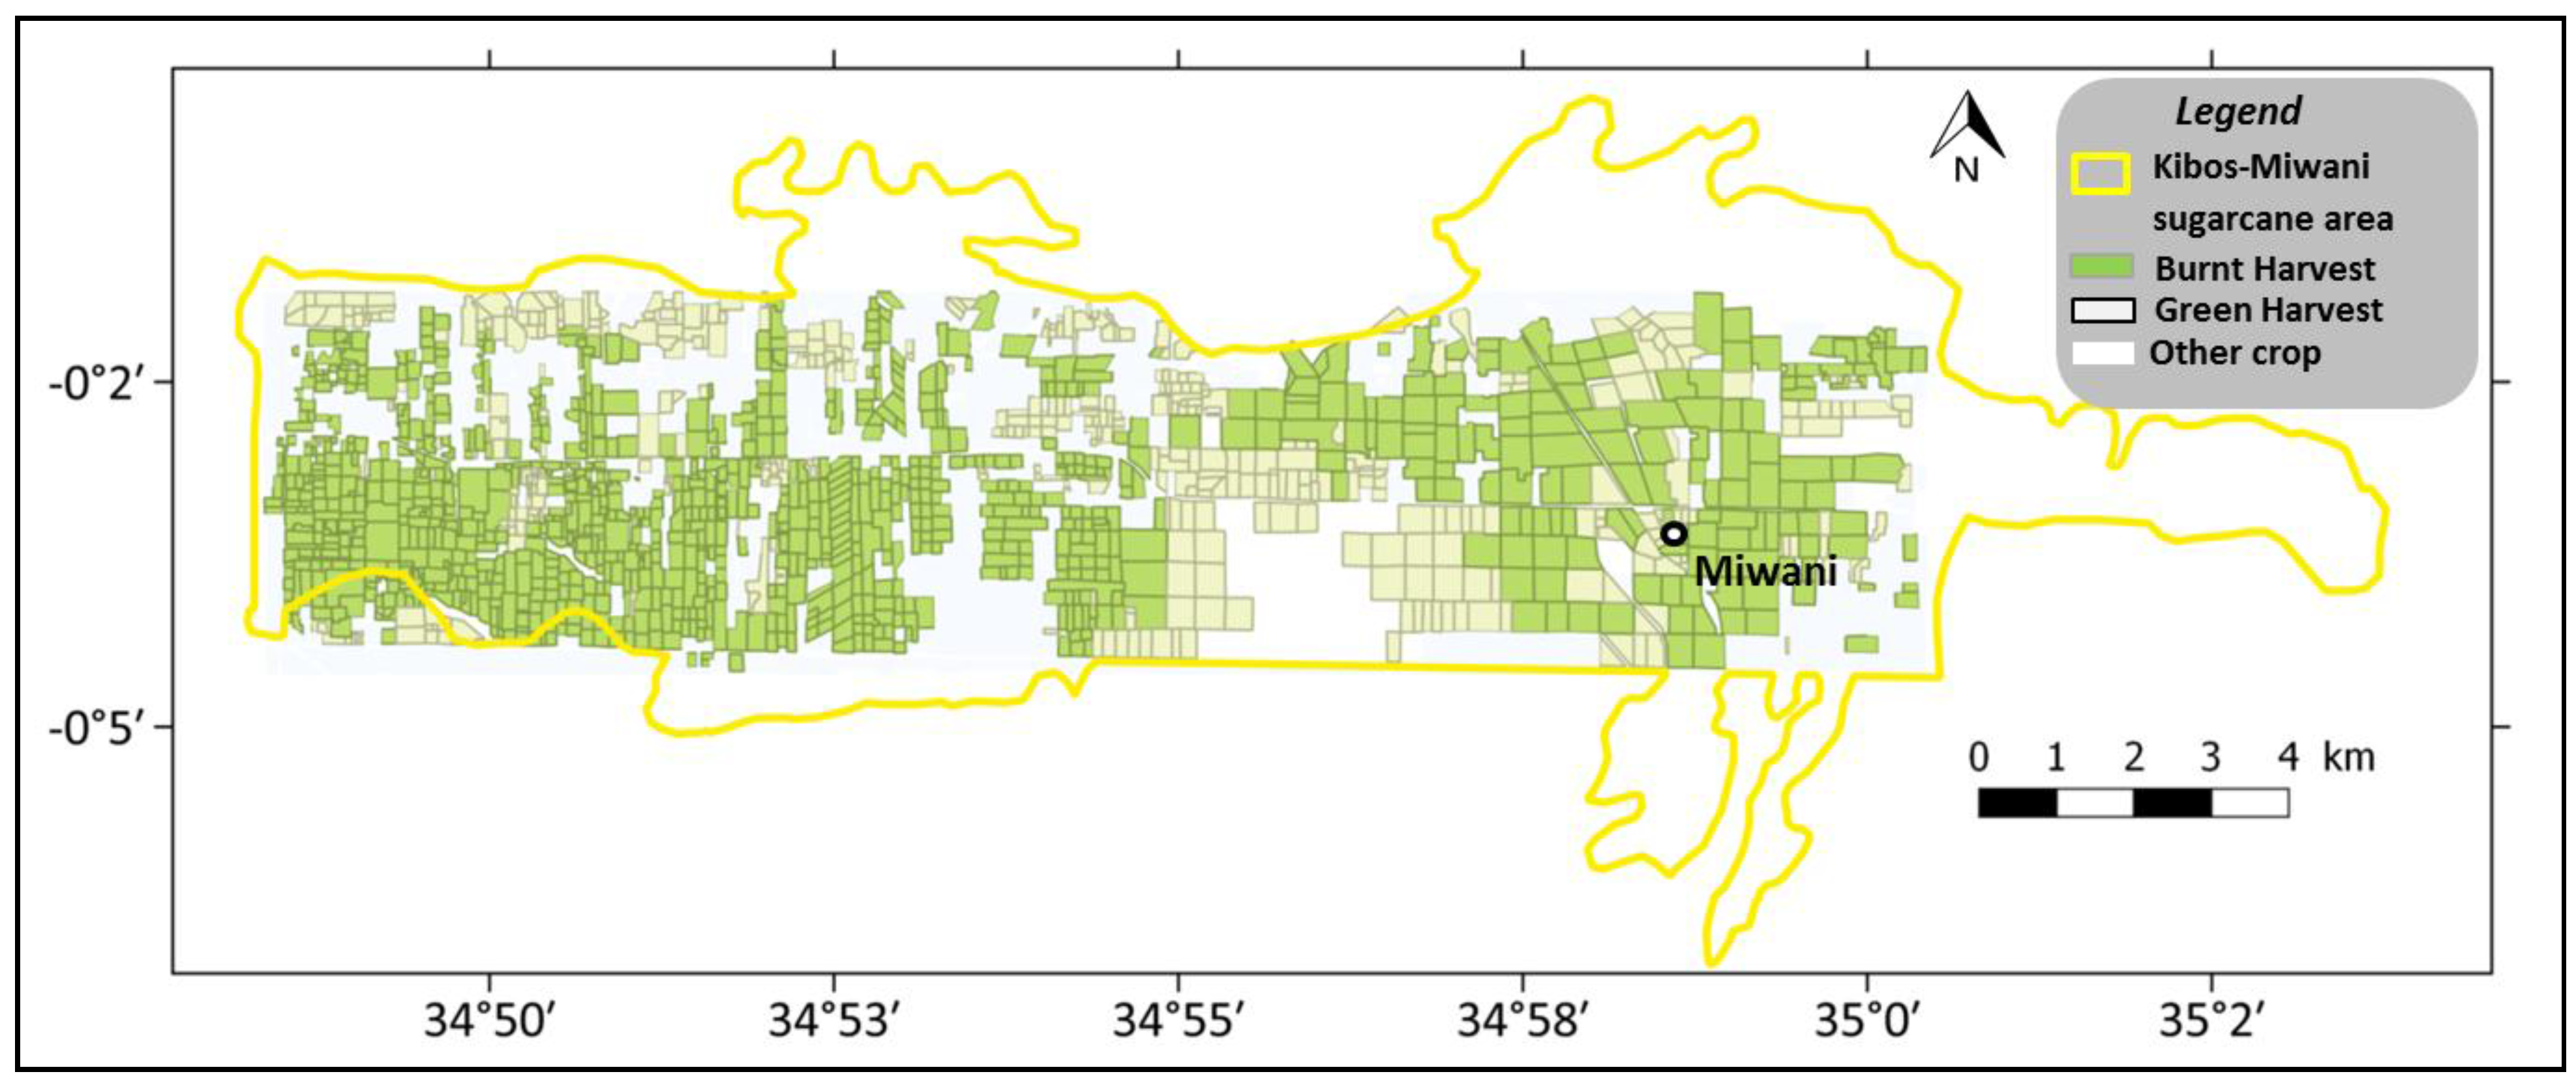
| Harvest Mode | Total (ha) | % Coverage |
|---|---|---|
| Green | 2284 | 25.5 |
| Burnt | 6672 | 74.5 |
| -- | Classification | |||||
|---|---|---|---|---|---|---|
| Green Harvest | Burnt Harvest | Line Total | Producer’s Accuracy | Omission Error | ||
| Ground Truth | Green Harvest | 90 | 8 | 98 | 91.8% | 8.2% |
| Burnt Harvest | 12 | 90 | 102 | 88.2% | 11.8% | |
| Row total | 102 | 98 | 200 | -- | -- | |
| User’s Accuracy | 88.2% | 91.8% | -- | 90.0% | -- | |
| Commission error | 11.8% | 8.2% | -- | -- | -- | |
4. Conclusions and Perspectives
Acknowledgments
Author Contributions
Conflicts of Interest
References
- Araujo-Barbosa, C.C.; Atkinson, P.M.; Dearing, J.A. Remote sensing of ecosystem services: A systematic review. Ecol. Indic. 2015, 52, 430–443. [Google Scholar] [CrossRef]
- Robertson, G.P.; Eldor, P.; Harwood, R. Greenhouse gases in intensive agriculture: Contributions of individual gases to the radiative forcing of the atmosphere. Science 2000, 289, 922–925. [Google Scholar] [CrossRef]
- South, S.; Qi, J.; Lusch, D.P. Optimal classification methods for mapping agricultural tillage practices. Remote Sens. Environ. 2004, 91, 90–97. [Google Scholar] [CrossRef]
- Razafimbelo, T.; Barthès, B.; Larré-Larrouy, M.C.; de-Luca, E.; Laurent, J.Y.; Cerri, C.C.; Feller, C. Effect of sugarcane residue management (mulching versus burning) on organic matter in a clayey Oxisol from southern Brazil. Agric. Ecosyst. Environ. 2006, 115, 285–289. [Google Scholar] [CrossRef]
- De-Figueiredo, E.B.; la-Scala, J.N. Greenhouse gas balance due to the conversion of sugarcane areas from burned to green harvest in Brazil. Agric. Ecosyst. Environ. 2001, 141, 77–85. [Google Scholar] [CrossRef]
- Panosso, A.R.; Marques, J.J.; Milori, D.M.B.P.; Ferraudo, A.S.; Barbieri, D.M.; Pereira, G.T.; La-Scala, J.N. Soil CO2 emission and its relation to soil properties in sugarcane areas under slash-and-burn and green harvest. Soil Tillage Res. 2011, 111, 190–196. [Google Scholar] [CrossRef]
- Jamoza, J.E.; Amolo, R.A.; Muturi, S.M. A Baseline Survey on the Status of Sugarcane Production Technologies in Western Kenya; International Society of Sugar Cane Technologists: Sao Paulo, Brazil, 2013. [Google Scholar]
- KSB. Year Book of Statistics; Kenya Sugar Board: Nairobi, Kenya, 2012. [Google Scholar]
- Mulianga, B.; Bégué, A.; Simoes, M.; Todoroff, P. Forecasting regional sugarcane yield based on time integral and spatial aggregation of MODIS NDVI. Remote Sens. 2013, 5, 2184–2199. [Google Scholar] [CrossRef] [Green Version]
- Blaschke, M.T. Object based image analysis for remote sensing. ISPRS J. Photogram. Remote Sens. 2010, 65, 2–16. [Google Scholar] [CrossRef]
- Pettorelli, N.; Vik, J.O.; Mysterud, A.; Gaillard, J.M.; Tucker, C.J.; Stenseth, N.C. Using the satellite-derived NDVI to assess ecological responses to environmental change. Trends Ecol. Evol. 2005, 20, 503–510. [Google Scholar] [CrossRef] [PubMed]
- Longley, P.A.; Goodchild, M.F.; Maguire, D.J.; Rhind, D.W. Geographical Information Systems: Principles, Techniques, Management, and Applications; John Wiley & Sons, Inc.: Hoboken, NJ, USA, 2005. [Google Scholar]
- Begue, A.; Lebourgeois, V.; Bappel, E.; Todoroff, P.; Pellegrino, A.; Baillarin, F.; Siegmund, B. Spatio-temporal variability of sugarcane fields and recommendations for yield forecast using NDVI. Int. J. Remote Sens. 2010, 31, 5391–5407. [Google Scholar] [CrossRef] [Green Version]
- Rudorff, B.F.T.; Aguiar, D.A.; Silva, W.F.; Sugawara, L.M.; Adami, M.; Moreira, M.A. Studies on the rapid expansion of sugarcane for ethanol production in São Paulo State (Brazil) using Landsat data. Remote Sens. 2010, 2, 1057–1076. [Google Scholar] [CrossRef]
- El-Hajj, M.; Bégué, A.; Guillaume, S.; Martiné, J.-F. Integrating SPOT-5 time series, crop growth modeling and expert knowledge for monitoring agricultural practices: The case of sugarcane harvest on Reunion Island. Remote Sens. Environ. 2009, 113, 2052–2061. [Google Scholar] [CrossRef]
- Vieira, M.A.; Formaggio, A.R.; Rennó, C.D.; Atzberger, C.; Aguiar, D.A.; Mello, M.P. Object based image analysis and data mining applied to a remotely sensed Landsat time-series to map sugarcane over large areas. Remote Sens.Environ. 2012, 123, 553–562. [Google Scholar] [CrossRef]
- Thenkabail, P.S.; Wu, Z. An Automated Cropland Classification Algorithm (ACCA) for Tajikistan by combining Landsat, MODIS, and secondary data. Remote Sens. 2012, 4, 2890–2918. [Google Scholar] [CrossRef]
- Mulianga, B.; Bégué, A.; Simoes, M.; Todoroff, P.; Clouvel, P. MODIS data for forecasting sugarcane yield in Kenya through a zonal approach. In Proceedings of the Sentinel-2 Preparatory Symposium, Frascati, Italy, 23–27 April 2012.
- Amolo, R.; Abayo, G.; Muturi, S.; Rono, J. The Impact of Planting and Harvesting Time on Sugarcane Productivity in Kenyan Sugar Industry; KESREF: Kisumu, Kenya, 2009; pp. 18–27. [Google Scholar]
- Mulianga, B. Assessing spatial heterogeneity and temporal dynamics of sugarcane landscape in western Kenya by remote sensing: Implications for environmental services. Availavble online: http://agritrop.cirad.fr/574730/ (accessed on 1 October 2015).
- KSB. Year Book of Statistics; Kenya Sugar Board: Nairobi, Kenya, 2010. [Google Scholar]
- Monroy, L.; Mulinge, W.; Witwer, M. Analysis of Incentives and Disincentives for Sugar in Kenya; Technical Notes Series, MAFAP; FAO: Rome, Italy, 2012. [Google Scholar]
- Aguiar, D.A.; Friedrich, B.; Rudorff, T.; Silva, W.F.; Adami, M.; Mello, M.P. Remote sensing images in support of environmental protocol: Monitoring the sugarcane harvest in Sao Paulo State, Brazil. Remote Sens. 2011, 3, 2682–2703. [Google Scholar] [CrossRef]
- Lebourgeois, V.; Begue, A.; Degenne, P.; Bappel, E. Improving harvest and planting monitoring for smallholders with geospatial technology: The Reunion Island experience. Int. Sugar J. 2010, 1298, 109–119. [Google Scholar]
- Shisanya, C.; Recha, C.; Anyamba, A. Rainfall variability and its impact on normalized difference vegetation index in arid and semi-arid lands of Kenya. Int. J. Geosci. 2012, 2, 36–47. [Google Scholar] [CrossRef]
- Cochran, W.G. Sampling Techniques, 3rd ed.; John Wiley and Sons: New York, NY, USA, 1977. [Google Scholar]
- Rouse, J.W. Monitoring the Vernal Advancement of Retrogradation of Natural Vegetation; Type III, Final Report; NASA/GSFC: Greenbelt, MD, USA, 1974. [Google Scholar]
- Gao, B. NDWI, a normalized difference water index for remote sensing of vegetation liquid water from space. Remote Sens. Environ. 1996, 58, 257–266. [Google Scholar] [CrossRef]
- Gu, Y.; Hunt, E.; Wardlow, B.; Basara, J.B.; Brown, J.F.; Verdin, J.P. Evaluation of MODIS NDVI and NDWI for vegetation drought monitoring using Oklahoma Mesonet soil moisture data. Geophys. Res. Lett. 2008, 35. [Google Scholar] [CrossRef]
- Wardlow, B.D.; Egbert, S.L. Large area crop mapping using time-series MODIS 250 m NDVI data: An assessment for the US Central Great Plains. Remote Sens. Environ. 2008, 112, 1096–1116. [Google Scholar] [CrossRef]
- Congalton, R.G.; Green, K. Assessing the Accuracy of Remotely Sensed Data: Principles and Practices; CRC Press: Boca Raton, FL, USA, 1991. [Google Scholar]
- Vintrou, E.; Desbrosse, A.; Bégué, A.; Traoré, S.; Baron, C.; Lo-Seen, D. Crop area mapping in West Africa using landscape stratification of MODIS time series and comparison with existing global land products. Int. J. Appl. Earth Obs. Geoinf. 2012, 14, 83–93. [Google Scholar] [CrossRef]
- Zarco-Tejada, P.J.; Ustin, S.L.; Whiting, M.L. Temporal and spatial relationships between within-field yield variability in cotton and high-spatial hyperspectral remote sensing imagery. Agronomy J. 2005, 97, 641–653. [Google Scholar] [CrossRef]
- Sader, S.A.; Bertrand, M.; Wilson, E.H. Satellite change detection of forest harvest patterns on an industrial forest landscape. For. Sci. 2003, 49, 341–353. [Google Scholar]
- Chen, D.; Huang, J.; Jackson, T.J. Vegetation water content estimation for corn and soybeans using spectral indices derived from MODIS near- and short-wave infrared bands. Remote Sens. Environ. 2005, 98, 225–236. [Google Scholar] [CrossRef]
- Todd, W.J.; Gehring, D.G.; Haman, J.F. Landsat wildland mapping accuracy. Photogram. Eng. Remote Sens. 1980, 46, 509–520. [Google Scholar]
© 2015 by the authors; licensee MDPI, Basel, Switzerland. This article is an open access article distributed under the terms and conditions of the Creative Commons Attribution license (http://creativecommons.org/licenses/by/4.0/).
Share and Cite
Mulianga, B.; Bégué, A.; Clouvel, P.; Todoroff, P. Mapping Cropping Practices of a Sugarcane-Based Cropping System in Kenya Using Remote Sensing. Remote Sens. 2015, 7, 14428-14444. https://doi.org/10.3390/rs71114428
Mulianga B, Bégué A, Clouvel P, Todoroff P. Mapping Cropping Practices of a Sugarcane-Based Cropping System in Kenya Using Remote Sensing. Remote Sensing. 2015; 7(11):14428-14444. https://doi.org/10.3390/rs71114428
Chicago/Turabian StyleMulianga, Betty, Agnès Bégué, Pascal Clouvel, and Pierre Todoroff. 2015. "Mapping Cropping Practices of a Sugarcane-Based Cropping System in Kenya Using Remote Sensing" Remote Sensing 7, no. 11: 14428-14444. https://doi.org/10.3390/rs71114428
APA StyleMulianga, B., Bégué, A., Clouvel, P., & Todoroff, P. (2015). Mapping Cropping Practices of a Sugarcane-Based Cropping System in Kenya Using Remote Sensing. Remote Sensing, 7(11), 14428-14444. https://doi.org/10.3390/rs71114428