Article

The Impact of Sunlight Conditions on the Consistency of Vegetation Indices in Croplands—Effective Usage of Vegetation Indices from Continuous Ground-Based Spectral Measurements

1
National Institute for Agro-Environmental Sciences, 3-1-3 Kannondai, Tsukuba, Ibaraki 305-8604, Japan
2
Graduate School of Agriculture, Hokkaido University, Kita 9, Nishi 9, Kita-ku, Sapporo, Hokkaido 060-8589, Japan
3
Civil Engineering Research Institute for Cold Region, National Research and Development Agency Public Works Research Institute, 3-1-43 Hiragishi Ichijo, Toyohira-ku, Sapporo, Hokkaido 062-8602, Japan
4
National Agriculture and Food Research Organization Institute of Livestock and Grassland Science, 768 Senbonmatsu, Nasushiobara, Tochigi 329-2793, Japan
*
Author to whom correspondence should be addressed.
Remote Sens. 2015, 7(10), 14079-14098; https://doi.org/10.3390/rs71014079
Submission received: 18 August 2015 / Revised: 5 October 2015 / Accepted: 20 October 2015 / Published: 26 October 2015
(This article belongs to the Special Issue Recent Advances in Remote Sensing for Crop Growth Monitoring)

Abstract

:
A ground-based network of spectral observations is useful for ecosystem monitoring and validation of satellite data. However, these observations contain inherent uncertainties due to the change of sunlight conditions. This study investigated the impact of changing solar zenith angles and diffuse/direct light conditions on the consistency of vegetation indices (normalized difference vegetation index (NDVI) and green-red vegetation index (GRVI)) derived from ground-based spectral measurements in three different types of cropland (paddy field, upland field, cultivated grassland) in Japan. In general, the vegetation indices decreased with decreasing solar zenith angle. This response was affected significantly by the growth stage and diffuse/direct light conditions. The decreasing response of the NDVI to the decreasing solar zenith angle was high during the middle growth stage (0.4 < NDVI < 0.8). On the other hand, a similar response of the GRVI was evident except in the early growth stage (GRVI < 0). The response of vegetation indices to the solar zenith angle was evident under clear sky conditions but almost negligible under cloudy sky conditions. At large solar zenith angles, neither the NDVI nor the GRVI were affected by diffuse/direct light conditions in any growth stage. These experimental results were supported well by the results of simulations based on a physically-based canopy reflectance model (PROSAIL). Systematic selection of the data from continuous diurnal spectral measurements in consideration of the solar light conditions would be effective for accurate and consistent assessment of the canopy structure and functioning.

Graphical Abstract

1. Introduction

Timely and large-scale observations of agroecosystems by remote sensing are crucial for food and environment security [1,2,3,4]. In many agroecosystem applications, high spatial and temporal resolutions are required at the same time. In particular, in many Asian countries, high spatial resolution is critical because agricultural fields are small and land use is mosaic. For example, high-spatial-resolution optical satellites are used for mapping of the protein content and the full ripe stage of rice in a large number of individual fields [5,6]. However, despite the constellation of satellites, the probability of image acquisition at specific target periods is still unsatisfactory for timely mapping. Low-spatial-resolution optical satellite sensors, such as the Terra and Aqua Moderate Resolution Imaging Spectroradiometer (MODIS), SPOT-VEGETATION (SPOT-VGT), and NOAA Advanced Very High Resolution Radiometer (AVHRR), can make global and regional observations with high temporal frequency, but their spatial resolutions range from 250 m to 1000 m. On the other hand, high-spatial-resolution optical satellite sensors, such as SPOT, RapidEye, and WorldView can observe the land surface with spatial resolutions of 2–15 m, but their temporal frequency is low. Additionally, medium-spatial-resolution optical satellite sensors, such as HJ-1A/B, with spatial resolutions of 30 m can observe the same position at temporal intervals of four days, but their spatial resolution is insufficient for monitoring agricultural fields in many Asian countries [7].
Under these circumstances, a ground-based network of spectral measurements would be important in ecosystem monitoring as an addition to synthetic aperture radar (SAR) satellites and drone-based remote sensing to compensate for the limitations of optical satellite sensors. SAR sensors have good potential for crop monitoring because they are not affected by sky conditions [8,9,10]. Drone-based remote sensors can play unique roles due to their timely and flexible operation and super-high spatial resolution (~10 cm) [11,12]. A ground-based network of spectral observations has proved to be useful for ecosystem monitoring and validation of optical satellite data (EUROSPEC [13], Spectral Network (SpecNet) [14], and Phenological Eyes Network (PEN) [15]). Ground-based sensors automatically acquire spectral reflectance, in addition to CO2 flux, micrometeorological data, and digital images, at high temporal resolution (~30 min) [15,16]. Such datasets can be used to investigate the dynamic change of ecosystems in detail by making the most of the high temporal resolution and continuous measurements. For assessment of phenological changes, such as timing of leaf green-up and autumn coloring or crop status in agroecosystems, such as protein content and water stress, spectral reflectance or vegetation indices from optical satellite data can be validated directly using ground-based spectral measurements. For example, Motohka et al. [17] reported that phenological features observed in MODIS data were validated using ground-based spectral reflectance observations in a paddy field. Sakamoto et al. [18] proposed a monitoring method for crop status based on ground-based digital camera images.
However, these ground-based spectral reflectance observations do not ensure consistency due to the differences in the canopy structure, viewing geometry, and illumination. These changes can be expressed by a bidirectional reflectance distribution function (BRDF) [19], but determination of surface parameters for the BRDF is not easy. The canopy structure can change drastically according to the growth stage and vegetation type. The view zenith angle of ground-based sensors is usually fixed at 0° (nadir observation), but the solar zenith angle changes with the time of day and day of the year. Additionally, the diffuse/direct light ratio changes with the daily weather conditions. While the ground-based spectral reflectances are used for calibration or validation of satellite data [20,21], the changes caused by diurnal and seasonal variation of canopy structures and light conditions are often ignored. Cogliati et al. [22] reported that the normalized difference vegetation index (NDVI) from continuous ground-based measurement showed some diurnal change as affected by the photosynthetic photon flux density (PPFD). Rahman et al. [23] reported that NDVI from ground-based observations was affected by the solar zenith angle in a pasture site. However, this relation was examined using a dataset for a full-cover pasture canopy only on two days under clear sky conditions during the vegetative stage. Thus, a generalized relation throughout the growth season under various light conditions and/or in different types of vegetation is necessary.
The objectives of this study are (1) to examine the diurnal and seasonal fluctuations of vegetation indices derived from ground-based spectral measurements for three different types of cropland (paddy field, upland field, cultivated grassland); (2) to investigate the impact of changing solar zenith angles and diffuse/direct light conditions on the consistency of vegetation indices; and (3) to propose efficient usage of ground-based spectral data. In this study, we used the NDVI and green-red vegetation index (GRVI) as vegetation indices because these indices are widely used in remote sensing studies [20,24]. The NDVI has been used to estimate variations in vegetation conditions [25,26]. The GRVI is a new vegetation index and has been used to detect subtle vegetation changes (e.g., leaf fall due to a typhoon or mowing of plants) or differences among ecosystem types [20,27].

2. Materials and Methods

2.1. Study Sites

The datasets were acquired in three types of cropland at different locations in Japan: a paddy field in Mase, Tsukuba (36°03'14.3"N/140°01'36.9"E: rice, MSE), an upland field in Shinhidaka (42°24'41.4"N/142°28'16.6"E: maize, SHD), and a cultivated grassland in Nasushiobara (36°54'54.3"N/139°56'12.8"E: grass, NSS). The details of each site are shown in Table 1. All three sites belong to AsiaFlux (http://asiaflux.net/), where fluxes of CO2, sensible heat, and latent heat, in addition to basic micrometeorological and physiological data have been collected since 1999 at the rice site, 2007 at the maize site, and 2004 at the grass site [28,29,30].
Table 1. Details of the study sites.
RiceMaizeGrass
Site codeMSESHDNSS
Position36°03'14.3"N,
140°01'36.9"E
42°24'41.4"N,
142°28'16.6"E
36°54'54.3"N,
139°56'12.8"E
Elevation (m asl)11120–130305
Mean annual air temperature (°C)13.78.012.2
Mean annual precipitation (mm)120012901561
Vegetation typePaddy fieldUpland fieldCultivated grassland
Dominant speciesRice (Oryza sativa L.; cultivar Koshihikari)Maize (Zea mays L.)Orchardgrass (Dactylis glomerata L.), Italian lyegrass (Lolium multiflorum Lam.)
Canopy height (m)0–1.20–3.20–1.2
Annual maximum leaf area index (m2·m−2)5.0NANA
Height of sensor arm (m)2.885.151.55
Data loggerCR3000CR23XCR23X
Observation year201320132014
Growth stageTransplanting: DOY 122 (2 May)
Heading: DOY 204 (23 Jul.)
Harvesting: DOY 249 (6 Sep.)
Budding: DOY 150 (30 May)
Silking: Dot 208 (27 Jul.)
Harvesting: DOY 261 (18 Sep.)
Second Harvesting: DOY 178 (27 Jun.)
Third harvesting: DOY 239 (27 Aug.)
NA: not available.

2.2. Data and Analytical Methods

2.2.1. Multispectral Radiance Measurement

Measurements of multispectral radiation were obtained by using a four-channel sensor (SKR1850, Skye Instruments Ltd, Llandrindod Wells, UK) at each study site in 2013 and 2014. The average center wavelength (average full width at half maximum (FWHM)) of each spectral band for the three sites was 478.3 ± 1.5 (9.3 ± 0.2) nm (blue), 549.0 ± 0.6 (9.7 ± 0.1) nm (green), 657.7 ± 0.6 (21.7 ± 0.1) nm (red), and 827.9 ± 0.6 (37.4 ± 0.1) nm (near infrared: NIR). The center wavelength and bandwidth were slightly different among the three sites, but the standard deviations for both the center wavelength and bandwidth were small enough to assume that the wavebands of all sensors were identical. A set of two sensors, one directed upwards and the other downwards was attached to a horizontal arm to measure the spectral irradiance of incident light and the radiance of reflected light. The field of view (FOV) of the sensors was 180° in the upward direction with a removable diffusing cosine correction head, and 25° in the downward direction. The height of the sensor arms was 2.88 m at the rice site, 5.15 m at the maize site, and 1.55 m at the grass site above the ground (Table 1). All measurements from individual spectral channels were recorded by a data logger (CR3000 (rice site) and CR23X (maize and grass sites), Campbell Scientific, USA) at an interval of 10 min throughout the seasons. We used the spectral data from 09:00 to 16:00 local time for the period of the day of the year (DOY) 130 (May 10)–DOY 230 (August 18), in 2013 at the rice and maize sites, and the same period in 2014 at the grass site.

2.2.2. Vegetation Indices Based on Ground-Based Spectral Measurements

The NDVI and the GRVI were calculated from the ground-based radiometer data. The NDVI and the GRVI are defined as follows [20,24]:
NDVI = (ρNIRρred) / (ρNIR + ρred)
GRVI = (ρgreenρred) / (ρgreen + ρred)
where ρNIR, ρred and ρgreen are the reflectance factors in the NIR, red, and green regions, respectively. The sensor with the removable diffusing cosine correction head for incident light was calibrated for irradiance by a National Physical Laboratory UK reference standard lamp. However, the sensor for reflected light did not have an absolute calibration [13]. Therefore, instead of calculating the reflectance for each channel directly, the NDVI and the GRVI were determined from the following equations using the incident and reflected light intensity in each spectral band:
NDVI = [(Z1 × RNIR / INIR) − (Rred / Ired)] / [(Z1 × RNIR / INIR) + (Rred / Ired)]
GRVI = [(Z2 × Rgreen / Igreen) − (Rred × Ired)] / [(Z2 × Rgreen / Igreen) + (Rred / Ired)]
where Z1 is the sensitivity ratio of reflected NIR to red light; Z2 is the sensitivity ratio of green to red light; RNIR, Rred, and Rgreen are the reflected readings in the NIR, red, and green regions (nano ampere: nA), respectively; and INIR, Ired, and Igreen are the incident (μmol·m−2·s−1) readings for the NIR, red, and green regions, respectively [31,32]. We used only the vegetation indices in the range from −1 to 1 to exclude abnormal data that were presumably caused by insufficient irradiance, rain, birds, insects, etc.
The solar zenith angle was calculated based on the geolocation of each site and the time of the spectral measurements. To investigate the influence of the diffuse/direct light conditions, we selected “clear sky” days and “cloudy sky” days by using the intensity and diurnal change of the global solar radiation measured by a pyranometer (rice and grass sites) and photosynthetically-active radiation (PAR) measured by a PAR sensor (maize site). A clear sky day was defined as a day with high radiation values and a smooth diurnal curve (see some examples in Figure 2). The PAR was proportional to the solar radiation and the ratio of PAR (μmol·m−2·s−1) to solar radiation (W·m−2) was 1.863. In contrast, a cloudy sky day was defined as a day with low incident radiation values throughout the daytime. We used these vegetation indices on the clear and cloudy sky days to analyze the effects of the solar zenith angle and diffuse/direct light conditions. The proportion of clear sky days was 19% at the rice site, 14% at the maize site, and 9% at the grass site.

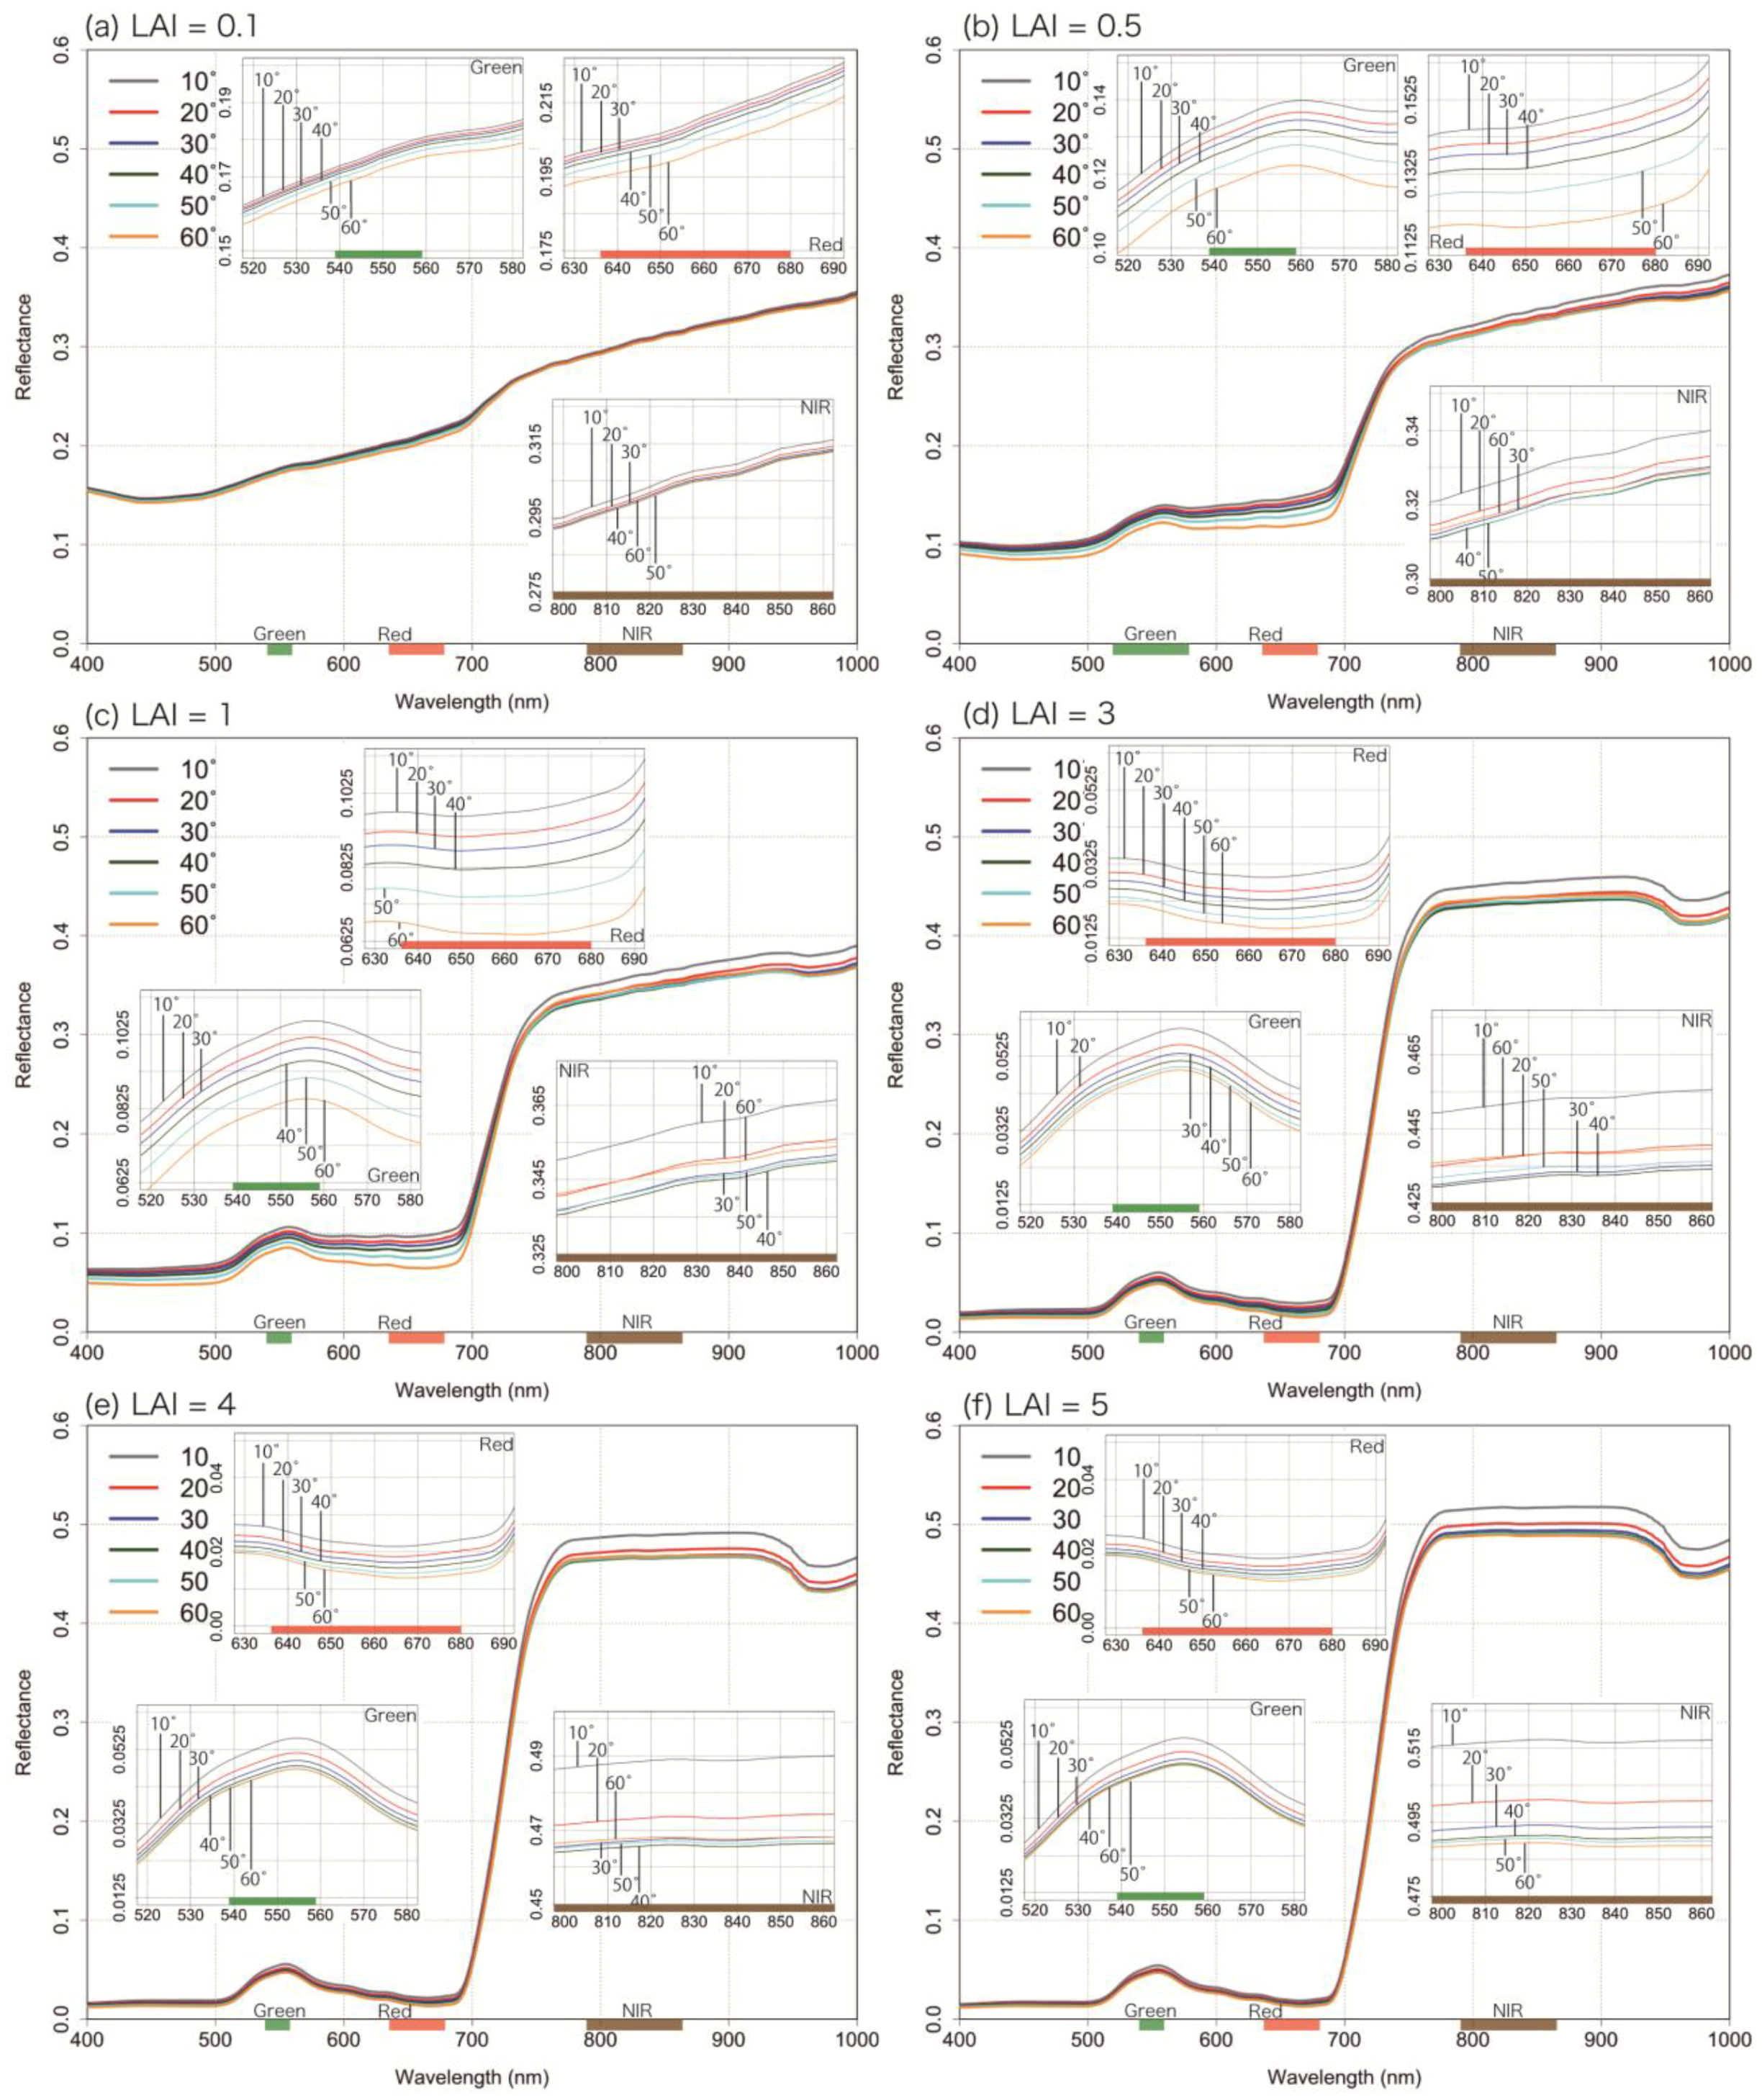
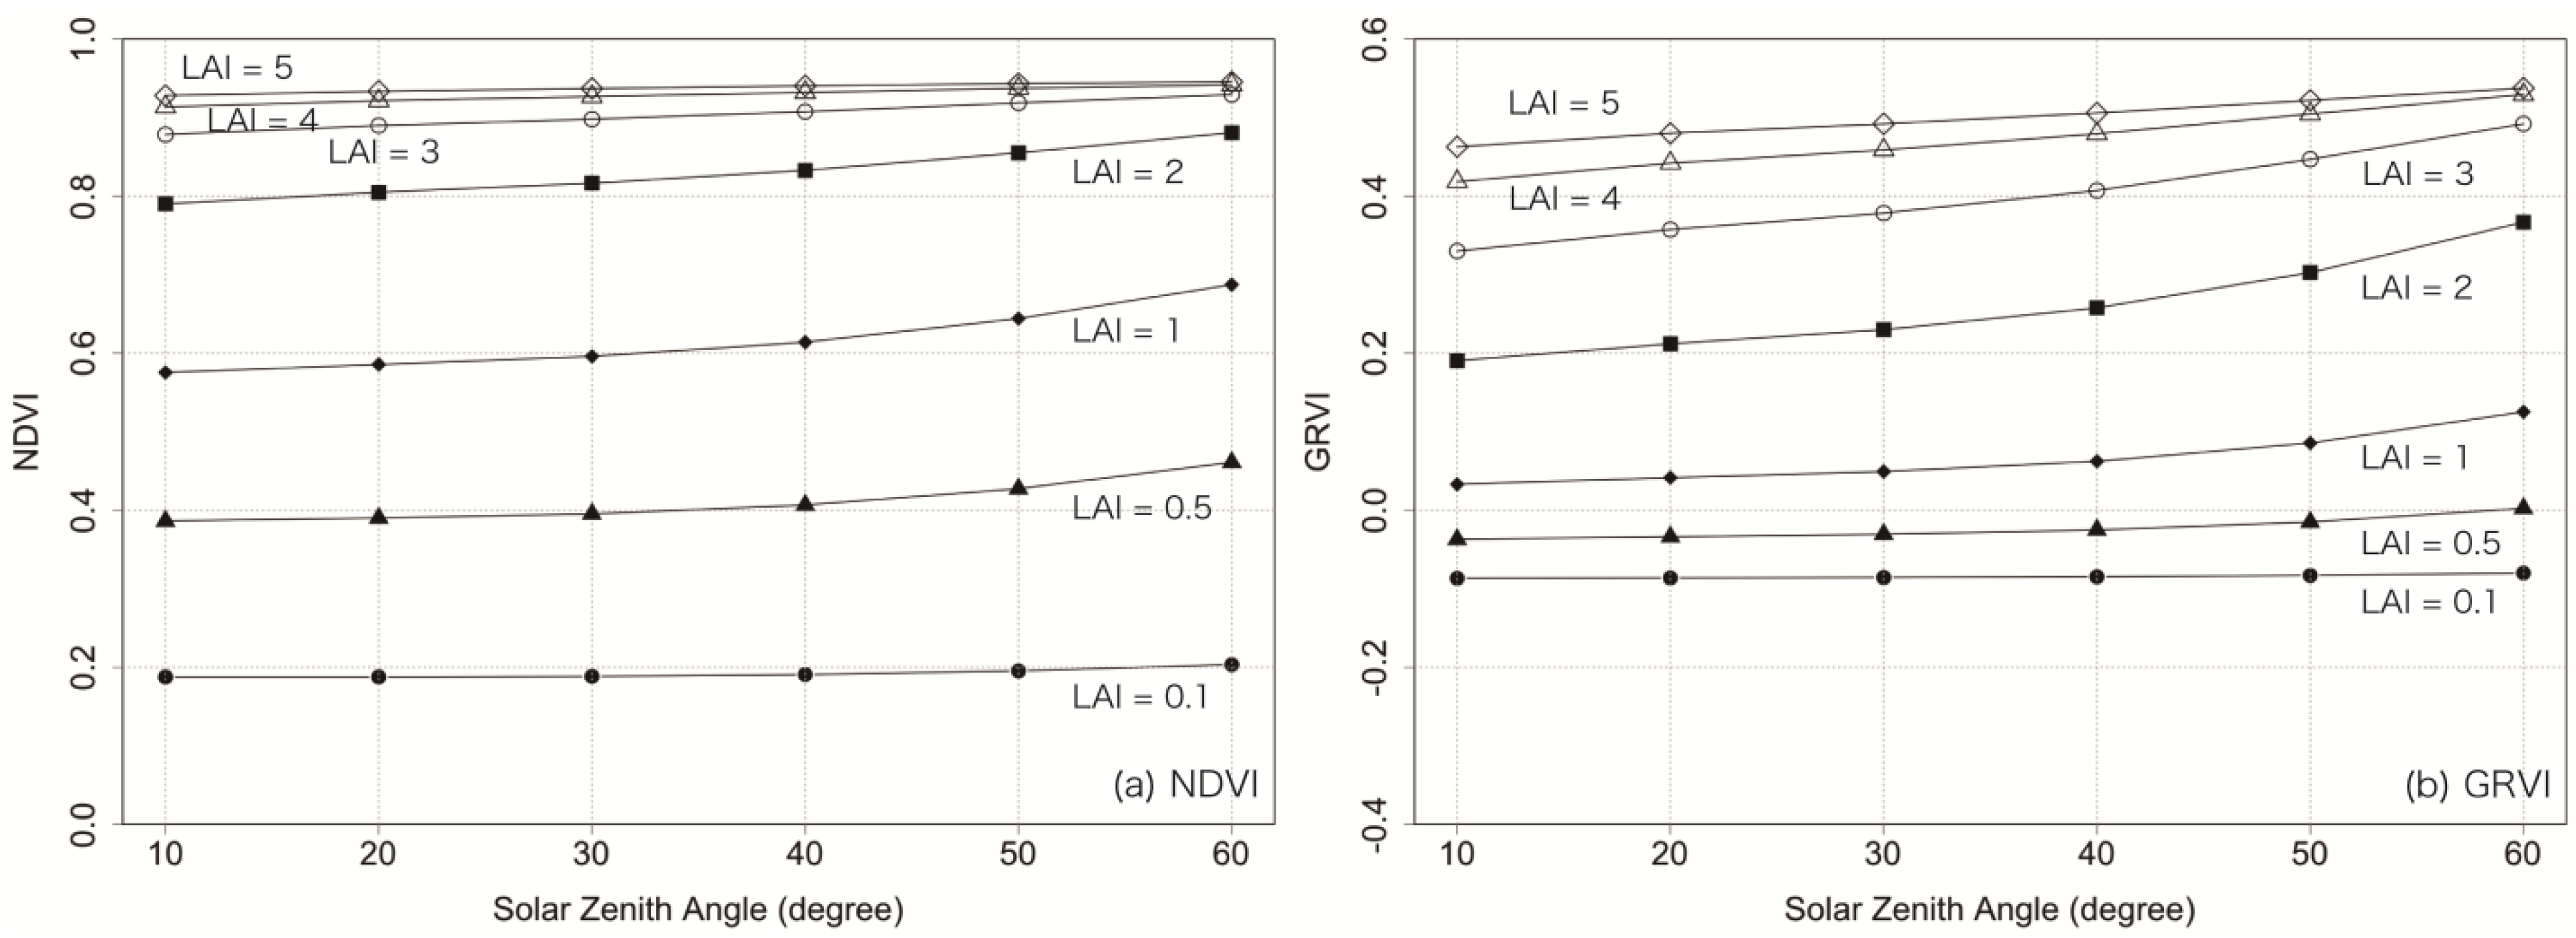
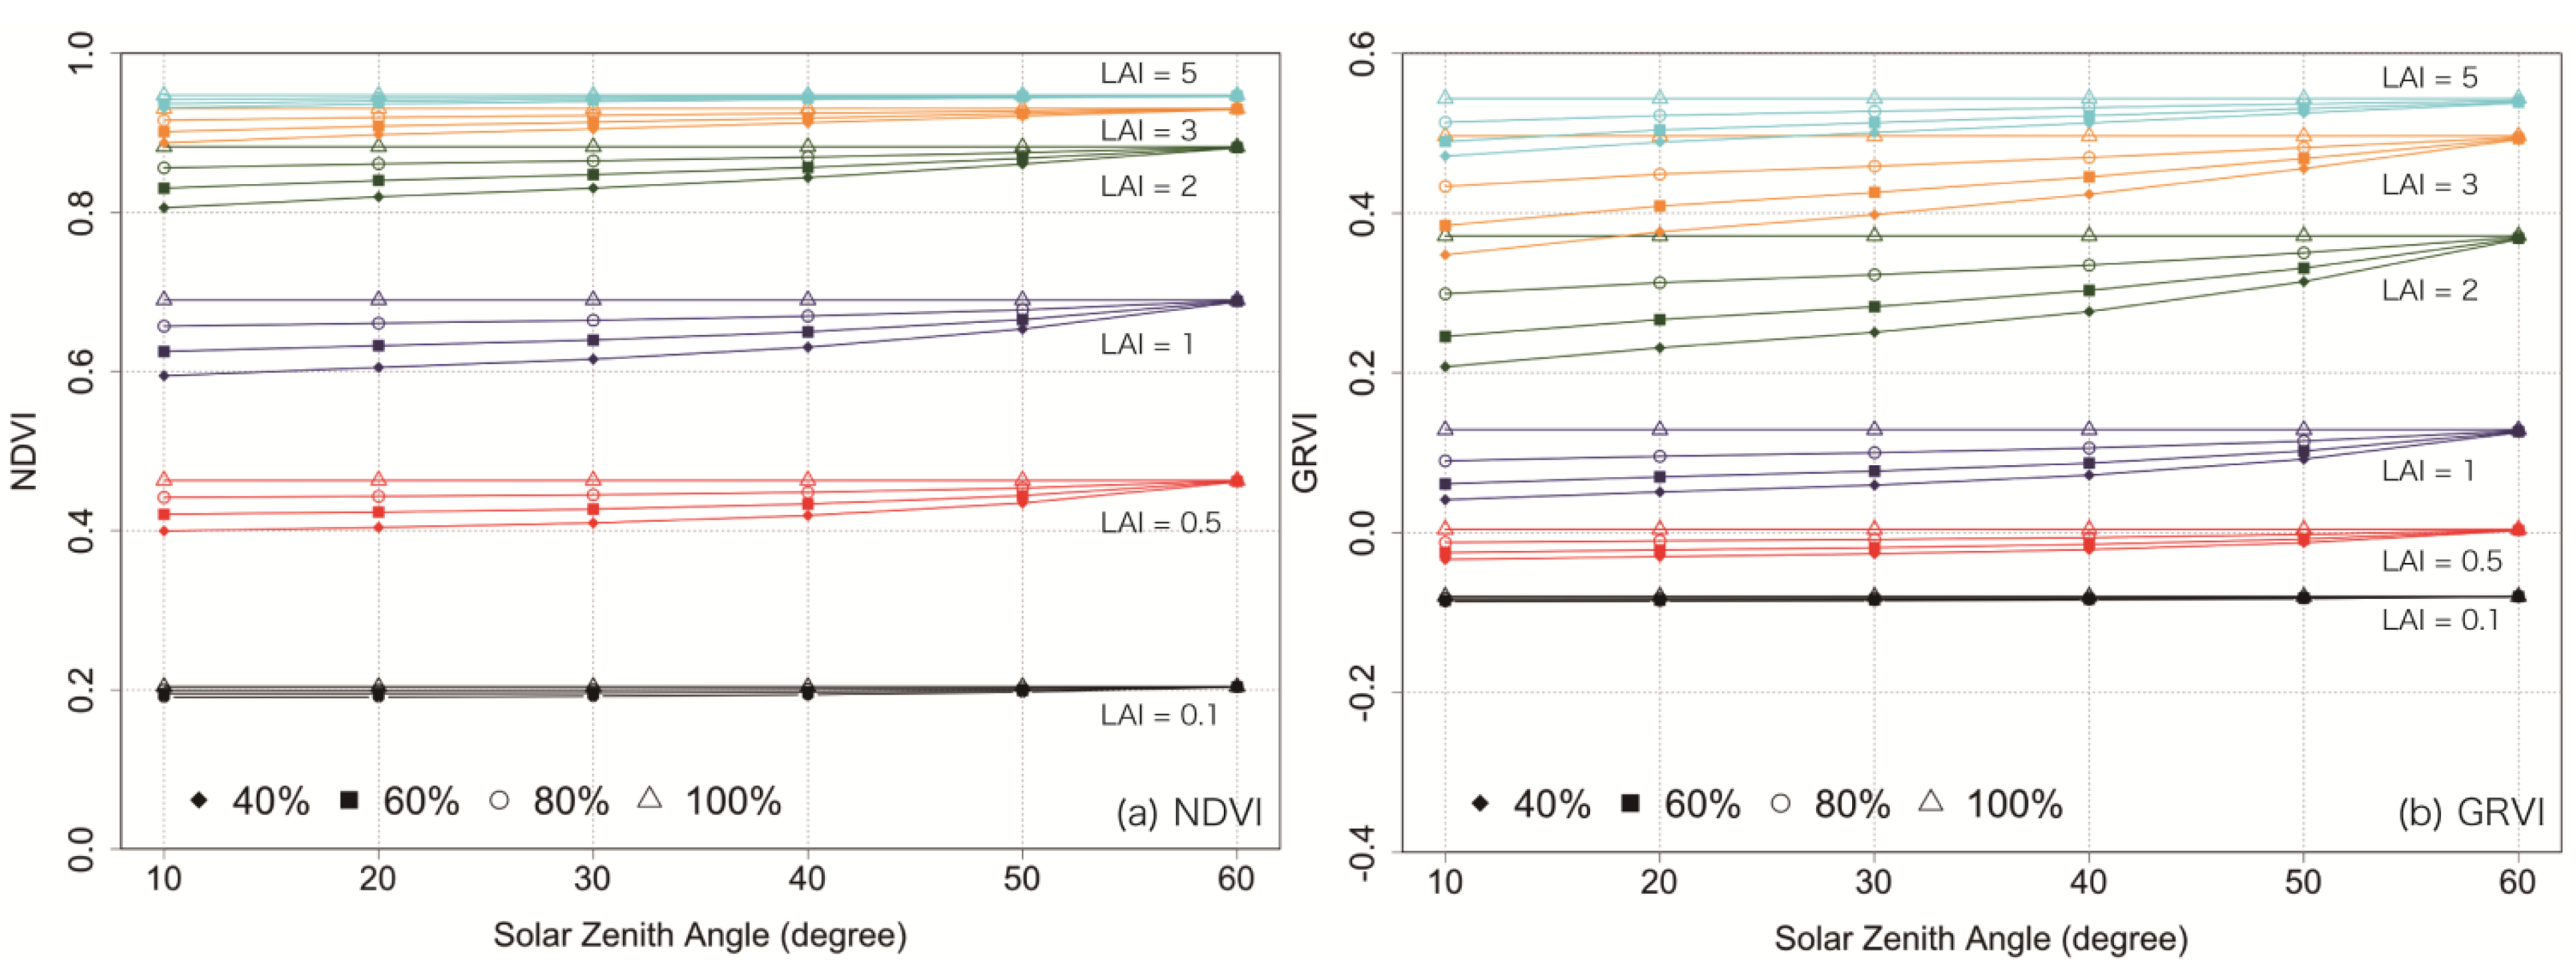
2.2.3. A Radiative Transfer Model for Simulating Vegetation Indices

We used the PROSAIL radiative transfer model to simulate the influence of the solar zenith angle and diffuse/direct light condition on the vegetation indices [33]. The PROSAIL model is a combination of the canopy reflectance model SAIL [34,35] and the leaf reflectance model PROSPECT [36]. The model can simulate the canopy bidirectional reflectance in the 400–2500 nm wavelength region at 1 nm resolution under various biophysical conditions and/or measurement configurations. In this study, model parameters for the actual canopies in each experiment were not determined, so we used typical parameter values from the literature for the maize canopies, as shown in Table 2 [12,37,38]. Therefore, we assumed that the general relations between solar zenith angle, diffuse/direct light conditions (the ratio of diffuse light to total radiation), and leaf area index (LAI) could be investigated properly by simulations with these typical parameters.
Table 2. List of input parameters for the PROSAIL model.
ParameterValue
Chlorophyll a and b content (Cab)40
Carotenoid content (Car)12.3
Brown pigment content (Cbrown)0
Leaf water content (Cw)0.015
Leaf dry matter content (Cm)0.0055
Structure coefficient (N)1.5
Leaf angle distribution (LIDF)Spherical
Leaf area index (LAI)0.1, 0.5, 1, 2, 3, 4, 5
Solar zenith angle (tts)20, 30, 40, 50, 60
Observer zenith angle (tto)0
Azimuth (psi)0
Soil reflectance properties (psoil)0.7

3. Results

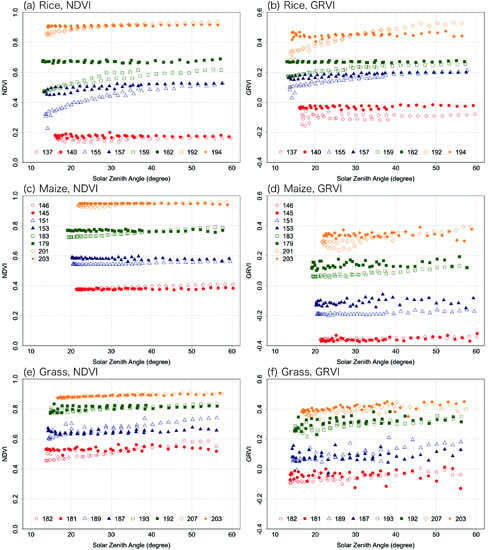
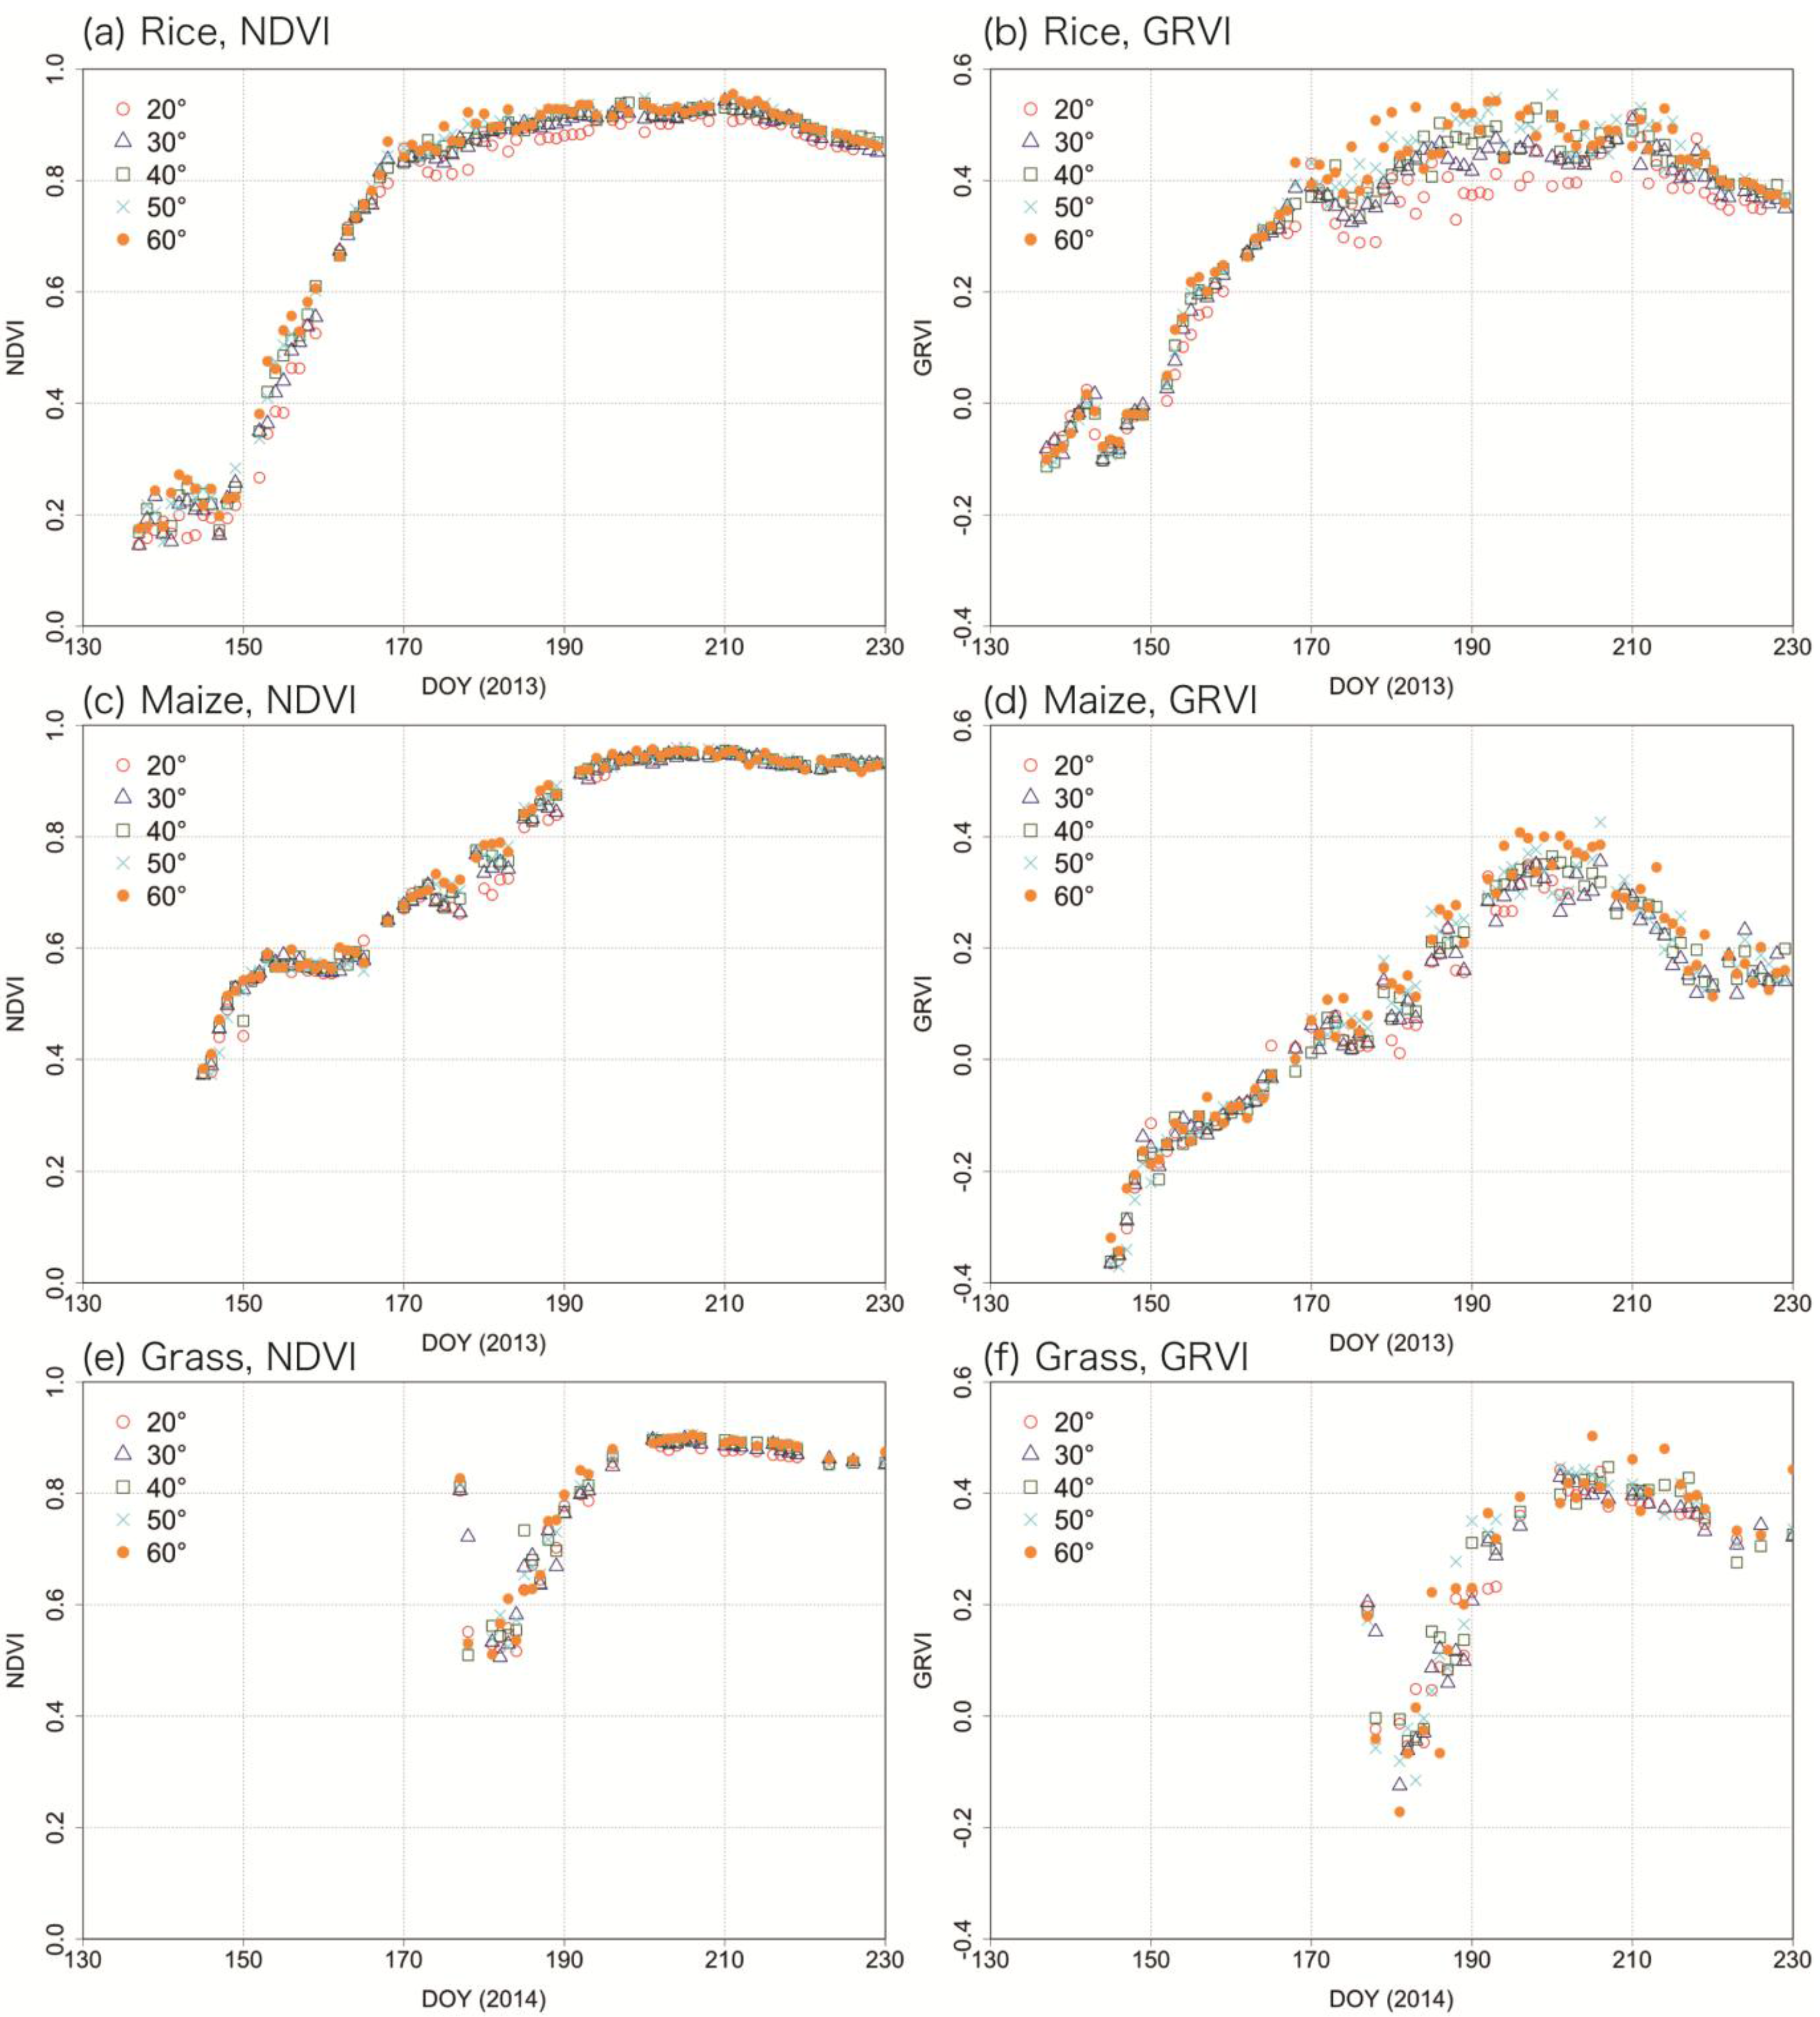
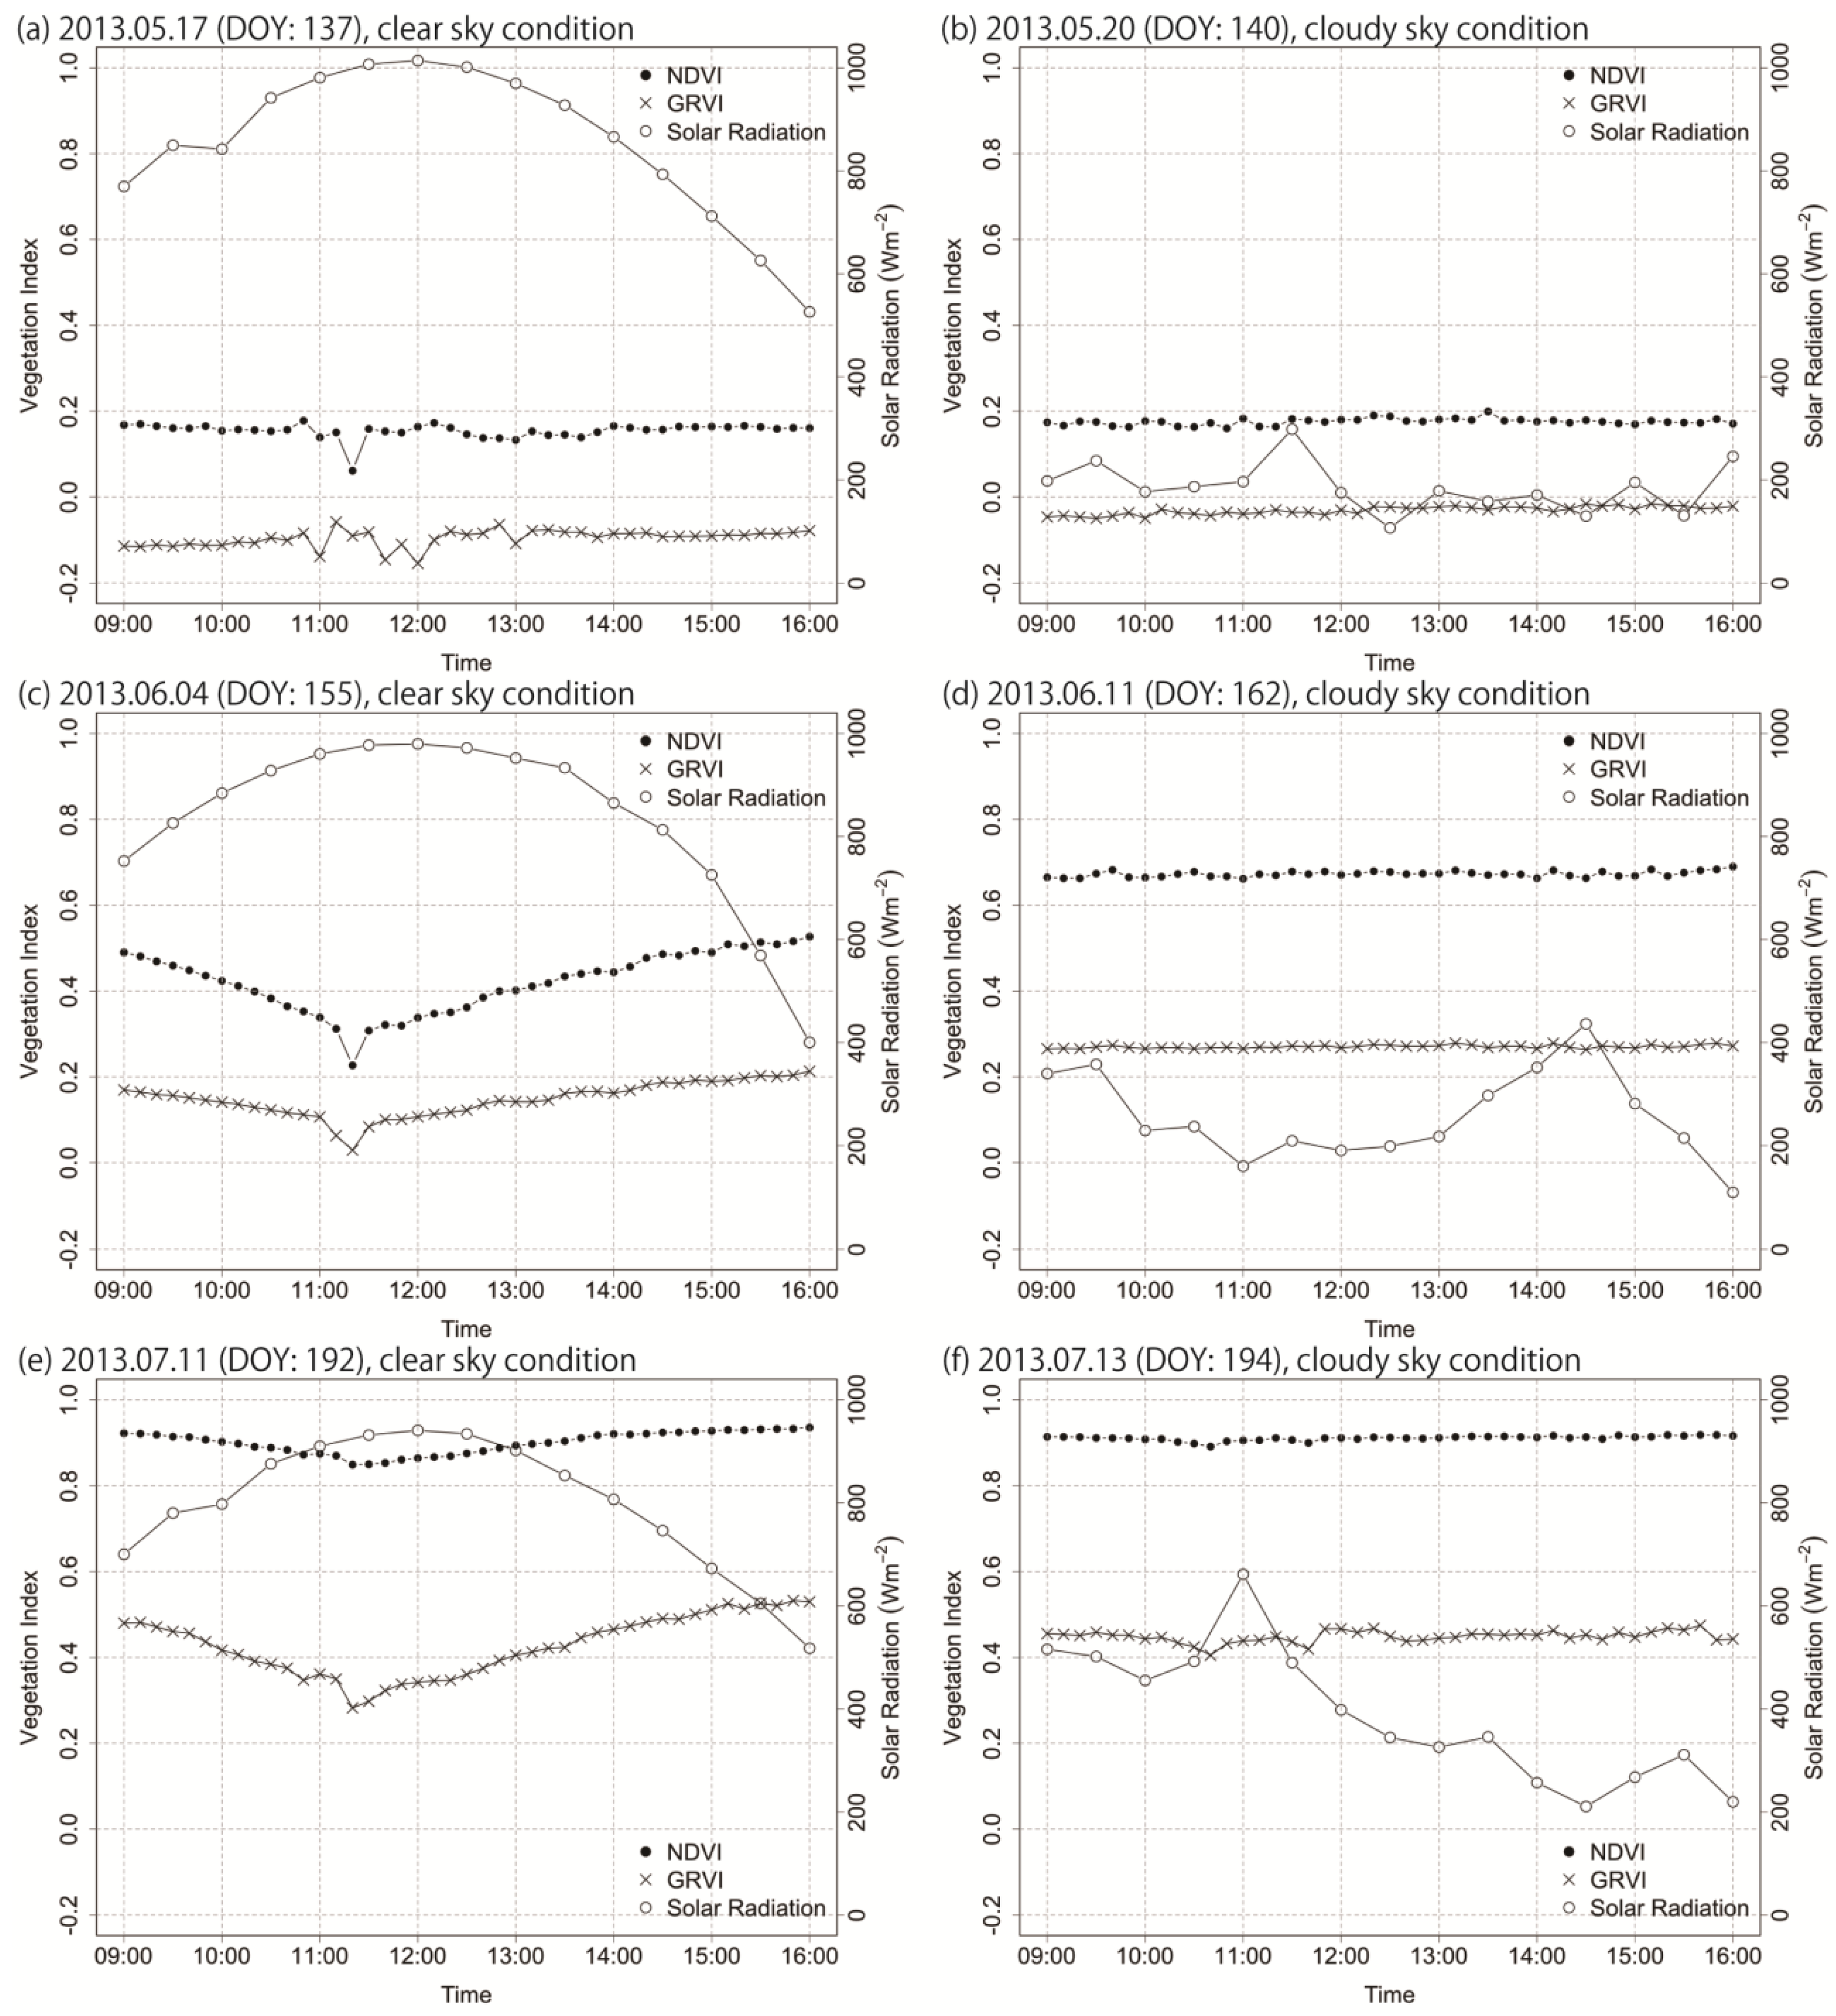
3.1. The Effects of Solar Zenith Angle on Diurnal and Seasonal Change of Vegetation Indices

Figure 1 shows a time series of the NDVI and the GRVI with the same solar zenith angle, i.e., 20°, 30°, 40°, 50°, and 60°, during the growing season. These data were extracted from the diurnal data so that the individual data had a similar solar zenith angle. Accordingly, the time of day for the individual data varied from morning (9:00 local time) to afternoon (16:00 local time). At the rice site (MSE), the dates for transplanting, heading, and harvesting were DOY 122 (2 May), DOY 204 (23 July), and DOY 249 (6 September), respectively (Table 1). At the maize site (SHD), the dates for budding, silking, and harvesting were DOY 150 (30 May), DOY 208 (27 July), and DOY 261 (18 September), respectively (Table 1). At the grass site (NSS), regular renovation of the grassland was conducted in 2012, and the second and third harvesting were on DOY 178 (27 June) and DOY 239 (27 August), respectively (Table 1). Overall, both the NDVI and the GRVI increased with plant growth at all sites. After reaching the maximum level, the NDVI remained nearly constant, whereas the GRVI gradually decreased. Most importantly, the difference in solar zenith angle caused some systematic changes in the seasonal pattern of both the NDVI and the GRVI. The influence of the solar zenith angle was slightly larger for the GRVI than for the NDVI.
Figure 2 shows the distinctive diurnal change of the NDVI, the GRVI and the solar radiation at the rice site. These figures show some selected days under clear and cloudy sky conditions during the early growth stage (NDVI < 0.4), middle growth stage (NDVI: 0.4–0.8), and late growth stage (NDVI > 0.8). Under clear sky conditions, both the NDVI and the GRVI showed significant diurnal changes during the middle and the late growth stages (Figure 2c,e), whereas the diurnal change was small during the early growth stage (Figure 2a). The NDVI and the GRVI showed minimum values from 11:00 to 12:00, when the solar radiation reached a maximum during the middle and late growth stages. The precipitous decrease of the NDVI and the GRVI showed around solar noon. On the other hand, under cloudy sky conditions, neither the NDVI nor the GRVI showed significant diurnal changes in spite of changes in the solar radiation throughout the growing season (Figure 2b,d,f).
Figure 1. Time series of the NDVI (left) and the GRVI (right) with the same solar zenith angles (20°, 30°, 40°, 50°, and 60°) during the growing season at the rice (a,b), maize (c,d), and grass (e,f) sites.
Remotesensing 07 14079 g001
Figure 2. Distinctive diurnal changes of the NDVI and the GRVI under clear sky conditions (left) and cloudy sky conditions (right) at the rice site. Solar noon is between 11:36 and 11:45 local time. (a) DOY: 137; (b) 140; (c) 155; (d) 162; (e) 192; (f) 194.
Remotesensing 07 14079 g002
Figure 3 shows the dependence of the NDVI and the GRVI on the solar zenith angle for selected days during the growing season. In this figure, data points are shown for sets of two days (clear and cloudy sky conditions) with almost the same crop conditions, in order to determine the effects of the diffuse/direct light conditions. The open symbols show the days under clear sky conditions and the closed symbols show the days under cloudy sky conditions. Overall, the NDVI was not affected by the solar zenith angle under cloudy sky conditions throughout the growing season. However, under clear sky conditions, the NDVI decreased significantly with decreasing solar zenith angle during the middle growth stage (NDVI: 0.4–0.8), whereas, even under clear sky conditions, the influence of the solar zenith angle on the NDVI was not clear during the early and late growth stages (NDVI < 0.4 and NDVI > 0.8). On the other hand, the GRVI decreased with decreasing solar zenith angle under clear sky conditions after the middle growth stage (GRVI > 0), whereas it was not affected by the solar zenith angle under either clear or cloudy sky conditions during the early growth stage (GRVI < 0). These responses of the vegetation indices to the change in solar zenith angle were much more significant at the rice site than at the other sites. In particular, on DOY 155, the NDVI decreased by more than 0.2 in response to a 25° decrease in solar zenith angle at the rice site. Meanwhile, there were some fluctuations in NDVI and the GRVI with the change of the solar zenith angle.
Figure 3. Relation between the NDVI (left), GRVI (right), and the solar zenith angles on selected days during the growing season at the rice (a,b), maize (c,d) and grass (e,f) sites. Open symbols show the days under clear sky conditions and closed symbols show the days under cloudy sky conditions.
Remotesensing 07 14079 g003
Table 3 shows the statistical coefficients for the linear regression between the vegetation indices and the solar zenith angle on the selected days used in Figure 3. The coefficient of determination for linear regression was high under clear sky conditions. Under cloudy sky conditions, the variation of the vegetation indices with changing the solar zenith angle was small, and linear relationship was not significant. The slope of linear regression between NDVI and solar zenith angle varied in a range from 0.0019 to 0.0050 under clear sky conditions during the middle growth stage (NDVI: 0.4–0.8) except DOY 151 at the maize site. On the other hand, the slope of linear regression between GRVI and solar zenith angle varied in a range from 0.0018 to 0.0054 under clear sky conditions after the middle growth stage (GRVI > 0). The mean slope of the regression lines for NDVI was 0.0042 at the rice site, 0.0012 at the maize site, and 0.0029 at the grass site, respectively. Similarly, the mean slope of the regression lines for GRVI was 0.0034 at the rice site, 0.0025 at the maize site, and 0.0021 at the grass site, respectively. All slopes of both NDVI and GRVI under cloudy sky conditions were less than 0.001 except DOY 157 at rice site in NDVI and DOY192 at grass site in GRVI.
Table 3. The statistical coefficients for the linear regression between the vegetation indices and the solar zenith angle on the selected days during the growing season at the rice, maize, and grass site. The days under clear sky conditions is highlighted by gray color.
(a) NDVI
RiceMaizeGrass
DOYSlopeInterceptR2DOYSlopeInterceptR2DOYSlopeInterceptR2
1370.00050.1400.1111460.00090.3570.7991820.00290.4260.855
140−0.000030.1760.0031450.00020.3710.2951810.00030.5240.092
1550.00500.2740.8471510.00050.5300.8691890.00290.5850.775
1570.00150.4550.642153−0.00030.5900.2151870.00040.6340.207
1590.00340.4490.8291830.00190.6860.9871930.00120.7660.798
1620.00010.6690.047179−0.00010.7720.1021920.00060.7890.219
1920.00190.8440.8562010.00080.9160.7072070.00080.8650.897
1940.00030.9030.364203−0.000070.9500.1612030.00070.8670.831
(b) GRVI
RiceMaizeGrass
DOYSlopeInterceptR2DOYSlopeInterceptR2DOYSlopeInterceptR2
1370.0004−0.1090.0721460.0005−0.3700.6091820.0016−0.1050.636
1400.0003−0.0410.1731450.0006−0.3780.290181−0.0001−0.0390.002
1550.00280.0650.8311510.0007−0.2070.6281890.00310.0100.603
1570.00100.1540.6801530.0005−0.1260.0721870.00030.0760.014
1590.00200.1590.8631830.00180.0230.9211930.00190.2330.651
1620.000040.2690.0191790.00060.1230.0971920.00140.2720.242
1920.00540.2700.9122010.00320.2040.7492070.00140.3460.470
1940.00040.4380.1152030.00010.3370.0042030.00130.3710.412

3.2. Vegetation Indices Simulated Using the Radiative Transfer Model

Figure 4 shows the reflectance values simulated by the PROSAIL model for a range of solar zenith angles (10°, 20°, 30°, 40°, 50°, 60°) under different LAI (0.1, 0.5, 1, 2, 3, 4, 5). For all solar zenith angles, the reflectance decreased with increasing LAI in the visible to red-edge range (400–750 nm). In contrast, in the red-edge to NIR range (750–1000 nm), the reflectance increased consistently. The response of the reflectance to the solar zenith angle was weak for low LAI values (~0.1), but the reflectance in the visible range for higher LAI (0.5–5) showed a decreasing trend with increasing solar zenith angle. The reflectance in the NIR region for LAI values of 0.5–4 showed a decreasing trend for solar zenith angles from 10 to 40°, but an increasing trend from 40 to 60°. The reflectance of the NIR for the high LAI (5) showed a decreasing trend in the order of solar zenith angle in the full range of 10 to 60°. In summary, the spectral response to the change in solar zenith angle was largest in the red band (657.7 nm), followed by the green (549.0 nm), and the NIR (827.9 nm) bands.
Figure 4. Reflectance spectra simulated using the PROSAIL model for a range of solar zenith angles (10°, 20°, 30°, 40°, 50°, 60°) and LAI values ((a) 0.1, (b) 0.5, (c) 1, (d) 3, (e) 4, (f) 5).
Remotesensing 07 14079 g004
Figure 5 shows the relations between the vegetation indices and the solar zenith angle simulated by the PROSAIL model for a range of solar zenith angles (10°, 20°, 30°, 40°, 50°, 60°) and LAI values (0.1, 0.5, 1, 2, 3, 4, 5). The NDVI decreased with decreasing solar zenith angle for all LAI values. Nevertheless, the response of the NDVI to the change in solar zenith angle was negligible for low and high LAI values. The response of the GRVI to solar zenith angle was similar to that of the NDVI. However, the response of the GRVI for high LAI values was much clearer than that of the NDVI, whereas the response for a low LAI value (0.1) was almost negligible as in the case of the NDVI.
Figure 5. Relation between vegetation indices ((a) NDVI and (b) GRVI) and solar zenith angles simulated by the PROSAIL model for a range of LAI values (0.1, 0.5, 1, 2, 3, 4, 5).
Remotesensing 07 14079 g005
Figure 6 shows the relations between the simulated vegetation indices and the solar zenith angles for different diffuse light ratios (40%, 60%, 80%, 100%). Under 100% diffuse light conditions, neither the NDVI nor the GRVI changed with changing solar zenith angle, irrespective of the LAI values. However, for lower diffuse light ratios (clear sky conditions), a response of the vegetation indices to the solar zenith angle was evident. Both the NDVI and the GRVI decreased with decreasing solar zenith angle. These responses were clearer at the middle LAI values, but were negligible for low and high LAI values in the case of the NDVI and for low LAI values in the case of the GRVI.
Figure 6. Relation between vegetation indices ((a) NDVI and (b) GRVI) and solar zenith angles simulated by the PROSAIL model for a range of LAI values (0.1, 0.5, 1, 2, 3, 4, 5) and different ratios of diffuse light (40%, 60%, 80%, 100%).
Remotesensing 07 14079 g006

4. Discussion

4.1. Influence of the Solar Zenith Angle on the Change in Vegetation Indices

The values of the vegetation indices for a vegetation canopy fluctuated in response to the solar zenith angle. The values were not consistent even during a day due to the change in solar radiation and solar zenith angle (Figure 1 and Figure 2). The precipitous decrease of the NDVI and the GRVI around solar noon may be attributable to the hot spot phenomenon [39]. In general, the vegetation indices decreased with decreasing solar zenith angle (Figure 3). This response was affected significantly by the growth stage and diffuse/direct light conditions. The decreasing response of the NDVI to decreasing solar zenith angle was high during the middle growth stage (0.4 < NDVI < 0.8). The decrease ratio of NDVI by decreasing solar zenith angle was in the range from 0.0019 to 0.0050 under clear sky conditions in this growth stage and the NDVI value decreased within the range from 0.0057 to 0.15 with decreasing solar zenith angle from 50 to 20 (Table 3). On the other hand, a similar response of the GRVI was evident, except for the early growth stage (GRVI < 0). The decrease in ratio of the GRVI by the decreasing solar zenith angle was from the range of 0.0018 to 0.0054 under clear sky conditions in this growth stage and the GRVI value decreased within the range from 0.0054 to 0.162 with decreasing solar zenith angle from 50 to 20. The response of the vegetation indices to the solar zenith angle was also affected by the diffuse/direct light conditions. The change in the vegetation indices in response to the solar zenith angle was evident under clear sky conditions but almost negligible in cloudy sky conditions. Under cloudy sky conditions, the variation of the vegetation indices by change of the solar zenith angle was small, and the clear linear relationship was not found. A part of the fluctuations of NDVI and the GRVI observed in Figure 3 would be attributable to the interaction of solar azimuth angle with crop row orientation, although the other parts might have been caused by other environmental factors such as rain and birds [1].
Rahman et al. [23] reported that the NDVI determined by ground-based observations decreased with decreasing solar zenith angle at a pasture site. These results indicated a similar tendency to those obtained in the present study. However, the previous study used a dataset for only two days under conditions of vegetation cover and did not show results throughout the growth season. Furthermore, because the observation of radiation was conducted only under clear sky conditions, the relations between the NDVI and the solar zenith angle were not investigated under cloudy sky conditions. In this study, we compared the influences of various growth stages and diffuse/direct light conditions on vegetation indices by using continuous ground-based measurements.
These experimental results were well supported by the results of simulations based on the physically-based canopy reflectance model (PROSAIL) (Figure 5 and Figure 6). First, the effect of the growth stage (as represented by LAI) on the sensitivity of the NDVI and the GRVI to the solar zenith angle was assessed quantitatively. The results agreed well with the experimental results, in which the sensitivity of the NDVI to LAI was evident during the middle growth stage but low during the early and late growth stages. The sensitivity of the GRVI was similar to that of the NDVI, but negligible only during the early growth stage. Second, the simulation results concerning the effect of light conditions (ratio of diffuse light) on the sensitivity of the NDVI and the GRVI to the solar zenith angle also agreed well with the experimental results. The response of the NDVI and the GRVI to the difference in solar zenith angle was evident under clear sky conditions (less diffuse light), but negligible under cloudy sky conditions, irrespective of the growth stage (LAI). Nevertheless, the sensitivity of these responses was significant during the middle growth stage, but weak during the early and late growth stages for the NDVI and during the early growth stage for the GRVI.
The relation between the vegetation indices and the solar zenith angle was caused by the response of the reflectance to the solar zenith angle (Figure 4). In general, the canopy reflectance is affected by view/illumination geometry as well as the canopy structure and optical properties of leaves and soils [1,33,34]. The variations in solar zenith angle alter both the optical thickness of a canopy and the illuminated components of vegetation/background [40]. In most crop canopies, the canopy reflectance is determined mainly by the soil reflectance in small LAI conditions (~1) and by the vegetation reflectance in large LAI conditions (4~). Accordingly, the response of canopy reflectance to the solar zenith angle is determined by the interactive effects of the canopy structure (LAI and leaf angle distribution) in the direction of sun-beam as well as the BRDF of soil surface. Similarly, the small influence of solar zenith angle under diffuse light is explained by the isotropic illumination conditions, i.e., stability of the optical thickness and the illuminated components.

4.2. Response of Vegetation Indices to Solar Zenith Angle and Diffuse/Direct Light Conditions in Different Vegetation Types

The overall relation between the vegetation indices and the solar zenith angles was similar for all three vegetation types. However, their responses were affected by the differences in canopy structure and the growth pattern for each vegetation type. The vegetation indices decreased with decreasing solar zenith angle for all vegetation types, but the sensitivity of the response was somewhat different across the three crops (Figure 3 and Table 3). In particular, the sensitivity of the response was much higher for the paddy field than for the other types. For the paddy field, the decrease in the NDVI was remarkable for solar zenith angles smaller than 30°. In contrast, the reduction rate for the GRVI with decreasing solar zenith angle was not affected by the vegetation type.
The relation between the NDVI and the solar zenith angle in the simulation was similar to the experimental results for upland field and cultivated grassland, whereas the experimental results for the paddy field showed a higher response than the simulation results (Figure 5 and Figure 6). This difference may be attributable to the unique ground surface condition in paddy fields. The soil surface of paddy fields is under flooded conditions during the majority of the growing period. All selected days used in Figure 3 were under flooded conditions. Under such conditions, radiation in the NIR region is absorbed by the background water, and so the reflectance in the NIR region would be decreased [41]. Especially during the early growth stage when the rice canopy is not closed, the effects of the water surface on the reflectance in the NIR region can be more significant than in other growth stages. Accordingly, under these conditions, the reflectance in the NIR region decreases when the solar zenith angle is small, whereas the reflected radiation would increase for high solar zenith angles. Our experimental and simulation results suggest that the higher sensitivity of vegetation indices to the solar zenith angle in paddy fields would be caused by the unique flooded conditions beneath the rice plants.
On the other hand, the relation between the NDVI and the solar zenith angle in upland field and cultivated grassland was slightly different from that for the paddy field. In cultivated grassland, the decrease in the NDVI was not significant for small solar zenith angles. A grass canopy usually closes earlier than row crops, such as rice and maize, because of the broadcast sowing method. This may be the reason why the relation between the NDVI and the solar zenith angle for cultivated grassland was less sensitive than that for the other vegetation types. The relation between the NDVI and the solar zenith angle for the maize canopy was also less sensitive than that for the paddy field because of the difference of background surface condition (upland or flooded). The vegetation indices were also affected by the soil surface condition when the vegetation cover was small [40]. The soil-adjusted vegetation index (SAVI) have been used to minimize the effects of soil background [40]. Note that the relation between the NDVI and the solar zenith angle was affected to some extent by the background surface conditions and differences in canopy structure.

4.3. Effective Usage of Vegetation Indices Derived from Continuous Ground-Based Spectral Measurement

Ground-based spectral observations can provide detailed and accurate information on the dynamic change in structure and/or function of vegetation based on high temporal resolution data. In addition, these ground-based measurements can be used for absolute calibration of satellite or airborne images. However, these data are affected by the solar zenith angle and diffuse/direct light conditions at the time of measurement. Therefore, we have to take account of such fluctuations in the analysis of continuous measurements on the ground. However, in previous studies, instantaneous or mean values at a specified time were often used throughout the season [20,21]. In such practices, the effects of diurnal and seasonal changes of the solar zenith angle are ignored, so the actual vegetation parameters would not be estimated properly. To reduce these influences, it is desirable to use data obtained under identical measurement conditions for the solar zenith angle and the diffuse/direct light. In general, the number of usable data is restricted to satisfy such measurement conditions. According to our results (Figure 3 and Figure 6), for larger solar zenith angles, the vegetation indices are not significantly affected by the diffuse/direct light conditions and growth stage. For example, for a solar zenith angle of 60°, neither the NDVI nor the GRVI are affected by the diffuse/direct light conditions in any growth stage. Therefore, our results suggest that using the selected data at the solar zenith angle of 60° would be effective for accurate assessment of the canopy structure and function based on continuous diurnal spectral measurements.
In Figure 3, we investigated the influence of solar zenith angle on vegetation indices based on the ground-based measurements on typical clear- and cloudy-sky days. However, in general, the distribution and optical thickness of clouds in the sky vary during a day or a season depending on the weather conditions. Therefore, we have examined similar relationships as in Figure 3 using the data on the other type of days, i.e., those with some fluctuations between clear- and cloudy-sky conditions in a day. The result suggested that the effect of solar zenith angle on the vegetation indices under such days varied within the variation range of the two typical conditions depending on the diffuse/direct light ratio. These fluctuations are explained mainly by the change of the diffuse/direct light ratio as investigated in our simulation study (Figure 6). Accordingly, the possible influences of sky conditions (diffuse/direct light ratio) on the relationship between vegetation indices and solar zenith angle can be assessed by using instantaneous measurements of incident light obtained by spectral radiometers, pyranometers, or PAR sensors.
Ground-based spectral measurements are also used for validation of satellite observations [17,42]. In the case that the satellite data are validated by synchronized ground-based measurements, the solar zenith angle and the diffuse/direct light conditions are basically the same for the ground-based and the satellite observations. However, the viewing angle of satellites does not always agree with the ground-based sensors because the view zenith angle is usually fixed at 0° (nadir observation) for the ground-based sensors. Therefore, similar to the fluctuations caused by the solar zenith angle, the influence of this difference in viewing angle has to be considered because the vegetation indices would be affected by it [43].
In a wide range of experimental studies in the field, spectral data are measured periodically using a portable spectro-radiometer at some intervals, and it is assumed that the effect of the solar zenith angle is small [44,45]. These observations are usually observed midday under clear sky conditions. When the observation dates are close to each other, the difference in solar zenith angle can be negligible. However, when the observation dates are different to some extent, the solar zenith angles may not be comparable. Rahman et al. [23] proposed a method to correct the influence of the solar zenith angle on the NDVI by using the relation between the NDVI and the solar zenith angle. However, the applicability of the method may be limited because the data used was from a narrow and specific period. In addition, the relation between the vegetation indices and the solar zenith angle is affected by the growth stage and vegetation type (Figure 3). The continuous spectral measurement allows the selection of some preferable data from the diurnal data for specific purposes, although measurements are taken for a fixed point in the field. Generally, field measurements using a portable spectro-radiometer allow us to acquire the spatial average of spectral measurements over a range of different targets. Nevertheless, data acquisition at the same solar zenith angle would be useful to improve the seasonal consistency of vegetation indices. If multiple measurements at different times of day (different solar zenith angles) can be made, the observation data can be corrected to be more consistent based on the relation between the solar zenith angle and the vegetation indices.

5. Conclusions

In this study, we investigated the impact of the changing solar zenith angle and diffuse/direct light conditions on the consistency of vegetation indices (NDVI and GRVI) derived from ground-based spectral measurements in three kinds of croplands (paddy field, upland field, cultivated grassland). The vegetation indices showed some systematic changes in response to the solar zenith angle, the ratio of diffuse light, and the growth stage.
Our comprehensive analysis revealed the general effects of the growth stage and light conditions on the diurnal and seasonal fluctuations of vegetation indices. In general, the vegetation indices decrease with decreasing solar zenith angle. This response can be affected significantly by the growth stage and diffuse/direct light conditions. The decreasing response of the NDVI to decreasing solar zenith angle is high during the middle growth stage (0.4 < NDVI < 0.8). On the other hand, a similar response of the GRVI is evident, except for the early growth stage (GRVI < 0). The change in vegetation indices in response to the solar zenith angle is evident under clear sky conditions, but almost negligible under cloudy sky conditions irrespective of the growth stage. Furthermore, for larger solar zenith angles, the vegetation indices are not significantly affected by the diffuse/direct light conditions and growth stage. These experimental results are well supported by the simulation results based on a physically-based canopy reflectance model (PROSAIL). Basically, the vegetation indices decrease with decreasing solar zenith angle for all vegetation types, but the sensitivity of the response is somewhat different for the three crops. In particular, the sensitivity of the response is much higher for the paddy field than for the other types, and this could be attributable to the uniquely flooded conditions in paddy fields.
Systematic selection of data from continuous diurnal spectral measurements in consideration of the solar light conditions would be effective for accurate and consistent assessment of canopy structure and function. Necessary corrections for the influences of sky conditions on the relationship between vegetation indices and solar zenith angle can be made by using instantaneous measurements of incident light obtained by spectral radiometers, pyranometers, or PAR sensors. These results would provide useful insights into the consistency of vegetation indices obtained by various sensors and platforms.

Acknowledgments

We thank M. Mano (Chiba University) for the assistance in field measurements. This work was supported by JSPS KAKENHI Grant Number 26850164. We also thank the three anonymous reviewers for their valuable comments and suggestions.

Author Contributions

Yoshio Inoue conceived and designed the spectral sensing network and research plans. Mitsunori Ishihara collected the field data, and analyzed the data for this study. Keisuke Ono, Mariko Shimizu and Shoji Matsuura assisted with the field data collection. Mitsunori Ishihara and Yoshio Inoue jointly wrote the manuscript. All the authors contributed to editing and reviewing the manuscript.

Conflicts of Interest

The authors declare no conflict of interest.

References

  1. Hatfield, J.L.; Gitelson, A.A.; Schepers, J.S.; Walthall, C.L. Application of spectral remote sensing for agronomic decisions. Agron. J. 2008, 100, 117–131. [Google Scholar]
  2. Inoue, Y.; Sakaiya, E.; Zhu, Y.; Takahashi, W. Diagnostic mapping of canopy nitrogen content in rice based on hyperspectral measurements. Remote Sens. Environ. 2012, 126, 210–221. [Google Scholar] [CrossRef]
  3. Peng, Y.; Gitelson, A.; Sakamoto, T. Remote estimation of gross primary productivity in crops using MODIS 250 m data. Remote Sens. Environ. 2013, 128, 186–196. [Google Scholar] [CrossRef]
  4. Zhong, L.; Gong, P.; Biging, G.S. Efficient corn and soybean mapping with temporal extendability: A multi-year experiment using Landsat imagery. Remote Sens. Environ. 2014, 140, 1–13. [Google Scholar] [CrossRef]
  5. Asaka, D.; Shiga, H. Estimating rice grain protein contents with SPOT/HRV data acquired at maturing stage. J. Remote Sens. Soc. Jpn. 2003, 23, 451–457, (In Japanese with English summary). [Google Scholar]
  6. Sakaiya, E.; Inoue, Y. Operational use of remote sensing for harvest management of rice. J. Remote Sens. Soc. Jpn. 2013, 33, 185–199, (In Japanese with English summary). [Google Scholar]
  7. Wang, J.; Huang, J.; Zhang, K.; Li, X.; She, B.; Wei, C.; Gao, J.; Song, X. Rice fields mapping in fragmented area using multi-temporal HJ-1A/B CCD images. Remote Sens. 2015, 7, 3467–3488. [Google Scholar] [CrossRef]
  8. Inoue, Y.; Sakaiya, E. Relationship between X-band backscattering coefficients from high-resolution satellite SAR and biophysical variables in paddy rice. Remote Sens. Lett. 2013, 4, 288–295. [Google Scholar] [CrossRef]
  9. Inoue, Y.; Sakaiya, E.; Wang, C. Potential of X-band images from high-resolution satellite SAR sensors to assess growth and yield in paddy rice. Remote Sens. 2014, 6, 5995–6019. [Google Scholar] [CrossRef]
  10. Inoue, Y.; Sakaiya, E.; Wang, C. Capability of C-band backscattering coefficients from high-resolution satellite SAR sensors to assess biophysical variables in paddy rice. Remote Sens. Environ. 2014, 140, 257–266. [Google Scholar] [CrossRef]
  11. Hunt, E.R.; Hively, W.D.; Fujikawa, S.J.; Linden, D.S.; David, S.C.; Daughtry, S.T.; McCarty, G.W. Acquisition of NIR-green-blue digital photographs from unmanned aircraft for crop monitoring. Remote Sens. 2010, 2, 290–305. [Google Scholar] [CrossRef]
  12. Duan, S.B.; Li, Z.L.; Wu, H.; Tang, B.H.; Ma, L.; Zhao, E.; Li, C. Inversion of the PROSAIL model to estimate leaf area index of maize, potato, and sunflower fields from unmanned aerial vehicle hyperspectral data. Int. J. Appl. Earth Obs. Geoinf. 2014, 26, 12–20. [Google Scholar] [CrossRef]
  13. Balzarolo, M.; Anderson, K.; Nichol, C.; Rossini, M.; Vescovo, L.; Arriga, N.; Wohlfahrt, G.; Calvet, J.-C.; Carrara, A.; Cerasoli, S.; et al. Ground-based optical measurements at European flux sites: A review of methods, instruments and current controversies. Sensors 2011, 11, 7954–7981. [Google Scholar] [CrossRef] [PubMed] [Green Version]
  14. Gamon, J.A.; Rahman, A.F.; Dungan, J.L.; Schildhauer, M.; Huemmrich, K.F. Spectral Network (SpecNet): What is it and why do we need it? Remote Sens. Environ. 2006, 103, 227–235. [Google Scholar] [CrossRef]
  15. Nasahara, K.N.; Nagai, S. Review: Development of an in situ observation network for terrestrial ecological remote sensing: the Phenological Eyes Network (PEN). Ecol. Res. 2015, 30, 211–223. [Google Scholar] [CrossRef]
  16. Soudani, K.; Hmimina, G.; Delpierre, N.; Pontailler, J.Y.; Aubinet, M.; Bonal, D.; Caquet, B.; de Grandcourt, A.; Burban, B.; Flechard, C.; et al. Ground-based Network of NDVI measurements for tracking temporal dynamics of canopy structure and vegetation phenology in different biomes. Remote Sens. Environ. 2012, 123, 234–245. [Google Scholar] [CrossRef]
  17. Motohka, T.; Nasahara, K.N.; Miyata, A.; Mano, M.; Tsuchida, S. Evaluation of optical satellite remote sensing for rice paddy phenology in monsoon Asia using a continuous in situ dataset. Int. J. Remote Sens. 2009, 30, 4343–4357. [Google Scholar] [CrossRef]
  18. Sakamoto, T.; Gitelson, A.A.; Nguy-Robertson, A.L.; Arkebauer, T.J.; Wardlow, B.D.; Suyker, A.E.; Verma, S.B.; Shibayama, M. An alternative method using digital cameras for continuous monitoring of crop status. Agric. For. Meteorol. 2012, 154–155, 113–126. [Google Scholar] [CrossRef]
  19. Schaaf, C.B.; Gao, F.; Strahler, A.H.; Lucht, W.; Li, X.; Tsang, T.; Strugnell, N.C.; Zhang, X.; Jin, Y.; Muller, J.P.; et al. First operational BRDF, Albedo and Nadir reflectance products from MODIS. Remote Sens. Environ. 2002, 83, 135–148. [Google Scholar] [CrossRef]
  20. Motohka, T.; Nasahara, K.N.; Oguma, H.; Tsuchida, S. Applicability of green-red vegetation index for remote sensing of vegetation phenology. Remote Sens. 2010, 2, 2369–2387. [Google Scholar] [CrossRef]
  21. Nagai, S.; Saitoh, T.M.; Kobayashi, H.; Ishihara, M.; Suzuki, R.; Motohka, T.; Nasahara, K.N.; Muraoka, H. In situ examination of the relationship between various vegetation indices and canopy phenology in an evergreen coniferous forest, Japan. Int. J. Remote Sens. 2012, 33, 6202–6214. [Google Scholar] [CrossRef]
  22. Cogliati, S.; Rossini, M.; Julitta, T.; Meroni, M.; Schickling, A.; Burkart, A.; Pinto, F.; Rascher, U.; Colombo, R. Continuous and long-term measurements of reflectance and sun-induced chlorophyll fluorescence by using novel automated field spectroscopy systems. Remote Sens. Environ. 2015, 164, 270–281. [Google Scholar] [CrossRef]
  23. Rahman, M.M.; Lamb, D.W.; Stanley, J.N. The impact of solar illumination angle when using active optical sensing of NDVI to infer fAPAR in a pasture canopy. Agric. For. Meteorol. 2015, 202, 39–43. [Google Scholar] [CrossRef]
  24. Tucker, C.J. Red and photographic infrared linear combinations for monitoring vegetation. Remote Sens. Environ. 1979, 8, 127–150. [Google Scholar] [CrossRef]
  25. Baez-Gonzalez, A.D.; Kiniry, J.R.; Maas, S.J.; Tiscareno, M.L.; Macias, J.C.; Mendoza, J.L.; Richardso, C.W.; Salinas, J.G.; Manjarrez, J.R. Large-area maize yield forecasting using leaf area index based yield model. Agron. J. 2005, 97, 418–425. [Google Scholar] [CrossRef]
  26. Funk, C.; Budde, M. Phenologically-tuned MODIS NDVI-based production anomaly estimates for Zimbabwe. Remote Sens. Environ. 2009, 113, 115–125. [Google Scholar] [CrossRef]
  27. Nagai, S.; Ishii, R.; Suhaili, A.B.; Kobayashi, H.; Matsuoka, M.; Ichie, T.; Motohka, T.; Kendawang, J.J.; Suzuki, R. Usability of noise-free daily satellite-observed green-red vegetation index values for monitoring ecosystem changes in Borneo. Int. J. Remote Sens. 2014, 35, 7910–7926. [Google Scholar] [CrossRef]
  28. Nkongolo, N.V.; Hatano, R.; Kakembo, V. Diffusivity models and greenhouse gases fluxes from a forest, pasture, grassland and corn field in Northern Hokkaido, Japan. Pedosphere 2010, 20, 747–760. [Google Scholar] [CrossRef]
  29. Ono, K.; Maruyama, A.; Kuwagata, T.; Mano, M.; Takimoto, T.; Hayashi, K.; Hasegawa, T.; Miyata, A. Canopy-scale relationships between stomatal conductance and photosynthesis in irrigated rice. Glob. Change Biol. 2013, 19, 2209–2220. [Google Scholar] [CrossRef] [PubMed]
  30. Matsuura, S.; Miyata, A.; Mano, M.; Hojito, M.; Mori, A.; Kano, S.; Sasaki, H.; Kohyama, K.; Hatano, R. Seasonal carbon dynamics and the effects of manure application on carbon budget of a managed grassland in a temperate, humid region in Japan. Grassl. Sci. 2014, 60, 76–91. [Google Scholar] [CrossRef]
  31. Harris, A.; Gamon, J.A.; Pastorello, G.Z.; Wong, C.Y.S. Retrieval of the photochemical reflectance index for assessing xanthophyll cycle activity: A comparison of near-surface optical sensors. Biogeosciences 2014, 11, 6277–6292. [Google Scholar] [CrossRef]
  32. Application Notes Sensors for NDVI Calculations. Available online: http://www.skyeinstruments.com/wp-content/uploads/Application-Notes-for-NDVI.pdf (accessed on 17 August 2015).
  33. Jacquemoud, S.; Verhoef, W.; Baret, F.; Bacour, C.; Zarco-Tejada, P.J.; Asner, G.P.; Francois, C.; Ustin, S.L. PROSPECT + SAIL models: A review of use for vegetation characterization. Remote Sens. Environ. 2009, 113, S56–S66. [Google Scholar] [CrossRef]
  34. Verhoef, W. Light scattering by leaf layers with application to canopy reflectance modeling: The SAIL model. Remote Sens. Environ. 1984, 16, 125–141. [Google Scholar] [CrossRef]
  35. Verhoef, W. Earth observation modeling based on layer scattering matrices. Remote Sens. Environ. 1985, 17, 165–178. [Google Scholar] [CrossRef]
  36. Jacquemoud, S.; Baret, F. PROSPECT: A model of leaf optical properties spectra. Remote Sens. Environ. 1990, 34, 75–91. [Google Scholar] [CrossRef]
  37. Jacquemoud, S.; Bacour, C.; Poilvé, H.; Frangi, J.-P. Comparison of four radiative transfer models to simulate plant canopies reflectance: direct and inverse mode. Remote Sens. Environ. 2000, 74, 471–481. [Google Scholar] [CrossRef]
  38. Wu, C.; Niu, Z.; Tang, Q.; Huang, W. Estimating chlorophyll content from hyperspectral vegetation indices: Modeling and validation. Agric. For. Meteorol. 2008, 202, 39–43. [Google Scholar] [CrossRef]
  39. Lacaze, R.; Chen, J.M.; Roujean, J.L.; Leblanc, S.G. Retrieval of vegetation clumping index using hot spot signatures measured by POLDER instrument. Remote Sens. Environ. 2002, 79, 84–95. [Google Scholar] [CrossRef]
  40. Epiphanio, J.C.N.; Huete, A.R. Dependence of NDVI and SAVI on sun/sensor geometry and its effect on fAPAR relationships in Alfalfa. Remote Sens. Environ. 1995, 51, 351–560. [Google Scholar] [CrossRef]
  41. Haltrin, V.I. Absorption and scattering of light in natural waters. In Light Scattering Reviews: Single and Multiple Light Scattering; Kokhanovsky, A.A., Ed.; Springer-Praxis: Berlin, Germany, 2006; pp. 445–486. [Google Scholar]
  42. Fensholt, R.; Sandholt, I. Evaluation of MODIS and NOAA AVHRR vegetation indices with in situ measurements in a semi-arid environment. Int. J. Remote Sens. 2005, 26, 2561–2594. [Google Scholar]
  43. Huber, S.; Tagesson, T.; Fensholt, R. An automated field spectrometer system for studying VIS, NIR and SWIR anisotropy for semi-arid savanna. Remote Sens. Environ. 2014, 152, 547–556. [Google Scholar] [CrossRef]
  44. Strachan, I.B.; Pattey, E.; Boisvert, J.B. Impact of nitrogen and environmental conditions on corn as detected by hyperspectral reflectance. Remote Sens. Environ. 2002, 80, 213–224. [Google Scholar] [CrossRef]
  45. Inoue, Y.; Peñuelas, J.; Miyata, A.; Mano, M. Normalized difference spectral indices for estimating photosynthetic efficiency and capacity at a canopy scale derived from hyperspectral and CO2 flux measurements in rice. Remote Sens. Environ. 2008, 112, 156–172. [Google Scholar] [CrossRef]

