1. Introduction
Underground coal fires are the cause of remarkable losses of coal resources and serious environmental problems, such as the emission of CO
2 and other noxious gasses, land subsidence and heavy metal contamination [
1,
2,
3,
4]. Estimating the volume lost from coal seams is a preliminary step for the evaluation of both the coal resource loss and the greenhouses gas (GHG) emissions.
We tried to estimate the annual emission of GHG caused by coal fires at the coal field scale. As suggested by Van Dijk
et al. [
5], the methods for the quantification of coal-fire-related GHG emissions can be grouped into three types: direct measurements of gas emission fluxes extrapolated to estimate the total gas emissions; calculation of the burnt volume of coal based on mining knowledge and 3D modeling of the coal seam and strata, and conversion of that volume to an estimate of gas emissions; and calculation of the amount of subsurface burning coal based on the energy release. These three methods are dependent on different basic data, such as in situ gas flux monitoring figures, the volume loss reported by coal production authorities and ground truth data about the energy release. A previous study used measured dynamic closed chamber data to interpolate the CO
2 flux in a coal fire area [
6]. The processing of TIR imagery to estimate energy emissions from a fire is another quantitative way to estimate the amount of burned coal. The coal consumption rate could be estimated based on the energy release values derived from thermal infrared imaging and the average heating value of subbituminous coals [
7]. In this research, we chose to estimate GHG emissions using thermal-infrared-image-based coal seam volume loss calculation, which is an alternative approach for estimating GHG emissions that does not depends on reports from coal companies and is a relatively economical way to scientifically estimate GHG emissions based on reliable geological data compared to relatively expensive gas monitoring and the likely exaggerated data about the coal resources that are influenced by a coal fire. Carbon dioxide (CO
2) and methane (CH
4) are the primary GHGs emitted by coal burning and are considered GHGs by the Kyoto Protocol. The atmospheric warming (greenhouse effect) caused by CH
4 is 21~23 times stronger than that due to CO
2. Thus, CH
4 is very important in GHG emission studies. However, CH
4 makes up a proportion of the GHGs from coal fire vents. We estimated an empirical ratio of the CH
4 emission to the CO
2 emission from coal fire vents (called the “CH
4 emission factor” in the following sections) based on the literature. From Carras
et al. [
8], an average CH
4 emission factor 0.62% was calculated for active spontaneous combustion regions; Engle
et al. [
9] estimates the CH
4 emission factor using ground-based and airborne methods for the Welch Ranch site at 0.33%; Van Dijk
et al. [
5] used 0.3% as the default CH
4 emission factor. We obtained a median value of 0.46% in this study. This figure is very close to the CH
4 emission factor of 0.45% found in gas chromatography analyses of samples from coal fire vents in October 2012 and was used for the calculation of the CO
2 emission equivalent. We propose a GHG emission estimation model based on thermal infrared remote sensing change detection and experimental combustion data.
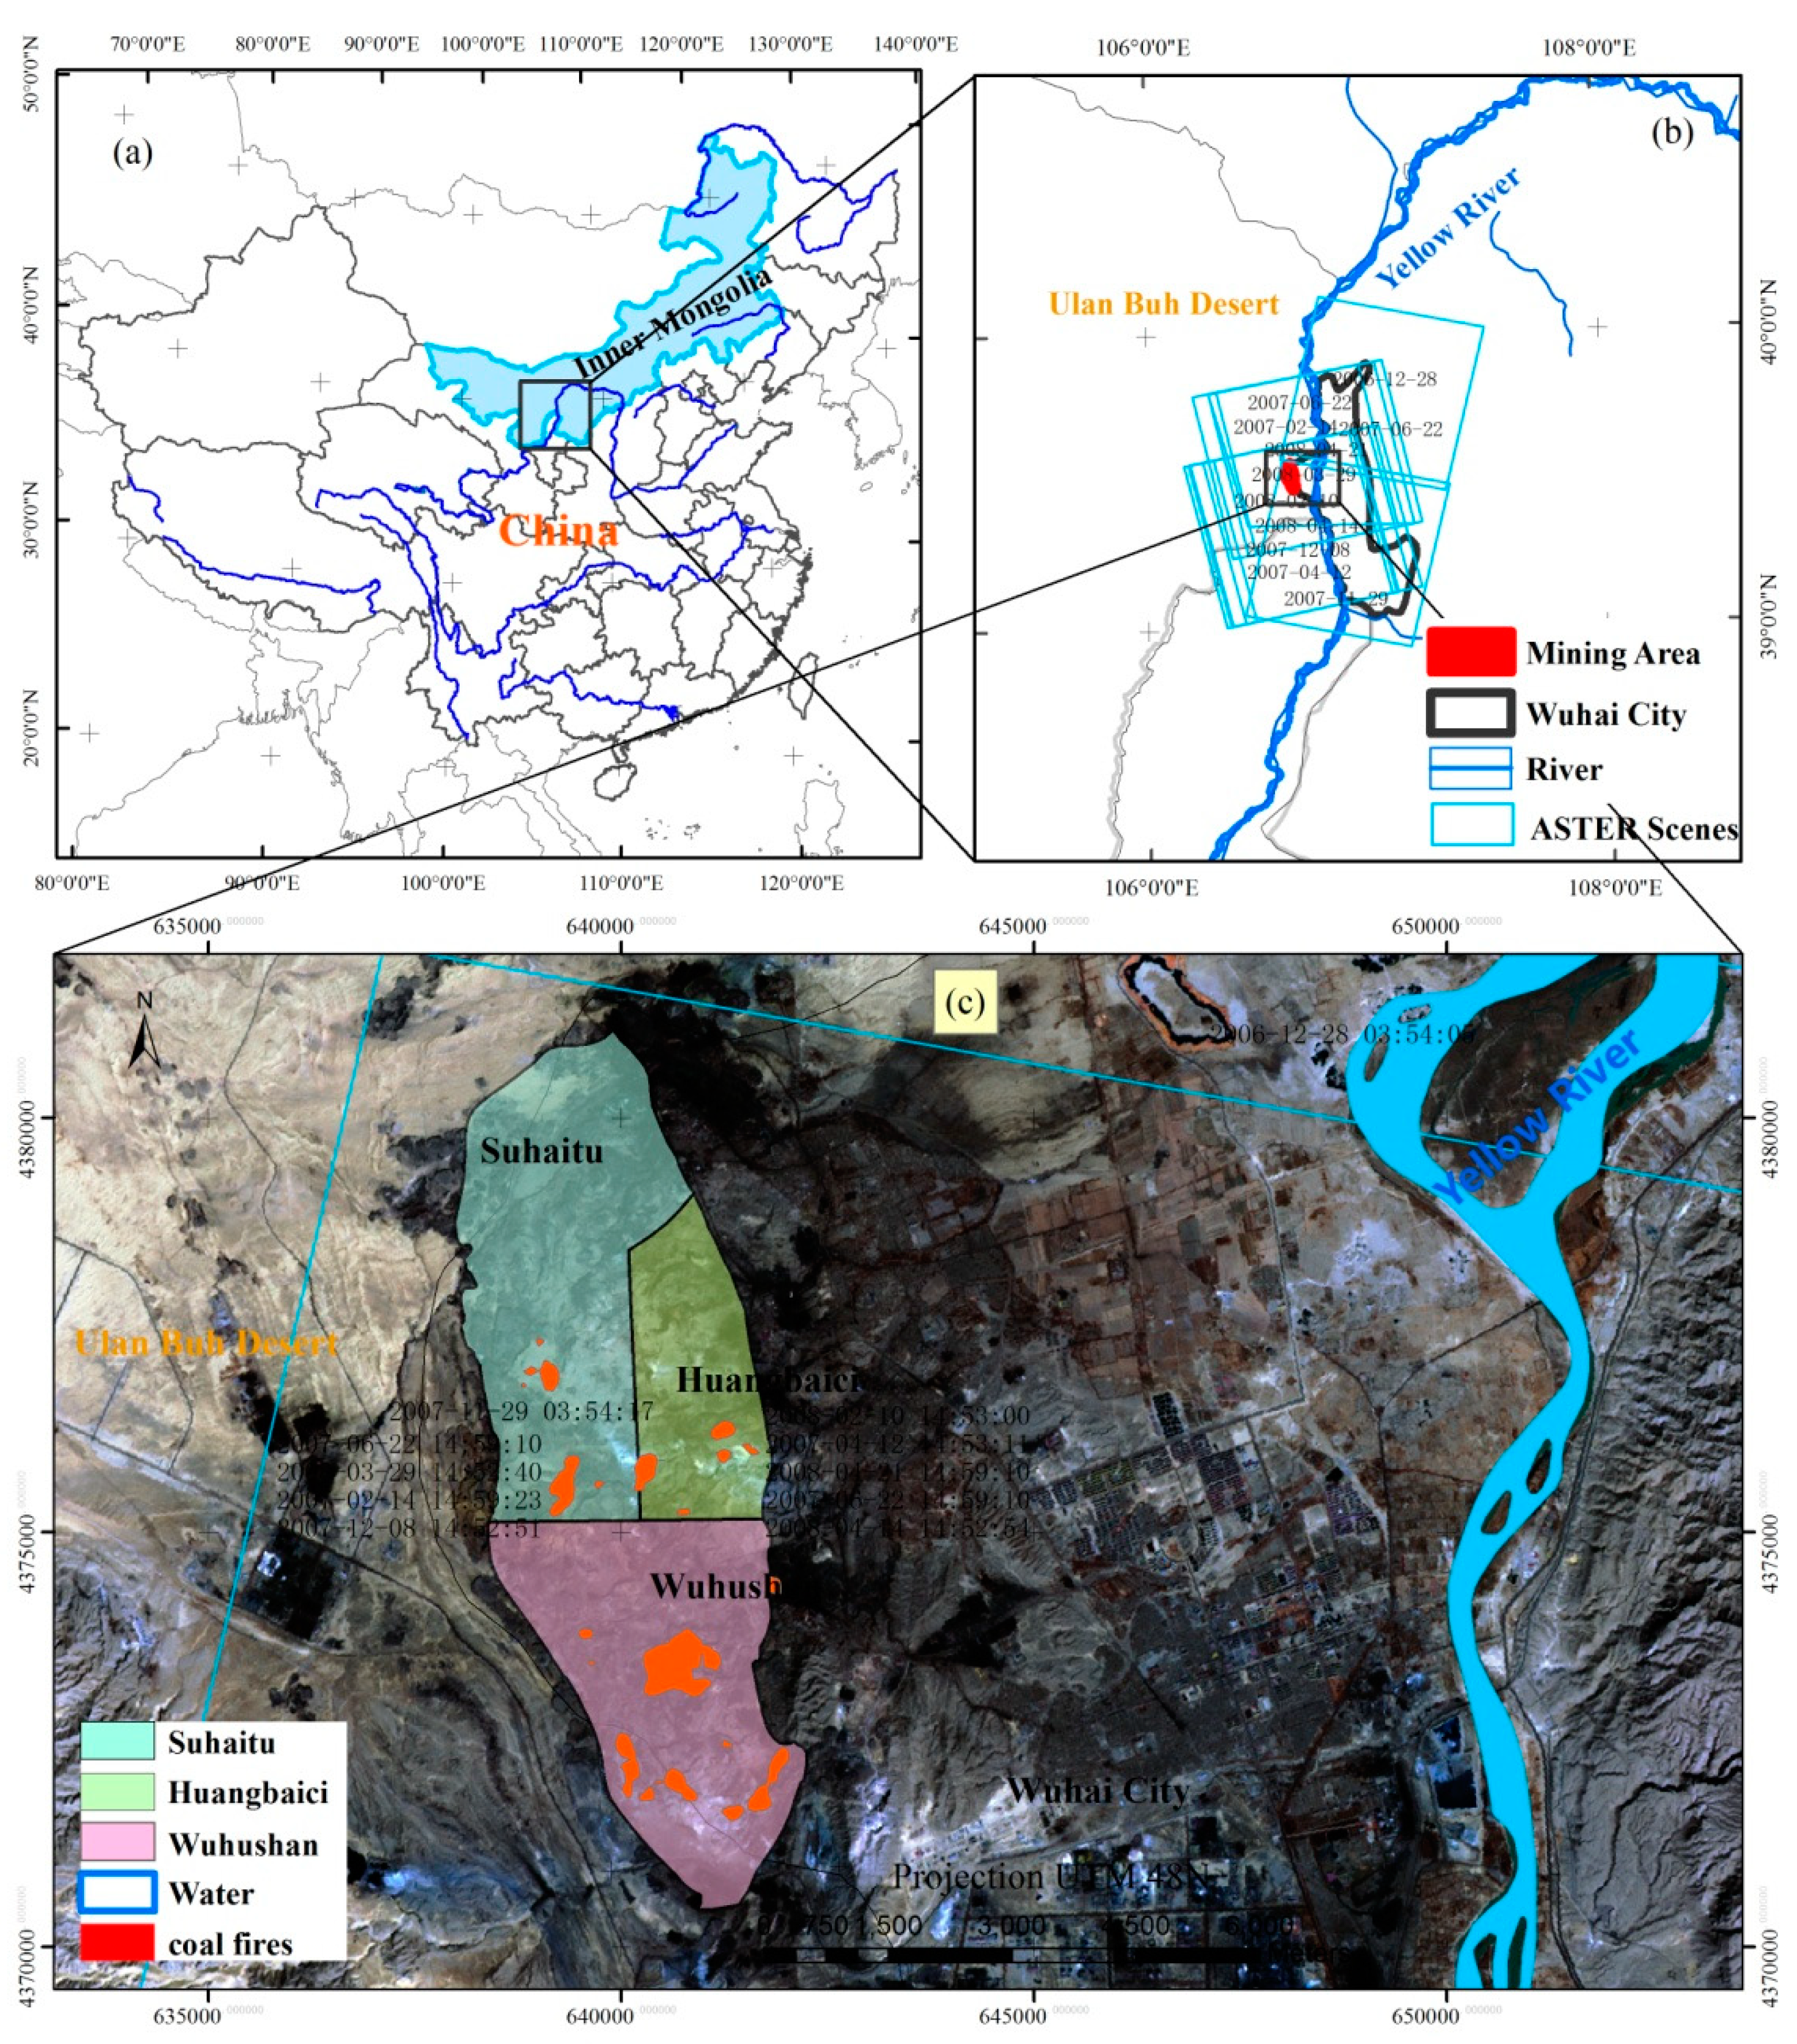
In the change detection step, we propose monitoring the areas of change in the Wuda coal field using the coal influenced by fire in a multi-temporal image sequence to estimate the amount of coal lost during the study period. Temporally estimating the area of change based on a time series of remote sensing images is a convenient and economical approach. In this study, images representing a 480-day period from 28 December 2006 to 21 April 2008 were selected to monitor the changes in the burned area in the Wuda coal field. Within this period, 11 sets of images (two during the day and nine at night) are available for the study area in the ASTER inventory. Most of these are ideal nighttime thermal infrared (TIR) images with a 90-m resolution. The ASTER thermal infrared bands were adopted as the main data source and were combined with the published ancillary data, geological maps and mining productivity figures. The accuracy of the estimated area of change is highly dependent on the spatial accuracy and temporal resolution of the images. The relatively coarse resolution of the ASTER thermal images necessitated image-to-image geocorrection, which reduced the notable offset between different images.
The change detection analysis attempted to assess the annual GHG emission intensity caused by spontaneous combustion in coal reservoirs and the migration trends of fire centers in this coal field. Using TIR imagery, the changes that occurred over a time series of images were identified, and patterns of growth, stability or shrinkage of burned areas were identified. A change-detection-based, three-stage model was proposed to divide the different burning phases into these three stages; we reviewed different classification schemes in a previous publication. Zhang divided coal fire development into 12 stages [
3]. However, in stages I, II and III, there are no surface temperature anomalies; thus, we adopted stage IV (the stage of forming burning centers) as the coal fire “growth” stage with a combustion temperature of 400–600 °C and a 5–10 °C positive surface temperature anomaly. Stages V~VIII are the phases from the formation of a combustion system to stable burning with a combustion temperature of 600 °C or greater and a surface temperature increase of 5–40 °C, which correspond to our stage labeled “stability”. From stage IX to stage XI (formation of pyro-metamorphic rocks and fumarolic minerals), we called these stages “shrinkage” due to the decrease in surface temperature, with an average combustion temperature of 400–600 °C and a 5–10 °C positive surface temperature anomaly. Because the extinction in stage XII cannot be detected using TIR images, we have not included it in our model. This three stages scheme is similar to the classification of Kuenzer
et al., who proposed a five-stage classification system (newly ignited fires (NF), accelerating fires (AF), consistently burning fires (CF), slowly burning out fires (SF), and extinct fires (EF)) based on the burning intensity [
10]. We combined NF and AF as the “growth” stage; CF corresponded to our “stability” stage; and SF and EF were combined into the “shrinkage” stage. Our combustion experiment was designed to measure the CO
2 emission rates for different combustion temperature ranges. We calculated two CO
2 emission rates for the temperature ranges 400–600 °C and 600–800 °C in our model. Using the five-stage classification Kuenzer
et al. observed dynamical coal fire development stages for 20 coal fire zones in the Wuda coal field over the period 2001–2005 [
10], which was used as a cross validation in our study to estimate the coal fire life cycle proportions for different developmental stages of coal fires. Based on the life cycle of a coal fire, the time periods for the three stages of growth, stability and shrinkage were calculated, and diurnal burning rates were generated for these three stages. Long-term or annual coal loss was calculated by multiplying the diurnal burning rate for different combustion stages using the time interval, the affected areas for different combustion stages, the average coal seam thickness, the average coal intensity, the coal mining remain rate and the loss of ignition (LOI). The subsurface burning process is complex. The feasibility of estimating the burnt coal and the equivalent emissions is based on complete oxidation of the carbon in the fire-influenced coal under an estimated average combustion efficiency, corrected by the value of the ash content and the average CH
4 content. Thus, the CO
2 emission equivalent for complete combustion was estimated.
3. Results and Discussion
3.1. Time Series Analysis
The aforementioned change detection algorithm was applied to the eight selected scenes spanning the observation period (from 28 December 2006 to 21 April 2008) to retrieve the change data for the study area (
Table 2). During the study period, the total area of coal fires in the Wuda coal field fluctuated from 178.20 hectares to 219.51 hectares (average = 176.48 hectares) over one year period (480 days).
A relative time system using 28 December 2006 as the orientation day was defined, and the time elapsed between this orientation date and the image acquiring date was used to indicate the timespan (in day). Seven pairs of temporally adjacent images were processed for change detection (
Table 2). Each of them has an initial day and a final day, and the day midway between the two for each change comparison, in the relative time system mentioned above, was used to represent the day that the change occurred.
Table 2.
Changes between temporally adjacent pairs of images.
Table 2.
Changes between temporally adjacent pairs of images.
| No. | Scene A (initial) | Scene B (final) | Time Interval between A&B (days) | Increase (ha, Blue) | Decrease (ha, Green) | Stable (ha,Orange) | Total Area of B (ha, Black) | Day for Scene B | Day for Midway between Scenes A and B |
|---|
| 0 | -- | ASTL1A_0612280354140701010054 | -- | -- | -- | -- | 1,782,000 | 0 | -- |
| 1 | ASTL1A_0612280354140701010054 | ASTL1A_0702141459230702170550 | 48 | 696,600 | 648,000 | 745,200 | 1,628,100 | 48 | 24 |
| 2 | ASTL1A_0702141459230702170550 | ASTL1A_0704121453110704150513 | 58 | 801,900 | 494,100 | 947,700 | 1,798,200 | 106 | 77 |
| 3 | ASTL1A_0704121453110704150513 | ASTL1A_0706221459100706250481 | 71 | 1,166,400 | 834,300 | 963,900 | 1,287,900 | 177 | 142 |
| 4 | ASTL1A_0706221459100706250481 | ASTL1A_0711291458560806290389 | 160 | 340,200 | 712,800 | 1,417,500 | 1,757,700 | 337 | 257 |
| 5 | ASTL1A_0711291458560806290389 | ASTL1A_0802101453000903080806 | 72 | 712,800 | 340,200 | 1,417,500 | 2,130,300 | 409 | 373 |
| 6 | ASTL1A_0802101453000903080806 | ASTL1A_0803291452400904260636 | 47 | 599,400 | 534,600 | 1,595,700 | 2,195,100 | 456 | 433 |
| 7 | ASTL1A_0803291452400904260636 | ASTL1A_0804211459100804240676 | 24 | 340,200 | 996,300 | 1,198,800 | 1,539,000 | 480 | 468 |
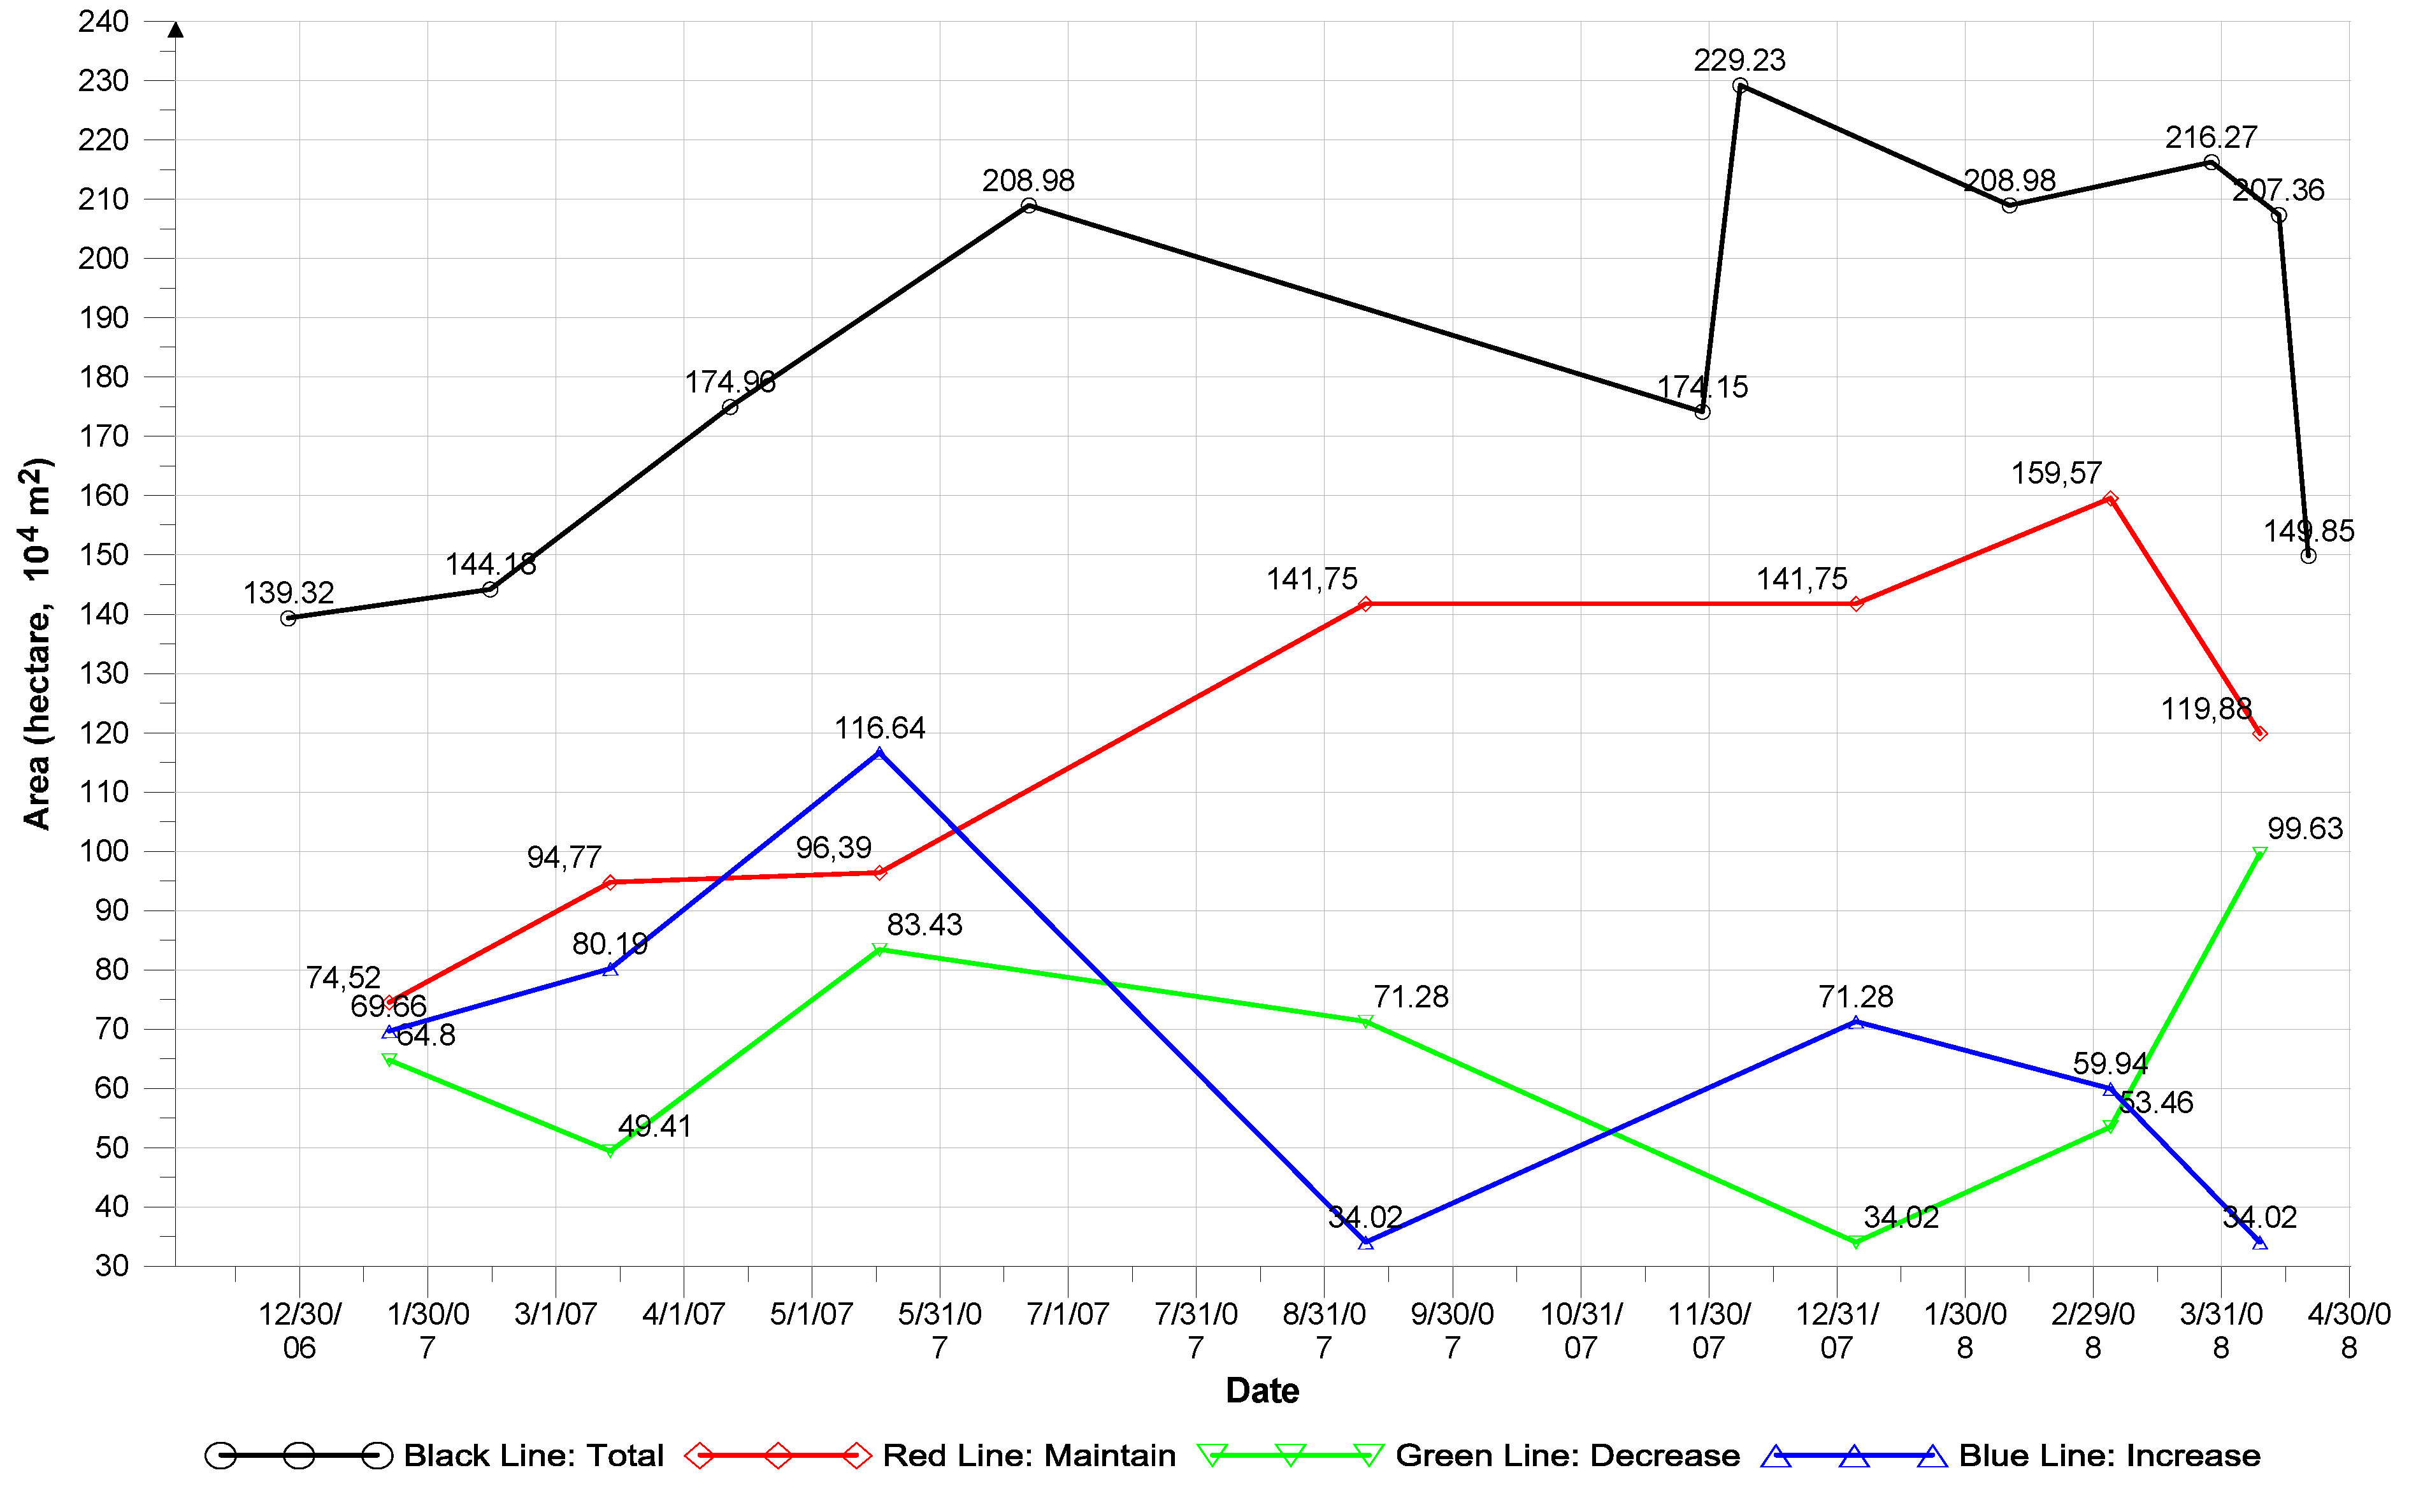
To visualize these changes, a time series analysis covering the timespan of all utilized images (December 2006–April 2008) was performed to illustrate the trends in the coal fire area: growth, stagnation, and shrinkage. In
Figure 3, the red line represents the area of ongoing burning in this period over time, which gradually increased and then decreased; the blue line represents the change in the area of new fires, or fire propagation; and the green line represents areas of decrease, which we associate with shrinking/extinguished fires. The total burning area is indicated by the black line, which indicates the intensity of the fire burning in this coal field.
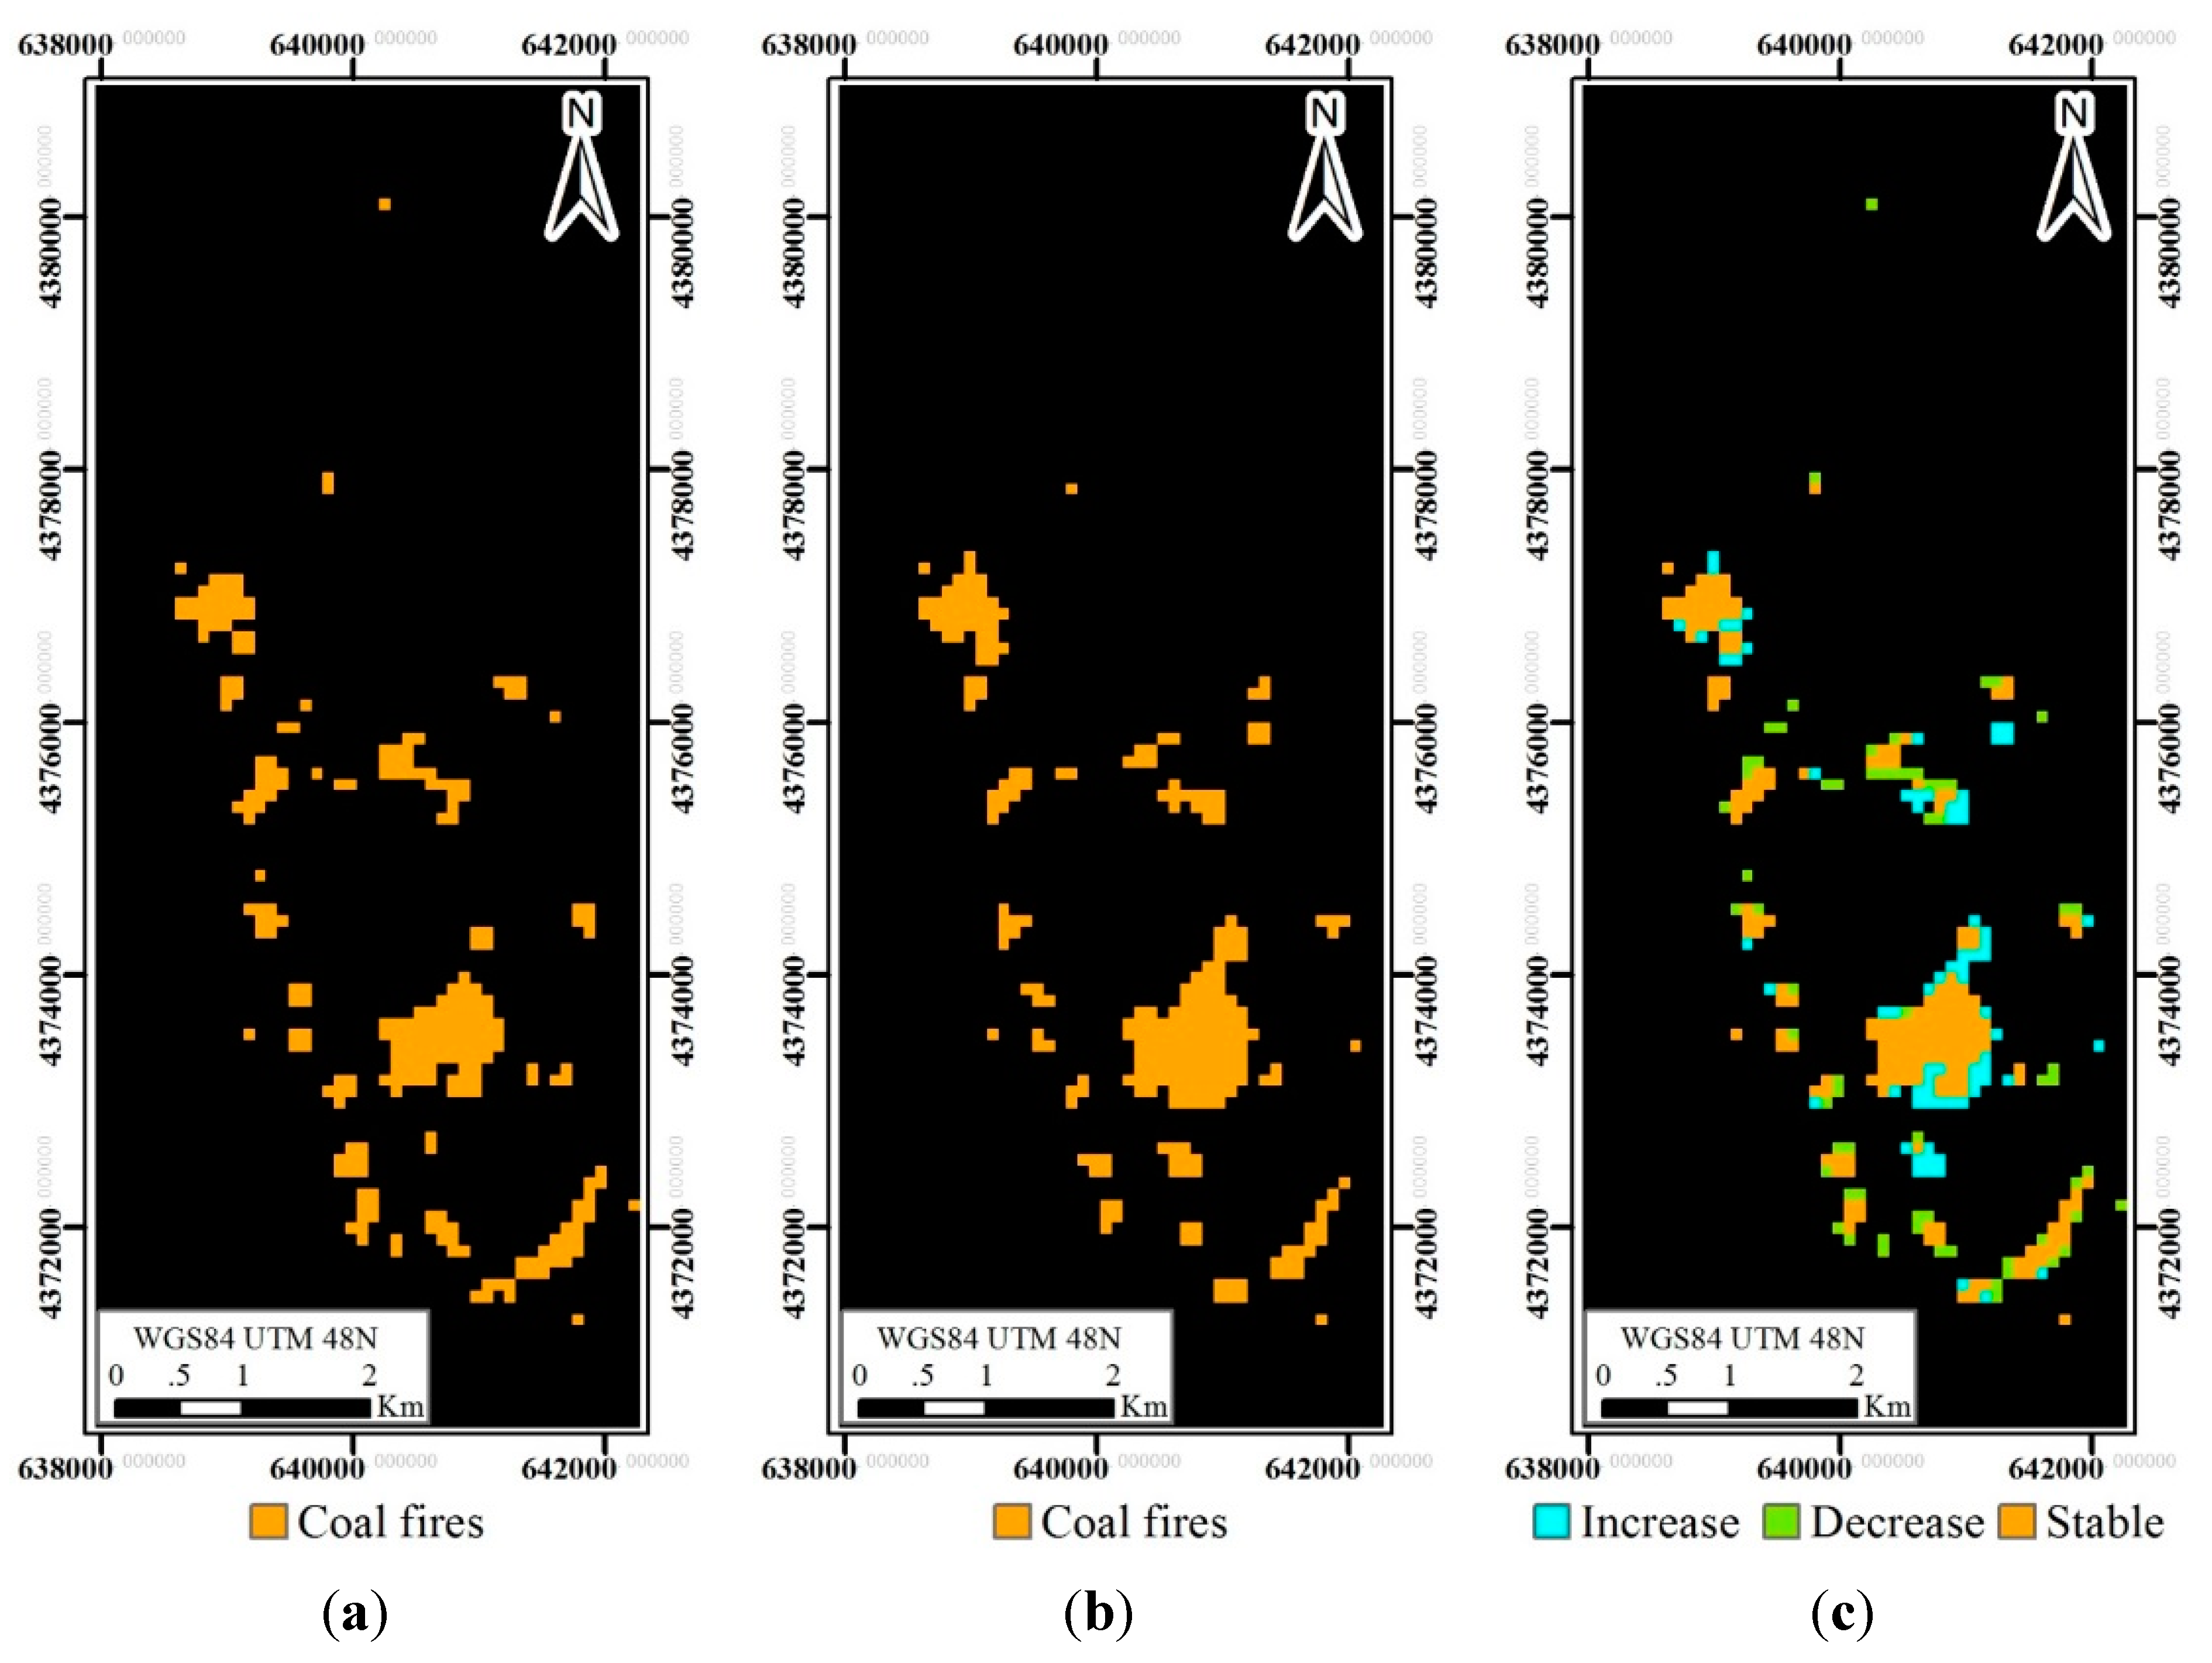
3.2. One-Year Coal Fire Area Maps
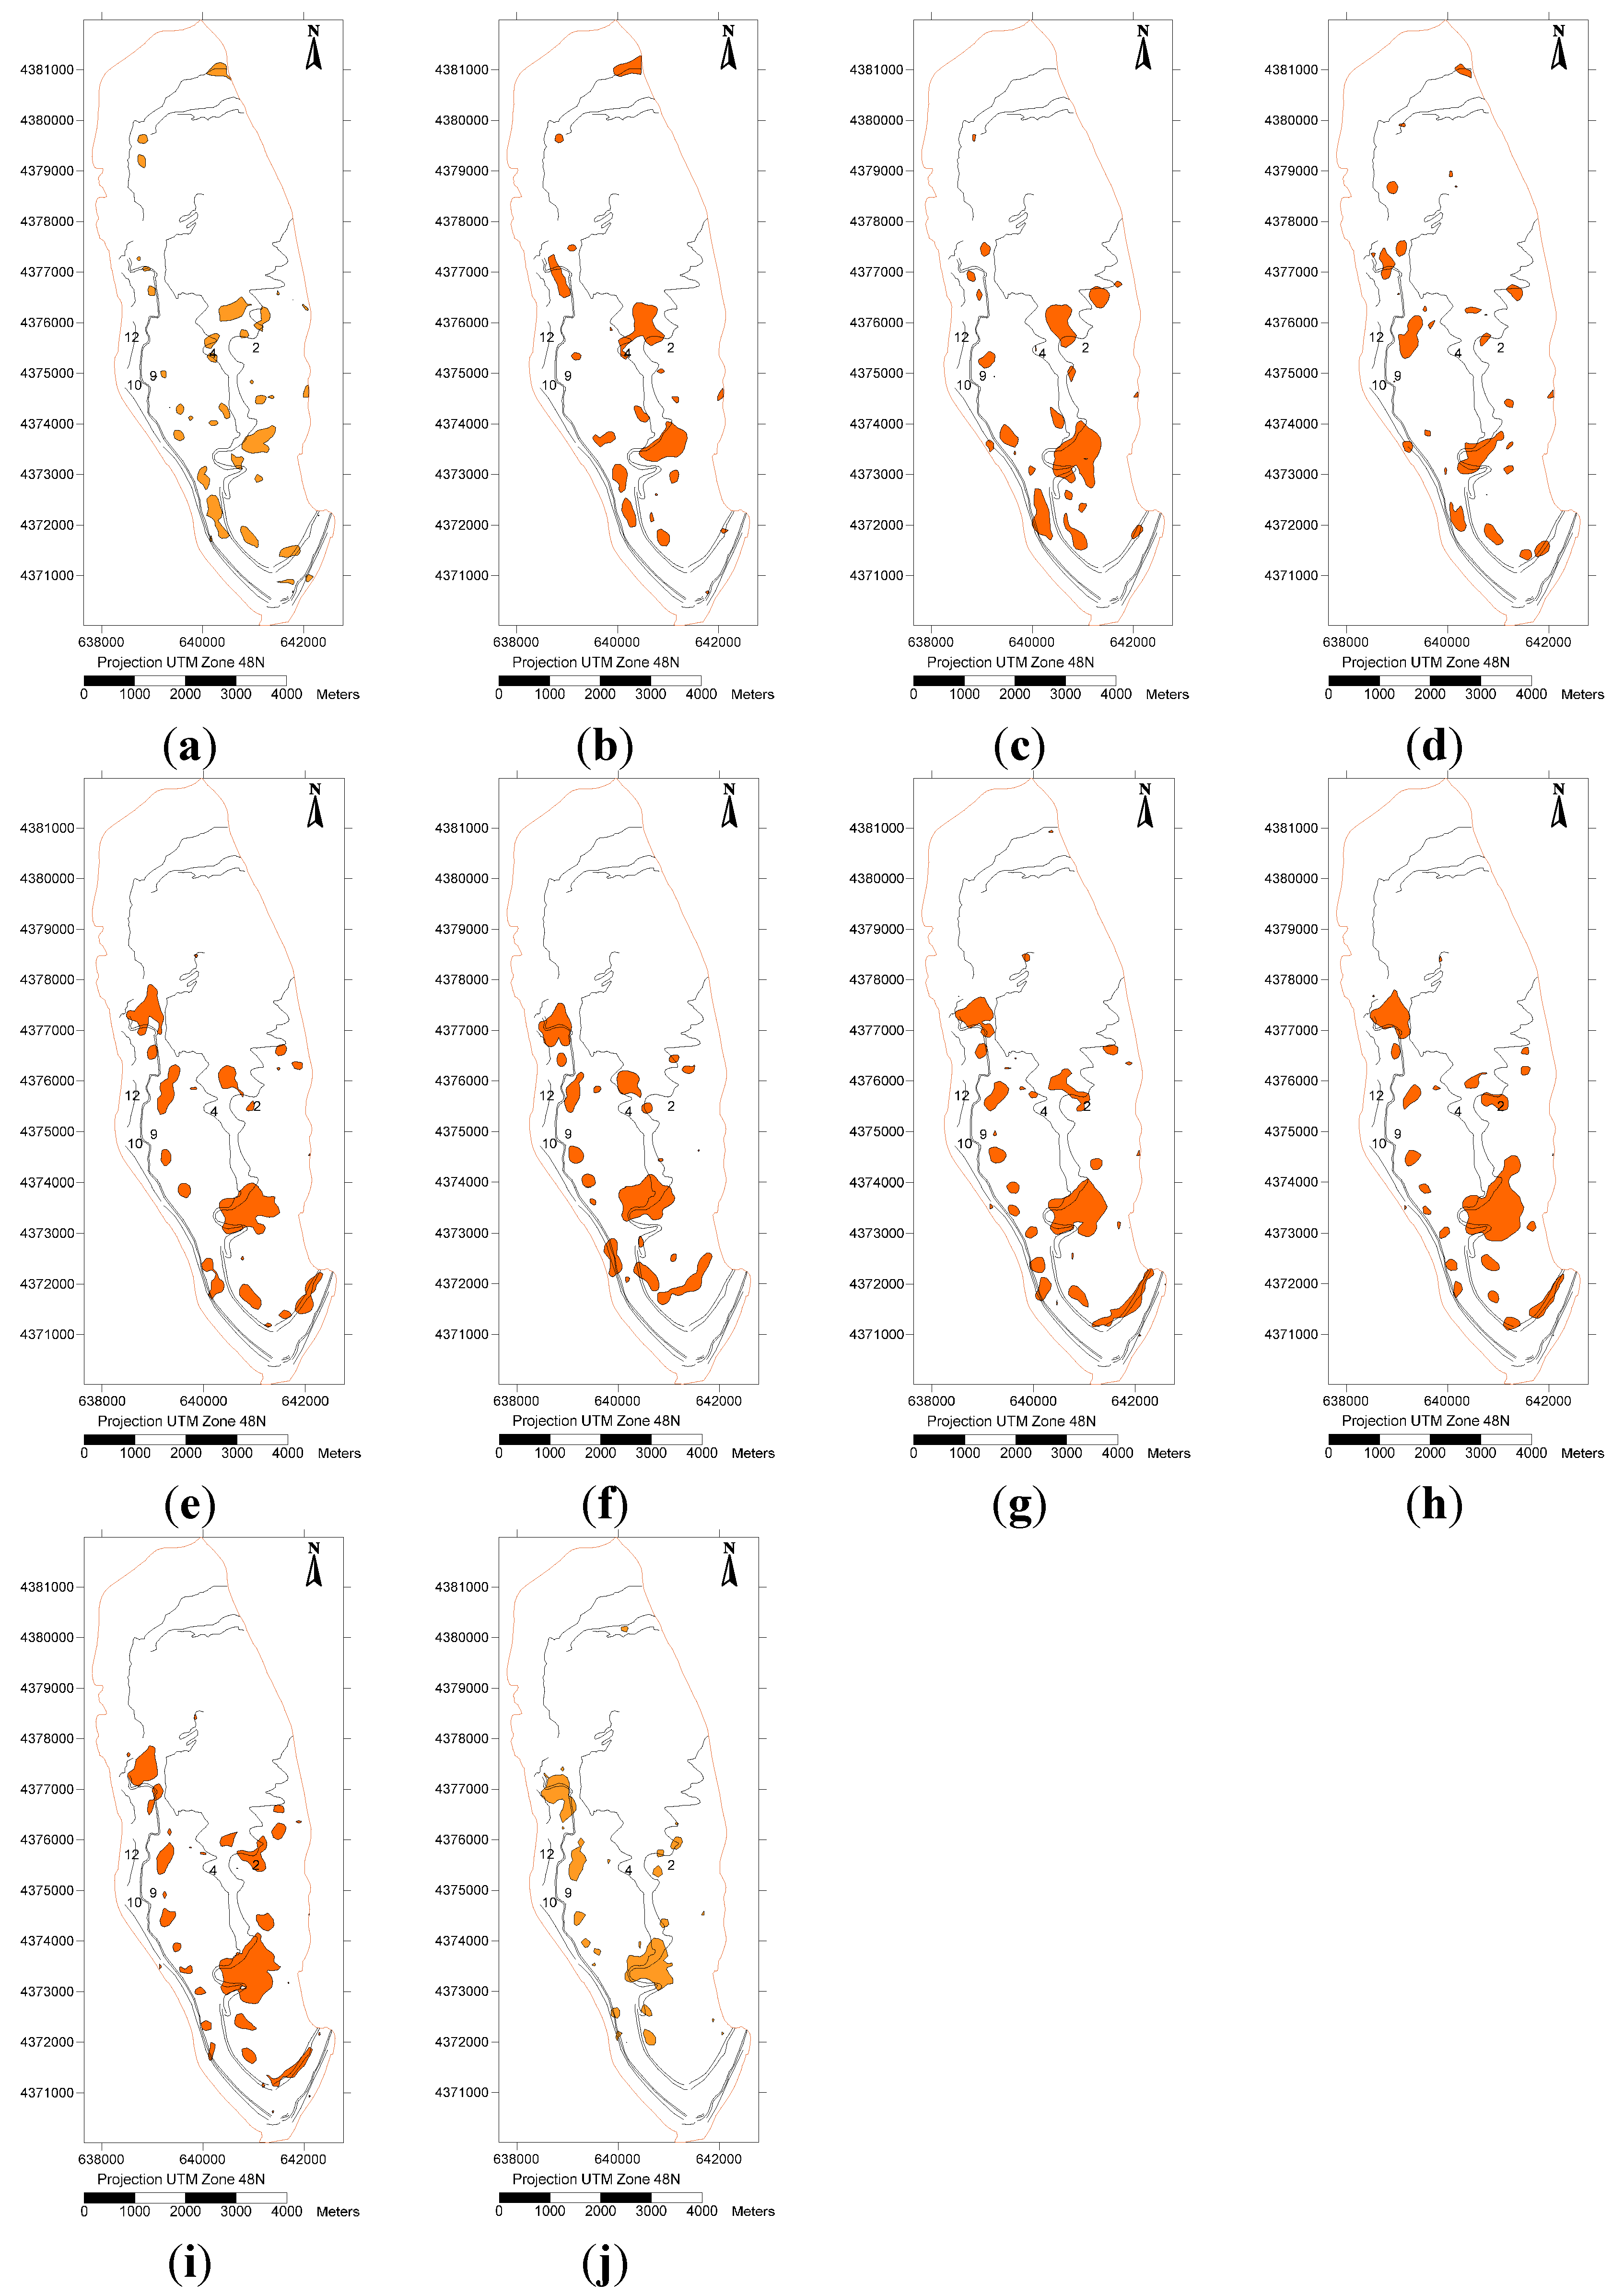
Following the SAGBT method, the coal fires were differentiated using the temperature thresholds. We mapped these anomalies using the boundaries of the coal field and the coal seam outcrops. As shown in
Figure 4, we observed that the coal fire regions are distributed along the coal seam outcrop lines, especially outcrop numbers 2, 4, 9, 10 and 12, which means that the coal fires are likely to occur in shallow coal seams. The fires in the Suhaitu Coal Mine in the northern part of the coal field were almost extinguished, and most of the fires were distributed in the central and southern parts of the coal field. The total area and the locations of the coal fires changed during the observation period.
The coal fire maps represented the static spatial pattern and characterize how these coal fires distributed and generally shifted over time. However it is necessary to monitor the fire centers for discovering more detailed trends of coal fire migration.
Figure 3.
Increasing, decreasing and stable areas of burning in the study period from 28 December 2006 to 21 April 2008.
Figure 3.
Increasing, decreasing and stable areas of burning in the study period from 28 December 2006 to 21 April 2008.
3.3. Fire Center Migration Maps
We traced the fire centers,
i.e., the centers of the high-temperature spots, which indicate burning in the thermal images. During the study period, we observed two relatively large coal fire areas: the middle sections of coal fire zones No. 8 and No. 11 (called by the fire-extinguishing administrator by the Wuda Energy Company). These two fire zones typically represented the coal fire areas for coal seams No. 9 and 10 and No. 2 and 4, respectively. We marked the highest-temperature points for these two fire zones in every image and connected the time series of points using oriented lines. These lines trace the movement of the fire centers (
Figure 5).
Figure 4.
Thermal anomaly maps for the period 28 December 2006–21 April 2008 in the Wuda coal field. The dates of these maps (dd/mm/yyyy) are as follows: (a) 28 December 2006; (b) 14 February 2007; (c) 12 April 2007; (d) 22 June 2007; (e) 29 November 2007; (f) 8 December 2007; (g) 10 February 2008; (h) 29 March 2008; (i) 14 April 2008; (j) 21 April 2008. The orange areas present thermal anomalies that could indicate underground coal fires. Solid black lines demarcate the outcrops of coal seams numbered from east to west, 2,4,9,10,12.
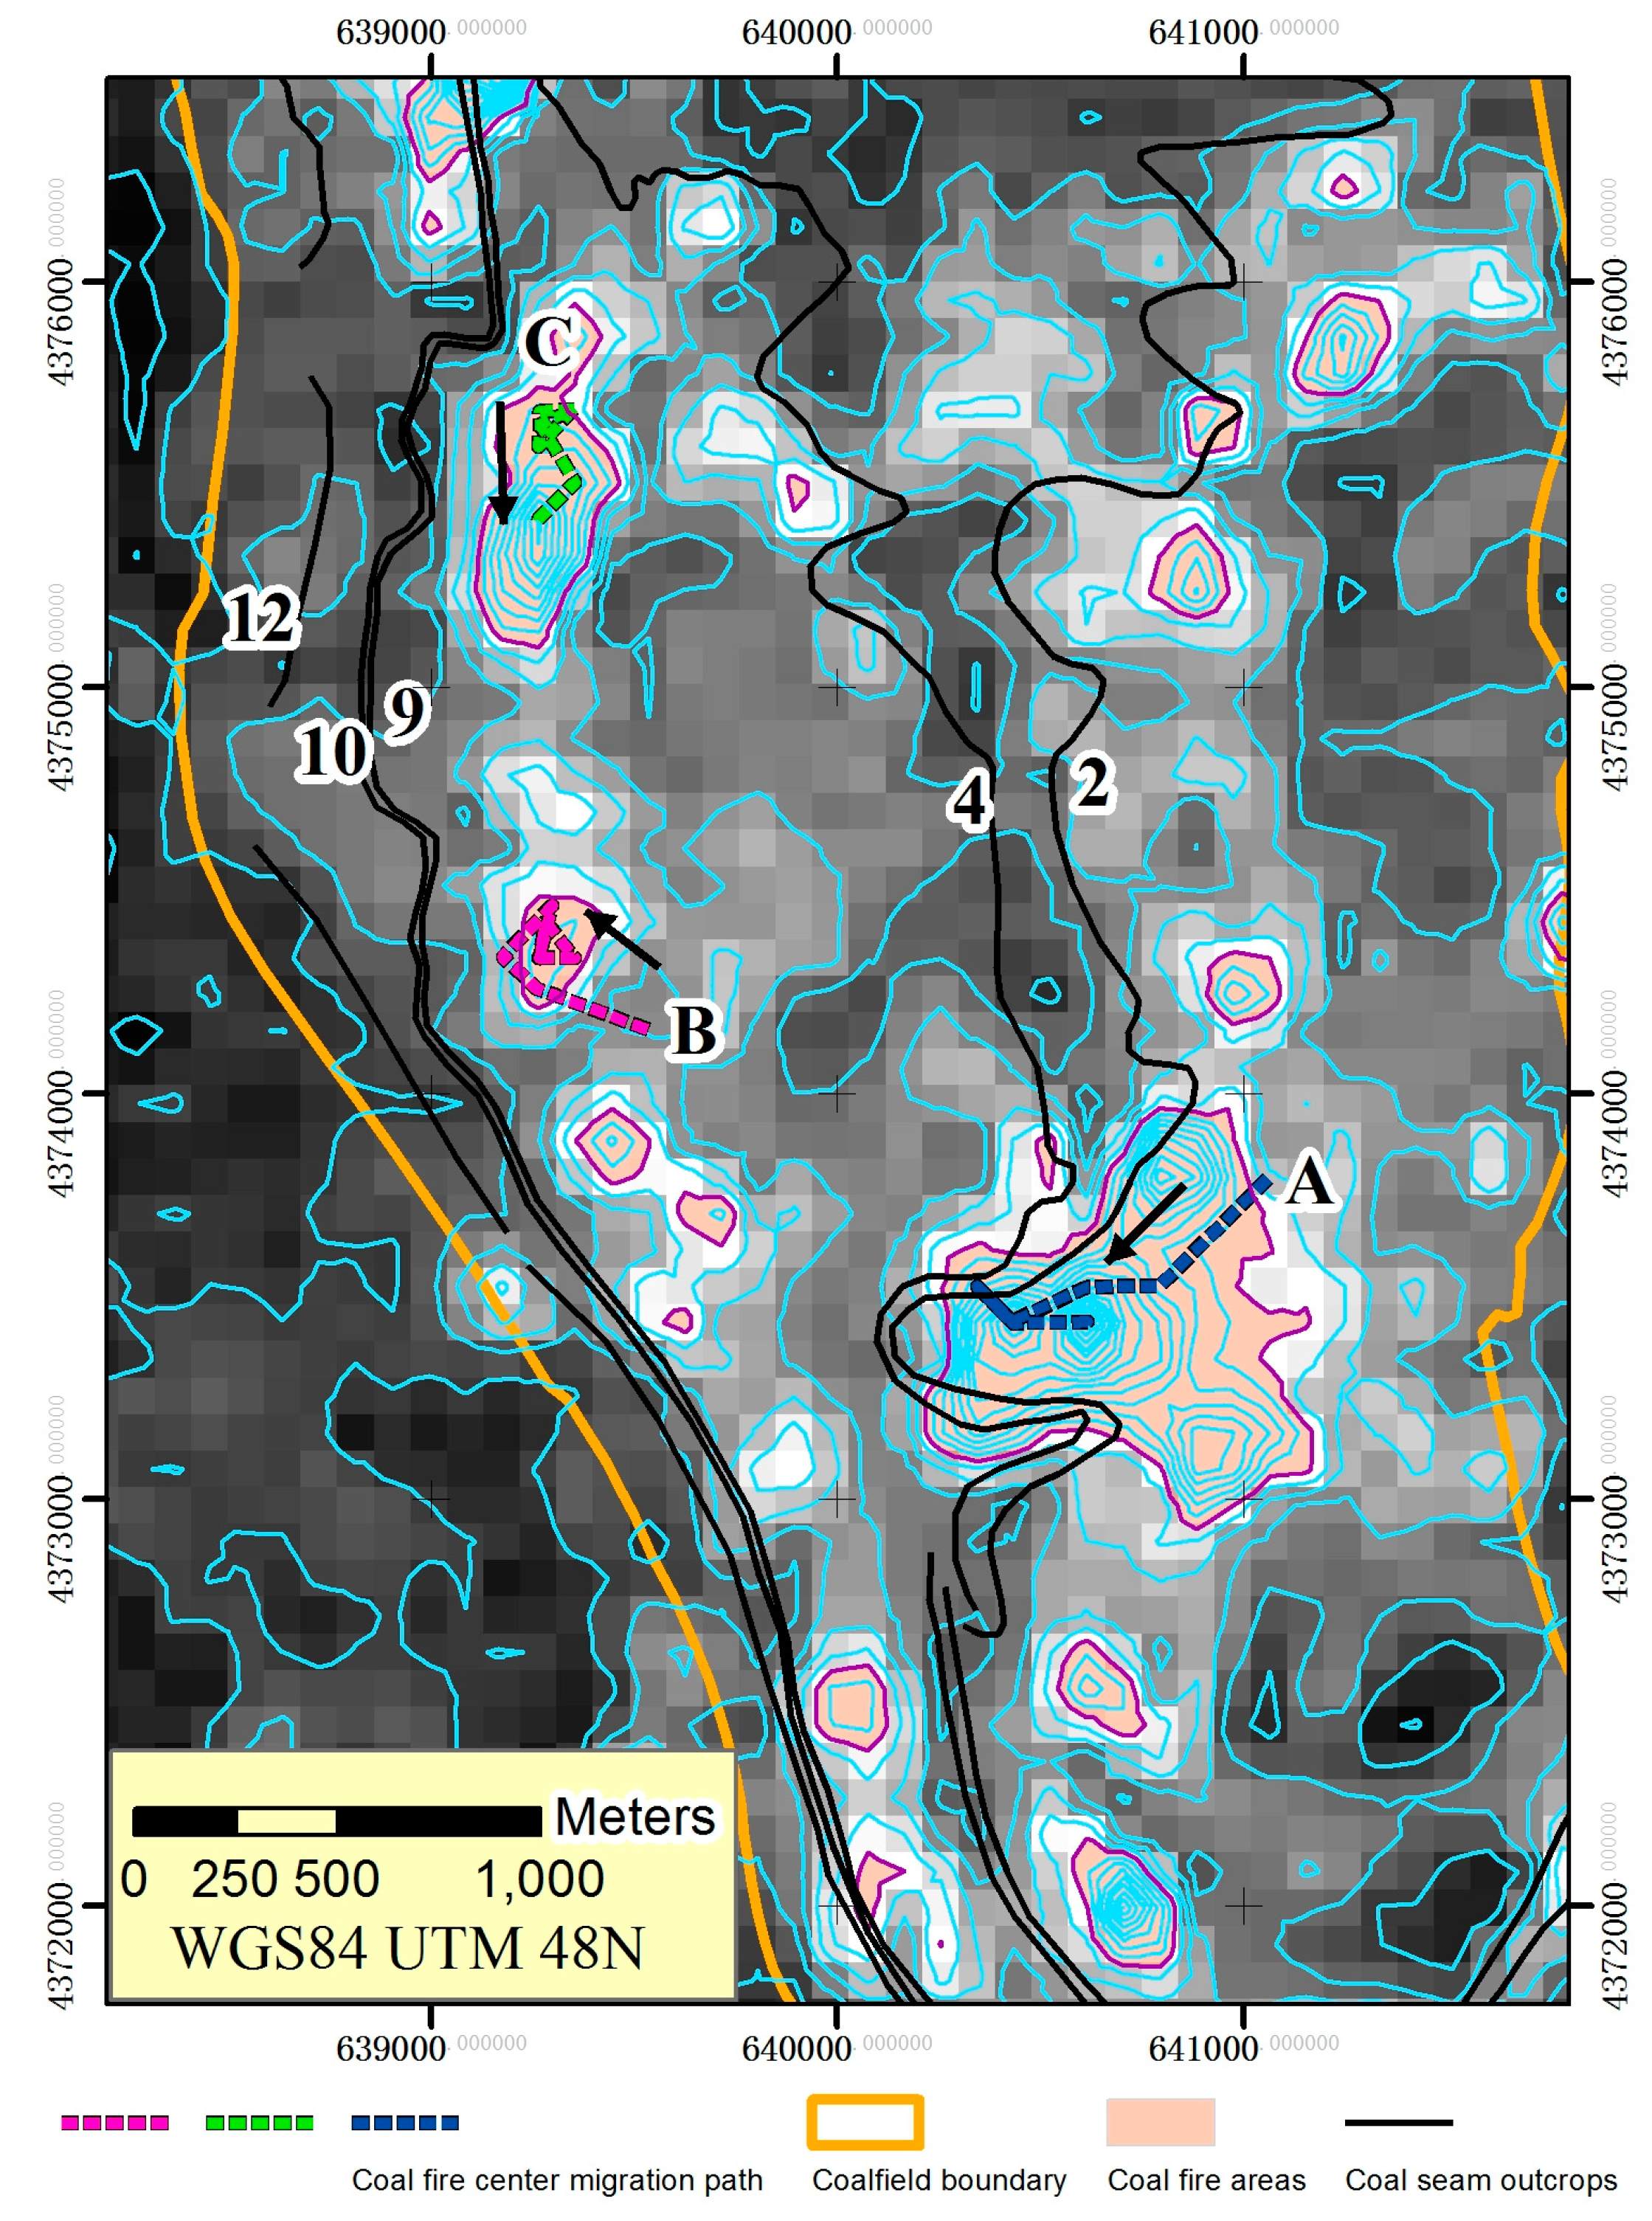
Figure 5.
The migration map of the fire centers. The point with the highest temperature in the coal fire area is considered the fire center. The background temperature, coal fire areas, and contours correspond to 21 April 2008. (A) The fire center in coal fire zone 11 migrated from east to west (from a deep part to a shallow part); (B) the fire center in coal fire area No. 8 moved from east to west (from a deep part to a shallow part); (C) the fire center in coal fire area No. 8 moved from north to south, along the coal seam outcrops or a coal seam strike.
As shown in
Figure 5, fire center A moved within the largest coal fire area (fire zone No. 11). In the period from late 2006 to early 2008, this center moved from the east to the west, corresponding to a shift from a deep to a shallow area of the seam. We deduced that the coal fires were first ignited deep in the coal seam rather than in the exposed outcrops. Otherwise, the coal fire center would have moved along the coal seam from a shallow area to a deeper area. In a technical report, Shenhua reported that the fire in Zone 11, where center A was located, had a maximum burning depth of 76 m below surface [
20]. We infer that these coal fires could be ignited from closed former goaf, where the residual high-sulfur-content coal is prone to spontaneous combustion in the laneways, rather than in coal mining faces with machinery present, where the ventilation system prevents the concentration of heat. This trend also agrees with the majority coal fire causes,
i.e., spontaneous in mine goaf [
21]. In fire zone No. 8, fire center B exhibited deep to shallow movement (from east to west) and fire center C was observed to migrate along the strike of the coal seam. Due to the limited presence of heavy machinery, artisan mining activities start at the outcropping coal seams. Thus, it is inferred that this coal fire area might have ignited at wasted artisan mines and not moved deeper due to the limited oxygen supply, resulting in a path parallel to the outcrop lines, which was also confirmed by a technical report from the local coal mining company Shenhua Croup. This report stated that the middle section of coal fire zone No. 8 was ignited by wasted artisan mines with residual, high-sulfur-content coal; the fires were connected via the laneway system and resulted in strong heat anomalies, subsidence, and cracks on the surface [
20].
Coal fires that propagate from deep to shallow areas of a seam or travel along the coal seam outcrops indicate fires that developed along the strike or opposite the dip, respectively. We observed that the fire centers in A, B and C did not move far from the outcrop lines (less than 400 m in the horizontal direction). This dynamic trend confirmed that the distribution pattern of the fires is close to that of the coal seam outcrops. These trends could indicate that, due to aerotaxis and the upward heating effect, the coal fires are prone to propagate to higher areas. Therefore, preventing spontaneous coal combustion should be emphasized more for former underground excavations with residual coal seams and access to oxygen.
3.4. Coal Loss and CO2 Emission Estimation
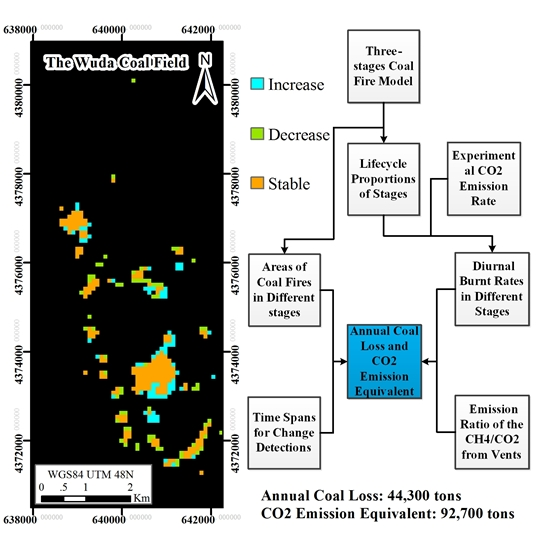
We attempted to estimate the amount of coal loss and corresponding CO2 emission. The main calculation process is divided into three modules: (1) The calculation of the coal fire-influenced quantity is accomplished using change detection to determine the areas of the different coal fire stages (increase/growth, maintenance/stability and decrease/shrinkage) for every change detection and considering the residual coal mining rate and the LOI, then multiplying the average thickness and intensity to obtain the amount of coal fire-influenced coal equivalent for the three stages. (2) The life cycle estimation is determined based on long-term coal fire monitoring using ASTER images and referring to the areas of the different the coal fire stages in the literature, recognizing the life cycles for these three coal fire stages, and determining the life cycle proportion of the total coal fire life span. (3) The burnt rate estimation is necessary because the coal was burning in different stages. We use the CO2 emission rates from spontaneous combustion experiments in different temperate ranges and the figures for coal fire life cycles to calculate the burning area and the diurnal burnt rate for different coal fire stages. Then, we applied Equations 1 and 2 to calculate the coal loss and the CO2 emissions.
The quantity of coal loss from coal fires is calculated using the following equations
where
M(stage): fire-influenced coal quantity in a certain coal fire developmental stage;
Rdiurnal(stage): diurnal burn rate for different coal fire stages;
T(change): time span for a specific coal fire stage in a certain change detection.
The CO
2 emission equivalent is
where Mtotal: Coal loss in these change detections; Ccarbon: Carbon content (70% is used in this research); CCO2: CO2 emission per ton of pure carbon (a ratio of molecular weight of CO2 and C, 44/12 = 3.67); Ccorrect: a calibration factor for the CO2 emission considering the CH4 content (1.0945 is used in this research).
3.4.1. Estimation of the Fire-Influenced Coal Quantity for Different Coal Fire Stages
The volume loss is a preliminary method for quantity estimation. However, volume loss is a complex and dynamic issue for the coal volume estimate in this study area due to the lack of a detailed coal thickness map and coal recovery rates for different coal mining goafs. However, given the average thickness of the coal fire groups, and the average coal recovery rate, we can calculate the approximate fire-influenced coal volume.
Based on Zhang’s observations, fires existed in coal seams Nos. 1, 2, 4, 6, 7, 9, 10, and 12 [
3]. Some of the coal seams make up a burning group that consists of 2~3 layers of coal seams, such as Group A, which is made up of coal seams Nos. 9 and 10, Group B (coal seams Nos. 6 and 7), Group C (coal seams Nos. 1 and 2), and Group D (coal seams Nos. 1, 2, and 4) [
3]. Because coal fires burn through these grouped coal seams, each group can be observed to be an entire burning layer. Based on the coal seam data in
Table 3 [
22], the average thickness of these four groups was calculated to be ((2.96 + 2.13) + (1.99 + 2.96) + (2.6 + 4.45) + (2.6 + 4.45 + 4.1))/4 = 7.06 m [
22]. The loss on ignition (LOI) is estimated using the average combustion efficiency of 76.5% for bituminous based on seven combustion efficiency figures (78.83%, 78.64%, 73.47%, 67.3%, 66.9%, 62.45%, and 57.12%) from the literature [
23] and three burnout characteristics (84.97%, 97.46%, and 97.91%) from the literature [
24]. The mining residual rate was estimate to be 60% using (1-percentage of coal recovery, 40%).
Table 3.
Data from the fire-related coal seams in the Wuda coal field.
Table 3.
Data from the fire-related coal seams in the Wuda coal field.
| Coal Seam No. | Thickness (m) | Ash Content (%) |
|---|
| 1 | 2.6 | 29.35 |
| 2 | 4.45 | 22.27 |
| 4 | 4.1 | 32.1 |
| 6 | 1.99 | 27.14 |
| 7 | 2.96 | 23.8 |
| 9 | 2.96 | 14.19 |
| 10 | 2.13 | 17.08 |
| 12 | 5.01 | 23.54 |
Based on the proportions in different coal density ranges from a previous study of the coal grading flotation for the Suhaitu coal washery in the Wuda coal field, an average coal density value of
ρ = 1.53 was calculated [
25]. Therefore, using the areas of the different coal fire stages shown in
Table 2, the amount of burnt coal (tons) was calculated using Equation 3 and shown as the columns Growth, Stability, and Shrinkage in
Table 4.
The coal fire-influenced quantity in each coal fire developmental stage in certain change detections was
where Area(stage): coal fire-influenced area of a certain coal fire developmental stage; Thickness: average thickness of the four fire-related coal seam groups, (7.06 m); Rcombustion: average combustion efficiency, (76.5%); Rresidual: the ratio of the residual coal mining rate, (60%); ρ: average coal density, (1.53 ton/m3).
Table 4.
Coal fire-influenced equivalent coal quantity and burnt coal for different change detections (tons).
Table 4.
Coal fire-influenced equivalent coal quantity and burnt coal for different change detections (tons).
| No. | Scene A (initial) | Scene B (final) | Time interval between A&B (days) | Growth (tons) | Stability (tons) | Shrinkage (tons) | Burnt Coal (tons) |
|---|
| 1 | ASTL1A_061228 | ASTL1A_070214 | 48 | 3,453,186 | 3,694,105 | 3,212,266 | 3173 |
| 2 | ASTL1A_070214 | ASTL1A_070412 | 58 | 3,975,179 | 4,697,938 | 2,449,353 | 4460 |
| 3 | ASTL1A_070412 | ASTL1A_070622 | 71 | 5,782,078 | 4,778,245 | 4,135,792 | 6395 |
| 4 | ASTL1A_070622 | ASTL1A_071129 | 160 | 1,686,439 | 7,026,831 | 3,533,492 | 15,927 |
| 5 | ASTL1A_071129 | ASTL1A_080210 | 72 | 3,533,492 | 7,026,831 | 1,686,439 | 7173 |
| 6 | ASTL1A_080210 | ASTL1A_080329 | 47 | 2,971,346 | 7,910,204 | 2,650,119 | 5227 |
| 7 | ASTL1A_080329 | ASTL1A_080421 | 24 | 1,686,439 | 5,942,691 | 4,938,858 | 2205 |
| Total | 480 | | | | 44,560 |
3.4.2. Coal Fire Development Life Cycles Estimation
We used continuous data from 2001 to 2011 derived from the ASTER TIR image inventory and one scene of Landsat 8 TIRS (thermal infrared sensor) image acquired on 23 December 2013 for long-term coal fire monitoring (
Table 5). Using the ASTER images shown in
Table 1, we observed that a coal fire lasted close to one year from ignition to stability based on the monitoring of coal fire area No. 6, which ignited on 28 December 2006 and reached a relatively stable status on 29 Novermber 2007, an interval of 336 days. We also observed that the stable burning stage lasts a longer time. Additionally, taking fire area No. 6 as an example, it occupied a relative stable area for approximately two years, from 29 November 2007 to 26 March 2010 (duration 848 days), based on a combined monitoring of the ASTER scenes from
Table 1 and
Table 5. The shrinkage/extinguishing stage could take longer, as the shrinkage/extinguishing process of coal fire area No. 6 lasted from 26 March 2010 to 23 December 2013, a duration of 1368 days based on analysis of ASTER and Landsat 8 TIRS scenes from
Table 5. Using these intervals, we built a simple model of the percentages of the overall coal fire development process representing growth, stability and shrinkage/extinguishment, which correspond to life cycle proportions of
LPgrowth = 13.2%,
LPstability = 33.2%, and
LPshrinkage = 53.6% for the overall life cycle, respectively.
Another coal fire lifecycle proportions can be deduced from the literature. Kuenzer
et al. released a statistical burning states table for different coal fire zones based on annual field coal fire dynamics observed from 2001 to 2005 [
10]. As mentioned above, by combining NF and AF into the “growth” stage, assigning CF to the “stability” stage and combing SF and EF into the “shrinkage” stage, we counted the numbers of different stages as NF + AF = 21, CF = 28 and SF + EF = 41 based on the coal fire dynamics table in literature [
10] and determined the proportions of the different stages in the coal fire lifecycle to be
LPgrowth = 23.3%,
LPstability = 31.1%, and
LPshrinkage = 45.6%, respectively. These in situ proportions had a similar variation (
LPshrinkage >
LPstability >
LPgrowth) as our model, and the similar proportion of
LPstability for the stable stage that is a key factor for the coal loss estimation. As introduced in the next section, the CO
2 emission in the stable stage is more significant than in the growth and shrinkage stages. Furthermore, because we assign the CO
2 emission rate for the growth and shrinkage stages to the same level, the minor difference between Kuenzer
et al.’s model [
10] and our model for the proportions of these two stages would not result in a notable difference in the coal loss estimate.
To estimate the average fire life span, we took fire areas Nos. 6 and 11 as examples and calculated the mean value. Based on continuous monitoring of the combined data from
Table 1 and
Table 5 from 2001 to 2013, coal fire area 11 lasted more than 12 years (the fire was detected for 4520 days from 8 August 2001 to the latest scenes) and fire area 6, as mentioned above, lasted more than 2552 days. Thus, the average life span was estimated to be 3536 days.
Table 5.
Information on the ASTER/Landsat 8 data used in coal fire long-term monitoring.
Table 5.
Information on the ASTER/Landsat 8 data used in coal fire long-term monitoring.
| Aster/Landsat 8 Scene ID | Acquisition Date (dd/mm/yyyy) | Day/Night |
|---|
| ASTL1B_0108080402180108190577 | 8 August 2001 | Day |
| ASTL1B_0209211454220210140292 | 14 September 2002 | Night |
| ASTL1B_0309240347540310110308 | 24 September 2003 | Day |
| ASTL1B_0504131458440504160548 | 12 April 2005 | Night |
| ASTL1B_0510060353310510080444 | 6 October 2005 | Day |
| ASTL1B_0612280354140701010054 | 28 December 2006 | Day |
| ASTL1B_0711291458560806290389 | 29 November 2007 | Night |
| ASTL1B_0804211459100804240676 | 21 April 2008 | Night |
| ASTL1B_1003260354351003290102 | 26 March 2010 | Day |
| ASTL1B_1101241458341101270384 | 24 January 2011 | Night |
| LC81300322013357LGN00 1 | 23 December 2013 | Day |
3.4.3. Estimation of the Diurnal Burnt Rate
As mentioned in introduction, based on the spontaneous combustion classification and field identification from literature [
3], we classified the growth and shrinkage/extinguishment stages as combustion class IV (corresponding to a combustion temperature of 400–600 °C), and the stability stage as class V (corresponding to a combustion temperature of 600–800 °C). Based on the spontaneous combustion experiments using coal samples from the Wuda coal field, the CO
2 emission rate was measured. In the combustion class IV, which had a temperature range of 400–600 °C, the CO
2 emission rate was measured as
ERIV = 0.2929 × 10
−6 ton/tons; in the combustion class V with the temperature range of 600–800 °C, the rate was measured as
ERV = 0.9739 × 10
−6 ton/tons. As shown in
Table 3, the average ash content is 23.7%, a carbon content of 70% was estimated for these fire-related coal seams. This carbon content was also applied in Van Dijk [
5] to estimate the CO
2 emission for the Wuda coal field. Thus, one ton of burning coal (70% carbon) releases approximately 2.5 tons of CO
2. Supposing that one ton of coal is burnt completely with a CO
2 emission rate
ERIV and emits 2.5 tons of CO
2, it can be inferred that the burning time
TIV would last 2.5 tons/
ERIV = 8,535,336 s = 98.8 days. Additionally, if it burn completely with CO
2 emission rate
ERV, the burning time
TV would be 29.7 days. These two burning times are far shorter than the corresponding life spans of 1704 days for the shrinkage stage (1368 days), the growth stage (336 days) and the stable stage (884 days), which are mentioned above in the life cycle estimation. We inferred that the combustion was not distributed over the entire fire area and only occurred in certain parts of the fire areas, thus the ratio of burning area to corresponding fire area was defined as burning area percentage
PA.
We then use the lifecycle proportions of the different development stages of the coal fires (under the assumption that the burning area percentages are equal in the three stages) to calculate the coal loss that occurred in each stage of this simplified three-stage model.
The coal loss percentages in the different coal fire stages are
where M indicates the coal quantity and T indicates the burning period. In this equation, M × PA × T was eliminated.
Then, we used Equation (4) and calculated the coal loss percentage in the growth stage Pgrowth to be 0.2929 × 10−6 × 13.2%/(0.2929 × 10−6× 13.2% + 0.9739 × 10−6 × 33.2% + 0.2929 × 10−6 × 53.6%) = 7.5%, Pstability = 62.3% for the stability stage, and Pshrinkage = 30.2% for shrinkage/extinguishment stage.
To calculate the proportions of the burning areas, we assume that a certain percentage of the area PAgrowth was burnt in combustion class IV (temperature range 400–600 °C), which lasted 336 days and burnt 7.5% of the total coal. Then, we can calculate the proportion of the area PAgrowth = TIV/(336/Pgrowth) = 98.8/(336/7.5%) = 2.21%. In the same way, we calculated the proportion of the burning area in the stability stage, PAstability = TV/(848/Pstability) = 29.7/(848/7.5%) = 2.18%, and the proportion of the shrinkage/extinguishment area, PAshrinkage = TIV/(1368/Pshrinkage) = 2.18%. These three figures are close, which confirms the assumption of equality between the burning area percentages in the three fire stages mentioned above.
To estimate the diurnal coal loss rate in each burning stage, we can assign these three stages different burnt rates. The burnt rate of the total coal loss that occurred per day in the different stages can then be calculated as Rdiurnal(growth) = APgrowth × Pgrowth/(3536 days × LPgrowth) = 3.527 × 10⁻⁶ per day in the growth stage, Rdiurnal(stability) = APstability × Pstability/(3536 days × LPtability) = 1.157 × 10⁻⁵ per day in the stability stage, and Rdiurnal(shrinkage) = APshrinkage × Pshrinkage/(3536 days × LPshrinkage) = 3.479 × 10⁻⁶ per day in the shrinkage/extinguishment stage.
3.4.4. Annual CO2 Emission Estimation
We applied Equation (1) to
Table 4 and calculated the total quantity of coal loss (intermediate results for specific change detection shown in the column:
“burnt coal”)
Mtotal at 44.56 × 10
3 tons in the study period (480 days), by reading the column “
Time Interval Between A&B” from
Table 4 as the time span for a specific coal fire stage in a certain change detection
T(change), taking the columns
“Growth”,
“Stability” and
“Shrinkage” as the fire-influenced coal quantity in a certain coal fire developmental stage
M(stage) and using above-mentioned diurnal burn rate for different coal fire stages
Rdiurnal(stage). Corrected by the average combustion efficiency of 76.5%, we estimated the total coal loss during the study period (480 days) to be 44.56 × 10
3/76.5% = 58.2 × 10
3 tons.
Additionally, 0.45% CH
4 [
5] is added using a Global Warming Potential (GWP) of 21 (e.g., 1 kg of CH
4 = 21 kg CO
2 equivalent) [
26], thus each ton of coal releases 2.5 tons of CO
2 and 0.45% of 2.5 tons as CH
4. To correct the CO
2 emissions to CO
2 equivalent, including the contribution from CH
4, a calibration factor of 1.0945 (1 + 0.45% × 21) was applied. We calculated this CO
2 equivalent emission over the study period (480 days) using Equation (2) to be 44.56 × 10
3 × 2.5 × 1.0945 = 121.9 × 10
3 tons, where we used 2.5 as the combined parameters
CCarbon ×
CCO2. In one year (365.25 days), using the figures for coal loss determined during the study period, the annual coal resource loss was estimated to be 58.248 × 10
3 × (365.25/480) = 44.3 ×10
3 tons, corresponding to emissions of 92.7 × 10
3 tons of CO
2 equivalent. We compared our results with other estimates for the Wuda coal field from the literature. In Tetzlaff [
27], a calculation based on the energy release using remote sensing data indicated that approximately 51,000 tons of coal are burned annually in the Wuda coal field, which is close to our annual coal loss result of 44.3 × 10
3 tons. Our CO
2 emission figure is within the range of extrapolated annual CO
2 emission, 90 × 10
3 tons ~ 36 × 10
3 tons, in the Wuda syncline estimated by Litschke through gas measurements at hot spot coal fire zones [
28], and is close to the lower bound 90 × 10
3 tons. Our figures about coal fire induced coal loss and corresponding CO
2 emission are smaller than both the coal loss amount (200,000 tons of coal were burnt in 2002 and one million tons of coal were burnt in 2009) reported by the local mining authorities and converted CO
2 emission (470 × 10
3 tons for 2002 and 2.35 × 10
6 tons for 2009) respectively in the Wuda coal field [
5].
This CO2 emission value represents the estimated emission of CO2 equivalent during the study period (480 days) under a set of ideal conditions: coal seams that are evenly distributed at a constant thickness of 7.06 m that have an average coal recovery rate of 40% and coal seams that were combusted with a combustion efficiency of 76.5% over a period of approximately 3536 days. Thus, our estimates can be considered to be the estimated coal losses and emissions of CO2 equivalent in the Wuda coal field.
3.5. Uncertainty Estimation
This research mainly depends on three models: the partitioning of coal fire development into three stages; change detection-based coal fire area estimation in different stages; and estimation of the proportion of the coal fire life cycle. These models were combined to be an approach for estimating the CO2 emission based on TIR images. We analyzed the errors in the change detection that resulted from the image offset when compared image pairs were not registered precisely. If we registered coal fires together that should not be matched, the result would generate more stable areas and could result in a 2.01 times increase in the final CO2 emission intensity. In contrast, if we offset coal fires that should be perfectly overlaid, a 58% decrease in the CO2 emission would result. Offsetting of image pairs could also result in changes in the directions of the fire center migrations. Other biases could also result from the calculations of the CO2 emission, which are based on the determination of certain parameters, and the uncertainty of the final result could be a combination from those different parameters. In this research, we tried to find the supports for those parameters in the literature. Although the parameters, i.e., the average thickness of the four fire-related coal seam groups (Thickness), the average combustion efficiency (Rcombustion), the ratio of the coal mining residual rate (Rresidual), the average coal density (ρ), and the carbon content (Ccarbon), were basically supported, these figures are open for debate to reach a more accurate result. The CH4 calibration factor for the CO2 emission is based on gas samples from the coal fire vents gathered on October 2012 only. A more representative factor should take into consideration the gas from coal waste piles and in different seasons or different weather conditions. The life spans in this model were estimated by monitoring two coal fire areas; however, exact life spans should take into consideration coal fire descriptions from historical documents. The most roughly estimated parameter is the coal recovery rate. This rate is essential but varied as mining technology improving; therefore, it is hard to measure. We adopted an empirical rate of 40% and assumed that all coal fire-influenced coal seams were mined, which meant that our results are likely a minimum estimate. If these coal seams were not mined, the final CO2 emission would have been 1.67 times greater as: 154.5 × 10³ tons with 73.8 × 10³ tons of coal burnt.
4. Conclusions and Vision
In this research, we used TES-MMD (temperature/emissivity separation-maximum and minimum difference) and SAGBT (self-adaptive gradient-based thresholding) methods for temperature retrieval and to delineate the underground coal fires. These methods are feasible for temperature inversion and the delineation of thermal anomalies. The coal fires flagged as thermal anomalies were analyzed using change detection, revealing the characteristics of the coal fire distribution and their propagation trends. The coal fire centers were tracked to show the migration of the burning centers of the coal fire areas relative to the coal seam outcrops. Based on an analysis of the coal fire life cycle and referring to the 12-stage and five-stage coal fire classification methods, we constructed a simplified three-stage method for coal fire classification: growth, stability and shrinkage. Each of these stages has a different duration and combustion intensity. We linked this three-stage model for coal fire change detection (increase, decrease, and stability) to the three coal fire development stages: growth, stability and shrinkage. Then, the fire areas derived from the multi-temporal change detection analysis were used to estimate the volume of the coal seam impacted by the coal fires. Based on estimates of the coal seam thickness, the average combustion efficiency, the average density of the coke coal, and the coal recovery rate, the coal fire-influenced quantity was calculated. Based on the spontaneous coal combustion experiment and long-term coal fire life cycles monitoring, the diurnal coal burn rates in different stages were estimated. By aggregating the quantity influence by the fires in the different stages, the diurnal burn rates for different stages and the time spans between changes, we estimated the annual coal loss to be 44.3 × 10³ tons. Then, we used a CH4 emission factor of 0.45% based on gas chromatographic analysis of samples from coal fire vents in the study area to calculate the annual CO2 equivalent emissions, which were 92.7 × 10³ tons. We also observed from the fire maps that the coal fire regions were located along the coal seam outcrops, especially outcrop numbers 2, 4, 9, 10 and 12. The change detection time series plot reveals that, during the early years, the fire areas increased until a peak occurred on 8 December 2007, after which they began to decrease moderately. By tracking the coal fire centers, identified as the highest-temperature point in a coal fire area, the fire centers migrated from deep to shallow areas of a seam or traveled along the coal seam outcrops, indicating that fires developed along the strikes or opposite dips; this result reveals a principle that coal fires are apt to migrate toward higher areas. We infer that these coal fires were ignited at wasted artisan mines with residual coal that had high-sulfur contents. This trend could indicate that former underground excavations with residual coal seams and access to oxygen should be closely watched to prevent spontaneous coal combustion.
Our CO2 emission model were combined: the partitioning of the three stages of coal fire development, change detection-based coal fire area estimation of the different stages, and coal fire life cycle proportion estimation. This combination provided a different quantitative method to estimate the CO2 emission from spontaneous coal seam combustion, which is based on remotely measuring data (not report numbers) and could be used as reference data for in situ or statistical coal loss/CO2 emission figures.
Coal fires are a complex system and contain too many variations; thus, coal loss depends on varying wind speeds or precipitation, surface fracturing and collapse, the oxygen supply to the fire, the burning efficiency of the fire, and the coal-quality, which are all related to changes in the burning intensity [
29]. The budget for measuring these parameters is also limited, and because the strength of remote sensing is its transferability and wide spatial range covering large areas for low-cost approximations [
30], we adopted this gradient-based coal fire delineation method, which depends on the spatial distribution of the most direct coal fire-induced factor (
i.e., energy release) to determine the accuracy of the variations in the temperature inversion. In reality, the heat capacity variations and overlaying thick strata could result in undetectable underground coal fires, which is a very complex problem and is impossible to resolve due to budget limitations. Thus, our results only reflect the coal loss and CO
2 emissions from detectable coal fires.
Further research plans include field measurements and image acquisition using the ASTER sensor onboard NASA’s Terra satellite from dates representing a range of different solar radiation intensities. Simultaneous ASTER collection and field measurements are planned in the Wuda coal field (China) with scheduled image collection at four times distributed throughout the year, including the winter and summer solstices (least and most intense solar radiation periods) and the vernal/autumnal equinoxes. These equally temporally distributed images will reduce the error resulting from the varying timespans between temporally adjacent images. Additionally, the loss on ignition (LOI) can be more accurately estimated by analyzing the combustion products from the different stages, and the coal fire development stages can be defined more accurately by monitoring the fires for longer time periods; both of these possibilities could improve our estimate. Finally, more accurate, three-dimensional coal seam models and detailed mining residual rates would produce a more accurate estimate of the coal seam volume loss.


