Article

Long-Term Record of Sampled Disturbances in Northern Eurasian Boreal Forest from Pre-2000 Landsat Data

1
Department of Geographical Sciences, University of Maryland, College Park, MD 20742, USA
2
Global Land Cover Facility, Department of Geographical Sciences, University of Maryland, College Park, MD 20742, USA
*
Author to whom correspondence should be addressed.
Remote Sens. 2014, 6(7), 6020-6038; https://doi.org/10.3390/rs6076020
Submission received: 30 April 2014 / Revised: 14 June 2014 / Accepted: 16 June 2014 / Published: 27 June 2014

Abstract

:
Stand age distribution is an important descriptor of boreal forest structure, which is directly linked to many ecosystem processes including the carbon cycle, the land–atmosphere interaction and ecosystem services, among others. Almost half of the global boreal biome is located in Russia. The vast extent, remote location, and limited accessibility of Russian boreal forests make remote sensing the only feasible approach to characterize these forests to their full extent. A wide variety of satellite observations are currently available to monitor forest change and infer its structure; however, the period of observations is mostly limited to the 2000s era. Reconstruction of wall-to-wall maps of stand age distribution requires merging longer-term site observations of forest cover change available at the Landsat scale at a subset of locations in Russia with the wall-to-wall coverage available from coarse resolution satellites since 2000. This paper presents a dataset consisting of a suite of multi-year forest disturbance samples and samples of undisturbed forests across Russia derived from Landsat Thematic Mapper and Enhanced Thematic Mapper Plus images from 1985 to 2000. These samples provide crucial information regarding disturbance history in selected regions across the Russian boreal forest and are designed to serve as a training and/or validation dataset for coarse resolution data products. The overall accuracy and Kappa coefficient for the entire sample collection was found to be 83.98% and 0.83%, respectively. It is hoped that the presented dataset will benefit subsequent studies on a variety of aspects of the Russian boreal forest, especially in relation to the carbon budget and climate.

Graphical Abstract

1. Introduction

Stand age distribution is a highly important property of boreal forest [1]. It has direct implications for timber stocks, ecology and biodiversity, carbon cycle, and surface radiation budget at the global scale. Russian boreal forests occupy 4–6 million square kilometers (km2) and represent 43%–65% of the global boreal biome [2]. Although the majority of timber produced in Russia is consumed domestically (61% in 2010), the exported timber from Russia was estimated to be worth $9.5 billion in 2010 [3]. In 2011, Russia produced almost a fifth (17.8%) of the world’s total industrial roundwood export [4]. While these forests are a major global economic resource, they simultaneously represent the largest contiguous areas of forest cover supporting large populations of brown bears, wolves, moose, and a plethora of other boreal species [2,5,6].
Carbon uptake and storage is dependent on forest successional stage and much of the carbon stocks are found in mature forests [79]. However, the highest rates of carbon uptake from the atmosphere are found in younger forests [9,10]. Moreover, recent studies on impacts of post-disturbance forest recovery (and subsequently stand age) on forest albedo in boreal forests of North America have quantified the tremendous contribution of stand age to the Earth’s radiation budget. Through a combination of canopy removal by the disturbance and subsequent changes in species composition, regrowing forests created a large net cooling effect [1114]. The effect was estimated to be −2.3 ± 2.2 W/m2 over an 80-year period in forest stands in interior Alaska [14].
Broad availability of global satellite observations of the land surface has brought about a number of significant improvements in mapping and quantifying Russian boreal forest cover. Bartalev, et al. [15] derived a 1999 land cover map of Eurasia with a spatial resolution of 1 km based on SPOT-VEGETATION data. This dataset employs a 26-class classification scheme, including forest types such as evergreen needleleaf forest, deciduous broadleaf forest and mixed forest. A global land cover product incorporating multiple classification schemes including some forest characterization at 500 m resolution was created based on Moderate Resolution Imaging Spectroradiometer (MODIS) data by Friedl, et al. [16,17]. Hansen, et al. [18] developed the MODIS Vegetation Continuous Fields (VCF) product, which, different from the land cover product, focuses explicitly on the proportional estimates of woody and herbaceous vegetation on land and is currently available at 250 m resolution. Recently, the Landsat-based VCF product was produced by Sexton, et al. [19]. Annual forest cover change from 2000 to 2012 was successfully mapped by Hansen, et al. [20] at 30 m. As a global forest cover product, it provides an unprecedented detailed assessment of forest change.
In addition to quantification and characterization of forest cover extent, a number of datasets aimed at developing a record of fire occurrence and extent have been developed. At a global level, a suite of burned area products have been derived based on a variety of data sources: MCD45A1 [2123] and MCD64 [24] (based on 500 m MODIS data); Global Burned Area 2000 [25] (GBA-2000) and L3JRC [26] (based on 1 km SPOT-VEGETATION data); GLOBSCAR [27] (based on 1 km Along Track Scanning Radiometer (ATSR-2) data); and the GLOBCARBON Burned Area Estimation product [28,29] (based on a combination of data from SPOT-VEGETATION, ATSR-2, Advanced Along Track Scanning Radiometer (AATSR) and Medium Resolution Imaging Spectrometer (MERIS)). In addition to these global burned area products, several regional burned area products have been developed for the Russian boreal forest, including Sukhinin, et al. [30] (based on Advanced Very High Resolution Radiometer (AVHRR) data), Bartalev, et al. [31] (based on SPOT-VEGETATION data) and Loboda, et al. [32] (based on MODIS data). The combination of the disturbance record and forest cover provides an insight into the amount and spatial distribution of very young (<15 years) forests. However, no reliable wall-to-wall record of past disturbances across the full extent of Russian forests exists.
New efforts aimed at creating a longer-term assessment of forest cover change and thus the potential for reconstructing stand age distribution are currently under development. First, the relatively slow succession of boreal forests allows for the development of assessments of stand age distribution based on the present-day composition of forest types (e.g., Loboda, et al. [33]). Second, the Land Long-term Data Record (LTDR) dataset created by fusing reprocessed AVHRR data with other datasets such as MODIS and SPOT-VEGETATION will likely present a new opportunity for direct mapping of forest cover change beginning with the early 1980s [34]. An example of this potential has been described in Zhang, et al. [1], in which the authors mapped the stand age distribution in the boreal forest in Ontario, Canada using AVHRR and SPOT-VEGETATION data. Either approach, however, will rely on the availability of a large suite of training data at moderate resolution for either training mapping algorithms or delivering the accuracy assessment for the finished product. This paper presents the development of a sample multi-year disturbance dataset derived from Landsat data stacks across Russian forests to support the future development and validation of coarse resolution forest cover, disturbance, and stand age distribution datasets.
The major objective for the presented dataset is to deliver a suite of multi-year forest disturbance samples across Russia with a high degree of confidence. The result is not an attempt to create the most spatially comprehensive map of past disturbances, but rather identify areas within which tree cover has been undoubtedly converted to non-tree cover at some point in time between two consequent available Landsat observations. The resultant product presents a conservative estimate of disturbances but ensures that if used in training coarse resolution or potentially moderate resolution algorithms, it will provide a high-fidelity change sample and will avoid capturing inter-annual forest variability due to phenology or other non-stand replacing events (e.g., partial defoliation due to insect activity not resultant in forest mortality). The release of this dataset to the broad scientific and management community globally is expected to contribute to international efforts for better characterization of forest cover in Russia and alleviate in part the redundancy in training data development for multiple projects.

2. Study Area, Data and Methods
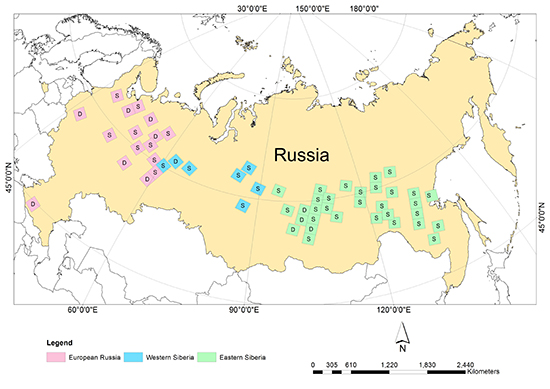
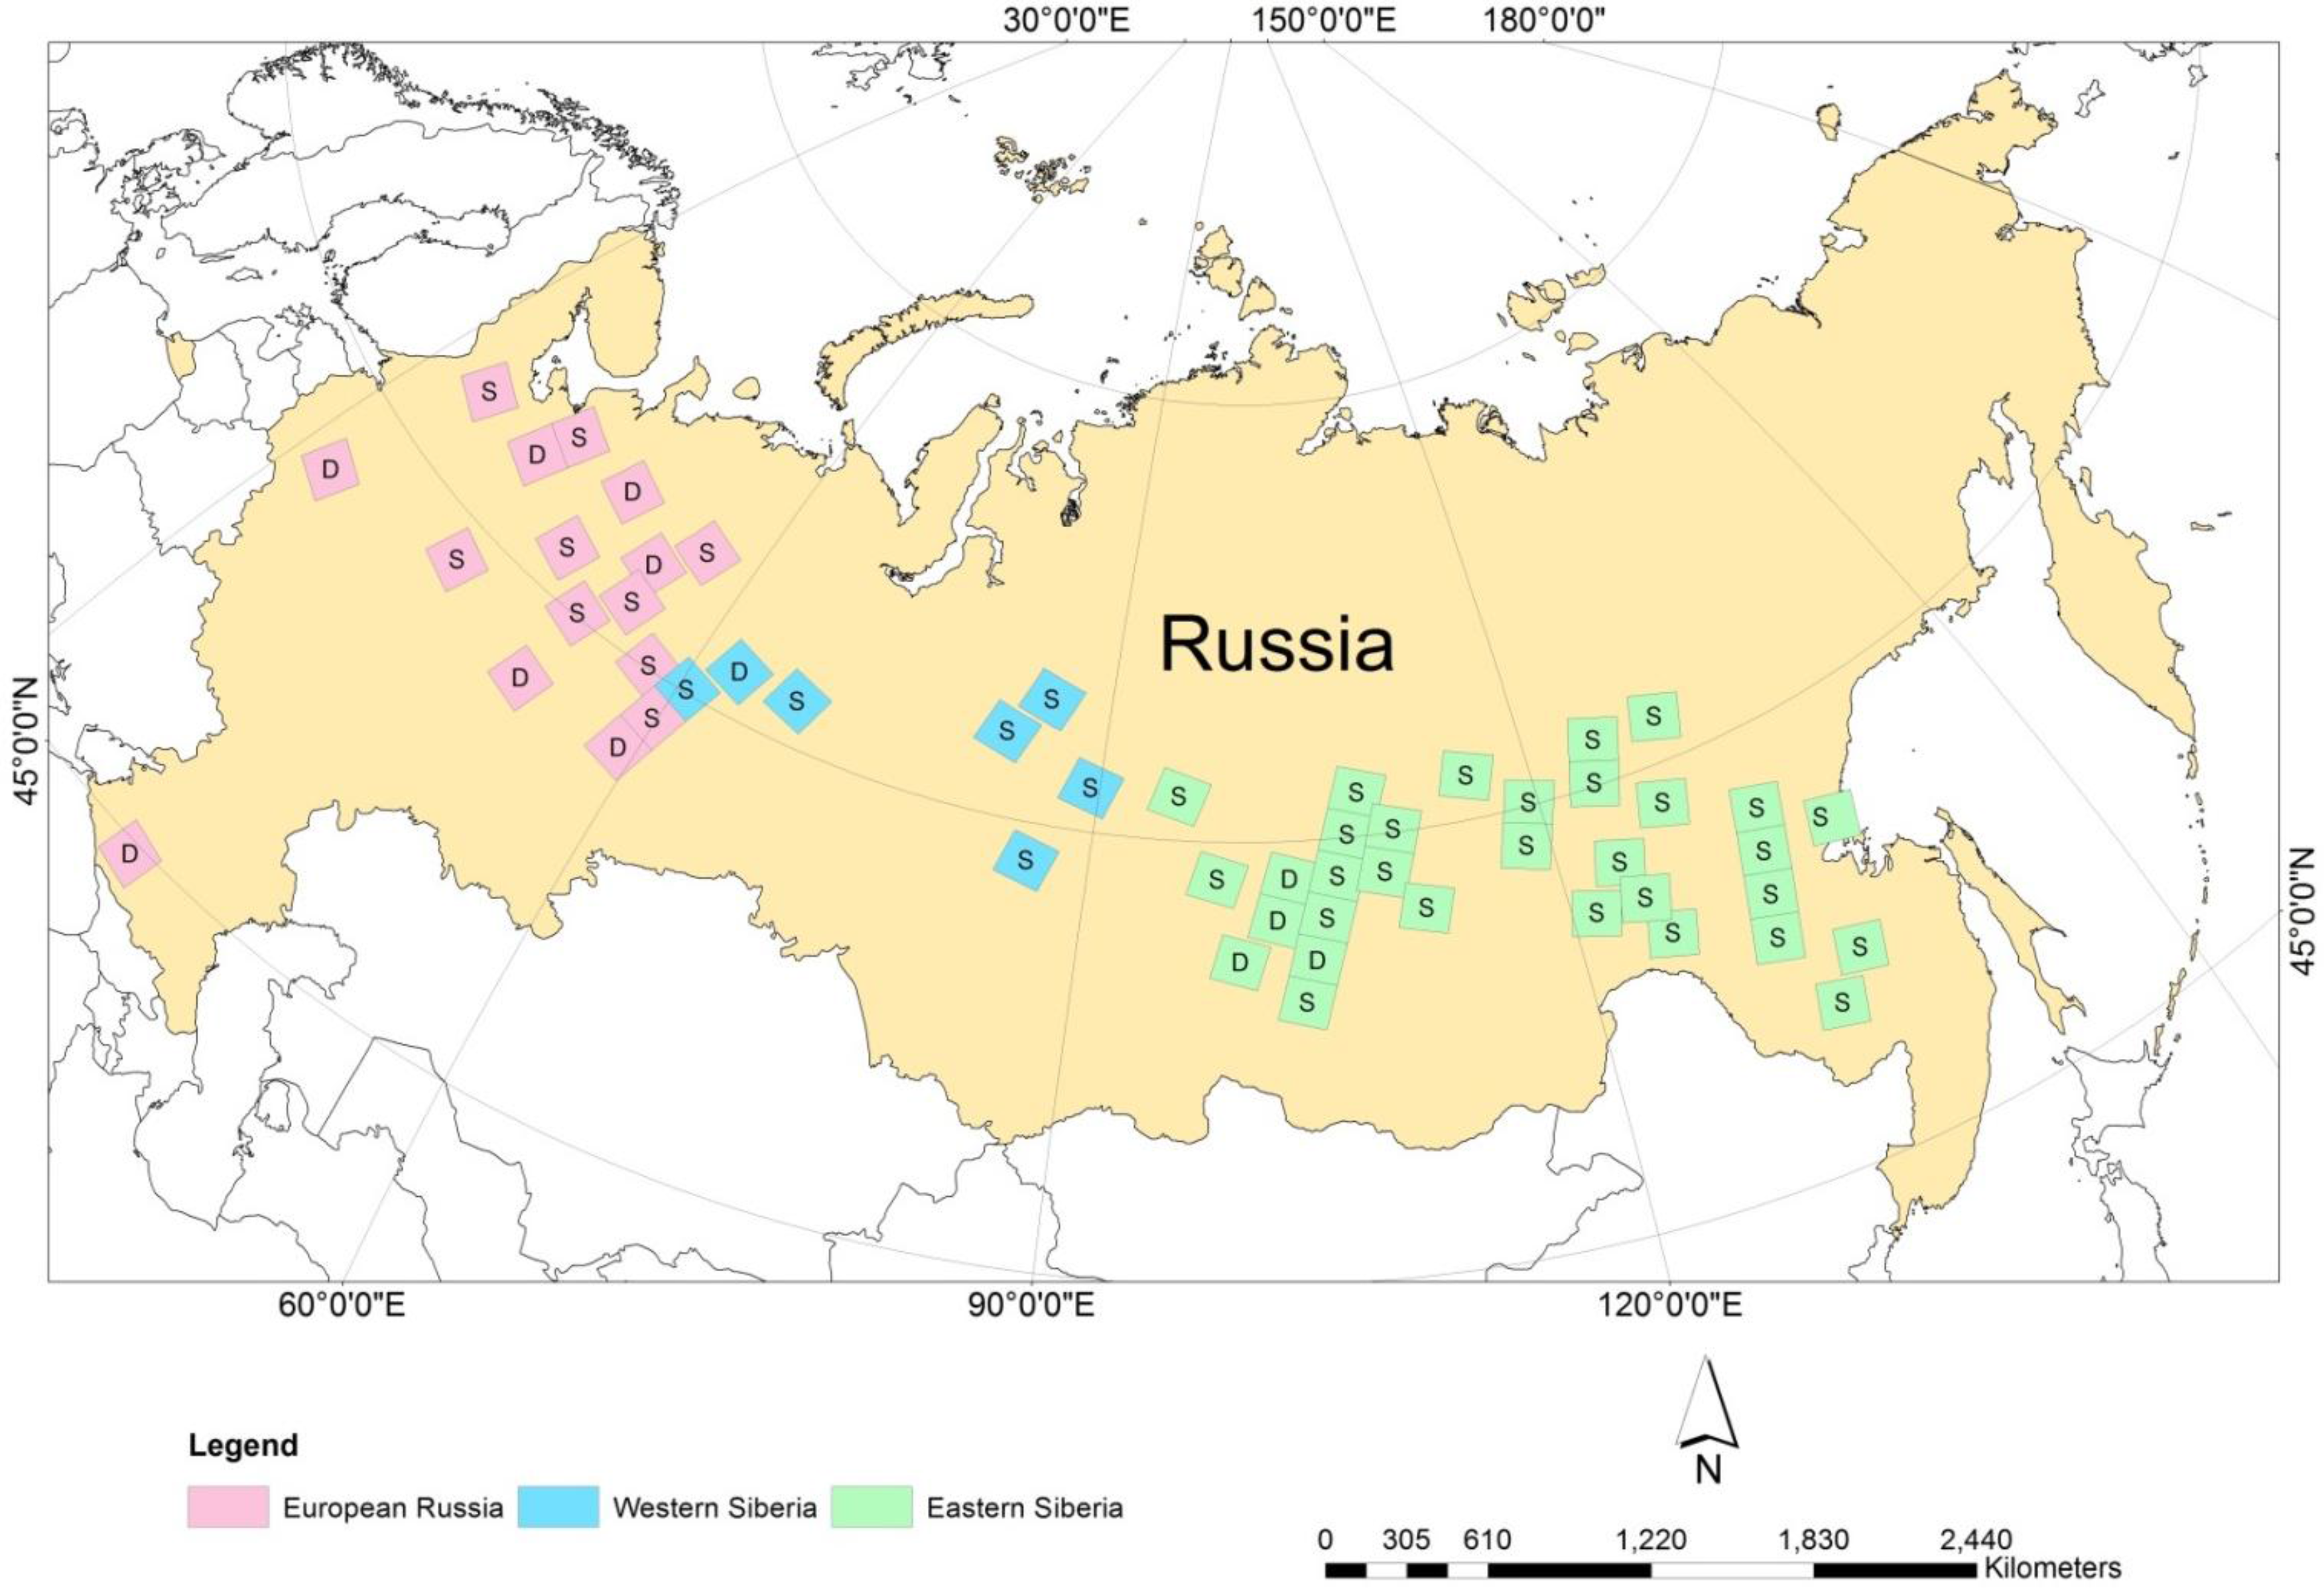
2.1. Study Area

The selected study area for this paper is the boreal forest in Northern Eurasia within the boundary of the Russian Federation. Across this vast area about 300 tree species are distributed; the predominate species include Larix sibirica (Siberian or Russian Larch), L. gmelinii (Dahurian Larch), Pinus sylvestris (Scots Pine), P. sibirica (Siberian Pine), Picea abies (European or Norway Spruce), P. obovata (Siberian Spruce) and Betula spp. (Birch) [35]. The climate in the region is highly or extremely continental, characterized by very cold winters and warm summers [36]. The continentality of climate reaches an extreme in Eastern and Central Siberia, where the recorded absolute minimum air temperature is −67 °C [37]. Precipitation in the region is light or modest, with mean annual precipitation being 300–800 mm·a−1 [36]. As with other boreal regions, wildfire is the most important disturbance agent in the Northern Eurasian boreal forest and imposes significant influences on forest composition and carbon cycles [2,38]. An average area of 20,000–30,000 km2 is estimated as burned each year across the region [2]. In addition to wildfire, another major disturbance agent in the boreal forest of Northern Eurasia is logging. In Siberia alone, it is estimated that 10,000 km2 of forest is logged each year [39]. Pressure from logging activities is more intense in European Russia, where the human population is larger [40].

2.2. Data

The presented dataset is derived from Landsat Thematic Mapper (TM) and Enhanced Thematic Mapper Plus (ETM+) imagery spanning the period between 1984 and 2000. MODIS Vegetation Continuous Fields (MOD44B) [41] data for the year 2000 was used to delineate the forest areas to which subsequent processes were applied. This is a global dataset and thus spans the full extent of the Russian forests. The dataset was used to focus the distribution of the Landsat sample stacks within forested areas (defined in this study as all pixels with percent tree cover greater than 10%) and thus excluded large zones of croplands and grasslands in southern Russia and tundra in the north.
The original sampling scheme included a random distribution of 50 points to locate dense near-cloud-free (<10% of cloud cover visually verified by the analyst) Landsat TM and ETM+ stacks across the full expanse of Russian forests. The specific parameters for the distribution included non-adjacency (points were dispersed more than 185 km to avoid overlap in Landsat stacks). All WRS-2 path rows of Landsat images containing the random points were examined to identify the stack with the largest number of cloud-free images during the growing season (between 1 June and 31 August) of subsequent years. Preference was given to stacks with near-annual observations rather than to those with the greatest number of images available since many images came from the growing season of the same year. The resultant distribution of training data contained only 12 dense Landsat stacks and was heavily skewed towards sampling forests in European Russia leaving most of Siberian forests under-sampled (Figure 1). Subsequently more Landsat stacks were added across Western and Eastern Siberia where general Landsat data coverage pre-2000 is very sparse. All Landsat stacks with images from more than two years of growing season observations in a stack were added across Siberia. The final dataset included 55 Landsat stacks distributed across the full extent of Russian forests with a total of 241 terrain-corrected (L1T product delivered by the US Geological Survey) images acquired between 1 June and 31 August of 1984–2000 (Figure 1). The number of stacks in European Russia, Western Siberia and Eastern Siberia was 16, 7, and 32, respectively.

2.3. Methods

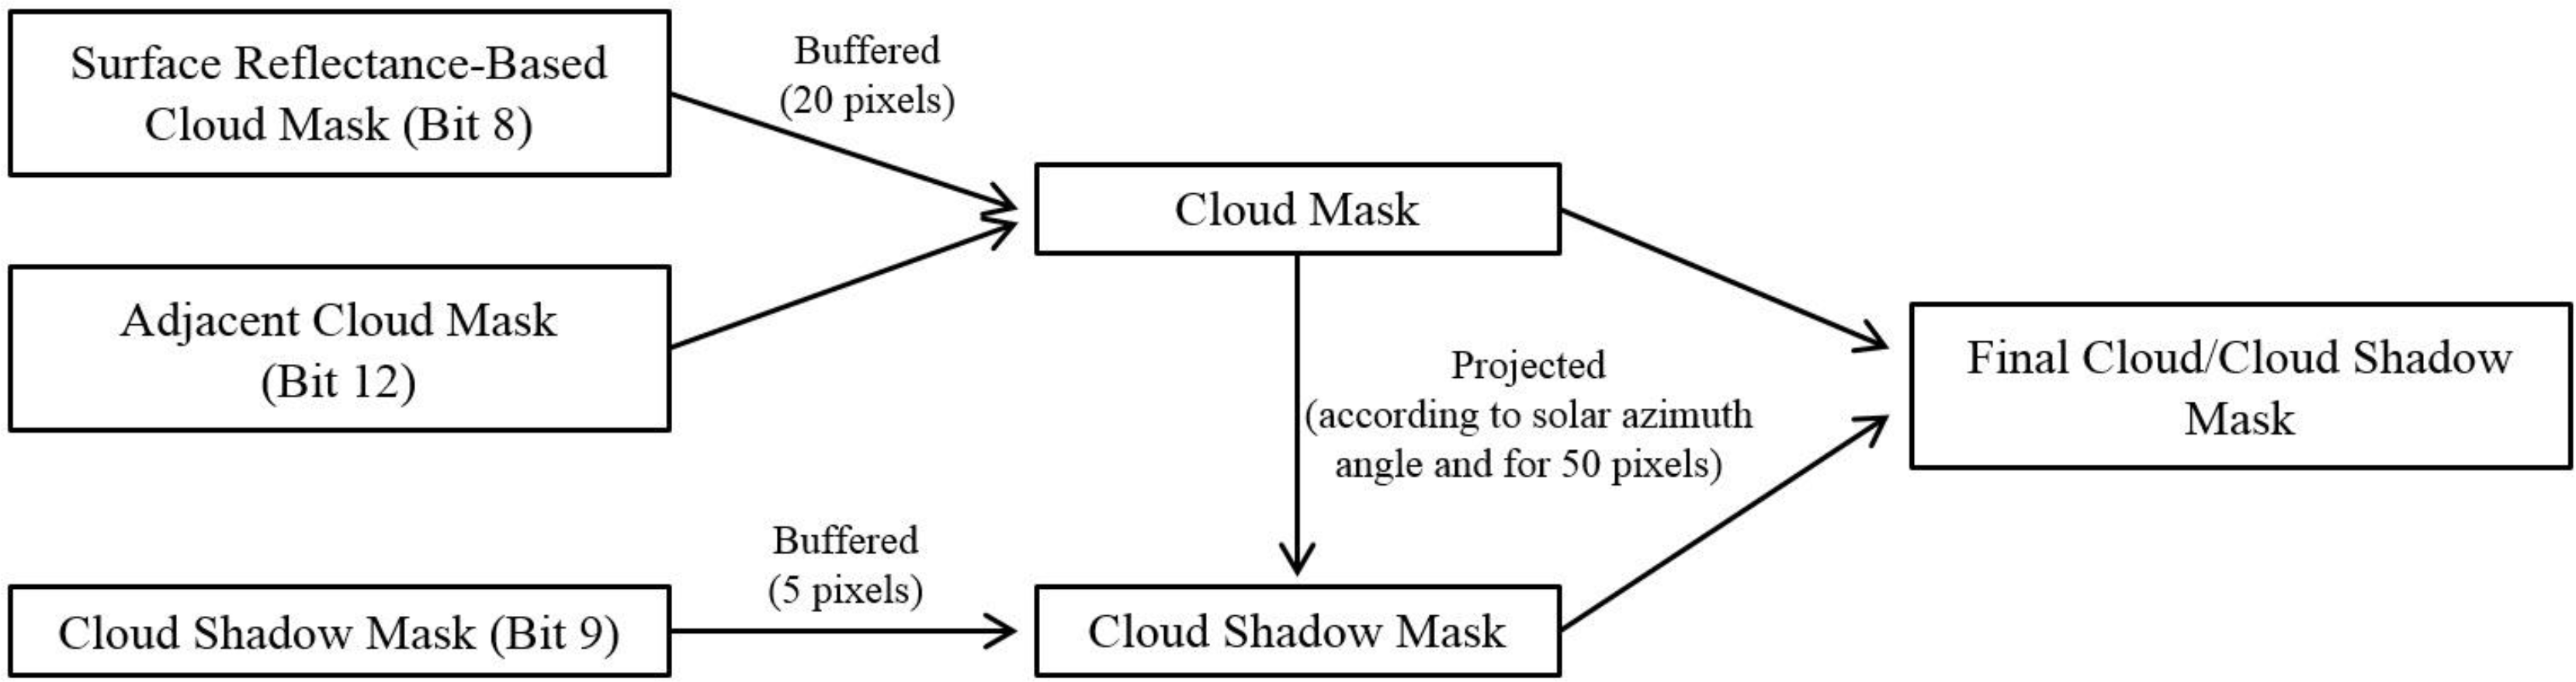
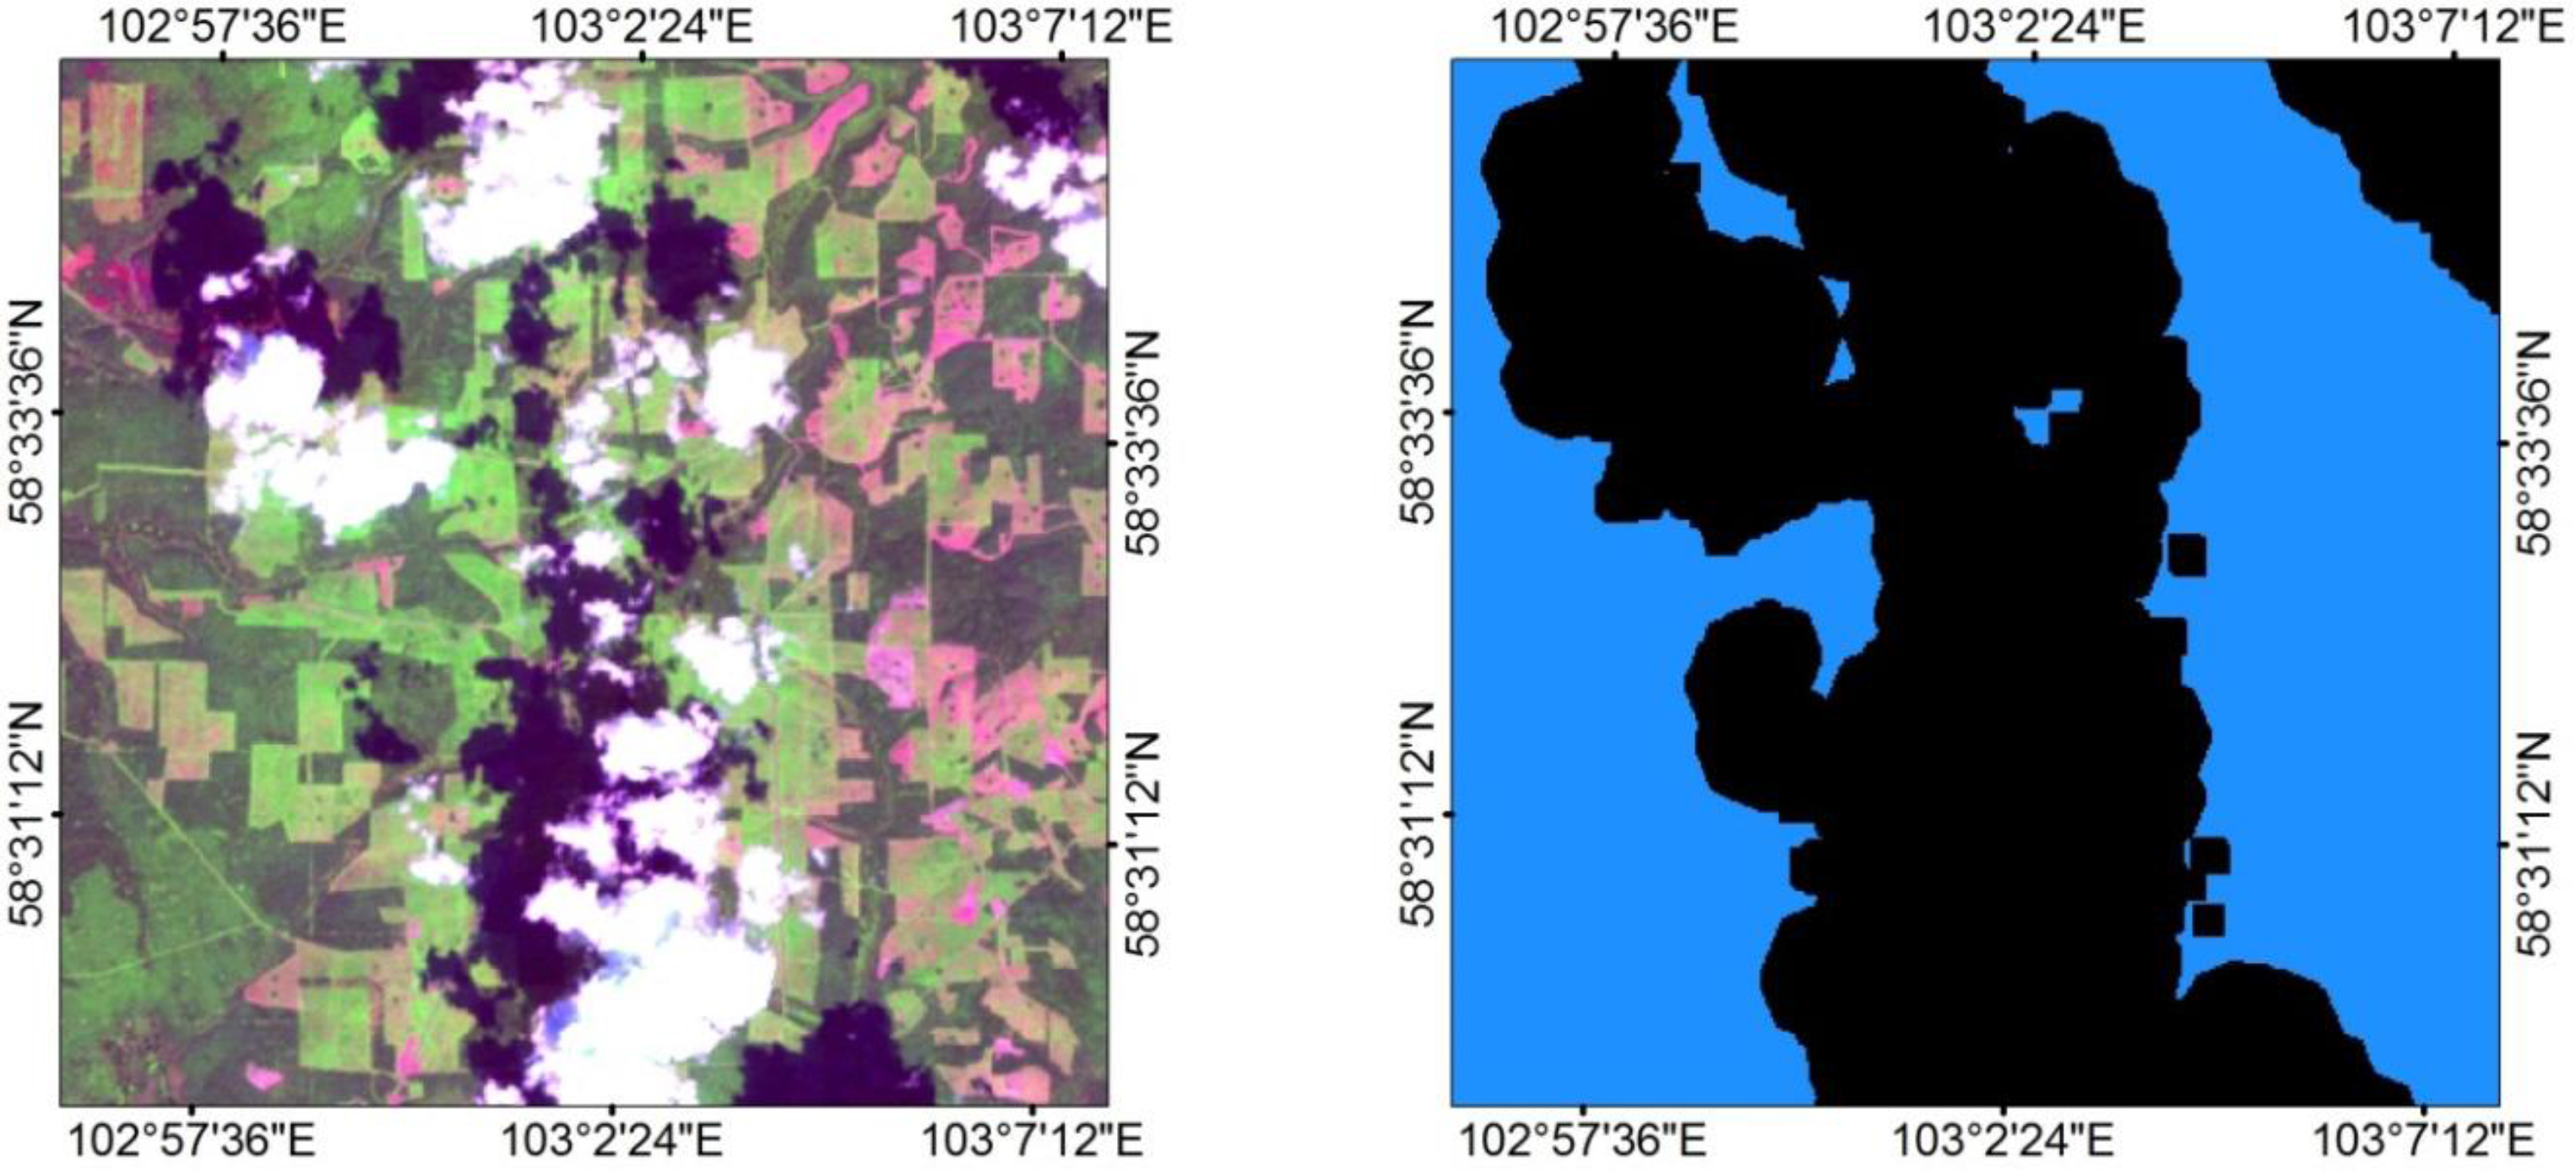
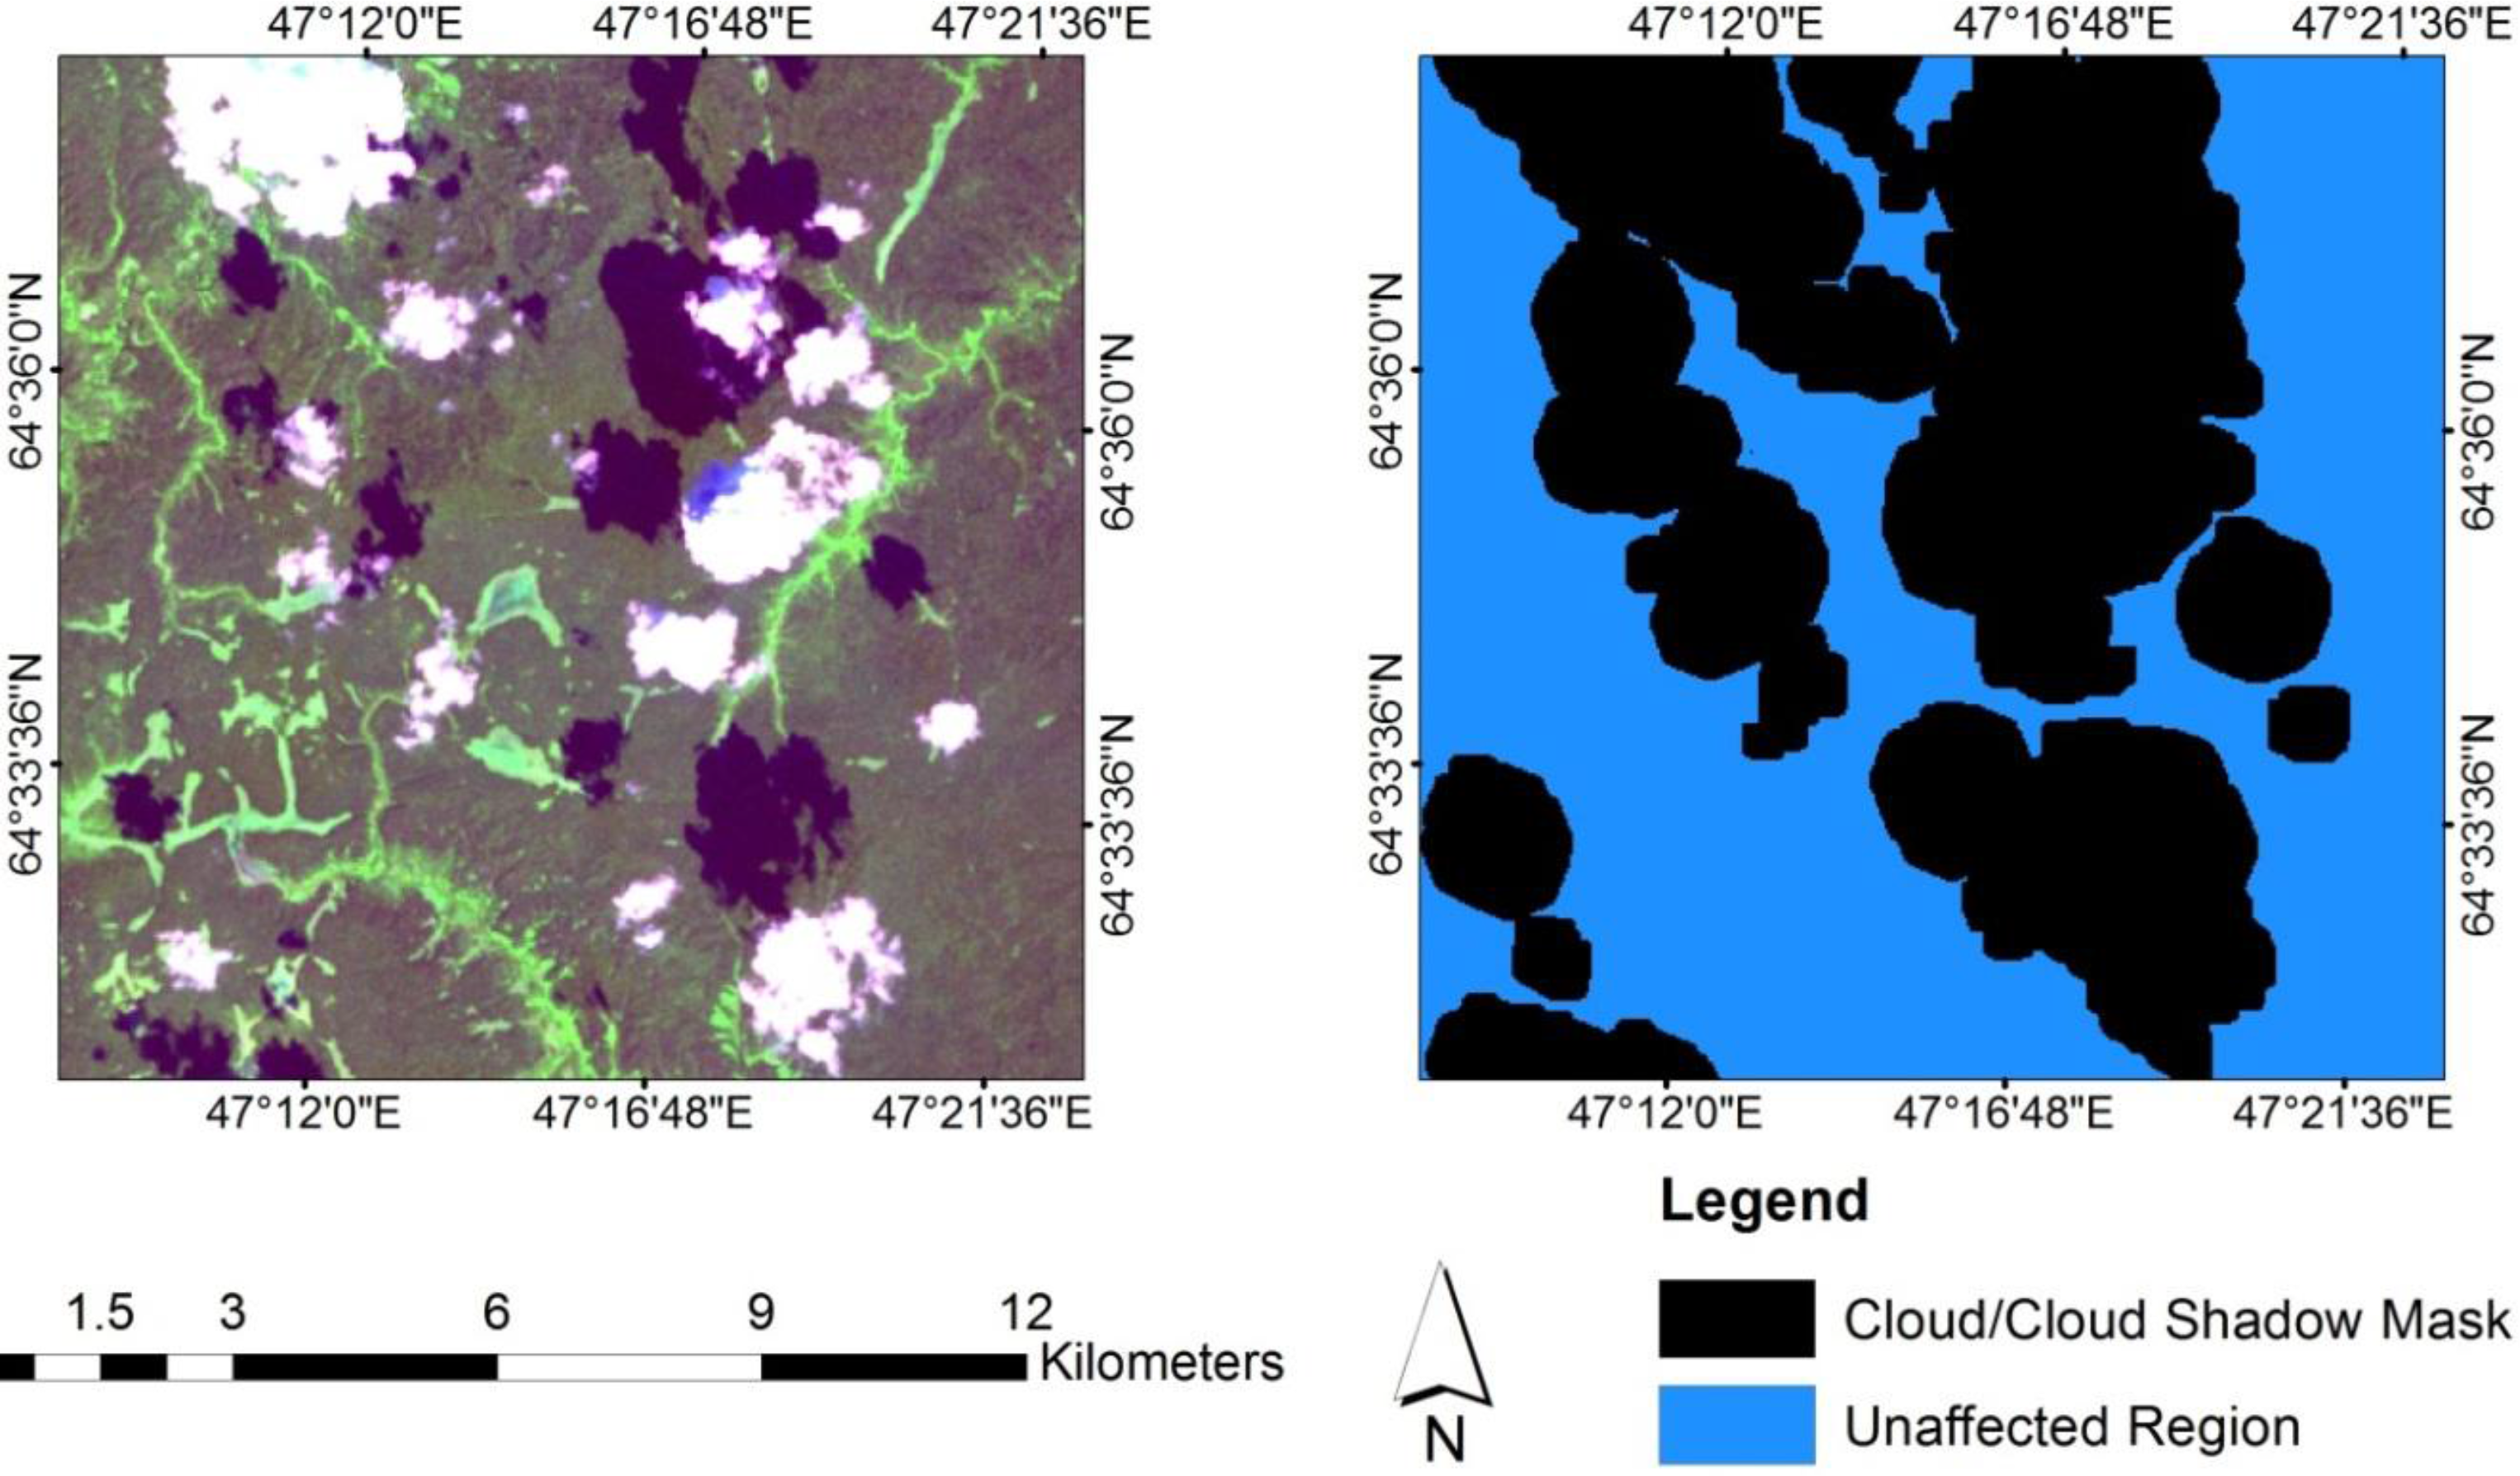
2.3.1. Image Pre-Processing and Masking

All L1T Landsat images were converted to surface reflectance using the Landsat Ecosystem Disturbance Adaptive Processing System (LEDAPS, V1.1.1) [42,43]. The image stacks were clipped to their common extent to eliminate the variation in exact scene coverage between different images.
Although preference was given to near-cloud-free imagery, considerable amounts of cloud and cloud shadow remained. For each Landsat image, three associated masks were extracted from the Quality Assessment (QA) packed bits [44]: the surface reflectance-based cloud mask (Bit 8), the adjacent cloud mask (Bit 12) and the cloud shadow mask (Bit 9). These masks were not used directly because visual analysis suggested that some edges of the clouds and cloud shadows were not captured by them. Instead, driven by the main objective of developing very high confidence rather than the most comprehensive disturbances mapping, liberal masks was designed to overestimate cloud and cloud shadow presence, particularly at the edges of clouds and cloud shadows, by incorporating the QA masks in the following manner. Firstly, the Bit 8 mask for each image was buffered outwards for 20 pixels (established visually by the analyst) to account for the cloud pixels at the edge of the clouds.
The buffered cloud mask was then merged with the Bit 12 mask (which did not require buffering because it generally performed well in including all the adjacent cloud pixels) to create a final cloud mask. The locations of cloud shadows were projected using the buffered cloud mask (described above) and the solar geometry at the time of image acquisition (delivered in the image metadata file). The spatial direction of displacement was determined as the opposite of the solar azimuth angle (solar azimuth + 180°). However, since cloud altitude at the time of image acquisition is not known, it is impossible to calculate the exact offset distance. Therefore an empirically determined offset distance of 50 pixels was established. Finally, the Bit 9 cloud mask for each image was buffered outward by five pixels, and was then merged into the projected cloud shadow mask to generate a final cloud shadow mask. The resultant cloud masks and cloud shadow masks were merged to mask out the corresponding pixels in the Landsat images for the subsequent processes. The workflow of deriving these cloud/cloud shadow masks is summarized in Figure 2. Figure 3 shows two examples of the performance of these masks.

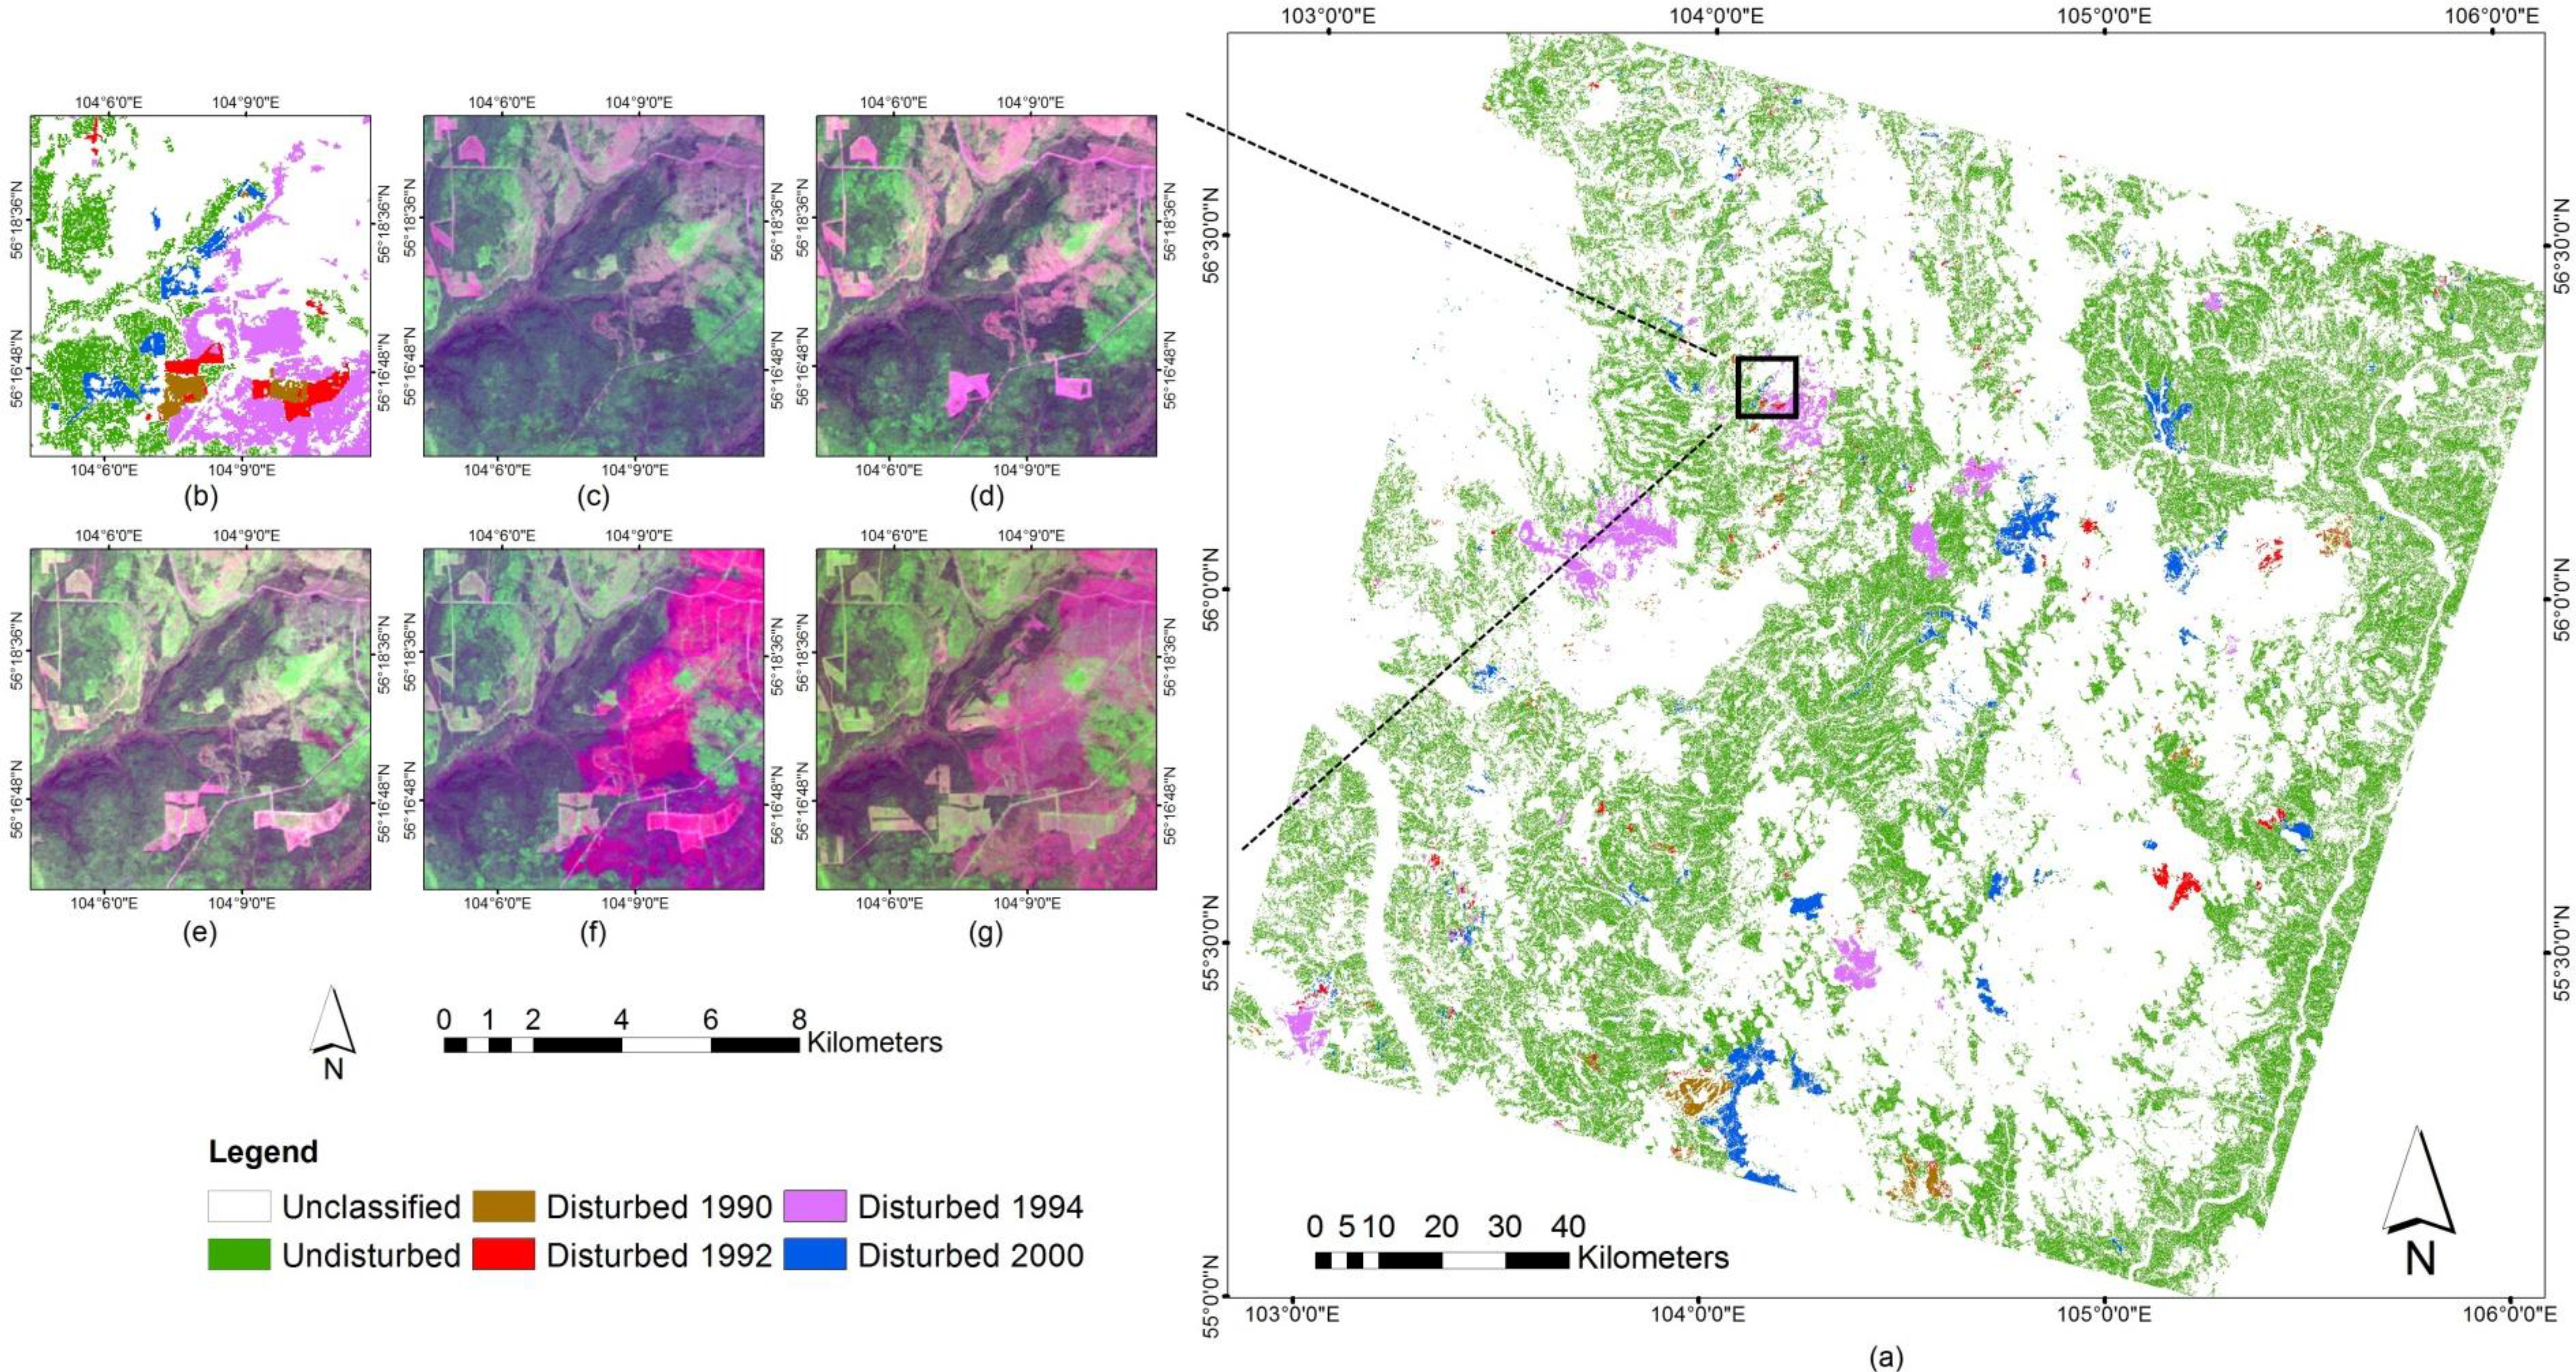
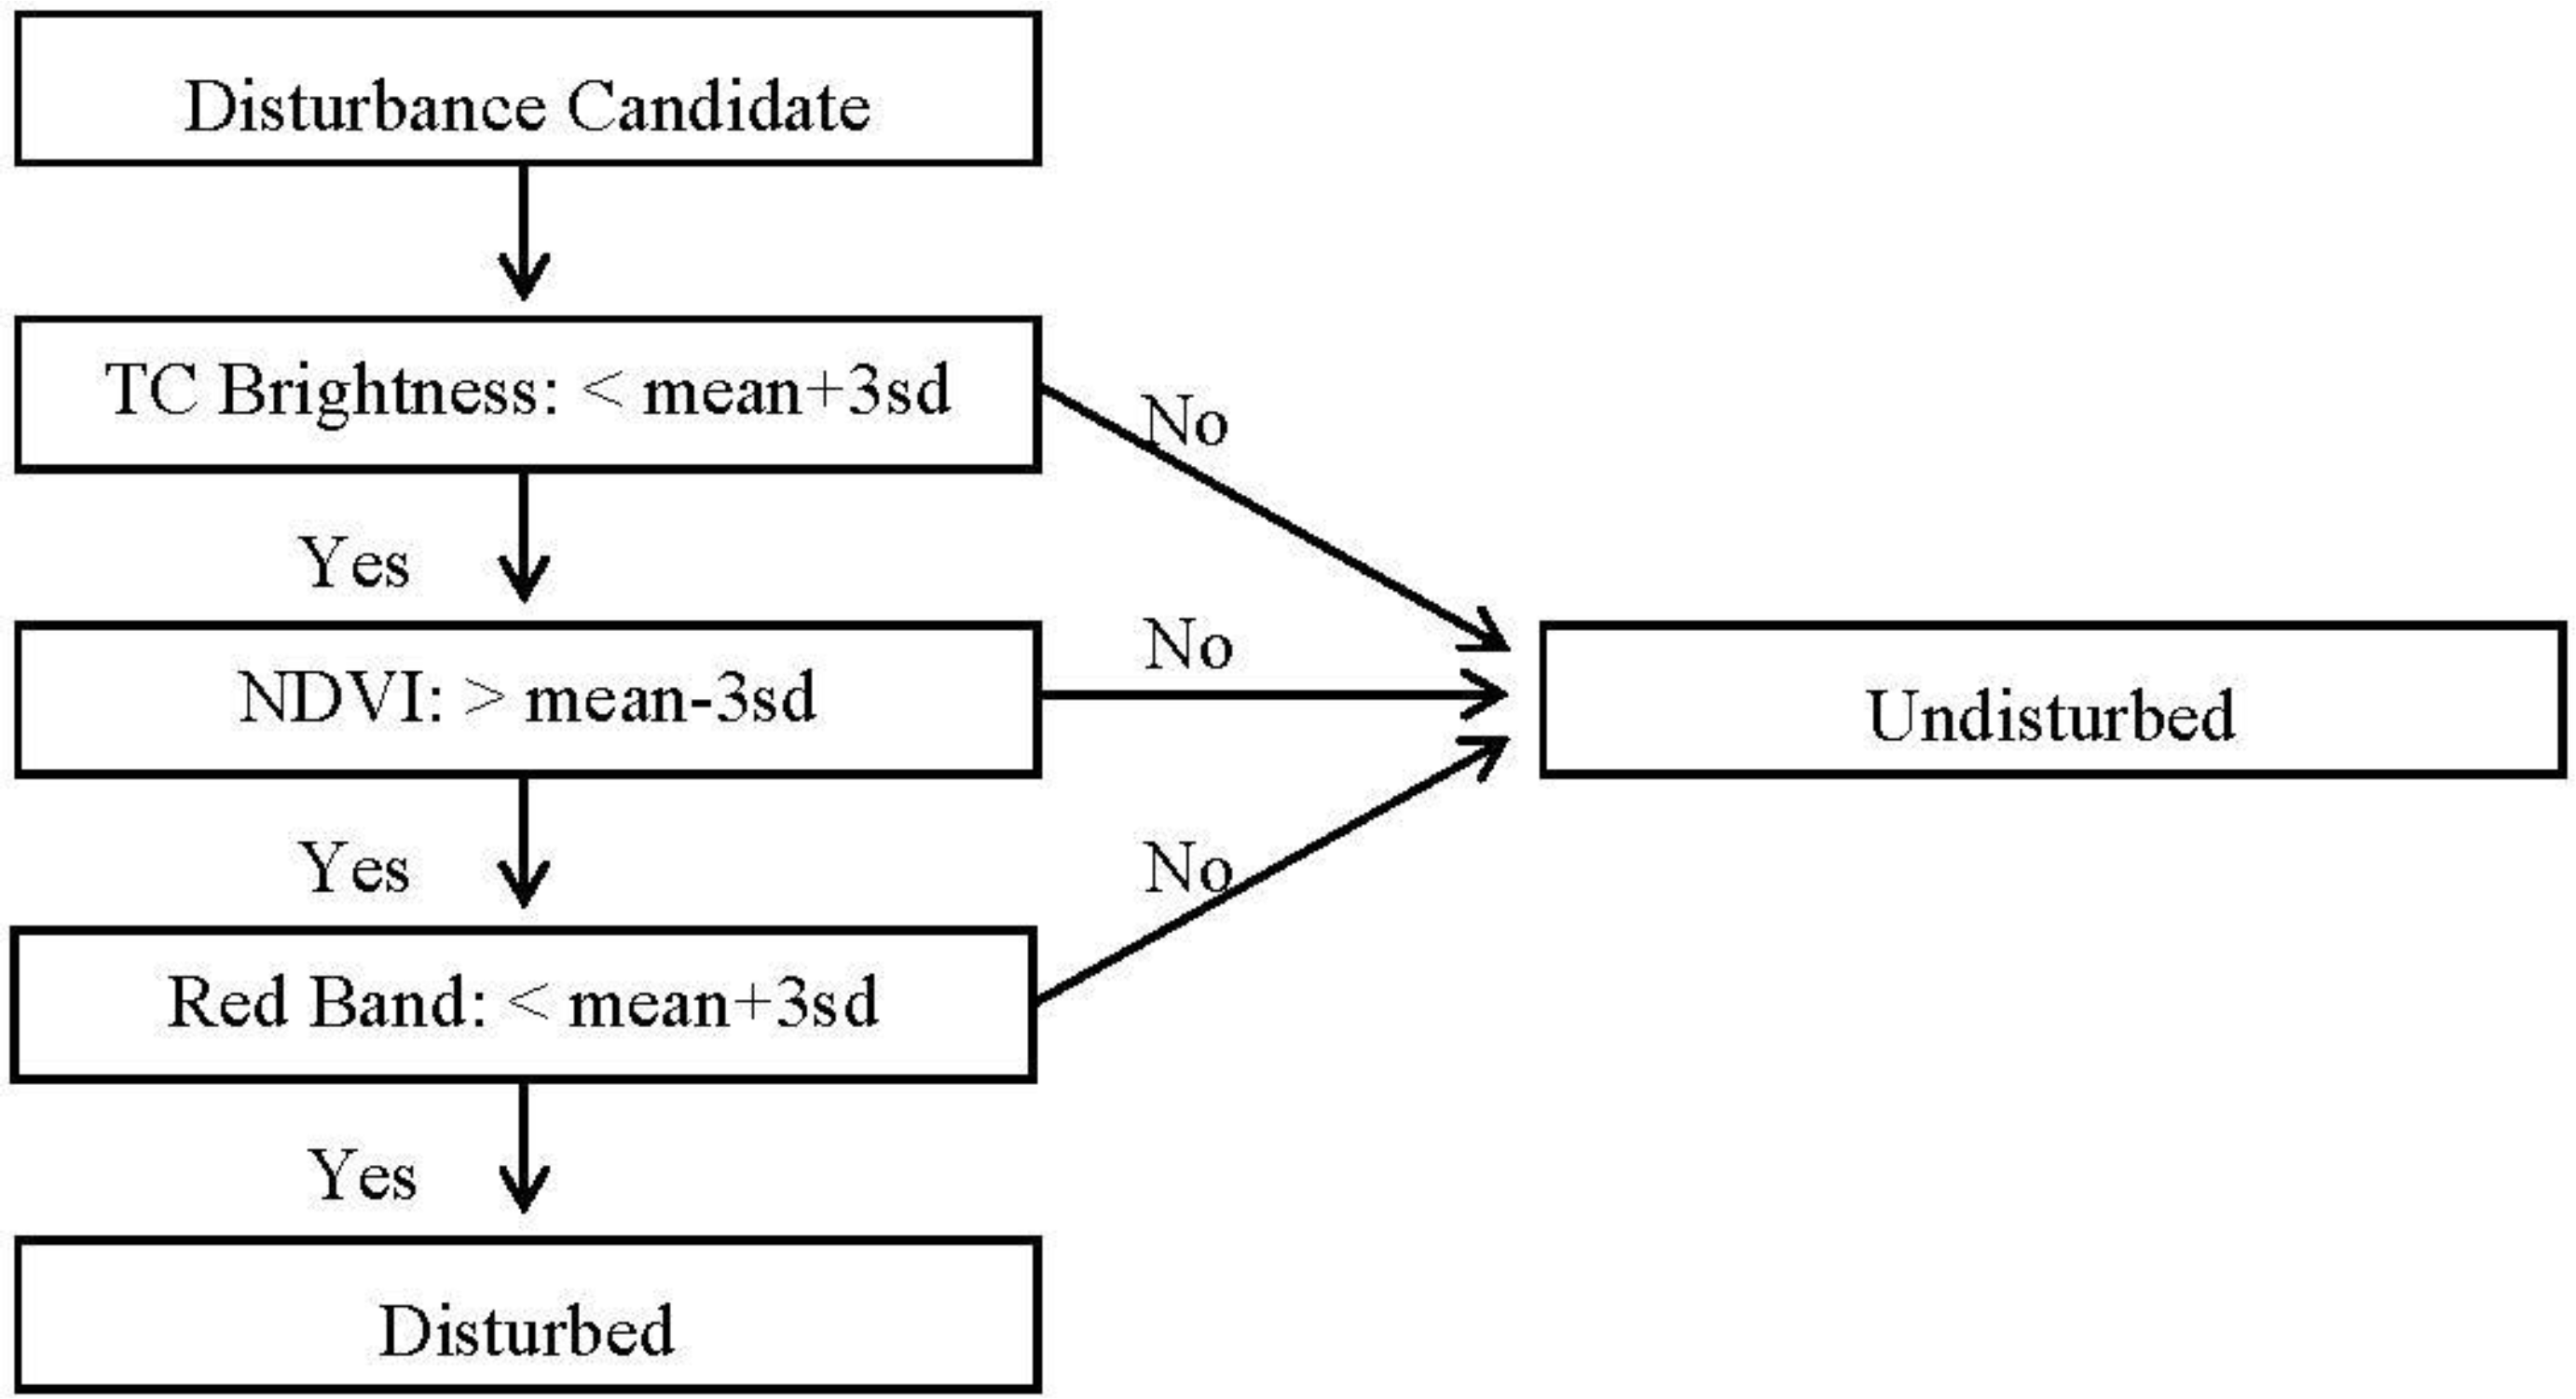
2.3.2. Disturbance Mapping

The method described in Healey, et al. [45], which is based on the disturbance index (DI), was adopted as the core algorithm to map disturbances in this paper. There have been quite a few other Landsat-based disturbance mapping algorithms that have been developed recently, including Kennedy, et al. [46], Huang, et al. [47], Kennedy, et al. [48] and Zhu, et al. [49]. However, most of them require dense stacks of Landsat images, which are difficult to obtain over Russia due to a lack of data over the country. On the other hand, the DI-based method has been proven to be effective in mapping forest disturbances in the Russian boreal forest by Loboda et al. [33], therefore it was used in favor of other methods. The DI for each image was calculated as a z score of Tasseled Cap [50,51] Brightness, Greenness and Wetness components weighted by the relevance index within mature forest. Landsat data was converted into Brightness, Greenness and Wetness indices using surface reflectance coefficients [52]. A mature forest mask was identified and mapped for each Landsat scene using Maximum Likelihood Classification (0.7 minimum probability) based on mature forest samples selected by the analyst in each scene. The large spatial extent and consequent diversity of forest types and conditions in combination with the goal of very high confidence mapping necessitated visual confirmation of mature forest samples by the analyst. Multiple DI images from the growing season of the same year were composited to create a single annual DI image. Image compositing increased the availability of clear-surface observations as many cloud and shadow-related gaps in observations within individual scenes were filled with data from other available images. In compositing, preference was given to pixels at the end of the growing season in an attempt to capture disturbances more fully and provide a more precise time-stamp for the disturbance. Cloud and shadow-affected pixels in the final composite were assigned a fill value.
DI image stacks were subsequently used to map and time-stamp forest disturbances. Difference DI (ΔDI) was calculated for each two adjacent years. At locations where one or both of the corresponding pixels were assigned the fill value, the values of ΔDI of those pixels were also set to the fill value. The pixels with non-fill ΔDI values of greater than 3 were considered as potential disturbances. Additional post-processing of candidate pixels was needed to account for strong inter-annual variability in surface reflectance of objects which are not associated with disturbances. Specifically, spectral signatures of wetlands in the northern section of European Russia and across Western Siberia change dramatically between years as the water table shifts in response to climatic and management events. Similarly, managed croplands and pastures exhibit large inter-annual variability in surface conditions based on crop rotation stages and other management practices. To eliminate commission error associated with spectral change of non-forested pixels, a suite of spectral thresholds was added, including the Tasseled Cap (TC) Brightness index, the Normalized Difference Vegetation Index (NDVI), and the surface reflectance in the red (0.65 µm) range of the electro-magnetic spectrum (Band 3 of the Landsat image). These thresholds were selected to identify whether there was forest at the location of a disturbance candidate pixel in the base year (i.e., the earlier year in each image pair based on which ΔDI was calculated), and were derived using the mean + or – 3 standard deviations of all pixels in the layers of the TC Brightness Index, NDVI and red band within the “mature forest” masks developed for each scene to compute DI (Figure 4). The 3 standard deviation threshold was selected to maximize the reparability of forest versus non-forest signatures since the distribution of the values within the mature forest masks was near-normal. Additionally, a series of tests were performed on a subset of images in areas with major forest/non-forest confusion using 1, 2 and 3 standard deviations. Three standard deviations was visually determined to be necessary to avoid commission error. Relative to forest pixels, non-forest pixels typically have high values in TC Brightness and the red spectrum, and low values in NDVI. If a disturbance candidate met all three criteria simultaneously, it was identified as a disturbed pixel and marked by the year in which it was discovered to be disturbed (i.e., the latter year in each image pair). If a pixel was disturbed multiple times as recorded by the temporal stack, the latest disturbance event in each stack was given precedence.
A time-stamped single-layer disturbance map was produced for each of the 55 Landsat stacks. Across the full extent of Russian forests, 15 classes were mapped: 14 disturbed classes represented by the individual years during which the disturbances were observed, and one undisturbed class. However, it is important to note that not all 14 classes were mapped in each stack and the number of classes was determined by stack density.

2.3.3. Accuracy Assessment
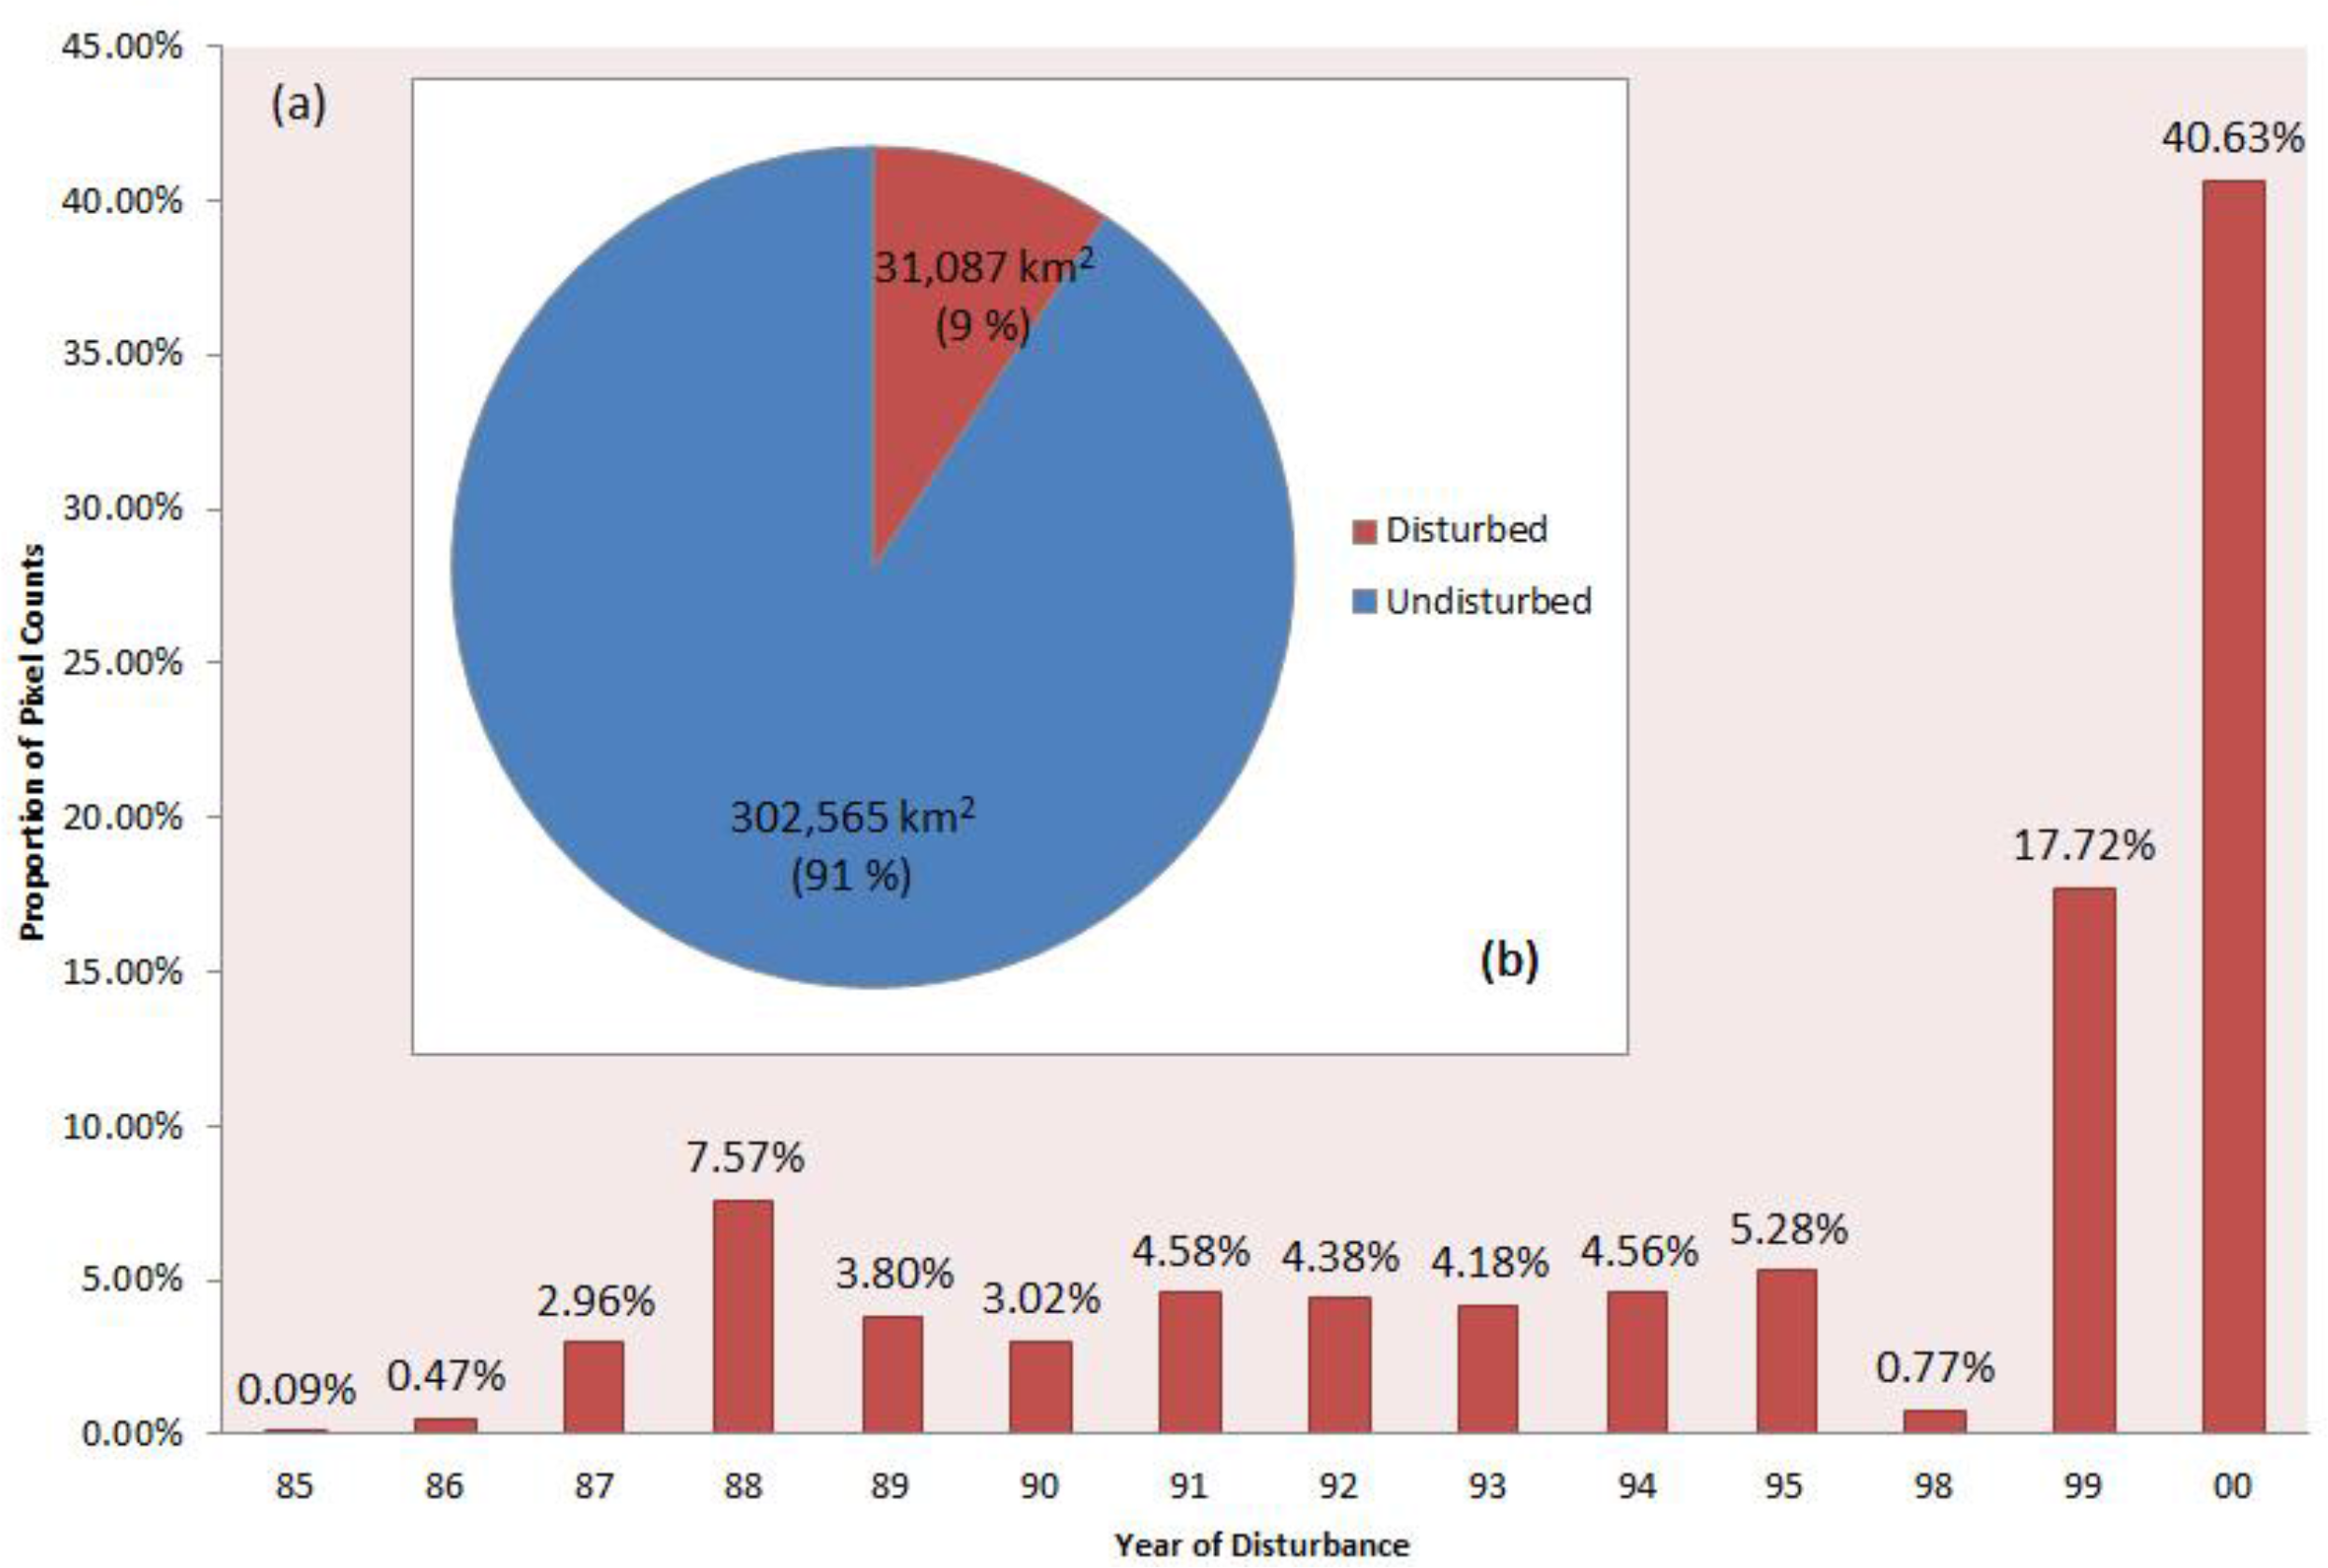
The results of the aforementioned semi-automated disturbance classification algorithm were evaluated through an analyst-driven double-blind validation. In preparation, a total of 1542 random sample points stratified disproportionally across all classes, with a goal of a minimum of 100 points per class distributed across all available maps, were obtained. These points were equally distributed among all the maps where a particular class was observed. For instance, the disturbed-in-2000 class appeared in 36 maps; hence each map was assigned three sample points within this class, bringing the total sample to 108 validation points for this class.
The double-blind method separates the process of mapping and random point generation from analyst-driven assessment by involving a separate set of analysts who have no a-priori knowledge of disturbances in the area and no prior involvement in the processing stream. These analysts are requested to examine the stack of imagery and assign the year of disturbance or “undisturbed” category to a set of points with no attributive information. No prior information is given to the analyst regarding the number of pixels expected to belong to a particular disturbed or undisturbed category with the varying number of points among image stacks.
Finally, the time-stamped sample points were compared with the classification results through the construction of the confusion matrices and corresponding statistics including the omission and commission errors, overall accuracy and Kappa coefficient. In addition to the global accuracy assessment (i.e., across the entire Russian boreal forest), the 55 maps were divided into several groups based on either geographical location (i.e., European Russia, Western Siberia and Eastern Siberia) or stack density (i.e., sparse or dense). For each of these groups, the evaluation statistics were also calculated and compared.

3. Results

Figure 5 shows the final disturbance map for one stack (Path 135, Row 21) as an example. The overall accuracy, calculated based on the 55 maps across the entire Russian boreal forest, was 83.98%, along with a Kappa coefficient of 0.83 (Table 1). Overall commission and omission errors of the classification are low. The average omission error for all classes is 11.24%, with the lowest omission error for 1998 disturbances (0.00%). The omission error for the undisturbed class is relatively high at 55.04%. In terms of commission error, the average value is 16.28%, and the range across all classes is relatively narrower than that of the omission error, with the largest and smallest being 30.48% (for 1990 disturbances) and 1.00% (for 1995 disturbances), respectively.
The values of overall accuracy and Kappa coefficient are very close for all the maps across the entire Russian forests as well as across three major geographic regions and between dense and sparse stacks of imagery (Table 2). The lowest Kappa (0.76) and overall accuracy (79.01%) is found in Western Siberia—a region dominated by wetlands. The highest Kappa (0.85) and overall accuracy (86.69%) is found in Eastern Siberia. A small difference in Kappa and overall accuracy is also registered between sparse and dense stacks of imagery. It appears that the confusion between specific time-stamps of disturbances is slightly higher in dense stacks, whereas a smaller number of selections in sparse stacks results in a clearer identification of the time of disturbance.
Figure 6 shows the distribution of the proportion of disturbed pixel counts according to the year of the disturbances as well as the comparison of overall area (km2) between undisturbed and disturbed classes. The total area classified as disturbed is 31,087 km2, whereas the total area classified as undisturbed is nearly ten times larger (302,565 km2). As shown in Figure 6b, the number of disturbed pixels among different years is not equally distributed, with about 40% of disturbances occurring in 2000. There are very few pixels that were identified as disturbed in 1985, 1986 and 1998, and no pixels were identified as disturbed in 1996 and 1997 (hence these two years are not shown in the figure).
The number of disturbed and undisturbed pixels is not equally distributed as well among three geographical regions. As shown in Figure 7, most undisturbed (71%) and disturbed (64%) pixels were identified in Eastern Siberia, which is not surprising since Eastern Siberia contributed the greatest number of Landsat stacks to the analyses. Similarly, European Russia is the second largest contributor for both undisturbed and disturbed categories, with Western Siberia being the smallest contributor. In addition to the context of geographical division, Table 3 also takes into account the temporal distribution of the disturbance samples, suggesting different temporal distribution patterns for three regions. Both Western Siberia and Eastern Siberia contributed disturbance samples in fewer years than European Russia.

4. Discussion

The disturbance maps of the 55 Landsat stacks spread across the entire Russian boreal forest was found to possess satisfactory accuracy (overall accuracy: 83.98%, Kappa: 0.83) through accuracy assessment conducted by independent analysts. The confusion matrix suggested relatively less desirable performance of the classifier in identifying the undisturbed class (Error of Omission: 55.04%). This may have multiple causes. Firstly, because the number of validation points selected for each class was similar (approximately 100), and because the undisturbed class appeared in almost all classified images, the number of validation points selected from the undisturbed class in each image was small (two points). Such a small number of validation points for this particular class resulted in the high sensitivity of the undisturbed class to errors. It implies that misassignment of individual pixels by the analysts led to substantial errors when validation results for each stack were aggregated in the end. Another potential reason involves the capability of the analysts to correctly identify disturbances. Although only Landsat images captured during the growing seasons were selected to explicitly reduce the influence of phenology, the Russian boreal forest encompasses a wide range of latitudes and altitudes. There is consequently large inter-annual variation in the beginning and end dates for the growing season. It is possible that the presence of phenological variations confused the analysts and caused them to identify forests as disturbed when this was not the case. It is also likely that the analysts were less likely to be able to differentiate between inter-annual and seasonal variability in forest conditions and natural or anthropogenic disturbances. In some cases, large gaps between image acquisitions limited the analysts’ ability to differentiate between regrowing disturbances and natural response to environmental change. As a result, the analysts might have mistakenly identified the undisturbed pixels to the disturbed classes, which inflated the Error of Omission for the undisturbed class. This scenario was especially likely since the undisturbed class was sensitive to human errors due to the small number of sample points. Finally, forests affected by insect infestation may also show signs of depressed growth over a period of time but never result in stand mortality, thus contributing to the misclassification by the analysts.
It should to be noted that while the omission error for the undisturbed class is seemingly high, it is a minor concern within the confines of this project for two reasons. Firstly, the algorithm used in this paper was designed to extract only disturbed forests and is not optimal for undisturbed forest extraction. Therefore the undisturbed class in this product was expected to be less accurate than the yearly disturbed classes. In addition, as suggested above, the Error of Omission for the undisturbed class was strongly influenced by the particular disturbed/undisturbed sample point partition that was employed, which was quite subjective. Arbitrarily increasing the number of the sample points for the undisturbed class might significantly lower the omission error, which would also further increase the numerical values of the overall accuracy and the Kappa coefficient of the overall classification; however, this would weaken the goal of this paper to identify forest disturbances with a high level of accuracy, and hence was not practiced.
In addition to the confusion matrix, the accuracy of these disturbance maps was also examined according to stratification by geographic region and stack density. The results (Table 2) suggested that regardless of the grouping criteria (i.e., geographical location or stack density), the accuracy of the classification algorithm was generally consistent. The slightly lower accuracy of classification in Western Siberia may be attributed to the fact that the number of stacks in that group (i.e., Figure 7) is smaller than the others.
It should be noted that the comparisons of the proportion of different classes, which are conducted in the analysis of this paper, should be interpreted with caution. Due to the fact that the Landsat images were not available every year for each stack, a certain amount of disturbance events in the study area were not marked by the exact years during which they occurred. Instead, they were classified into the next year when Landsat data were available. As a result, the proportion of different classes in Figures 6 and 7 merely reflects a general trend, rather than the actual temporal distribution of disturbances across the Russian boreal forest, and the presented dataset should be used as a decadal-scale reconstruction of the disturbance history of the Russian boreal forest instead of the exact annual disturbance history based on the available data. To illustrate such a caveat, note the fact that there were no pixels that were identified as disturbed in 1996 and 1997. Since it is highly unlikely that there were no disturbance events in the study area during those two years, the fact that they were missing from the results exemplify the lack of data for 1996 and 1997. Similar reasoning may explain the disproportionately high number of pixels disturbed in 2000, which is likely to be attributed to the fact that image availability for 2000 was relatively high for most of the stacks.

5. Conclusions

The Landsat-based dataset, representing a sample of disturbances in Russian forests between 1985 and 2000 described in this paper, is designed to support training and validation of continental and global-scale coarse- to moderate-resolution datasets characterizing forest cover in Russia. The mapped disturbances represent a “high confidence” rather than “most comprehensive” sample (overall 0.83 Kappa coefficient, 16.28% and 11.24% commission and omission errors, respectively), where disturbance is defined as forest-to-non-forest conversion between the subsequent dates of acquisition within the Landsat data stacks. The significance of the dataset presented in this paper is multifold. First, it can provide insights regarding the timing and locations of fire and logging events that occurred from 1985 to 2000 within the 55 selected Landsat stacks in the Russian boreal forest. Although not a wall-to-wall assessment, this effort represents the first known product with this spatial resolution and geographical span before the year 2000. The dataset could be expanded further using additional stacks (especially in European Russia where we used a random sampling scheme instead of exhaustive selection). However, the current selection of stacks is considered in this study as a good representation of the heterogeneity of the Russian boreal forest in terms of both forest composition and disturbance regime. Although the timing of disturbances provided in this dataset are approximated and linked to the dates of available imagery rather than to the actual timing of disturbance, the dataset provides an opportunity to assess variation in temporal changes in disturbance rates at decadal scales across Russia as a whole, and at finer temporal scales in European Russia, where dense stacks of Landsat data are available. Secondly, this dataset can be used to quantify long-term forest disturbance history within individual Landsat scenes. While we did not provide a differentiation between fire- and logging-driven disturbances, this dataset represents the basis for attribution based on extent, shape and possibly additional spectral information in the data. Third, this dataset possesses the potential to serve as a data input to studies that require information regarding the disturbance history of the Russian boreal forest. For instance, this study will be followed by a “wall-to-wall” stand age distribution map of the entire Russian boreal forest. Finally, these disturbance maps will be released to the broader scientific community in order to reduce duplication of effort.

Acknowledgments

The work on this project has been supported by the NASA Carbon Cycle project NNX11AE39G and the NASA Land Cover and Land Use Change project NNX12AD34G. The authors would also like to thank Claire Weber of the University of Maryland, College Park for support of validation activities.

Author Contributions

Dong Chen and Tatiana Loboda developed the concept and research plan. Dong Chen produced the presented dataset. Saurabh Channan prepared the Landsat surface reflectance data. Tatiana Loboda and Amanda Hoffman-Hall participated in the validation activities. All authors contributed to the writing of the manuscript.

Conflicts of Interest

The authors declare no conflict of interest.

References

  1. Zhang, Q.; Pavlic, G.; Chen, W.; Latifovic, R.; Fraser, R.; Cihlar, J. Deriving stand age distribution in boreal forests using SPOT vegetation and NOAA AVHRR imagery. Remote Sens. Environ 2004, 91, 405–418. [Google Scholar]
  2. Goldammer, J.G.; Furyaev, V.V. Fire in Ecosystems of Boreal Eurasia: Ecological Impacts and Links to the Global System. In Fire in Ecosystems of Boreal Eurasia; Goldammer, J.G., Furyaev, V.V., Eds.; Kluwer Academic Publishers: Dordrecht, the Netherlands, 1996; Volume 48, pp. 1–20. [Google Scholar]
  3. Food and Agriculture Organization (FAO), Russian Federation Forest Sector Outlook Study to 2030; FAO: Rome, Italy, 2012.
  4. Food and Agriculture Organization (FAO), FAO Yearbook of Forest Products 2011; FAO: Rome, Italy, 2013.
  5. Pruitt, W.O.; Baskin, L.M. Boreal Forest of Canada and Russia; Pensoft: Sofia, Bulgaria, 2004. [Google Scholar]
  6. Zlotin, R. Biodiversity and Productivity of Ecosystems. In The Physical Geography of Northern Eurasia; Shahgedanova, M., Ed.; Oxford University Press: Oxford, UK, 2002. [Google Scholar]
  7. Magnani, F.; Mencuccini, M.; Borghetti, M.; Berbigier, P.; Berninger, F.; Delzon, S.; Grelle, A.; Hari, P.; Jarvis, P.G.; Kolari, P.; et al. The human footprint in the carbon cycle of temperate and boreal forests. Nature 2007, 447, 849–851. [Google Scholar]
  8. Pregitzer, K.S.; Euskirchen, E.S. Carbon cycling and storage in world forests: Biome patterns related to forest age. Glob. Chang. Biol 2004, 10, 2052–2077. [Google Scholar]
  9. Gower, S.T.; Krankina, O.; Olson, R.J.; Apps, M.; Linder, S.; Wang, C. Net primary production and carbon allocation patterns of boreal forest ecosystems. Ecol. Appl 2001, 11, 1395–1411. [Google Scholar]
  10. Amiro, B.D.; Chen, J.M.; Liu, J. Net primary productivity following forest fire for Canadian ecoregions. Can. J. For. Res 2000, 30, 939–947. [Google Scholar]
  11. Lyons, E.A.; Jin, Y.F.; Randerson, J.T. Changes in surface albedo after fire in boreal forest ecosystems of interior Alaska assessed using MODIS satellite observations. J. Geophys. Res. Biogeosci 2008, 113. [Google Scholar] [CrossRef]
  12. McMillan, A.M.S.; Goulden, M.L. Age-dependent variation in the biophysical properties of boreal forests. Glob. Biogeochem Cycle 2008, 22. [Google Scholar] [CrossRef]
  13. Amiro, B.D.; Orchansky, A.L.; Barr, A.G.; Black, T.A.; Chambers, S.D.; Chapin, F.S.; Gouldenf, M.L.; Litvakg, M.; Liu, H.P.; McCaughey, J.H.; et al. The effect of post-fire stand age on the boreal forest energy balance. Agric. For. Meteorol 2006, 140, 41–50. [Google Scholar]
  14. Randerson, J.T.; Liu, H.; Flanner, M.G.; Chambers, S.D.; Jin, Y.; Hess, P.G.; Pfister, G.; Mack, M.C.; Treseder, K.K.; Welp, L.R.; et al. The impact of boreal forest fire on climate warming. Science 2006, 314, 1130–1132. [Google Scholar]
  15. Bartalev, S.A.; Belward, A.S.; Erchov, D.V.; Isaev, A.S. A new SPOT4-vegetation derived land cover map of northern Eurasia. Int. J. Remote Sens 2003, 24, 1977–1982. [Google Scholar]
  16. Friedl, M.A.; McIver, D.K.; Hodges, J.C.F.; Zhang, X.Y.; Muchoney, D.; Strahler, A.H.; Woodcock, C.E.; Gopal, S.; Schneider, A.; Cooper, A.; et al. Global land cover mapping from MODIS: Algorithms and early results. Remote Sens. Environ 2002, 83, 287–302. [Google Scholar]
  17. Friedl, M.A.; Sulla-Menashe, D.; Tan, B.; Schneider, A.; Ramankutty, N.; Sibley, A.; Huang, X.M. MODIS collection 5 global land cover: Algorithm refinements and characterization of new datasets. Remote Sens. Environ 2010, 114, 168–182. [Google Scholar]
  18. Hansen, M.C.; DeFries, R.S.; Townshend, J.R.G.; Carroll, M.; Dimiceli, C.; Sohlberg, R.A. Development of 500 Meter Vegetation Continuous Field Maps Using MODIS Data. Proceedings of the IEEE International Geoscience and Remote Sensing Symposium (IGARSS ’03), Toulouse, France,, 21–25 July 2003; 261, pp. 264–266.
  19. Sexton, J.O.; Song, X.-P.; Feng, M.; Noojipady, P.; Anand, A.; Huang, C.; Kim, D.-H.; Collins, K.M.; Channan, S.; DiMiceli, C.; et al. Global, 30-m resolution continuous fields of tree cover: Landsat-based rescaling of MODIS vegetation continuous fields with Lidar-based estimates of error. Int. J. Digit. Earth 2013, 6, 427–448. [Google Scholar]
  20. Hansen, M.C.; Potapov, P.V.; Moore, R.; Hancher, M.; Turubanova, S.A.; Tyukavina, A.; Thau, D.; Stehman, S.V.; Goetz, S.J.; Loveland, T.R.; et al. High-resolution global maps of 21st-century forest cover change. Science 2013, 342, 850–853. [Google Scholar]
  21. Roy, D.P.; Jin, Y.; Lewis, P.E.; Justice, C.O. Prototyping a global algorithm for systematic fire-affected area mapping using MODIS time series data. Remote Sens. Environ 2005, 97, 137–162. [Google Scholar]
  22. Roy, D.P.; Boschetti, L.; Justice, C.O.; Ju, J. The collection 5 MODIS burned area product—Global evaluation by comparison with the MODIS active fire product. Remote Sens. Environ 2008, 112, 3690–3707. [Google Scholar]
  23. Roy, D.P.; Lewis, P.E.; Justice, C.O. Burned area mapping using multi-temporal moderate spatial resolution data—A bi-directional reflectance model-based expectation approach. Remote Sens. Environ 2002, 83, 263–286. [Google Scholar]
  24. Giglio, L.; Loboda, T.; Roy, D.P.; Quayle, B.; Justice, C.O. An active-fire based burned area mapping algorithm for the MODIS sensor. Remote Sens. Environ 2009, 113, 408–420. [Google Scholar]
  25. Tansey, K.; Grégoire, J.-M.; Stroppiana, D.; Sousa, A.; Silva, J.; Pereira, J.M.C.; Boschetti, L.; Maggi, M.; Brivio, P.A.; Fraser, R.; et al. Vegetation burning in the year 2000: Global burned area estimates from SPOT vegetation data. J. Geophys. Res. Atmos 2004, 109. [Google Scholar] [CrossRef]
  26. Tansey, K.; Grégoire, J.-M.; Defourny, P.; Leigh, R.; Pekel, J.-F.; van Bogaert, E.; Bartholomé, E. A new, global, multi-annual (2000–2007) burnt area product at 1 km resolution. Geophys. Res. Lett 2008, 35. [Google Scholar] [CrossRef]
  27. Simon, M.; Plummer, S.; Fierens, F.; Hoelzemann, J.J.; Arino, O. Burnt area detection at global scale using ATSR-2: The globscar products and their qualification. J. Geophys. Res. Atmos 2004, 109. [Google Scholar] [CrossRef]
  28. Plummer, S.; Arino, O.; Simon, M.; Steffen, W. Establishing a earth observation product service for the terrestrial carbon community: The globcarbon initiative. Mitig. Adapt. Strateg. Glob. Chang 2006, 11, 97–111. [Google Scholar]
  29. Plummer, S.; Arino, O.; Ranera, F.; Tansey, K.; Jing, C.; Dedieu, G.; Eva, H.; Piccolini, I.; Leigh, R.; Borstlap, G.; et al. The Glob Carbon Initiative Global Biophysical Products for Terrestrial Carbon Studies. Proceedings of the IEEE International Geoscience and Remote Sensing Symposium (IGARSS 2007, Barcelona, Spain, 23–28 July 2007; pp. 2408–2411.
  30. Sukhinin, A.I.; French, N.H.F.; Kasischke, E.S.; Hewson, J.H.; Soja, A.J.; Csiszar, I.A.; Hyer, E.J.; Loboda, T.; Conrad, S.G.; Romasko, V.I.; et al. AVHRR-based mapping of fires in Russia: New products for fire management and carbon cycle studies. Remote Sens. Environ 2004, 93, 546–564. [Google Scholar]
  31. Bartalev, S.A.; Egorov, V.A.; Loupian, E.A.; Uvarov, I.A. Multi-year circumpolar assessment of the area burnt in boreal ecosystems using SPOT-VEGETATION. Int. J. Remote Sens 2007, 28, 1397–1404. [Google Scholar]
  32. Loboda, T.; O’Neal, K.J.; Csiszar, I. Regionally adaptable dNBR-based algorithm for burned area mapping from MODIS data. Remote Sens. Environ 2007, 109, 429–442. [Google Scholar]
  33. Loboda, T.V.; Zhang, Z.; O’Neal, K.J.; Sun, G.; Csiszar, I.A.; Shugart, H.H.; Sherman, N.J. Reconstructing disturbance history using satellite-based assessment of the distribution of land cover in the Russian far east. Remote Sens. Environ 2012, 118, 241–248. [Google Scholar]
  34. Pedelty, J.; Devadiga, S.; Masuoka, E.; Brown, M.; Pinzon, J.; Tucker, C.; Roy, D.; Junchang, J.; Vermote, E.; Prince, S.; et al. Generating a Long-Term Land Data Record from the AVHRR and MODIS Instruments. Proceedings of the IEEE International Geoscience and Remote Sensing Symposium (IGARSS 2007), Barcelona, Spain, 23–28 July 2007; pp. 1021–1025.
  35. Tishkov, A. Boreal Forests. In The Physical Geography of Northern Eurasia; Shahgedanova, M., Ed.; Oxford University Press: New York, NY, USA, 2002; pp. 216–233. [Google Scholar]
  36. Shahgedanova, M. Climate at Present and in the Historical Past. In The Physical Geography of Northern Eurasia; Shahgedanova, M., Ed.; Oxford University Press: New York, NY, USA, 2002; pp. 70–102. [Google Scholar]
  37. Osawa, A.; Zyryanova, O.A. Introduction. In Permafrost Ecosystems: Siberian Larch Forests; Osawa, A., Zyryanova, O.A., Matsuura, Y., Kajimoto, T., Wein, R.W., Eds.; Springer: New York, NY, USA, 2010; Volume 209, pp. 3–15. [Google Scholar]
  38. Goldammer, J.G.; Stocks, B.J. Eurasian Perspective of Fire: Dimension, Management, Policies, and Scientific Requirements. In Fire, Climate Change, and Carbon Cycling in the Boreal Forest; Kasischke, E.S., Stocks, B.J., Eds.; Springer: London, UK, 2000; pp. 49–65. [Google Scholar]
  39. Danilin, I.; Crow, T. The Great Siberian Forest: Challenges and Opportunities of Scale. In Patterns and Processes in Forest Landscapes; Lafortezza, R., Sanesi, G., Chen, J., Crow, T., Eds.; Springer: Dordrecht, The Netherland, 2008; pp. 47–66. [Google Scholar]
  40. Potapov, P.; Turubanova, S.; Zhuravleva, I.; Hansen, M.; Yaroshenko, A.; Manisha, A. Forest cover change within the Russian European north after the breakdown of soviet union (1990–2005). Int. J. For. Res 2012, 2012. [Google Scholar] [CrossRef]
  41. Hansen, M.; DeFries, R.; Townshend, J.R.; Carroll, M.; Dimiceli, C.; Sohlberg, R. Percent Tree Cover, Collection 4, Vegetation Continuous Fields MOD44B. Available online: http://glcf.umd.edu/data/vcf/ (accessed on 4 May 2014).
  42. Masek, J.G.; Vermote, E.F.; Saleous, N.E.; Wolfe, R.; Hall, F.G.; Huemmrich, K.F.; Feng, G.; Kutler, J.; Teng-Kui, L. A Landsat surface reflectance dataset for North America, 1990–2000. IEEE Geosci. Remote Sens. Lett 2006, 3, 68–72. [Google Scholar]
  43. Feng, M.; Sexton, J.O.; Huang, C.; Masek, J.G.; Vermote, E.F.; Gao, F.; Narasimhan, R.; Channan, S.; Wolfe, R.E.; Townshend, J.R. Global surface reflectance products from Landsat: Assessment using coincident MODIS observations. Remote Sens. Environ 2013, 134, 276–293. [Google Scholar]
  44. Jones, J.W.; Starbuck, M.J.; Jenkerson, C.B. Landsat Surface Reflectance Quality Assurance Extraction (Version 1.7); U.S. Geological Survey: Reston, VA, USA, 2013; Chapter C7; p. 9. [Google Scholar]
  45. Healey, S.P.; Cohen, W.B.; Yang, Z.; Krankina, O.N. Comparison of tasseled cap-based Landsat data structures for use in forest disturbance detection. Remote Sens. Environ 2005, 97, 301–310. [Google Scholar]
  46. Kennedy, R.E.; Cohen, W.B.; Schroeder, T.A. Trajectory-based change detection for automated characterization of forest disturbance dynamics. Remote Sens. Environ 2007, 110, 370–386. [Google Scholar]
  47. Huang, C.; Goward, S.N.; Masek, J.G.; Thomas, N.; Zhu, Z.; Vogelmann, J.E. An automated approach for reconstructing recent forest disturbance history using dense Landsat time series stacks. Remote Sens. Environ 2010, 114, 183–198. [Google Scholar]
  48. Kennedy, R.E.; Yang, Z.; Cohen, W.B. Detecting trends in forest disturbance and recovery using yearly Landsat time series: 1. Landtrendr—Temporal segmentation algorithms. Remote Sens. Environ 2010, 114, 2897–2910. [Google Scholar]
  49. Zhu, Z.; Woodcock, C.E.; Olofsson, P. Continuous monitoring of forest disturbance using all available Landsat imagery. Remote Sens. Environ 2012, 122, 75–91. [Google Scholar]
  50. Crist, E.P.; Cicone, R.C. A physically-based transformation of thematic mapper data—The TM tasseled cap. IEEE Trans. Geosci. Remote Sens 1984, 3, 256–263. [Google Scholar]
  51. Kauth, R.J.; Thomas, G.S. The Tasseled Cap—A Graphic Description of the Spectral-Temporal Development of Agricultural Crops as Seen by Landsat. Proceedings of the Symposium on Machine Processing of Remotely Sensed Data, West Lafayette, IN, USA, 29 June–1 July 1976; pp. 41–51.
  52. Crist, E.P. A TM tasseled cap equivalent transformation for reflectance factor data. Remote Sens. Environ 1985, 17, 301–306. [Google Scholar]
Figure 1. Distribution of the disturbance maps of the individual stacks. Red, blue and green represent stacks in European Russia, Western Siberia and Eastern Siberia, respectively. Letters in the polygons indicate the density status of each stack, with “D” and “S” representing dense and sparse stacks, respectively.
Remotesensing 06 06020f1
Figure 2. Workflow of deriving the cloud/cloud shadow mask.
Remotesensing 06 06020f2
Figure 3. Performance of the cloud/cloud shadow masks in two Landsat scenes. The images on the left show the existence of clouds and cloud shadows in the original Landsat images, and the images on the right show the cloud/cloud masks at the corresponding locations, indicated in black.
Remotesensing 06 06020f3aRemotesensing 06 06020f3b
Figure 4. The decision tree that was used to determine whether a disturbance candidate was truly disturbed. All mean and standard deviation values were calculated based on the mature forest mask of each scene obtained during previous stage.
Remotesensing 06 06020f4
Figure 5. Final disturbance map for Path 135, Row 21 with disturbances being color encoded according to the year in which they occurred. (a) Overall map; (b) A zoomed in region; (cg) The region corresponding to (b) on the original Landsat images (color composite: 7-4-3) in 1989, 1990, 1992, 1994 and 2000, respectively.
Remotesensing 06 06020f5
Figure 6. (a) Distribution of proportion of disturbed pixel counts according to the year of the disturbances; (b) ratio between pixels that were identified as disturbed and those that were identified as undisturbed.
Remotesensing 06 06020f6
Figure 7. Distribution of (a) undisturbed and (b) disturbed class among Eastern Siberia, European Russia and Western Siberia in area (km2) and percentage. The difference in size of the two pie charts is indicative of the fact that the total area of undisturbed class is larger than that of the disturbed class.
Remotesensing 06 06020f7
Table 1. Confusion matrix and corresponding statistics obtained through the accuracy assessment based on all validation points. “UD” stands for the “undisturbed” class.
ClassificationReference
UD19851986198719881989199019911992199319941995199819992000SumError of Comm.
UD1070014300000004011910.08%
19854811500000000000010019.00%
1986828901000100000010111.88%
1987500961100030000110710.28%
19881103090000002000110715.89%
1989703008900000000110011.00%
199012000213730001003110530.48%
199140000109300010101007.00%
19921600020008000000210020.00%
1993500546005750000010025.00%
199460000000209400111049.62%
199510000000000990001001.00%
1998162001100200054228032.50%
1999900010001001099011110.81%
20002701000210000017610829.63%
Sum23885111102106114759491789710154111851542

Error of Omis.55.04%4.71%19.82%5.88%15.09%21.93%2.67%1.06%12.09%3.85%3.09%1.98%0.00%10.81%10.59%

Overall Accuracy: 83.98%, Kappa: 0.83
Omis.: Error of Omission; Comm.: Error of Commission.
Table 2. Summary of the overall accuracy and Kappa coefficient for all the stacks as well as stacks that were grouped based on the geographical locations and stack density.
StatisticsRussiaEuropean RussiaWestern SiberiaEastern SiberiaSparse StacksDense Stacks
Number of Stacks55167324312
Number of Validation Points1542745181616758784
Overall Accuracy83.98%82.95%79.01%86.69%85.36%82.65%
Kappa0.830.810.760.850.840.81
Table 3. Distribution of disturbed pixels in area (km2) according to the year of the disturbances for European Russia, Western Siberia and Eastern Siberia.
Year of DisturbanceEuropean RussiaWestern SiberiaEastern SiberiaTotal
198527N/AN/A27
1986146N/AN/A146
1987803116N/A919
1988232826N/A2354
1989490692N/A1181
199016872699939
199141014101424
1992440228991361
1993768532N/A1300
1994315N/A11021417
19959N/A16331642
19982N/A236238
19991037116033115508
2000138567610,56812,629
Total7923330519,859

