On the Semi-Automatic Retrieval of Biophysical Parameters Based on Spectral Index Optimization


 ,
, 
Abstract
:1. Introduction
- Band selection: Typically, most SIs are mathematical formulations consisting of two or three sensor spectral bands (B). How then, do we evaluate with a high enough scrutiny, whether the most sensitive spectral bands—with respect to biophysical parameter retrieval—have been selected? This question is especially relevant in view of the high number of bands associated with imaging spectrometry [32];
- SI formulation: Typically, the normalized difference (ND) formulation is applied, i.e., (B2 − B1)/(B2 + B1). But again, how do we assess, whether the applied ND formulation is the most accurate one with respect to biophysical parameter retrieval? Even given high spectral resolution multi- or hyperspectral reflectance data, there is no reason to assume that a two-band SI formulation leads to the most accurate empirical relationship [33];
- Fitting function: A regression model is typically reduced to a linear fitting exercise, directly or indirectly by prior transformation to linearity. Also here, the question is, whether the regression function selected is the most accurate one? Typically, saturation effects are common for dense canopies [14,15].
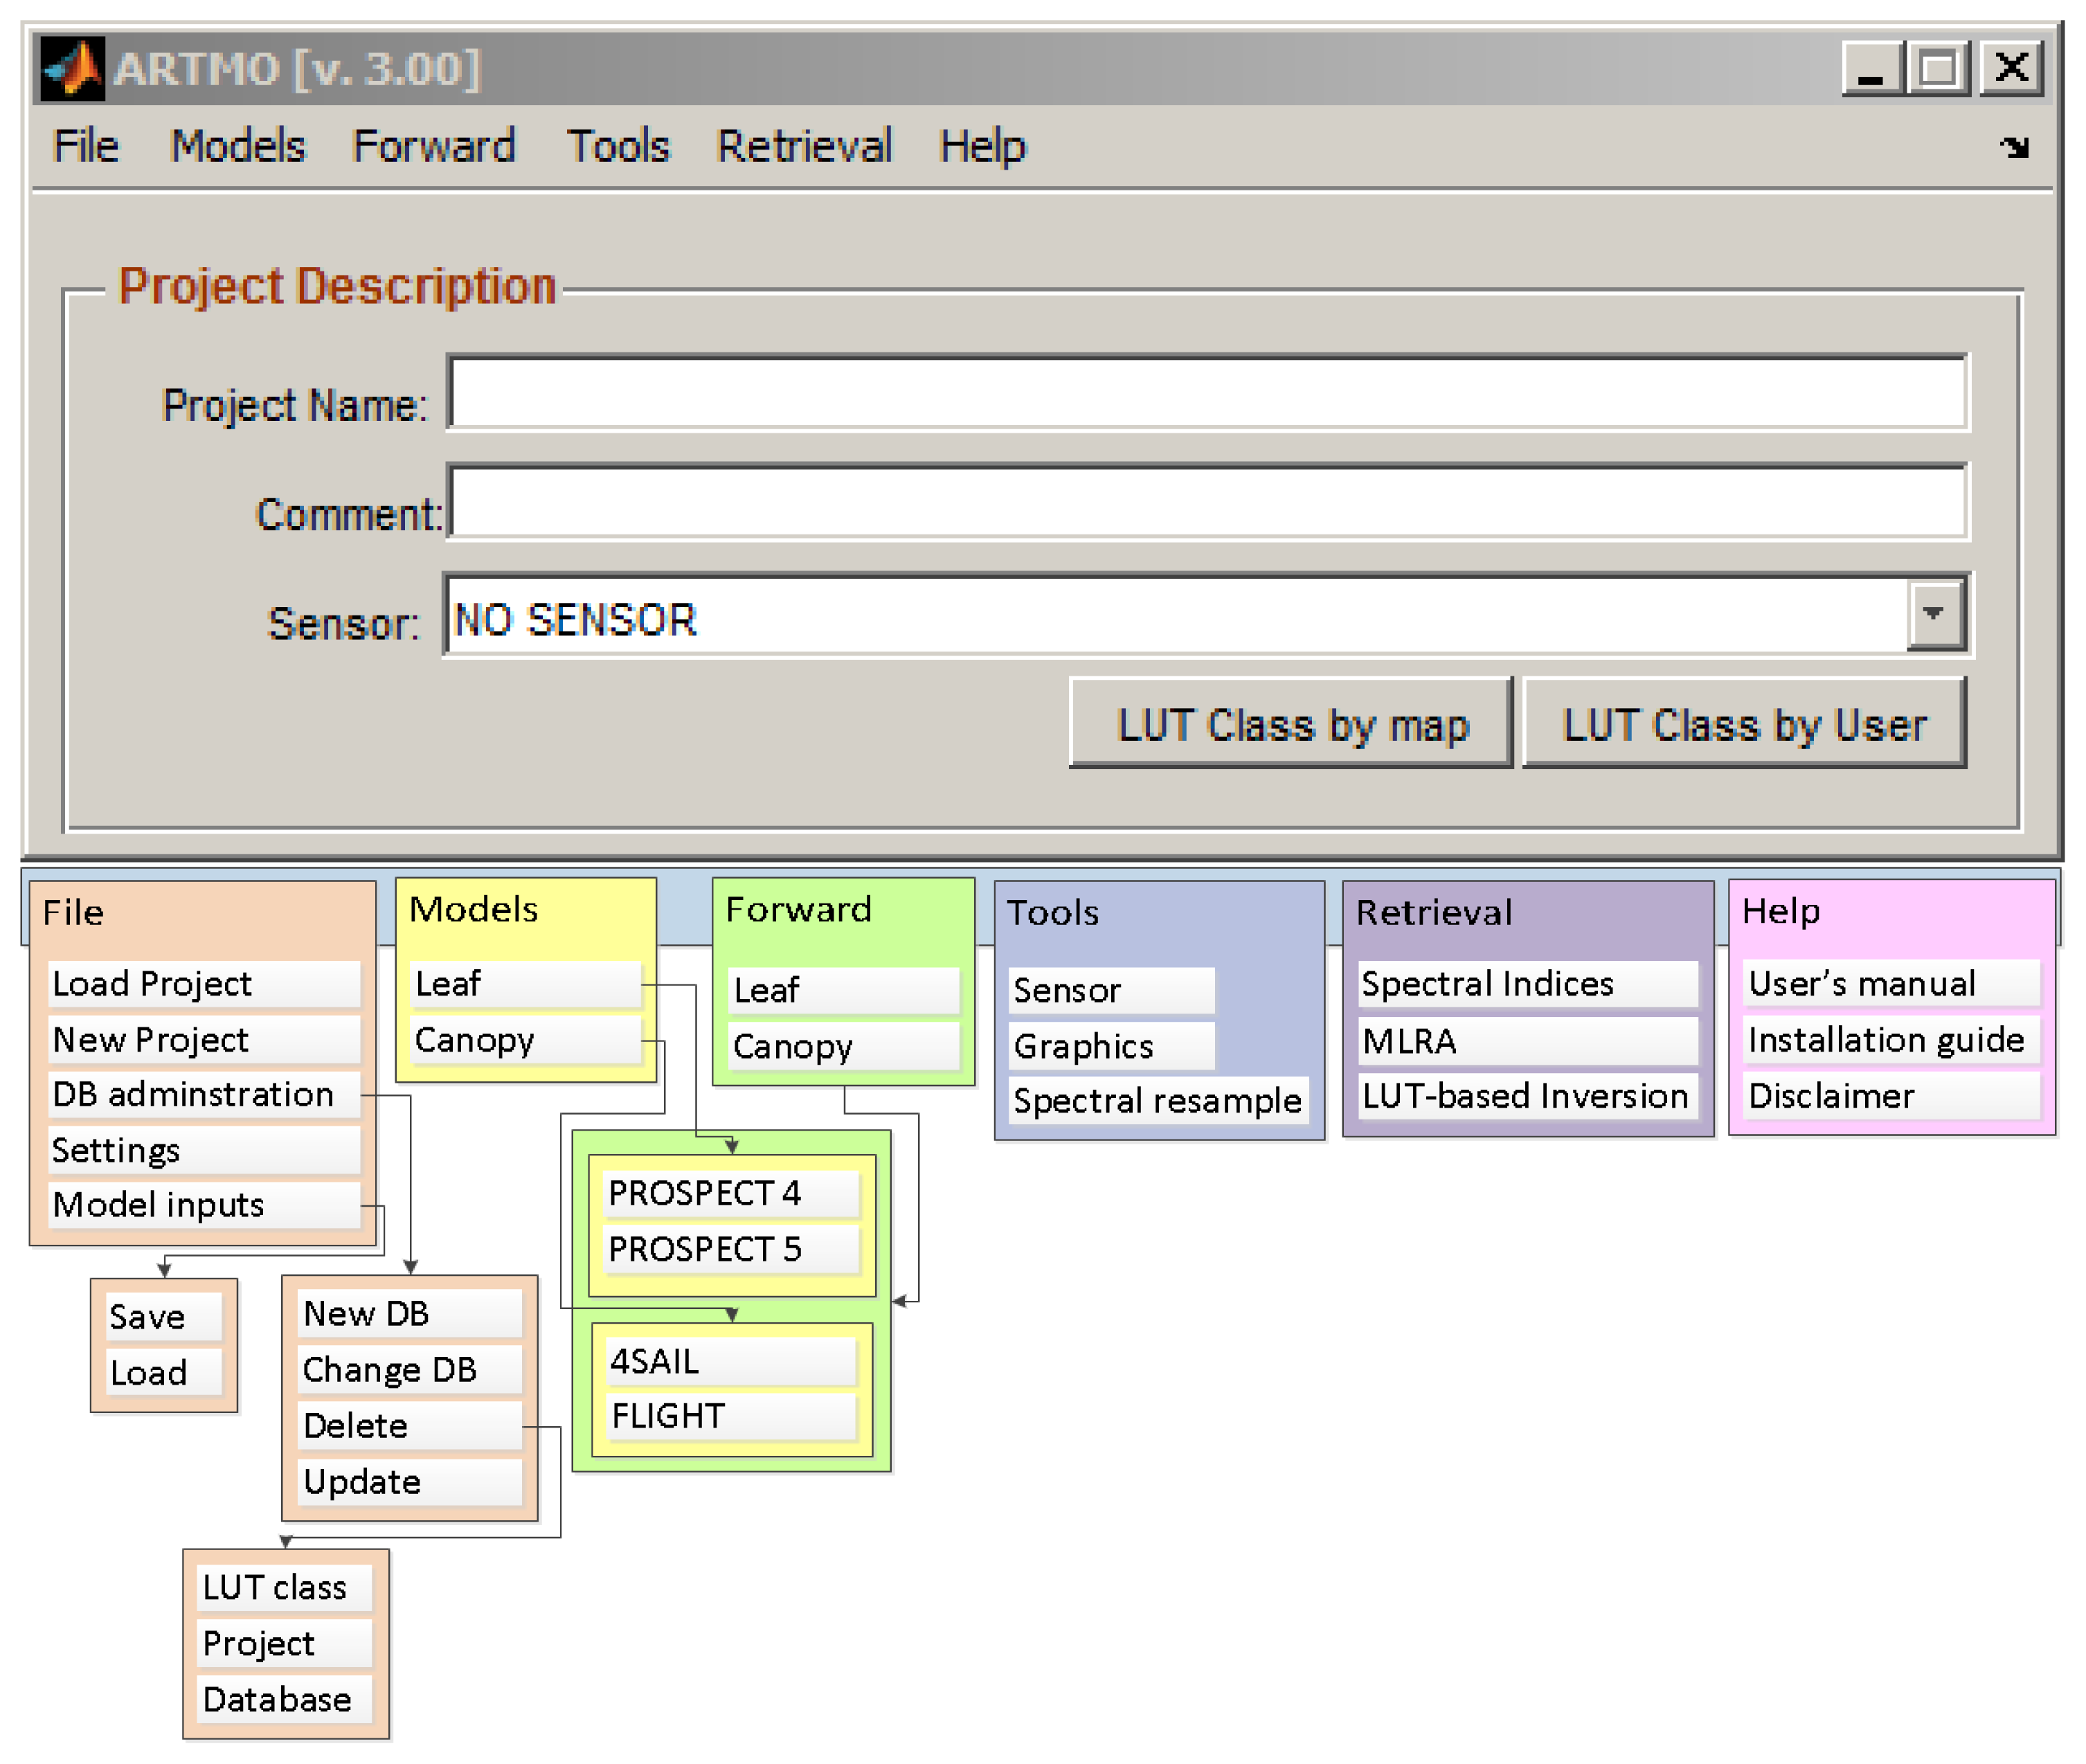
2. ARTMO Software Package
- The choice to specify or select spectral band settings specifically for various existing air- and space-borne sensors or user defined settings, typically for recently developed or future sensor systems;
- The option to simulate large datasets of top-of-canopy (TOC) reflectance spectra for sensors sensitive in the optical range (400 to 2500 nm). Look-up tables (LUT) can be generated, which are stored in a relational SQL database management system;
- Finally, various retrieval scenarios can be selected and run using EO reflectance datasets.
- ARTMO v3 is designed modularly. Its modular architecture offers the possibility for easy addition (or removal) of components, such as RTM models and post-processing modules;
- The MySQL database is organized in such a way that it supports the modular architecture of ARTMO v3. This avoids redundancy and increases the processing speed. For instance, all spectral datasets are stored as binary objects;
- New retrieval toolboxes are incorporated. They are based on parametric and non-parametric regression as well as physically-based inversion using a LUT. This has led to the development of a: (1) “Spectral Indices assessment toolbox”; (2) “Machine Learning Regression Algorithm toolbox” [41]; and (3) “LUT-based inversion toolbox” [12].
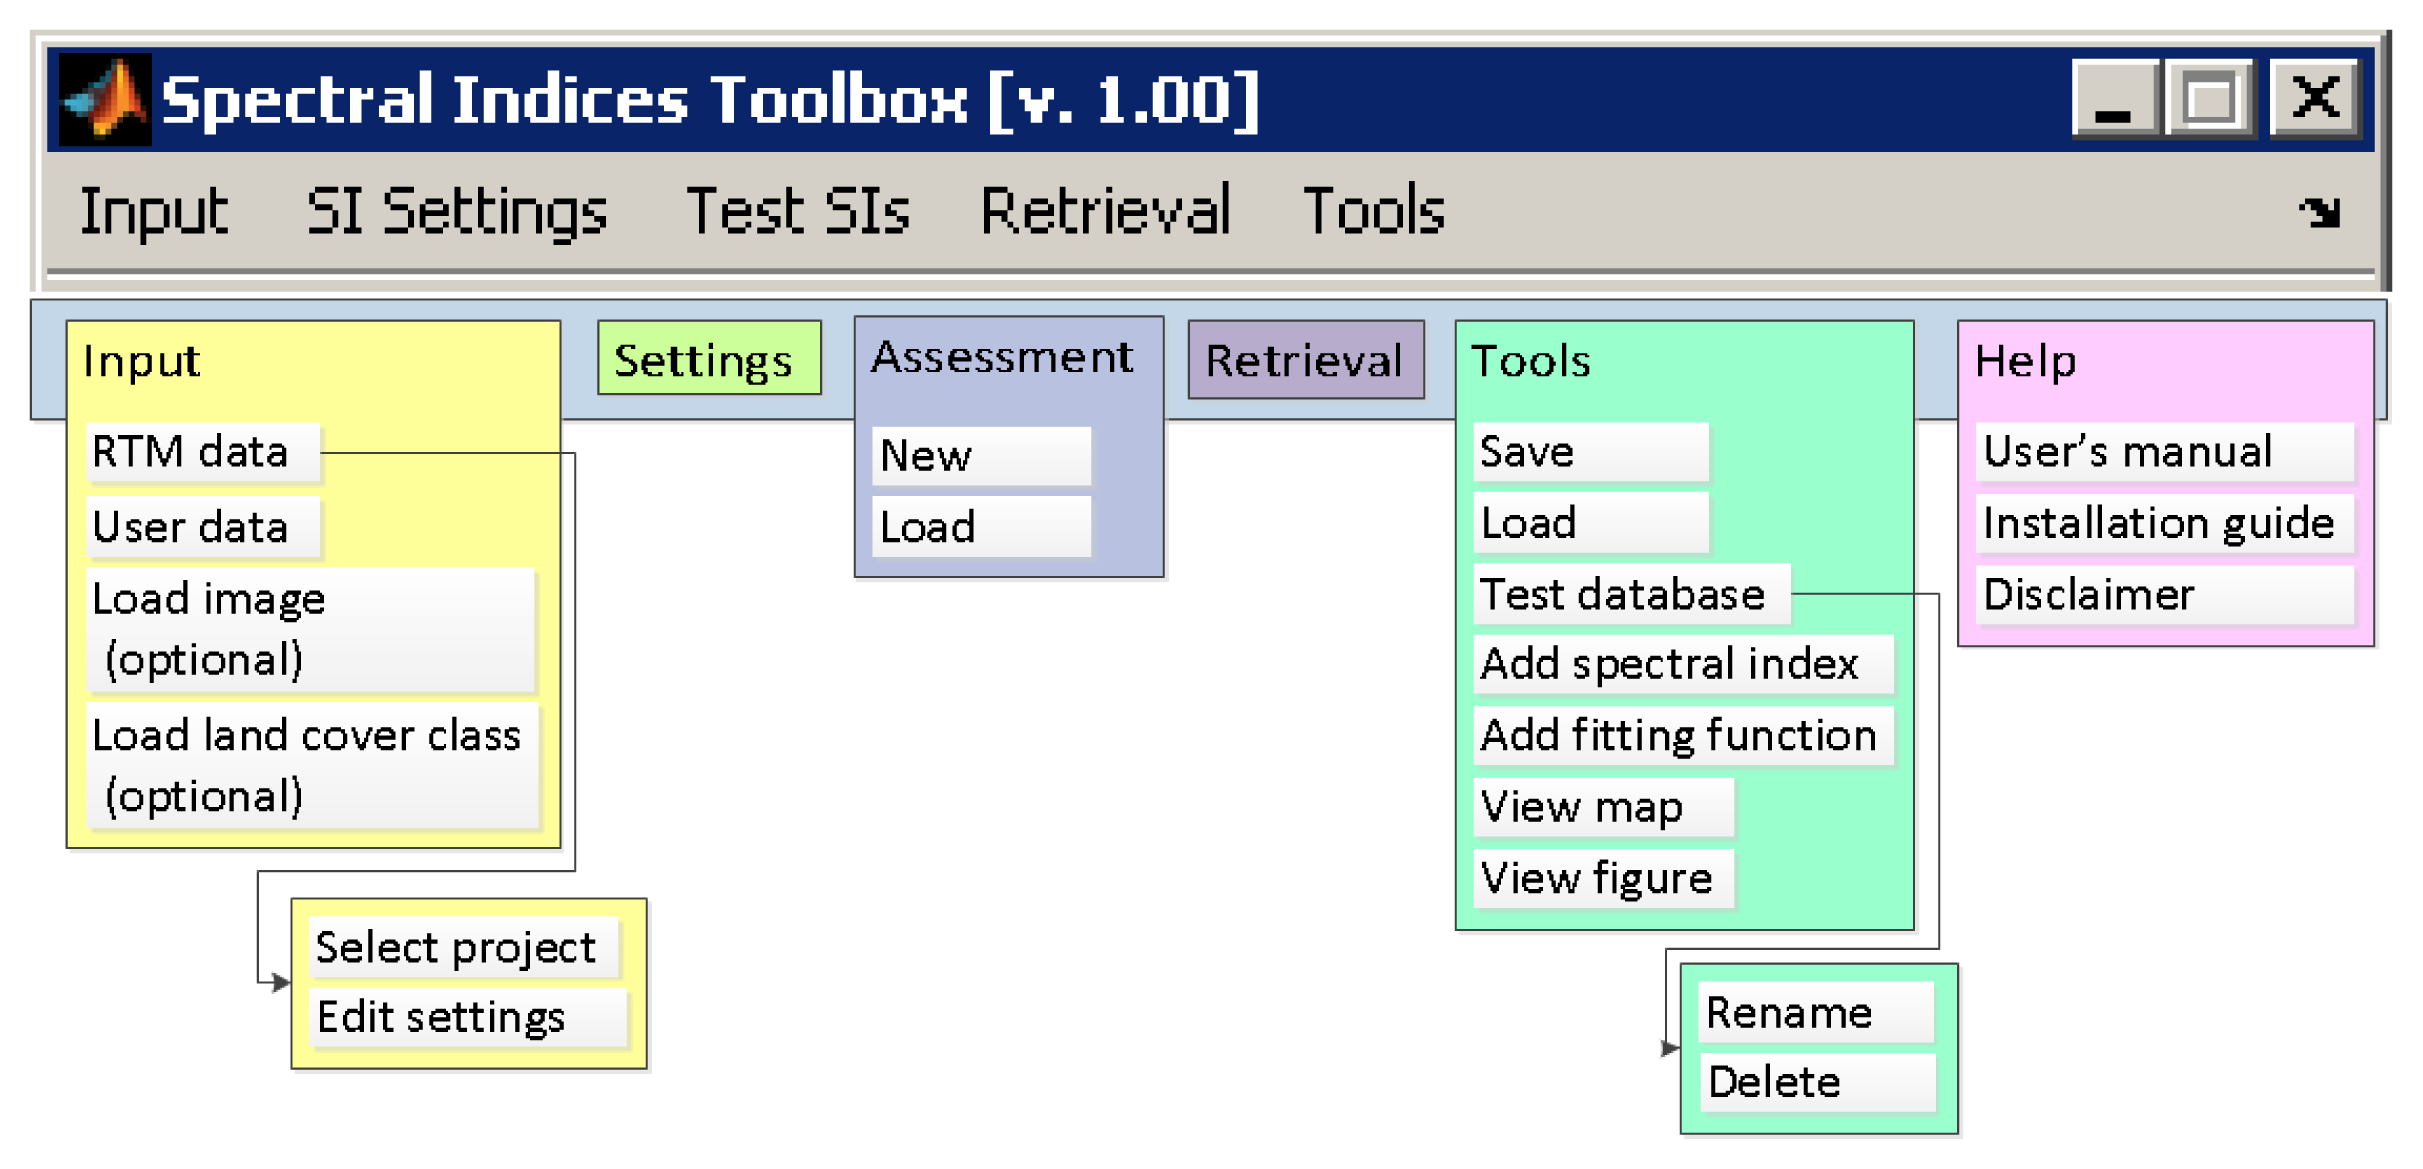
2.1. ARTMO Spectral Indices (SI) Toolbox
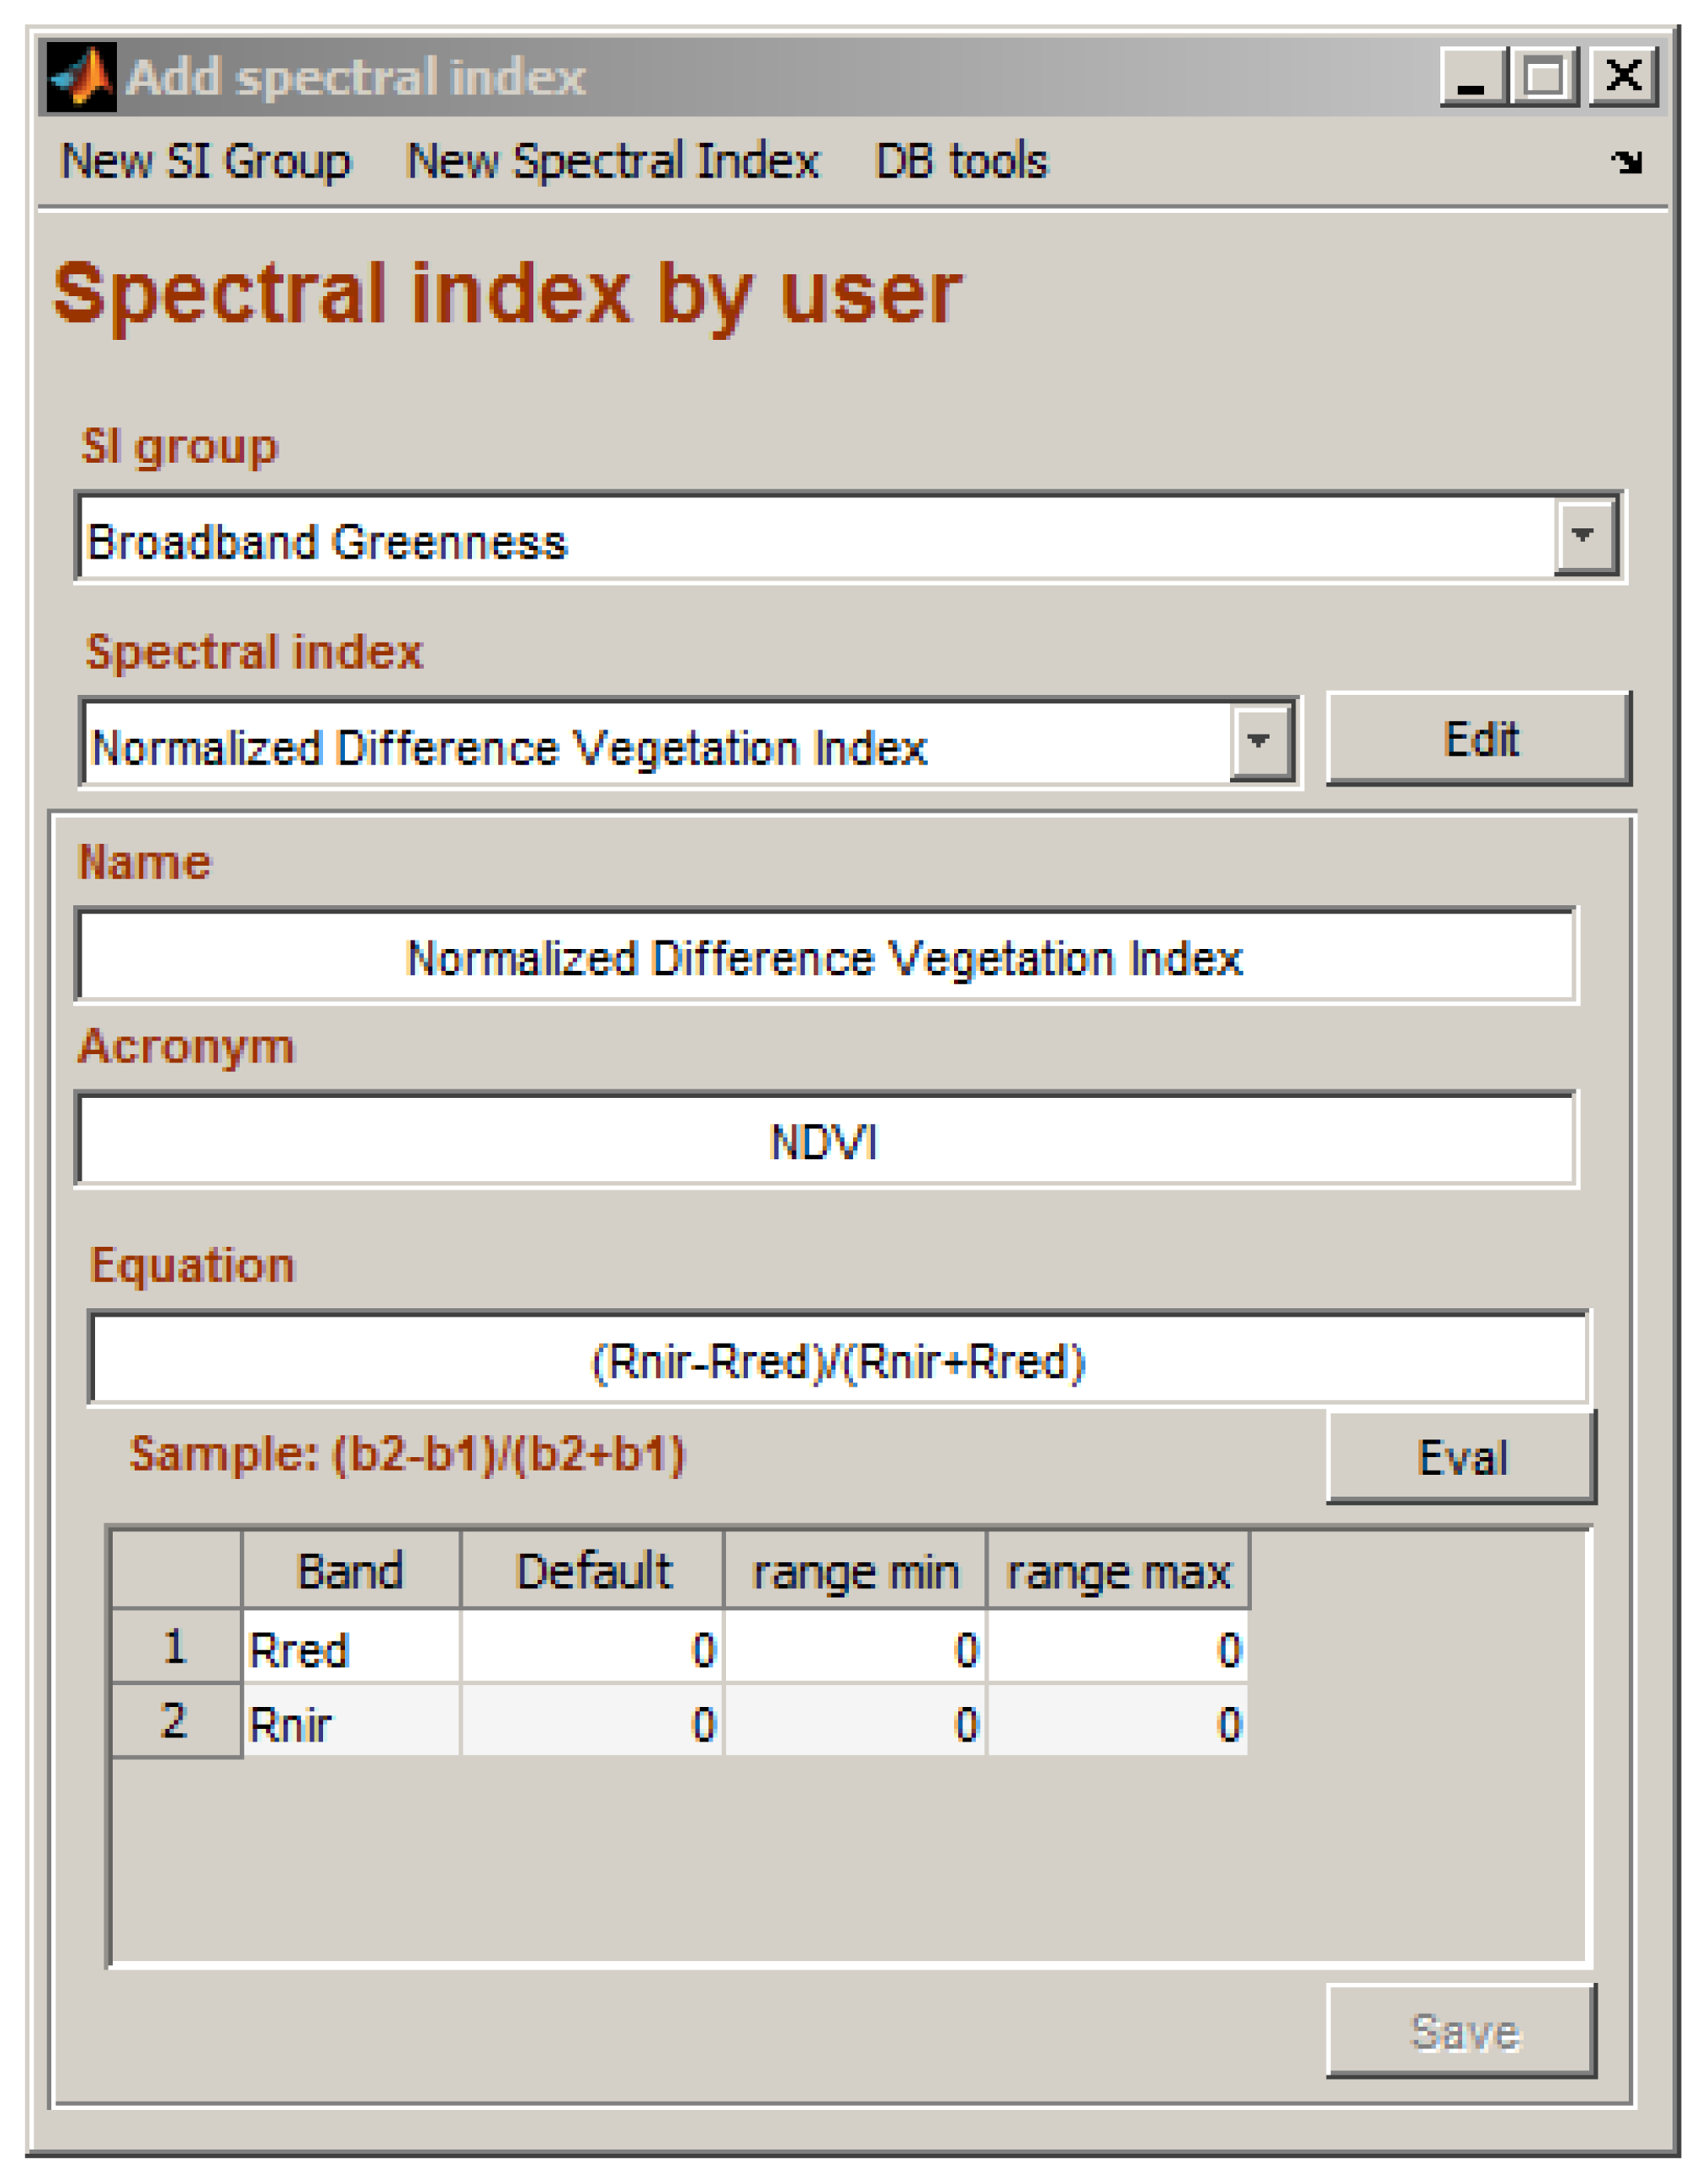
2.2. Add Spectral Index
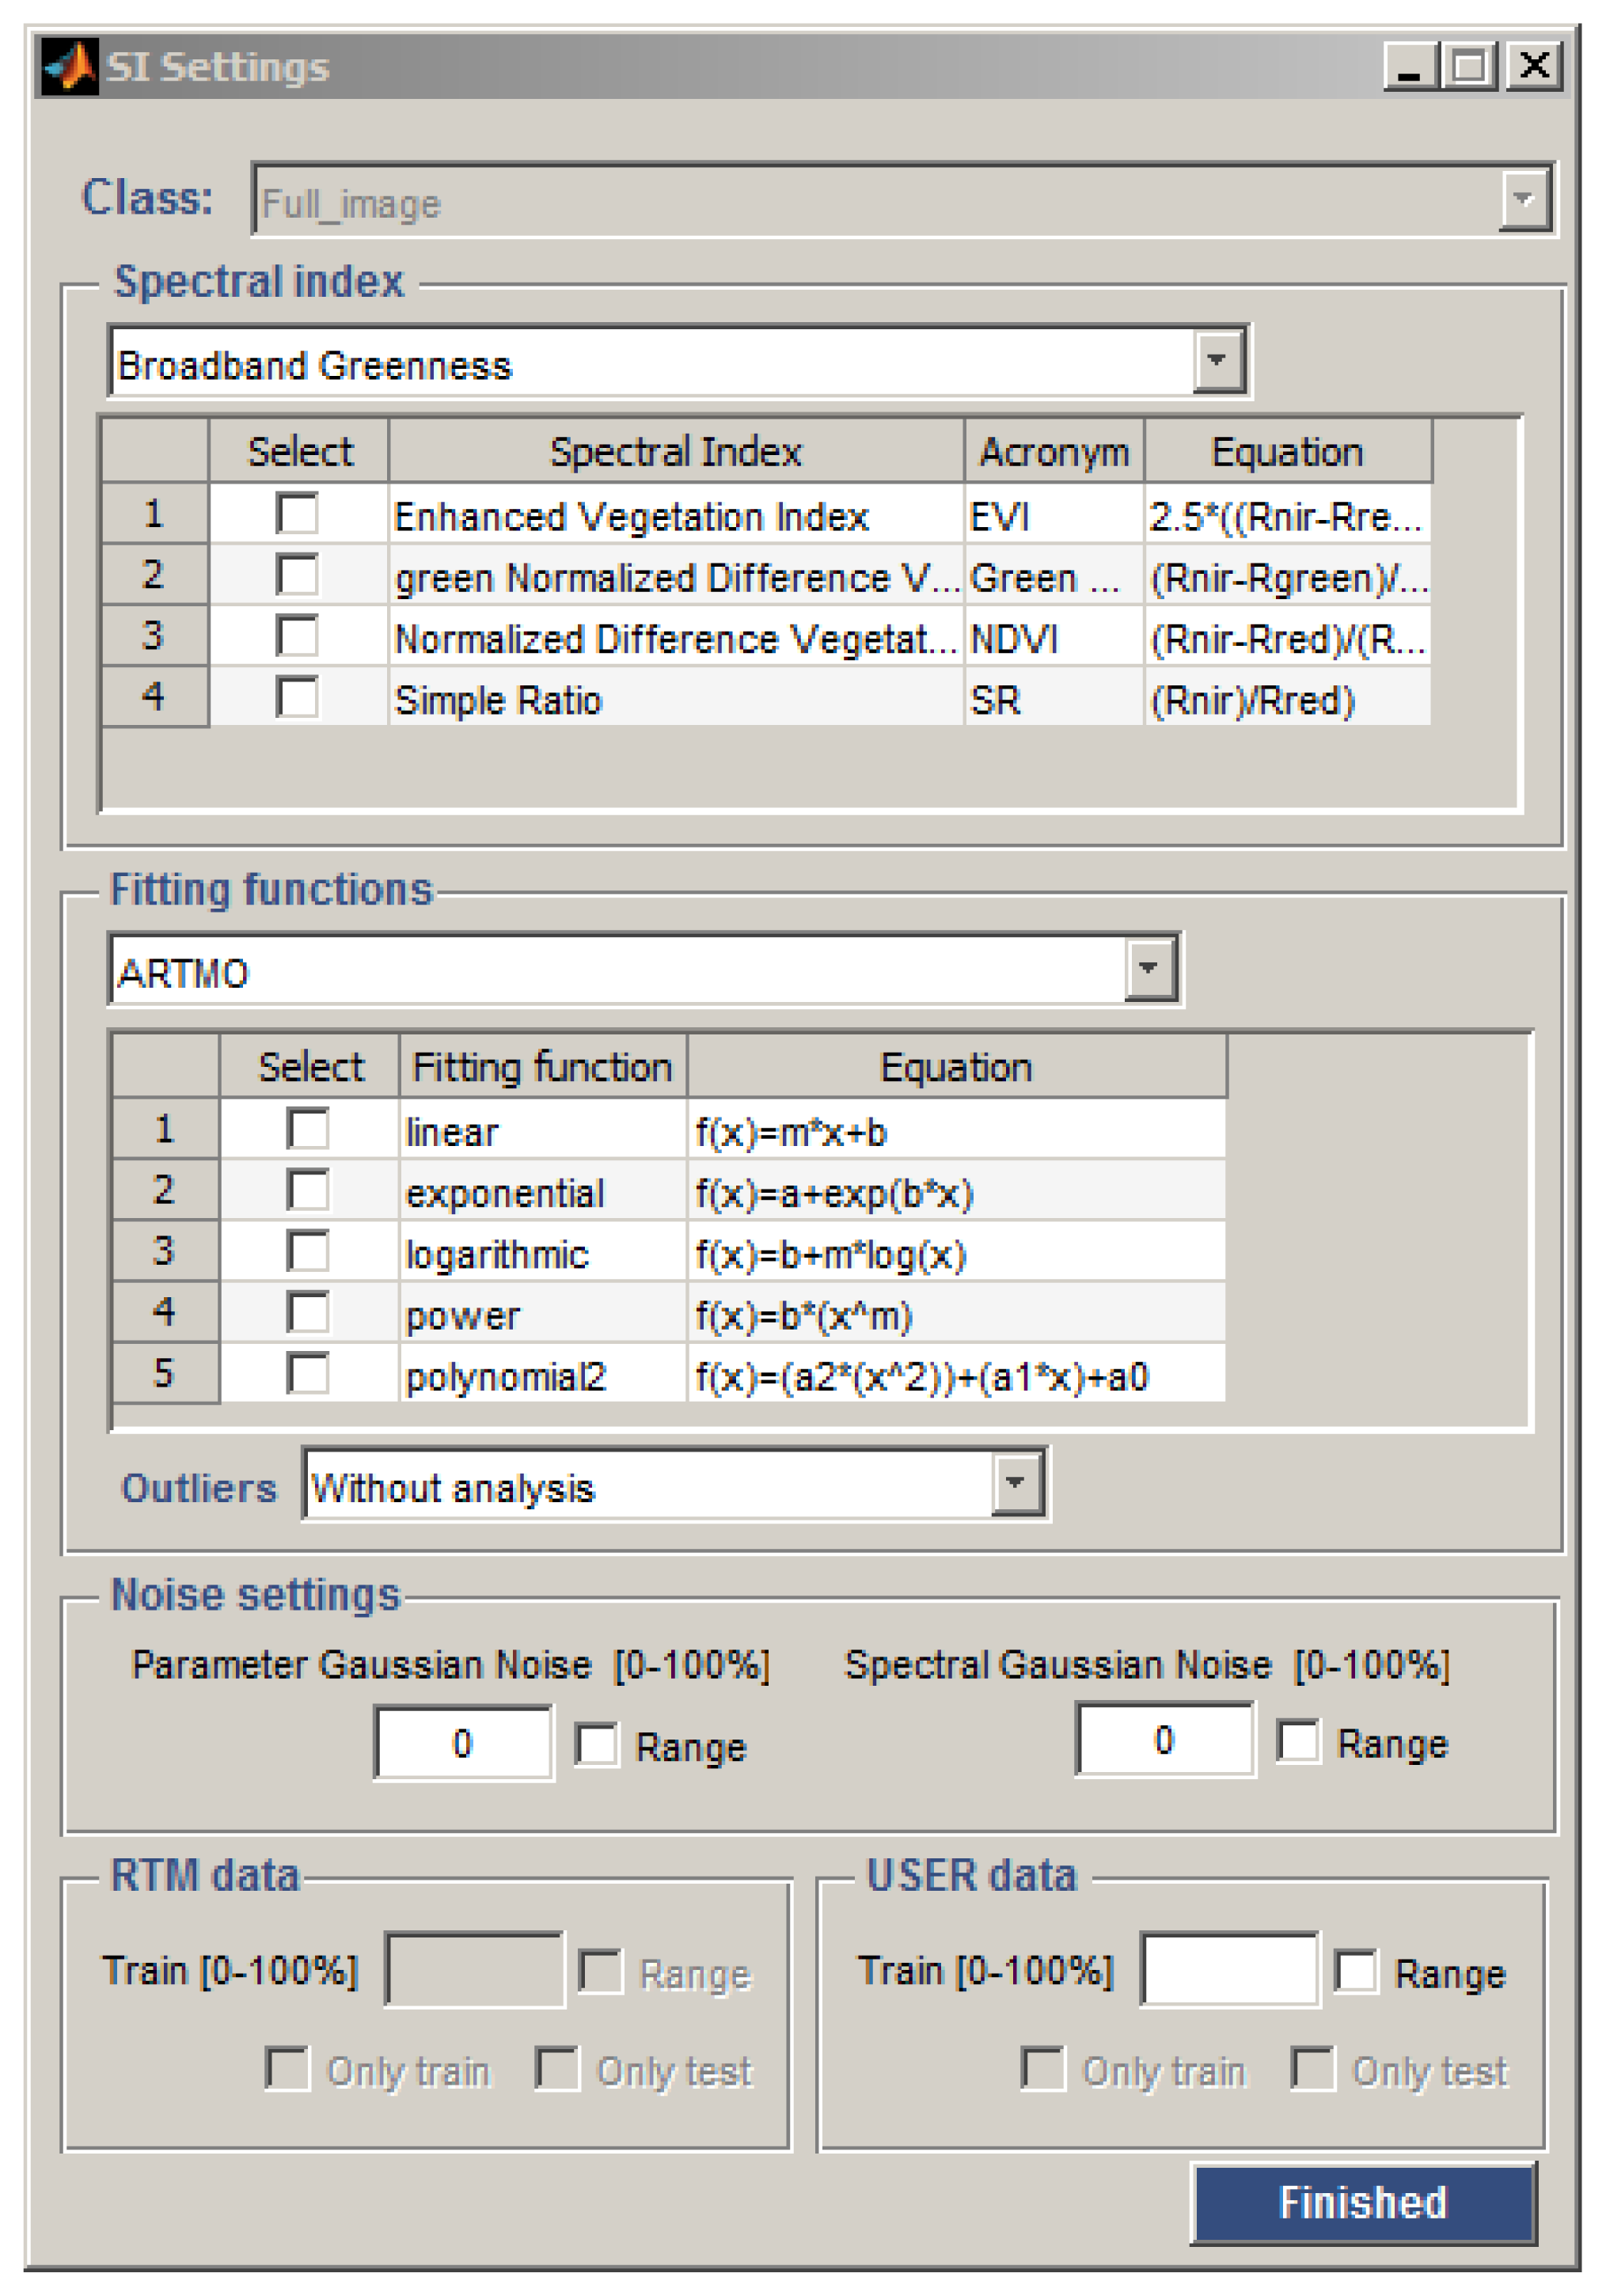
2.3. SI Settings
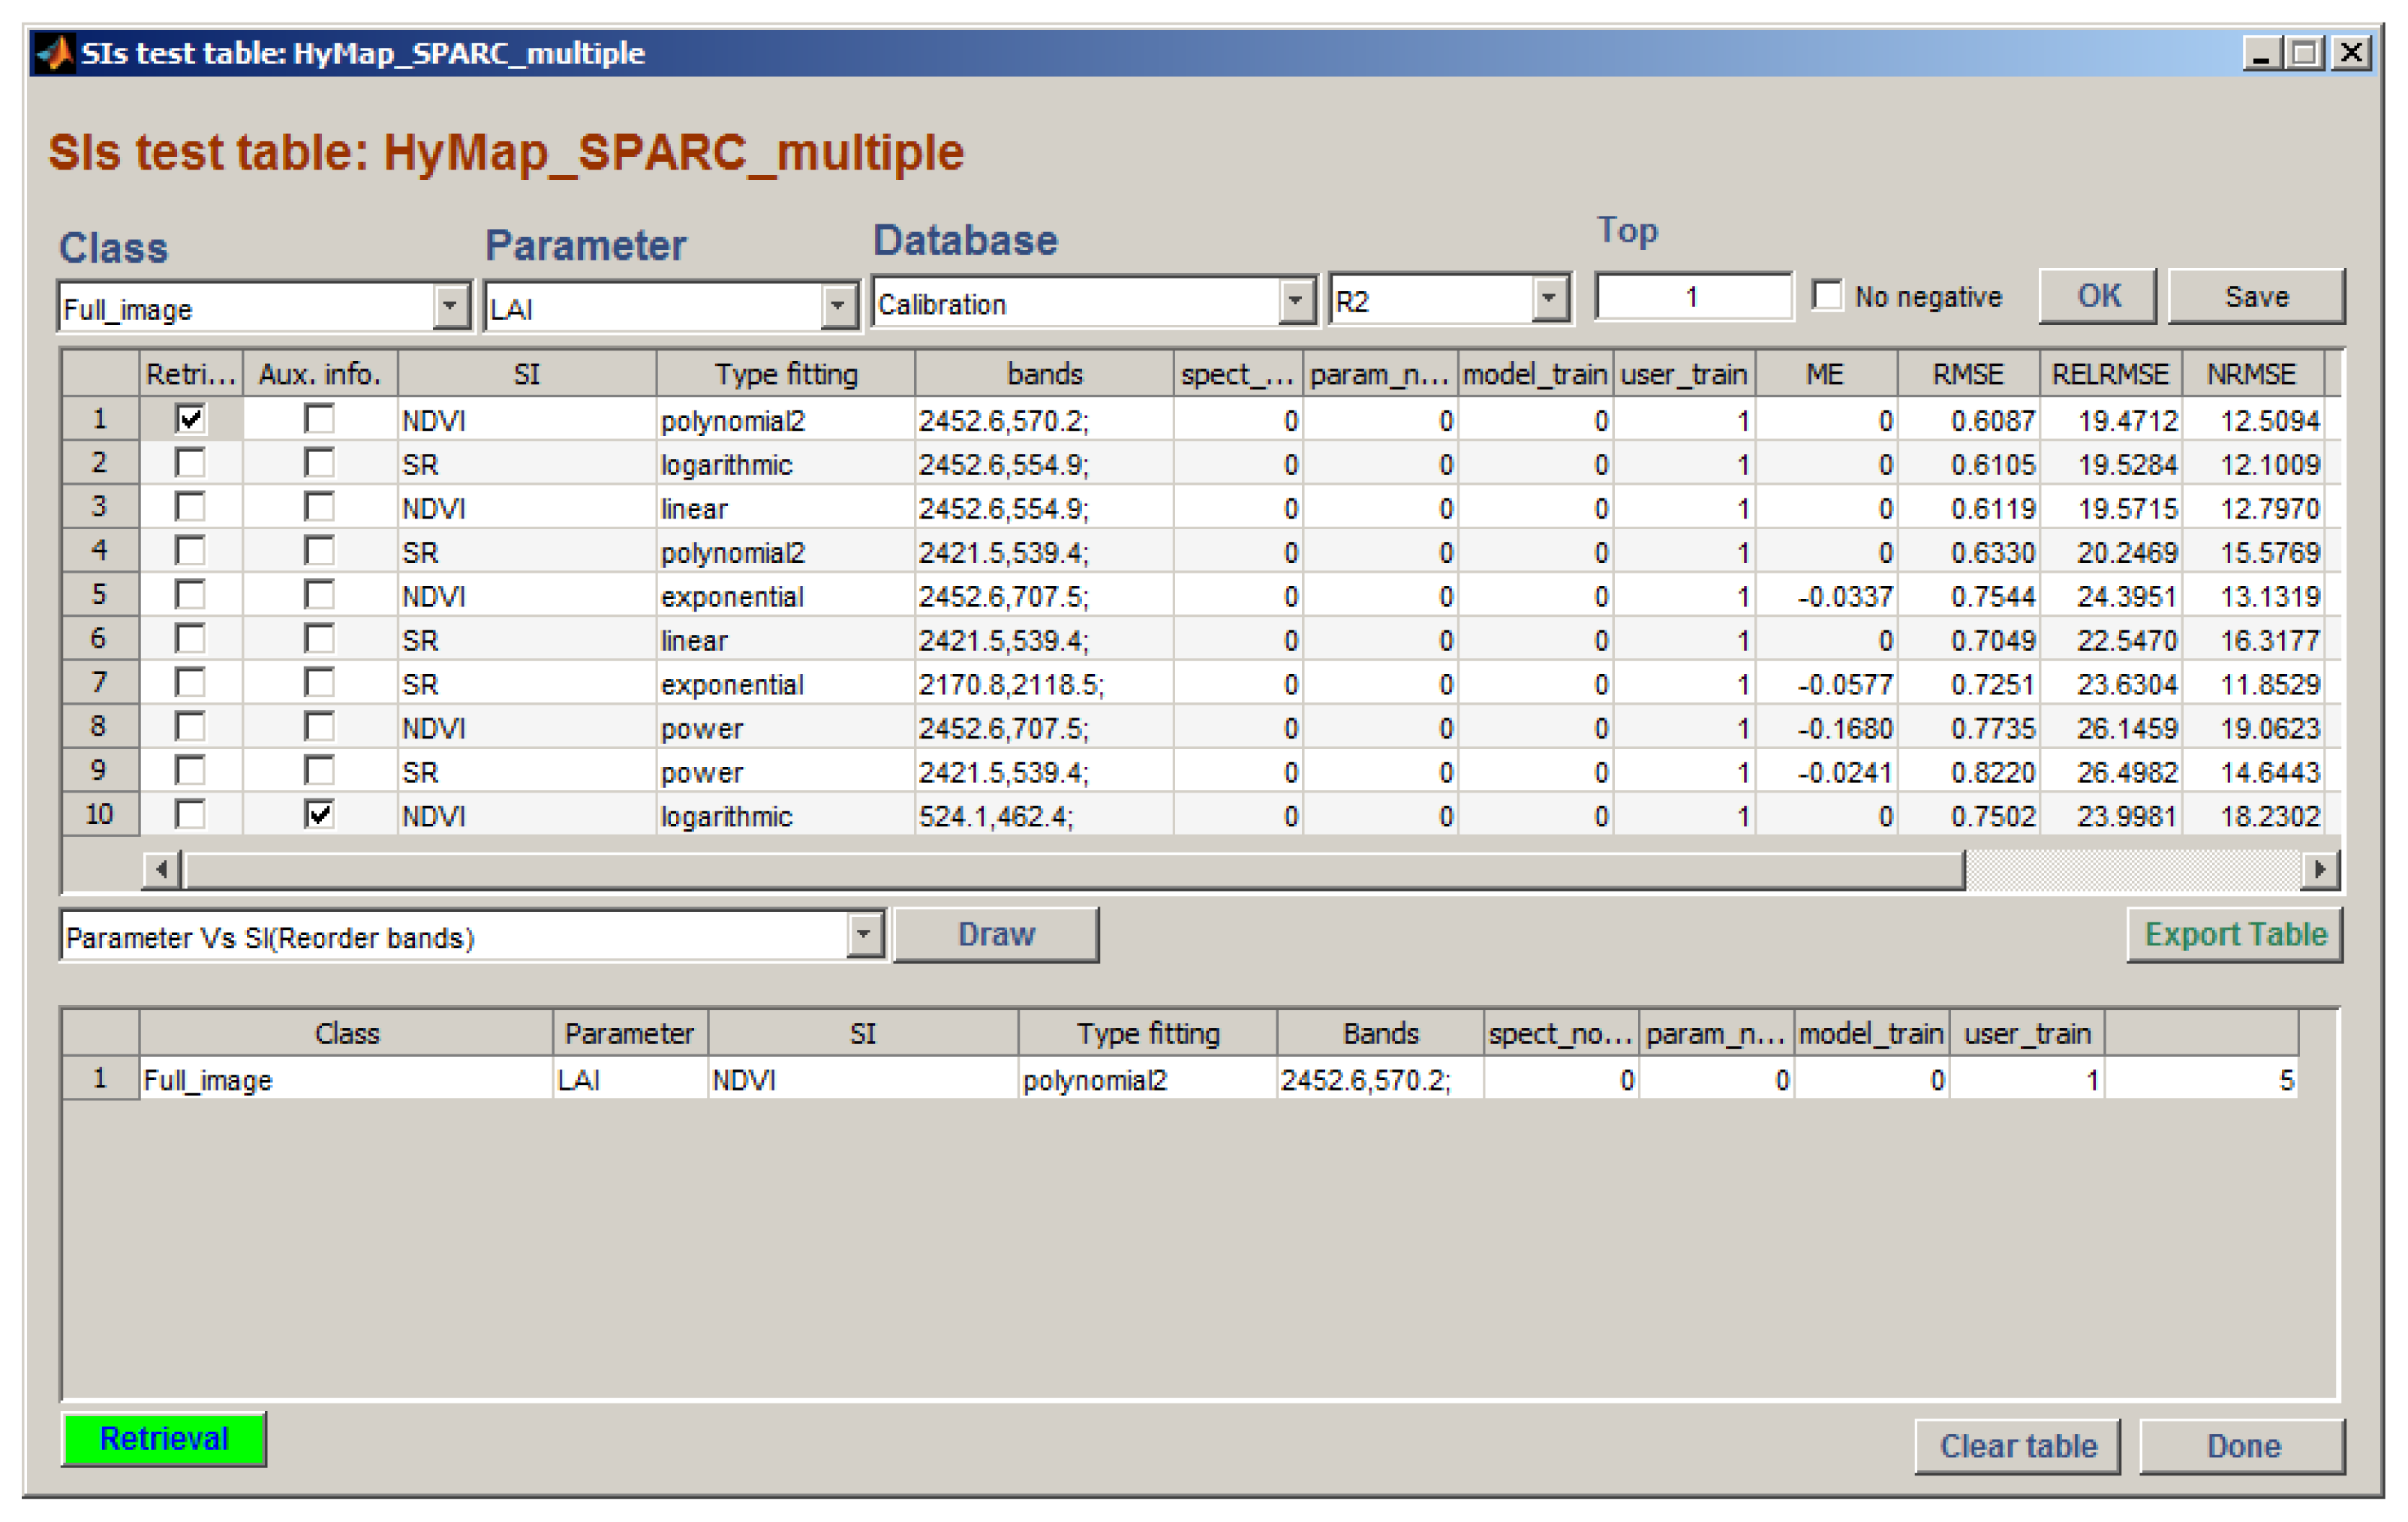
2.4. Calibration/Validation Assessment
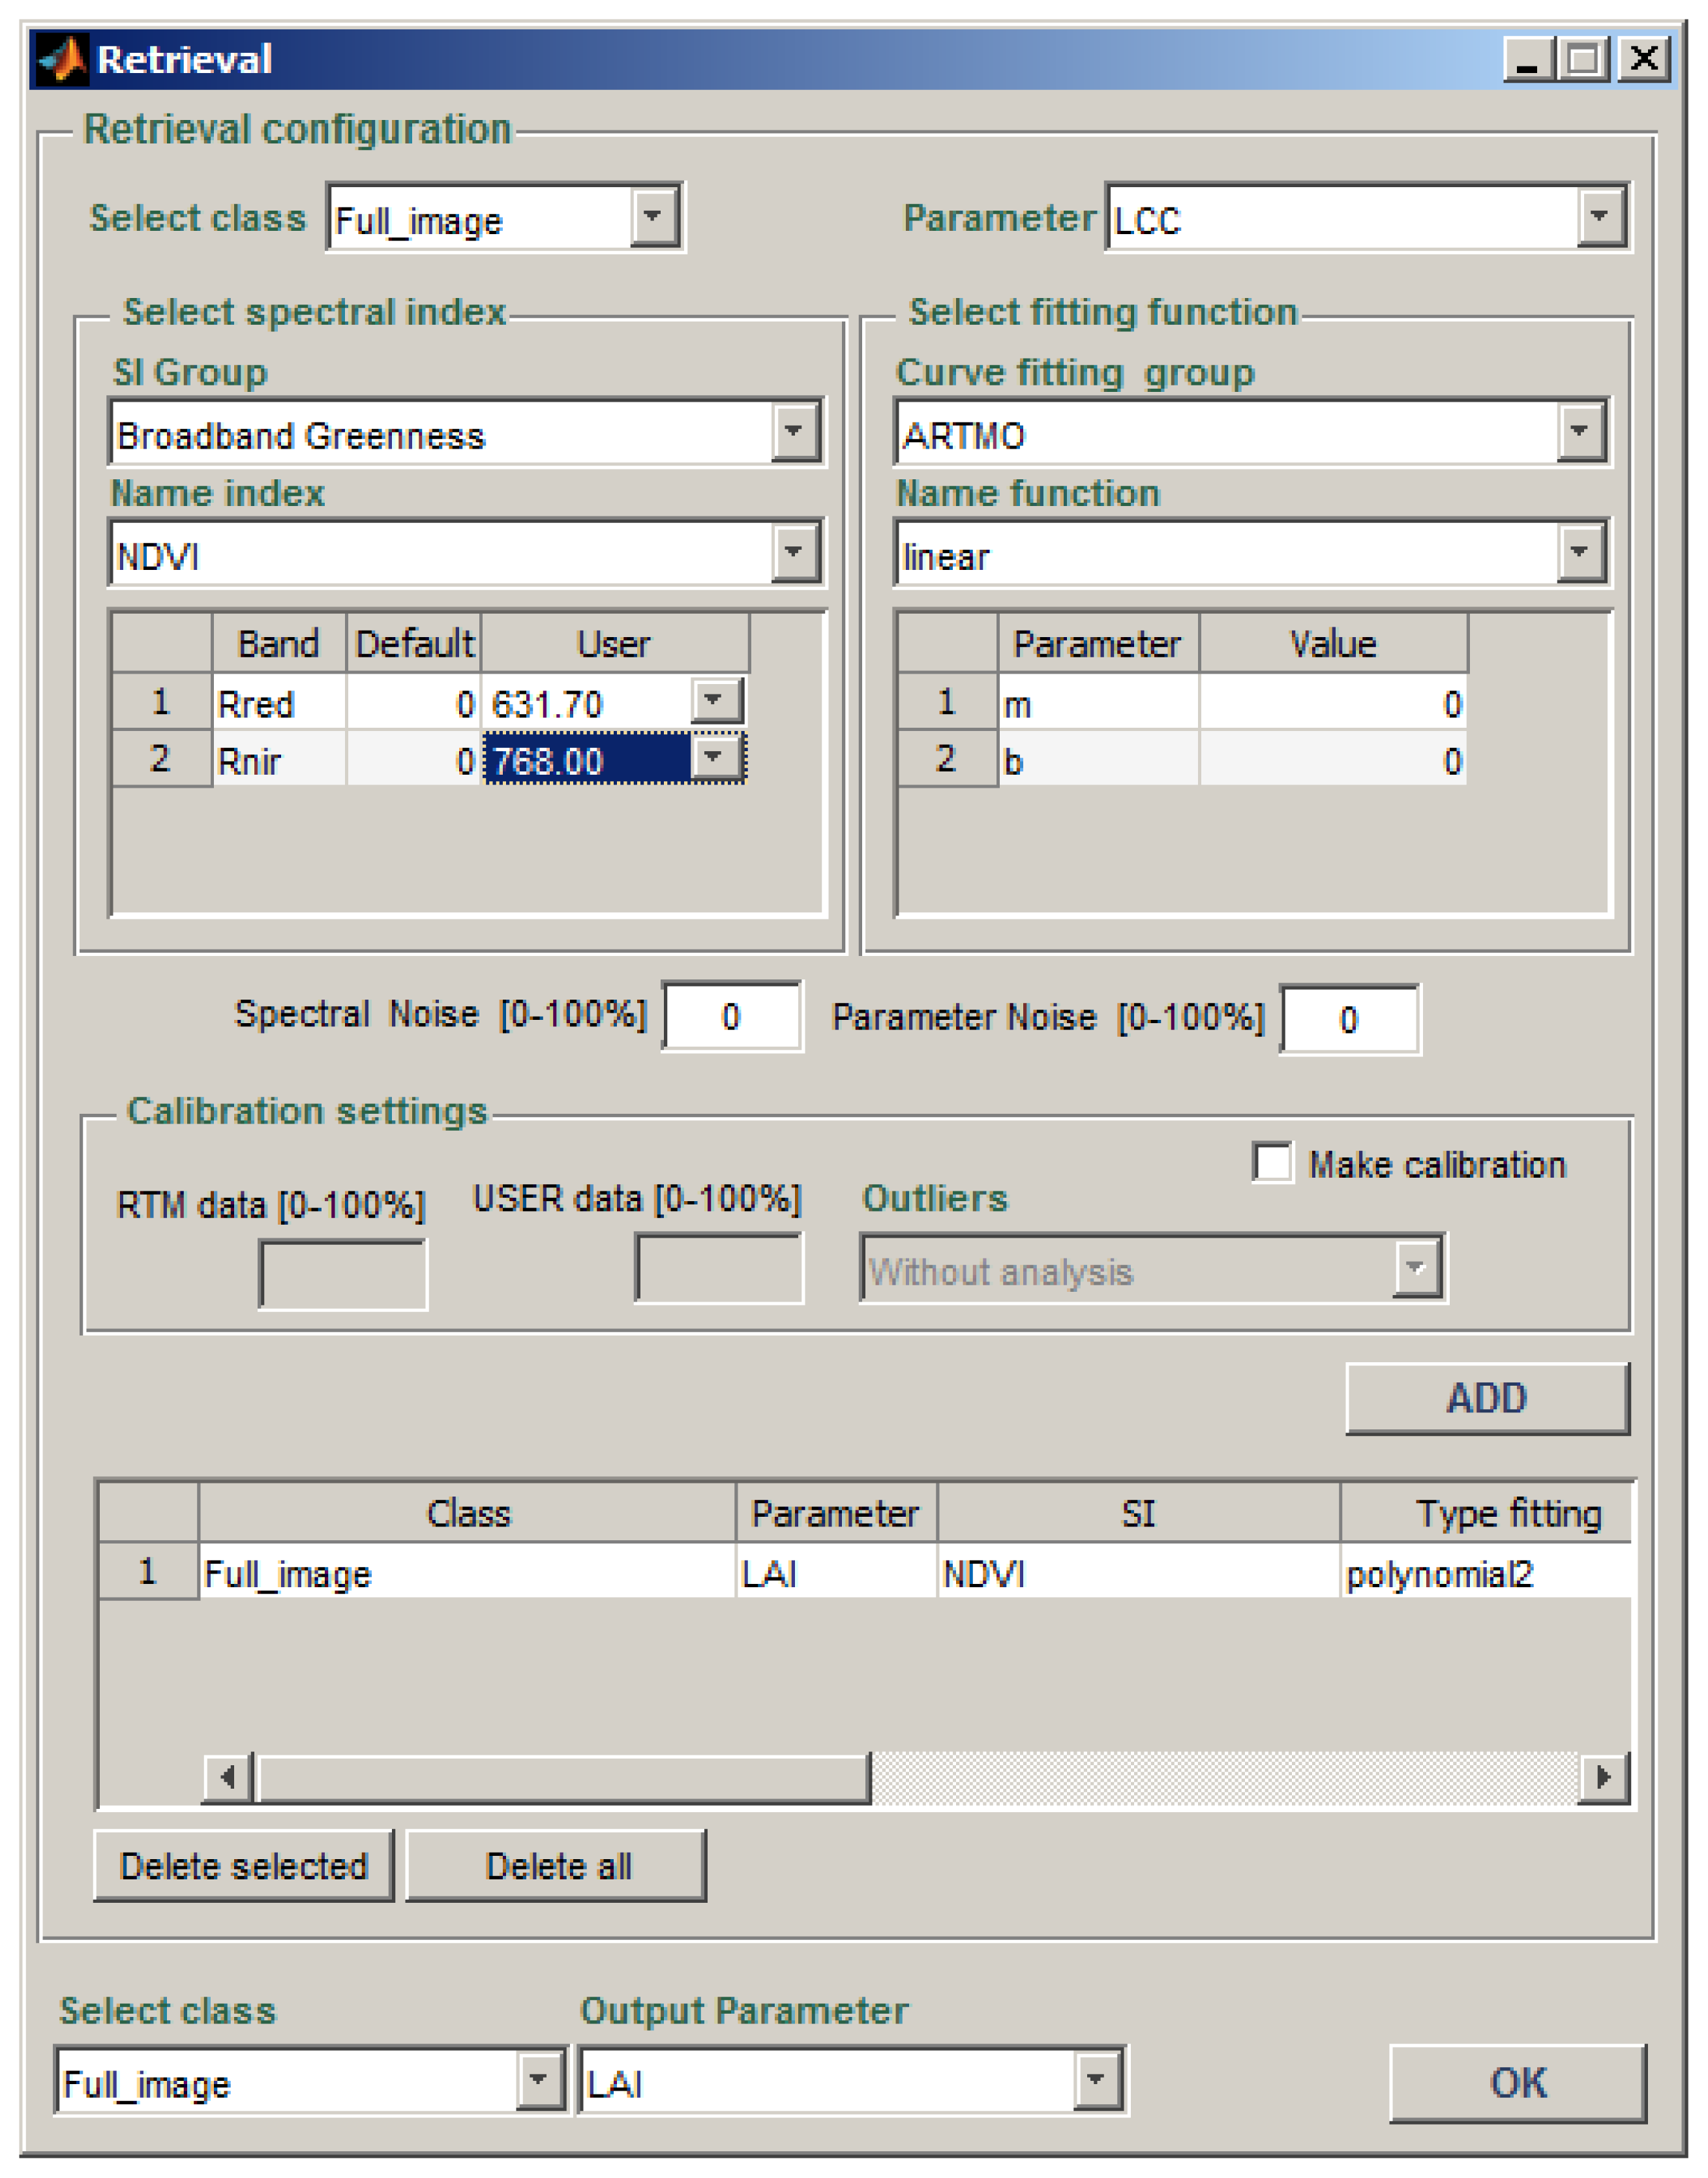
2.5. Retrieval
3. Assessment and Mapping Applications
3.1. Used Data
3.2. Experimental Setup
4. Results & Discussion
4.1. Optimized SI’s
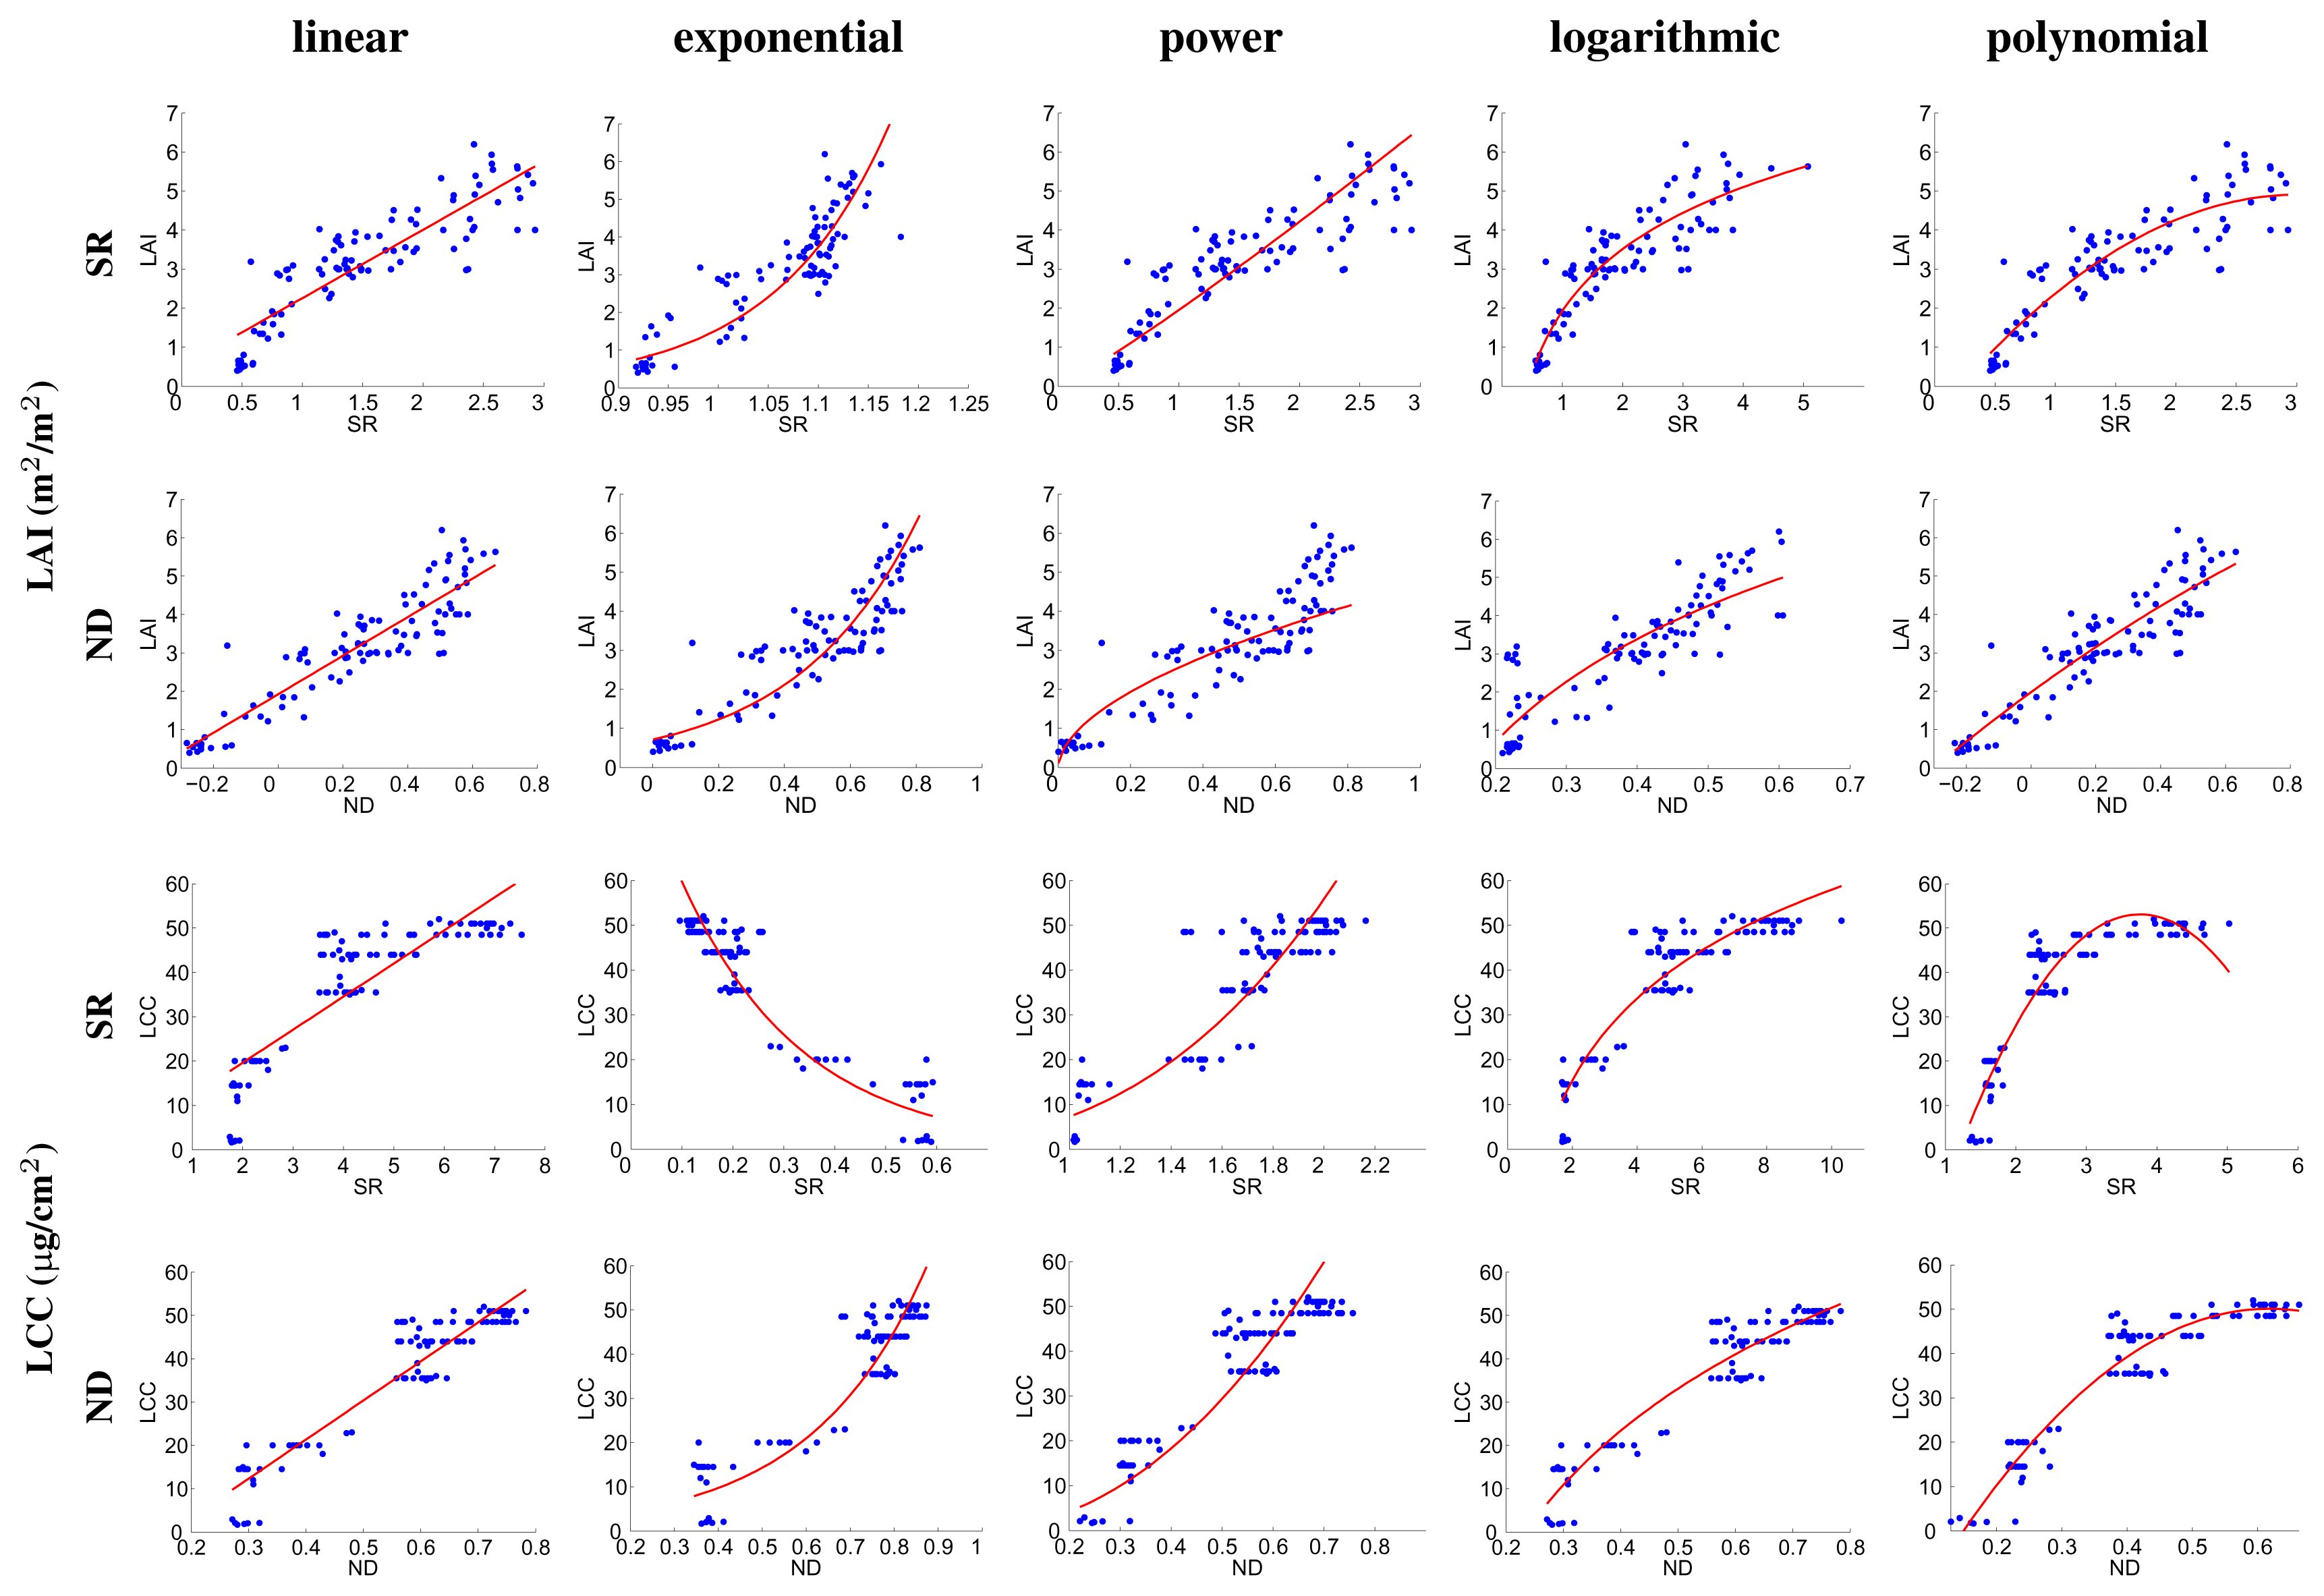
- With regard to SI formulations, no strong evidence has been found that the widely used ND formulation outperforms the less popular SR formulation. Though, it is also recognized that the main argument for using ND types of indices is not the improved correlation performance in comparison to SRs, but rather the (at least to some extent) improved comparability of different observation times/dates and the possible reduction of effects of varying illumination intensity (shades, etc.), due to the inherent normalization of the value range [47]. The ND outperformed the SR for both LAI and LCC only when a second order polynomial is applied as a fitting function. However, when a conventional linear regression is applied, ND performs similar (LCC) or superior (LAI) to SR;
- While the polynomial fit outperforms to some extent the linear regression fitting scenario, the linear fit model is nonetheless accurate as well. For instance, the best linear regression fit outperforms the more sophisticated exponential and power curve fitting approaches significantly for both, LAI and LCC;
- For the majority of the most accurate regression functions, about the same spectral band locations were assessed as being optimal for biophysical parameter retrieval. For LAI, two-band formulations are optimal at 570, 555, 539 and 707 nm with the second band at 2453 or 2421 nm. For LCC two-band locations at 692 nm and 632 nm with the second band at 1661–1698 nm or 1200–1340 nm performed best.
4.2. Correlation Matrices
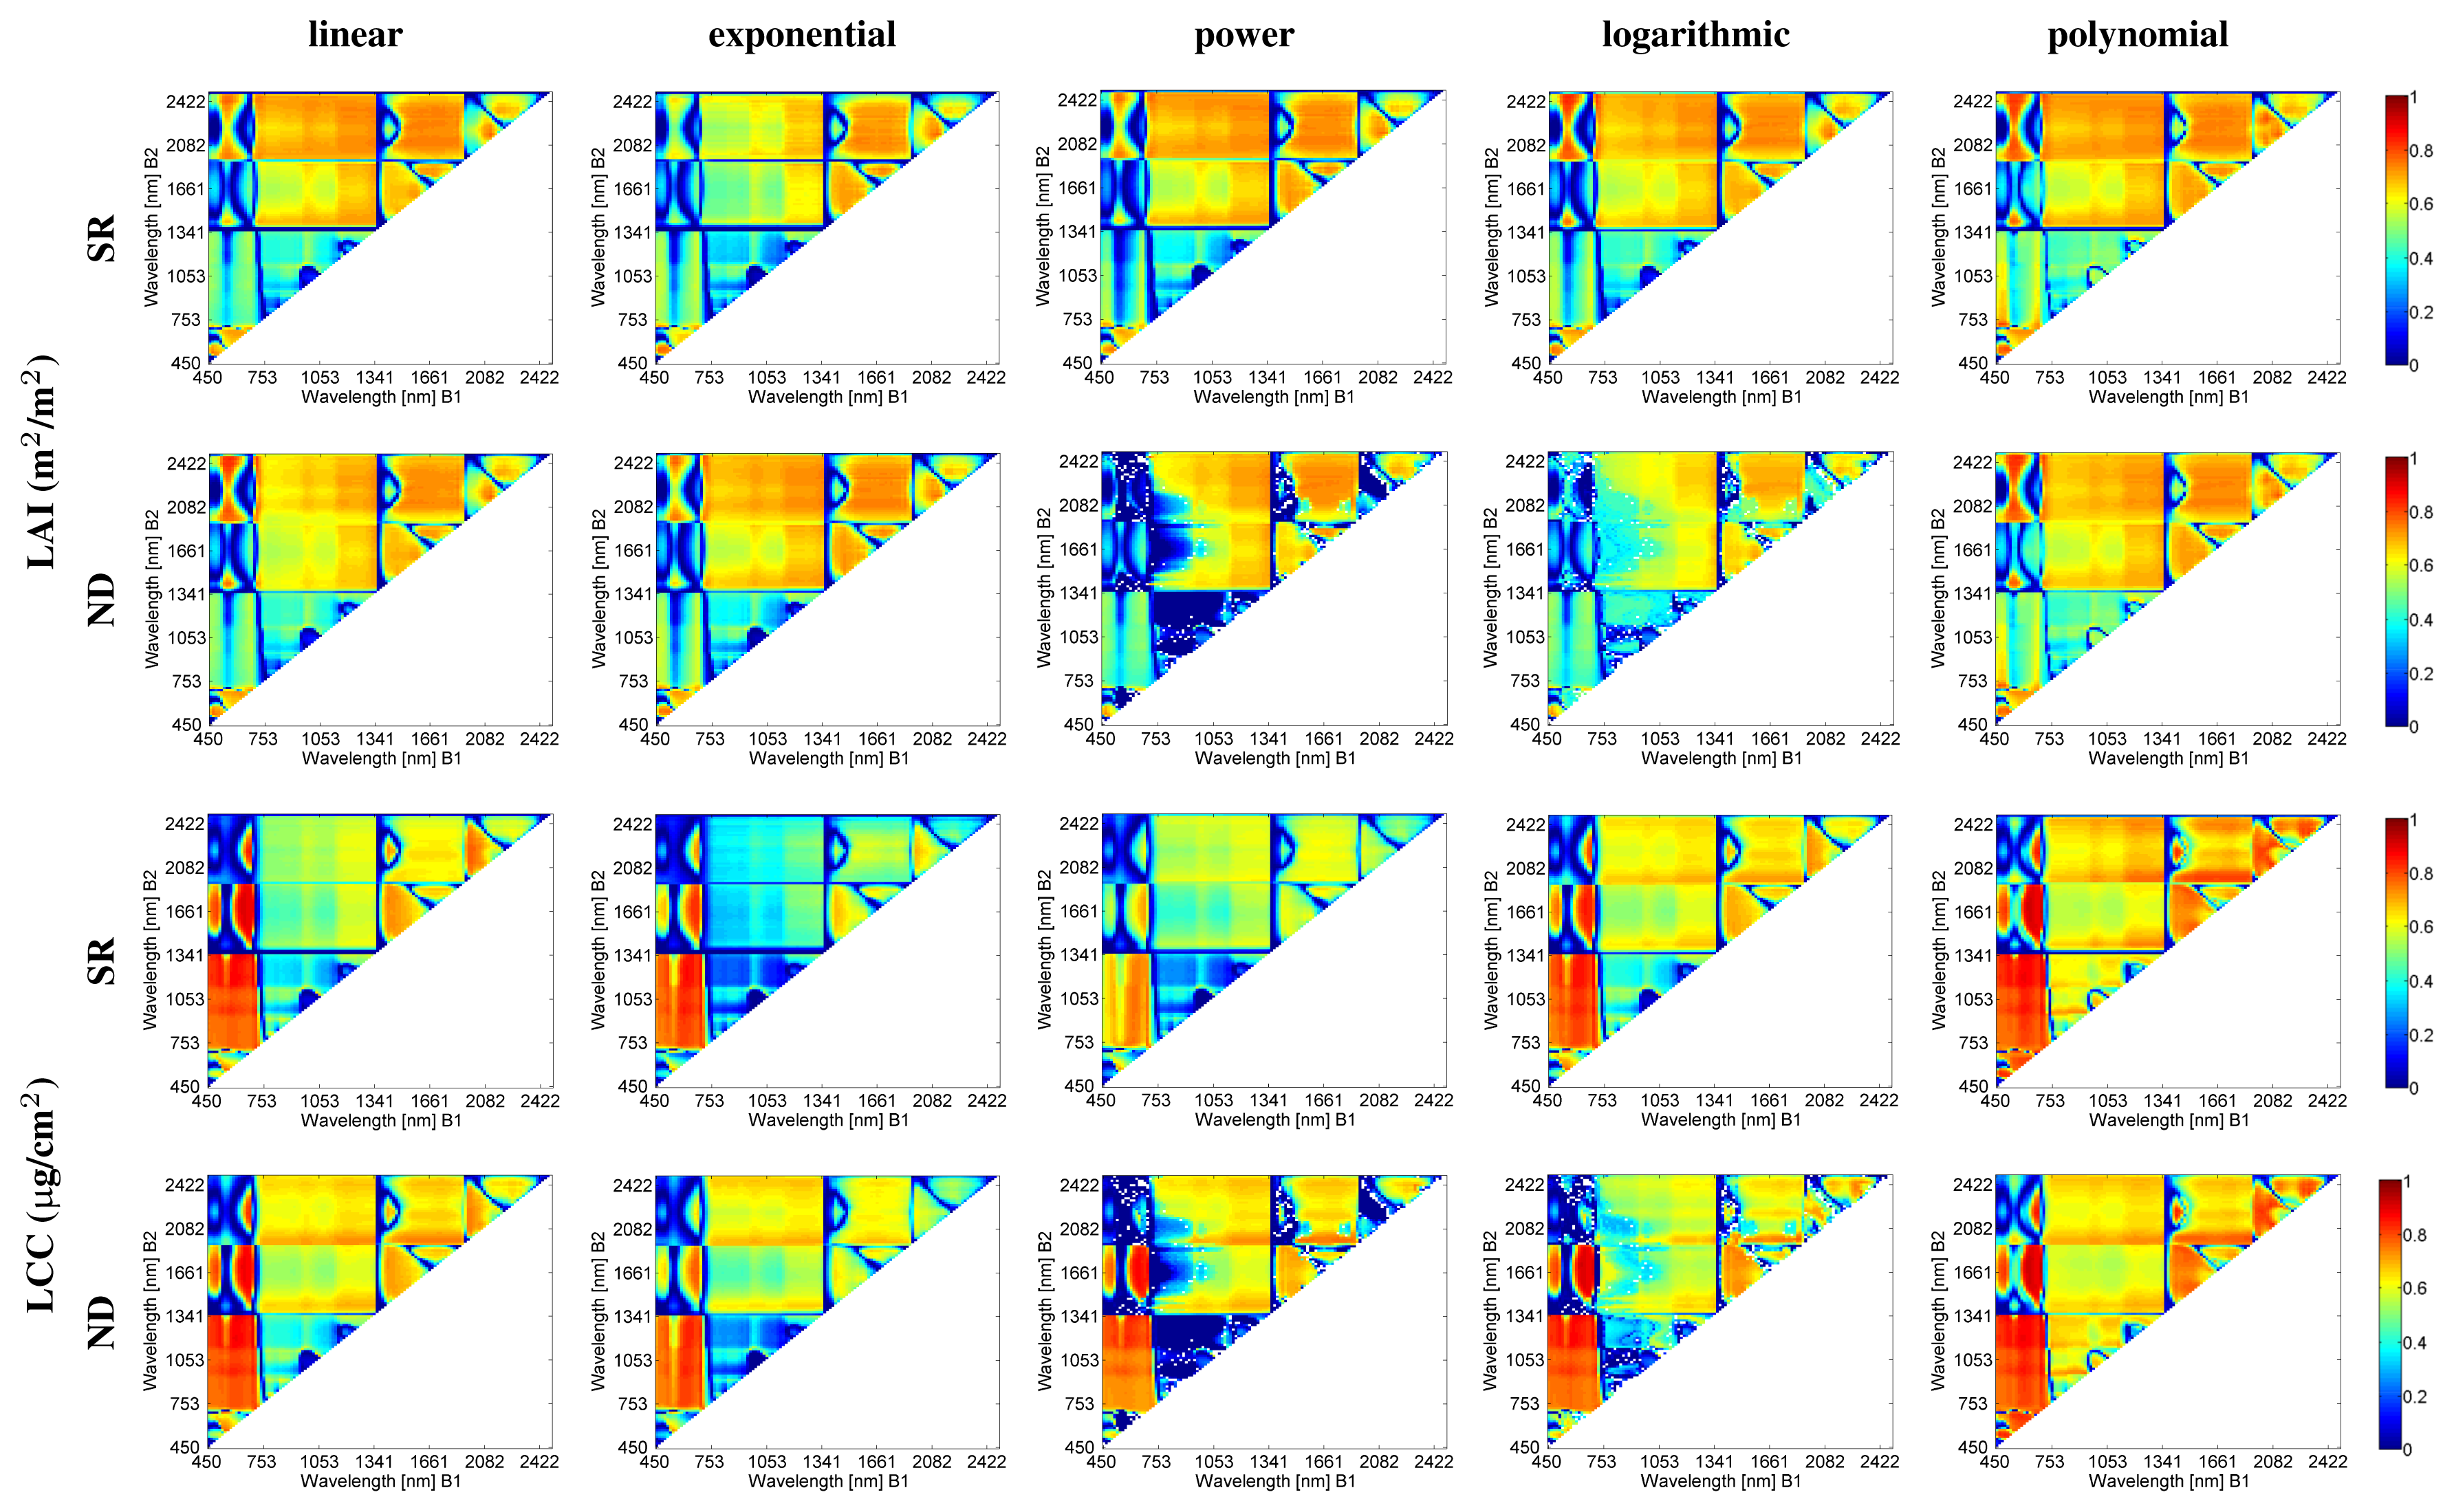
- SR and ND formulations lead to the same spectral regions exhibiting strong correlations between the LAI/LCC biophysical parameters and the two-band SIs. For instance, similar patterns for B2 in the visible spectral region can be observed. However, the ND power and logarithmic functions fail as good fitting functions for several band combinations. Specifically, they provide lower regression accuracies for B1 (740–1000 nm) and B2 (1400–2200 nm);
- Similar patterns with strong and low correlation values are found across the different curve fitting functions assessed. This suggests that the major impact on retrieval accuracy in EO does not originate from the chosen curve fitting but rather from the spectral dimension. Though, local differences do occur. These local differences are particularly pronounced along exponential, power and logarithmic fittings, characterized by quite low correlation values. Hence, the following sections are limited to the discussion of linear and polynomial curve fits;
- For LAI, Figure 8 shows that the most important spectral region for retrieval is the 539–707 nm region for the B1band, whereas B2 is located in the longwave SWIR. Notice the hourglass shape in the SWIR region. A second spectral region of maximal r2 for B1 is the 1300–1500 nm region as well as the region at 1400–1800 nm. These regions are spectrally quite broad, meaning that the spectral indices do not require very narrow and hence precisely positioned spectral bands, at least for the samples that were used in this study for the generation of the empirical relationships;
- For LCC, Figure 8 shows that the most important spectral region for retrieval is the visible region, particularly the red region until the red edge. B2 is spectrally located in the shortwave SWIR. Another sensitive zone, having the same B1 (around 692 nm) as in the first case, has its second band B2 in the NIR range as well as in the longwave SWIR. Note that these spectral areas are covered by broad spectral bands.
4.3. LAI & LCC Mapping
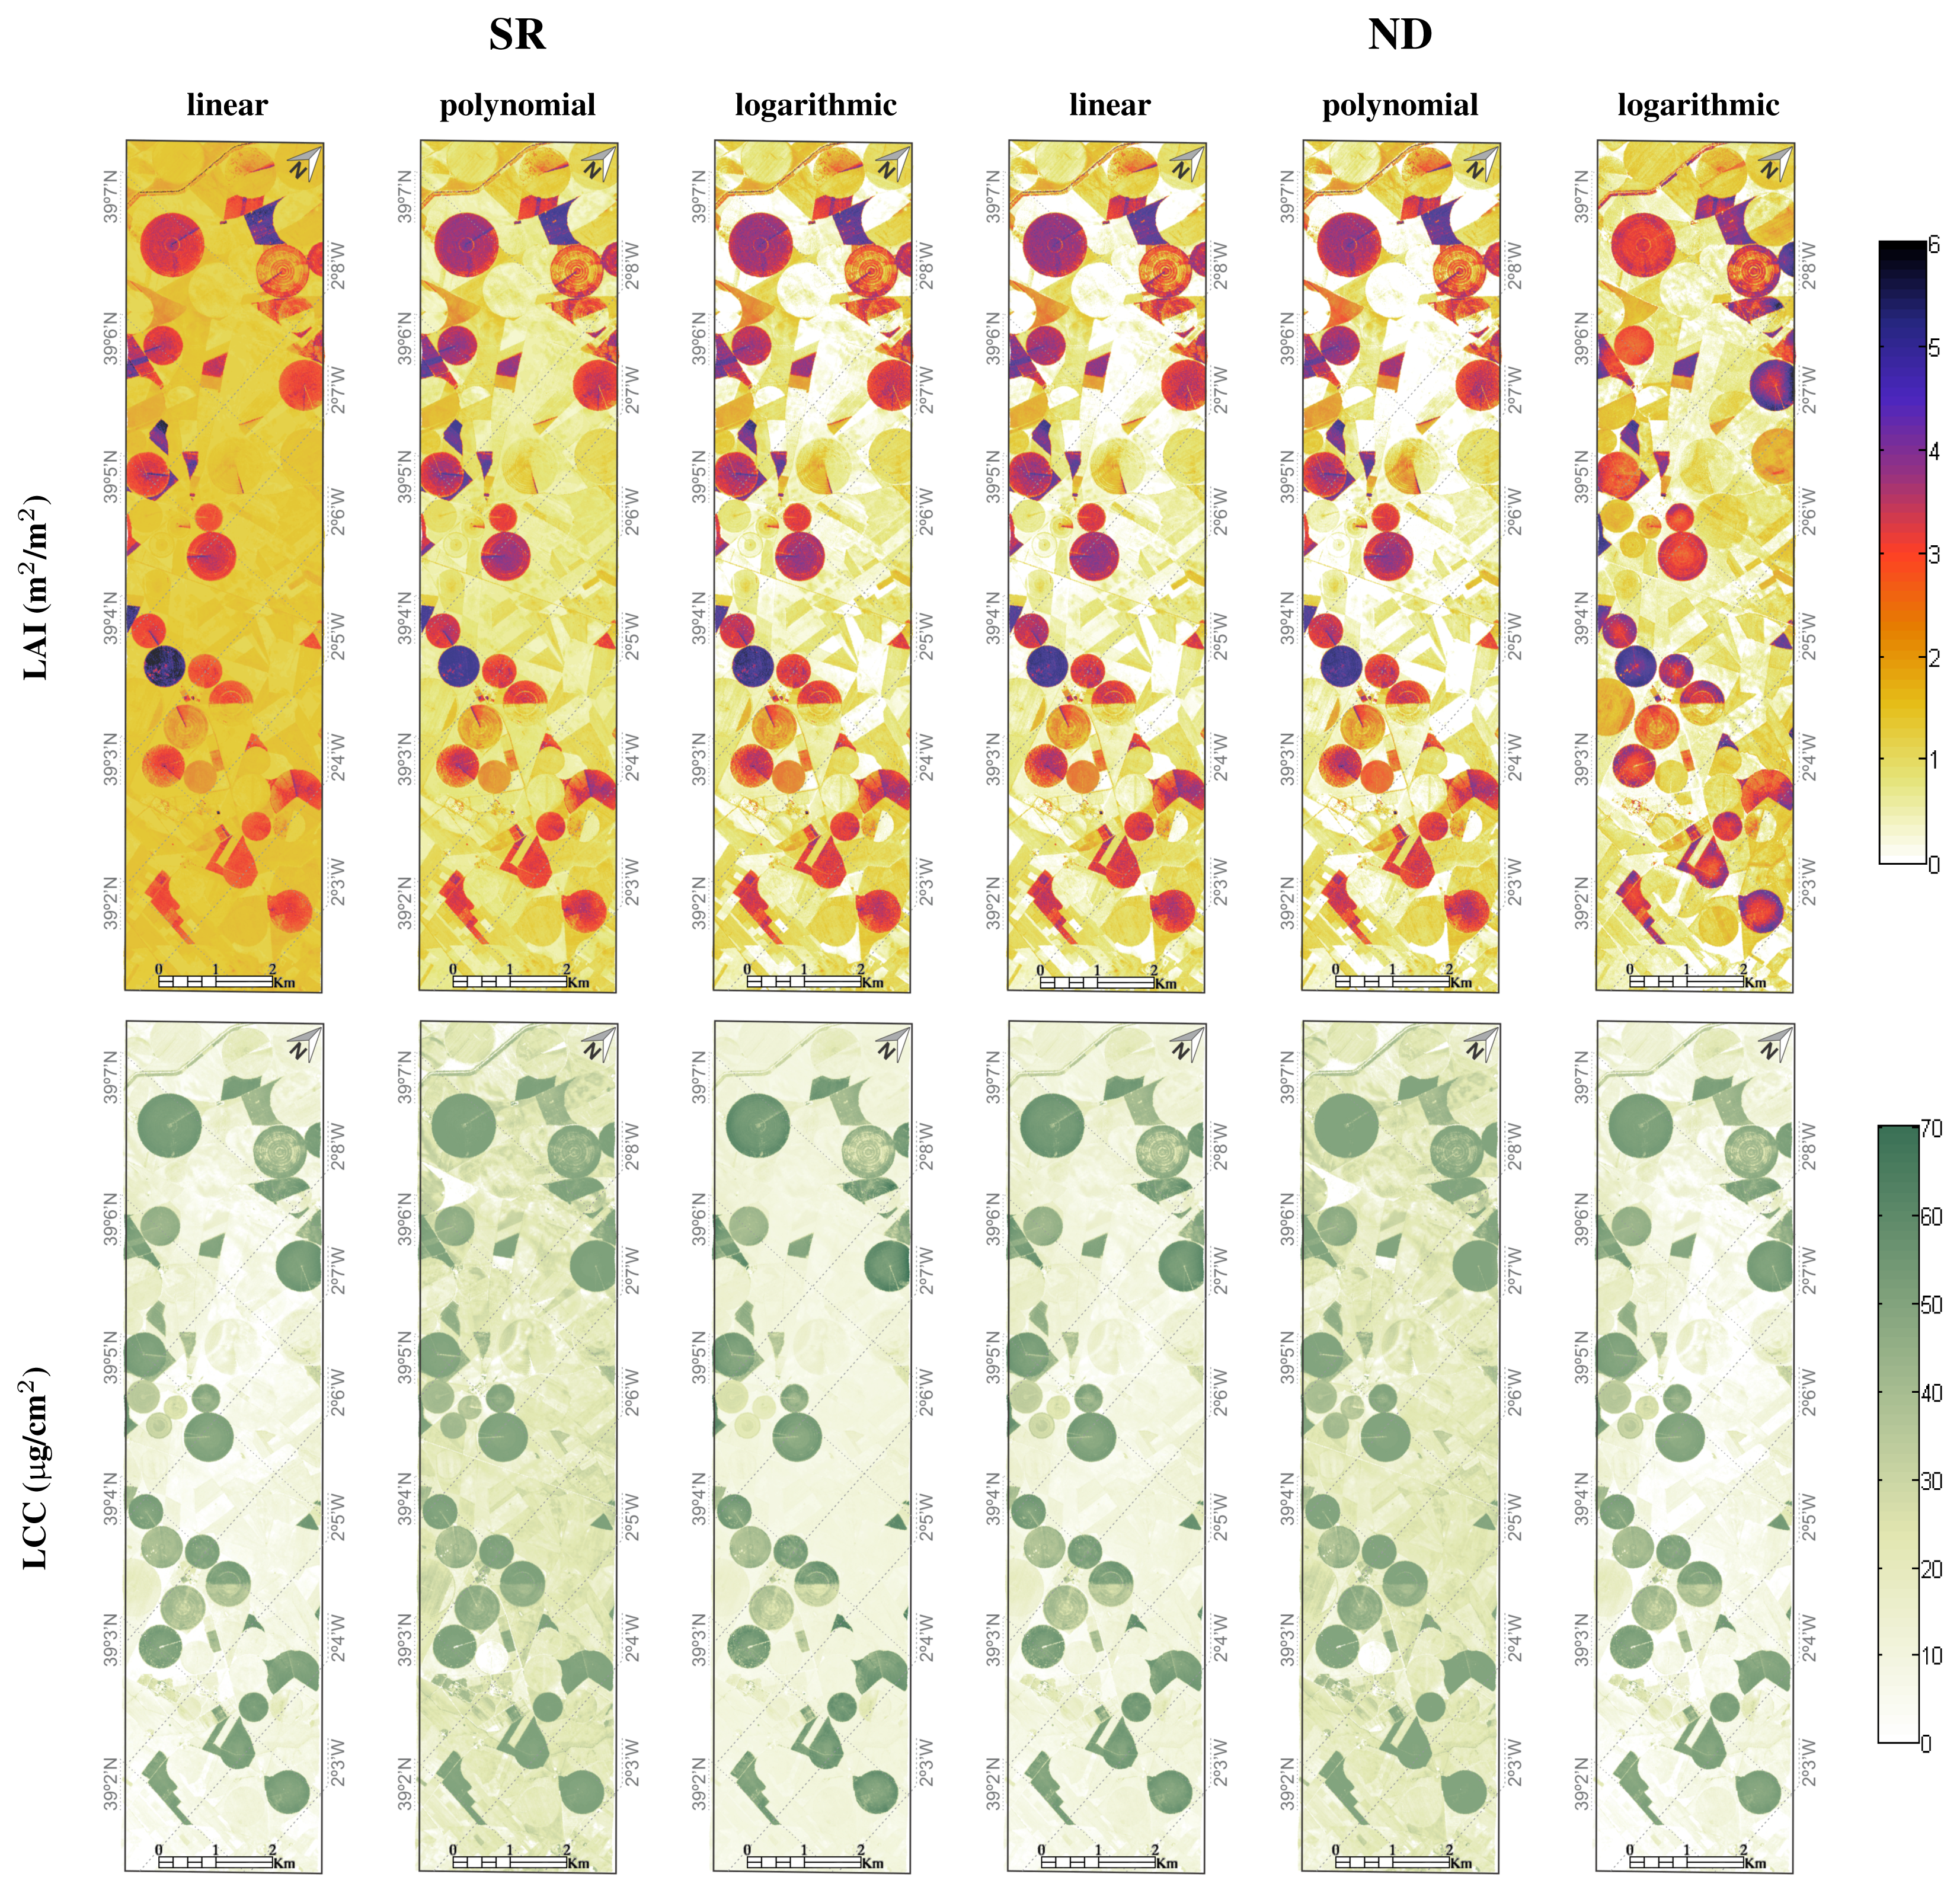
- For LAI, both, the ND polynomial and ND linear regression models, lead to the same calibration result (RMSE = 0.61; r2 = 0.83) and accordingly to very similar LAI maps. This example provides confidence that a linear regression is able to deliver adequate LAI maps, when appropriate spectral bands are selected; i.e., green spectral region (B1: 539–570 nm) in combination with the longwave SWIR (B2: 1970–2453 nm). Rapid saturation of the LAI in function of the SI is thereby avoided. The map shows areas with a high LAI quite clearly (irrigated circular fields). Areas with a low LAI—senescent crops to bare soil surfaces—elicit a zero value LAI (white color code);
- Conversely, when using SR for LAI mapping, prominent spatial differences appeared for the linear versus polynomial and logarithmic regression models. Particularly, a linear regression exhibits problematic behavior, since LAI variations for senescent regions significantly deviate from the other LAI mapping results. Due to variable soil contribution, a simple linear fit will never be able to capture the variability for near zero LAI values compatible with high LAI values. A logarithmic fitting function seems to lead to more consistent LAI maps. Nevertheless, although the ND type yields considerably poorer calibration results, both maps yield similar LAI patterns. The spatial similarity of the three best performing fitting functions (SR, logarithmic, ND linear and ND polynomial) provide confidence in the realism of the maps produced;
- With regard to LCC mapping, the spatial similarity between the SR and ND polynomial fits and the degree of detail is remarkable. However, interpretation becomes difficult for areas earlier identified as having low LAI values in the LAI map and showing high LCC values in the LCC map. One interpretation may be that the nature of a polynomial of second degree fit leads to retrievals of high LCC values at near-zero SI values. Another problem might be related to the difficulty of upscaling. For the areas where the canopy is very sparse, i.e., the LAI is low, it becomes harder to perceive the chlorophyll pigments in the leaves with a moderate spatial resolution of 1–4 m, even if the chlorophyll concentration in the small leaves is relatively high;
- Logarithmic ND fits, along with linear SR and ND fits, elicit the most realistic LCC patterns; with spatial patterns conform to those of the best LAI maps.
4.4. Towards a New Generation of Spectral Indices
- Development and evaluation of generic SIs by using RTMs including viewing and solar geometry. ARTMO includes turbid (e.g., SAIL) as well as explicit 3D RTMs (e.g., FLIGHT). Evidently, the validity of the most optimal models will be assessed using in situ validation data;
- New types of index formulations will be developed and tested across the full optical spectrum. Only SR and ND indices have been assessed here. Yet, alternative mathematical formulations are to be tested as well, e.g., the formulations used for soil adjusted vegetation index (SAVI), enhanced vegetation index (EVI), weighted difference vegetation index (WDVI) or more complex ones;
- Although in this paper only two-band formulations have been assessed, the SI toolbox offers the option for a systematic analysis of a full optical spectrum of band combinations with SI formulations of up to ten different bands in the range of 400 to 2500 nm. Since there is no reason to believe that two-band indices lead to the most successful SI models, this multiple band approach may lead to the development of more accurate and sensitive spectral indices.
5. Conclusions
Acknowledgments
Conflicts of Interest
- Author ContributionsJuan Pablo Rivera developed the toolbox presented here, developed this paper’s study concept, performed the experiments and contributed to writing the manuscript. The co-authors of this manuscript significantly contributed to all phases of the investigation: Jochem Verrelst supervised the research project and contributed to research design as well as manuscript writing. Jesus Delegido contributed to the experimental work, and Frank Veroustraete and José Moreno contributed to manuscript editing.
References
- Moulin, S.; Bondeau, A.; Delécolle, R. Combining agricultural crop models and satellite observations: From field to regional scales. Int. J. Remote Sens 1998, 19, 1021–1036. [Google Scholar]
- Báez-González, A.; Chen, P.Y.; Tiscareño López, M.; Srinivasan, R. Using satellite and field data with crop growth modeling to monitor and estimate corn yield in Mexico. Crop Sci 2002, 42, 1943–1949. [Google Scholar]
- Dorigo, W.A.; Zurita-Milla, R.; de Wit, A.J.W.; Brazile, J.; Singh, R.; Schaepman, M.E. A review on reflective remote sensing and data assimilation techniques for enhanced agroecosystem modeling. Int. J. Appl. Earth Obs. Geoinf 2007, 9, 165–193. [Google Scholar]
- Drusch, M.; del Bello, U.; Carlier, S.; Colin, O.; Fernandez, V.; Gascon, F.; Hoersch, B.; Isola, C.; Laberinti, P.; Martimort, P.; et al. Sentinel-2: ESA’s optical high-resolution mission for GMES operational services. Remote Sens. Environ 2012, 120, 25–36. [Google Scholar]
- Donlon, C.; Berruti, B.; Buongiorno, A.; Ferreira, M.H.; Femenias, P.; Frerick, J.; Goryl, P.; Klein, U.; Laur, H.; Mavrocordatos, C.; et al. The Global Monitoring for Environment and Security (GMES) Sentinel-3 mission. Remote Sens. Environ 2012, 120, 37–57. [Google Scholar]
- Stuffler, T.; Kaufmann, C.; Hofer, S.; Forster, K.; Schreier, G.; Mueller, A.; Eckardt, A.; Bach, H.; Penne, B.; Benz, U.; et al. The EnMAP hyperspectral imager—An advanced optical payload for future applications in Earth observation programmes. Acta Astronaut 2007, 61, 115–120. [Google Scholar]
- Roberts, D.; Quattrochi, D.; Hulley, G.; Hook, S.; Green, R. Synergies between VSWIR and TIR data for the urban environment: An evaluation of the potential for the Hyperspectral Infrared Imager (HyspIRI) decadal survey mission. Remote Sens. Environ 2012, 117, 83–101. [Google Scholar]
- Labate, D.; Ceccherini, M.; Cisbani, A.; de Cosmo, V.; Galeazzi, C.; Giunti, L.; Melozzi, M.; Pieraccini, S.; Stagi, M. The PRISMA payload optomechanical design, a high performance instrument for a new hyperspectral mission. Acta Astronaut 2009, 65, 1429–1436. [Google Scholar]
- Myneni, R.; Maggion, S.; Iaquinta, J.; Privette, J.; Gobron, N.; Pinty, B.; Kimes, D.; Verstraete, M.; Williams, D. Optical remote sensing of vegetation: Modeling, caveats, and algorithms. Remote Sens. Environ 1995, 51, 169–188. [Google Scholar]
- Gobron, N.; Pinty, B.; Verstraete, M.; Widlowski, J.L. Advanced vegetation indices optimized for up-coming sensors: Design, performance, and applications. IEEE Trans. Geosci. Remote Sens 2000, 38, 2489–2505. [Google Scholar]
- Houborg, R.; Boegh, E. Mapping leaf chlorophyll and leaf area index using inverse and forward canopy reflectance modeling and SPOT reflectance data. Remote Sens. Environ 2008, 112, 186–202. [Google Scholar]
- Rivera, J.; Verrelst, J.; Leonenko, G.; Moreno, J. Multiple cost functions and regularization options for improved retrieval of leaf chlorophyll content and LAI through inversion of the PROSAIL model. Remote Sens 2013, 5, 3280–3304. [Google Scholar]
- Verrelst, J.; Rivera, J.; Leonenko, G.; Alonso, L.; Moreno, J. Optimizing LUT-based RTMinversion for semiautomatic mapping of crop biophysical parameters from Sentinel-2 and -3 data: Role of cost functions. IEEE Trans. Geosci. Remote Sens 2013, 52, 257–269. [Google Scholar]
- Chen, J.; Cihlar, J. Retrieving leaf area index of boreal conifer forests using Landsat TM images. Remote Sens. Environ 1996, 55, 153–162. [Google Scholar]
- Myneni, R. Estimation of global leaf area index and absorbed PAR using radiative transfer models. IEEE Trans. Geosci. Remote Sens 1997, 35, 1380–1393. [Google Scholar]
- Combal, B.; Baret, F.; Weiss, M.; Trubuil, A.; Macé, D.; Pragnère, A.; Myneni, R.; Knyazikhin, Y.; Wang, L. Retrieval of canopy biophysical variables from bidirectional reflectance using prior information to solve the ill-posed inverse problem. Remote Sens. Environ 2003, 84, 1–15. [Google Scholar]
- Broge, N.; Mortensen, J. Deriving green crop area index and canopy chlorophyll density of winter wheat from spectral reflectance data. Remote Sens. Environ 2002, 81, 45–57. [Google Scholar]
- Haboudane, D.; Miller, J.; Pattey, E.; Zarco-Tejada, P.; Strachan, I. Hyperspectral vegetation indices and novel algorithms for predicting green LAI of crop canopies: Modeling and validation in the context of precision agriculture. Remote Sens. Environ 2004, 90, 337–352. [Google Scholar]
- Thenkabail, P.; Smith, R.; de Pauw, E. Evaluation of narrowband and broadband vegetation indices for determining optimal hyperspectral wavebands for agricultural crop characterization. Photogramm. Eng. Remote Sens 2002, 68, 607–621. [Google Scholar]
- Ustin, S.; Roberts, D.; Gamon, J.; Asner, G.; Green, R. Using imaging spectroscopy to study ecosystem processes and properties. BioScience 2004, 54, 523–534. [Google Scholar]
- Hatfield, J.; Gitelson, A.; Schepers, J.; Walthall, C. Application of spectral remote sensing for agronomic decisions. Agron. J 2008, 100, S117–S131. [Google Scholar]
- Baret, F.; Guyot, G. Potentials and limits of vegetation indices for LAI and APAR assessment. Remote Sens. Environ 1991, 35, 161–173. [Google Scholar]
- Verrelst, J.; Schaepman, M.; Koetz, B.; Kneubuhler, M. Angular sensitivity analysis of vegetation indices derived from CHRIS/PROBA data. Remote Sens. Environ 2008, 112, 2341–2353. [Google Scholar]
- Verrelst, J.; Schaepman, M.E.; Malenovský, Z.; Clevers, J.G.P.W. Effects of woody elements on simulated canopy reflectance: Implications for forest chlorophyll content retrieval. Remote Sens. Environ 2010, 114, 647–656. [Google Scholar] [Green Version]
- Ceccato, P.; Flasse, S.; Grégoire, J.M. Designing a spectral index to estimate vegetation water content from remote sensing data: Part 1: Theoretical approach. Remote Sens. Environ 2002, 82, 188–197. [Google Scholar]
- Zarco-Tejada, P.; Miller, J.; Noland, T.; Mohammed, G.; Sampson, P. Scaling-up and model inversion methods with narrowband optical indices for chlorophyll content estimation in closed forest canopies with hyperspectral data. IEEE Trans. Geosci. Remote Sens 2001, 39, 1491–1507. [Google Scholar]
- Le Maire, G.; François, C.; Dufrêne, E. Towards universal broad leaf chlorophyll indices using PROSPECT simulated database and hyperspectral reflectance measurements. Remote Sens. Environ 2004, 89, 1–28. [Google Scholar]
- Zarco-Tejada, P.J.; Berjón, A.; López-Lozano, R.; Miller, J.R.; Martín, P.; Cachorro, V.; Gonzalez, M.R.; de Frutos, A. Assessing vineyard condition with hyperspectral indices: Leaf and canopy reflectance simulation in a row-structured discontinuous canopy. Remote Sens. Environ 2005, 99, 271–287. [Google Scholar]
- Le Maire, G.; François, C.; Soudani, K.; Berveiller, D.; Pontailler, J.Y.; Bréda, N.; Genet, H.; Davi, H.; Dufrêne, E. Calibration and validation of hyperspectral indices for the estimation of broadleaved forest leaf chlorophyll content, leaf mass per area, leaf area index and leaf canopy biomass. Remote Sens. Environ 2008, 112, 3846–3864. [Google Scholar]
- Delegido, J.; Verrelst, J.; Alonso, L.; Moreno, J. Evaluation of Sentinel-2 red-edge bands for empirical estimation of green LAI and chlorophyll content. Sensors 2011, 11, 7063–7081. [Google Scholar]
- Mariotto, I.; Thenkabail, P.; Huete, A.; Slonecker, E.; Platonov, A. Hyperspectral versus multispectral crop-productivity modeling and type discrimination for the HyspIRI mission. Remote Sens. Environ 2013, 139, 291–305. [Google Scholar]
- Thenkabail, P.; Lyon, G.; Huete, A. Advances in Hyperspectral Remote Sensing of Vegetation and Agricultural Croplands. In Hyperspectral Remote Sensing of Vegetation; CRC Press: New York, NY, USA, 2011; pp. 3–29. [Google Scholar]
- Verrelst, J.; Alonso, L.; Camps-Valls, G.; Delegido, J.; Moreno, J. Retrieval of vegetation biophysical parameters using Gaussian process techniques. IEEE Trans. Geosci. Remote Sens 2012, 50, 1832–1843. [Google Scholar]
- Feret, J.B.; François, C.; Asner, G.P.; Gitelson, A.A.; Martin, R.E.; Bidel, L.P.R.; Ustin, S.L.; le Maire, G.; Jacquemoud, S. PROSPECT-4 and 5: Advances in the leaf optical properties model separating photosynthetic pigments. Remote Sens. Environ 2008, 112, 3030–3043. [Google Scholar]
- Stuckens, J.; Verstraeten, W.; Delalieux, S.; Swennen, R.; Coppin, P. A dorsiventral leaf radiative transfer model: Development, validation and improved model inversion techniques. Remote Sens. Environ 2009, 113, 2560–2573. [Google Scholar]
- Verhoef, W.; Bach, H. Coupled soil-leaf-canopy and atmosphere radiative transfer modeling to simulate hyperspectral multi-angular surface reflectance and TOA radiance data. Remote Sens. Environ 2007, 109, 166–182. [Google Scholar]
- North, P. Three-dimensional forest light interaction model using a Monte Carlo method. IEEE Trans. Geosci. Remote Sens 1996, 34, 946–956. [Google Scholar]
- Widlowski, J.L.; Pinty, B.; Lopatka, M.; Atzberger, C.; Buzica, D.; Chelle, M.; Disney, M.; Gastellu-Etchegorry, J.P.; Gerboles, M.; Gobron, N.; et al. The fourth radiation transfer model intercomparison (RAMI-IV): Proficiency testing of canopy reflectance models with ISO-13528. J. Geophys. Res. D Atmos 2013, 118, 6869–6890. [Google Scholar]
- ARTMO. Available online: http://ipl.uv.es/artmo/ (accessed on 22 May 2014).
- Verrelst, J.; Romijn, E.; Kooistra, L. Mapping vegetation density in a heterogeneous river floodplain ecosystem using pointable CHRIS/PROBA data. Remote Sens 2012, 4, 2866–2889. [Google Scholar]
- Rivera Caicedo, J.; Verrelst, J.; Alonso, L.; Moreno, J.; Camps-Valls, G. Toward a semiautomatic machine learning retrieval of biophysical parameters. IEEE J. Sel. Top. Appl. Earth Obs. Remote Sens 2014, 7, 1249–1259. [Google Scholar]
- Richter, K.; Atzberger, C.; Hank, T.; Mauser, W. Derivation of biophysical variables from earth observation data: Validation and statistical measures. J. Appl. Remote Sens 2012, 6. [Google Scholar] [CrossRef]
- Gandía, S.; Fernández, G.; Garcia, J.C.; Moreno, J. Retrieval of Vegetation Biophysical Variables from CHRIS/PROBA Data in the SPARC Campaign. Proceedings of the 2nd CHRIS/PROBAWorkshop, Frascati, Italy, 28–30 April 2004.
- Fernández, G.; Moreno, J.; Gandía, S.; Martínez, B.; Vuolo, F.; Morales, F. Statistical Variability of Field Measurements of Biophysical Parameters in SPARC-2003 and SPARC-2004 Campaigns. Proceedings of the ESA WPP-250—SPARC Final Workshop, Enschede, the Netherlands, 4–5 July 2005.
- Alonso, L.; Moreno, J. Advances and Limitations in a Parametric Geometric Correction of CHRIS/PROBA Data. Proceedings of the 3rd CHRIS/Proba Workshop, Frascati, Italy, 21–23 March 2005.
- Guanter, L.; Estellés, V.; Moreno, J. Spectral calibration and atmospheric correction of ultra-fine spectral and spatial resolution remote sensing data. Application to CASI-1500 data. Remote Sens. Environ 2007, 109, 54–65. [Google Scholar]
- Rouse, J.; Haas, R.; Schell, J.; Deering, D.; Harlan, J. Monitoring the Vernal Advancement of Retrogradation of Natural Vegetation; Remote Sensing Center, Texas A&M University: College Station, TX, USA, 1974. [Google Scholar]
- Gitelson, A.; Gritz, Y.; Merzlyak, M. Relationships between leaf chlorophyll content and spectral reflectance and algorithms for non-destructive chlorophyll assessment in higher plant leaves. J. Plant Physiol 2003, 160, 271–282. [Google Scholar]
- Stenberg, P.; Rautiainen, M.; Manninen, T.; Voipio, P.; Smolander, H. Reduced simple ratio better than NDVI for estimating LAI in Finnish pine and spruce stands. Silva Fenn 2004, 38, 3–14. [Google Scholar]
- Verstraete, M.; Pinty, B. Designing optimal spectral indexes for remote sensing applications. IEEE Trans. Geosci. Remote Sens 1996, 34, 1254–1265. [Google Scholar]
- Draper, N.; Smith, H. Applied Regression Analysis, 3rd ed; Wiley Series in Probability and Statistics; Wiley: New York, NY, USA, 1998. [Google Scholar]
- Darvishzadeh, R.; Atzberger, C.; Skidmore, A.; Abkar, A. Leaf Area Index derivation from hyperspectral vegetation indicesand the red edge position. Int. J. Remote Sens 2009, 30, 6199–6218. [Google Scholar]
- Schlerf, M.; Atzberger, C.; Hill, J. Remote sensing of forest biophysical variables using HyMap imaging spectrometer data. Remote Sens. Environ 2005, 95, 177–194. [Google Scholar]
- Cocks, T.; Jenssen, R.; Stewart, A.; Wilson, I.; Shields, T. The HyMap Airborne Hyperspectral Sensor: The System, Calibration and Performance. Proceedings of the 1st EARSeL Workshop on Imaging Spectroscopy, Zurich, Switzerland, 6–8 October 1998; pp. 37–42.
- Filella, I.; Penuelas, J. The red edge position and shape as indicators of plant chlorophyll content, biomass and hydric status. Int. J. Remote Sens 1994, 15, 1459–1470. [Google Scholar]
- Clevers, J.; Gitelson, A. Remote estimation of crop and grass chlorophyll and nitrogen content using red-edge bands on Sentinel-2 and -3. Int. J. Appl.Earth Obs. Geoinf 2013, 23, 344–351. [Google Scholar]
- Delegido, J.; Verrelst, J.; Meza, C.; Rivera, J.; Alonso, L.; Moreno, J. A red-edge spectral index for remote sensing estimation of green LAI over agroecosystems. Eur. J. Agron 2013, 46, 42–52. [Google Scholar]
- Brown, L.; Chen, J.; Leblanc, S.; Cihlar, J. A shortwave infrared modification to the simple ratio for LAI retrieval in boreal forests: An image and model analysis. Remote Sens. Environ 2000, 71, 16–25. [Google Scholar]
- Lee, K.S.; Cohen, W.; Kennedy, R.; Maiersperger, T.; Gower, S. Hyperspectral versus multispectral data for estimating leaf area index in four different biomes. Remote Sens. Environ 2004, 91, 508–520. [Google Scholar]
- Gonsamo, A. Normalized sensitivity measures for leaf area index estimation using three-band spectral vegetation indices. Int. J. Remote Sens 2011, 32, 2069–2080. [Google Scholar]
- Heiskanen, J.; Rautiainen, M.; Stenberg, P.; Mõttus, M.; Vesanto, V.H. Sensitivity of narrowband vegetation indices to boreal forest LAI, reflectance seasonality and species composition. ISPRS J. Photogramm. Remote Sens 2013, 78, 1–14. [Google Scholar]
- Curran, P. Remote sensing of foliar chemistry. Remote Sens. Environ 1989, 30, 271–278. [Google Scholar]
- Verrelst, J.; Muñoz, J.; Alonso, L.; Delegido, J.; Rivera, J.; Camps-Valls, G.; Moreno, J. Machine learning regression algorithms for biophysical parameter retrieval: Opportunities for Sentinel-2 and -3. Remote Sens. Environ 2012, 118, 127–139. [Google Scholar]
- Lobell, D.; Asner, G. Moisture effects on soil reflectance. Soil Sci. Soc. Am. J 2002, 66, 722–727. [Google Scholar]
- Thenkabail, P.; Smith, R.; de Pauw, E. Hyperspectral vegetation indices and their relationships with agricultural crop characteristics. Remote Sens. Environ 2000, 71, 158–182. [Google Scholar]
- Thenkabail, P.; Enclona, E.; Ashton, M.; van der Meer, B. Accuracy assessments of hyperspectral waveband performance for vegetation analysis applications. Remote Sens. Environ 2004, 91, 354–376. [Google Scholar]


| Index type | Fitting function | B1 (nm) | B2 (nm) | SI model | abs. RMSE | NRMSE (%) | r2 |
|---|---|---|---|---|---|---|---|
| LAI: | |||||||
| ND | polynomial | 570 | 2453 | LAI = −1.366ND2 + 6.154ND + 1.976 | 0.61 | 12.51 | 0.83 |
| SR | logarithmic | 555 | 2453 | LAI = 2.291 log(SR) + 1.924 | 0.61 | 12.10 | 0.83 |
| ND | linear | 555 | 2453 | LAI = 5.023ND + 1.922 | 0.61 | 12.80 | 0.83 |
| SR | polynomial | 539 | 2421 | LAI = −0.621SR2 + 3.754SR −0.760 | 0.63 | 15.58 | 0.82 |
| SR | linear | 539 | 2421 | LAI = 1.751SR + 0.504 | 0.70 | 16.32 | 0.77 |
| SR | exponential | 2118 | 2171 | LAI = 0.000238e8.783SR | 0.72 | 11.85 | 0.77 |
| ND | exponential | 707 | 2453 | LAI = 0.712e2.721ND | 0.75 | 13.13 | 0.77 |
| ND | power | 707 | 2453 | LAI = 4.670ND0.548 | 0.77 | 19.06 | 0.77 |
| SR | power | 539 | 2421 | LAI = 1.951SR1.112 | 0.82 | 14.64 | 0.76 |
| ND | logarithmic | 462 | 524 | LAI = 3.888 log(ND) + 6.947 | 0.85 | 18.23 | 0.74 |
| LCC: | |||||||
| ND | polynomial | 692 | 1686 | LCC = −227.499ND2 + 281.410ND − 36.924 | 4.21 | 7.75 | 0.93 |
| SR | polynomial | 692 | 1661 | LCC = −8.114ND2 + 60.997ND − 61.553 | 4.30 | 7.64 | 0.92 |
| ND | logarithmic | 692 | 1340 | LCC = 43.578 log(ND) + 63.272 | 4.70 | 10.18 | 0.91 |
| SR | linear | 692 | 1340 | LCC = 7.455SR + 4.707 | 4.70 | 20.24 | 0.91 |
| ND | linear | 692 | 1340 | LCC = 90.290ND − 14.808 | 4.21 | 10.75 | 0.90 |
| SR | logarithmic | 692 | 1200 | LCC = 26.447 log(ND) − 2.990 | 5.53 | 11.54 | 0.87 |
| SR | exponential | 692 | 1215 | LCC = 91.164e−4.235SR | 6.00 | 11.25 | 0.87 |
| ND | power | 632 | 1698 | LCC = 127.581ND2.119 | 28.06 | 365.5 | 0.87 |
| ND | exponential | 632 | 1257 | LCC = 2.110e3.827ND | 6.64 | 12.80 | 0.84 |
| SR | power | 707 | 723 | LCC = 7.281SR2.938 | 8.28 | 13.19 | 0.76 |
© 2014 by the authors; licensee MDPI, Basel, Switzerland This article is an open access article distributed under the terms and conditions of the Creative Commons Attribution license (http://creativecommons.org/licenses/by/3.0/).
Share and Cite
Rivera, J.P.; Verrelst, J.; Delegido, J.; Veroustraete, F.; Moreno, J. On the Semi-Automatic Retrieval of Biophysical Parameters Based on Spectral Index Optimization. Remote Sens. 2014, 6, 4927-4951. https://doi.org/10.3390/rs6064927
Rivera JP, Verrelst J, Delegido J, Veroustraete F, Moreno J. On the Semi-Automatic Retrieval of Biophysical Parameters Based on Spectral Index Optimization. Remote Sensing. 2014; 6(6):4927-4951. https://doi.org/10.3390/rs6064927
Chicago/Turabian StyleRivera, Juan Pablo, Jochem Verrelst, Jesús Delegido, Frank Veroustraete, and José Moreno. 2014. "On the Semi-Automatic Retrieval of Biophysical Parameters Based on Spectral Index Optimization" Remote Sensing 6, no. 6: 4927-4951. https://doi.org/10.3390/rs6064927