1. Introduction
Bridges undoubtedly form a vital part of every community’s economy and mobility. It is therefore of great importance that they are maintained within the structure of lifelong service planning in a way that is fit for purpose and cost effective.
Different bridges inevitably require different means of gaining information relating to the structure’s health, but one certainty is the need for the most appropriate technique to be selected for each structure and for operators of the systems to be adequately trained in their use. There are various non-destructive testing (NDT) techniques commercially available for use in the area of the health monitoring and assessment of bridges, including: radiography and radiometry, sonic, ultrasonic and ground penetrating radar (GPR). All of these NDT techniques have proven effective, but all work best in combination with other techniques, depending upon the application, as they all provide different data [
1–
5].
Radiography and radiometry are the two currently available gamma (γ)-ray techniques. The method of radiography passes the γ-ray through the front of the sample, which is then recorded onto a film/sensor at the rear of the sample for viewing. The method of radiometry measures the amount of energy which has passed through the material, which relates to the density of the material. This is done with a radiation detector situated behind the test element. Both of these techniques are useful in finding the position and size of reinforcement, detecting concrete quality and in finding any voids and corrosion in post tensioned cables in concrete. The techniques, however, are expensive and are only usable in concrete thicknesses of up to 0.5 m. Other downsides include the need for access to both sides of the sample, the length of time needed for the development of its comparison with the X-ray technique image, and health risks due to radiation [
6]. Transportation of the equipment for the γ-ray radiation method is easier than for X-ray radiography as it is not heavy and requires no external power. It is also a simple technique to apply, although it requires training and a specialized operator. Because of these advantages, and the increased range of data it brings in, it is considered beneficial to integrate this technique into others, such as GPR.
The sonic/ultrasonic technique, impact echo, works by striking the sample point by point, using sound waves created by mechanical energy [
7]. A small impulse hammer strikes the surface of the sample and information is recorded in the location of the strike and on the reflected signal using an accelerometer placed 50–75 mm from the impact point. Fast Fourier transform (FFT) is applied to this information [
8,
9]. The impact echo technique is useful in measuring and detecting defects in plate-like structures such as bridge decks, slabs and walls and in bar-like structures such as circular, square and rectangular columns, as well as in the detection of defects in I-girders [
10]. This is a relatively low cost technique which is simple to apply, but it is not able to penetrate deep into the bridge deck structure. Therefore, compared to this technique, assessing bridge health with GPR provides more accurate information at greater depths as impact echo provides only limited bridge deck information, and also they require training and a specialized operator. The GPRs’ basic principle is based on the transmission of electromagnetic pulses into the subsurface, which are either transmitted into deeper layers, or reflected at subsurface interfaces. Various parameters of these propagating waves can then be recorded and analyzed in order to assess the properties of the subsurface [
11–
14].
This paper examines the GPR technique and provides guidance in the selection of antenna and method of analysis needed to detect the presence of moisture ingress [
14], and counter its effects.
The positions of the rebars can be misinterpreted due to GPR’s limited ability to show moisture.
The need to utilize split-spectrum processing with order statistic filter [
7,
8] in the GPR survey data.
The requirement for a destructive test using the aforementioned information to confirm the presence of moisture.
Applying split-spectrum processing in GPR combined with order statistic filters improves the signal-to-noise ratio of the backscattered signal. Guidance will then be given on how to identify moisture without the need for costly excavation work.
The paper focuses on the effectiveness of using GPR as a NDT method in terms of improving understanding of both possible structural defects and underlying supports, such as rebars [
15–
18]. Furthermore, the order statistic filters perform better when GPR and noise have good statistical separation, representing a particular rank, such as minimum, median or maximum. Reported results illustrate the effectiveness of GPR mapping, providing valuable information regarding the positions of rebar (upper and lower reinforcement), unknown structural features and possible moisture ingress within the structure.
2. Theoretical Background
2.1. Moisture
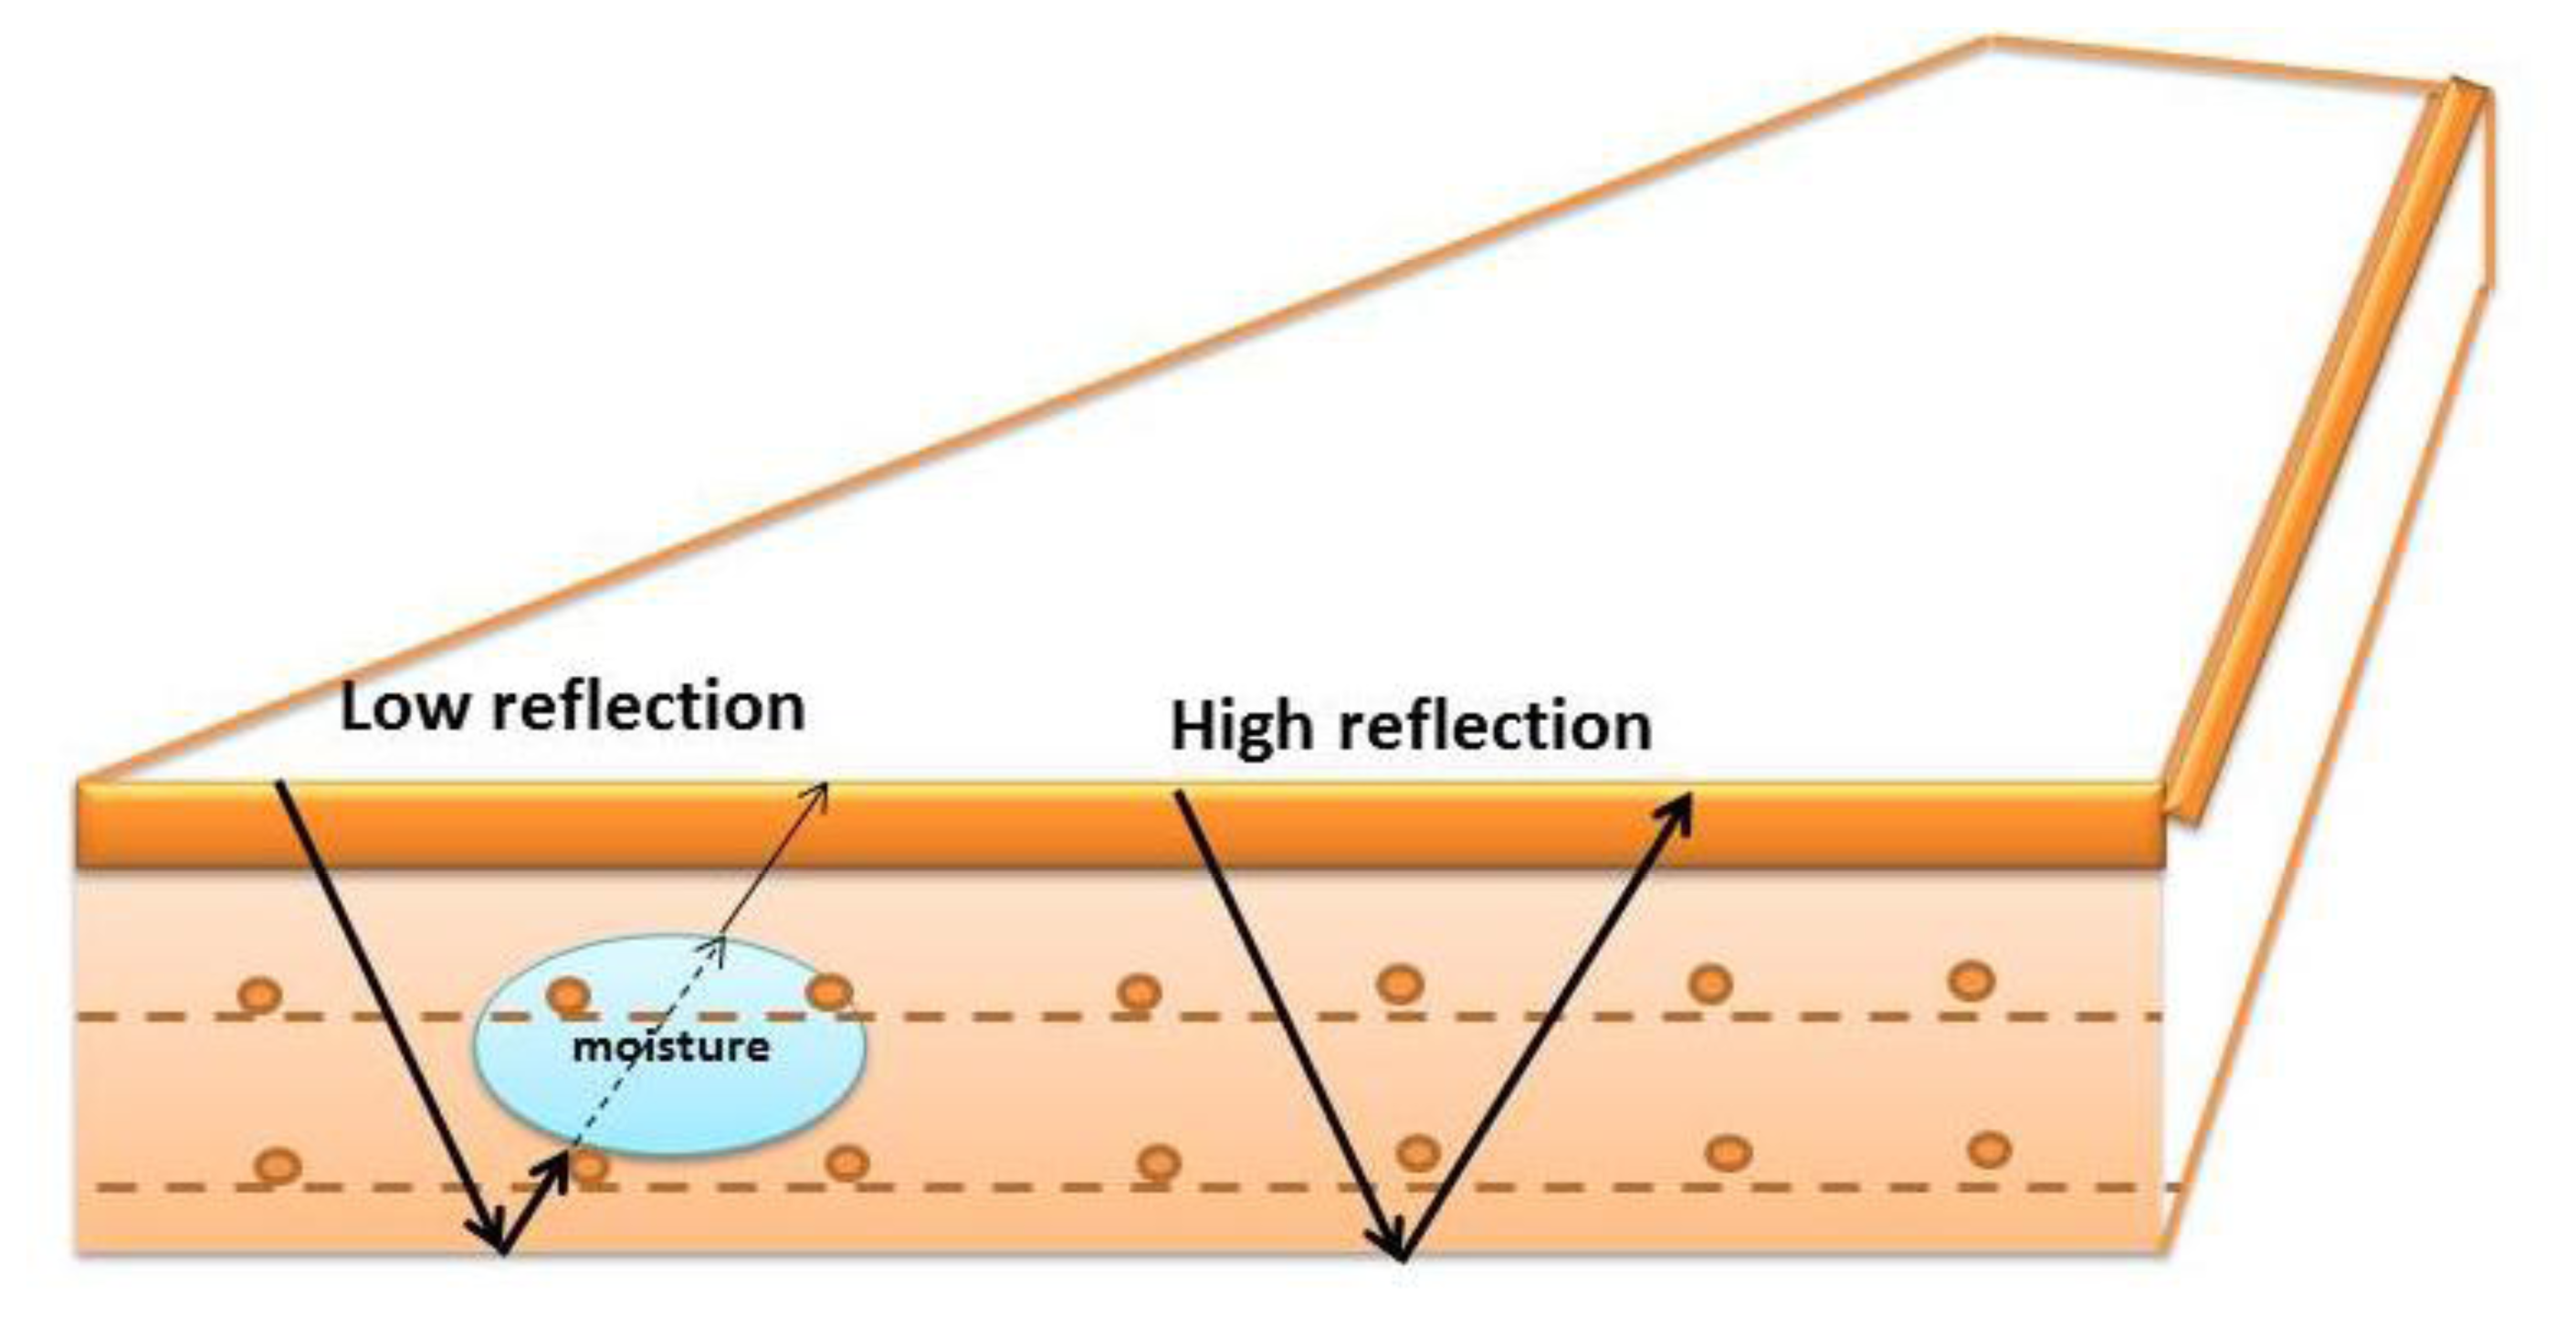
The extreme sensitivity of GPR towards moisture makes it very suitable for detecting certain factors of deterioration for bridge decks such as damage sustained from freeze/thaw cycles, corrosion in steel reinforcements, and the reaction of alkali on silica.
Figure 1 shows that the GPR’s apparent sensitivity to moisture makes its use promising in the detection [
19,
20].
The presence of moisture within the bridge deck is considered to be a serious issue, as it leads to potential weakening of the structural rebars. Moisture is able to penetrate into concrete in the following four phases [
21]:
Absorption
Common usually in dry conditions, this happens due to moisture entering the concrete by attaching to the porous walls. A thin coating of moisture may even remain during the original process of drying.
Condensation
In general, the pores of concrete may be filled with a vapour, which is a continuous process. Owing to various differences in pressure, this moisture is capable of diffusing throughout the entire body of concrete.
Vapour and Liquid Transport
The moisture which is present in the form of vapour is capable of condensing as humidity increases, potentially causing the formation of liquid. This can occur in conjunction with the presence of a layer of vapour, as has been discussed above.
Liquid Transport
In an environment of high humidity and moisture, the presence of liquid becomes continuous.
Apart from these circumstances, another process that enables moisture and liquid to enter the concrete is in the excessive cracking of the concrete. Cracking enables a gateway to be formed which allows water to seep through the initial cover and move inwards. When this occurs, the rebars can become susceptible to corrosion, caused by moisture, ingress of chloride ions and carbonation [
22]. Carbonation in concrete and the damage caused by chloride ions can normally be countered by the alkaline environment inherent in concrete, which allows for an oxide layer to exist passively. This layer is responsible for preventing further oxidization in the steel reinforcements [
22]. Furthermore, chloride ions can create cathodic and anodic areas in the reinforcements, which results in oxidation in the steel in the anodic areas, and electrons transferring in the cathodic areas. This further causes hydroxylation leading to an environment conducive to corrosion.
The internal stress is also increased by the formation of ferric oxide, which increases the volume and contributes towards the concrete cover deboning from the layer of reinforcement [
22]. The cumulative impact of rebar corrosion and carbonation cracking can greatly vary depending on the width of the crack; however, frequency of cracking and the quality of the concrete are less important than the cover depth [
21]. Early studies conducted using ground coupled systems were able to measure the rate of delamination experienced by bridge decks made of concrete. The analysis of the data was further strengthened by investigating the radargram produced using the GPR [
23]. Another commonly utilized method to assess the condition of the deck is to map the amplitudes of the reflections ranging from the top rebar to the layer interfaces. The data collections around areas with longitudinal reinforcement bars are problematic for our coupled antennas.
However, [
24] were able to utilize a processing technique coupled with a special setup—a horn antenna (dual polarization) which helped to resolve this problem. In deducing the accuracy of results produced via GPR on the bridge decks, [
24] were able to conclude that data from the rebar reflection indicates the presence of defects with an accuracy rate of 75%. The dielectric value of the surface did not create differences in detection on the decks. However, there is much speculation regarding the GPR testing techniques reliability, particularly in testing the bridge decks, because resolution issues prompt the usage of antennas that have higher frequencies than those recommended for standard usage.
However, the deformation and the strength of various road structures on different subgrade soils are greatly affected by the moisture content. When designing highways in areas with large bodies of clay and soils which are vulnerable to frost, it is currently considered important to gain data regarding the moisture content within the subgrade soil in order to accurately predict the degree of compressibility and stability [
25]. This rule is also applicable to bridge decks where the moisture is high and can significantly affect the cumulative strength of concrete, which cause delaminations in the cover. It is deemed imperative to record the presence of moisture in bridge decks so that its negative effects can be neutralized. It is also important to have a measurement record of the dielectric tendencies exhibited by various materials as they are susceptible to changes in temperature, GPR frequencies and moisture.
It was also found that the samples of asphalts show changes in their dielectric permittivity values as they experienced changes such as increase in moisture and temperature. The changes were reported to be slight at higher frequencies and were rather marked at low frequencies [
20,
26].
2.2. EM Waves Velocity and Dispersion
The processed data sets the automatic extraction of the shallower rebar layer, in addition to the analysis of rebar backscattered signal and manual extraction of the deeper layer of rebar. Acquired radar data is saved as raw data and processed to display as a “b-scan” that represents a vertical slice through the surveyed area.
In addition to the conventional interpretation of radargrams, a technique known as velocity analysis can be used [
27]. In this technique, the velocity of the transmitted wave is compared to that of the received wave, and discrepancies can indicate the presence of medium electromagnetic waves, such as moisture.
The main interest is in the travel time and signal amplitude of the reflected pulse. The significance of travel time is that it can be converted to depth if the propagation velocity of the EM pulse in the concrete is known. If the transmitter and receiver are coincident (point source), the velocity (
Vm) is calculated according to
Equation (1) [
27]:
where
is the loss factor, σ is conductivity, c is speed of light, ω = 2π
f (rad/s) is the angular frequency,
f (Hz) is frequency, ɛ =
ɛr × ɛ0 the permittivity of the material,
ɛ0 is the permittivity of free space or vacuum (e.g., 8.85... × 10
−12 F/m). Velocity can be simplified for homogeneous and isotropic material [
28]; the relative propagation velocity can be calculated from
Equation (2).
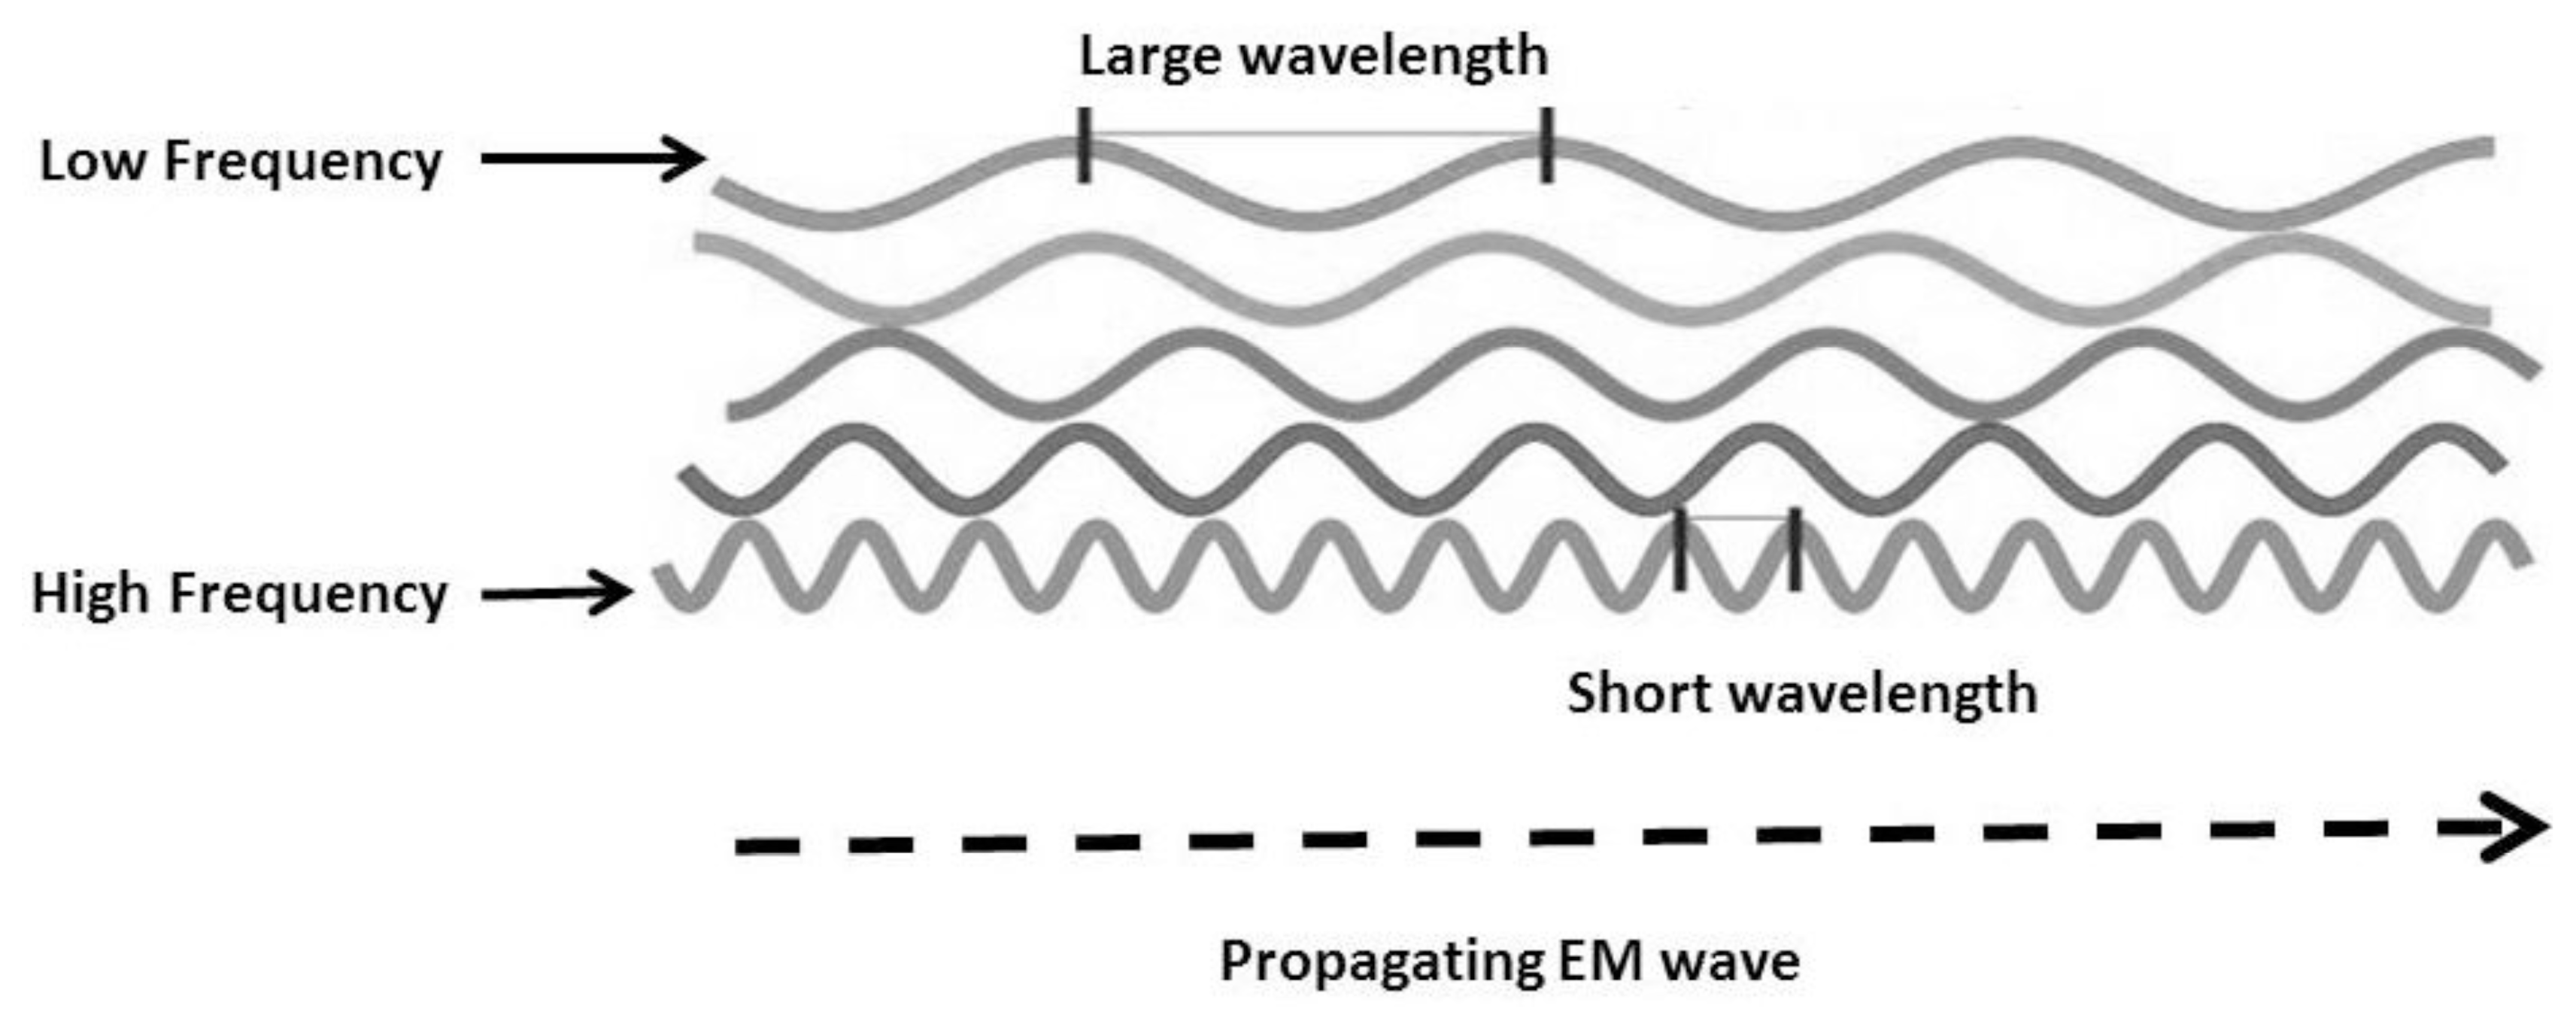
The velocity and the attenuation of the waves emitted via GPR are largely dependent on the conductivity and dielectric properties of the investigated medium. The dispersion of the signal is capable of affecting wavelengths and increases as the depth increase. When the signal becomes weaker, there is less reflection of signal energy [
22,
29] (
Figure 2).
One drawback is that, when conditions are wet or when dealing with saline or clay-rich objects, GPR signals are less able to penetrate to the material. Therefore, the target resolution and the wavelength are largely determined by the frequency and the material permittivity/properties. As stated in
Equation (3), the propagation velocity is related (as a result of) to the inherent material properties
i.e., the dielectric constant. For this reason, certain materials that have low permittivities such as dry concrete, dry sands
etc., can experience longer wavelengths and may produce poor target resolution but deeper penetration. However, materials which have high permittivities, such as saturated sands, can experience shorter wavelengths, and may produce good target resolution but less penetration.
The GPR velocity is largely utilized to assess the depth of features or layers of an object. However, the velocity can be greatly influenced by the material’s ability to reflect and reabsorb energy, the water content and any other changes in the material [
26]. It was pointed out by [
30] that the reflection of energy depends on the GPR wave velocity and its depth and propagation through the various layers, which tend to function as a dielectric constant. The dielectric properties of the water content of different layers are largely dependent on the degree of compaction at the time of the measurements of GPR and are only deemed valid for a few days [
30].
2.3. Split-Spectrum Processing (SSP)
The commonly implemented technique of split-spectrum processing with order statistics reliably facilitates the detection of subsurface characteristics and defects within materials. This ultrasonic imaging technique collects and analyzes data generated from a sample’s backscatter microstructure echoes or, put more simply, its random signals. These signals can then be analyzed to reveal crucial information relating to such characteristics as grain size, shape and positioning, as well as information on boundary and chemical makeup [
31,
32].
The received measuring system impulse response comprises a complexity of factors which are analyzed to calculate the measuring system impulse response (the interrogating ultrasonic wavelet) together with the grain scattering function. The data collected can then be used to categorize grain size. The grain-scattering signal thus becomes random and considerable variability in the time domain is displayed. In order to determine and locate the presence of moisture within concrete materials, this technique is used in combination with data collected via the GPR system; this paper examines this partnership [
33,
34].
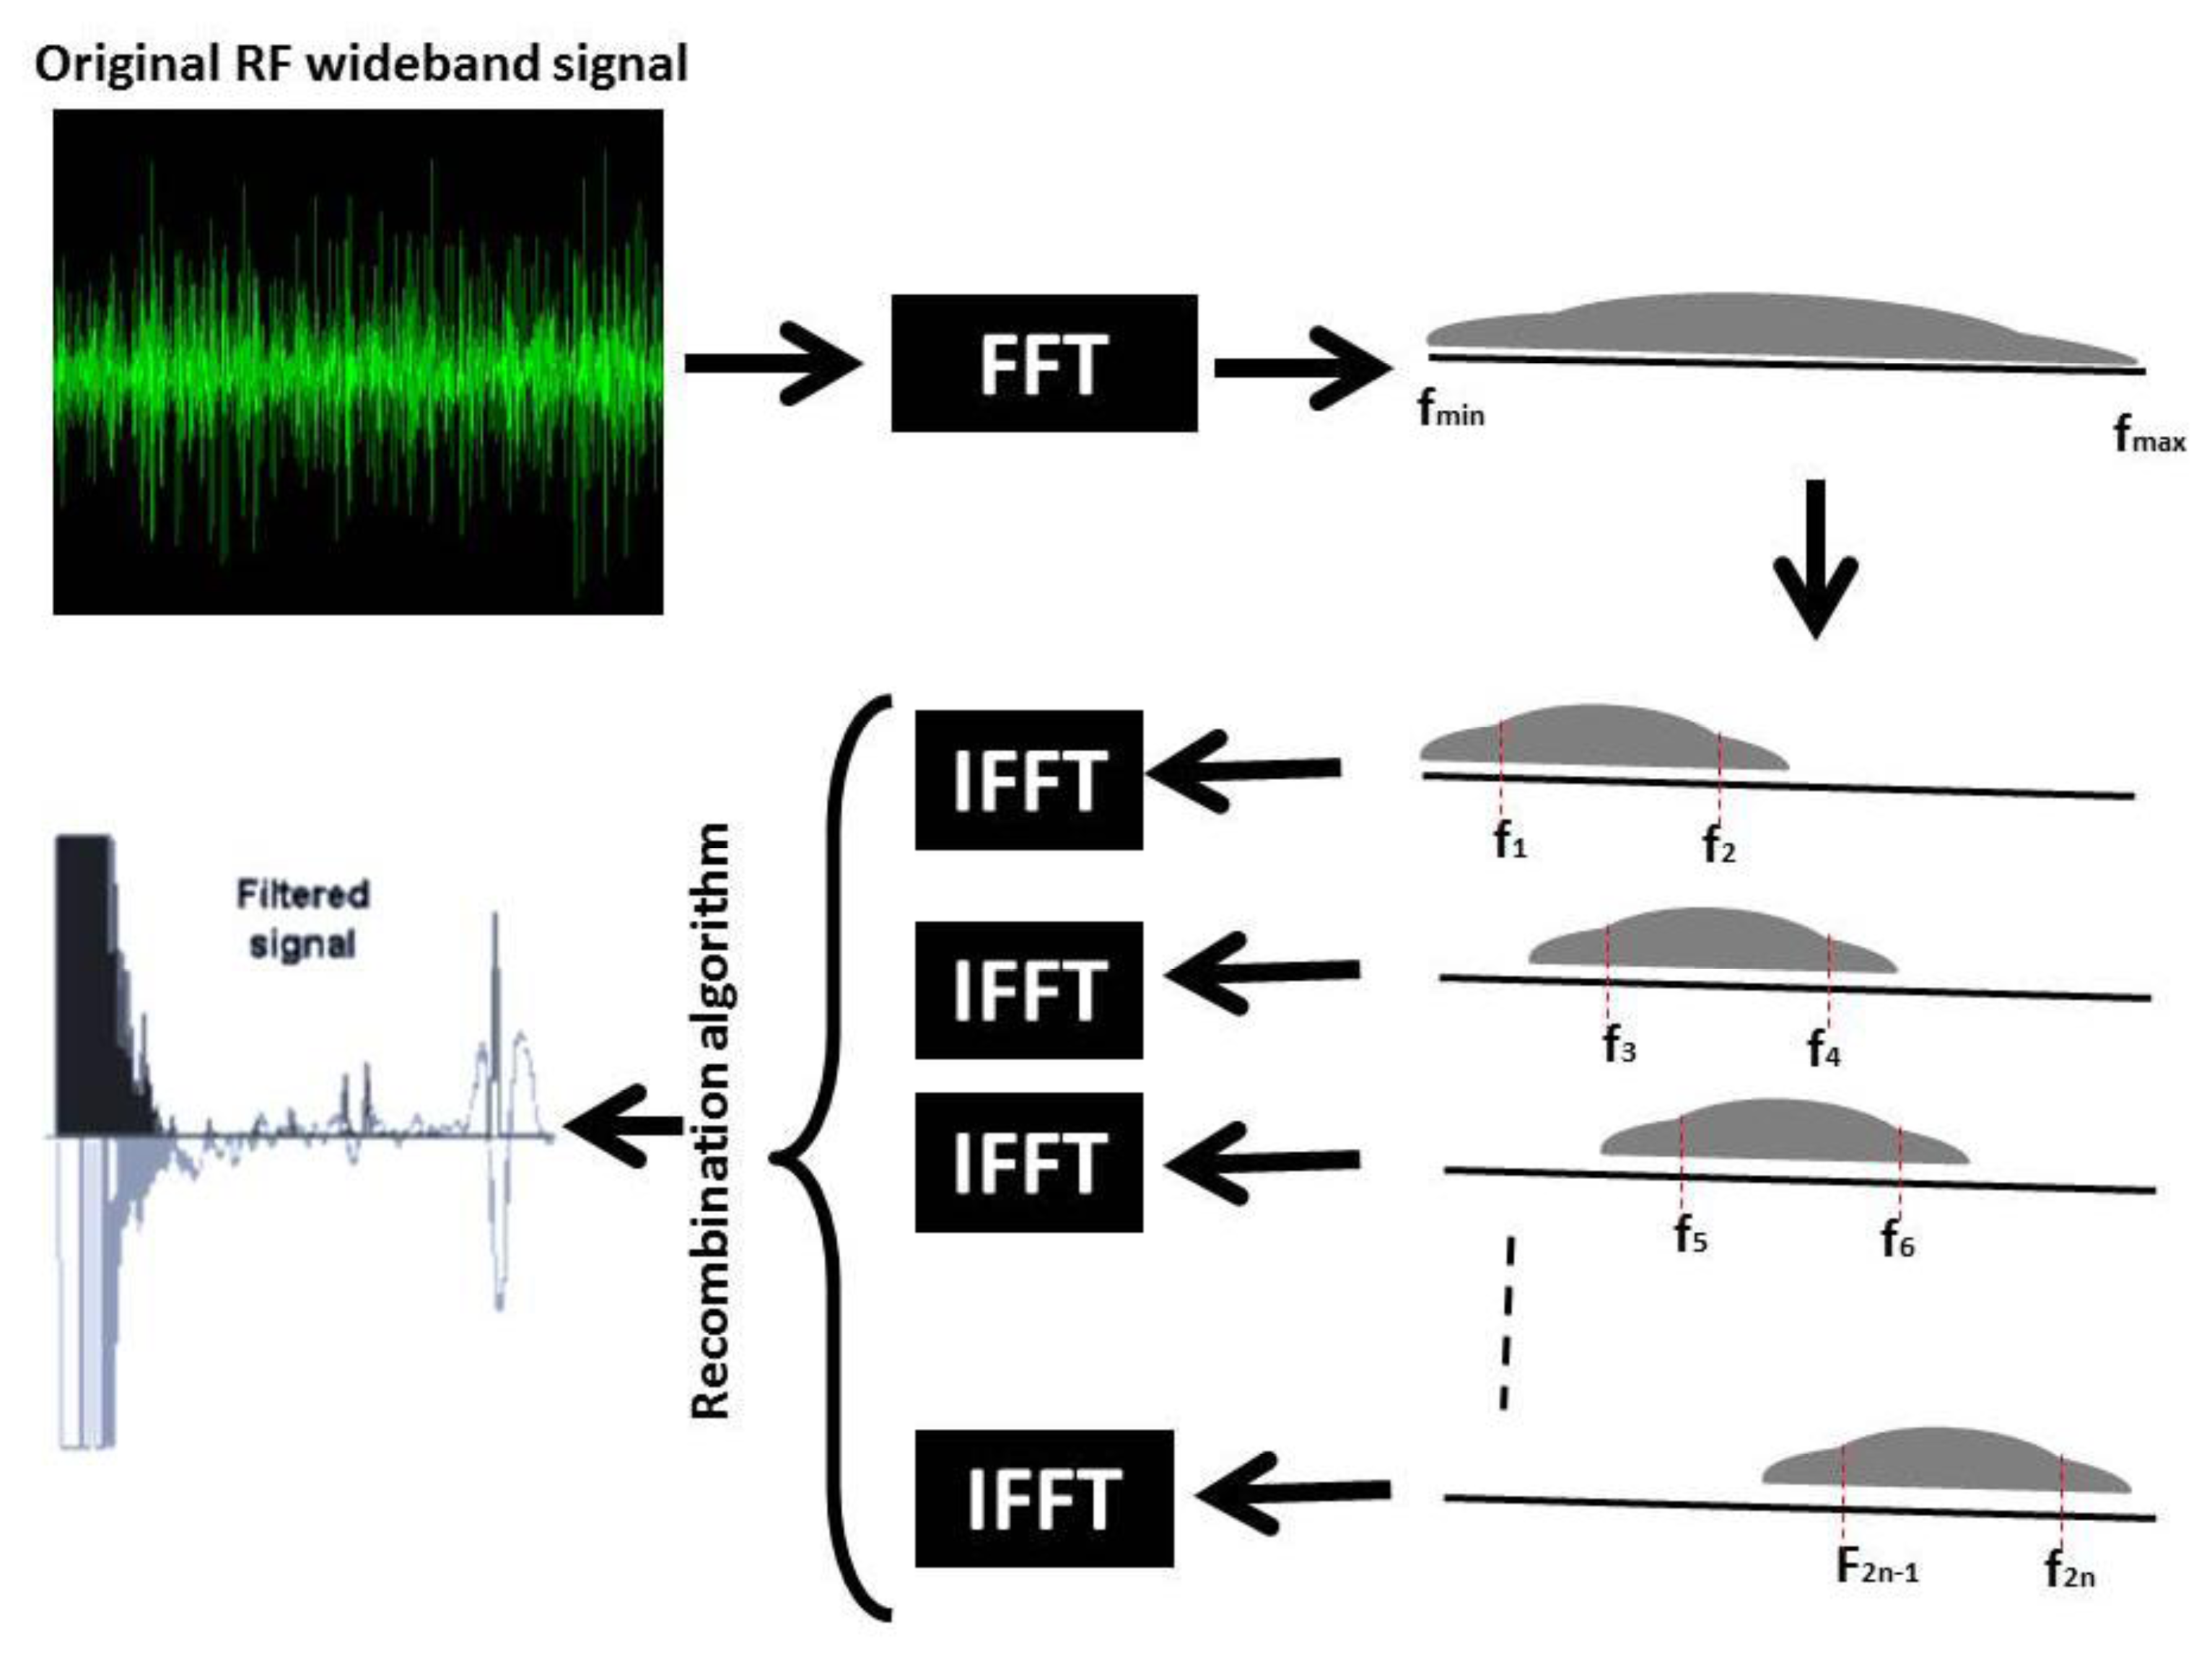
The best results can be achieved by utilizing a broad signal for the excitation of a probe, since it can be easily decomposed into various frequency bands [
35,
36]. SSP’s general algorithm can be optimized further by performing a filtration in the domain of frequency, which results in a flow diagram such as the one shown in
Figure 3 for the SSP.
3. Case Study
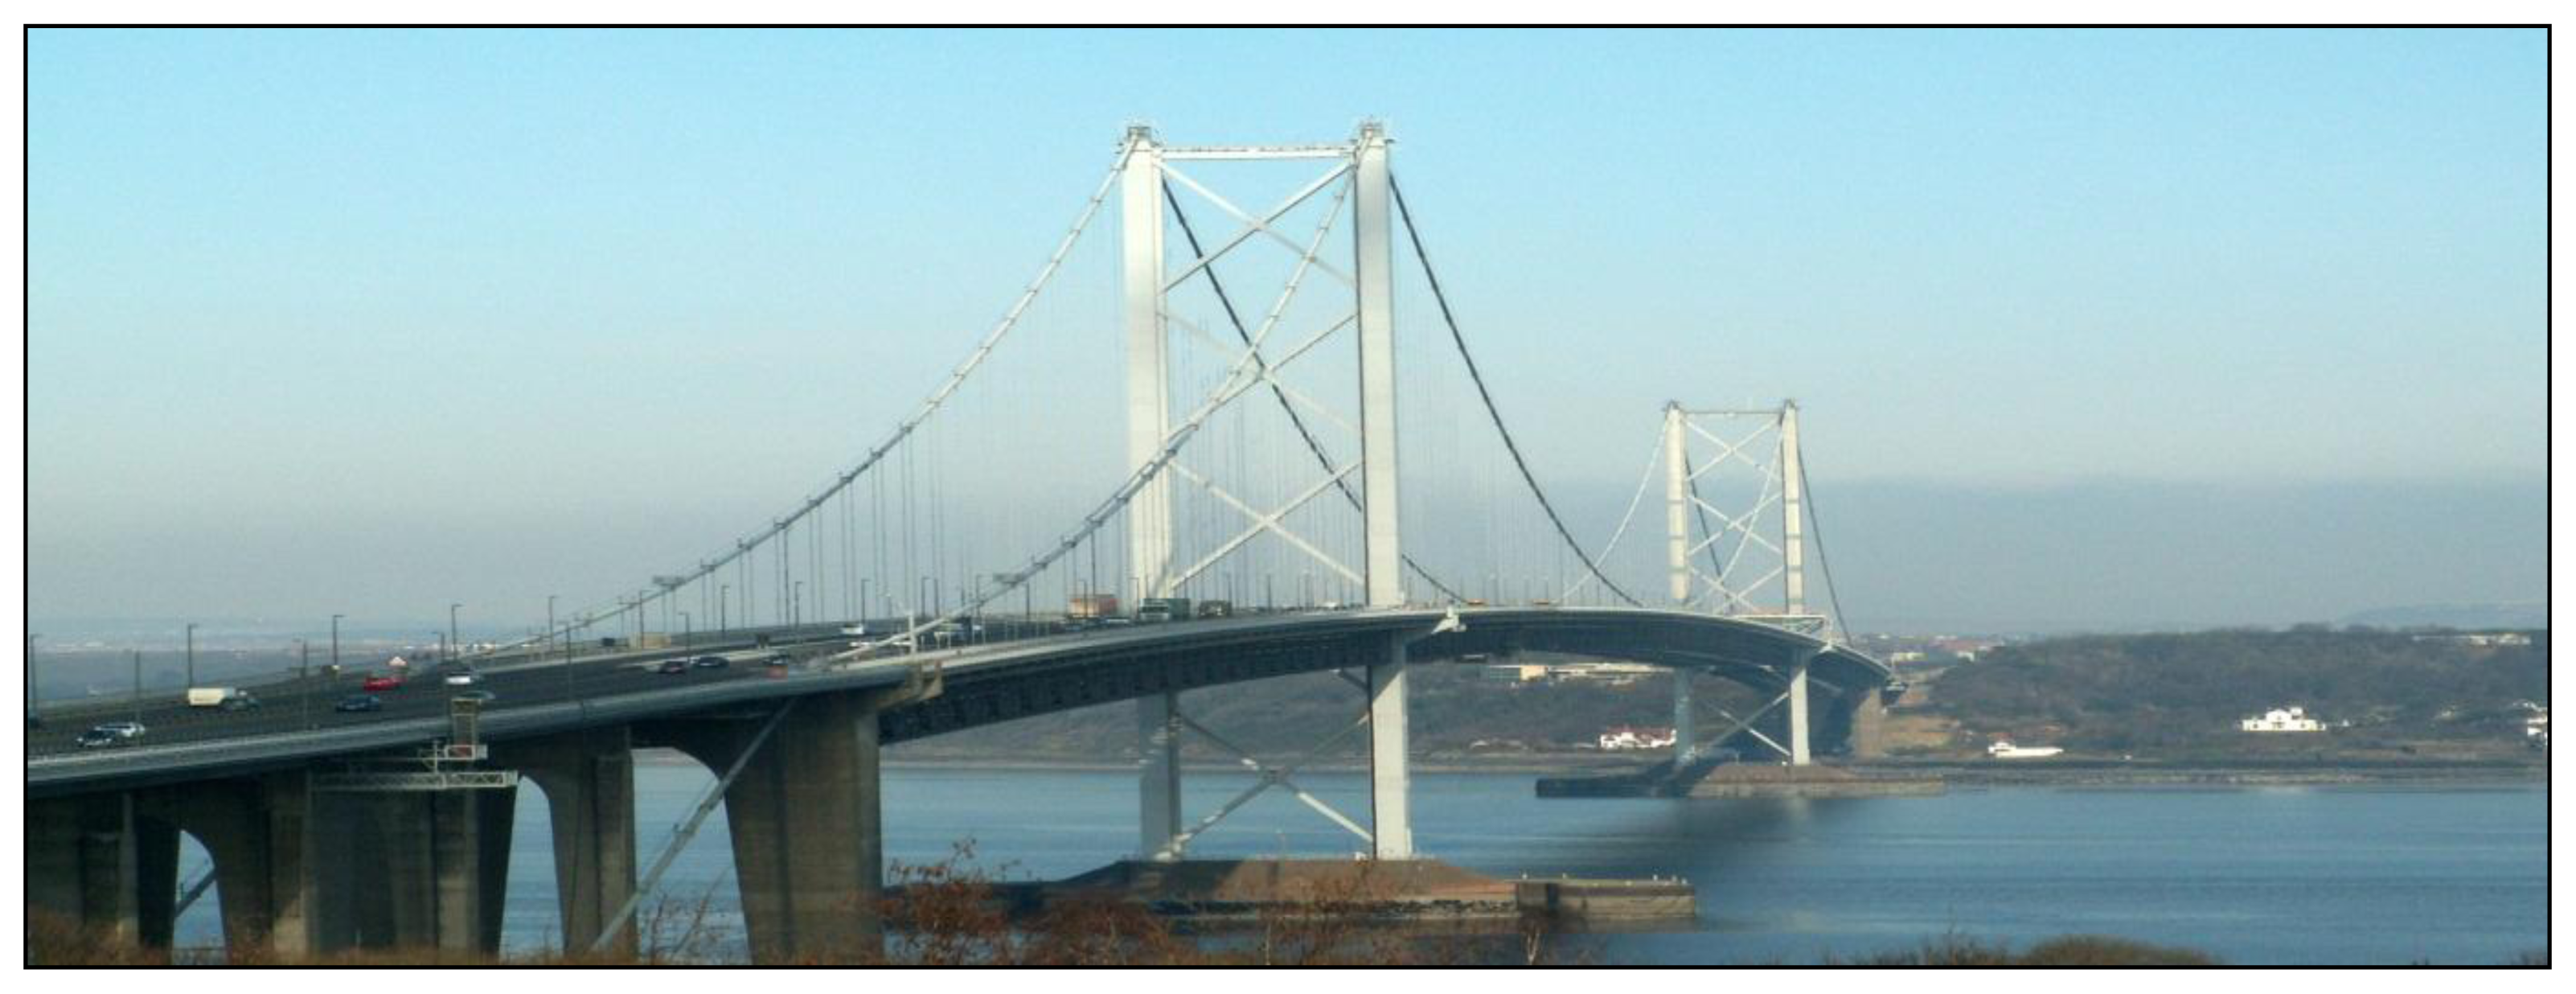
GPR surveys were carried out on Forth Road Bridge and the results were examined in order to obtain a realistic picture of both the health of the bridge and the state of key features, such as rebar condition and location, delamination, moisture, beams, thickness of layers, map drainage and other buried utilities.
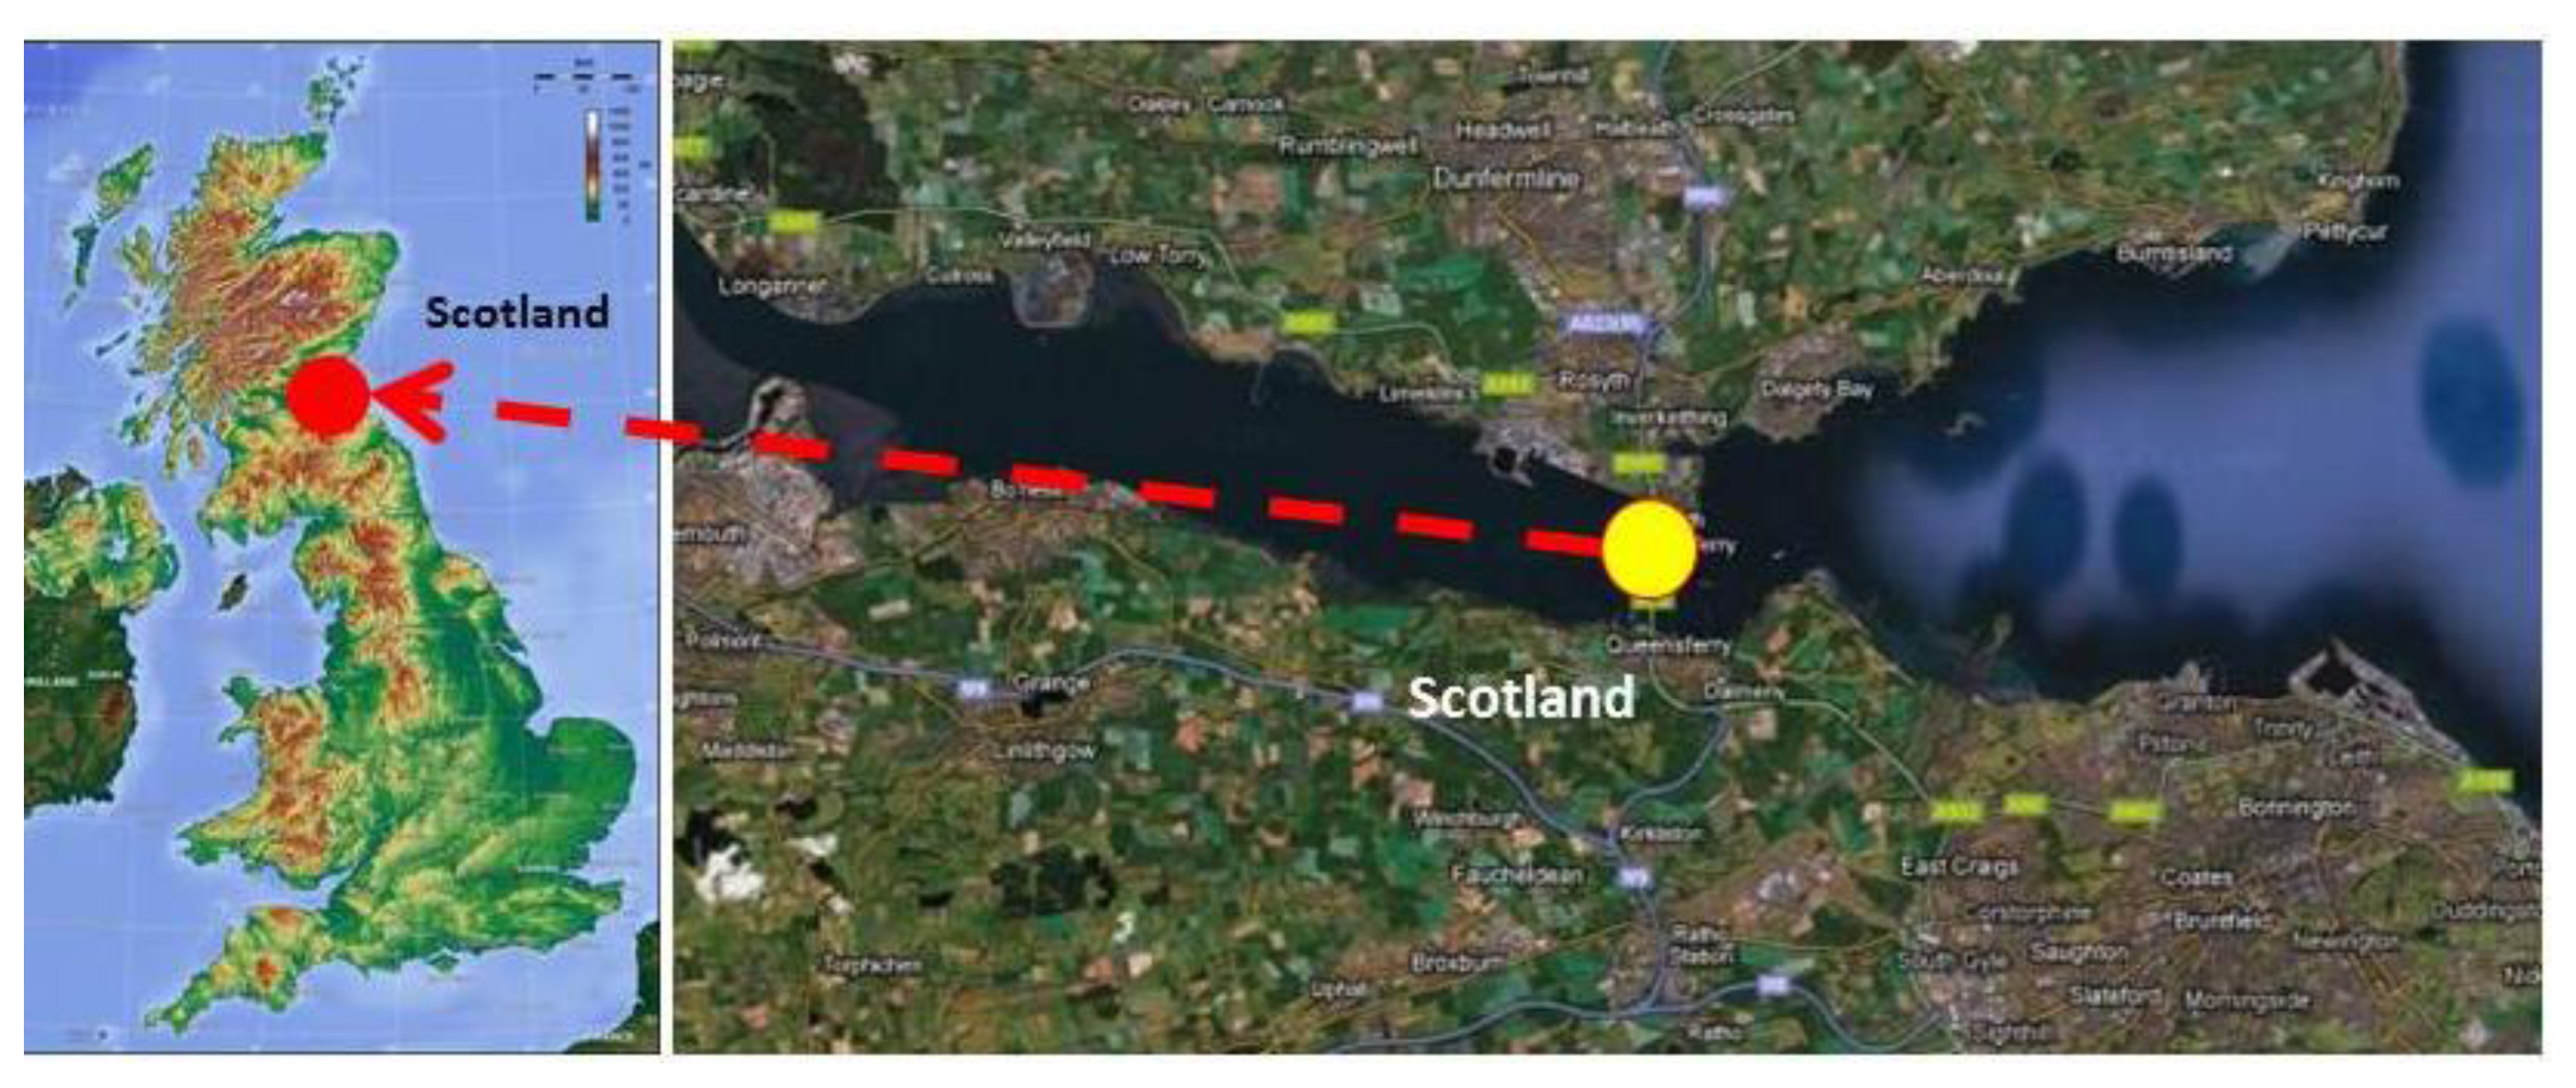
The Forth Road Bridge (
Figure 4) is located in Eastern Scotland (
Figure 5), providing access to the capital city, Edinburgh, from North Queensferry [
37].
The Forth Road Bridge, a suspension bridge, opened in 1964. Traffic on the bridge has increased substantially since that time, from an initial 4 million vehicles a year to the current level of 24 million. The main span of Forth Road Bridge is 1006 m asphalt cover, the two side spans are 408 m, the total length between abutments is 2517 m, and the tower height is 156 m [
37–
40].
4. The GPR Survey and Equipment
GPR survey requires that a grid is marked with chalk on the ground so that the radar may be slowly moved in straight lines along both the transversal and longitudinal axes of the grid. The referencing of the grid’s location is a key element in accurately mapping the area to be surveyed, and is accomplished by recording the coordinates of various fixed locations. In this particular case, it was decided to divide the bridge into small areas to be surveyed separately, rather than survey the whole bridge simultaneously.
The GPR survey was performed using the IDS (RIS Hi BriT 2 GHz) and IDS (RISMF HI-MOD 200–600 MHz) GPR antennas. The GPR data was processed and interpreted by the author.
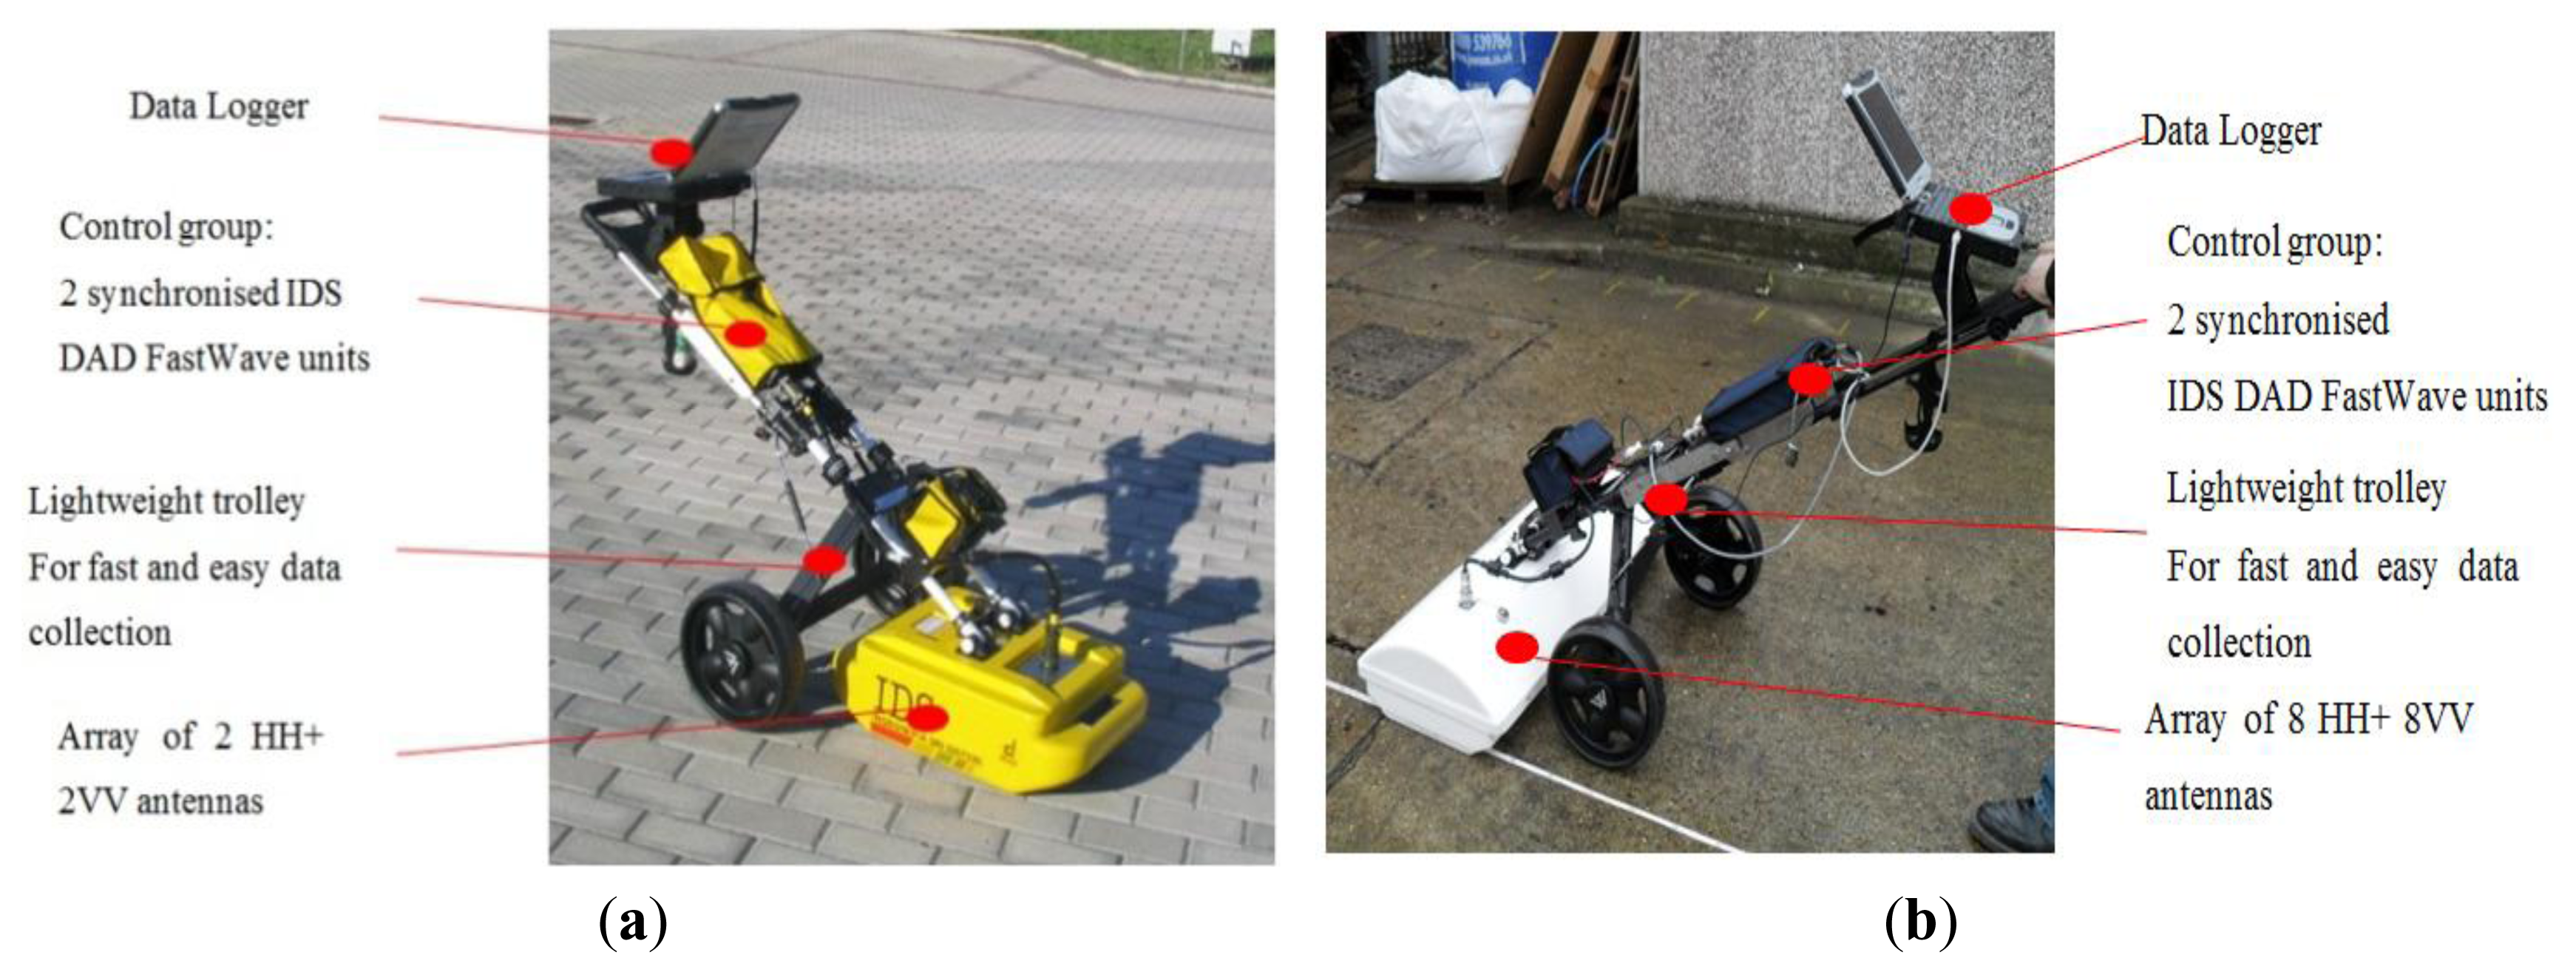
Although the quality of the data gathered by the low frequency RISMF HI-MOD (200–600 MHz) GPR antenna (
Figure 6a) is not of high quality [
37], it does produce deep and densely sampled data. It consists of an array of horizontally polarized 200 MHz and 600 MHz channels, is powered via a 24A 12V battery and sits on a trolley which is designed to be easily controllable and lightweight. K2 Fast-wave software runs on a standard ruggedized laptop, and controls the acquisition of data.
The high frequency RIS Hi BriT (High resolution Bridge Tomography) (2 GHz) antenna (
Figure 6b) has been explicitly created for use on bridge decks with high quality results [
37]. The antenna produces lower penetrating depth and densely sampled data, enabling higher quality tomography and 3D images, and therefore the potential for more accurate data interpretation. With the assistance of advanced software processing, it is possible to gather information relating to, for example, shallow utilities and drainage, layer thickness, rebar location, the presence of moisture, delamination and the condition of materials within structures.
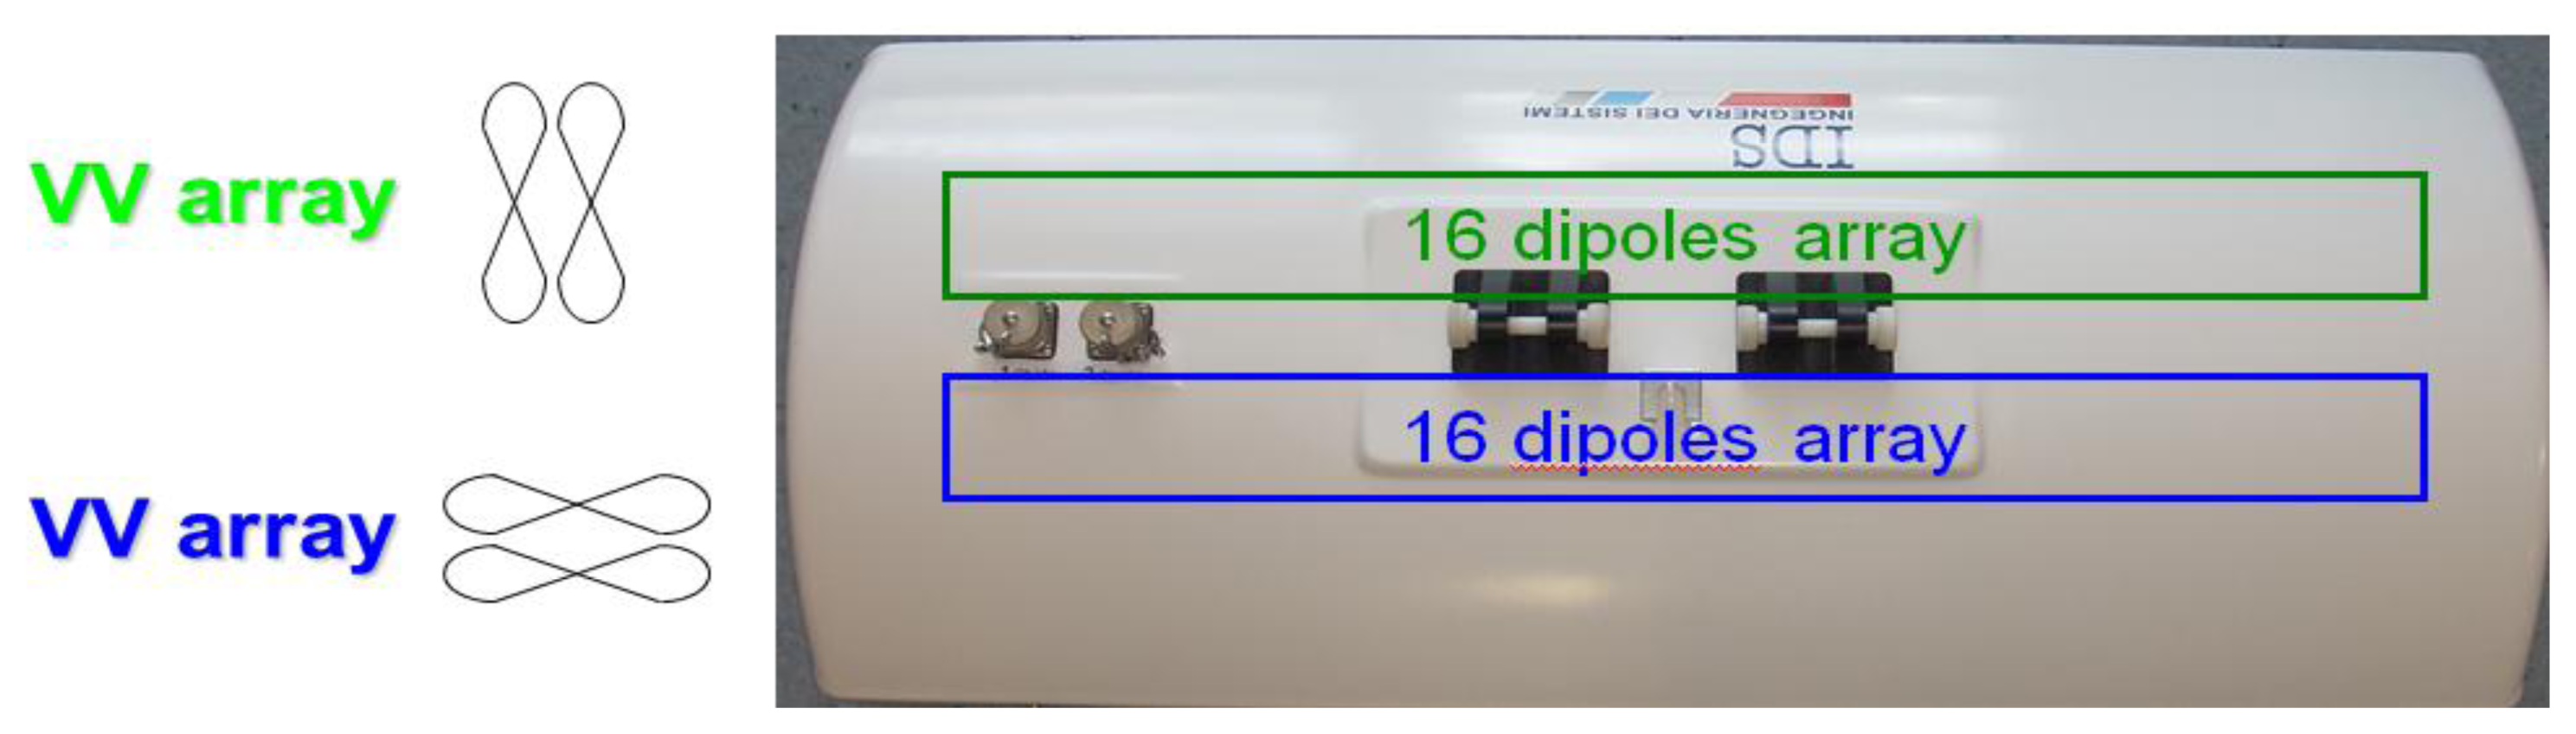
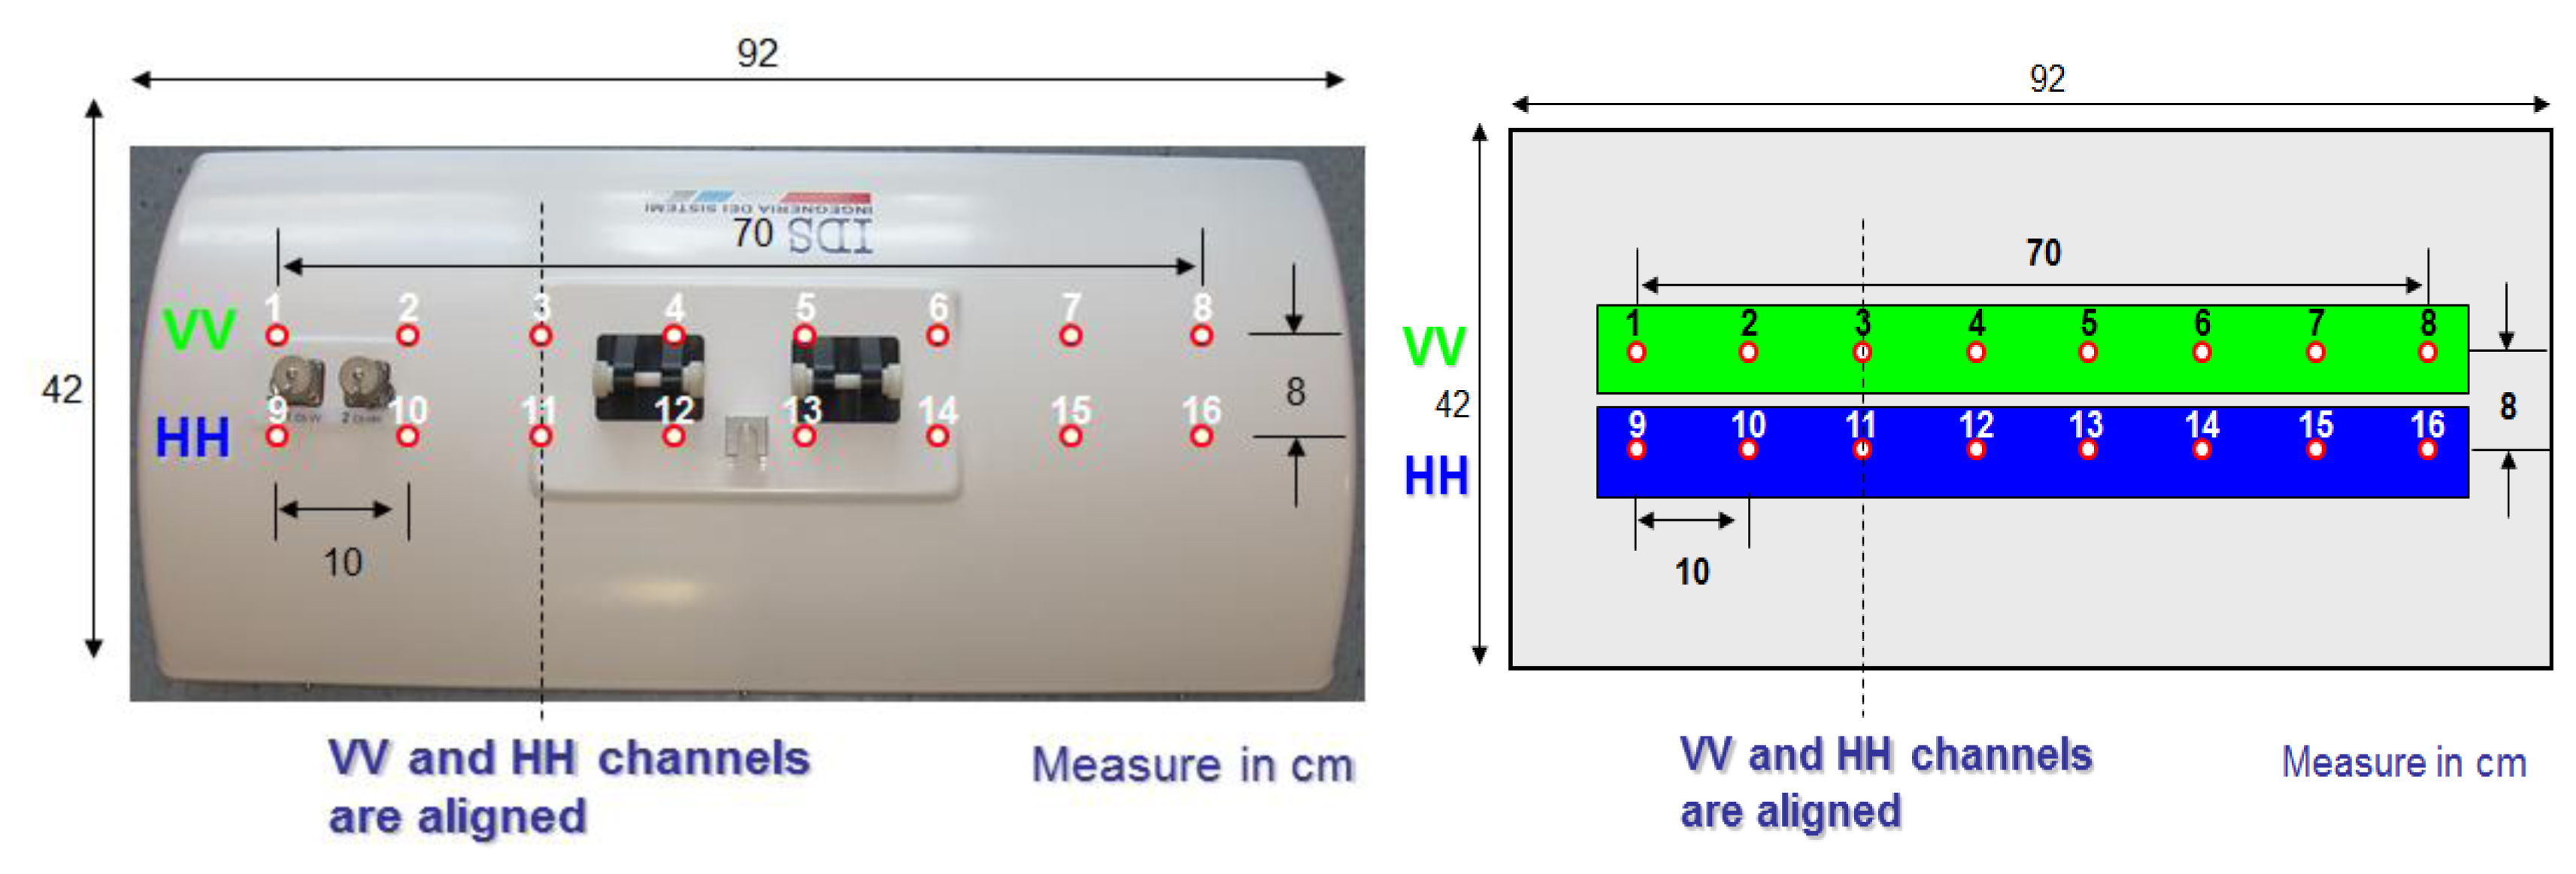
Figures 7 and
8 show the the Hi BriT (2 GHz) antenna array layout which has 16 channels with two closed 2 GHz arrays of 16 dipoles each one. Eight couples are laid out in VV polarization (dipole parallel to forward direction), and the other eight couples are in HH polarization (dipoles orthogonal to forward direction) [
37,
41].
In this study, IDS GRED data analysis software was used to produce 2D tomography for underground layers, and a 3D view of the surveyed volume. The results of such analyses are greatly improved by the system’s ability to merge and clarify the same tomographic map datasets collected along both the longitudinal and transversal scans.
5. Results and Data Processing
5.1. Order Statistic Filters and SSP
Order statistic filter is a renamed technique using probability theory to analyze order statistics of random samples from a continuous distribution, and has been widely used in the field of signal and image processing [
32,
33]. The main idea behind an order statistic filter is to find the
mth(1,2,3. …, n), largest element in an input signal. Different values for
m result in various members of order statistic filters [
32,
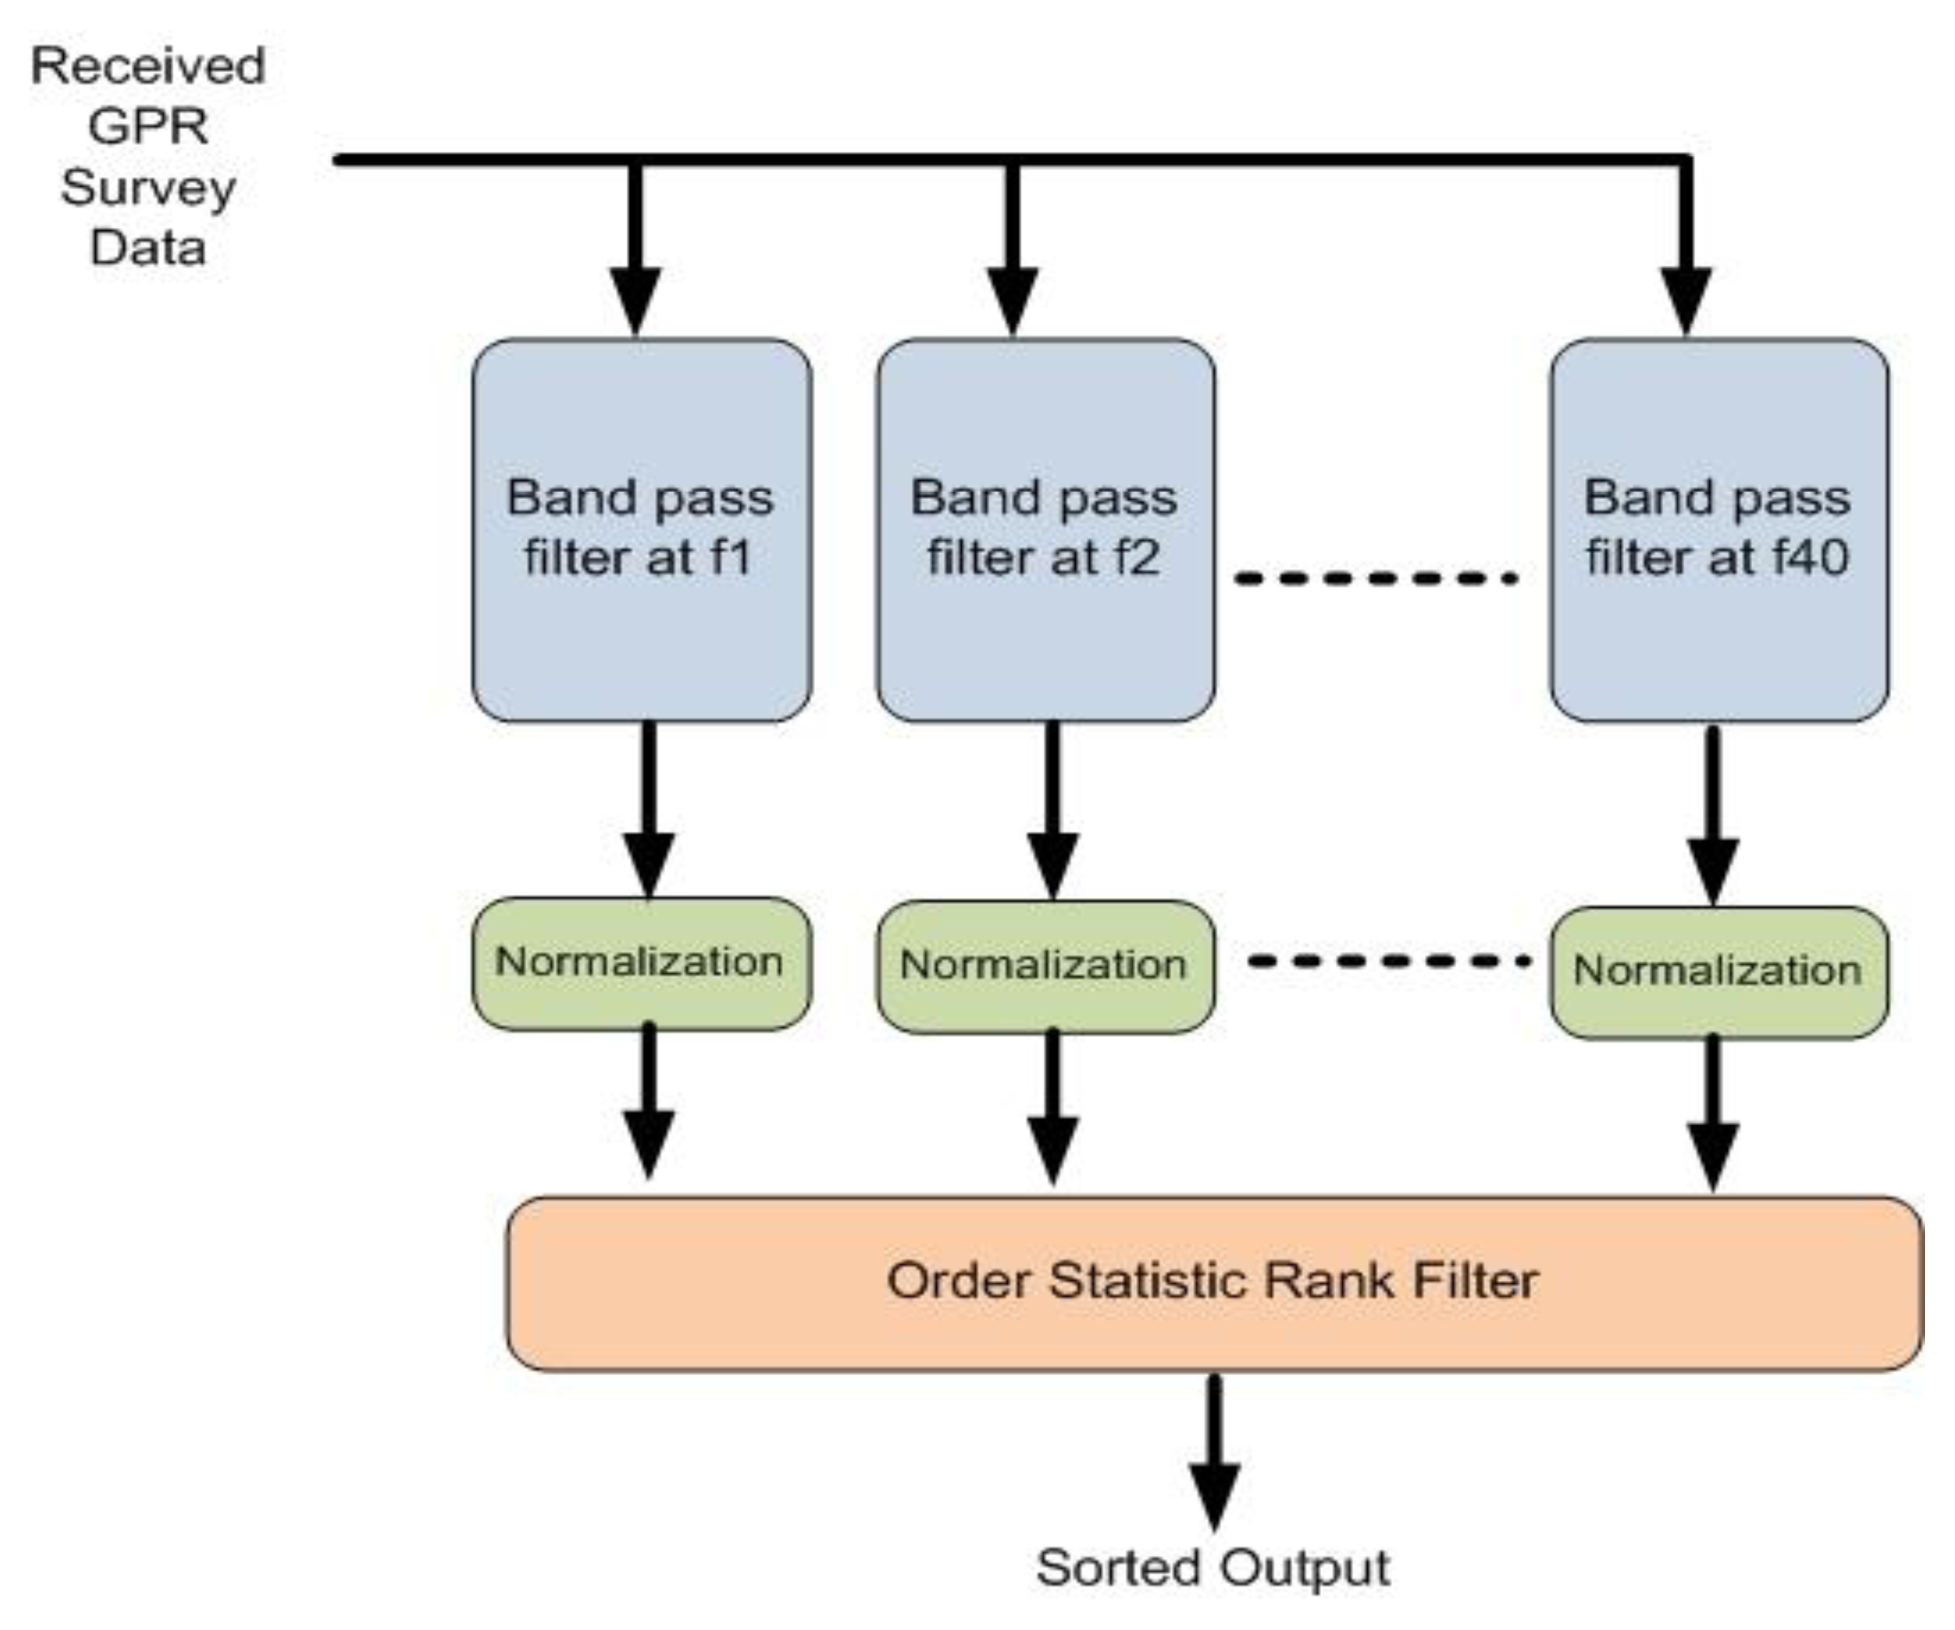
33]. Some of the members, such as minimum, median and maximum filters, have been used extensively in signal and image processing. Applying split-spectrum processing (SSP) in GPR survey data combined with order statistic filters improves the signal-to-noise ratio of backscattered signals. The performance of order statistic filters is better where signal and noise have good statistical separation, representing a particular rank, such as minimum, median or maximum. The block diagram of split-spectrum processing is shown in
Figure 9. The received GPR survey data is partitioned in several narrow-band channels, as shown in
Figure 9.
The output of these channels is normalized at the end of each block, referred to as band-pass filters and sent to an order statistic filter. The output data was normalized between 0 and 1. There are three important issues in split-spectrum processing: the number of partitions (how many band-pass filters are used); the correlation amongst partitions; and the statistical information in each partition. There is an upper limit on the number of partitions that can be chosen when there is not a great deal of overlap amongst the partitions. Reducing the size of the frequency band of each channel can simply reduce the correlation between partitions. This might also reduce the recovery of backscattered echoes.
Correlation is not as critical to the performance of the split-spectrum processing as selecting the frequency range which contains the information of moisture, yet this knowledge is not generally known
a priori. The total number of band-pass filters was chosen as 40. GPR survey data shows how an order statistic filter can utilize the statistical information that is buried in different frequency bands to improve the signal-to-noise ratio in noisy environments. The results from the 2 GHz antenna testing are shown in
Figure 10.
As stated earlier, 40 band-pass filters are used in the SSP. In
Figure 9, the frequencies of the channels reside within the frequency range of 0.1–2 GHz and the bandwidth of the channels is 47.5 MHz. It is not easy to determine the frequency because of the moisture from the row data (
Figure 10a). The x-axis is the distance, the y-axis represents the travel time of EM wave. The application of the split-spectrum processing with minimum rank order statistic filter shows that moisture exists between the 500 and 1700-m level (
Figure 10b). The distortion due to the moisture ingress in the radargram is also observed in the output of distance b-scan (
Figure 10c).
5.2. Moisture Detection
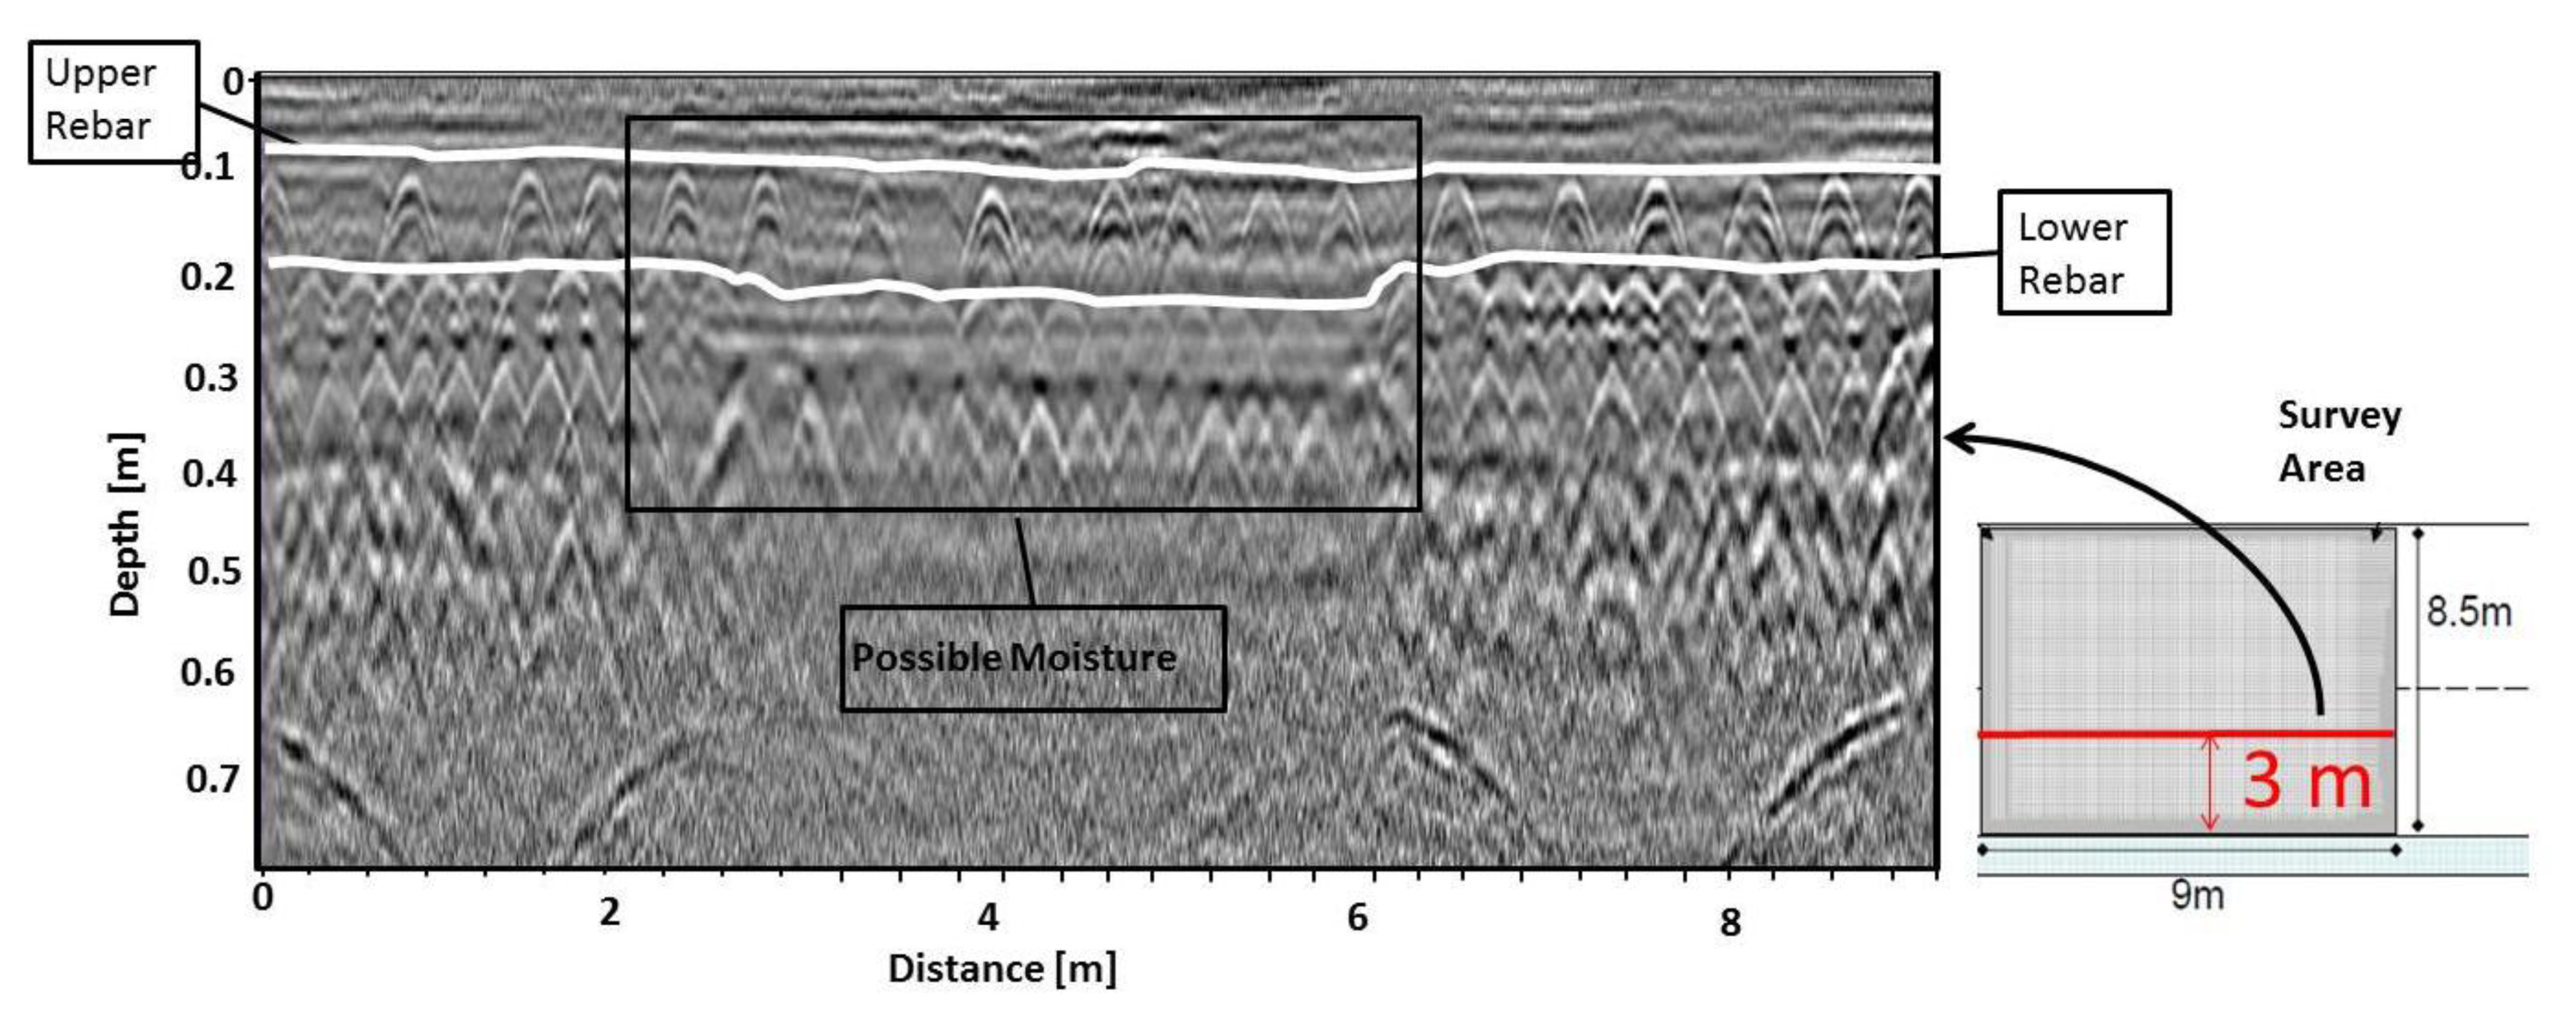
The correlation suggested possible subsidence in the bridge deck, but later, partial removal revealed no evidence of subsidence, instead indicating that the possible higher signal attenuation resulted from moisture ingress below the upper rebar layer of the bridge deck. It can be seen from the below radargram (slice from 3 m above the survey area) that the deteriorated section directly correlates to the higher signal attenuation apparent in
Figure 11.
Using the processed and interpreted data (
Figure 12) from the GPR survey, b-scans of the bridge’s vertical cross-sections were obtained. By combining these b-scans, it is possible to produce horizontal sections of the area surveyed, as seen in
Figure 12, which displays the expansion of the moisture-affected area at lower depths. As well as data related to moisture, it is also possible to determine the following information from the radargram:
The location and spacing of the two separate layers of rebar: the top layer of rebar in both directions and the deeper layer of rebar in one direction only.
The area of moisture penetration close to the surface.
The larger area of moisture penetration underneath the surface damage.
The processed data was examined (at approximately 20 cm depth) and it was clear that the concrete is in good condition, as represented by lighter contrast. The rebar can be clearly seen as illustrated in
Figure 12. The area of moisture is also identified by a patch of reduced contrast and the size of this deteriorated area is highlighted by the indicator in
Figure 12d.
One of the most important findings from the radargram on this selected area was the indication of an area of moisture at 20 cm depth. To verify this, breaking out the concrete was recommended. When the bridge authority carried out the excavation, damaged concrete and corroded rebars were found (
Figure 13a).
Figure 13b shows the new rebars used as replacements.
Visual assessments of the results from remedial works carried out by the bridge authority for the Forth Road Bridge confirm both the location and spacing of two separate layers of rebar, i.e., the top layer of rebar in both directions and the area of moisture penetration close to the surface.
6. Discussion
GPR was chosen as a technique for further analysis as it is widely used in the bridge health monitoring industry as a means to identify hidden defects within a structure. It can also be used to discover the position of hidden features such as buried pipes and rebars, which usually requires highly disruptive and destructive tests to unearth. There are a number of bridges in existence which have no detailed structural information. This causes problems during the installation of pipes and utilities as it is crucial not to damage structural supports. However, if the position of these features are unknown, this becomes a difficult task. As has been seen in previous literature, GPR has been used to identify the position of these supports [
8,
42]. This paper illustrates, however, that the presence of moisture has a negative impact on the ability of GPR to accurately map the support.
Split-spectrum processing with order statistics filtering was also employed in the GPR data to find the moisture ingress. In addition, there is a good statistical separation between GPR signal and noise representing minimum, maximum or median rank. Applying split-spectrum processing in GPR combined with order statistic filters improves the signal-to-noise ratio of backscattered signals. The results suggest that the split-spectrum processing is an effective method for identifying the moisture ingress in GPR data.
In terms of defect detection, moisture was discovered in Forth Road Bridge, as indicated by a high intensity on the GPR radargram. Due to the density of channels in the RIS Hi BriT (2 GHz) antenna, it is possible to recover large quantities of information during a radar acquisition. This gives a high level of confidence in the data acquired, as well as enabling radargrams of exceptional quality to be produced, which aids data interpretation. It also allows more advanced processing techniques to be performed, such as the mathematical calculation of the areas with higher than average attenuation (absorption of the radar signal), enabling the production of a 2D map of the moisture levels within the bridge.
Before the damaged concrete was removed from the area of moisture, it was noted that the rebars had undergone excessive deformation, as indicated by
Figure 13a. However, this was found not to be the case as, when the remedial work was undertaken, the rebars were seen to have undergone corrosion, but were still at a horizontal level (
Figure 13b). Misinterpretation of radagrams as indication of the depth of reinforcement was attributed to the high levels of moisture present, as saturated media can attenuate the electromagnetic waves, distorting the radargram hyperbola. This discovery increases confidence in the assertion above that moisture reduces the accuracy of the GPR mapping of rebars. Different antennas were also utilized in order to examine the effects that moisture has on various wavelengths, and provide guidance for future bridge health monitoring [
2,
19,
43–
49].
Two different antenna systems were used on Forth Road Bridge (RIS Hi BriT (2 GHz) and RISMF HI-MOD (200–600 MHz) GPR antennas). It was found that the higher frequency antenna alone was successful in mapping moisture. It should therefore be recommended that, in cases where the structural composition of the bridge is unknown, a higher frequency antenna will enable the higher resolution of the bridge deck. It can thus be concluded that both antennae be used in conjunction to ensure that all areas of possible moisture are detected.
The results listed above are important findings, as GPR is often used to detect buried supports and utilities on bridges but, if inaccurate locations are indicated, it can prove costly in terms of both construction and manpower. Further research should into the degree to which moisture distorts the radargram hyperbole should thus be undertaken, so that counteractive actions can be taken to limit its effect.
7. Conclusions
The main aim of this paper was to identify the detrimental effects of moisture on GPR results. The radargrams for Forth Road Bridge indicated that the upper rebars had undergone deformation. However when excavation was undertaken, this was found not to be the case. This apparent deformation was in fact shown to be attributed to moisture by GPR and the role of moisture was confirmed by destructive testing. This moisture caused the electromagnetic waves to attenuate, causing a distortion in the radargram. The split-spectrum processing with order statistic filters was tested for moisture ingress detection. Based on experimental observations, the order statistic filters can be efficiently used in split-spectrum processing in order to detect moisture ingress in GPR data.
Different frequency antennas were used to analyze Forth Road Bridge, confirming the findings of previous research, i.e., that the higher frequency gives more detailed results, and the lower frequency gives a greater penetrative depth, but at the cost of losing detail. However, the RIS Hi BriT (High Resolution Bridge Tomography) (2 GHz) antenna, specifically designed for bridge health monitoring, was shown to be the most effective antenna, thus confirming its suitability for other bridge health monitoring surveys. However, it is important to note that care should be taken when using this antenna to identify lower lying supports, as it has a lesser penetrative depth than a lower frequency antenna.
This paper highlights a significant problem which engineers may encounter when dealing with GPR results. Thus, caution is urged when analyzing results, because of the dangers of moisture distorting the position of features.
