Article

Multi-Sensor Calibration Studies of AVHRR-Heritage Channel Radiances Using the Simultaneous Nadir Observation Approach

by
Karl-Göran Karlsson
* and
Erik Johansson
Swedish Meteorological and Hydrological Institute, Folkborgsvägen 17, Norrköping SE-601 76, Sweden
*
Author to whom correspondence should be addressed.
Remote Sens. 2014, 6(3), 1845-1862; https://doi.org/10.3390/rs6031845
Submission received: 26 December 2013 / Revised: 5 February 2014 / Accepted: 9 February 2014 / Published: 27 February 2014

Abstract

:
The European Space Agency project for studies of cloud properties in the Climate Change Initiative programme (ESA-CLOUD-CCI) aims at compiling the longest possible time series of cloud products from one single multispectral sensor—The five-channel Advanced Very High Resolution Radiometer (AVHRR) instrument. A particular aspect here is to include corresponding products based on other existing (Moderate Resolution Imaging Spectroradiometer (MODIS), Advanced Along-Track Scanning Radiometer (AATSR), MEdium Resolution Imaging Spectrometer (MERIS), Visible and Infrared Radiometer Suite (VIIRS)) and future Sea and Land Surface Temperature Radiometer (SLSTR) sensors measuring in similar (AVHRR-heritage) spectral channels. Initial inter-comparisons of the involved AVHRR-heritage channel radiances over a short demonstration period (2007–2009) were performed. Using Aqua-MODIS as reference, AVHRR (NOAA-18), AATSR, and MERIS channel radiances were evaluated using the simultaneous nadir (SNO) approach. Results show generally agreeing radiances within approximately 3% for channels at 0.6 μm and 0.8 μm. Larger deviations (+5%) were found for the corresponding AATSR channel at 0.6 μm. Excessive deviations but with opposite sign were also indicated for AATSR 1.6 μm and MERIS 0.8 μm radiances. Observed differences may largely be attributed to residual temporal and spatial matching differences while excessive AATSR and MERIS deviations are likely partly attributed to incomplete compensation for spectrally varying surface and atmospheric conditions. However, very good agreement was found for all infrared channels among all the studied sensors. Here, deviations were generally less than 0.2% for the measured brightness temperatures with the exception of some remaining non-linear deviations at extreme low and high temperatures.

1. Introduction

The task of creating climatologies of different atmospheric and surface parameters from satellite measurements has, thus far, been limited by the fact that most satellite sensors have not been available over a sufficiently long time to be able to provide climatologically significant data records. In this context, it is generally required that a time series of observations should have a length of at least 30 years. However, there are indeed sensors or sensor families that recently have exceeded this age. One such sensor is the Advanced Very High Resolution Radiometer (AVHRR, [1]) and there are already several AVHRR-based Climate Data Records (CDRs) available [24]. However, a threat against the future prolongation of this observation series for continued use for climate monitoring is the fact that the last AVHRR sensor is soon to be launched on the European Organisation for the Exploitation of Meteorological Satellites EUMETSAT satellite Metop-3 (with tentative launch year 2018). Consequently, for enabling an extension of the time series beyond these scheduled approximately four decades of AVHRR observations, mitigation actions for mimicking or simulating the AVHRR observation from future multispectral sensors have to be made.
The European Space Agency (ESA) has initiated several projects aiming at exploring the use of ESA’s and other satellite agency sensors for climate change studies. The program is denoted Climate Change Initiative (CCI) and is running over the time period 2010–2016 [5]. One of its projects is focused on cloud studies and it is denoted ESA-CLOUD-CCI. The project aims at adapting and developing state-of-the-art cloud retrieval schemes [6] to be applied to the longest available time series of cloud observations available from polar orbiting satellites with AVHRR or AVHRR-like sensors. In addition, the project also intends to prepare for the extension of the time series by developing methods that could be applied to AVHRR-heritage channels on future sensors beyond the true AVHRR era. Such instruments are for example the Visible and Infrared Radiometer Suite (VIIRS, [7]) and the Sentinel-3 Sea and Land Surface Temperature Radiometer [8].
An essential part of any climatological study trying to make use of multi-sensor data over long periods is to ensure that datasets are homogeneous and consistent. Thus, existing sensor differences (natural or artificial) have to be monitored, documented and corrected for. Thus, in the ESA-CLOUD-CCI context of applying the same retrieval methods to AVHRR data, as well as to data from AVHRR-heritage channels of other sensors, it is important to account for existing differences between the sensors.
This paper describes the initial work in ESA-CLOUD-CCI concerning the attempts to evaluate the differences between AVHRR radiances and radiances from a set of sensors all having AVHRR-like channels, namely the Moderate Resolution Imaging Spectroradiometer (MODIS), the Advanced Along-Track Scanning Radiometer (AATSR), and the MEdium Resolution Imaging Spectrometer (MERIS). The two latter instruments are instruments on board the ESA ENVISAT platform. Section 2 describes the method for inter-comparison and the used demonstration dataset followed by a presentation and discussion of results in Section 3. Conclusions are presented in Section 4 together with an outlook on future activities.

2. Data and Methods

2.1. Purpose and Background

The intention of the initial radiance comparisons in the ESA-CLOUD-CCI project were mainly that they should be complementary to the numerous studies being reported previously. For example, the relation between AVHRR and MODIS radiances has already been examined in depth [9,10]. Furthermore, the radiances from the two European Space Agency Environment Satellite ENVISAT sensors were continuously monitored through comparisons with surface site reflectances and through inter-comparisons with other sensors measuring over the same locations [1113]. Special studies of the involved visible channel radiances have also been carried out within the framework of the Infrared and Visible Optical Sensors Subgroup (IVOS) of the Committee on Earth Observation Satellites (CEOS) Working Group on Calibration and Validation (WGCV, [14]). Lastly, continuous evaluation of corresponding infrared radiances is also carried out within the context of Global Space-based Intercalibration System (GSICS, [15]). Thus, the study reported here could be seen as results of a sanity check of the used radiances before applying more advanced retrieval schemes. However, in one aspect the results are different from and, thus, really complementary to previous approaches: They are based on direct inter-comparison of radiances simultaneously measured for arbitrary sites on the Earth or, more correctly, at locations enabled at the crossing of the orbital tracks of satellites by using the Simultaneous Nadir Observation (SNO) approach. This is the same approach as used previously for comparing AVHRR and MODIS radiances [9,10] but is now being applied systematically for comparing MODIS and ENVISAT sensor radiances. In addition, this study will evaluate all involved AVHRR-heritage channels and not restricted to, e.g., visible channels.

2.2. Method for Inter-Comparison of Radiances—The SNO Approach

The SNO method [16] is built upon the principle that polar orbits from different satellites will cross at regular intervals and, if this occurs within a very small time window, it is possible to compare measurements occurring more or less simultaneously. An additional advantage is that the comparison will be done at the same Earth viewing conditions (nadir view) and this means that no compensation for different viewing angles is necessary. Thus, we may directly compare differences in radiances for similar channels even if there will be some noise in the results created by remaining uncertainties in the temporal and spatial matching of observations.
In this study we have collected SNO cases for MODIS radiances (used as the reference) and corresponding radiances for AVHRR, AATSR, and MERIS sensors. This gives the following pairs of compared satellites and sensors:
  • NOAA-18 AVHRR vs. AQUA-MODIS
  • ENVISAT AATSR vs. AQUA-MODIS
  • ENVISAT MERIS vs. AQUA-MODIS.
Notice that we have chosen to use AQUA-MODIS as the reference. TERRA-MODIS has been reported to have inferior calibration quality because of some problems with the used solar diffuser [17]. Simultaneously measured radiances within 10 minutes have been compared for all six AVHRR and AVHRR-like channels centered at wavelengths 0.6, 0.9, 1.6, 3.7, 11 and 12 μm. To reduce the uncertainty caused by remaining differences in the spatial and temporal matching, pixel radiances from a target area around the SNO-point (with size 11 × 11 pixels ≈ 121 km2) were used (Figure 1).
For the solar reflectance channels the basic measurement for each pixel is the top-of-atmosphere spectral radiance L(λ) for a target with a given top-of-atmosphere bi-directional reflectance BRF. It is defined as:
L ( λ ) = BRF cos ( θ 0 ) I s ( λ ) π
where θ0 is the solar zenith angle and Is(λ) is the solar spectral irradiance at spectral channel wavelength λ. However, the most suitable quantity to study here is the normalized reflectance quota or reflectance factor Rf defined as
Rf = L ( λ ) π I s ( λ ) = BRF cos ( θ 0 )
The main advantage of using this quantity is that no knowledge of the absolute solar irradiance is needed. In addition, this quantity stays closest to the behavior of the actual measurement, i.e., a linear response to radiance, while the BRF itself may have a strong non-linear behavior (for example when trying to estimate it at very high solar zenith angles).
The corresponding quantity evaluated for infrared channels is the Planck equivalent brightness temperature Tb(λ). Although this quantity will have some non-linear behavior as opposed to the originally measured radiances, we consider it still valuable as a reference for this initial evaluation. For example, potential non-linear effects may be studied by plotting results as a function of brightness temperatures or by sub-dividing results into different temperature intervals.

2.3. The Studied Dataset

A three-year (2007–2009) demonstration dataset of global cloud products from the ESA-CLOUD-CCI project was produced in the project’s first development phase. Thus, calibration studies focused on data valid for the same period.
Calibrated radiances for the four involved sensors were defined according to the latest available standards as listed in Table 1.

3. Results and Discussion

3.1. Resulting AQUA-MODIS Match-Ups for NOAA AVHRR and ENVISAT Sensors

Figures 2 and 3 show the geographical distribution of the resulting match-ups over the studied period 2007–2009. In total, 6209 match-ups were theoretically available for AQUA/NOAA-18 and 6240 match-ups for AQUA/ENVISAT. The different patterns for the two cases are explained by the fact that the NOAA-18 satellite is practically located in the same orbital plane as the AQUA satellite (“afternoon orbit”) while ENVISAT orbits in an approximately perpendicular orbital plane (“morning orbit”). The latter orbit allows only crossing orbital tracks (i.e., SNO observations) at high latitudes (close to 72°N and 72°S) with the AQUA satellite. We repeat that the SNO observation is in this case defined as an observation of the same point on Earth within 10 minutes.

3.2. Results for AVHRR-Heritage Channel at 0.6 μm (Channel 1 Visible—VIS)

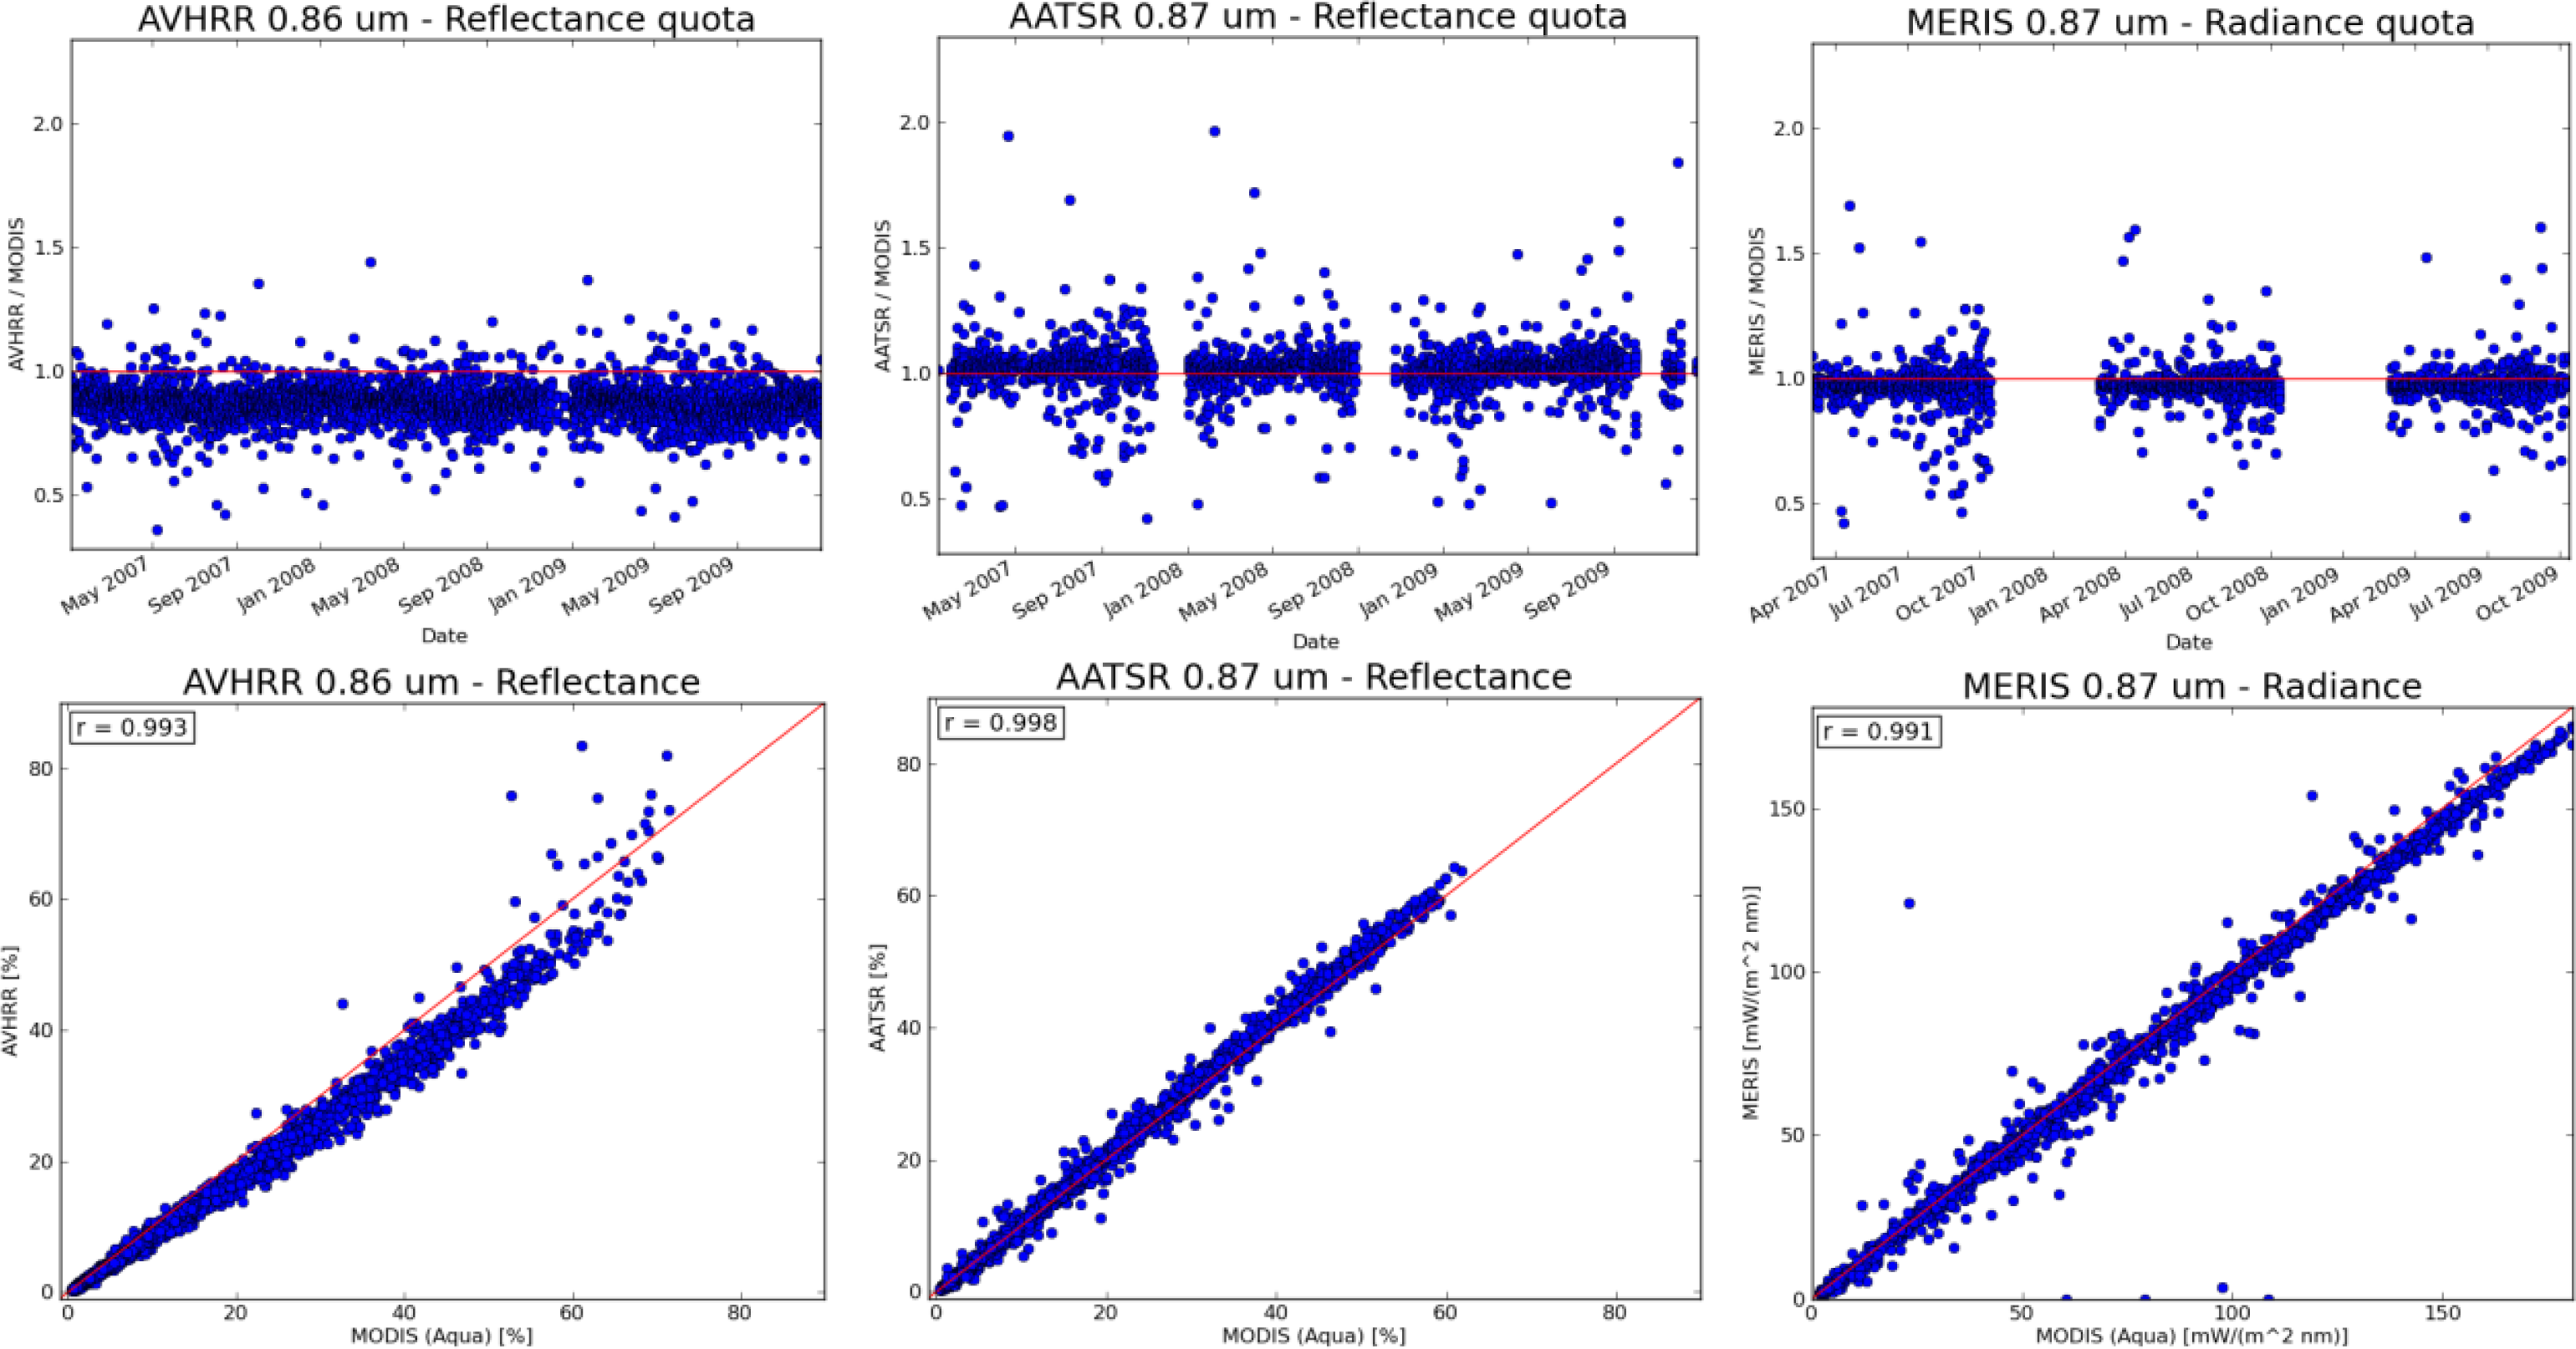
Figure 4 shows the inter-comparison of normalized reflectance factors for the AVHRR and AATSR sensors AVHRR against corresponding MODIS reflectance factors. For MERIS, we compare, in 
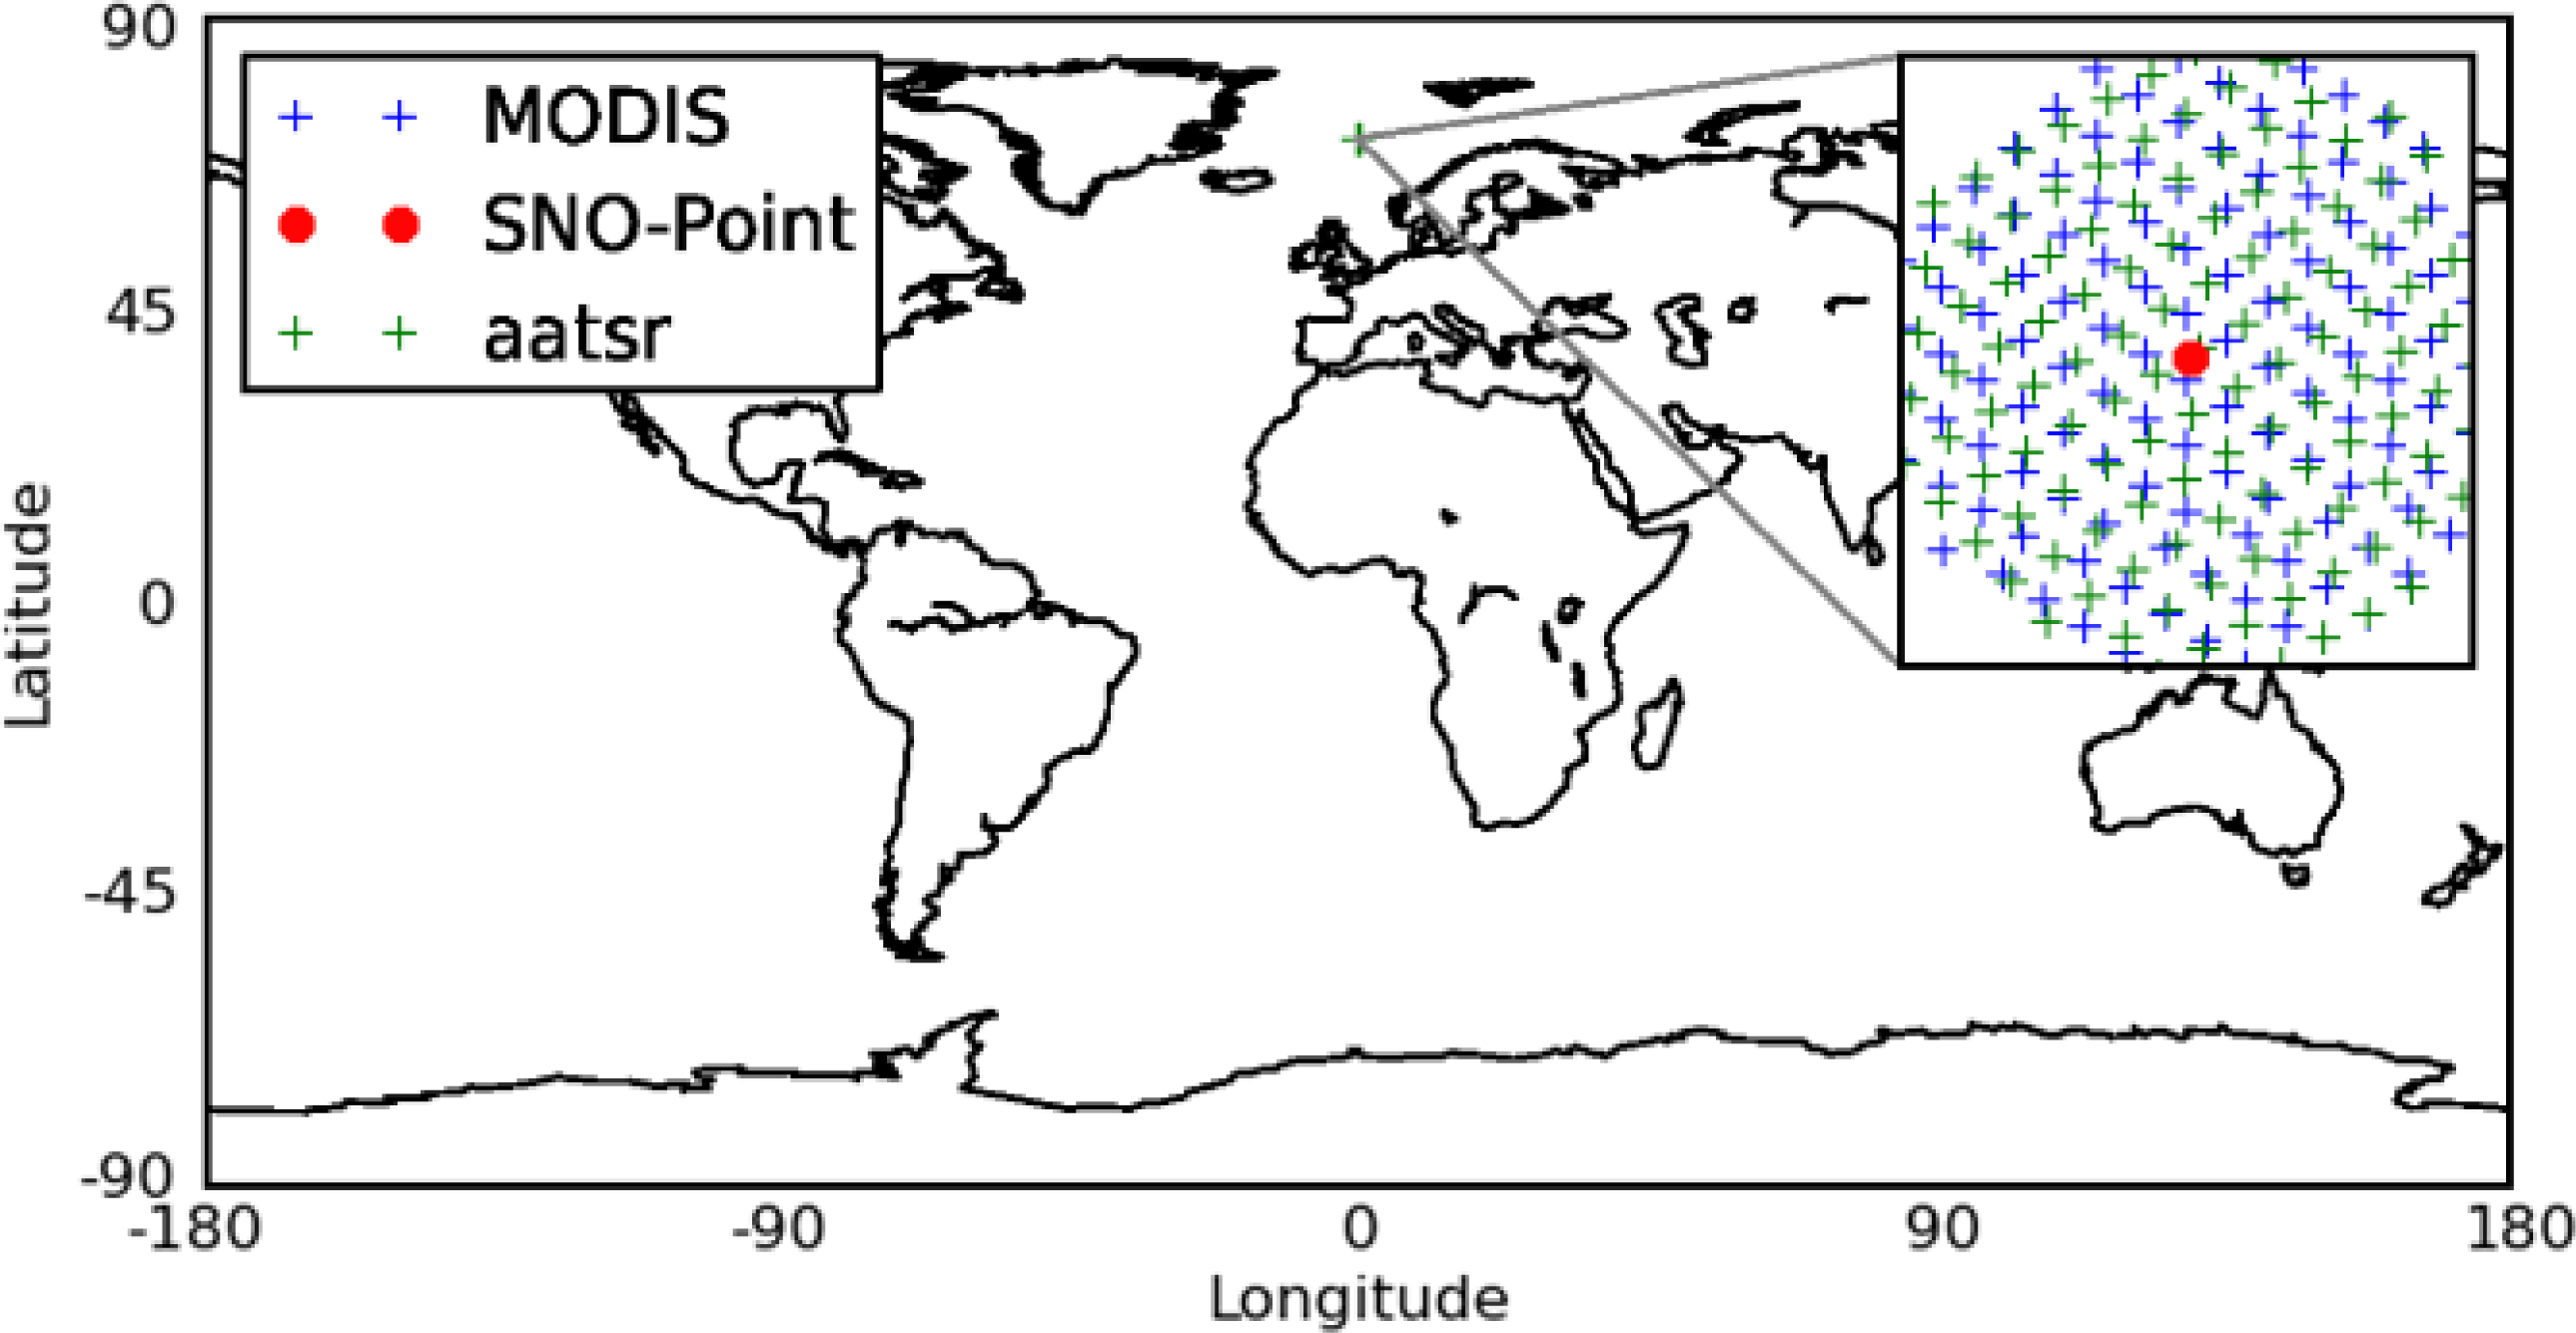
Figure 4, with original radiances as the conversion into reflectances are not straight-forward (MERIS is a Spectroradiometer with different pixel characteristics along the conical scan) and was found to introduce additional uncertainties in the results. It is clear that conditions for inter-comparisons are quite different for the sensors being in the same orbital plane as MODIS-AQUA (AVHRR) compared to those being in a perpendicular orbital plane (AATSR, MERIS). For the latter, we largely miss results from MERIS during the Southern Hemisphere summer (showing large data gaps). Data was for this study only available from the descending overpasses facing the direction of the Sun. As the SNO point in the Southern Hemisphere occurs only in the ascending ENVISAT overpasses we were left exclusively with match-ups in the Northern Hemisphere. For AATSR, data for ascending ENVISAT overpasses was available (explaining better data coverage) but, also, here we experienced some data gaps for the Southern Hemisphere summer because of frequent occurrence of too high solar zenith angles for those SNOs (being excluded by initial quality control procedures). Thus, results for AATSR and MERIS visible channels are predominantly based on the SNO points in the Northern Hemisphere whereas for infrared channels all SNO points are used.
Reflectances generally agree well, i.e., results are organized closely along the diagonal in the scatter plots. However, it is also clear that there is a rather large spread in reflectance quota results for the time series panels resulting in low precision (high variance) and an uncertainty in the estimation of potential systematic biases or trends. As we do not want to restrict the SNO time difference criterion too much (which would reduce the number of useful targets seriously), it was considered wiser to try to restrict the number of cases with very inhomogeneous targets. In addition, cases with very low reflectance factor values should be avoided since the quota calculations will be very sensitive to small and spurious deviations. Thus, the following restrictions were applied to data:
  • Standard deviations within individual match-up targets were maximized to 1%.
  • Solar zenith angles should be less than 70°.
  • Normalized reflectances should be larger than 10% (AVHRR, AATSR).
In the MERIS case the restriction was guided by conditions valid exclusively for the matched MODIS target reflectances.
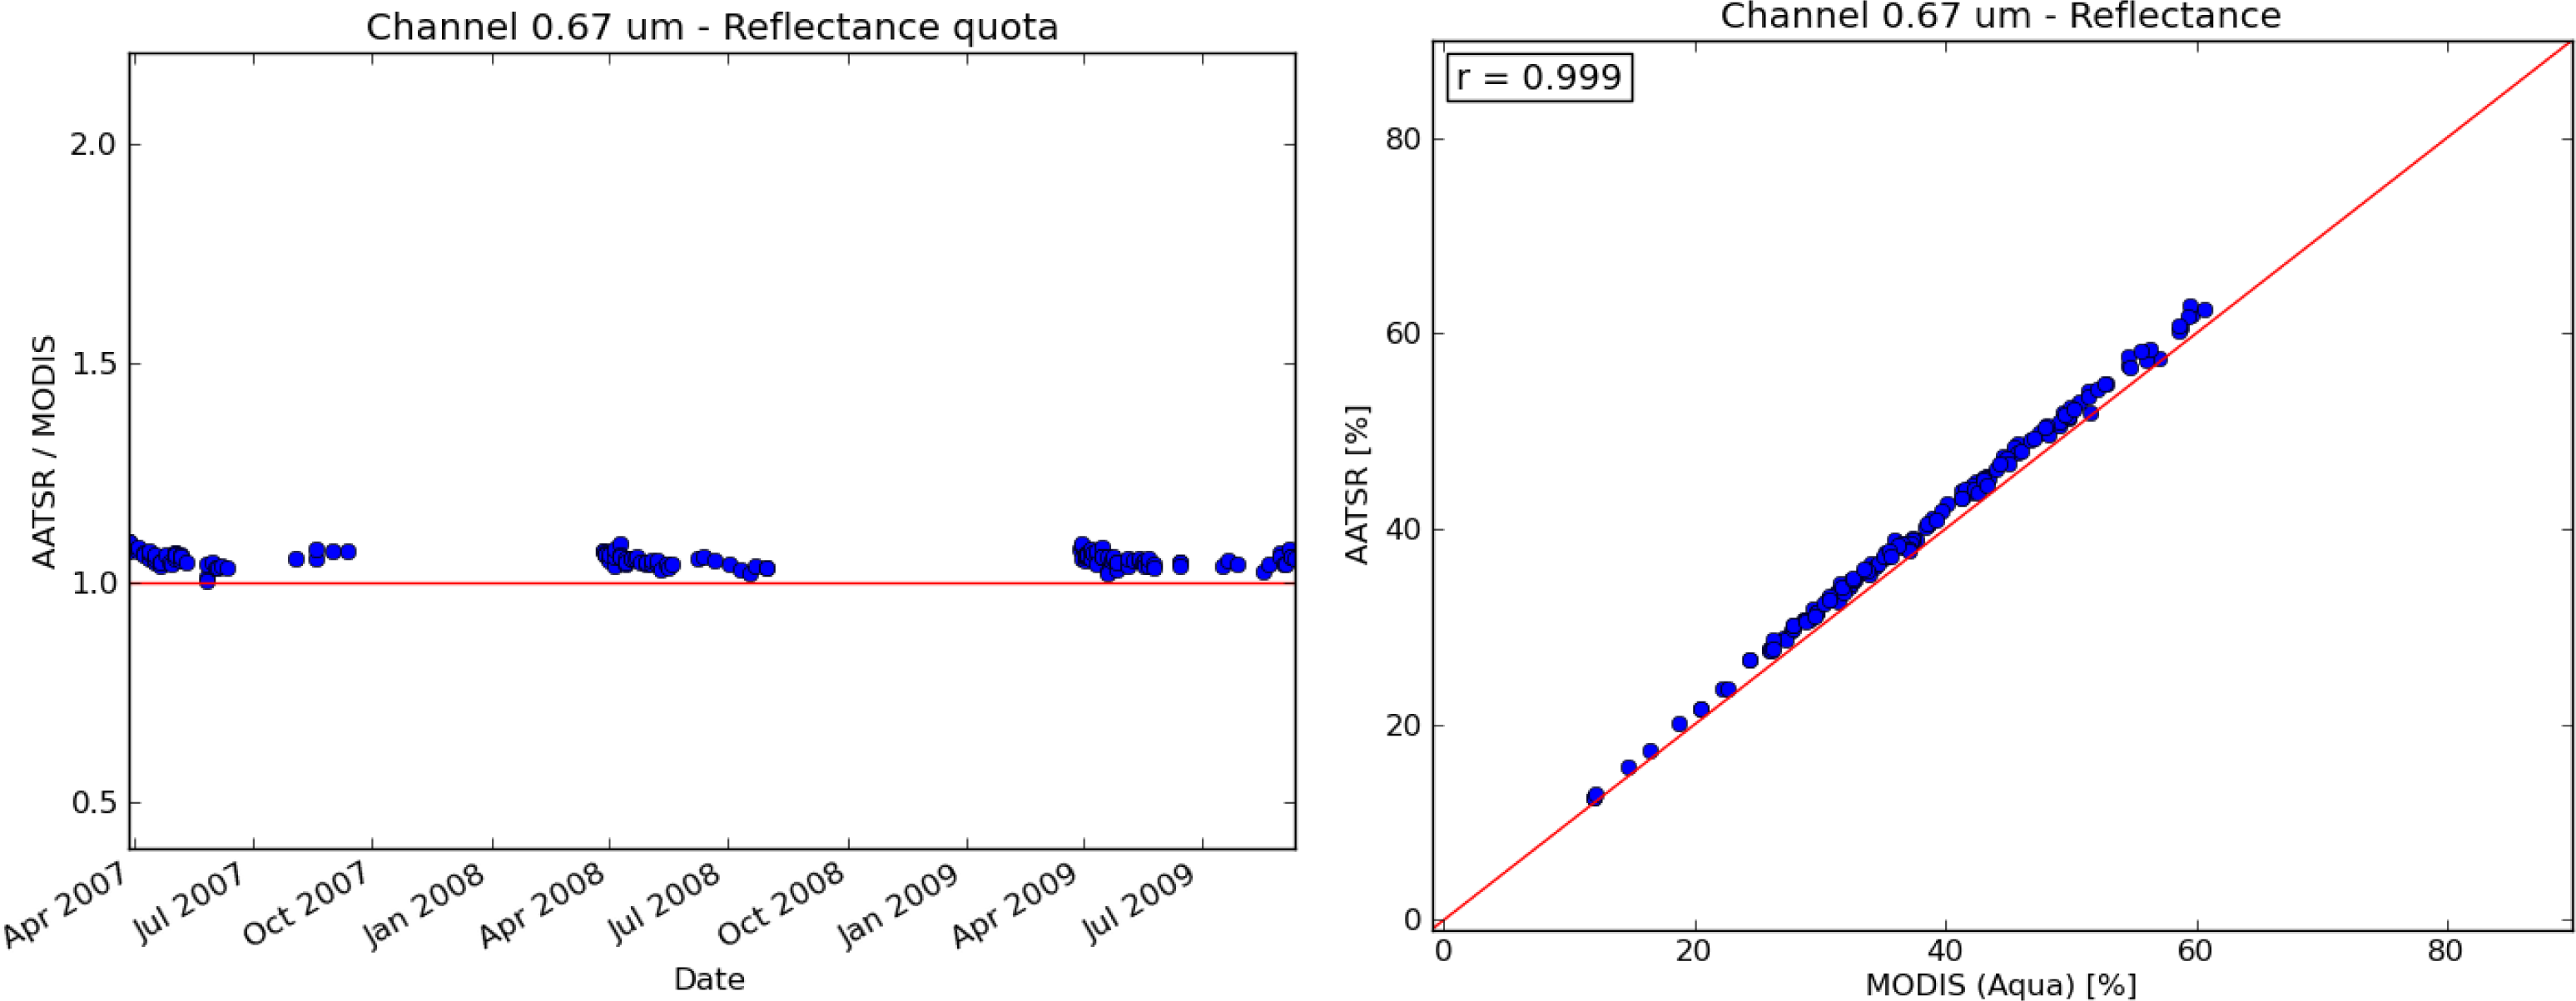
Results for AATSR after applying these restrictions are shown in Figure 5. It is clear that the systematic differences are much more evident now after screening out cases with large internal (target) variability.
Table 2 summarizes results with and without the described restrictions. A small underestimation (less than 2%) is seen for AVHRR and MERIS while AATSR shows 5% higher values. Results do not change significantly after applying restrictions which indicates a high degree of robustness.

3.3. Results for AVHRR-Heritage Channel at 0.9 μm (Channel 2 Near Infrared—NIR)

Figure 6 shows the inter-comparison of radiances for all three sensors (AVHRR, AATSR, and MERIS) against corresponding MODIS radiances.
Reasonably good agreement is found for AATSR and MERIS while larger deviations are found for AVHRR. The latter is due to the AVHRR channel 2 having a much wider spectral response function than the corresponding channels for the other sensors. Especially, the AVHRR channel includes water vapor absorption lines near 0.94 μm leading to lower reflectances except for highly reflecting and geometrically thick clouds. Table 3 summarizes again results with and without the restrictions described in Section 3.1. In addition, it also includes results after compensating for water vapor absorption effects by utilizing differentially affected MODIS channels 18 and 19 according to the method described in [10].
After applying restrictions and corrections, deviations are within 2% for all sensors except for MERIS showing a −3.5% deviation.

3.4. Results for AVHRR-Heritage Channel at 1.6 μm (Channel 3a Short-Wave Infrared—SWIR)

Figure 7 shows the inter-comparison of normalized reflectance factors for the AATSR sensor against corresponding MODIS reflectance factors. This visible channel is not carried by the MERIS sensor and it also lacks infrared channels (to be described in subsequent sub-sections). Furthermore, since the study only included comparisons to NOAA-18 AVHRR data no results can be shown for the 1.6 μm channel (being inactive on NOAA-18).
Results reveal a larger range of variation compared to the other visible channels, even after applying restrictions (see Table 4). A further discussion of these results follows in Section 3.8.

3.5. Results for AVHRR-Heritage Channel at 3.7 μm (Channel 3b Mid-Wave INFRARED—MWIR)

Figure 8 shows the inter-comparison of brightness temperatures in this channel for the AVHRR and AATSR sensors against corresponding MODIS brightness temperatures. In this comparison no sub-sampling restriction like for the visible channels has been applied. A summary of the results over all samples is displayed in Table 5.
The agreement is very good except for at very low brightness temperatures for AVHRR where lower values are found (also affecting both bias and standard deviation in Table 5).

3.6. Results for AVHRR-Heritage Channel at 11 μm (Channel 4 Long-Wave Infrared—LWIR1)

Figure 9 shows the inter-comparison of brightness temperatures in this channel for the AVHRR and AATSR sensors against corresponding MODIS brightness temperatures. A summary of the results over all samples is displayed in Table 6. The agreement is in general very good.

3.7. Results for AVHRR-Heritage Channel at 12 μm (Channel 5 Long-Wave Infrared—LWIR2)

Figure 10 shows the inter-comparison of brightness temperatures in this channel for the AVHRR and AATSR sensors against corresponding MODIS brightness temperatures. A summary of the results over all samples is displayed in Table 7. As for the 11 μm channel, the agreement is very good.

3.8. Discussion of Results for all AVHRR Heritage Channels

Overall results are summarized in Tables 8 and 10 for all studied sensors where the quota of reflectances or brightness temperatures is compared against MODIS.
For AVHRR visible (VIS) and near infrared (NIR) channels mean deviations are estimated to approximately 1.5%. A good agreement is expected since the used AVHRR calibration [10] is already linked to MODIS. Thus, the current results can merely serve as a confirmation of a correct implementation of this calibration method. Our results also basically confirms the validity of the method of compensating for water vapor absorption effects in AVHRR channel 2 (see Table 3) by use of additional MODIS channels [9]. Now assuming a correct implementation and a close agreement with MODIS reflectances, these results may give an indication of the typical deviations that might be attributed to remaining uncertainties in the spatial and temporal matching of the SNO targets. In conclusion, they should most likely not exceed 1.5%. Although not directly comparable, this agrees rather well with the random uncertainties of 1%–2% estimated in [11] and [13] when inter-comparing radiances over Earth surface sites.
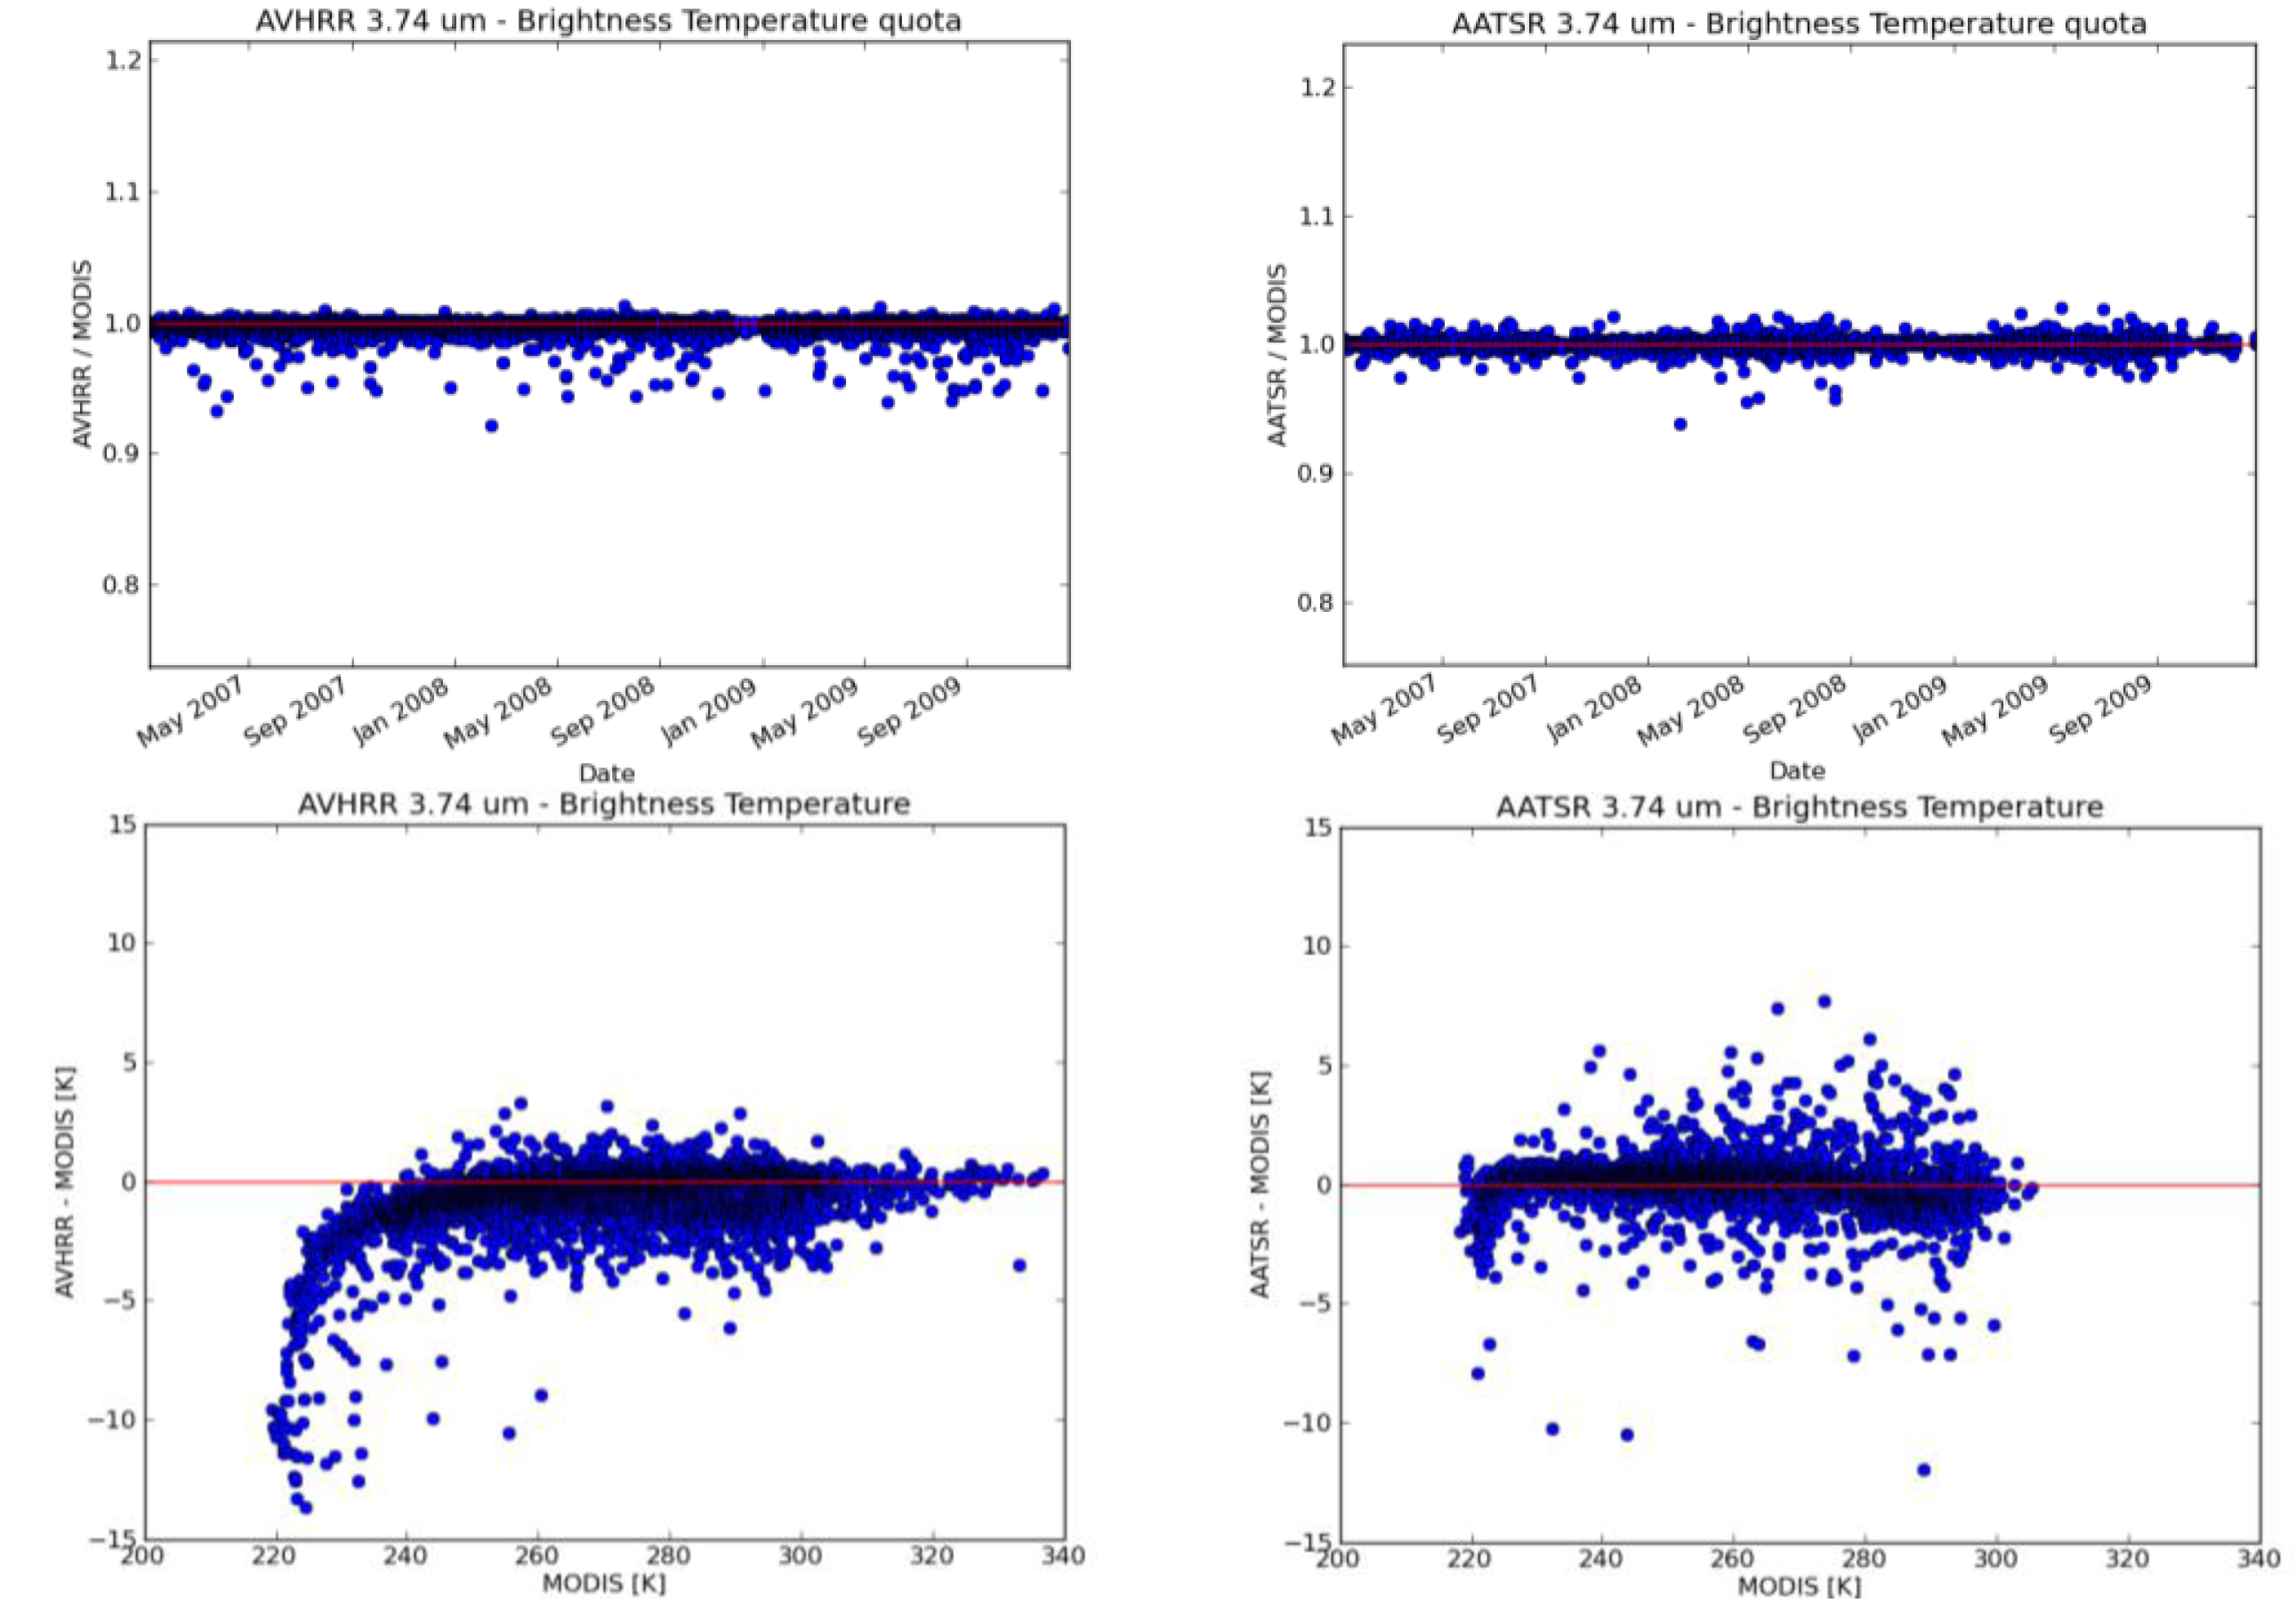
For AVHRR MWIR, LWIR1 and LWIR2 radiances deviations are very small, i.e., less than 0.2% (i.e., approximately 0.5 K at 250 K). However, in practice some systematic and significant deviations are seen for very cold temperatures, especially for channel 3b (see leftmost figure in lower panels of Figure 8). Results for channel 3b indicates that, despite applying non-linear corrections in the calibration process, these corrections are not able to remove all systematic radiance biases. Remaining deviations here are very critical because of the poor radiometric resolution in this channel [18]. This conclusion is further strengthened by the observation that deviations (although smaller) are seen also at very high temperatures in all three infrared channels. Thus, the problem of applying non-linear corrections is not only a problem for AVHRR channel 3b but also for the other two infrared channels.
For AATSR results in Table 9, deviations against MODIS for VIS, NIR, and SWIR channels are slightly larger than for AVHRR. Generally, deviations range from 2.9% to 5.0% with the highest values for channel 2 at 665 nm and with higher reflectances for AATSR in both channels. Results agree reasonably well with those found in [11] and [13] stating an overall systematic bias of 2%–3% (with the same sign as here) and a random uncertainty of about 1%–2%. It is pointed out in [11] and [19] that a positive deviation could be expected here (at least over land surface sites) due to remaining (non-compensated) differences in spectral response functions between the MODIS and AATSR sensors. This should mainly come from differential absorption effects (e.g., ozone) and the existing changes with wavelength of the surface reflectance (which is most serious for heterogeneous targets). As the SNO approach used here leads to the use of quite heterogeneous targets in comparison to the reference sites used in [11] and [13], we suspect that corresponding deviations may be larger, which is also what our results suggest.
We also see that the largest scatter in our results occurs for AATSR channel 4 at 1.6 μm (see Figure 7), which is an indication that conditions for inter-comparison are not as good as for the other channels. As the AATSR-MODIS inter-comparisons are made at high latitudes (± 72 degrees latitude) it is clear that many of the matched targets are selected over snow- and ice-covered surfaces. Thus, targets consist of a blend of poorly reflecting ice and snow surfaces in this wavelength (although with strongly anisotropic reflection behavior) and highly reflecting clouds (also reflecting strongly anisotropic). This explains the much larger scatter in the results for both low and high reflectances and we must consider the results obtained here as quite uncertain and less significant in comparison to results for the other channels.
For LWIR1 and LWIR2 AATSR channels the agreement with MODIS is exceptionally good for all channels. Here, it is clear that the small differences in spectral response for the involved channels are not influencing the results noticeably. Nevertheless, also for AATSR we see signs of deviations at very low and very high temperatures (e.g., at very low temperatures for 11 μm and at very high temperatures for 12 μm) indicating that some problems with non-linear radiance correction might still remain.
The evaluation of MERIS radiances (Table 10) revealed the same magnitude of deviations as for AATSR but with different sign (i.e., lower values than MODIS instead of higher). This is also in reasonable agreement with [13] although the differences are slightly larger here.
Finally, an interesting reference to this study is [20], where radiances measured by the Spinning Enhanced Visible and Infrared Imager (SEVIRI) were compared to MODIS and AVHRR radiances, thus using SEVIRI (considered to be a very stable sensor) as a transfer sensor for evaluating the difference between MODIS and AVHRR. Table 11 shows the currently retrieved results and the results from the SEVIRI transfer study for the NOAA-18 AVHRR sensor. Notice that the SEVIRI study was performed for exactly the same period as studied here. We find a very good agreement for AVHRR channel 1, while deviations are a bit larger for AVHRR channel 2 (3.4% for the SEVIRI method vs. 1.5% for the current method). The latter result is most probably an effect of the large differences in spectral response functions for this channel for the involved sensors. These are differences which are not easily compensated for, especially not when having to take into account three different spectral responses instead of two as for the direct inter-comparisons performed here.

4. Conclusions

The ESA-CLOUD-CCI project has completed its first effort of inter-comparing all involved sensor radiances to be utilized in the construction of an AVHRR-heritage cloud product dataset for climate studies. Radiances from the MODIS, AVHRR, AATSR, and MERIS sensors have been inter-compared using the SNO approach over a three-year demonstration period, covering 2007–2009. The comparison included the full AVHRR-heritage six-channel dataset, thus evaluating the full range from visible to infrared channels, including channels measuring in the intermediate near-infrared or shortwave-infrared spectral region.
Results are presented as relative deviations with respect to MODIS radiances which are serving as the calibration reference. Deviations are generally within 3% for VIS, NIR, and SWIR channels which is encouraging considering that random uncertainties from spatial and temporal matching are expected to be of the order of 1%–2%. Slightly larger deviations (3.5%–5%) are found for the two AATSR channels at 0.6 and 1.6 μm and for the MERIS channel at 0.9 μm. However, remaining differences in spectral response functions (i.e., largely non-compensateable in this context) and the heterogeneous character of the SNO targets in this study preclude us from safely interpreting this as an artificial and unwanted bias. Further studies including more rigorous error budget estimations as well as allowing coverage over longer periods for better trend analysis is needed for getting full clarification of this point.
Excellent agreement is found between all involved LWIR1 and LWIR2 channels showing only small (within 0.2%) deviations in brightness temperatures. Noteworthy deviations are found exclusively for very cold (especially in AVHRR channel 3b at 3.7 μm) or very warm targets. It is clear that remaining non-linear effects in the relation between counts and radiances and the poor radiometric resolution at very cold temperatures leads to some systematic deviations. For improving the confidence in these results in future studies, some further efforts are needed to reduce the variability within the studied samples. However, great care must be taken here avoiding that important samples at very low and at very high temperatures are filtered out.
In the next phase of the ESA-CLOUD-CCI project we plan to extend calibration studies over much longer periods (e.g., coverage of the full ENVISAT period and tracking of AVHRR radiances back to the launch of the first AVHRR/1 sensor in 1978). The work will also include collaboration with the corresponding ESA Climate Change Initiative project for studies of sea surface temperatures (ESA-SST-CCI), with special focus on improving the calibration accuracy of AVHRR infrared channels. The latter is particularly important when processing historic AVHRR data for which the applied calibration technique has been shown to be associated with some specific problems [21]. In addition, we hope that the planned work may contribute to the advancing of the quality of the AVHRR fundamental climate data record (AVHRR FCDR)—A topic that recently has been proposed for obtaining more concrete international coordination within the WMO Sustained, Coordinated Processing of Environmental Satellite Data for Climate Monitoring (SCOPE-CM) initiative [22].

Acknowledgments

This work was funded by the European Space Agency (ESA) and carried out in the ESA-CLOUD-CCI project—A project within the ESA Climate Change Initiative (CCI) programme. The authors are very grateful to Dave Smith at the Rutherford Appleton Laboratory Space, Science and Technologies Facilities Council, Didcot, UK, for valuable discussions on the calibration of the AATSR sensor. We also thank Caroline Poulsen at the same institution and the British Atmospheric Data Centre (BADC) for assisting with the needed AATSR datasets. Finally, we thank Rasmus Lindstrot and Rene Preusker at the Freie Universität Berlin for supplying the required MERIS datasets.

Author Contributions

Karl-Göran Karlsson outlined the research topic and study concept. Erik Johansson implemented required tools and processing methods. He also collected and prepared the various satellite data sets. Analysis of results was made jointly while the main text was written by Karl-Göran Karlsson.

Conflicts of Interest

The authors declare no conflict of interest.

References and Notes

  1. Cracknell, A.P. The Advanced Very High Resolution Radiometer (AVHRR); Taylor and Francis: London, UK, 1997. [Google Scholar]
  2. Karlsson, K.-G.; Riihela, A.; Mueller, R.; Meirink, J.F.; Sedlar, J.; Stengel, M.; Lockhoff, M.; Trentmann, J.; Kaspar, F.; Hollmann, R.; et al. CLARA-A1: A cloud, albedo, and radiation dataset from 28 yr of global AVHRR data. Atoms. Chem. Phys 2013, 13, 5351–5367. [Google Scholar]
  3. Foster, M.J.; Heidinger, A. PATMOS-x: Results from a diurnally corrected 30-yr satellite cloud climatology. J. Clim 2013, 26, 414–425. [Google Scholar]
  4. Heidinger, A.K.; Foster, M.J.; Walther, A.; Zhao, X. The pathfinder atmospheres extended (PATMOS-x) AVHRR climate data set. Bull. Am. Meteorol. Soc 2013. [Google Scholar] [CrossRef]
  5. Hollmann, R.; Merchant, C.J.; Saunders, R.; Downy, C.; Buchwitz, M.; Cazenave, A.; Chuvieco, E.; Defourny, P.; de Leeuw, G.; Forsberg, R.; et al. The ESA climate change initiative: Satellite data records for essential climate variables. Bull. Am. Meteorol. Soc 2013, 94, 1541–1552. [Google Scholar]
  6. Stengel, M.; Mieruch, S.; Jerg, M.; Karlsson, K.-G.; Scheirer, R.; Maddux, B.; Meirink, J.F.; Poulsen, C.; Siddans, R.; Walther, A.; et al. The Clouds Climate Change Initiative: The assessment of state of the art cloud property retrieval systems applied to AVHRR heritage measurements. Remote Sens. Environ 2014, in press. [Google Scholar]
  7. Lee, T.E.; Miller, S.D.; Turk, F.J.; Schueler, C.; Julian, R.; Deyo, S.; Dills, P.; Wang, S. The NPOESS VIIRS day/night visible sensor. Bull. Am. Meteorol. Soc 2006, 87, 191–199. [Google Scholar]
  8. Coppo, P.; Ricciarelli, B.; Brandani, F.; Delderfield, J.; Ferlet, M.; Mutlow, C.; Munro, G.; Nightingale, T.; Smith, D.; Bianchi, S.; et al. SLSTR: A high accuracy dual scan temperature radiometer for sea and land surface monitoring from space. J. Mod. Opt 2010, 57, 1815–1830. [Google Scholar]
  9. Heidinger, A.K.; Cao, C.; Sullivan, J.T. Using Moderate Resolution Imaging Spectrometer (MODIS) to calibrate advanced very high resolution radiometer reflectance channels. J. Geophys. Res 2002. [Google Scholar] [CrossRef]
  10. Heidinger, A.K.; Straka, W.C., III; Molling, C.C.; Sullivan, J.T.; Wu, X. Deriving an inter-sensor consistent calibration for the AVHRR solar reflectance data record. Int. J. Remote Sens 2010, 31, 6493–6517. [Google Scholar]
  11. Smith, D.L.; Cox, C.V. (A)ATSR solar channel on-orbit radiometric calibration. IEEE Trans. Geosci. Remote Sens 2013, 51, 1370–1382. [Google Scholar]
  12. Delwart, S.; Preusker, R.; Bourg, L.; Santer, R.; Ramon, D.; Fischer, J. MERIS in flight spectral calibration. Int. J. Remote Sens 2007, 28, 479–496. [Google Scholar]
  13. Bouvet, M.; Ramoino, F. Radiometric intercomparison of AATSR, MERIS, and Aqua MODIS over Dome Concordia (Antarctica). Can. J. Remote Sens 2010, 36, 464–473. [Google Scholar]
  14. Belward, A.S. International co-operation in satellite sensor calibration; The role of the CEOS working group on calibration and validation. Adv. Space Res 1999, 23, 1443–1448. [Google Scholar]
  15. Goldberg, M.; Ohring, G.; Butler, J.; Cao, C.; Datla, R.; Doelling, D.; Gärtner, V.; Hewison, T.; Iacovazzi, B.; Kim, D.; et al. The global space-based inter-calibration system. Bull. Am. Meteorol. Soc 2011, 92, 467–475. [Google Scholar]
  16. Cao, C.; Weinreb, M.; Xu, H. Predicting simultaneous nadir overpasses among polar-orbiting meteorological satellites for the intersatellite calibration of radiometers. J. Atmos. Ocean. Technol 2004, 21, 537–542. [Google Scholar]
  17. Xiong, X.; Barnes, W. An overview of MODIS radiometric calibration and characterization. Adv. Atmos. Sci 2006, 23, 69–79. [Google Scholar]
  18. Trishchenko, A.P.; Fedosejevs, G.; Li, Z.; Cihlar, J. Trends and uncertainties in thermal calibration of AVHRR radiometers onboard NOAA-9 to NOAA-16. J. Geophys. Res.: Atmos 2002, 107, 4778–4790. [Google Scholar]
  19. Bouvet, M.; Adriaensen, S.; Barker, K.; Bourg, L.; Fougnie, B.; Govaerts, Y.; Henry, P.; Kent, C.; Smith, D.; Sterckx, S. CEOS IVOS Working Group 4: Intercomparison of Vicarious Calibration Methodologies and Radiometric Comparison Methodologies over Pseudo-Invariant Calibration Sites; Committee on Earth Observation Satellites (CEOS): Longueil, QC, Canada, 2012. [Google Scholar]
  20. Meirink, J.F.; Roebeling, R.A.; Stammes, P. Inter-calibration of polar imager solar channels using SEVIRI. Atmos. Meas. Tecl. Discuss 2013, 6, 2495–2508. [Google Scholar]
  21. Mittaz, J.; Harris, A. A physical method for the calibration of the AVHRR/3 thermal IR channels Part 2: An in-orbit comparison of the AVHRR longwave thermal IR channels on board MetOp-A with IASI. J. Atmos. Ocean. Technol 2011, 28, 1072–1087. [Google Scholar]
  22. World Meteorological Organisation (WMO). SCOPE-CM Phase 2 Implementation Plan; Version 1.0; WMO: Geneva, Switzerland, 2012; p. 28. [Google Scholar]
Figure 1. Target area for simultaneous nadir observation studies. Example shown for a SNO-point inter-comparing MODIS and AATSR radiances.
Remotesensing 06 01845f1
Figure 2. Distribution of realized SNO match-ups within 10 min for NOAA-18 AVHRR and AQUA MODIS in the period 2007–2009.
Remotesensing 06 01845f2
Figure 3. Distribution of realized SNO match-ups within 10 min for ENVISAT AATSR/MERIS and AQUA MODIS in the period 2007–2009. Notice that for MERIS and for AATSR visible channels only half of the match-ups are useful (i.e., available during daytime conditions).
Remotesensing 06 01845f3
Figure 4. Inter-comparison of radiances against MODIS for the AVHRR-heritage channel at 0.6 μm for AVHRR (Left), AATSR (Middle), and MERIS (Right). Upper panels show results expressed as reflectance factor quotas or radiance quotas over the full time series and lower panels show results expressed as scatter plots. Time period is from January 2007 to December 2009.
Remotesensing 06 01845f4
Figure 5. Inter-comparison of normalized reflectance factors against MODIS for the AVHRR-heritage channel at 0.6 μm for AATSR for the restricted dataset. Left panel shows results expressed as reflectance factor quotas over the full time series and right panel shows results expressed as a scatter plot.
Remotesensing 06 01845f5
Figure 6. Inter-comparison of radiances against MODIS for the AVHRR-heritage channel at 0.9 μm for AVHRR (Left), AATSR (Middle), and MERIS (Right). Upper panels show results expressed as reflectance factor quotas or radiance quotas over the full time series and lower panels show results expressed as scatter plots.
Remotesensing 06 01845f6
Figure 7. Inter-comparison of normalized reflectance factors against MODIS for the AVHRR-heritage channel at 1.6 μm for AATSR. Left panel show results expressed as reflectance factor quotas over the full time series and the right panel show results expressed as a scatter plot.
Remotesensing 06 01845f7
Figure 8. Inter-comparison of brightness temperatures against MODIS for the AVHRR-heritage channel at 3.7 μm for AVHRR (Left) and AATSR (Right). Upper panels show results expressed as brightness temperature quotas over time and lower panels show results expressed as brightness temperature differences as a function of MODIS brightness temperatures.
Remotesensing 06 01845f8
Figure 9. Inter-comparison of brightness temperatures against MODIS for the AVHRR-heritage channel at 11 μm for AVHRR (Left) and AATSR (Right). Upper panels show results expressed as brightness temperature quotas over time and lower panels show results expressed as brightness temperature differences as a function of MODIS brightness temperatures.
Remotesensing 06 01845f9
Figure 10. Inter-comparison of brightness temperatures against MODIS for the AVHRR-heritage channel at 12 μm for AVHRR (Left) and AATSR (Right). Upper panels show results expressed as brightness temperature quotas over time and lower panels show results expressed as brightness temperature differences as a function of MODIS brightness temperatures.
Remotesensing 06 01845f10
Table 1. Status of calibration for involved sensors. Applicable references are indicated where further details of the applied calibration methods are given.
SensorCalibration Status
MODISCalibration according to methods used for MODIS Collection 5 [16]. Both radiances and reflectances were provided in Level 1 files. MODIS bands 1,2,6,20,31 and 32 were used in this study. Notice that only data from the afternoon orbit (the AQUA satellite) was used.
AVHRRVisible radiances calibrated and reflectances calculated according to [10], infrared radiances based on standard blackbody reference calibration. Data was taken exclusively from the afternoon orbit of the NOAA-18 satellite.
AATSR2nd AATSR Reprocessing dataset, drift correction Look Up Table applied [11]. Both radiances and reflectances provided in Level 1 files.
MERIS3rd MERIS Reprocessing dataset [12]. Only radiances provided in Level 1 files.
Table 2. Summary of results for all Simultaneous Nadir Observation (SNO) match-up targets for the Advanced Very High Resolution Radiometer (AVHRR)-heritage channel at 0.6 μm based on inter-comparisons with Moderate Resolution Imaging Spectroradiometer (MODIS) on the AQUA satellite. The total bias is expressed as the relative bias (i.e., reflectance factor quota or radiance quota).
SensorTotal BiasStdSamplesRestrictions
AVHRR0.98380.012927SZA < 70 deg, BRF > 10%, Std < 1%
0.98290.06582915Original results—No restrictions
AATSR1.05040.0157146SZA < 70 deg, BRF > 10%, Std < 1%
1.05360.08262294Original results—No restrictions
MERIS0.97090.0444172SZA < 70 deg, BRF > 10%, Std < 1%
0.98300.13921823Original results—No restrictions
Table 3. Summary of results for all SNO match-up targets for the AVHRR-heritage channel at 0.9 μm based on inter-comparisons with MODIS on AQUA. The total bias is expressed as the relative bias (i.e., reflectance factor quota or radiance quota).
SensorTotal BiasStdSamplesRestrictions
AVHRR0.98510.016925SZA < 70 deg, BRF > 10%, Std < 1% + Water Vapor compensation according to [10]
0.87910.07882917Original results—No restrictions

AATSR1.02890.0140131SZA < 70 deg, BRF > 10%, Std < 1%
1.02540.10722293Original results—No restrictions

MERIS0.96520.0425163SZA < 70 deg, BRF > 10%, Std < 1%
0.97080.14271822Original results—No restrictions
Table 4. Summary of results for all SNO match-up targets for the AVHRR-heritage channel at 1.6 μm based on Advanced Along-Track Scanning Radiometer (AATSR) inter-comparisons with MODIS on AQUA. The total bias is expressed as the relative bias (i.e., reflectance factor quota).
SensorTotal BiasStdSamplesRestrictions
AATSR0.96470.022168SZA < 70 deg, BRF > 10%, Std < 1%
0.92320.18471946Original results—No restrictions
Table 5. Summary of results for all SNO match-up targets for the AVHRR-heritage channel at 3.7 μm based on inter-comparisons with MODIS on AQUA. The total bias is expressed as the relative bias (i.e., brightness temperature quota).
SensorTotal BiasStdSamplesRestrictions
AVHRR0.99770.00605735No restrictions—All samples
AATSR1.00030.00354002No restrictions—All samples
Table 6. Summary of results for all SNO match-up targets for the AVHRR-heritage channel at 11 μm based on inter-comparisons with MODIS on AQUA. The total bias is expressed as the relative bias (i.e., brightness temperature quota).
SensorTotal BiasStdSamplesRestrictions
AVHRR1.00070.00295788No restrictions—All samples
AATSR1.00010.00344112No restrictions—All samples
Table 7. Summary of results for all SNO match-up targets for the AVHRR-heritage channel at 12 μm based on inter-comparisons with MODIS on AQUA. The total bias is expressed as the relative bias (i.e., brightness temperature quota).
SensorTotal BiasStdSamplesRestrictions
AVHRR0.99900.00285788No restrictions—All samples
AATSR0.99930.00334091No restrictions—All samples
Table 8. Reflectance factor quotas or brightness temperature quotas with respect to MODIS (AVHRR/MODIS) deduced from NOAA-18 vs. AQUA SNO inter-comparisons in the period of 2007–2009.
AVHRR ChannelWavelength Interval (nm)Reflectance Factor Quota (Channels 1,2,3a) or Brightness Temperature Quota (Channels 3b,4,5)
1580–6800.984
2725–10000.985
3b3550–39300.998
410,300–11,3001.000
511,500–12,5000.999
Table 9. Reflectance factor quotas or brightness temperature quotas for AATSR with respect to MODIS (AATSR/MODIS) deduced from SNO inter-comparisons in the period of 2007–2009.
AATSR ChannelCentral Wavelength (nm)Reflectance Factor Quota (Channels 2–4) or Brightness Temperature Quota (Channels 5–7)
26651.050
38651.029
416100.965
537401.000
610,8501.000
712,0000.999
Table 10. Radiance quotas for MERIS with respect to MODIS (MERIS/MODIS) deduced from SNO inter-comparisons in the period 2007–2009.
MERIS ChannelCentral Wavelength (nm)Radiance Quota
76650.971
138650.965
Table 11. Quota of normalized reflectance factors for AVHRR VIS and NIR channels for NOAA-18 in the period 2007–2009 deduced from SNO inter-comparisons (this study) and Spinning Enhanced Visible and Infrared Imager (SEVIRI)-transfer inter-comparisons [20].
MethodAVHRR Channel 1 (0.67 μm)AVHRR Channel 2 (0.87 μm)
SNO comparison (this study)0.9840.985
SEVIRI-transfer [20]0.9930.966

