Error Analysis on ESA’s Envisat ASAR Wave Mode Significant Wave Height Retrievals Using Triple Collocation Model


Abstract
:1. Introduction
2. Data Description
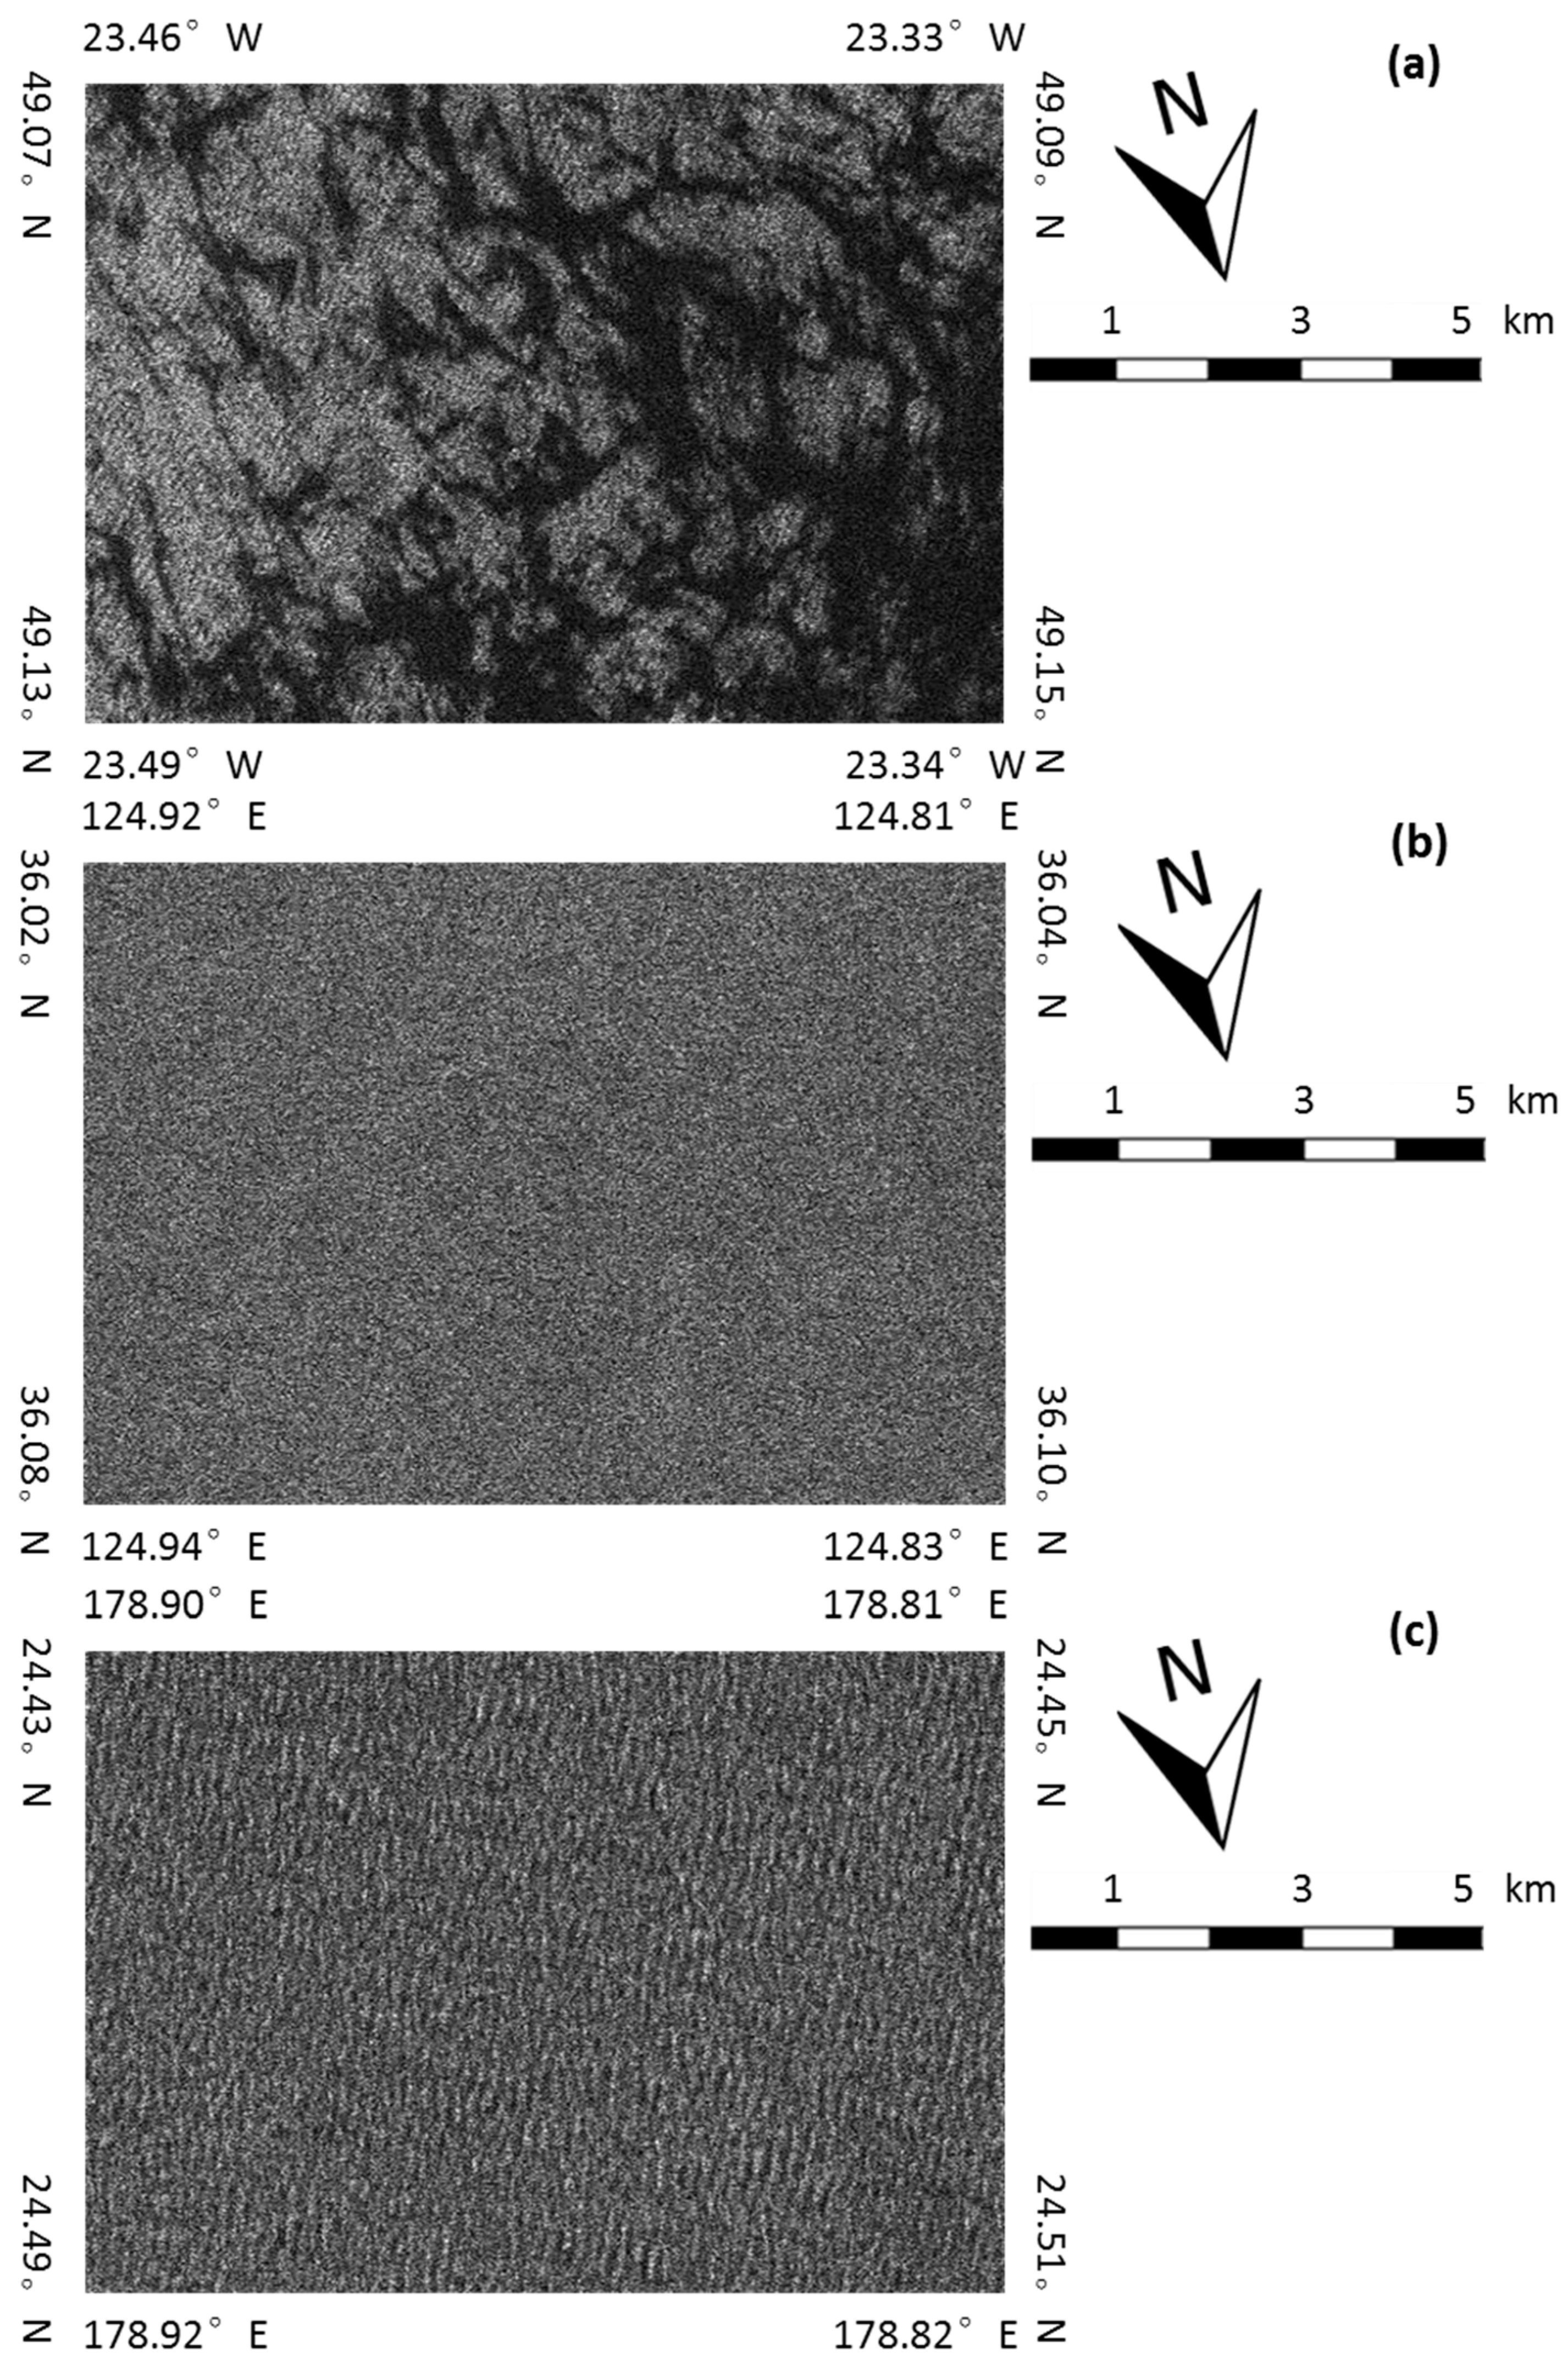
2.1. Envisat ASAR Wave Mode Data
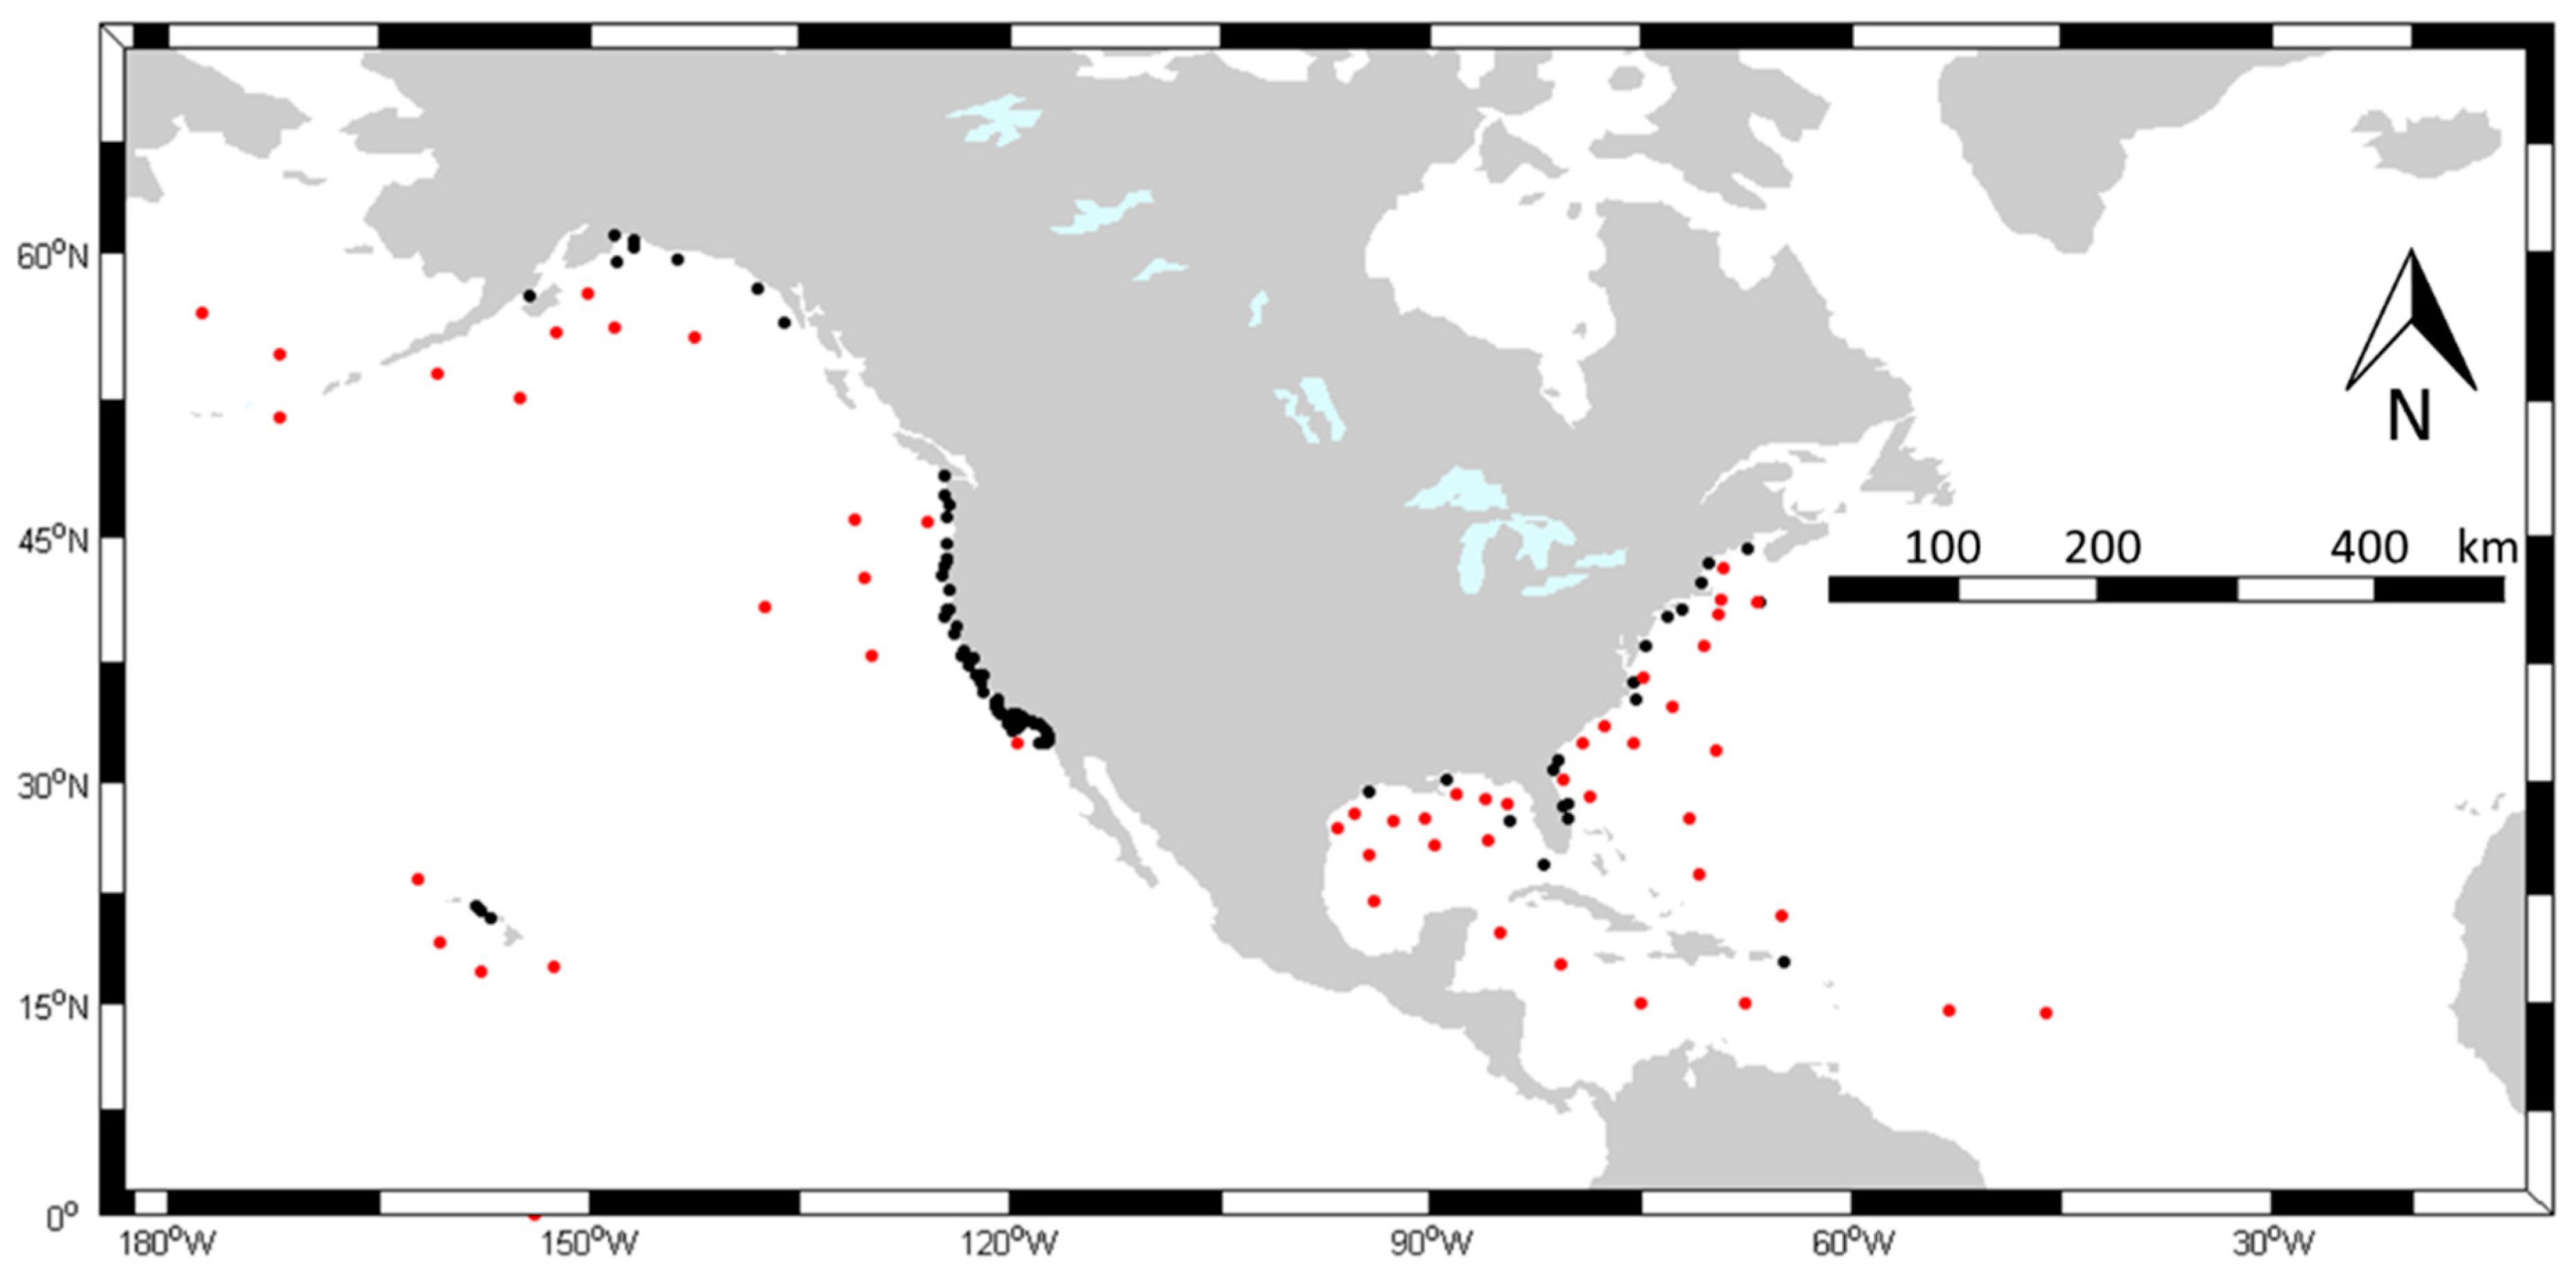
2.2. Buoy Data
2.3. Wavewatch III SWH Hindcast
3. Triple Collocation Error Model
4. Triple Collocation and Error Analysis
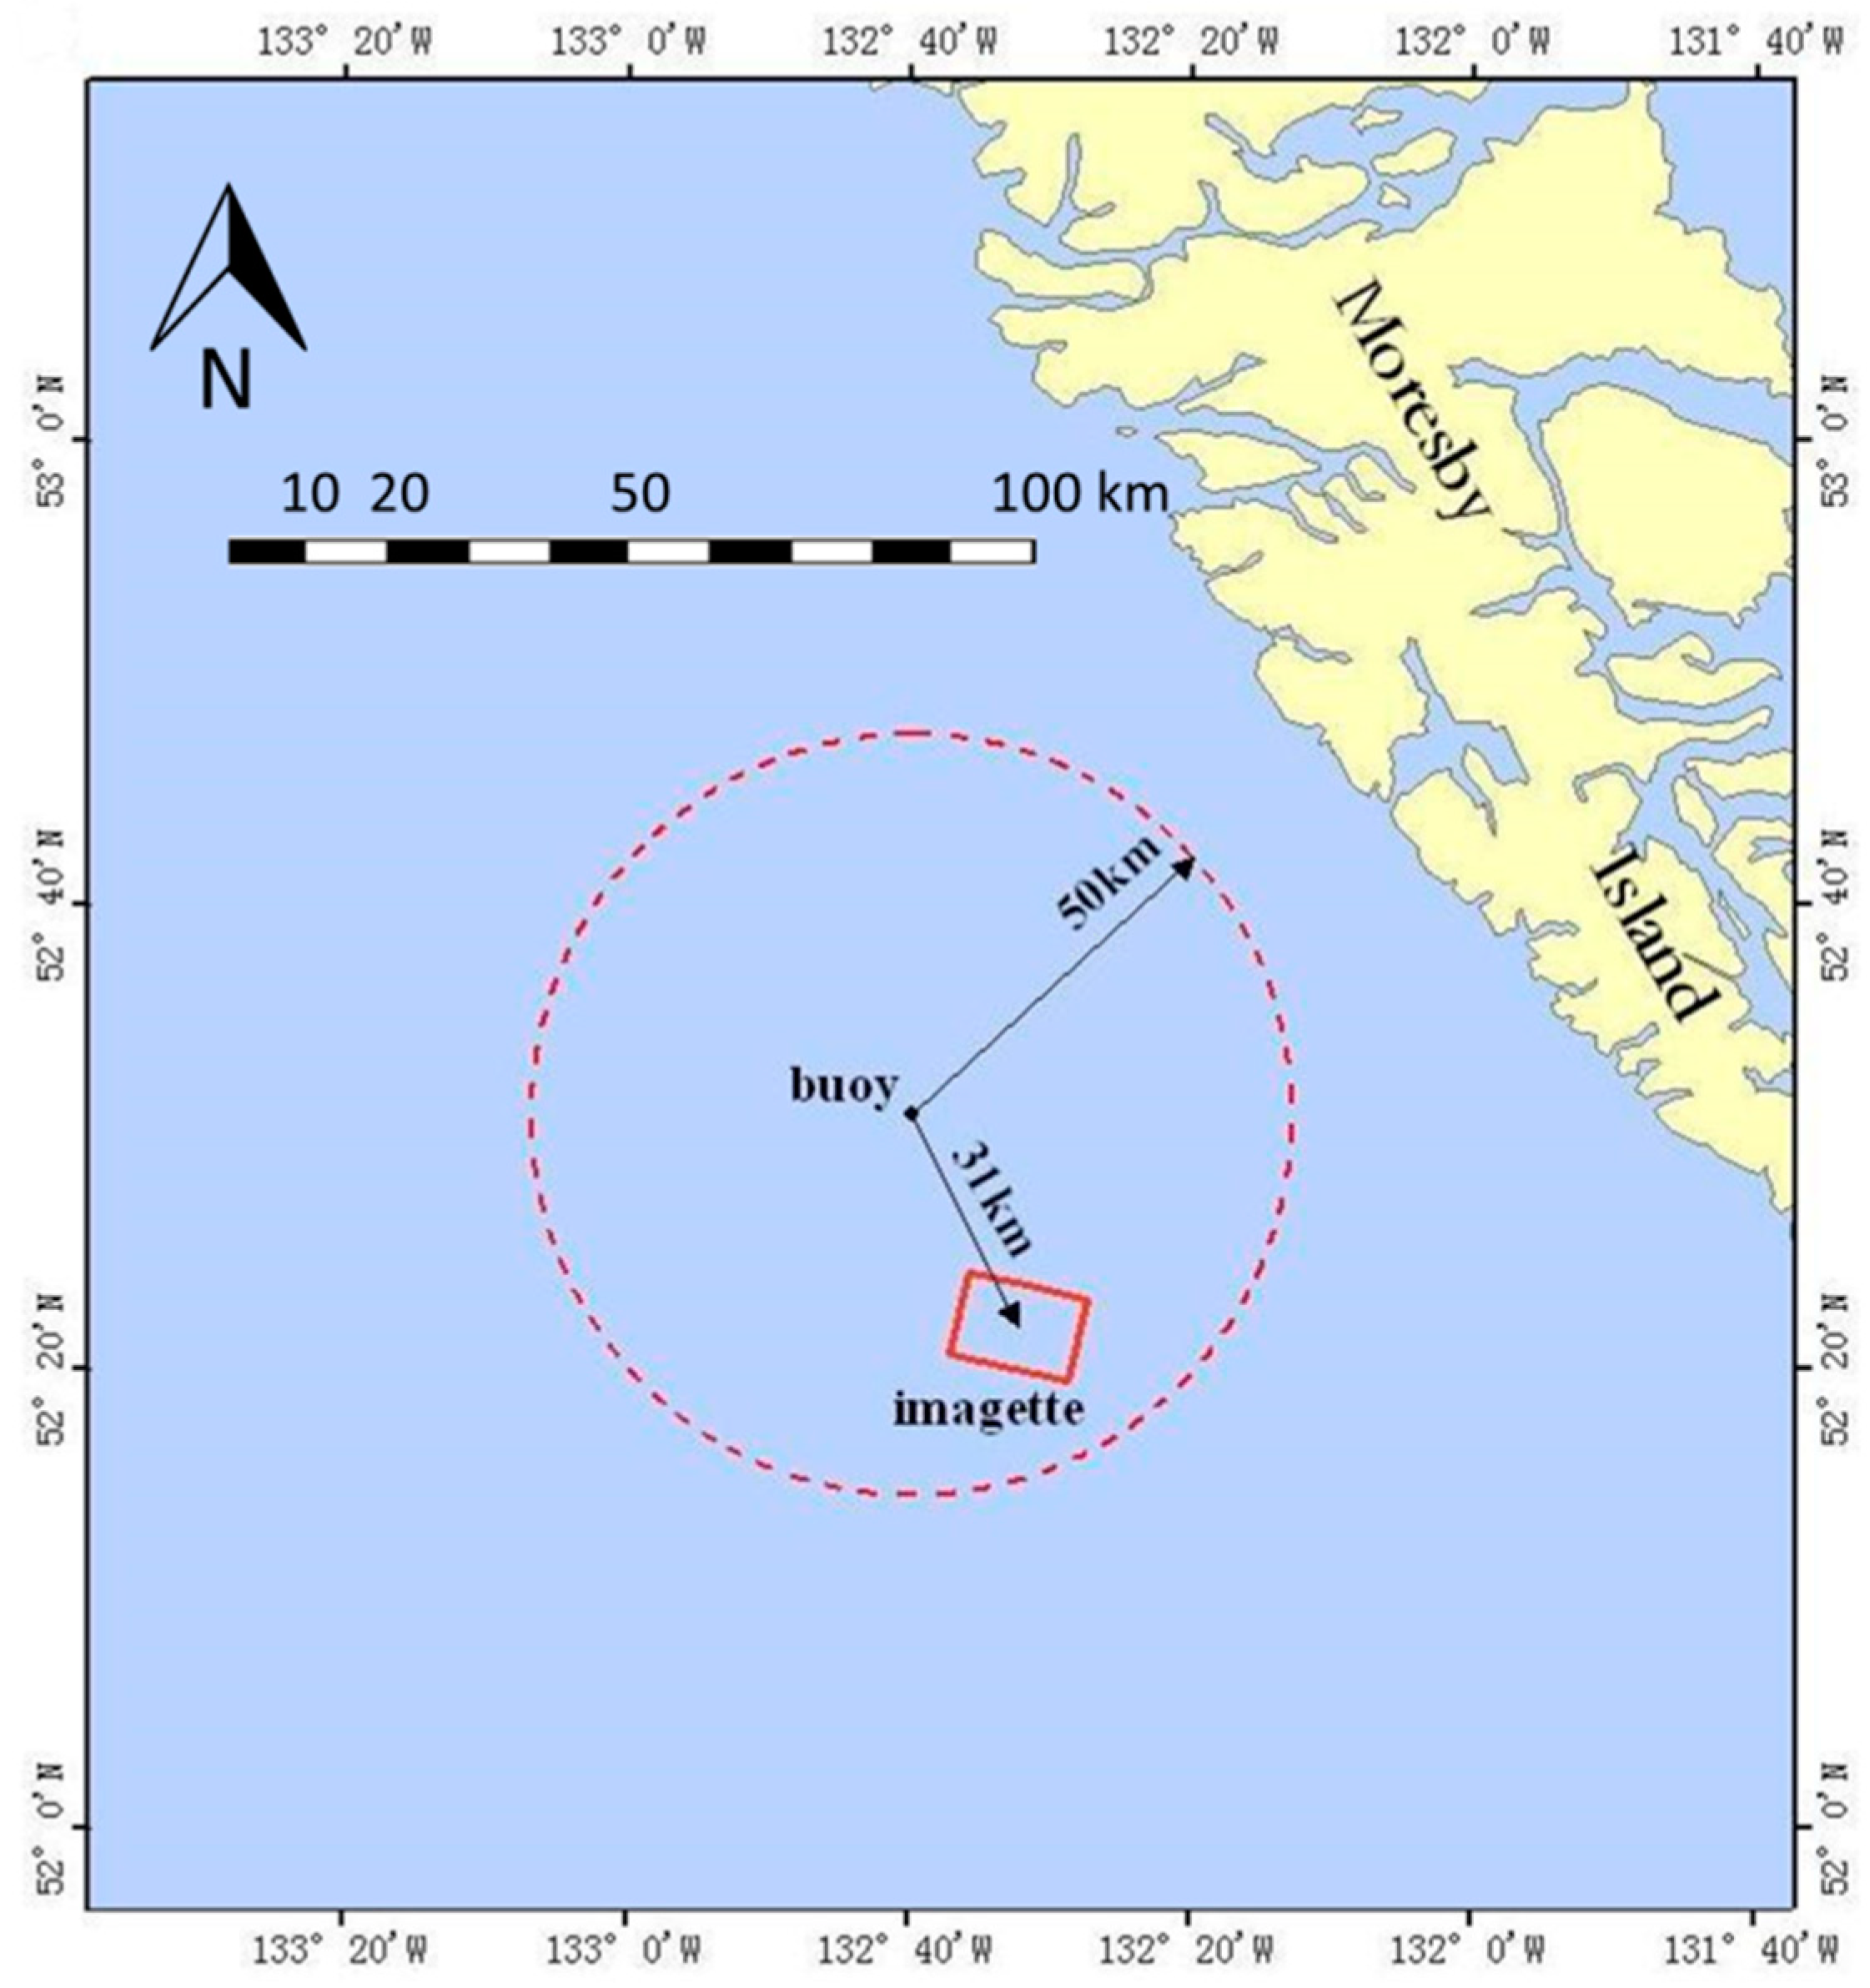
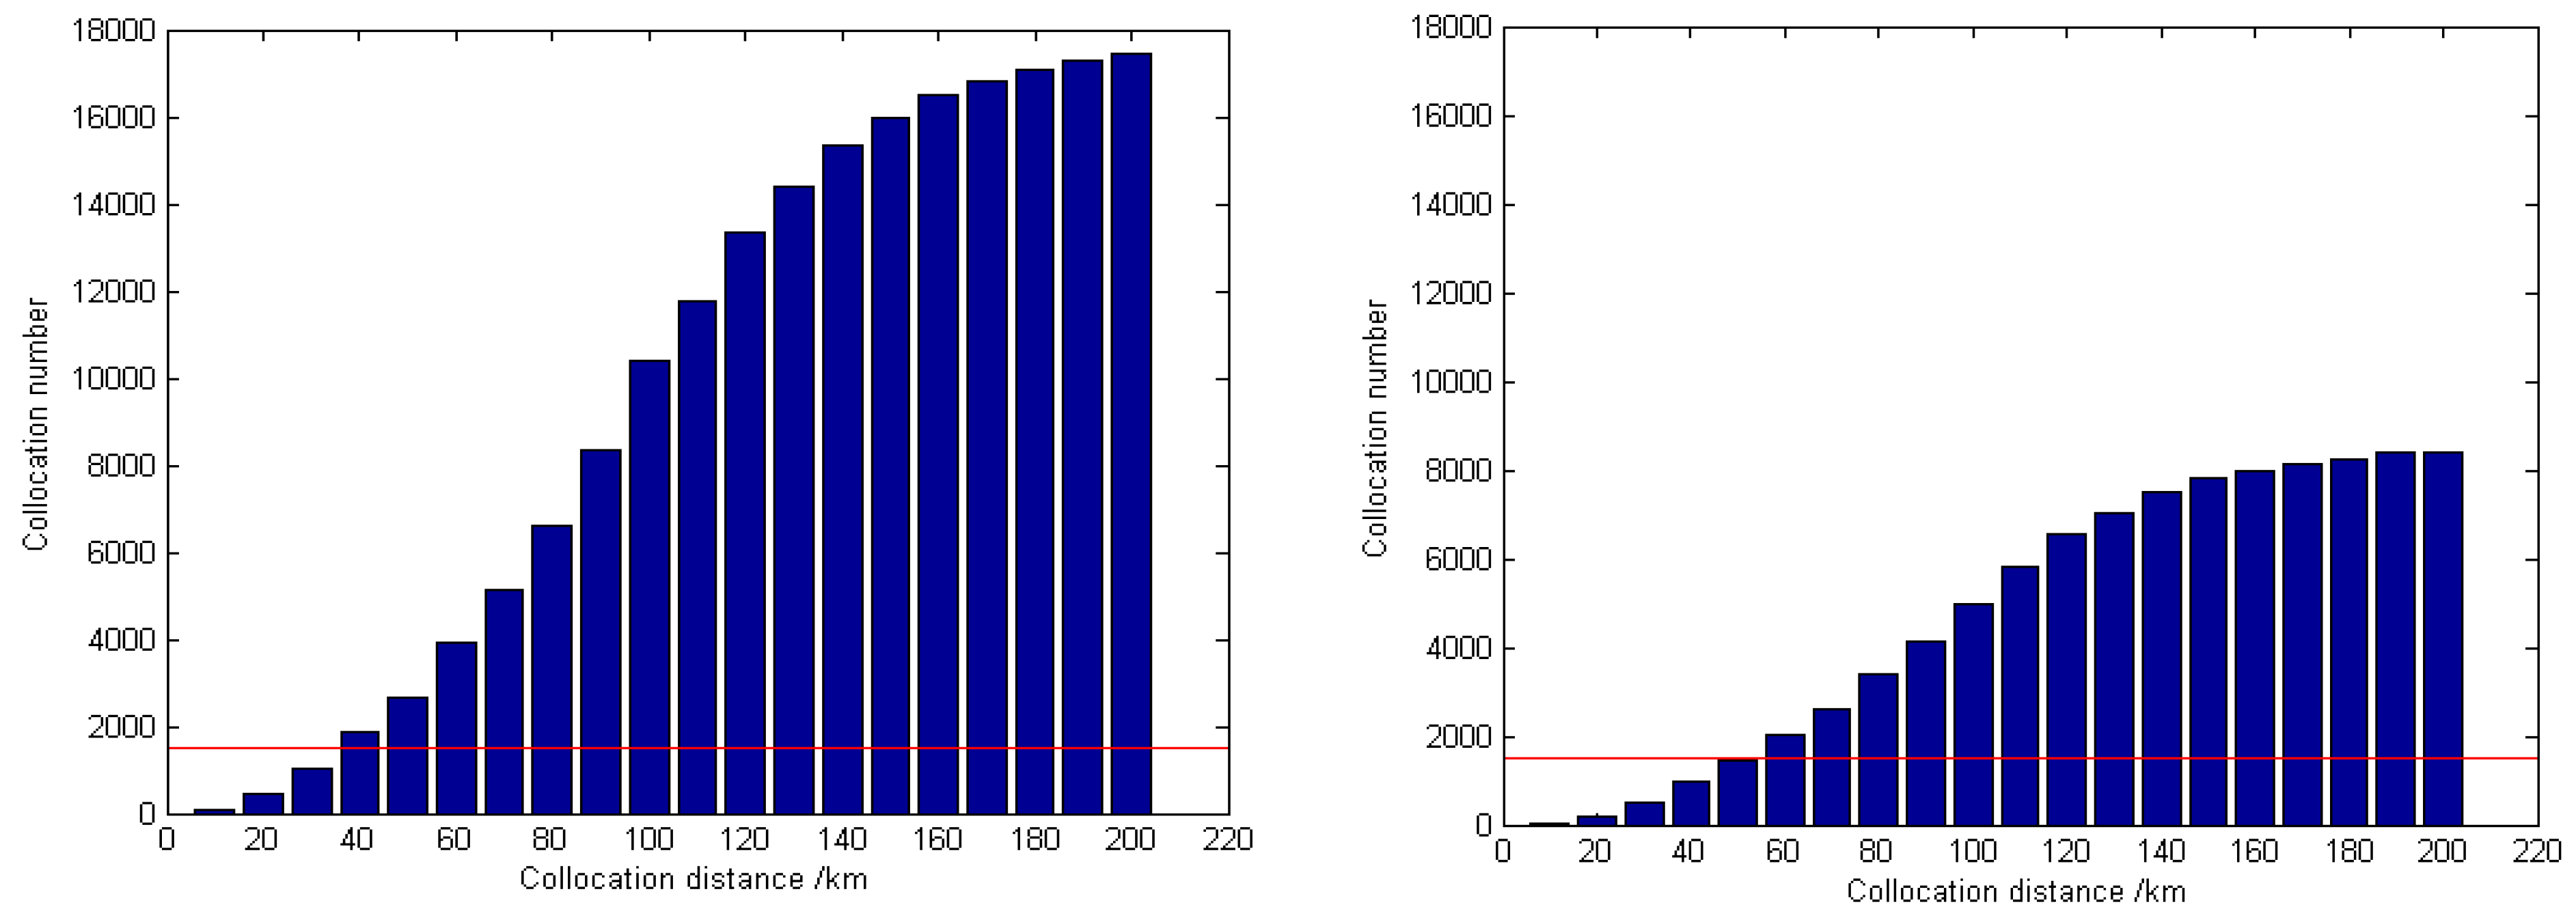
4.1. Collocation Criteria and Collocated Results


4.2. Triple Collocation Comparison Results

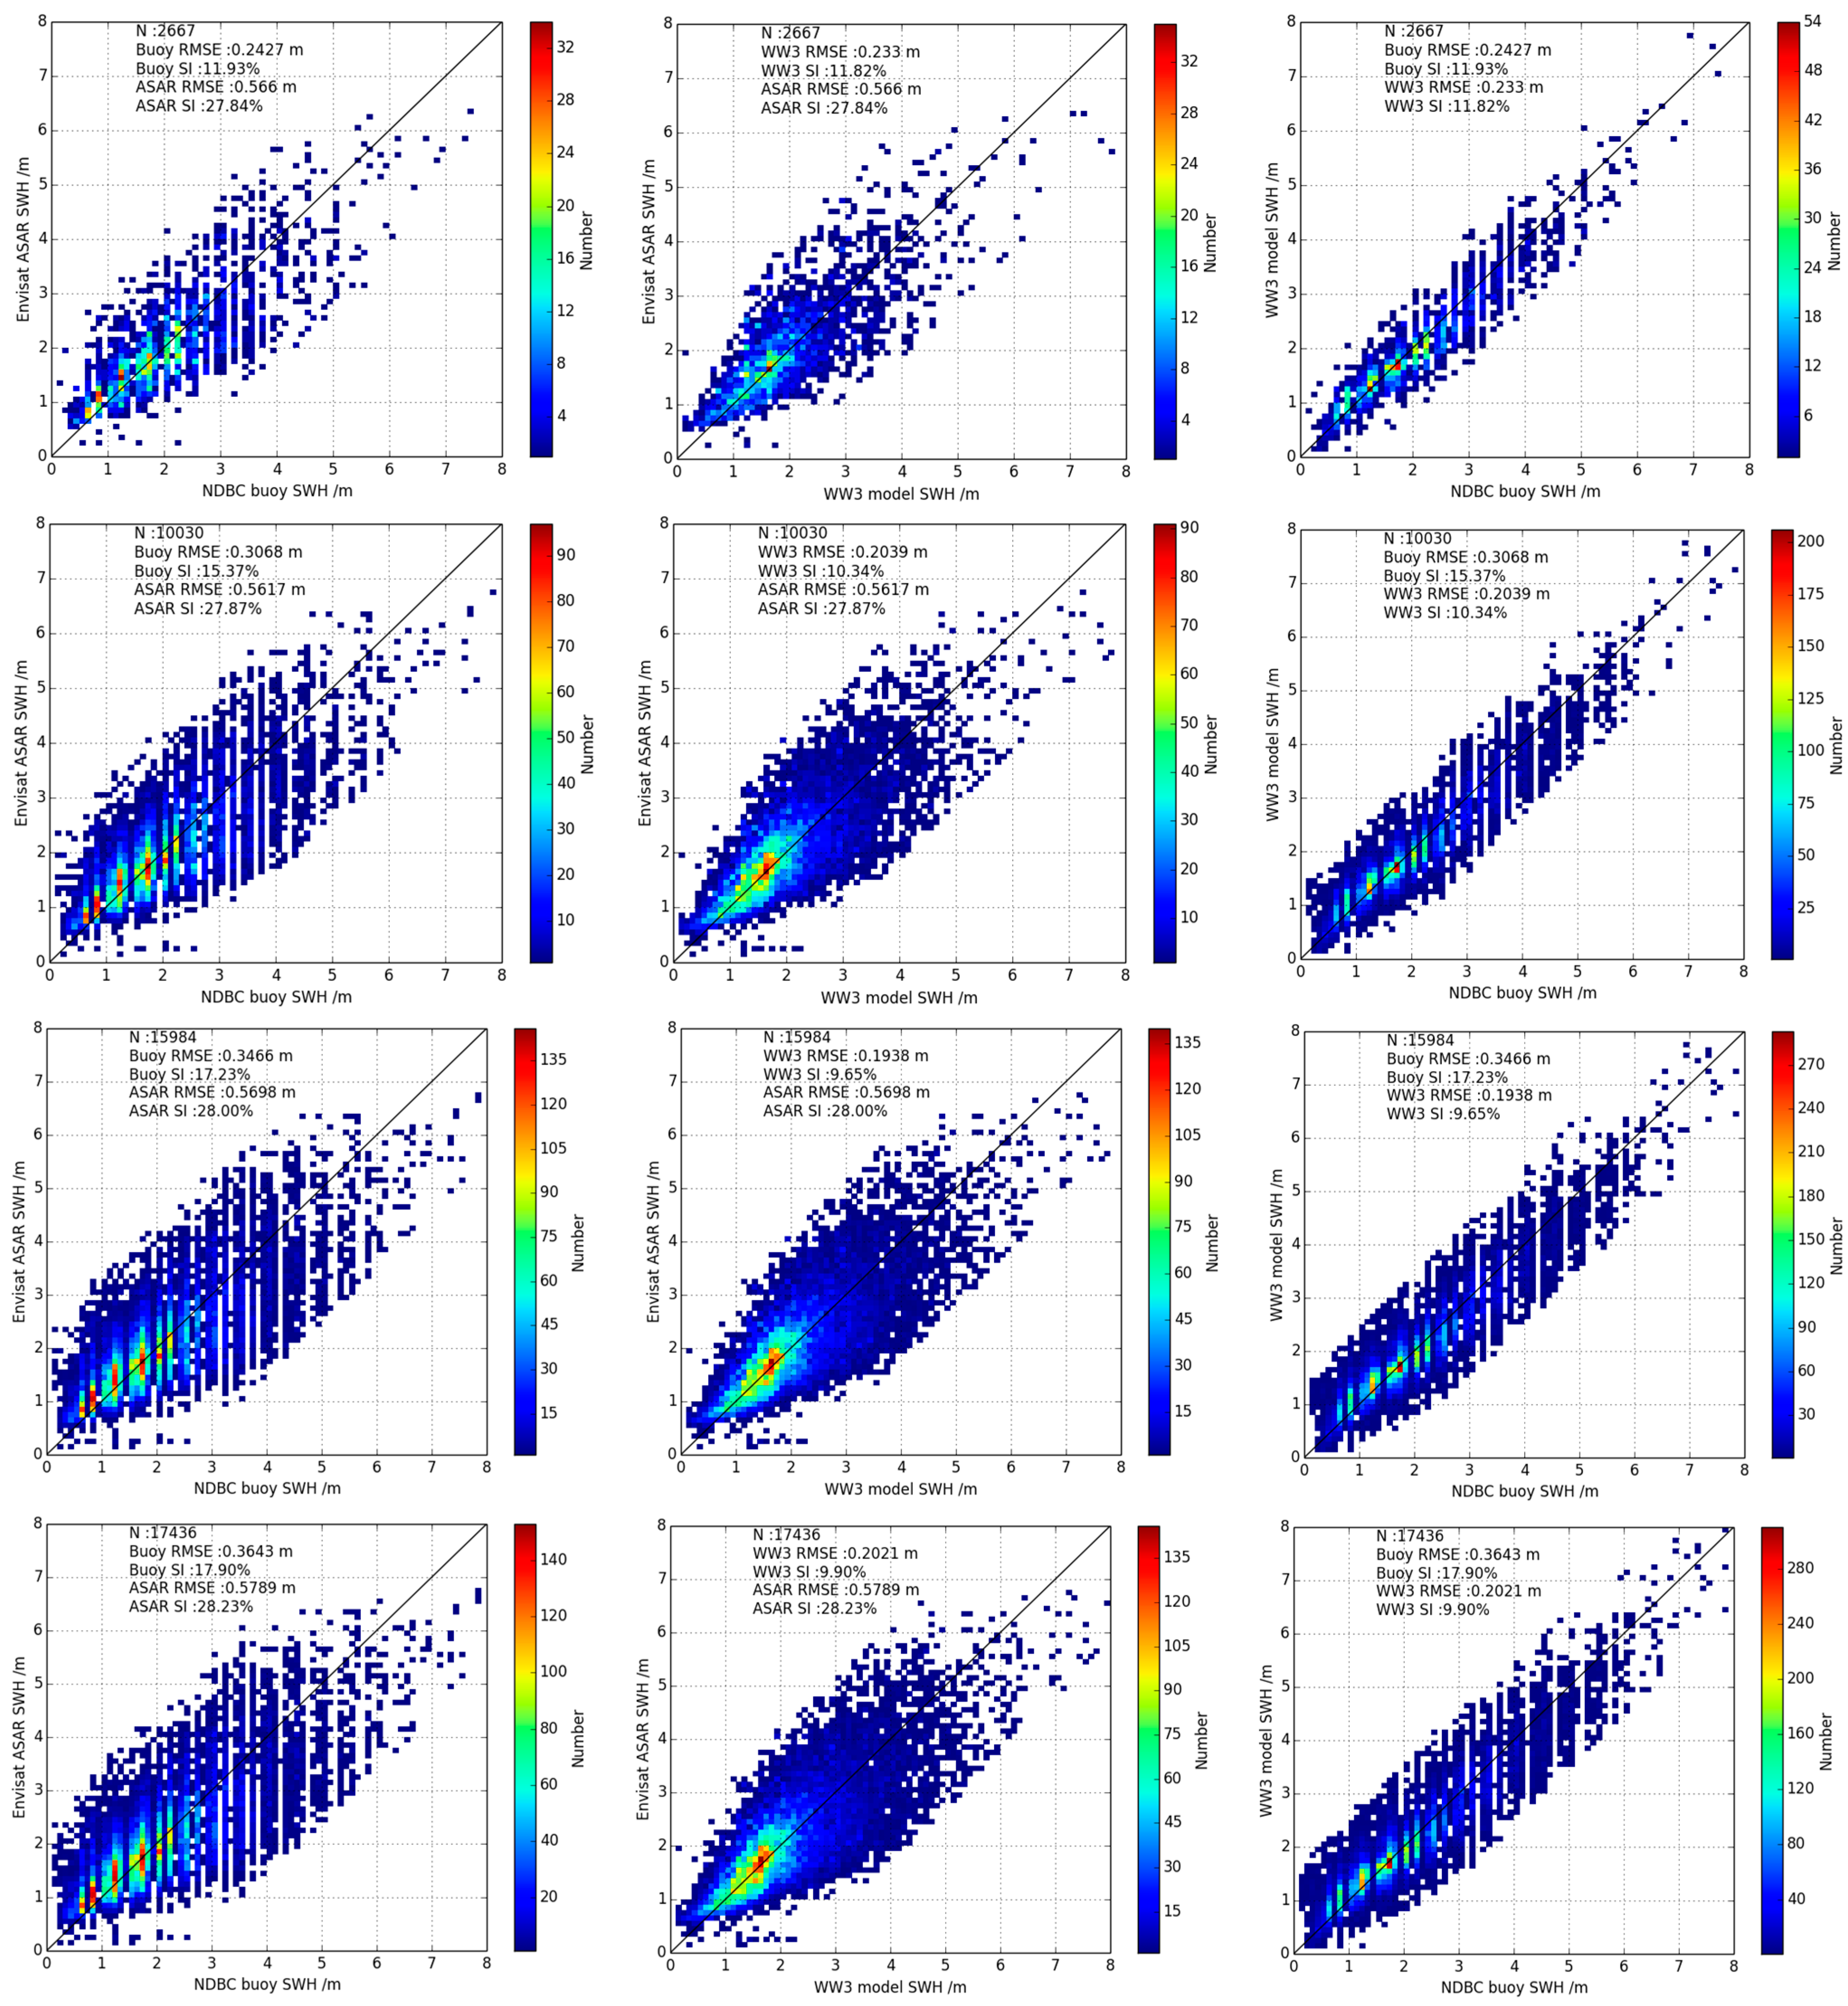
| Collocation Distance (km) | Calibration Coefficients | RMSE (m) | SI | |||||
|---|---|---|---|---|---|---|---|---|
| βASAR | βww3 | RMSEbuoy | RMSEASAR | RMSEww3 | SIbuoy | SIASAR | SIww3 | |
| 50 | 0.9495 | 0.9583 | 0.2427 | 0.5660 | 0.2330 | 11.93% | 27.84% | 11.82% |
| 60 | 0.9478 | 0.9618 | 0.2599 | 0.5725 | 0.2254 | 12.75% | 28.08% | 11.37% |
| 70 | 0.9510 | 0.9670 | 0.2698 | 0.5738 | 0.2254 | 13.33% | 28.26% | 11.39% |
| 80 | 0.9558 | 0.9716 | 0.2864 | 0.5710 | 0.2148 | 14.18% | 28.08% | 10.83% |
| 90 | 0.9583 | 0.9743 | 0.3027 | 0.5665 | 0.2042 | 15.08% | 28.00% | 10.33% |
| 100 | 0.9604 | 0.9771 | 0.3068 | 0.5617 | 0.2039 | 15.37% | 27.87% | 10.34% |
| 110 | 0.9619 | 0.9822 | 0.3191 | 0.5607 | 0.1953 | 16.08% | 27.94% | 9.92% |
| 120 | 0.9649 | 0.9842 | 0.3295 | 0.5646 | 0.1925 | 16.59% | 28.03% | 9.74% |
| 130 | 0.9642 | 0.9852 | 0.3366 | 0.5663 | 0.1897 | 16.90% | 28.04% | 9.56% |
| 140 | 0.9629 | 0.9866 | 0.3415 | 0.5678 | 0.1921 | 17.03% | 27.98% | 9.61% |
| 150 | 0.9631 | 0.9886 | 0.3466 | 0.5698 | 0.1938 | 17.23% | 28.00% | 9.65% |
| 160 | 0.9622 | 0.9904 | 0.3522 | 0.5721 | 0.1969 | 17.43% | 28.02% | 9.74% |
| 170 | 0.9609 | 0.9917 | 0.3557 | 0.5762 | 0.1986 | 17.55% | 28.15% | 9.79% |
| 180 | 0.9592 | 0.9920 | 0.3575 | 0.5773 | 0.2012 | 17.60% | 28.17% | 9.88% |
| 190 | 0.9581 | 0.9917 | 0.3605 | 0.5787 | 0.2017 | 17.71% | 28.22% | 9.89% |
| 200 | 0.9583 | 0.9927 | 0.3643 | 0.5789 | 0.2021 | 17.90% | 28.23% | 9.90% |
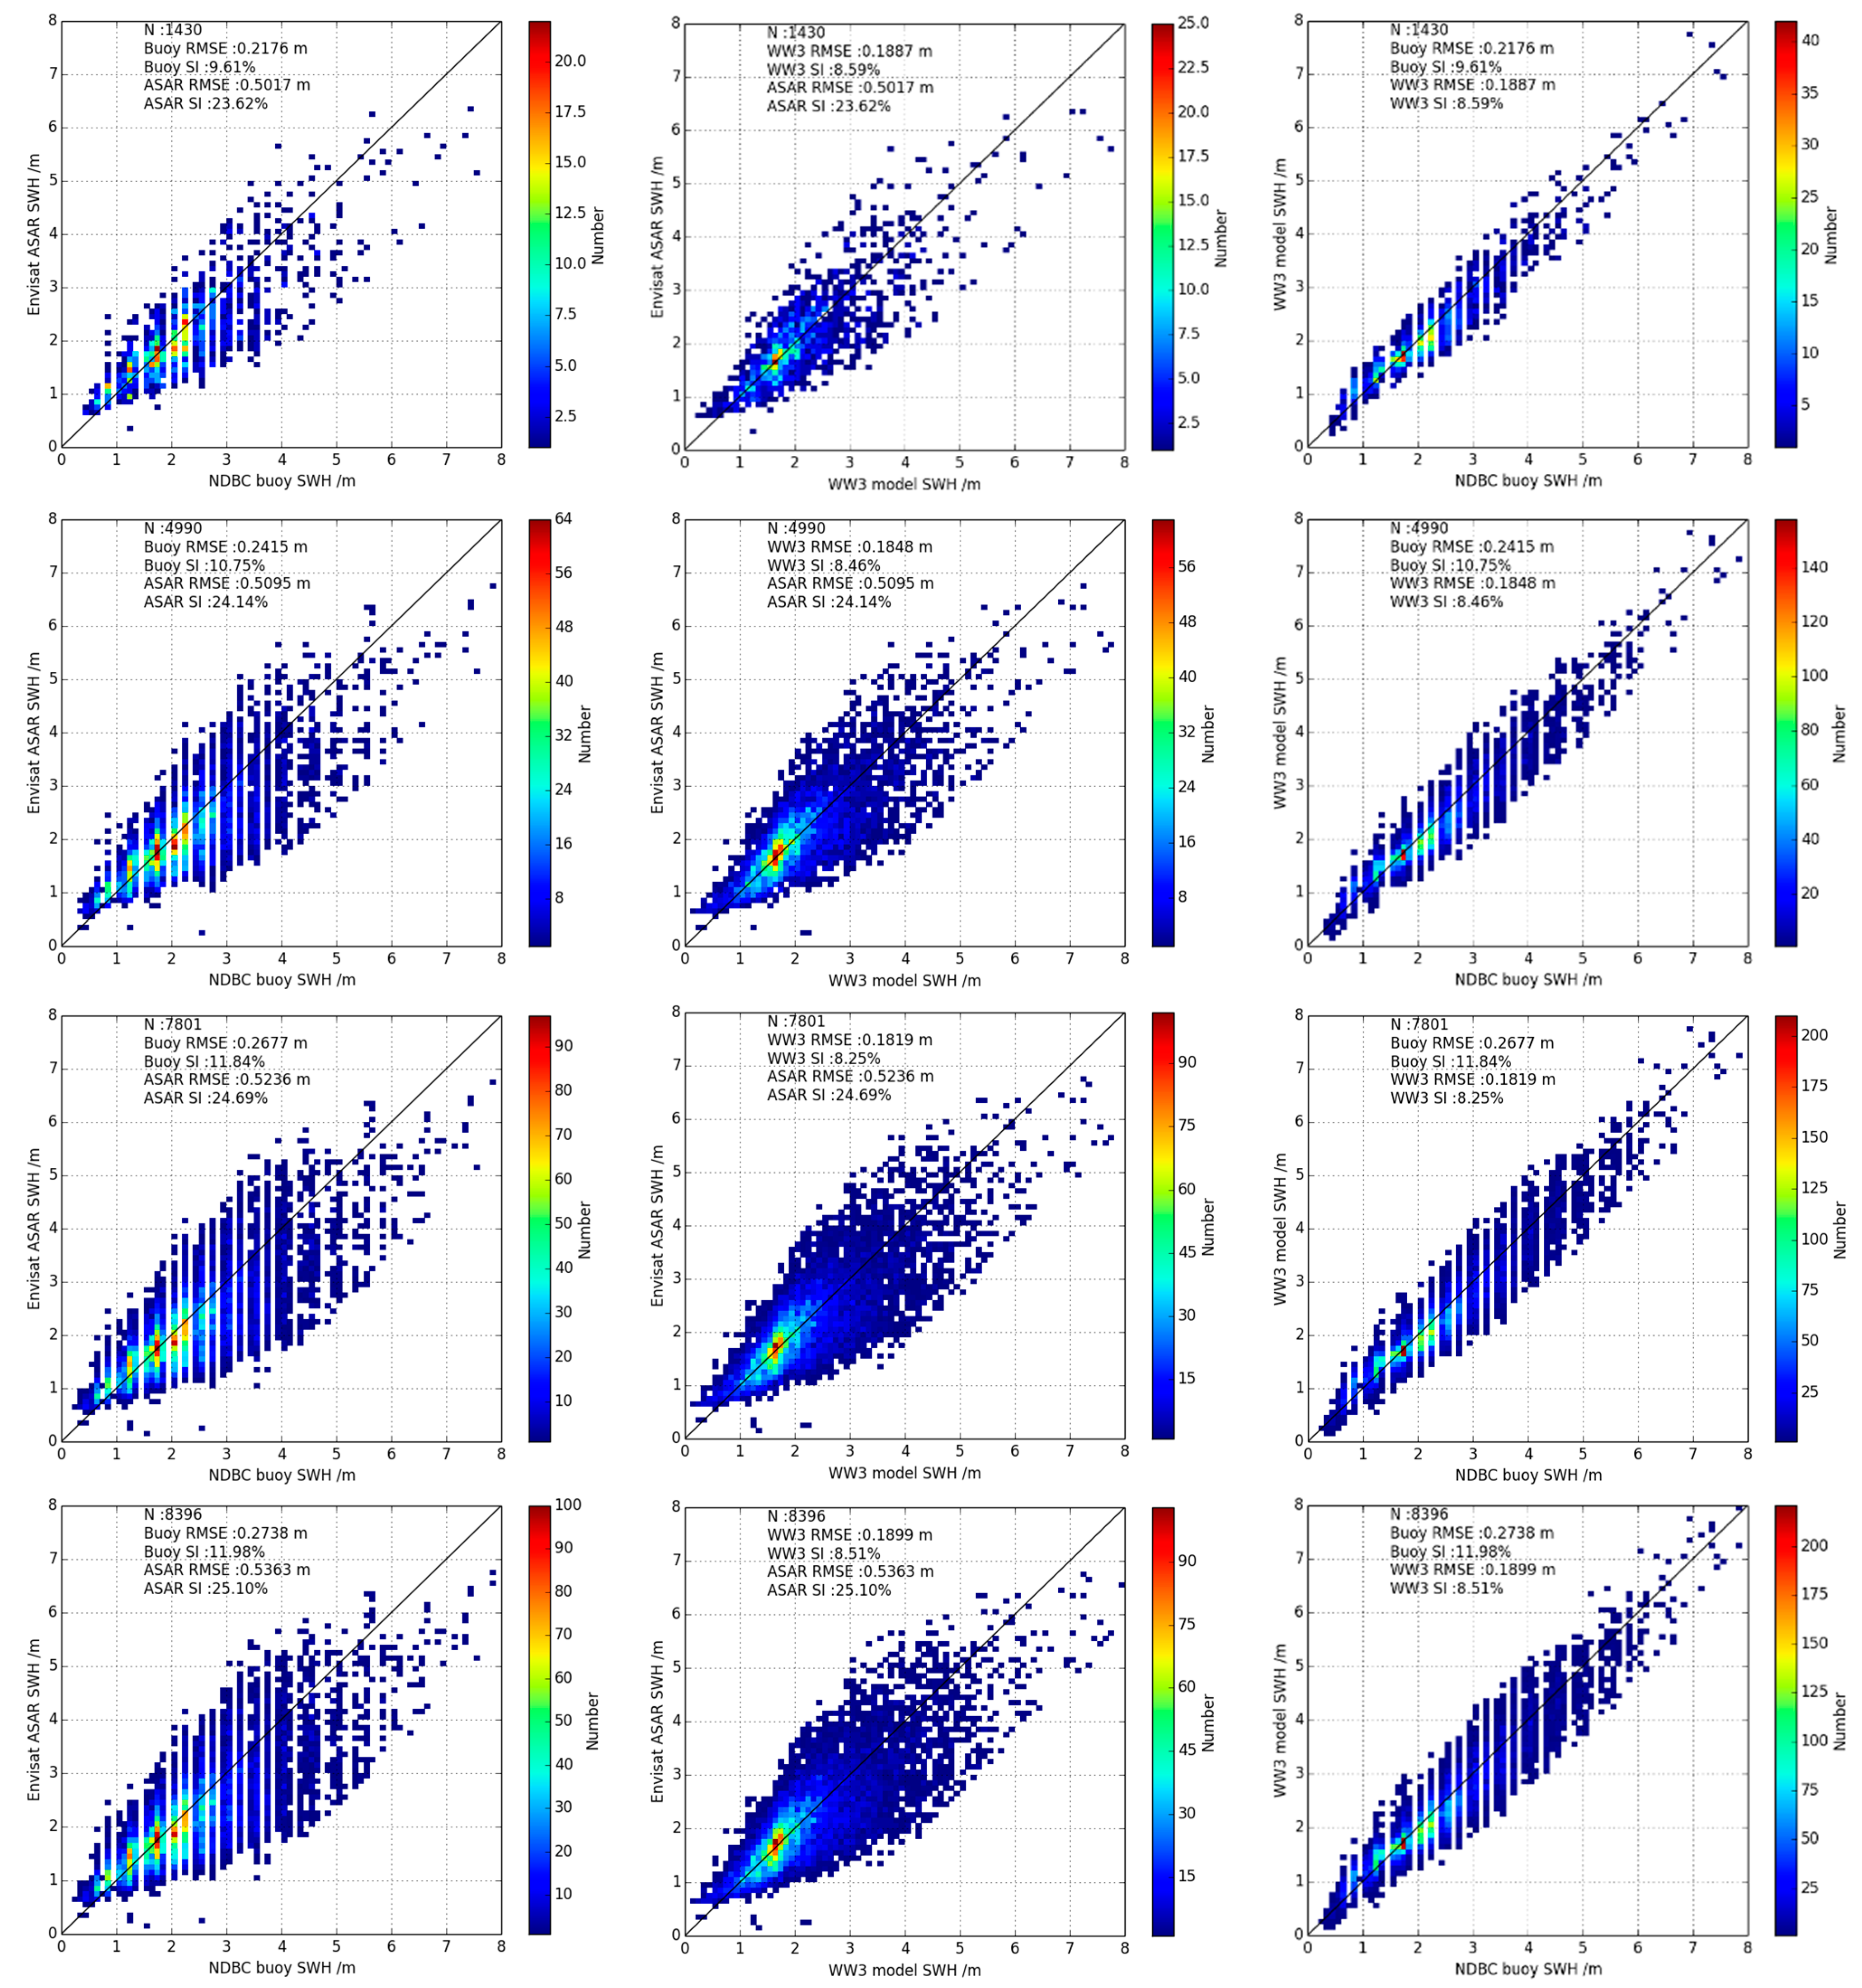
| Collocation Distance (km) | Calibration Coefficients | RMSE (m) | SI | |||||
|---|---|---|---|---|---|---|---|---|
| βASAR | βww3 | RMSEbuoy | RMSEASAR | RMSEww3 | SIbuoy | SIASAR | SIww3 | |
| 50 | 0.9044 | 0.9614 | 0.2176 | 0.5017 | 0.1887 | 9.61% | 23.62% | 8.59% |
| 60 | 0.8989 | 0.9622 | 0.2253 | 0.5131 | 0.1875 | 9.85% | 24.02% | 8.45% |
| 70 | 0.9034 | 0.9637 | 0.2289 | 0.5122 | 0.1799 | 10.05% | 23.97% | 8.14% |
| 80 | 0.9069 | 0.9650 | 0.2376 | 0.5108 | 0.1789 | 10.47% | 23.92% | 8.12% |
| 90 | 0.9091 | 0.9661 | 0.2433 | 0.5094 | 0.1792 | 10.76% | 23.95% | 8.16% |
| 100 | 0.9075 | 0.9663 | 0.2415 | 0.5095 | 0.1848 | 10.75% | 24.14% | 8.46% |
| 110 | 0.9055 | 0.9662 | 0.2442 | 0.5072 | 0.1837 | 10.92% | 24.20% | 8.46% |
| 120 | 0.9057 | 0.9669 | 0.2545 | 0.5167 | 0.1779 | 11.36% | 24.57% | 8.16% |
| 130 | 0.9046 | 0.9666 | 0.2596 | 0.5188 | 0.1790 | 11.55% | 24.61% | 8.19% |
| 140 | 0.9042 | 0.9687 | 0.2669 | 0.5227 | 0.1778 | 11.81% | 24.67% | 8.08% |
| 150 | 0.9049 | 0.9699 | 0.2677 | 0.5236 | 0.1819 | 11.84% | 24.69% | 8.25% |
| 160 | 0.9034 | 0.9712 | 0.2676 | 0.5284 | 0.1870 | 11.78% | 24.82% | 8.43% |
| 170 | 0.9028 | 0.9716 | 0.2700 | 0.5330 | 0.1866 | 11.85% | 24.99% | 8.39% |
| 180 | 0.9024 | 0.9722 | 0.2699 | 0.5343 | 0.1896 | 11.82% | 25.01% | 8.50% |
| 190 | 0.9016 | 0.9719 | 0.2717 | 0.5363 | 0.1910 | 11.89% | 25.09% | 8.55% |
| 200 | 0.9014 | 0.9723 | 0.2738 | 0.5383 | 0.1899 | 11.98% | 25.10% | 8.51% |


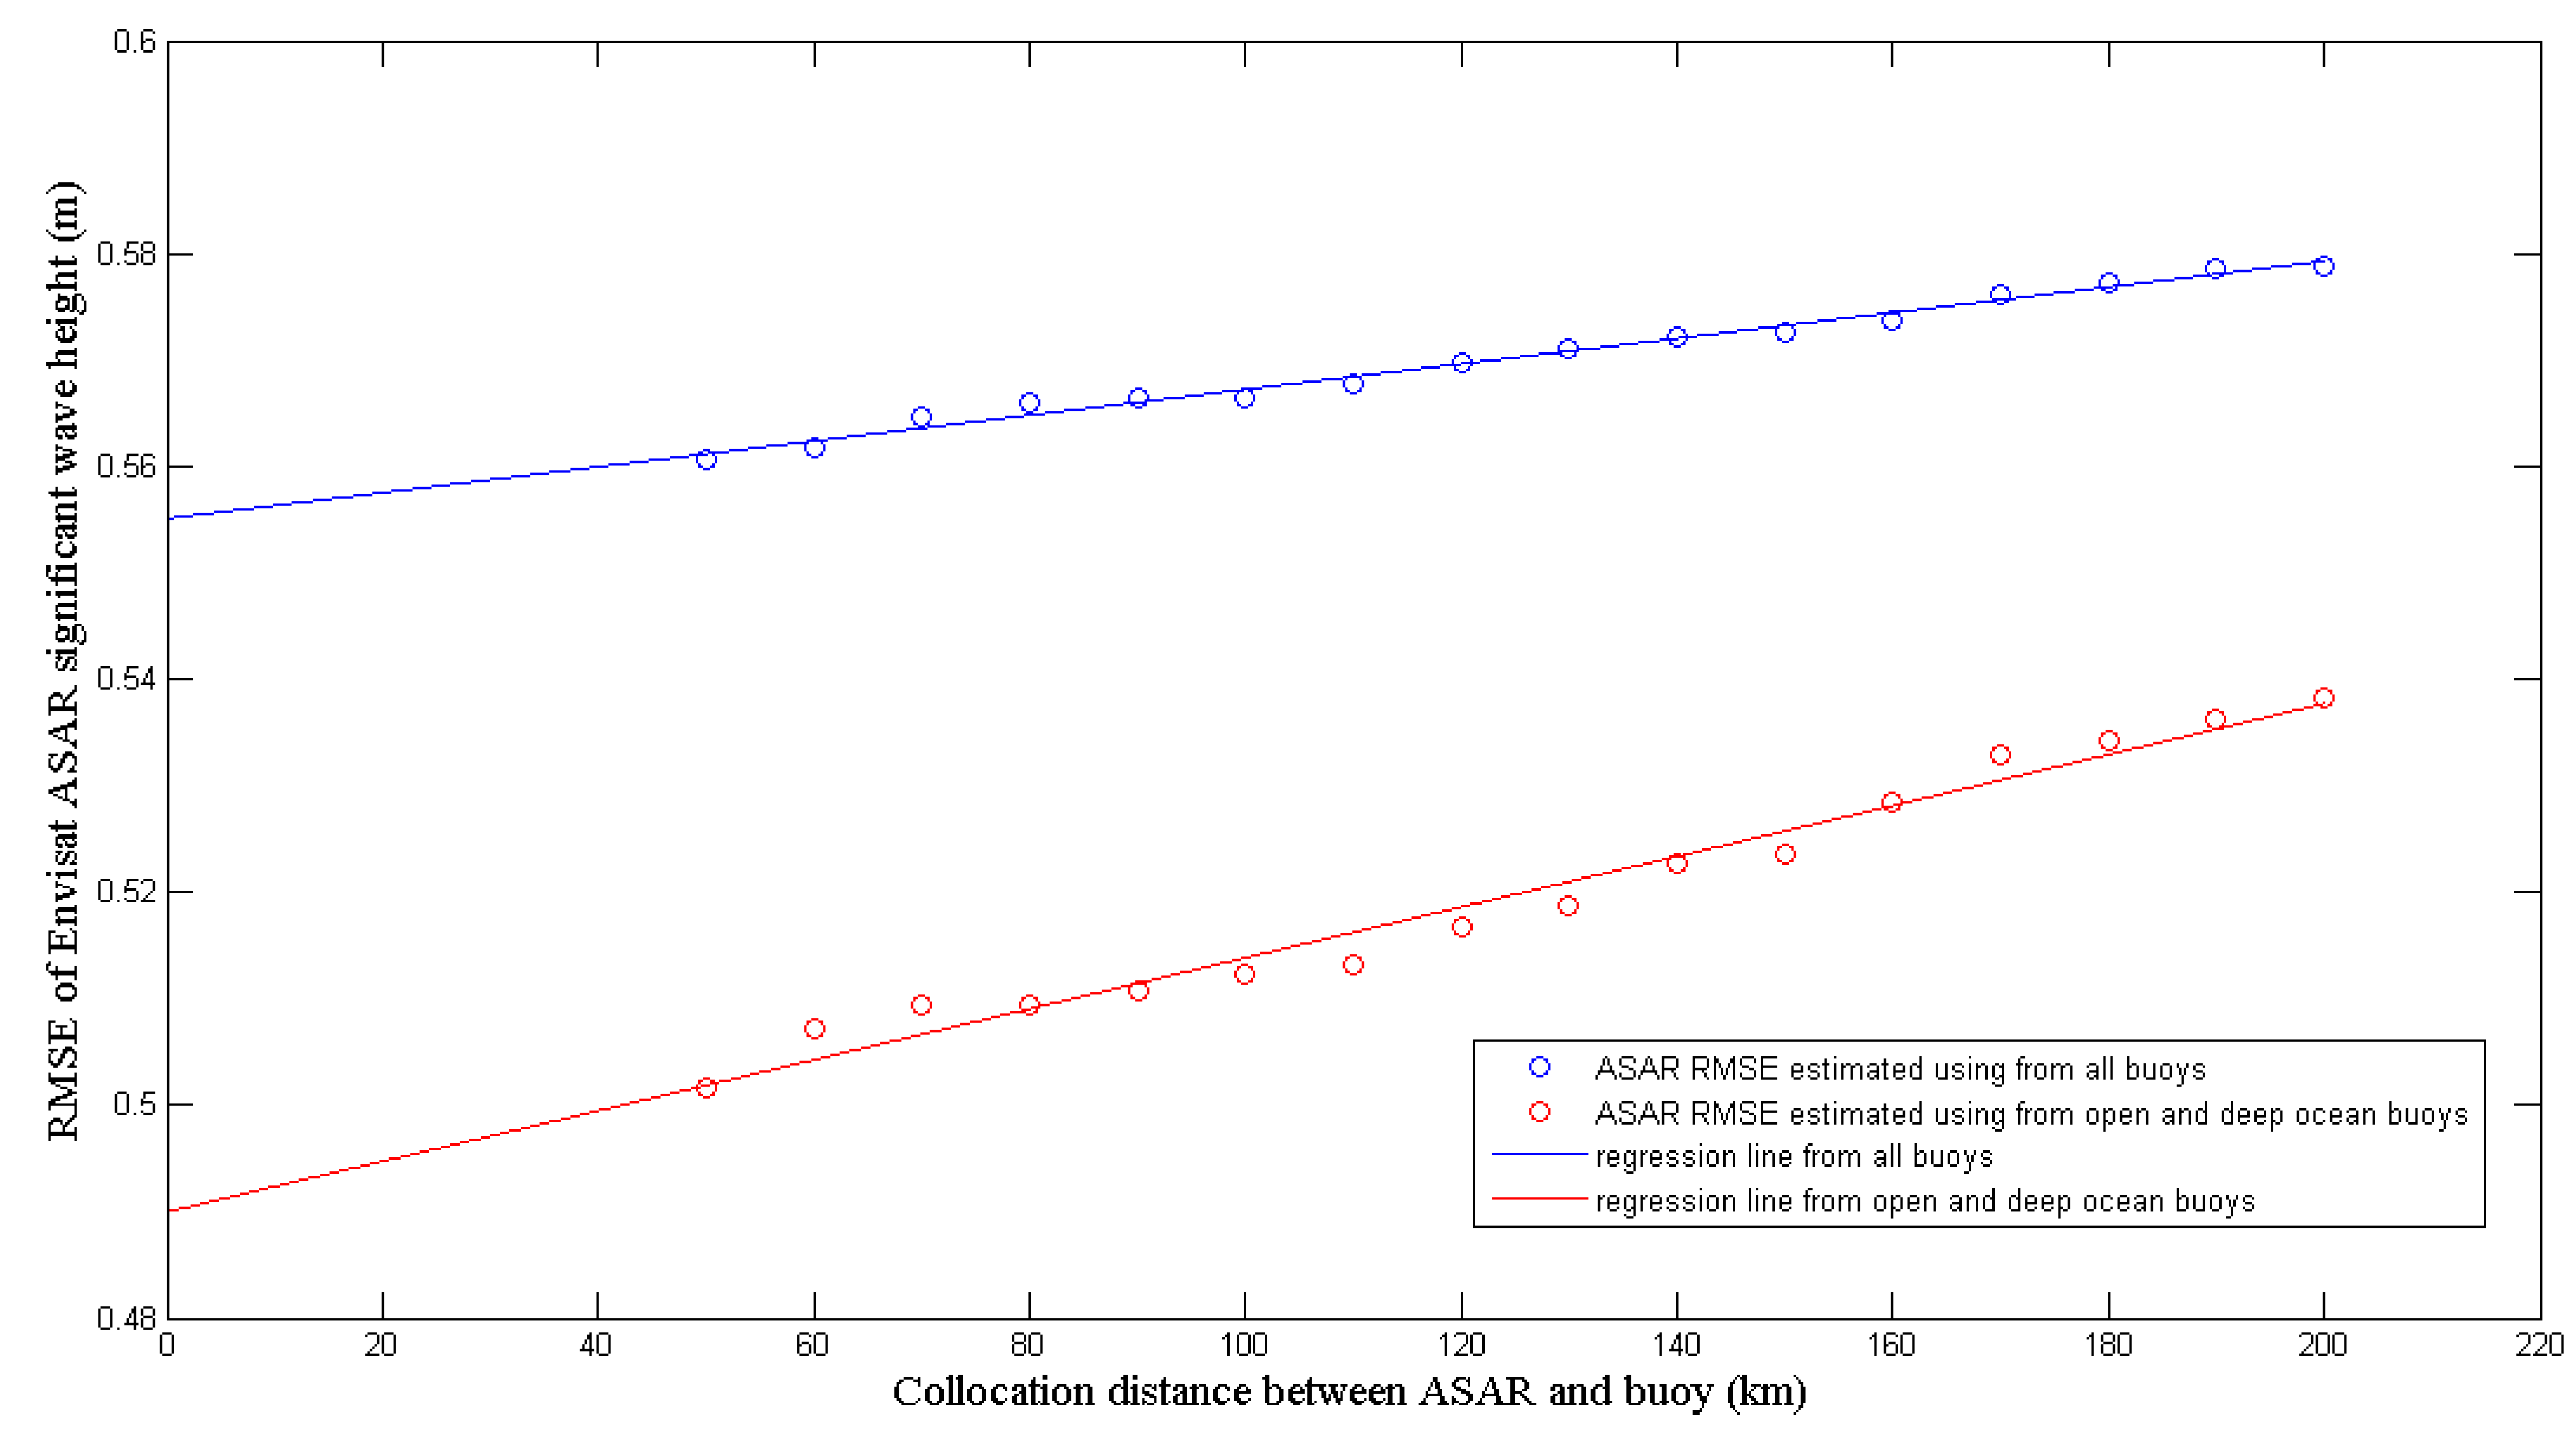
4.3. Error Analysis on Collocation Distance
4.4. Discussion on Error of Envisat ASAR Wave Mode SWH in Coastal Waters
4.5. Discussion on the Triple Collocation Results
5. Conclusions
List of All Acronyms
| ASAR | Advanced Synthetic Aperture Radar |
| CDIP | Coastal Data Information Program |
| Envisat | Environmental Satellite |
| ECMWF | European Centre for Medium-Range Weather Forecasts |
| ERS | European Remote Sensing Satellite |
| IFREMER | Institut Français de Recherche pour l’Exploitation de la Mer |
| IOWAGA | Integrated Ocean Waves for Geophysical and other Applications |
| MEDS | Marine Environmental Data Service |
| MTF | Modulation Transfer Function |
| NDBC | National Data Buoy Centre |
| NOAA | National Oceanic and Atmospheric Administration |
| RAR | Real Aperture Radar |
| RMSE | Root Mean Square Error |
| SAR | Synthetic Aperture Radar |
| SI | Scatter Index |
| SWH | Significant Wave Height |
| ww3 | WaveWatch III |
Acknowledgments
Author Contributions
Conflicts of Interest
References
- Hasselmann, K.; Hasselmann, S. On the nonlinear mapping of an ocean wave spectrum into a synthetic aperture radar image spectrum and its inversion. J. Geophys. Res. 1991, 96, 10713–10729. [Google Scholar]
- Krogstad, H.E.; Barstow, S.F. Satellite wave measurement for coastal engineering applications. Coast. Eng. 1999, 37, 283–307. [Google Scholar] [CrossRef]
- Hasselmann, K.; Chapron, B.; Aouf, L.; Ardhuin, F.; Collard, F.; Engen, G.; Hasselmann, S.; Heimbach, P.; Janssen, P.A.E.M.; Johnsen, H.; et al. The ERS SAR wave mode: A breakthrough in global ocean wave observations. In ERS Missions: 20 Years of Observing Earth, 1st ed.; Fletcher, K., Ed.; European Space Agency: Noordwijk, The Netherlands, 2013; pp. 165–198. [Google Scholar]
- Chapron, B.; Collard, F.; Johnsen, H.; Engen, G. ASAR Wave mode first geophysical results. In Proceedings of 2002 ENVISAT Calibration Review Meeting, ESTEC, Noordwijk, The Netherlands, 9–13 September 2002.
- Li, X.M.; Lehner, S.; Bruns, T. Ocean wave integral parameter measurements using ENVISAT ASAR wave mode data. IEEE Trans. Geosci. Remote Sens. 2011, 49, 155–174. [Google Scholar] [CrossRef]
- Li, X.M.; Lehner, S.; Bruns, T. Simultaneous measurements of global ocean waves by ASAR and Radar Altimeter onboard ENVISAT. IEEE Trans. Geosci. Remote Sens. 2014, 52, 2508–2518. [Google Scholar] [CrossRef]
- Malenovsky, Z.; Rott, H.; Cihlar, J.; Schaepman, M.; Garcia-Santos, G.; Fernandes, R.; Berger, M. Sentinels for science: Potential of Sentinel-1, -2, and -3 missions for scientific observations of ocean, cryosphere, and land. Remote Sens. Environ. 2012, 120, 91–101. [Google Scholar] [CrossRef]
- Husson, R.; Mouche, A.; Collard, F.; Johnsen, H.; Grouazel, A.; Chapron, B.; Coat, M.; Vincent, P.; Hajduch, G. Sentinel-1 advanced capabilities for improved wave spectra estimation and beyond. In Proceedings of the 2014 Waves in Shallow Water Environment Meeting, Reading, UK, 8–12 June 2014.
- Aouf, L.; Lefevre, J.M.; Hauser, D.; Chapron, B. On the combined assimilation of RA-2 and ASAR wave data for the improvement of wave forecasting. In Proceedings of the 2006 15 Years of Radar Altimetry Symposium, Venice, Italy, 13–18 March 2006.
- Ardhuin, F.; Chapron, B.; Collard, F. Observation of swell dissipation across oceans. Geophys. Res. Lett. 2009, 36. [Google Scholar] [CrossRef]
- De Farias, E.G.G.; Lorenzzetti, J.A.; Bentamy, A.; Chapron, B.; Husson, R. Fuzzy logic applied to track generation areas of swell systems observed by SAR. IEEE Trans. Geosci. Remote Lett. 2012, 9, 841–845. [Google Scholar] [CrossRef]
- Voorrips, A.G.; Mastenbroek, C.; Hansen, B. Validation of two algorithms to retrieve ocean wave spectra from ERS synthetic aperture radar. J. Geophys. Res. 2001, 106, 16825–16840. [Google Scholar] [CrossRef]
- Violante-Carvalho, N.; Robinson, I.S.; Schulz-Stellenfleth, J. Assessment of ERS synthetic aperture radar wave spectra retrieved from the Max-Planck-Institut (MPI) scheme through intercomparisons of 1 year of directional buoy measurements. J. Geophys. Res. 2005, 110. [Google Scholar] [CrossRef]
- Collard, F.; Ardhuin, F.; Chapron, B. Monitoring and analysis of ocean swell fields from space: New methods for routine observations. J. Geophys. Res. 2009, 114. [Google Scholar] [CrossRef]
- Wang, H.; Zhu, J.H.; Yang, J.S.; Shi, C.Y. A semiempirical algorithm for SAR wave height retrieval and its validation using Envisat ASAR wave mode data. Acta Oceanol. Sin. 2012, 31, 59–66. [Google Scholar]
- Zhang, B.; Perrie, W.; He, Y.J. Remote sensing of ocean waves by along-track interferometric synthetic aperture radar. J. Geophys. Res. 2009, 114. [Google Scholar] [CrossRef]
- Zhang, B.; Perrie, W.; He, Y.J. Validation of RADARSAT-2 fully polarimetric SAR measurements of ocean surface waves. J. Geophys. Res. 2010, 115. [Google Scholar] [CrossRef]
- Heimback, P.; Hasselmann, S.; Hasselmann, K. Statistical analysis and intercomparison of WAM model data with global ERS-1 SAR wave mode spectral retrievals over 3 years. J. Geophys. Res. 1998, 103, 7931–7977. [Google Scholar] [CrossRef]
- Li, X.M.; KönigKonig, T.; Schulz-Stellenfleth, J.; Lehner, S. Validation and intercomparison of ocean wave spectra inversion schemes using ASAR wave mode data. Int. J. Remote Sens. 2010, 31, 4969–4993. [Google Scholar] [CrossRef]
- Krogstad, H.E.; Wolf, J.; Thompson, S.P.; Wyatt, L.R. Methods for intercomparison of wave measurements. Coast. Eng. 1999, 37, 235–257. [Google Scholar] [CrossRef]
- Stoffelen, A. Toward the true near-surface wind speed: Error modeling and calibration using triple collocation. J. Geophys. Res. 1998, 103, 7755–7766. [Google Scholar] [CrossRef]
- Portabella, M.; Stoffelen, A. On scatterometer ocean stress. J. Atmos. Ocean. Technol. 2009, 26, 368–382. [Google Scholar] [CrossRef]
- Vogelzang, J.; Stoffelen, A.; Verhoef, A.; Figa-SaldañaSaldana, J. On the quality of high-resolution scatterometer winds. J. Geophys. Res. 2011, 116. [Google Scholar] [CrossRef]
- Chakraborty, A.; Kumar, R.; Stoffelen, A. Validation of ocean surface winds from the OCEANSAT-2 scatterometer using triple collocation. Remote Sens. Lett. 2013, 4, 85–94. [Google Scholar]
- Caires, S.; Sterl, A. Validation of ocean wind and wave data using triple collocation. J. Geophys. Res. 2003, 108. [Google Scholar] [CrossRef]
- Janssen, P.A.E.M.; Abdalla, S.; Hersbach, H.; Bidlot, J.R. Error estimates of buoy, satellite, and model wave height data. J. Atmos. Ocean. Technol. 2007, 24, 1665–1677. [Google Scholar] [CrossRef]
- Abdalla, S.; Janssen, P.A.E.M.; Bidlot, J.R. Altimeter near real time wind and wave products: Random error estimation. Mar. Geod. 2011, 34, 393–406. [Google Scholar] [CrossRef]
- Chen, G.; Lin, H. Impacts of collocation window on the accuracy of altimeter/buoy wind-speed comparison—A simulation study. Int. J. Remote Sens. 2001, 22, 35–44. [Google Scholar] [CrossRef]
- Chen, G.; Xu, P.; Fang, C.Y. Numerical simulation on the choice of space and time windows for altimeter/buoy comparison of significant wave height. In Proceedings of the 2000 IEEE International Geoscience and Remote Sensing Symposium, Honolulu, HI, USA, 24–28 July 2000.
- Engen, G.; Johnsen, H.; HøgdaHogda, K.A.; Chapron, B.; Collard, F. Envisat ASAR Level 2 Wave Mode Product Algorithm Specification—Software Requirements Document (Version 2.2.9); ESA ESTEC Contract “Envisat ASAR Wind & Wave Measurements from Level 1 Product” Report; Norut IT: Tromsø, Norway, 2005. [Google Scholar]
- Chapron, B.; Johnsen, H.; Garello, R. Wave and wind retrieval from SAR images of the ocean. Ann. Telecommun. 2001, 56, 682–699. [Google Scholar]
- Engen, G.; Johnsen, H. SAR-ocean wave inversion using image cross spectra. IEEE Trans. Geosci. Remote Sens. 1995, 33, 1047–1056. [Google Scholar] [CrossRef]
- Ardhuin, F.; Hanafin, J.; Quilfen, Y.; Chapron, B.; Queffeulou, P.; Obrebski, M.; Sienkiewicz, J.; Vandemark, D. Calibration of the “IOWAGA” global wave hindcast (1991–2011) using ECMWF and CFSR wind. In Proceedings of the 2011 International Workshop on Wave Hindcasting and Forecasting and 3rd Coastal Hazard Symposium, Kona, HI, USA, 30 October–4 November 2011.
- Rascle, N.; Ardhuin, F.; Queffeulou, P.; Croize-Fillon, D. A global wave parameter database for geophysical applications. Part 1: Wave-current-turbulence interaction parameters for the open ocean based on traditional parameterizations. Ocean Model. 2008, 25, 154–171. [Google Scholar] [CrossRef]
- Ardhuin, F.; Rogers, E.; Babanin, A.V.; Filipot, J.R.; Magne, R.; Roland, A.; Van der Westhuysen, A.J.; Queffeulou, P.; Lefevre, J.M.; Aouf, L.; et al. Semiempirical dissipation source functions for ocean waves. Part I: Definition, calibration, and validation. J. Phys. Oceanogr. 2010, 40, 1917–1941. [Google Scholar] [CrossRef]
- Marsden, R.F. A proposal for a neutral regression. J. Atmos. Ocean. Technol. 1999, 16, 876–883. [Google Scholar] [CrossRef]
- Zwieback, S.; Scipal, K.; Dorigo, W.; Wagner, W. Structural and statistical properties of the collocation technique for error characterization. Nonlin. Process. Geophys. 2012, 19, 69–80. [Google Scholar] [CrossRef] [Green Version]
- Collard, F.; Ardhuin, F.; Chapron, B. Extraction of coastal ocean wave fields from SAR images. IEEE J. Ocean. Eng. 2005, 30, 526–533. [Google Scholar] [CrossRef]
- Johnsen, H.; Collard, F. Sentinel-1 Ocean Swell Wave Spectra (OSW) Algorithm Definition; Sentinel-1 IPF Development (Project No.: 355) Report; Norut IT: Tromsø, Norway, 2010. [Google Scholar]
© 2014 by the authors; licensee MDPI, Basel, Switzerland. This article is an open access article distributed under the terms and conditions of the Creative Commons Attribution license (http://creativecommons.org/licenses/by/4.0/).
Share and Cite
Wang, H.; Zhu, J.; Yang, J. Error Analysis on ESA’s Envisat ASAR Wave Mode Significant Wave Height Retrievals Using Triple Collocation Model. Remote Sens. 2014, 6, 12217-12233. https://doi.org/10.3390/rs61212217
Wang H, Zhu J, Yang J. Error Analysis on ESA’s Envisat ASAR Wave Mode Significant Wave Height Retrievals Using Triple Collocation Model. Remote Sensing. 2014; 6(12):12217-12233. https://doi.org/10.3390/rs61212217
Chicago/Turabian StyleWang, He, Jianhua Zhu, and Jingsong Yang. 2014. "Error Analysis on ESA’s Envisat ASAR Wave Mode Significant Wave Height Retrievals Using Triple Collocation Model" Remote Sensing 6, no. 12: 12217-12233. https://doi.org/10.3390/rs61212217
APA StyleWang, H., Zhu, J., & Yang, J. (2014). Error Analysis on ESA’s Envisat ASAR Wave Mode Significant Wave Height Retrievals Using Triple Collocation Model. Remote Sensing, 6(12), 12217-12233. https://doi.org/10.3390/rs61212217