Earth Observation Based Assessment of the Water Production and Water Consumption of Nile Basin Agro-Ecosystems


Abstract
:
1. Introduction
2. Materials and Methods
3. Results
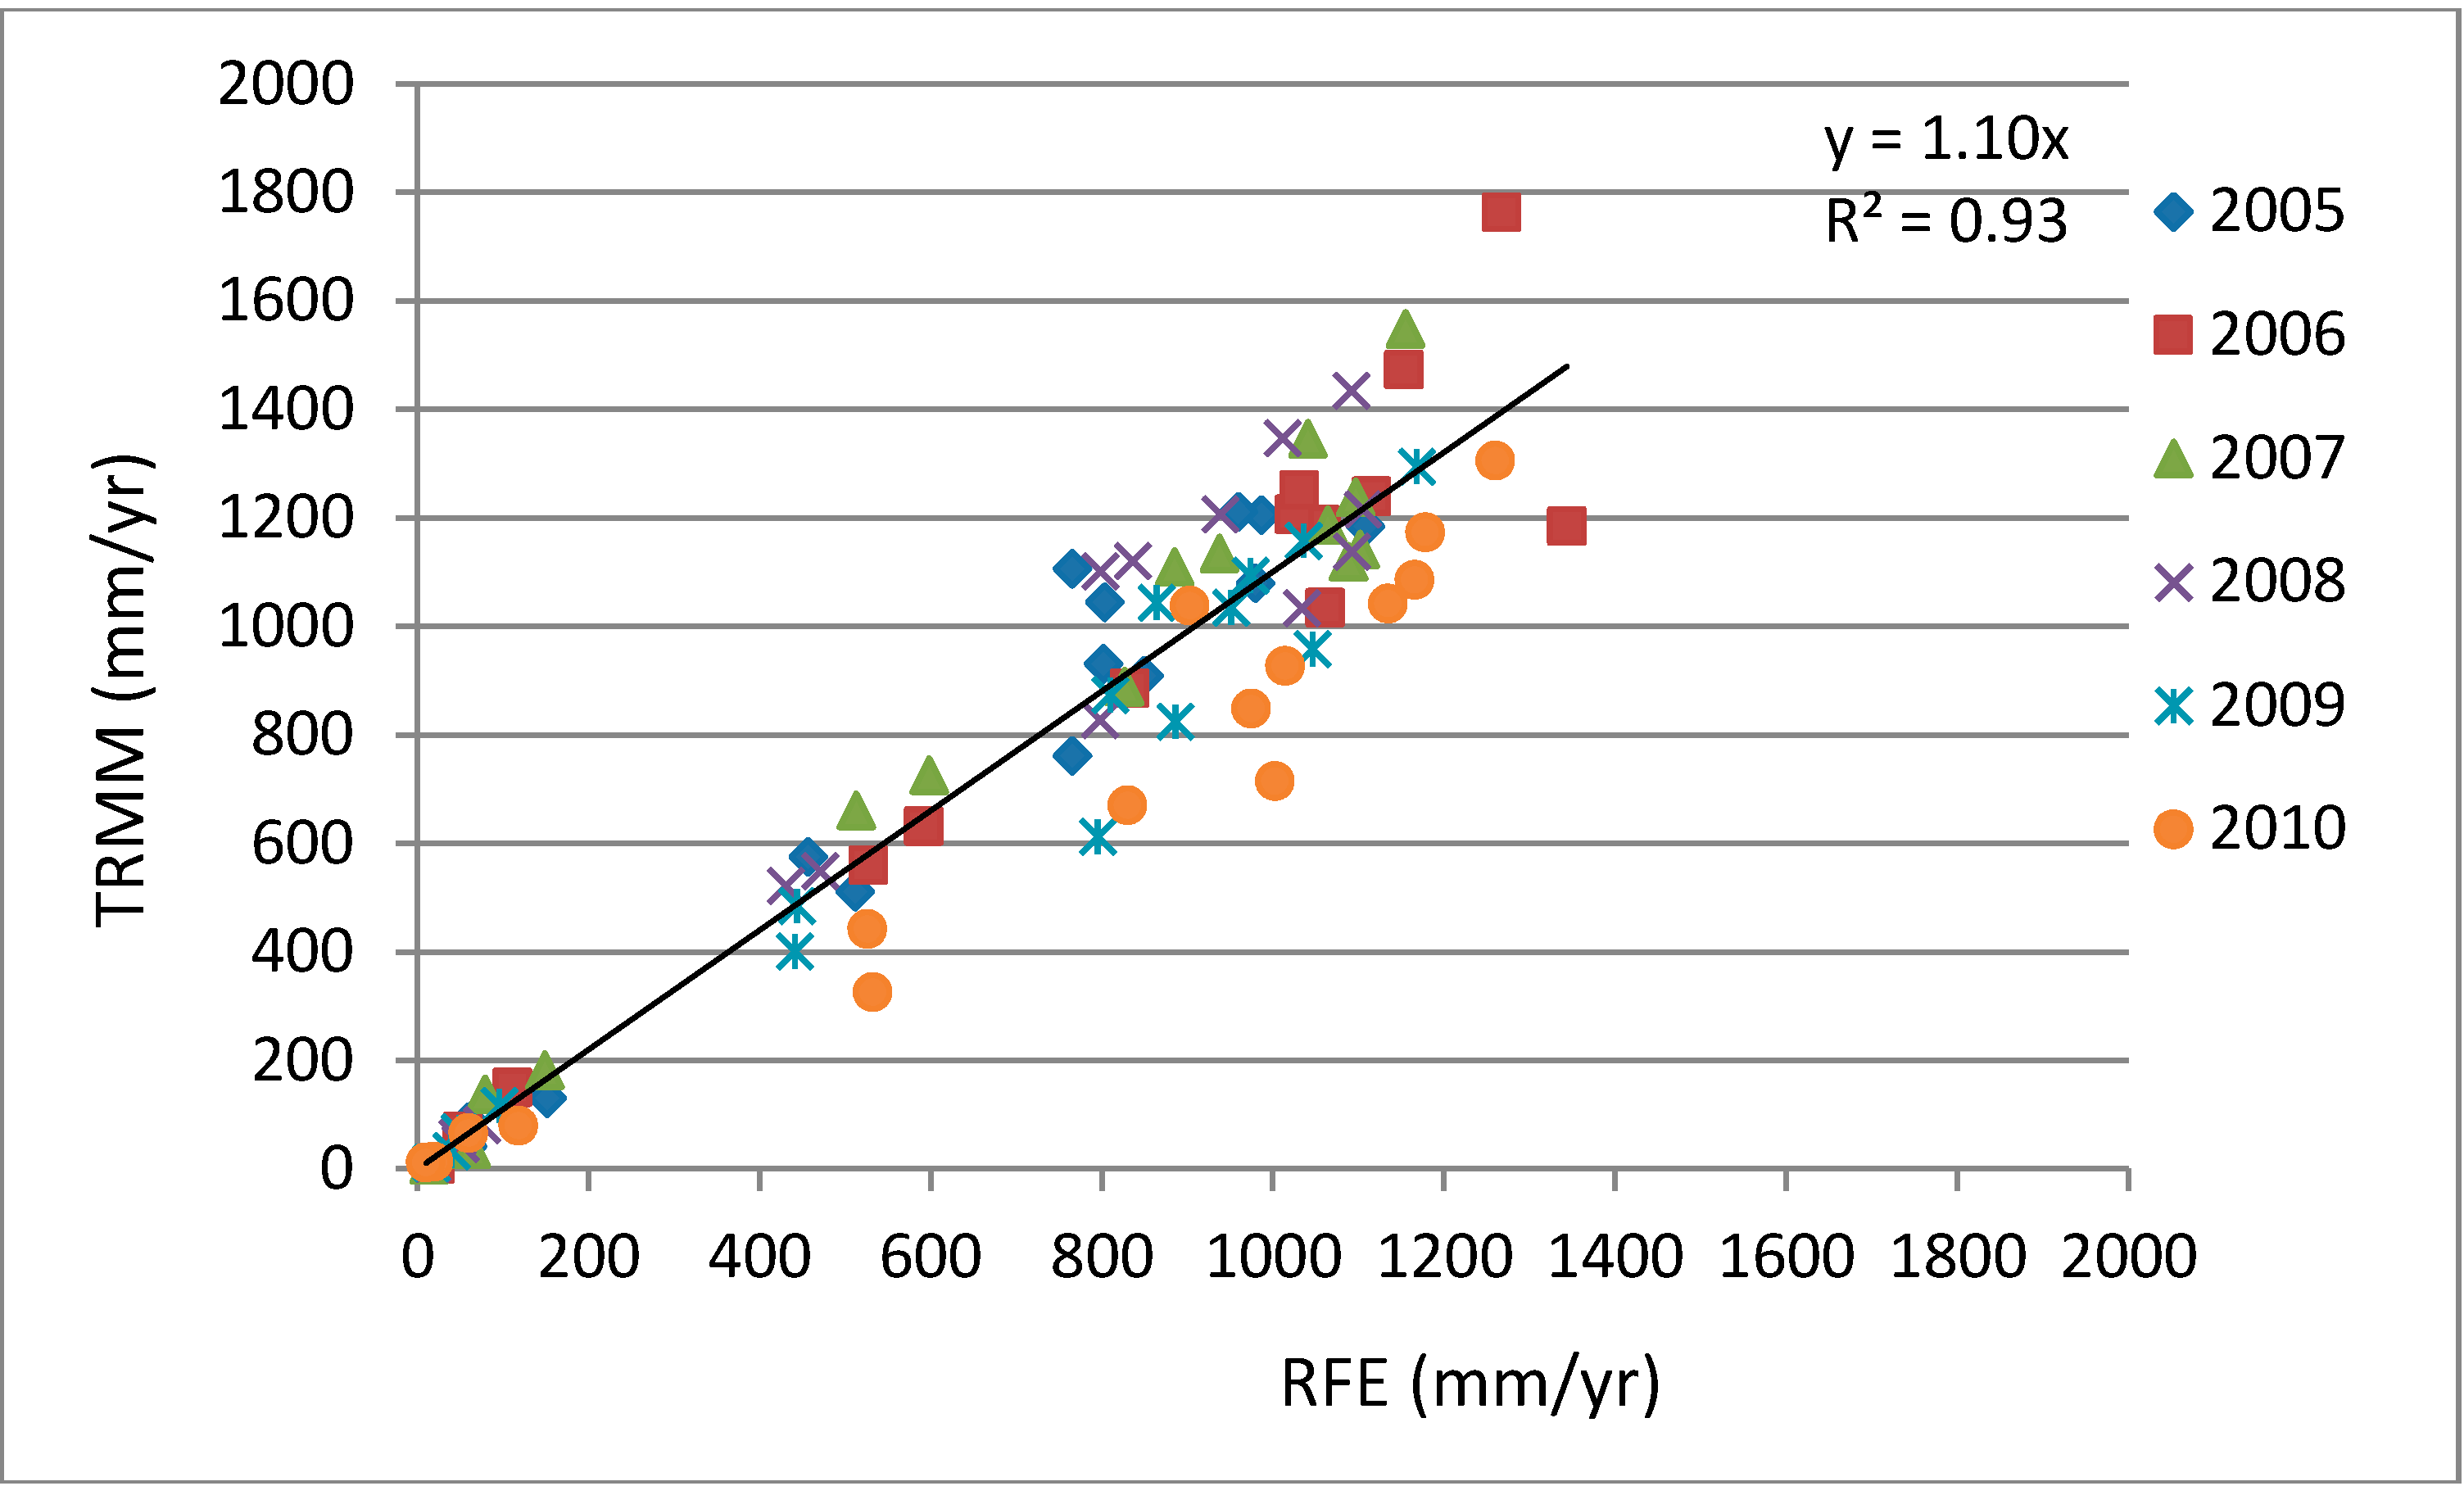
3.1. Rainfall


| Sub-Basin | Area (km2) | Jan | Feb | Mar | Apr | May | Jun | Jul | Aug | Sep | Oct | Nov | Dec | Total (mm) |
|---|---|---|---|---|---|---|---|---|---|---|---|---|---|---|
| Main Nile 1 | 39.896 | 9 | 10 | 5 | 4 | 2 | 0 | 0 | 0 | 0 | 3 | 2 | 6 | 40 |
| Main Nile 2 | 199.564 | 2 | 2 | 2 | 2 | 2 | 0 | 0 | 0 | 0 | 0 | 1 | 2 | 13 |
| Main Nile 3 | 743.913 | 1 | 0 | 0 | 1 | 2 | 3 | 21 | 31 | 8 | 1 | 0 | 0 | 70 |
| Tekezze-Atbara | 231.492 | 3 | 2 | 9 | 20 | 31 | 58 | 150 | 155 | 74 | 19 | 3 | 2 | 524 |
| Main Nile 4 | 35.338 | 0 | 0 | 0 | 2 | 7 | 5 | 31 | 51 | 19 | 4 | 0 | 0 | 121 |
| Blue Nile | 307.262 | 6 | 11 | 22 | 36 | 87 | 138 | 231 | 225 | 140 | 63 | 14 | 6 | 978 |
| Lower White Nile | 237.429 | 1 | 1 | 1 | 13 | 31 | 68 | 131 | 129 | 83 | 54 | 4 | 0 | 517 |
| Bahr el Ghazal | 549.714 | 4 | 6 | 19 | 47 | 78 | 107 | 149 | 176 | 124 | 70 | 14 | 3 | 795 |
| Sudd | 167.354 | 8 | 12 | 32 | 76 | 118 | 135 | 148 | 160 | 137 | 103 | 32 | 7 | 968 |
| Baro-Akobo-Sobat | 230.368 | 23 | 22 | 50 | 94 | 130 | 119 | 140 | 140 | 134 | 111 | 62 | 27 | 1051 |
| Albert Nile-Bahr al Jabal | 80.432 | 18 | 41 | 79 | 126 | 143 | 98 | 119 | 132 | 140 | 114 | 75 | 36 | 1121 |
| Victoria Nile | 86.192 | 39 | 65 | 111 | 142 | 134 | 68 | 92 | 105 | 131 | 123 | 98 | 58 | 1166 |
| Semliki-L.Albert | 70.646 | 55 | 90 | 121 | 109 | 99 | 50 | 54 | 93 | 122 | 120 | 118 | 64 | 1095 |
| Lake Victoria | 191.317 | 104 | 105 | 163 | 167 | 136 | 53 | 45 | 58 | 88 | 101 | 140 | 125 | 1285 |
| Kagera | 58.115 | 98 | 133 | 142 | 128 | 86 | 19 | 14 | 26 | 57 | 74 | 122 | 89 | 986 |
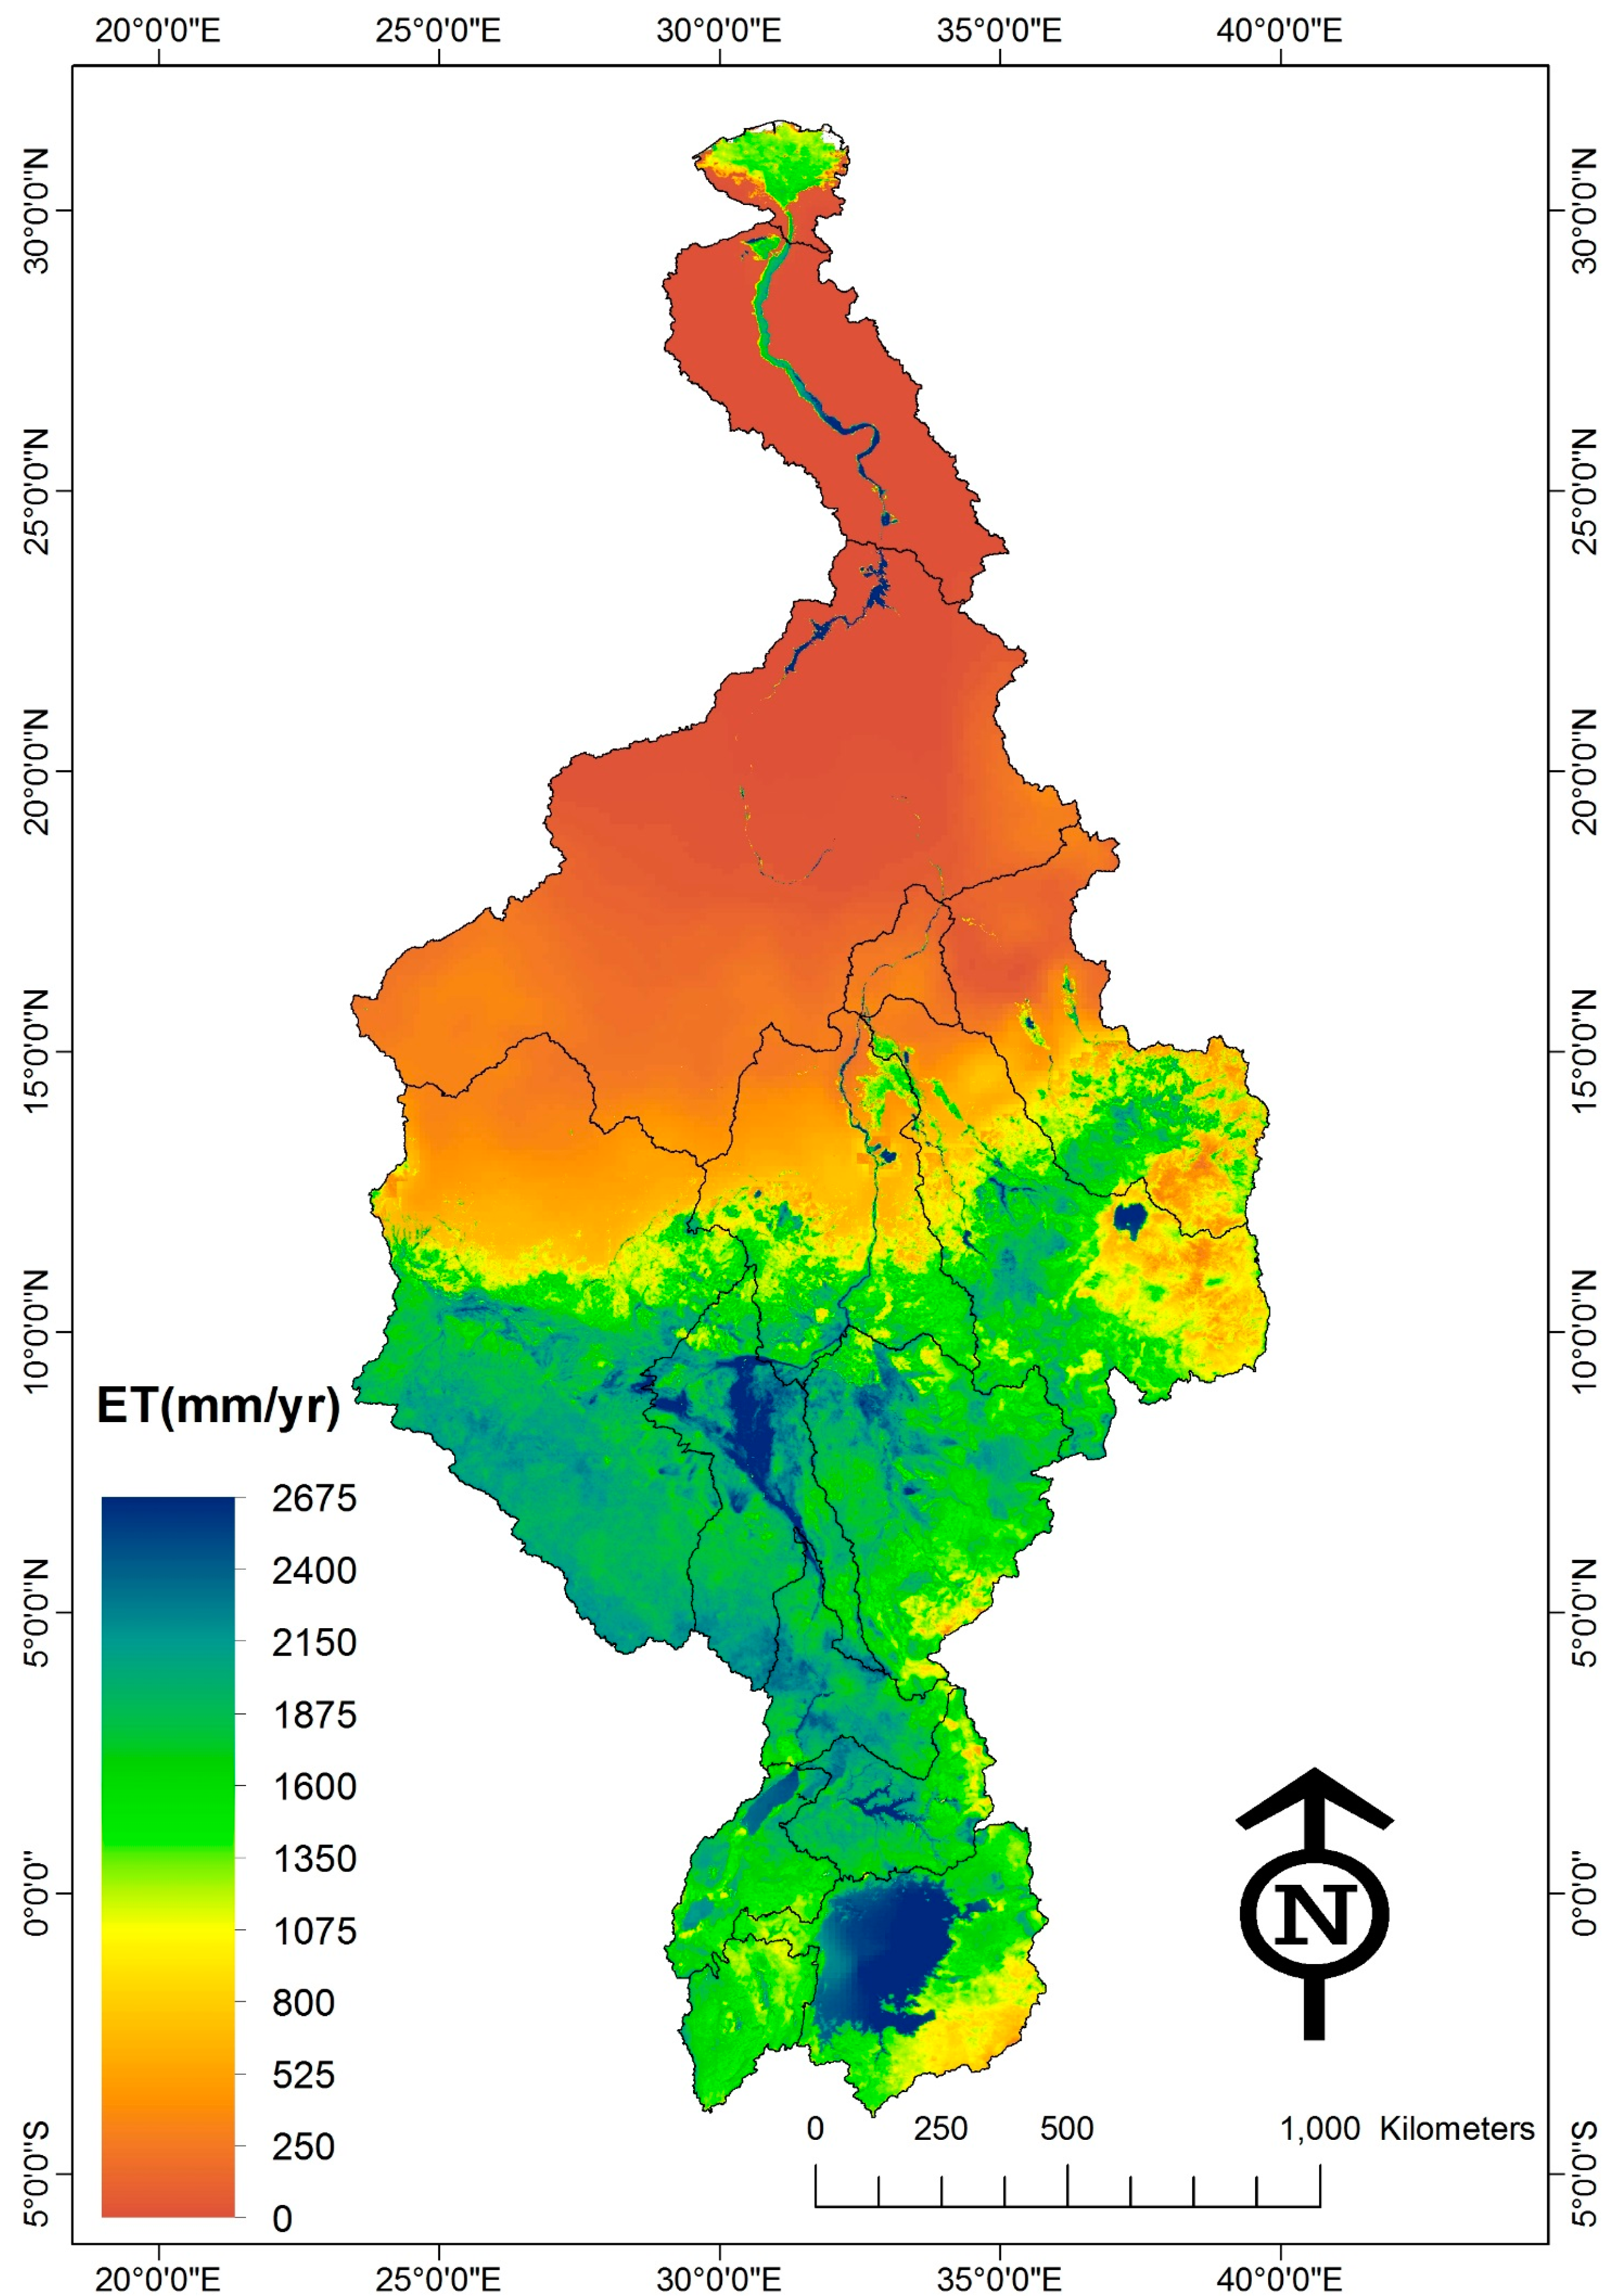
3.2. Actual Evapotranspiration
| Sub-Basin | Area (km2) | Jan | Feb | Mar | Apr | May | Jun | Jul | Aug | Sep | Oct | Nov | Dec | Total (mm) |
|---|---|---|---|---|---|---|---|---|---|---|---|---|---|---|
| Main Nile 1 | 39,896 | 13 | 21 | 36 | 49 | 46 | 60 | 76 | 75 | 45 | 24 | 15 | 11 | 472 |
| Main Nile 2 | 199,564 | 3 | 4 | 6 | 8 | 8 | 9 | 10 | 10 | 7 | 4 | 3 | 2 | 74 |
| Main Nile 3 | 743,913 | 1 | 1 | 1 | 1 | 3 | 10 | 28 | 30 | 11 | 5 | 3 | 1 | 97 |
| Tekezze-Atbara | 231,492 | 19 | 15 | 15 | 16 | 23 | 53 | 79 | 79 | 70 | 44 | 23 | 18 | 453 |
| Main Nile 4 | 35,338 | 2 | 2 | 3 | 3 | 7 | 18 | 51 | 61 | 25 | 5 | 1 | 1 | 180 |
| Blue Nile | 307,262 | 45 | 38 | 37 | 39 | 52 | 72 | 89 | 87 | 90 | 83 | 57 | 47 | 737 |
| Lower White Nile | 237,429 | 35 | 29 | 25 | 22 | 34 | 62 | 95 | 100 | 80 | 64 | 38 | 34 | 617 |
| Bahr el Ghazal | 549,714 | 51 | 48 | 53 | 50 | 68 | 81 | 93 | 95 | 88 | 80 | 62 | 53 | 823 |
| Sudd | 167,354 | 97 | 87 | 86 | 79 | 102 | 105 | 104 | 103 | 109 | 119 | 114 | 103 | 1,209 |
| Baro-Akobo-Sobat | 230,368 | 87 | 70 | 65 | 70 | 82 | 82 | 86 | 82 | 92 | 106 | 99 | 91 | 1,012 |
| Albert Nile-Bahr al Jabal | 80,432 | 85 | 72 | 88 | 87 | 105 | 100 | 94 | 93 | 105 | 114 | 113 | 88 | 1,144 |
| Victoria Nile | 86,192 | 93 | 77 | 90 | 89 | 91 | 85 | 82 | 84 | 90 | 101 | 99 | 86 | 1,067 |
| Semliki-L.Albert | 70,646 | 92 | 82 | 90 | 86 | 86 | 83 | 78 | 78 | 84 | 88 | 90 | 87 | 1,023 |
| Lake Victoria | 191,317 | 96 | 90 | 102 | 95 | 89 | 82 | 80 | 79 | 83 | 86 | 88 | 85 | 1,056 |
| Kagera | 58,115 | 77 | 67 | 82 | 83 | 82 | 73 | 68 | 69 | 68 | 71 | 79 | 71 | 891 |

| FAO-Nile | Adjusted SSEBop Model | |||||||
|---|---|---|---|---|---|---|---|---|
| Description | Area | ET | ET | Description | Area | ET | ET | Dev |
| (km2) | (km3/yr) | (mm/yr) | (km2) | (km3/yr) | (mm/yr) | (%) | ||
| Main Nile d/s Atbara | 877,866 | 108.8 | 124 | Main Nile 1,2,3 | 98,3375 | 105.7 | 107 | 13.3 |
| Atbara | 237,044 | 94.1 | 397 | Tekezze-Atbara | 231,492 | 104.8 | 453 | −14.0 |
| Main Nile d/s Khartoum | 34,523 | 7.3 | 211 | Main Nile 4 | 35,338 | 6.4 | 180 | 14.7 |
| Blue Nile | 308,198 | 266.0 | 863 | Blue Nile | 307,262 | 226.4 | 737 | 14.6 |
| White Nile | 260,943 | 144.5 | 554 | Lower White Nile | 237,429 | 146.4 | 617 | −11.4 |
| Bahr el Ghazal & el Arab | 606,428 | 454.1 | 749 | Bahr el Ghazal - Sudd | 717,069 | 654.7 | 913 | −21.9 |
| Pibor-Akabo-Sobat | 246,779 | 223.8 | 907 | Baro-Akobo-Sobat | 230,369 | 233.2 | 1012 | −11.6 |
| Bahr el Jebel | 136,400 | 163.1 | 1,196 | Albert Nile-Bahr - al Jabal | 80,433 | 92.0 | 1144 | 4.3 |
| Kyoga-Albert | 197,253 | 221.6 | 1,124 | Victoria Nile Semliki - L.Albert | 156,839 | 164.2 | 1047 | 6.8 |
| Lake Victoria basin | 264,985 | 307.5 | 1,160 | Lake VictoriaKagera | 249,433 | 253.8 | 1018 | 12.3 |
| Total and average | 3,170,419 | 1990.8 | 628 | 3,229,039 | 1987.6 | 616 | ||
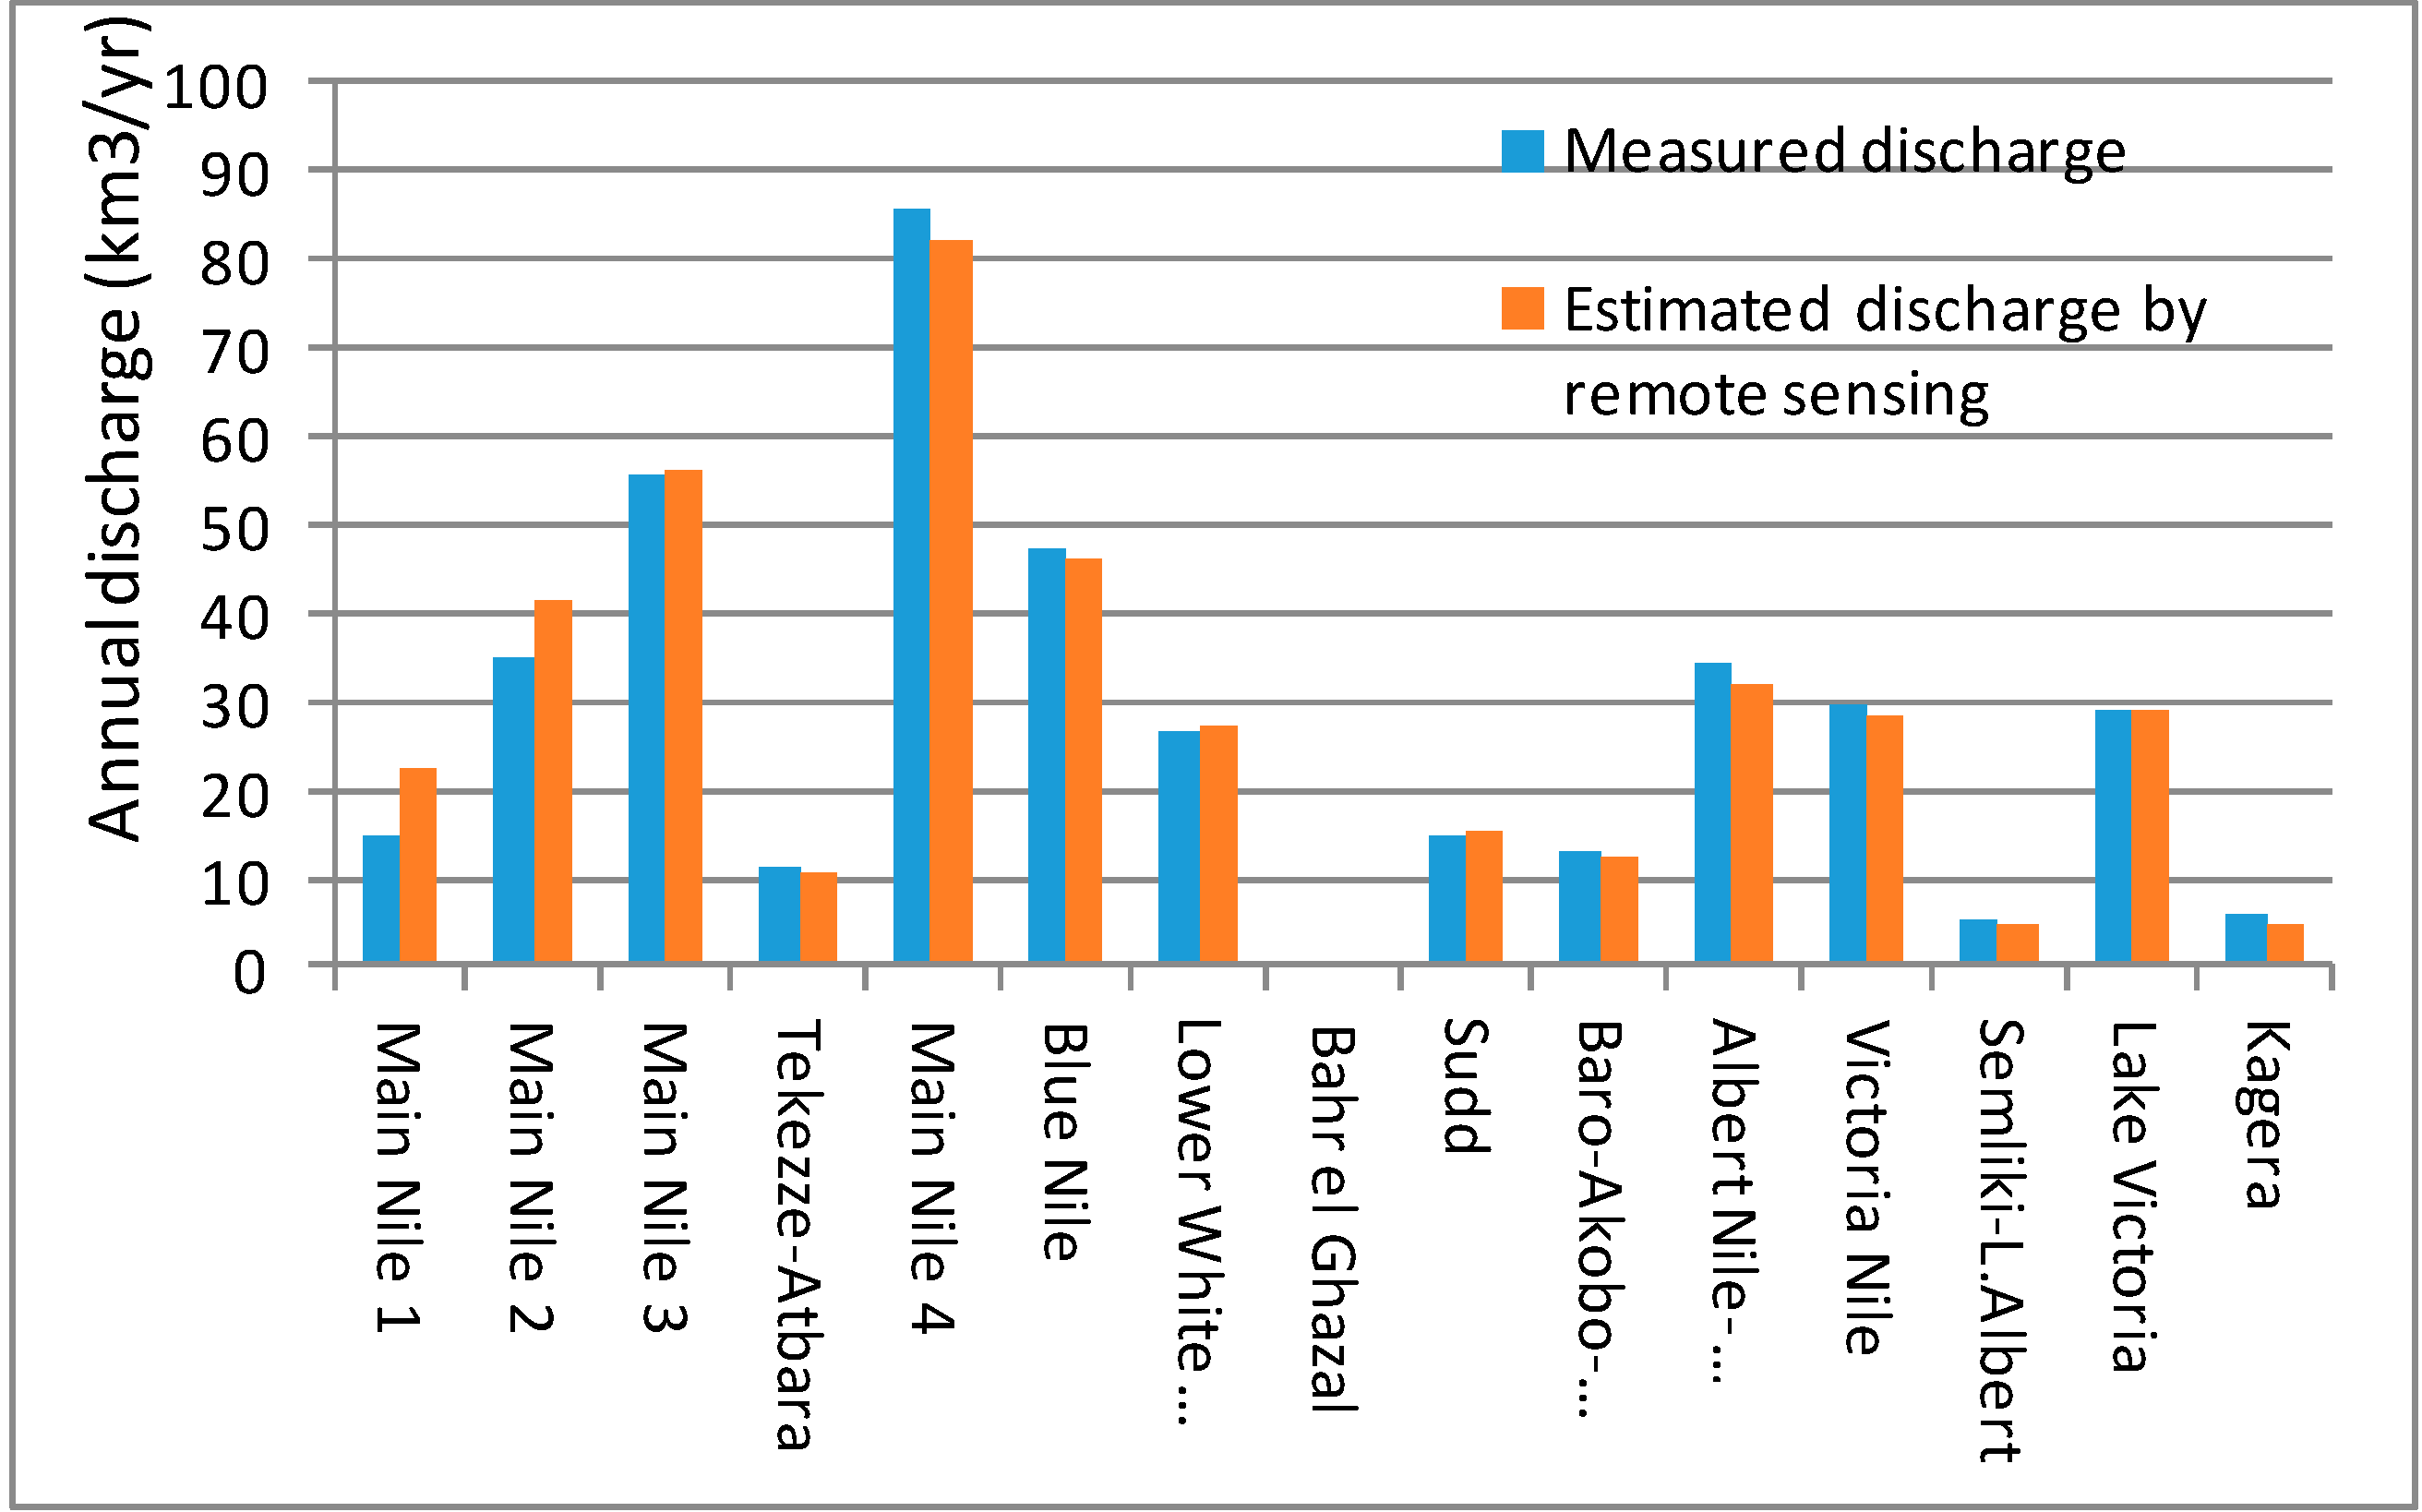
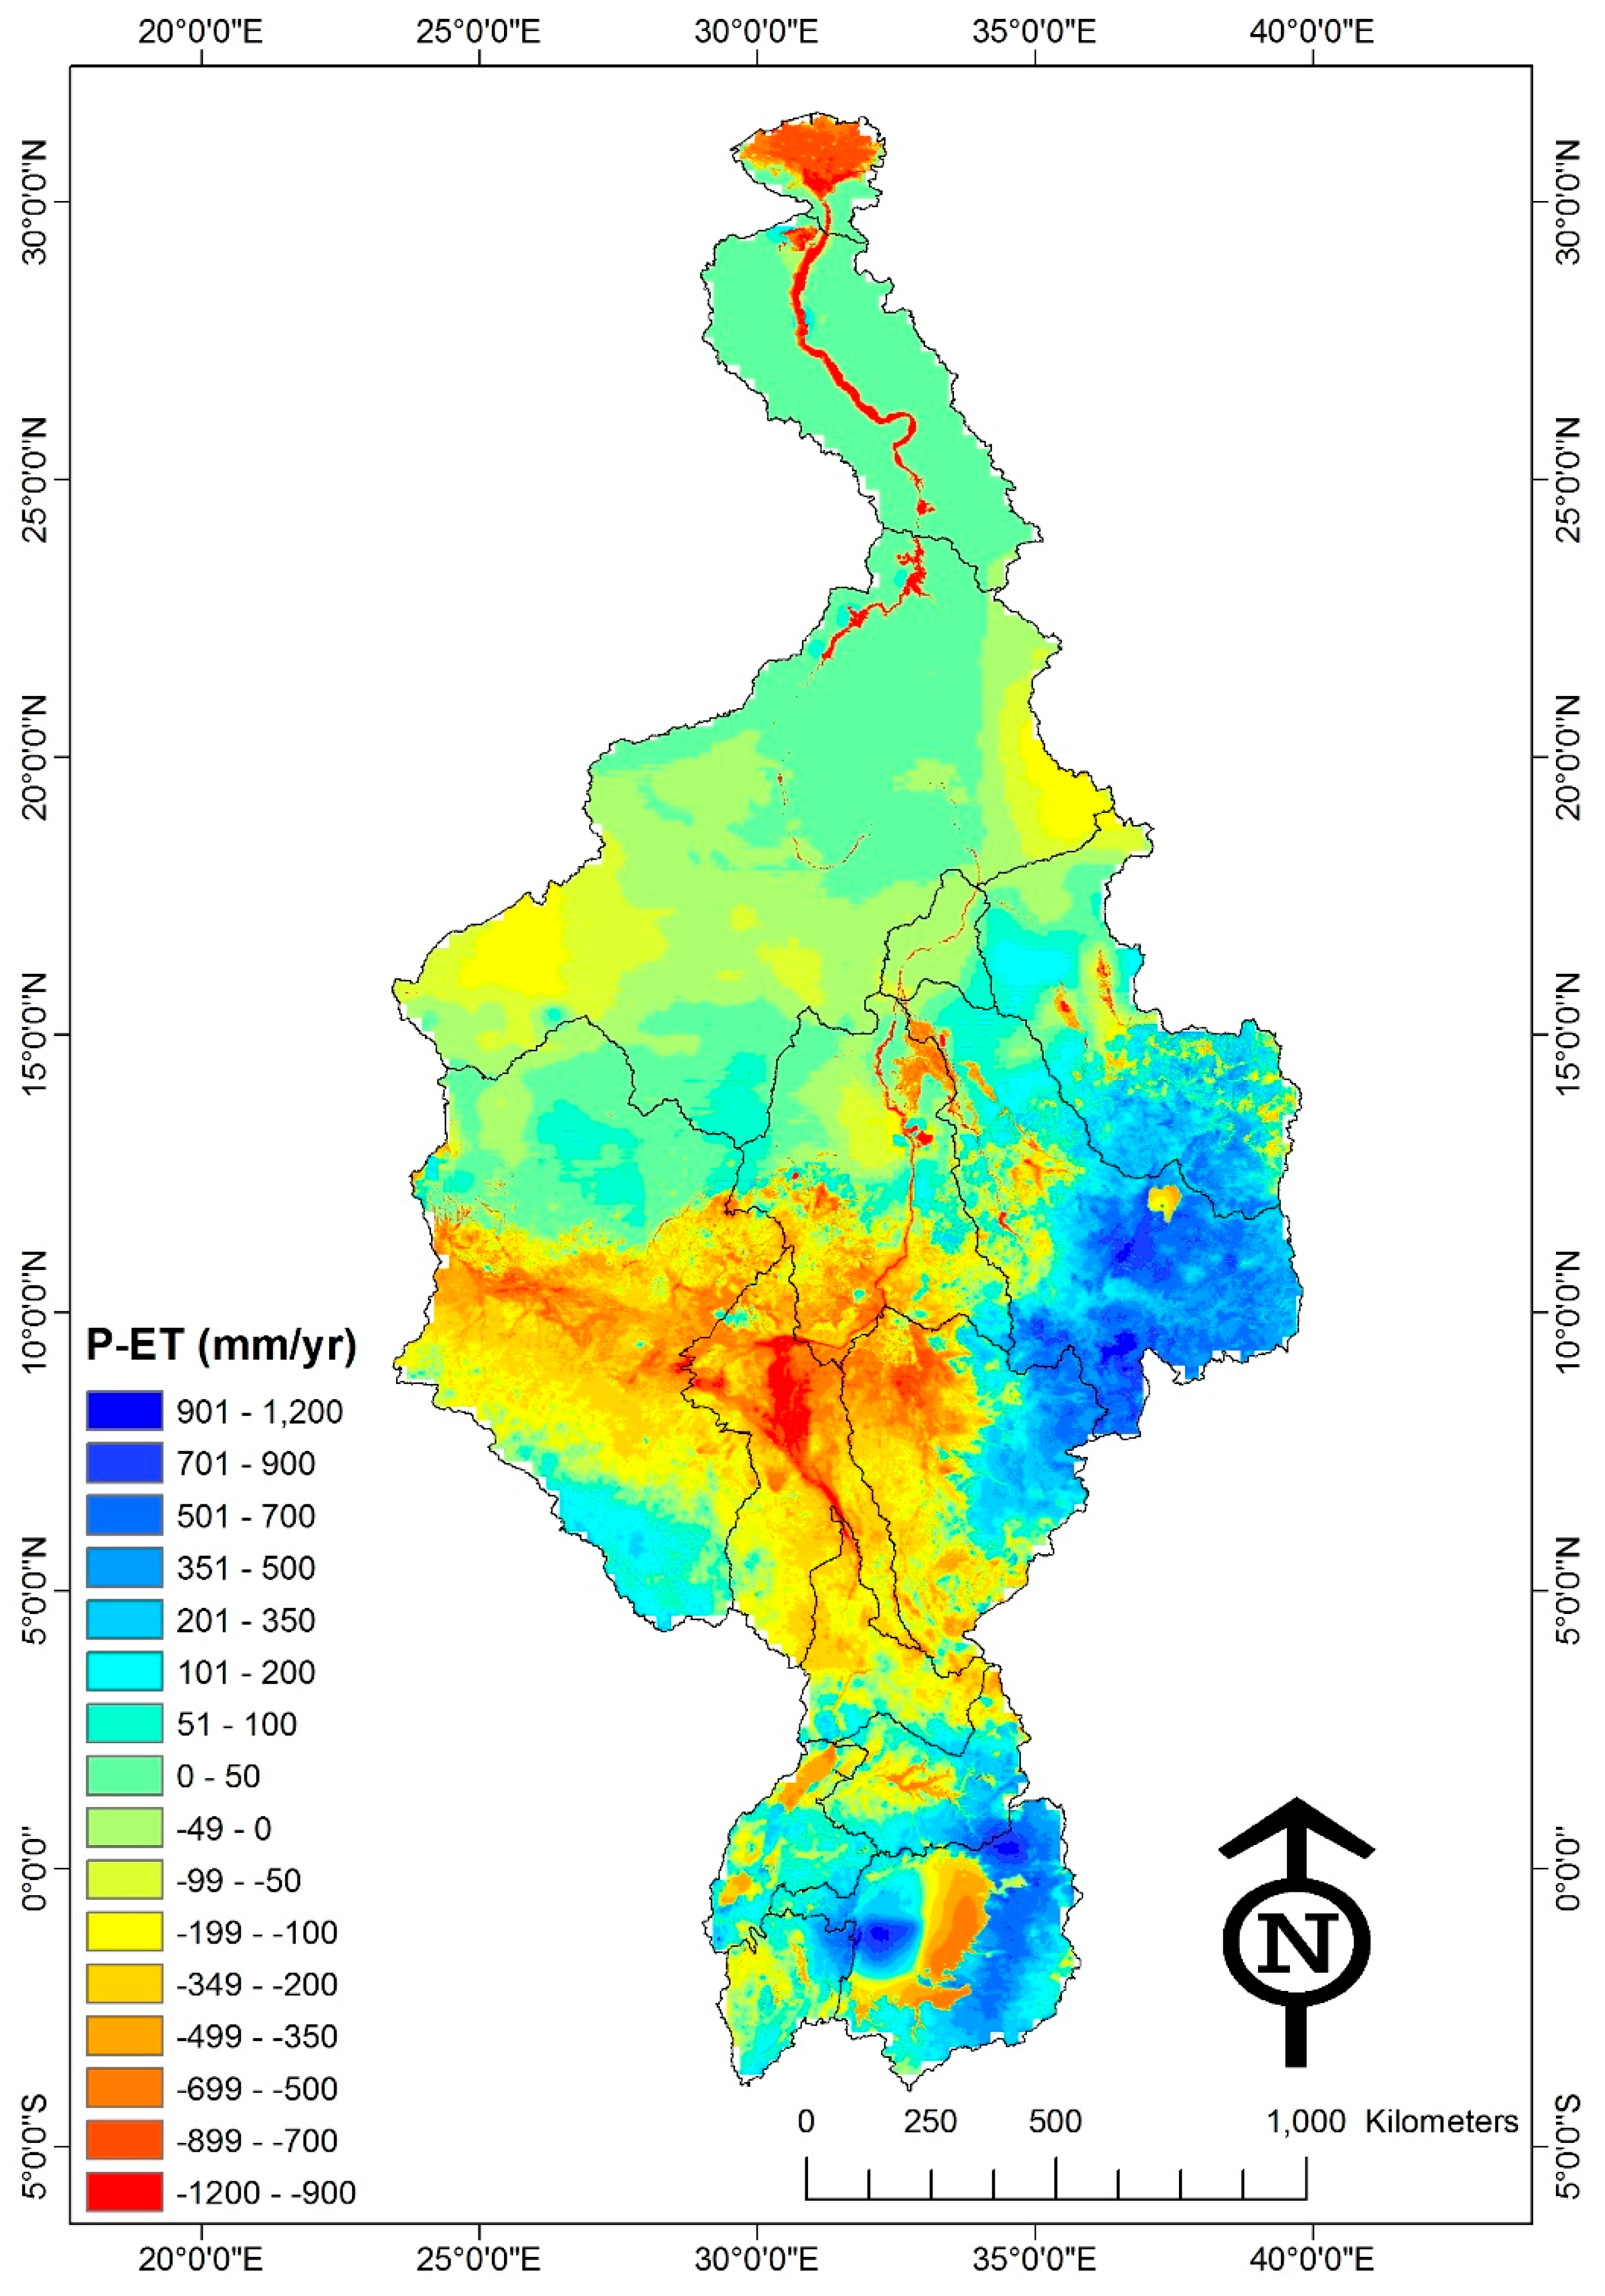
3.3. Water Balance
| SB Name | Inflow | P | ET+I | Net GW interbasin | Net SW interbasin | ΔS | Outflow |
|---|---|---|---|---|---|---|---|
| (km3/yr) | (km3/yr) | (km3/yr) | (km3/yr) | (km3/yr) | (km3/yr) | (km3/yr) | |
| Main Nile 1 | 36 | 2 | 19 | 4 | 1 | −0.09 | 14 |
| Main Nile 2 | 55 | 3 | 16 | 4 | 1 | −0.22 | 36 |
| Main Nile 3 | 79 | 51 | 71 | 4 | 1 | 0.10 | 55 |
| Tekezze-Atbara | 0 | 121 | 105 | 1 | 2 | 1.19 | 12 |
| Main Nile 4 | 87 | 4 | 6 | 4 | 2 | −0.07 | 79 |
| Blue Nile | 0 | 299 | 237 | 5 | 6 | 1.54 | 50 |
| Lower White Nile | 25 | 122 | 141 | −11 | −7 | −0.25 | 25 |
| Bahr el Ghazal | 0 | 435 | 446 | −3 | −10 | 1.00 | 1 |
| Sudd | 35 | 162 | 201 | −9 | −6 | −1.25 | 12 |
| Baro-Akobo-Sobat | 0 | 242 | 232 | −1 | 0 | −1.17 | 13 |
| Albert Nile-Bahr al Jabal | 33 | 90 | 91 | −2 | −1 | −0.08 | 35 |
| Victoria Nile | 28 | 100 | 93 | 3 | 5 | −0.56 | 28 |
| Semliki-L.Albert | 0 | 78 | 72 | 0 | 0 | 0.43 | 5 |
| Lake Victoria | 5 | 246 | 208 | 6 | 8 | 2.00 | 28 |
| Kagera | 0 | 57 | 52 | 0 | 0 | 0.78 | 5 |
| NILE 2005 to 2010 | 2013 | 1987 | 5 | 2 | 3 | 14 |

3.4. Net Water Producers and Consumers
| WA+ Code | LULC | Area | ET | ET | P | P | P-ET | Production | Net Withdrawals |
|---|---|---|---|---|---|---|---|---|---|
| (km2) | (mm/yr) | (km3/yr) | (mm/yr) | (km3/yr) | (mm/yr) | (km3/yr) | (km3/yr) | ||
| MLU2 | Rainfed crops | 380,180 | 749 | 284.6 | 929 | 353.3 | 181 | 68.7 | 0 |
| MLU1 | Plantations | 74,806 | 850 | 63.6 | 1150 | 86.0 | 300 | 22.4 | 0 |
| ULU4 | Savannah | 892,666 | 846 | 755.3 | 870 | 776.2 | 23 | 20.9 | 0 |
| ULU8 | Pastures | 441,240 | 423 | 186.9 | 442 | 194.9 | 18 | 8.1 | 0 |
| MWU17 | Wetlands | 10,057 | 1040 | 10.5 | 1092 | 11.0 | 52 | 0.5 | 0 |
| MWU11 | Urban areas | 58 | 769 | 0.0 | 815 | 0.0 | 46 | 0.0 | 0 |
| ULU19 | Sinks | 987 | 297 | 0.3 | 146 | 0.1 | −150 | 0.0 | −0,2 |
| MLU12 | Urban areas | 4740 | 473 | 2.2 | 142 | 0.7 | −330 | 0.2 | −1,8 |
| PLU4 | Bare land | 196,017 | 91 | 17.9 | 64 | 12.6 | −27 | 3.8 | −9,1 |
| MWU6 | Reservoirs | 6310 | 1566 | 9.9 | 48 | 0.3 | −1518 | 0.1 | −9,7 |
| ULU11 | Bare land | 679,835 | 62 | 42.1 | 52 | 35.4 | −10 | 10.6 | −17,3 |
| MWU1 | Irrigated crops | 54,733 | 812 | 44.5 | 282 | 15.5 | −530 | 4.6 | −33,6 |
| ULU16 | Rivers and natural lakes | 89,489 | 1445 | 129.3 | 1335 | 119.4 | −110 | 35.8 | −45,7 |
| ULU10 | Wetlands | 112,648 | 1206 | 135.9 | 960 | 108.1 | −247 | 32.4 | −60,2 |
| ULU1 | Forests | 285,271 | 1067 | 304.4 | 1053 | 300.5 | −14 | 90.2 | −94,1 |
| Total | 3,229,039 | 1987.3 | 2014.1 | 298 | −272 |
4. Discussion
5. Conclusions
Acknowledgement
Author Contributions
Conflicts of Interest
Appendix
| WA+ Code | Description | LULC | Area | ET | ET | P | P | P-ET | P-ET |
|---|---|---|---|---|---|---|---|---|---|
| (km2) | (mm/yr) | (km3/yr) | (mm/yr) | (km3/yr) | (mm) | (km3/yr) | |||
| PLU4 | Sand dunes | Bare land | 196017 | 91.4 | 17.9 | 64.1 | 12.6 | −27.3 | −5.3 |
| ULU1 | Closed trees with closed to open shrubs | Forests | 9802 | 1182.2 | 11.6 | 1290.3 | 12.6 | 108.1 | 1.1 |
| ULU2 | Closed multilayered trees (broadleaved evergreen) | Forests | 7109 | 1154.6 | 8.2 | 1286.4 | 9.1 | 131.7 | 0.9 |
| ULU3 | Open trees with open shrubs | Forests | 268360 | 1060.7 | 284.7 | 1038.7 | 278.7 | −22.1 | −5.9 |
| ULU4 | Closed shrubs | Savannah | 116480 | 1068.7 | 124.5 | 1096.5 | 127.7 | 27.8 | 3.2 |
| ULU5 | Open general shrubs with closed to open herbaceous | Savannah | 342789 | 845.0 | 289.7 | 866.8 | 297.1 | 21.8 | 7.5 |
| ULU6 | Closed shrubs with sparse trees | Savannah | 312953 | 693.8 | 217.1 | 738.6 | 231.1 | 44.8 | 14.0 |
| ULU7 | Closed low trees with closed to open shrubs | Savannah | 120445 | 1030.2 | 124.1 | 998.2 | 120.2 | −32.0 | −3.9 |
| ULU8 | Sparse herbaceous | Pastures | 419102 | 405.8 | 170.1 | 415.6 | 174.2 | 9.8 | 4.1 |
| ULU9 | Closed to very open grassland | Pastures | 22138 | 758.0 | 16.8 | 936.4 | 20.7 | 178.4 | 4.0 |
| ULU10 | River bank | Wetlands | 535 | 751.8 | 0.4 | 193.1 | 0.1 | −558.8 | −0.3 |
| ULU11 | Bare soil stony (deep soil) | Bare land | 117213 | 33.1 | 3.9 | 30.7 | 3.6 | −2.3 | −0.3 |
| ULU12 | Bare soil stony under reclamation | Bare land | 23530 | 386.9 | 9.1 | 384.2 | 9.0 | −2.7 | −0.1 |
| ULU14 | Bare rock with a thin sand layer | Bare land | 396767 | 51.9 | 20.6 | 39.6 | 15.7 | −12.2 | −4.9 |
| ULU16 | River | Open water | 4423 | 967.7 | 4.3 | 409.8 | 1.8 | −557.9 | −2.5 |
| ULU17 | Natural lakes | Open water | 85066 | 1469.3 | 125.0 | 1382.9 | 117.6 | −86.4 | −7.4 |
| ULU18 | Post Flooding Herbaceous Crop, Medium Fields | Wetlands | 25093 | 1111.3 | 27.9 | 938.4 | 23.5 | −172.9 | −4.3 |
| ULU19 | Salt fields | Sinks | 987 | 297.0 | 0.3 | 146.5 | 0.1 | −150.5 | −0.1 |
| ULU20 | Closed medium herbaceous on permanently flooded land - brackish water | Wetlands | 112 | 787.4 | 0.1 | 74.6 | 0.0 | −712.8 | −0.1 |
| ULU21 | Bare soil | Bare land | 142325 | 59.8 | 8.5 | 49.5 | 7.0 | −10.3 | −1.5 |
| ULU24 | Open general woody with closed to open herbaceous on temporarily flooded land | Wetlands | 77743 | 1231.0 | 95.7 | 980.5 | 76.2 | −250.5 | −19.5 |
| ULU25 | Closed trees on permanently flooded land - fresh water | Wetlands | 9166 | 1286.6 | 11.8 | 894.6 | 8.2 | −392.0 | −3.6 |
| MLU1 | Forest Plantation | Plantations | 74806 | 850.0 | 63.6 | 1150.0 | 86.0 | 300.0 | 22.4 |
| MLU2 | Rainfed Tree Crop | Rainfed crops | 189204 | 869.4 | 164.5 | 1142.8 | 216.2 | 273.5 | 51.7 |
| MLU4 | Rainfed Herbaceous Crop | Rainfed crops | 8952 | 752.4 | 6.7 | 350.7 | 3.1 | −401.8 | −3.6 |
| MLU5 | Rainfed Herbaceous Crop | Rainfed crops | 107661 | 541.4 | 58.3 | 618.1 | 66.5 | 76.7 | 8.3 |
| MLU6 | Rainfed Shrub Crop/orchard | Rainfed crops | 2634 | 904.1 | 2.4 | 1103.2 | 2.9 | 199.1 | 0.5 |
| MLU7 | Rainfed Herbaceous Crop | Rainfed crops | 70564 | 732.2 | 51.7 | 895.9 | 63.2 | 163.7 | 11.6 |
| MLU8 | Rainfed Shrub Crop | Rainfed crops | 1165 | 866.1 | 1.0 | 1077.7 | 1.3 | 211.6 | 0.2 |
| MLU12 | Dumps / deposits | Urban areas | 3 | 177.7 | 0.0 | 147.7 | 0.0 | −30.1 | 0.0 |
| MLU14 | Airport | Urban areas | 94 | 401.9 | 0.0 | 360.5 | 0.0 | −41.4 | 0.0 |
| MLU16 | Urban areas | Urban areas | 3490 | 503.3 | 1.8 | 60.3 | 0.2 | −443.0 | −1.5 |
| MLU17 | Rural settlements | Urban areas | 1153 | 386.0 | 0.4 | 372.4 | 0.4 | −13.6 | 0.0 |
| MWU1 | Irrigated Herbaceous Crop | Irrigated crops | 12983 | 744.3 | 9.7 | 287.8 | 3.7 | −456.5 | −5.9 |
| MWU2 | Irrigated Herbaceous − Cereal | Irrigated crops | 9275 | 835.5 | 7.7 | 351.2 | 3.3 | −484.3 | −4.5 |
| MWU2 | Irrigated Herbaceous Crop (1 add. Crop) Large to Medium Fields – Maize, Clover | Irrigated crops | 5621 | 839.2 | 4.7 | 41.7 | 0.2 | −797.5 | −4.5 |
| MWU3 | Irrigated Orchard, Small Fields - Citrus spp. | Irrigated crops | 17698 | 822.3 | 14.6 | 428.3 | 7.6 | −394.0 | −7.0 |
| MWU4 | Irrigated Herbaceous Crop (1 add. Crop) Small Fields | Irrigated crops | 6449 | 921.0 | 5.9 | 68.8 | 0.4 | −852.2 | −5.5 |
| MWU5 | Irrigated Forest Plantation - Eucalyptus | Irrigated crops | 2707 | 682.2 | 1.8 | 75.7 | 0.2 | −606.5 | −1.6 |
| MWU6 | Artificial Lakes or Reservoirs | Open water | 12 | 1156.3 | 0.0 | 461.9 | 0.0 | −694.4 | 0.0 |
| MWU8 | Snow | Open water | 5918 | 1642.6 | 9.7 | 46.1 | 0.3 | −1596.5 | −9.4 |
| MWU10 | Fish Pond | Open water | 381 | 391.3 | 0.1 | 66.2 | 0.0 | −325.1 | −0.1 |
| MWU11 | Refugee camp | Urban areas | 33 | 765.7 | 0.0 | 821.9 | 0.0 | 56.2 | 0.0 |
| MWU15 | Urban Areas Vegetated | Urban areas | 25 | 772.8 | 0.0 | 806.5 | 0.0 | 33.7 | 0.0 |
| MWU17 | Open trees with closed to open herbaceous on temporarily flooded land | Wetlands | 5443 | 984.4 | 5.4 | 1101.4 | 6.0 | 117.0 | 0.6 |
| MWU18 | Very open trees with closed to open shrubs on temporarily flooded land - fresh water | Wetlands | 4614 | 1105.2 | 5.1 | 1080.4 | 5.0 | −24.7 | −0.1 |
| Total | 3229039 | 1987.3 | 2014.1 | 26.8 | |||||
References
- Rockstrom, J.; Steffen, W.; Noone, K.; Persson, A.; Chapin, F.S.; Lambin, E.F.; Lenton, T.M.; Scheffer, M.; Folke, C.; Schellnhuber, H.J.; et al. A safe operating space for humanity. Nature 2009, 461, 472–475. [Google Scholar] [CrossRef]
- Alexandratos, N.; Bruinsma, J. World Agriculture towards 2030/2050: The 2012 Revision; FAO: Rome, Italy, 2012. [Google Scholar]
- Rijsberman, F.R. Water scarcity: Fact or fiction? Agric. Water Manage. 2006, 80, 5–22. [Google Scholar] [CrossRef]
- Hilhorst, B.; Burke, J.; Hoogeveen, J.; Fremken, K.; Faures, J.-M.; Gross, D. Information Products for Nile Basin Water Resources Management; FAO: Rome, Italy, 2011; p. 130. [Google Scholar]
- Thenkabail, P.S.; Knox, J.W.; Ozdogan, M.; Gumma, M.K.; Congalton, R.G.; Wu, Z.; Milesi, C.; Finkral, A.; Marshall, M.; Mariotto, I.; et al. Assessing future risks to agricultural productivity, water resources and food security—How can remote sensing help? Photogramm. Eng. Remote Sens. 2012, 78, 773–782. [Google Scholar]
- Rebelo, L.-M.; Johnston, R.; Karimi, P.; McCornick, P.G. Determining the dynamics of agricultural water use: Cases from Asia and Africa. J. Contemporary Water Res. Education 2014, 153, 79–90. [Google Scholar] [CrossRef]
- De Fraiture, C.; Molden, D.; Wichelns, D. Investing in water for food, ecosystems, and livelihoods: An overview of the comprehensive assessment of water management in agriculture. Agric. Water Manage. 2010, 97, 495–501. [Google Scholar] [CrossRef]
- Alcamo, J.; Döll, P.; Kaspar, F.; Siebert, S. Global Change and Global Scenarios of Water Use and Availability: An Application of Watergap1.0; Center for Environmental Systems Research (CESR), University of Kassel: Kassel, Germany, 1997. [Google Scholar]
- Seckler, D.; Amarasinghe, U.; Molden, D.; Silva, R.d.; Barker, R. World Water Demand and Supply, 1990 to 2025: Scenarios and Issues; International Water Management Institute: Colombo, Sri Lanka, 1998. [Google Scholar]
- Shiklomanov, I.A. Appraisal and assessment of world water resources. Water Int. 2000, 25, 11–32. [Google Scholar] [CrossRef]
- Wallace, J.S. Increasing agricultural water use efficiency to meet future food production. Agric. Ecosyst. Environ. 2000, 82, 105–119. [Google Scholar] [CrossRef]
- Vörösmarty, C.J.; Green, P.; Salisbury, J.; Lammers, R.B. Global water resources: Vulnerability from climate change and population growth. Science 2000, 289, 284–288. [Google Scholar] [CrossRef] [PubMed]
- Droogers, P.; Immerzeel, W.W.; Terink, W.; Hoogeveen, J.; Bierkens, M.F.P.; van Beek, L.P.H.; Debele, B. Water resources trends in middle east and north africa towards 2050. Hydrol. Earth Syst. Sci. Discuss. 2012, 16, 3101–3114. [Google Scholar] [CrossRef]
- Bosch, J.M.; Hewlett, J.D. A review of catchment experiments to determine the effect of vegetation changes on water yield and evapotranspiration. J. Hydrol. 1982, 55, 3–23. [Google Scholar] [CrossRef]
- Smakhtin, V.; Revenga, C.; Döll, P. Taking into Account Environmental Water Requirements in Global-Scale Water Resources Assessments; Comprehensive Assessment Secretariat: Colombo, Sri Lanka, 2004. [Google Scholar]
- Seckler, D. The New Era of Water Resources Management: From “Dry” to “Wet” Water Savings; International Irrigation Management Institute: Colombo, Sri Lanka, 1996. [Google Scholar]
- Shahin, M. Assessment of Groundwater Resources in Egypt; UNESCO-IHE: Delft, The Netherlands, 1991. [Google Scholar]
- Sutcliffe, J.V.; Parks, Y.P. The Hydrology of the Nile; IAHS Press, Institute of Hydrology: Wallingford, UK, 1999; p. 179. [Google Scholar]
- Serrat-Capdevila, A.; Valdes, J.B.; Stakhiv, E.Z. Water management applications for satellite precipitation products: Synthesis and recommendations. JAWRA J. Am. Water Resour. Assoc. 2014, 50, 509–525. [Google Scholar] [CrossRef]
- Neal, C.M.U.; Cosh, M.H. Remote Sensing and Hydrology; IAHS: Wallingford, UK, 2012. [Google Scholar]
- Batelaan, O. Special Issue: Hydrological Remote Sensing. https://www.mdpi.com/journal/remotesensing/special_issues/hydrological (accessed on 15 April 2014).
- Nagesh Kumar, D.; Reshmidevi, T.V. Remote sensing applications in water resources. J. Indian Inst. Sci. 2013, 93, 163–187. [Google Scholar]
- Karimi, P.; Bastiaanssen, W.G.M. Spatial evapotranspiration, rainfall and land use data in water accounting—Part 1: Review of the accuracy of the remote sensing. Hydrol. Earth Syst. Sci. Discuss. 2014, 11, 1073–1123. [Google Scholar] [CrossRef]
- Xie, P.; Arkin, P.A. Global precipitation: A 17-year monthly analysis based on gauge observations, satellite estimates, and numerical model outputs. Bull. Amer. Meteor. Soc. 1997, 78, 2539–2558. [Google Scholar] [CrossRef]
- Van den Hurk, B.J.J.M.; Viterbo, P.; Beljaars, A.C.M.; Betts, A.K. Offline Validation of the Era40 Surface Scheme; ECMWF: Reading, UK, 2000; p. 43. [Google Scholar]
- Balsamo, G.; Beljaars, A.; Scipal, K.; Viterbo, P.; van den Hurk, B.; Hirschi, M.; Betts, A.K. A revised hydrology for the ecmwf model: Verification from field site to terrestrial water storage and impact in the integrated forecast system. J. Hydrometeorol. 2009, 10, 623–643. [Google Scholar] [CrossRef]
- Miralles, D.G.; Holmes, T.R.H.; De Jeu, R.A.M.; Gash, J.H.; Meesters, A.G.C.A.; Dolman, A.J. Global land-surface evaporation estimated from satellite-based observations. Hydrol. Earth Syst. Sci. 2011, 15, 453–469. [Google Scholar] [CrossRef]
- Mu, Q.; Heinsch, F.A.; Zhao, M.; Running, S.W. Development of a global evapotranspiration algorithm based on modis and global meteorology data. Remote Sens. Environ. 2007, 111, 519–536. [Google Scholar] [CrossRef]
- Kim, H.W.; Hwang, K.; Mu, Q.; Lee, S.O.; Choi, M. Validation of modis 16 global terrestrial evapotranspiration products in various climates and land cover types in Asia. KSCE J. Civ. Eng. 2012, 16, 229–238. [Google Scholar] [CrossRef]
- Trambauer, P.; Dutra, E.; Maskey, S.; Werner, M.; Pappenberger, F.; van Beek, L.P.H.; Uhlenbrook, S. Comparison of different evaporation estimates over the african continent. Hydrol. Earth Syst. Sci. 2014, 18, 193–212. [Google Scholar] [CrossRef]
- Guerschman, J.P.; Van Dijk, A.I.J.M.; Mattersdorf, G.; Beringer, J.; Hutley, L.B.; Leuning, R.; Pipunic, R.C.; Sherman, B.S. Scaling of potential evapotranspiration with modis data reproduces flux observations and catchment water balance observations across australia. J. Hydrol. 2009, 369, 107–119. [Google Scholar] [CrossRef]
- Anderson, M.C.; Kustas, W.P.; Norman, J.M.; Hain, C.R.; Mecikalski, J.R.; Schultz, L.; González-Dugo, M.P.; Cammalleri, C.; d'Urso, G.; Pimstein, A.; et al. Mapping daily evapotranspiration at field to continental scales using geostationary and polar orbiting satellite imagery. Hydrol. Earth Syst. Sci. 2011, 15, 223–239. [Google Scholar] [CrossRef]
- Bastiaanssen, W.G.M.; Cheema, M.J.M.; Immerzeel, W.W.; Miltenburg, I.J.; Pelgrum, H. Surface energy balance and actual evapotranspiration of the transboundary indus basin estimated from satellite measurements and the etlook model. Water Resour. Res. 2012, 48, W11512. [Google Scholar] [CrossRef]
- Senay, G.B.; Bohms, S.; Singh, R.K.; Gowda, P.H.; Velpuri, N.M.; Alemu, H.; Verdin, J.P. Operational evapotranspiration mapping using remote sensing and weather datasets: A new parameterization for the sseb approach. JAWRA J. Am. Water Resour. Assoc. 2013, 49, 577–591. [Google Scholar] [CrossRef]
- Karimi, P.; Molden, D.; Bastiaanssen, W.G.M.; Cai, X. Water accounting to assess use and productivity of water—Evolution of the concept and new frontiers. In Water Accounting: International Approaches to Policy and Decision-Making; Chalmers, K., Godfrey, J., Eds.; Edgar Elger: Cheltenham, UK, 2012; pp. 76–88. [Google Scholar]
- Dickinson, R.E. Land surface processes and climate surface albedos and energy-balance. In Advances in Geophysics; Academic Press, Inc.: New York, NY, USA, 1983; Vol. 25; pp. 305–353. [Google Scholar]
- Di Gregorio, A.; Jansen, L.J.M. Land Cover Classification System (LCCS), Classification Concepts and User Manual; FAO: Rome, Italy, 2000; pp. 80–99. [Google Scholar]
- Karimi, P.; Bastiaanssen, W.G.M.; Molden, D. Water accounting plus (WA+)—A water accounting procedure for complex river basins based on satellite measurements. Hydrol. Earth Syst. Sci. 2013, 17, 2459–2472. [Google Scholar] [CrossRef]
- Ahmad, M.-U.-D.; Bastiaanssen, W.G.M.; Feddes, R.A. A new technique to estimate net groundwater use across large irrigated areas by combining remote sensing and water balance approaches, Rechna Doab, Pakistan. Hydrogeol. J. 2005, 13, 653–664. [Google Scholar] [CrossRef]
- Van Eekelen, M.; Bastiaanssen, W.G.M.; Jarmain, C.; Jackson, B.; Ferreira, F.; Zaag, P.v.d.; Okello, A.S.; Bosch, J.H.; Dye, P.; Bastidas-Obando, E.; et al. A novel approach to estimate direct and indirect water withdrawals from satellite measurements: A case study from the incomati basin. Agric. Ecosyst. Environ. 2014. submitted. [Google Scholar]
- Schreiber, P. Uber die beziehungen zwischen dem niederschlag und der wasserfuhrung der flube in mitteleuropa. Z. Meteorol. 1904, 21, 441–452. [Google Scholar]
- Budyko, M.I. Climate and Life; Academic: Orlando, FL, USA, 1974. [Google Scholar]
- Gerrits, A.M.J.; Savenije, H.H.G.; Veling, E.J.M.; Pfister, L. Analytical derivation of the budyko curve based on rainfall characteristics and a simple evaporation model. Water Resour. Res. 2009, 45, W04403. [Google Scholar] [CrossRef]
- Crétaux, J.F.; Jelinski, W.; Calmant, S.; Kouraev, A.; Vuglinski, V.; Bergé-Nguyen, M.; Gennero, M.C.; Nino, F.; Abarca Del Rio, R.; Cazenave, A.; et al. Sols: A lake database to monitor in the near real time water level and storage variations from remote sensing data. Adv. Space Res. 2011, 47, 1497–1507. [Google Scholar] [CrossRef]
- Duan, Z.; Bastiaanssen, W.G.M. Estimating water volume variations in lakes and reservoirs from four operational satellite altimetry databases and satellite imagery data. Remote Sens. Environ. 2013, 134, 403–416. [Google Scholar] [CrossRef]
- Syed, T.H.; Famiglietti, J.S.; Rodell, M.; Chen, J.; Wilson, C.R. Analysis of terrestrial water storage changes from GRACE and GLDAS. Water Resour. Res. 2008, 44, W02433. [Google Scholar] [CrossRef]
- Klees, R.; Liu, X.; Wittwer, T.; Gunter, B.C.; Revtova, E.A.; Tenzer, R.; Ditmar, P.; Winsemius, H.C.; Savenije, H.H.G. A comparison of global and regional grace models for land hydrology. Sur. Geophys. 2008, 29, 335–359. [Google Scholar] [CrossRef]
- Rodell, M.; Velicogna, I.; Famiglietti, J.S. Satellite-based estimates of groundwater depletion in India. Nature 2009, 460, 999–1002. [Google Scholar] [CrossRef] [PubMed]
- Funk, C.C.; Peterson, P.J.; Landsfeld, M.F.; Pedreros, D.H.; Verdin, J.P.; Rowland, J.D.; Romero, B.E.; Husak, G.J.; Michaelsen, J.C.; Verdin, A.P. A Quasi-Global Precipitation Time Series for Drought Monitoring; U.S. Geological Survey Data Series 832 ed. 2014.
- Karimi, P.; Molden, D.; Notenbaert, A.; Peden, D. Nile basin farming systems and productivity. In The Nile River Basin, Water, Agriculture, Governance and Livelihoods; Chalmers, K., Godfrey, J., Eds.; Edgar Elger: Cheltenham, UK, 2012; pp. 133–153. [Google Scholar]
- Duan, Z.; Bastiaanssen, W.G.M. First results from version 7 TRMM 3b43 precipitation product in combination with a new downscaling–calibration procedure. Remote Sens. Environ. 2013, 131, 1–13. [Google Scholar] [CrossRef]
- Hunink, J.E.; Immerzeel, W.W.; Droogers, P. A high-resolution precipitation 2-step mapping procedure (hip2p): Development and application to a tropical mountainous area. Remote Sens. Environ. 2014, 140, 179–188. [Google Scholar] [CrossRef]
- Alemu, H.; Senay, G.B.; Kaptue, A.T.; Kovalskyy, V. Evapotranspiration variability and its association with vegetation dynamics in the Nile Basin, 2002–2011. Remote Sens. 2014, 6, 5885–5908. [Google Scholar] [CrossRef]
- Senay, G.B.; Gowda, P.H.; Bohms, S.; Howell, T.A.; Friedrichs, M.; Marek, T.H.; Verdin, J.P. Evaluating the ssebop approach for evapotranspiration mapping with landsat data using lysimetric observations in the semi-arid texas high plains. Hydrol. Earth Syst. Sci. Discuss. 2014, 11, 723–756. [Google Scholar] [CrossRef]
- Velpuri, N.M.; Senay, G.B.; Singh, R.K.; Bohms, S.; Verdin, J.P. A comprehensive evaluation of two MODIS evapotranspiration products over the conterminous united states: Using point and gridded fluxnet and water balance ET. Remote Sens. Environ. 2013, 139, 35–49. [Google Scholar] [CrossRef]
- Singh, R.; Senay, G.; Velpuri, N.; Bohms, S.; Scott, R.; Verdin, J. Actual evapotranspiration (water use) assessment of the colorado river basin at the landsat resolution using the operational simplified surface energy balance model. Remote Sens. 2014, 6, 233–256. [Google Scholar] [CrossRef]
- Senay, G.B.; Budde, M.E.; Verdin, J.P. Enhancing the simplified surface energy balance (SSEB) approach for estimating landscape ET: Validation with the METRIC model. Agric. Water Manage. 2011, 98, 606–618. [Google Scholar] [CrossRef]
- Gowda, P.H.; Senay, G.B.; Colaizzi, P.D.; Howell, T.A. Lysimeter validation of the simplified surface energy balance (SSEB) approach for estimating actual ET. Trans. ASABE 2009, 25, 665–669. [Google Scholar]
- Senay, G.B.; Velpuri, M.N.; Bohms, S.; Demissie, Y.; Gebremichael, M. Understanding the hydrologic sources and sinks in the Nile Basin using multi-source climate and remote sensing data sets. Water Resour. Res. 2014. submitted. [Google Scholar]
- Allen, R.; Tasumi, M.; Trezza, R. Satellite-based energy balance for mapping evapotranspiration with internalized calibration (METRIC)—model. J. Irrig. . Drain. Eng. 2007, 133, 380–394. [Google Scholar] [CrossRef]
- Bastiaanssen, W.G.M.; Menenti, M.; Feddes, R.A.; Holtslag, A.A.M. A remote sensing surface energy balance algorithm for land (SEBAL). 1. Formulation. J. Hydrol. 1998, 212–213, 198–212. [Google Scholar] [CrossRef]
- Immerzeel, W.W.; Droogers, P.; Terink, W.; Hoogeveen, J.; Hellegers, P.J.J.G.; Bierkens, M.F.P.; Beek, L.P.H.v. Middle-East and Northern Africa, Water Outlook; FutureWater: Wageningen, The Netherlands, 2011; p. 136. [Google Scholar]
- Bastiaanssen, W.G.M.; Hoekman, D.H.; Roebeling, R.A. A Methodology for the Assessment of Surface Resistance and Soil Water Storage Variability at Mesoscale Based on Remote Sensing Measurements: A Case Study with Hapex-Efeda Data; International Association of Hydrological Sciences: Wallingford, UK, 1994. [Google Scholar]
- Mohamed, Y.A.; Bastiaanssen, W.G.M.; Savenije, H.H.G. Spatial variability of evaporation and moisture storage in the swamps of the upper nile studied by remote sensing techniques. J. Hydrol. 2004, 289, 145–164. [Google Scholar] [CrossRef]
- Allen, R.G.; Pereira, L.S.; Raes, D.; Smith, M. Crop Evapotranspiration—Guidelines for Computing Crop Water Requirements; FAO: Rome, Italy, 1998. [Google Scholar]
- Kirby, M.; Eastham, J.; Mainuddin, M. Water-Use Accounts in CPWF Basins: Simple Water-Use Accounting of the Nile Basin; The CGIAR Challenge Program on Water and Food: Colombo, Sri Lanka, 2010. [Google Scholar]
- NWRP Project. National Water Resources Plan 2017; Arab Republic of Egypt, Ministry of Water Resources and Irrigation: Cairo, Egypt, 2005. [Google Scholar]
- Dai, A.; Trenberth, K.E. New estimates of continental discharge and oceanic freshwater transport. In Proceedings of JP1.11 AMS Symposium on Observing and Understanding the Variability of Water in Weather and Climate, Long Beach, CA, USA, 9–13 February 2003.
- Awulachew, S.R.; Lisa-Maria; Molden, David. The nile basin: Tapping the unmet agricultural potential of nile waters. Water Int. 2010, 35, 623–654. [Google Scholar] [CrossRef]
- El-Shabrawy, G.M. Lake Nasser-Nubia. In The Nile: Origin, Environments, Limnology and Human Use; Dumont, H.J., Ed.; Springer: Dordrecht, The Netherlands, 2009; pp. 125–156. [Google Scholar]
- Johnston, R. Availability of water for agriculture in the nile basin. In The Nile River Basin, Water, Agriculture, Governance and Livelihoods; Awulachew, S.B., Smakhtin, V., Molden, D., Peden, D., Eds.; Routledge - Earthscan: Abingdon, UK, 2012; pp. 61–83. [Google Scholar]
- MacAlister, C.; Pavelic, P.; Tindimugaya, C.; Ayenew, T.; Ibrahim, M.E.; Meguid, M.A. Overview of groundwater in the nile river basin. In The Nile River Basin, Water, Agriculture, Governance and Livelihoods; Awulachew, S.B., Smakhtin, V., Molden, D., Peden, D., Eds.; Routledge - Earthscan: Abingdon, UK, 2012; pp. 186–211. [Google Scholar]
- Bonsor, H.C.; Mansour, M.M.; MacDonald, A.M.; Hughes, A.G.; Hipkin, R.G.; Bedada, T. Interpretation of grace data of the nile basin using a groundwater recharge model. Hydrol. Earth Syst. Sci. Discuss. 2010, 7, 4501–4533. [Google Scholar] [CrossRef]
- Elsawwaf, M.; Feyen, J.; Batelaan, O.; Bakr, M. Groundwater–surface water interaction in lake Nasser, Southern Egypt. Hydrol. Processes 2014, 28, 414–430. [Google Scholar] [CrossRef]
- Faures, J.-M.; Svendsen, M.; Turral, H. Reinventing irrigation. In Water for Food, Water for Life, a Comprehensive Assessment of Water in Agriculture; Molden, D.J., Ed.; IWMI and Earthscan: London, UK, 2007; pp. 353–394. [Google Scholar]
- Dastane, N.G. Effective Rainfall in Irrigated Agriculture; FAO: Rome, Italy, 1974. [Google Scholar]
- Rebelo, L.-M.; McCartney, M. Wetlands of the Nile Basin, distributions, functions and contribution to livelihoods. In The Nile River Basin: Water, Agriculture, Governance and Livelihoods; Awulachew, S.B., Smakhtin, V., Molden, D., Peden, D., Eds.; Routledge - Earthscan: Abingdon, UK, 2012; pp. 212–228. [Google Scholar]
- Awulachew, S.B.; Demissie, S.S.; Hagos, F.; Erkossa, T.; Peden, D. Water management intervention analysis in the nile basin. In The Nile River Basin: Water, Agriculture, Governance and Livelihoods; Awulachew, S.B., Smakhtin, V., Molden, D., Peden, D., Eds.; Routledge - Earthscan: Abingdon, UK, 2012; pp. 292–316. [Google Scholar]
- Bastiaanssen, W.; Perry, C. Agricultural Water Use and Water Productivity in the Large Scale Irrigation (LSI) Schemes of the Nile Basin; Nile Basin Initiative (NBI): Entebbe, Uganda, 2009. [Google Scholar]
- FAO. Assessment of the Irrigation Potential of the Nile Basin; Land and Water Division, FAO: Rome, Italy, 1997; p. 41. [Google Scholar]
- Allen, R.G.; Burnett, B.; Kramber, W.; Huntington, J.; Kjaersgaard, J.; Kilic, A.; Kelly, C.; Trezza, R. Automated calibration of the metric-landsat evapotranspiration process. JAWRA J. Am. Water Resour. Assoc. 2013, 49, 563–576. [Google Scholar] [CrossRef]
- Morton, C.G.; Huntington, J.L.; Pohll, G.M.; Allen, R.G.; McGwire, K.C.; Bassett, S.D. Assessing calibration uncertainty and automation for estimating evapotranspiration from agricultural areas using metric. JAWRA J. Am. Water Resour. Assoc. 2013, 49, 549–562. [Google Scholar] [CrossRef]
- Van der Ent, R.J.; Savenije, H.H.G.; Schaefli, B.; Steele-Dunne, S.C. Origin and fate of atmospheric moisture over continents. Water Resour. Res. 2010, 46, W09525. [Google Scholar]
- De Lange, R.; Beck, R.; van de Giesen, N.; Friesen, J.; de Wit, A.; Wagner, W. Scatterometer-derived soil moisture calibrated for soil texture with a one-dimensional water-flow model. IEEE Trans. Geosci. Remote Sens. 2008, 46, 4041–4049. [Google Scholar] [CrossRef]
- Bastiaanssen, W.G.M. Water Accountants: De Nieuwe Generatie Waterbeheercontroleurs, Intreerede; Delft University of Technology: Delft, The Netherlands, 2009. [Google Scholar]
- UN. System of Environmental Economic Accounting for Water; United Nations: Geneva, Switzerland, 2007. [Google Scholar]
- ABS. Water Account Australia 2000-01; Australian Bureau of Statistics: Canberra, ACT, Australia, 2004.
- Crouzet, P.; Gall, G.L.; Campling, P.; Basso, M.; Weber, J.L.; Gomez, O.; Kurnik, B. Results and Lessons from Implementing the Water Assets Accounts in the Eea Area, from Concept to Production; European Environmental Agency (EEA): Copenhagen, Denmark, 2013. [Google Scholar]
- Van de Giesen, N.; Hut, R.; Selker, J. The Trans-African Hydro-Meteorological Observatory (TAHMO). Wiley Interdisciplinary Reviews: Water 2014, 1, 341–348. [Google Scholar]
- Overeem, A.; Leijnse, H.; Uijlenhoet, R. Country-wide rainfall maps from cellular communication networks. Proc. Natl. Acad. Sci. USA 2013, 110, 2741–2745. [Google Scholar] [CrossRef] [PubMed]
© 2014 by the authors; licensee MDPI, Basel, Switzerland. This article is an open access article distributed under the terms and conditions of the Creative Commons Attribution license (http://creativecommons.org/licenses/by/4.0/).
Share and Cite
Bastiaanssen, W.G.M.; Karimi, P.; Rebelo, L.-M.; Duan, Z.; Senay, G.; Muthuwatte, L.; Smakhtin, V. Earth Observation Based Assessment of the Water Production and Water Consumption of Nile Basin Agro-Ecosystems. Remote Sens. 2014, 6, 10306-10334. https://doi.org/10.3390/rs61110306
Bastiaanssen WGM, Karimi P, Rebelo L-M, Duan Z, Senay G, Muthuwatte L, Smakhtin V. Earth Observation Based Assessment of the Water Production and Water Consumption of Nile Basin Agro-Ecosystems. Remote Sensing. 2014; 6(11):10306-10334. https://doi.org/10.3390/rs61110306
Chicago/Turabian StyleBastiaanssen, Wim G.M., Poolad Karimi, Lisa-Maria Rebelo, Zheng Duan, Gabriel Senay, Lal Muthuwatte, and Vladimir Smakhtin. 2014. "Earth Observation Based Assessment of the Water Production and Water Consumption of Nile Basin Agro-Ecosystems" Remote Sensing 6, no. 11: 10306-10334. https://doi.org/10.3390/rs61110306
APA StyleBastiaanssen, W. G. M., Karimi, P., Rebelo, L.-M., Duan, Z., Senay, G., Muthuwatte, L., & Smakhtin, V. (2014). Earth Observation Based Assessment of the Water Production and Water Consumption of Nile Basin Agro-Ecosystems. Remote Sensing, 6(11), 10306-10334. https://doi.org/10.3390/rs61110306