Oil Palm Tree Detection with High Resolution Multi-Spectral Satellite Imagery

Abstract
: Oil palm tree is an important cash crop in Thailand. To maximize the productivity from planting, oil palm plantation managers need to know the number of oil palm trees in the plantation area. In order to obtain this information, an approach for palm tree detection using high resolution satellite images is proposed. This approach makes it possible to count the number of oil palm trees in a plantation. The process begins with the selection of the vegetation index having the highest discriminating power between oil palm trees and background. The index having highest discriminating power is then used as the primary feature for palm tree detection. We hypothesize that oil palm trees are located at the local peak within the oil palm area. To enhance the separability between oil palm tree crowns and background, the rank transformation is applied to the index image. The local peak on the enhanced index image is then detected by using the non-maximal suppression algorithm. Since both rank transformation and non-maximal suppression are window based, semi-variogram analysis is used to determine the appropriate window size. The performance of the proposed method was tested on high resolution satellite images. In general, our approach uses produced very accurate results, e.g., about 90 percent detection rate when compared with manual labeling.1. Introduction
1.1. The Need for Oil Palm Tree Detection
Oil palm is a perennial monocot plant with a long generation period of about 25 years. It is an important economic crop in tropical areas of Southeast Asia, Africa and South America. Oil palm is the most efficient oil seed crop in the world when compared to other oilseed crops such as soybean, sunflower, rapeseed or canola, peanut, cottonseed, coconut, olive, etc. One hectare of oil palm plantation can produce up to ten times more oil than other leading oilseeds [1]. Palm oil is used in a wide variety of food products and is a raw material in the production non-food products. Global demand for palm oil has grown exponentially during the last 50 years. Palm oil accounted for more than 30% of all edible oil production in 2012/2013.
Accurate inventories and monitoring of oil palm areas are critical for plantation management and plant area expansion. Remote sensing is one of the most reliable measurement tool for accurate monitoring over large areas. Tan et al. [2] demonstrated some techniques for studying the age of oil palm trees using UK-DMC 2 and ALOS PALSAR remote sensing data. Age is one of the important factors influencing the production of fruit bunches, which begins at the time a tree reaches maturity at about 3 years, with production reaching a peak between 6 and 10 years. Tan found that texture measurement and fraction of shadow are useful for studying the age of oil palm trees. Santoso et al. [3] investigated the potential of high resolution satellite imagery for detecting oil palms infected by basal stem rot disease, and for mapping the disease. Basal stem rot disease can cause of up to 50% loss of the palms in a plantation. The article reported that vegetation indices derived from remote sensing imagery can discriminate between healthy and infected oil palms with a mapping accuracy of 84%. Tan et al. [4] estimated oil palm productivity on a large scale using existing remote sensing based models. These models use Light Use Efficiency (LUE) logic. This study concluded that the existing remote sensing based models need to be modified to incorporate meteorological inputs, environmental constraints, and maximum LUE as a constant value, in order to accurately estimate oil palm productivity. Thenkabail et al. [5] developed a comprehensive methodological framework for oil palm carbon and biomass estimation using a multi-date wet and dry season high spatial resolution IKONOS dataset. The study site was West Africa, where oil palm trees are found primarily in shifting cultivation agro-forest farms. Morel et al. [6,7] tried to estimate and evaluate the potential for monitoring aboveground biomass in forest and oil palm plantation in Sabah, Malaysian Borneo using Landsat ETM+ and ALOS PALSAR data.
1.2. Related Methods
The purpose of oil palm tree detection is to locate or count oil palm trees on map, aerial image or satellite imagery. This information is the key factor for oil palm plantation management and monitoring in each plantation area. Knowing the amount of oil palm tree in each plantation area can facilitate the yield prediction. The simplest way to detect oil palm is to manually mark the oil palm trees on images or field surveying using GPS to collect the positions of oil palm trees and display their position on the image. However, if there a lot of oil palm plantation areas, which can be large and contain more than 1000 oil palm tress, manual detection and field surveying can be a time consuming process and expensive. This case is where remote sensing technique.
Broadly speaking, the oil palm tree detection can be considered as the tree detection problem which is an on-going research problem in remote sensing. The goal of tree detection is to extract tree positions or tree crowns from given data, i.e., photograph or laser point cloud. Existing methods for tree detection can be grouped in terms of data used. This work concentrates on using high-resolution image instead of LiDAR. A drawback of using LiDAR for detecting trees is the requirement of high point density, which is costly and requires large data storage. Moreover, using high resolution images, oil palm tree can be easily recognized and identified on images.
Aerial photograph and satellite imagery have been the most widely used data for the application of tree delineation or detection. Wulder et al. [8–11] performed a series of studies on the use of a local maximum filter to detect tree location in high spatial resolution imagery, i.e., airborne and satellite-borne images. The local maximum filter is applied to the intensity image to find local peaks which are hypothesized to be the likely positions of trees. Similarly, Gebreslasie et al. [12] used the concept of local peak detection for locating individual trees in plantation forest in KwaZulu-Natal, South Africa. Their method is based on the use of Gaussian filter to smooth satellite image in order to eliminate noise. Furthermore, extremely bright and dark areas are removed by using natural break classification. In order to determine the window size for local peak detection, they employed the semi-variogram. Szantoi et al. [13] used Sobel edge detection and several (color) band combinations to detect downed trees (palms and deciduous) from very high spatial resolution (0.3 m) aerial imagery. This resolution is very close to the one the authors use in this study.
In stead of detecting only the position of trees, some approaches also delineating tree crowns. In [14], Culvenor presented a method for automatically delineating tree crowns in high spatial resolution image. The method first detects the tree crown centroid, (i.e., the image coordinates of the likely crown peak) by detecting local radiometric maxima. The local maximum pixels are then used to construct boundaries between all likely tree crowns. The digital number/brightness of the maxima pixels is used to compute the threshold for aggregating contiguous pixels within the same boundary defined by local minima pixels into a unique tree crown. The seed points for the aggregation are the maxima pixels. This work was tested on imagery of native Eucalypt forests in Australia.
Jiang and Lin [15] introduced a method for the delineation of individual deciduous trees in leaf-off aerial Ultra-High Spatial Resolution Remotely Sensed (UHSRRS) imagery. Individual tree locations are first detected by using mathematical morphology. Given the potential tree locations, tree boundaries are then identified by the marker-controlled watershed segmentation algorithm. The segmented tree regions are then classified as deciduous or coniferous by using a distribution free support vector machine, i.e., least-square support vector machine. The drawback of this method is that it required ultra-high resolution image which can be impractical.
Ardila et al. [16] presented an active contour based method for the tree detection in urban areas using very high resolution image. The process starts with the computation of a normalized difference vegetation index image. The local peaks on the image are then detected. The likely boundaries of the tree are defined as ellipses and extracted by fitting a two-dimensional Gaussian equation around the detected local peak. The obtained ellipses are then refined by using active contour model to get more realistic tree boundaries. Since the active contour is used to refine the shapes of tree crown boundaries, this approach can be impractical when ultra-high resolution image is not used.
Shafri et al. [17] proposed a method for detecting oil palm trees in an image of an oil palm plantation site. The input data was airborne hyperspectral imagery which provides rich information for removing non-oil palms from the image. To detect oil palm trees, this method employed several processing algorithms. Texture analysis, i.e., grey-level co-occurrence matrix was used to make the oil palm area more homogeneous. Edge enhancement, particularly the Sobel edge filter, was then applied to delineate edges. Oil palm trees were then extracted by using a threshold technique. The shapes of the extracted oil palm trees were refinned by morphology reconstruction and the number of oil palm trees was counted by blob analysis. The drawback of this approach is that only hyperspectral image is required.
The study reported in this paper deals with the problem of oil palm tree detection from an image of an oil palm plantation area on high resolution multi-spectral imagery. That is, a novel algorithm is proposed. An advantage of the proposed method is that only high resolution multispectral satellite image is required in contrast to [15–17] which require very high resolution or hyperspectral images. The concept of the proposed method is based on the local peak detection on a vegetation index image. Since there are various existing vegetation indices, we propose to use the vegetation index having the most power in discrimination between oil palm and non-oil palm objects. With the feature selection process, the proposed method is versatile because some indices cannot be extracted from some imagery or when the radiometric information is transformed. For example, the radiometric information of pan-sharpened image is transformed; radiance transformation cannot be computed. As a result, NDVI cannot show the true phenology of trees.
The remaining of this paper is organized as following; in Section 2, the proposed method and also the dataset used in the experiment are introduced. The experimental result and performance evaluation are reported in Section 3. The detection accuracy and discussion will be in Section 4. The conclusion of this work will be presented in Section 5.
2. Material and Method
2.1. Dataset
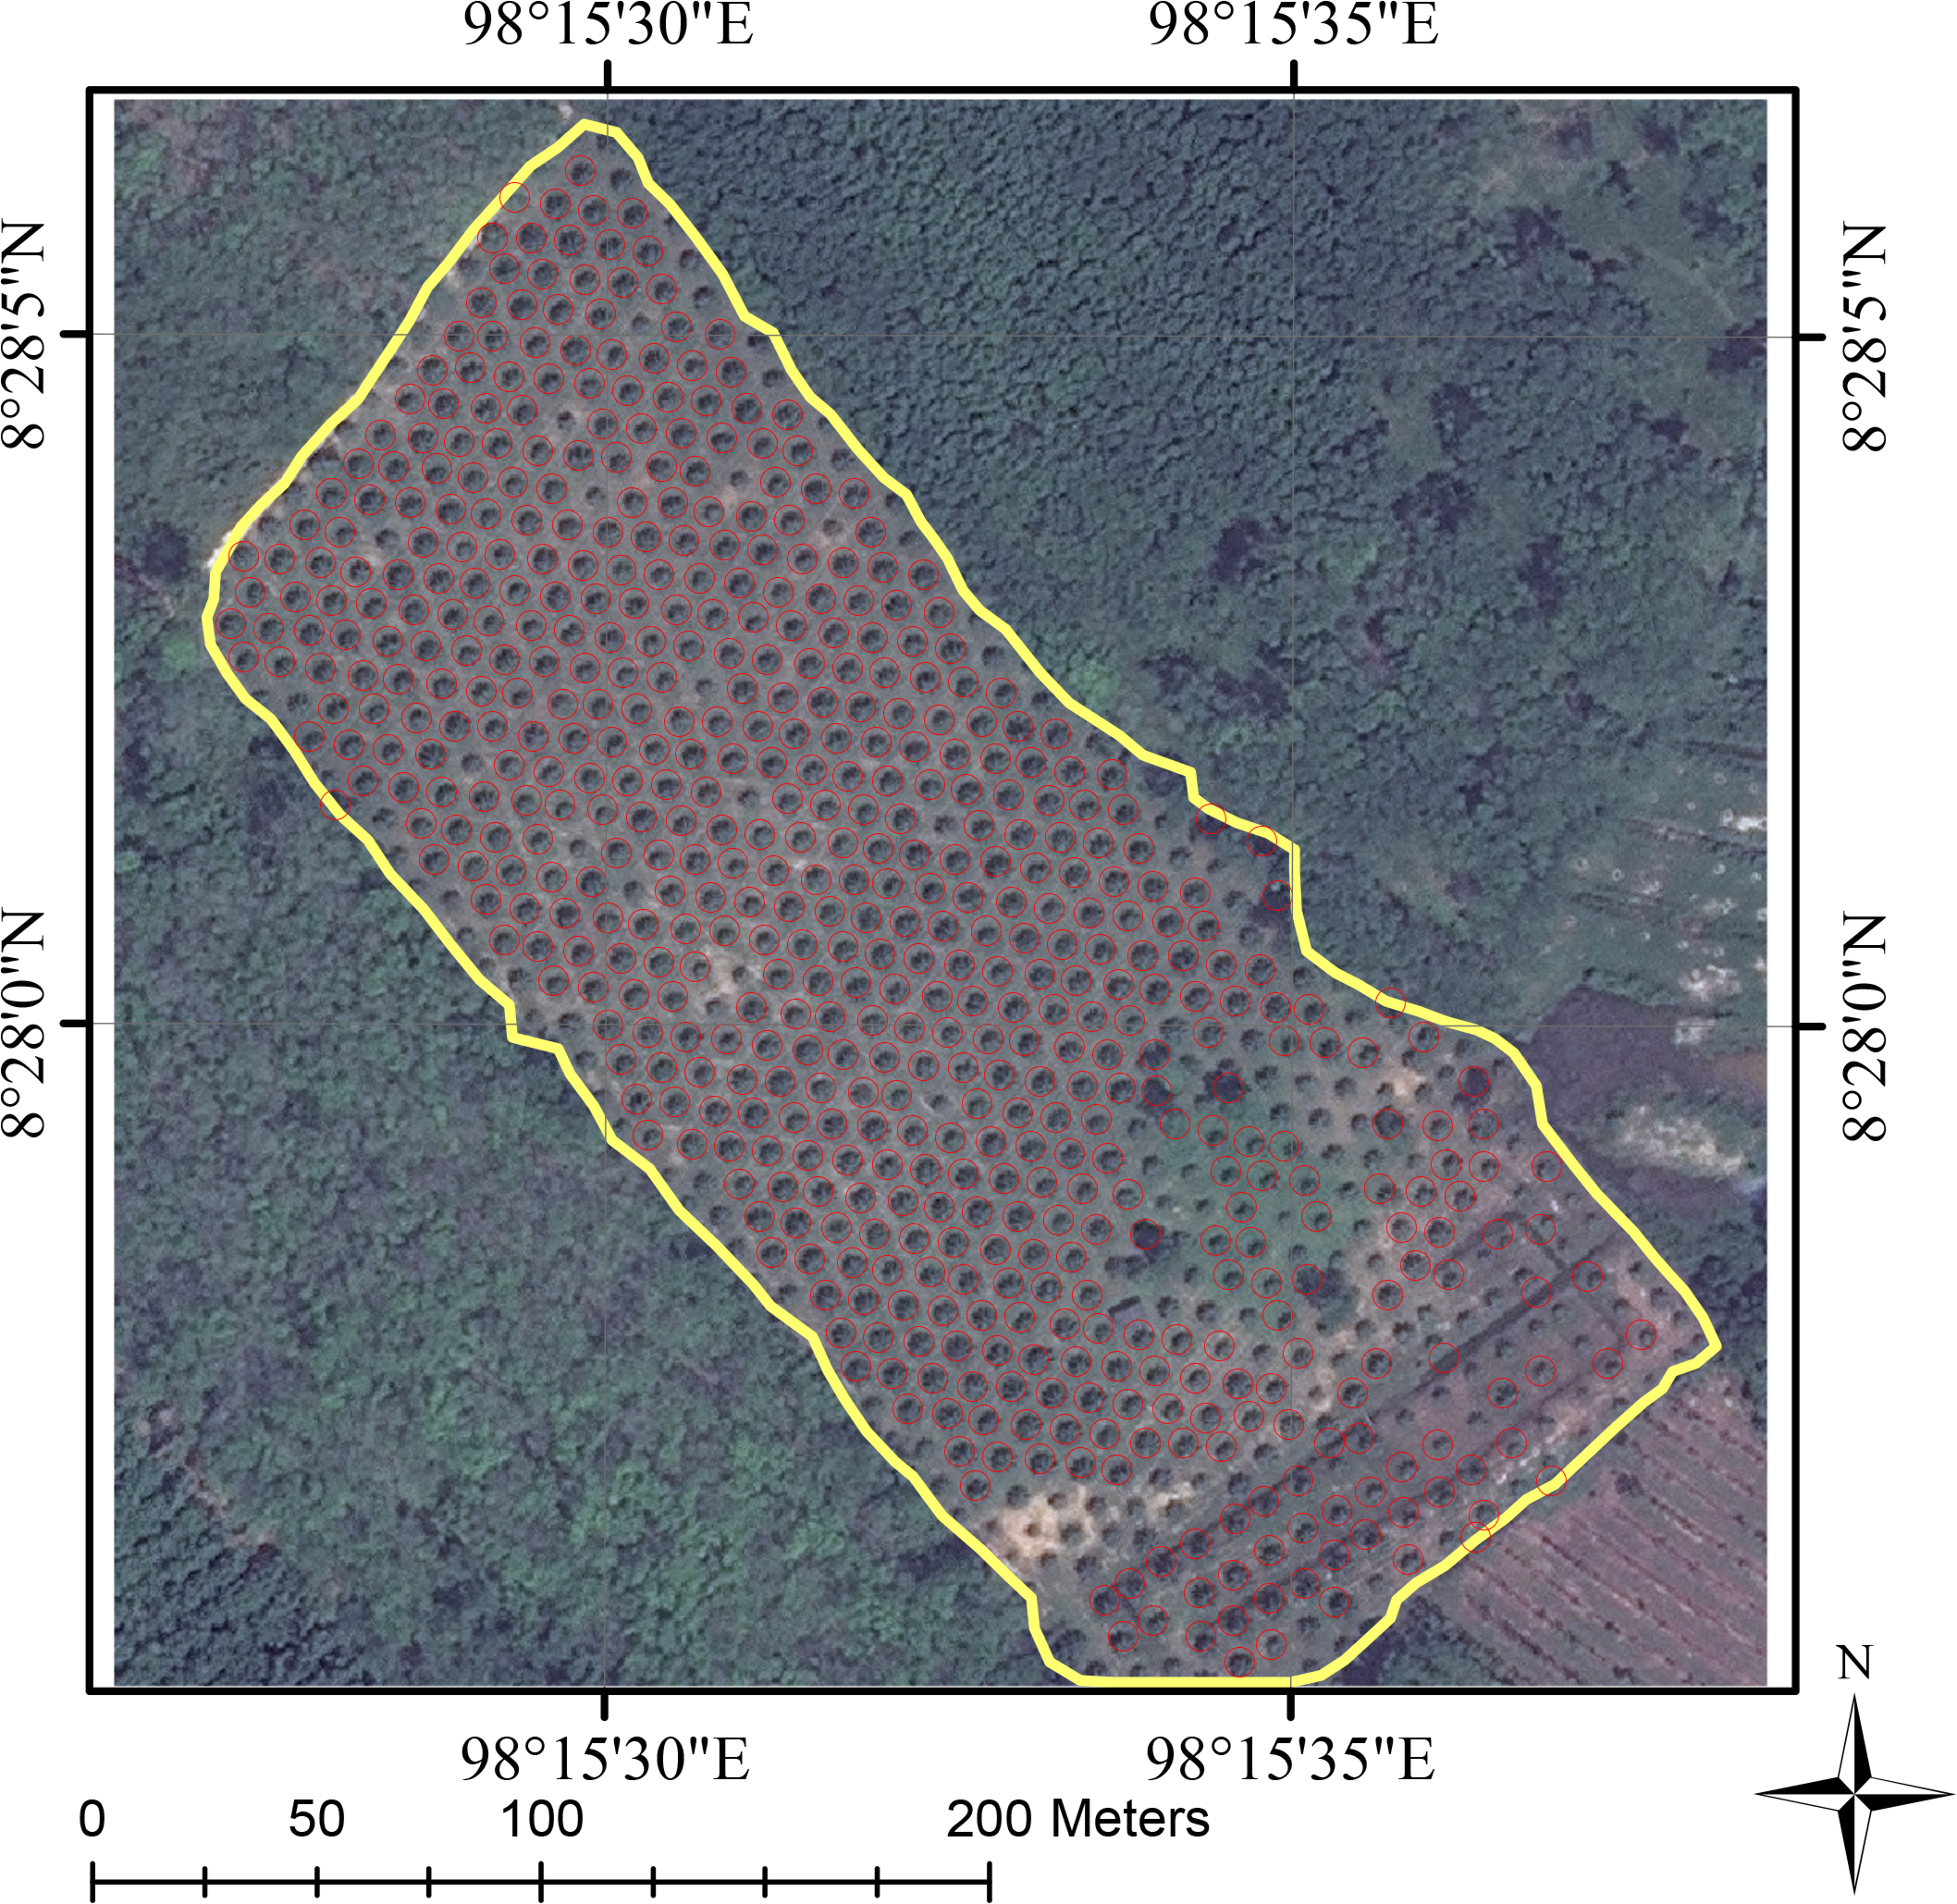
In our experiments, to evaluate the performance of our proposed palm detection method, QuickBird imagery of Phang-nga province in the southern region of Thailand centered at 8.4397°N, 98.5181°E was utilized. This area has been traditionally cultivated intensively with oil palm and rubber tree. The pan sharpened imagery has ground sampling distance about 60 cm per pixel and 4 bands including blue, green, red and near-infrared. With this spatial resolution, it can be recognized and identified an individual tree crown whose radius is more than 2 or 3 m. We manually selected the palm plantation areas and marked their boundaries. Moreover, pan-sharpened WorldView-2 imagery of Phuket province centered at 7.8900°N, 98.3983°E was also used to demonstrate the performance of the proposed method. Both of the imagery used in this work were already ortho-rectified without radiance transformation.
2.2. Workflow of the Oil Palm Tree Detection Method
In this paper, a method for detecting individual oil palm trees using high-resolution multi-spectral images, particularly in plantation areas is proposed. The images used in this methods are already ortho-rectified and can be either RGB or RGB with NIR. After the boundary of the plantation area has been manually marked, a local peak detection approach is applied. In this approach, the tree crown apex is assumed to have locally maximal digital number, e.g., reflectance or vegetation index, greater than that of surrounding neighbours within the window.
The local peak detection is applied on a vegetation index image derived from the multi-spectral image. There are several predefined indices. The best index is chosen, where best is defined as the index that maximizes inter-class dissimilarity oil palm trees and non-oil palm samples.
As explained previously, the proposed method is based the use of local peak detection which can be implemented by using 2D window function. The determination of the window size is hence very important. We propose to use a fixed-window size for any one image, which is estimated by using 2D semi-variogram technique. This approach is used because the pattern of oil palm plantation area is normally well structured i.e., the distances between an one oil palm tree and its neighbors are close to constant.
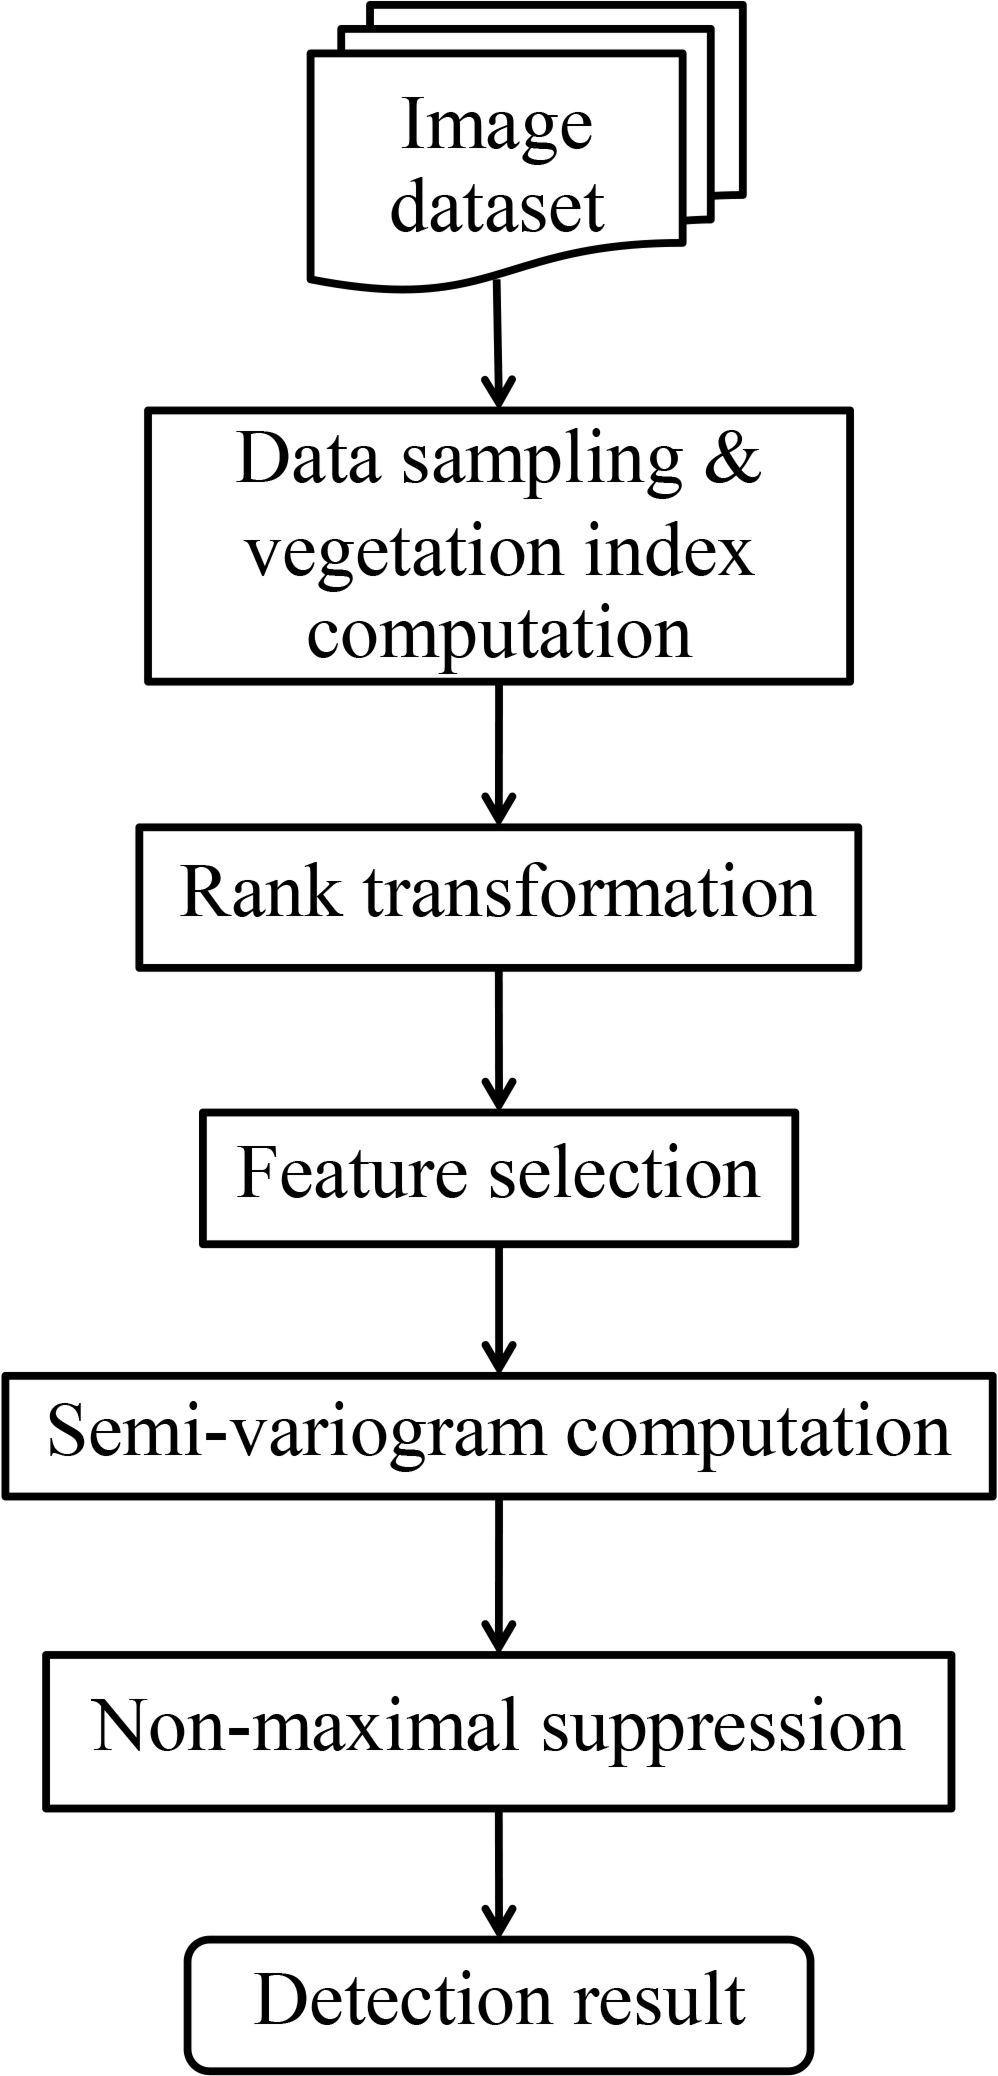
After the appropriate vegetation index feature and window size are determined, the method proceeds to the enhancement of the index image. In order to maximize the distinction between oil palm and non-oil palm trees, a rank transformation is applied to the vegetation index image. The local peaks are then detected with a non-maximal suppression algorithm using the window size obtained from the 2D semi-variogram technique. The work flow of the proposed method is summarized in the Figure 1.
2.3. Calculation of Vegetation Indices
To detect objects of interest on an image, the first step is commonly to reduce the amount of information by using image features. Since the proposed method is oriented toward green segmentation, i.e., palm trees, we believe that vegetation indices are good features for this purpose. In literature, there exist various spectral indices defined for inferring surface properties, for example, vegetation health, burned area and fire severity. In other words, these indices were usually defined for specific tasks [18,19]. To choose an appropriate feature for palm tree detection, some vegetation indices presented in the literature are reviewed. The discussion on how to select an appropriate index is deferred to Section 3.2.2. Note that the purpose of using vegetation indices in this work is not to find the true phenology of tree but just to differentiate oil palm tree and background. Therefore, the radiance transformation of the images is not required in this work because the true phenology of the tree is not needed in this work.
In [20], Guijarro et al. utilized various indices in the segmentation of agricultural images. Such indices include Excess Green (ExG), Excess Red (ExR), Excess Blue (ExB) and Excess Green minus excess Red (ExGR). Given an image in the RGB color space, the computation of those indices starts from the normalization of spectral red (R), green (G) and blue(B) components at a certain pixel:
As a consequence, the normalized spectral r, g and b are in the range [0, 1]. The indices are then computed as following:
In [21], Woebbecke et al. used green and red bands to compute Normalized Difference Index (NDI) for distinguishing plants from the soil:
The aforementioned indices are very useful for segmenting vegetation on an image when only red, green and blue spectral bands are available. However most remote sensing satellites provide images in the RGB-NIR space. Given an image with higher spectral resolution, the NIR spectrum can be taken into account in defining vegetation indices. The simplest vegetation index using NIR spectrum is the simple ratio [22]:
It is the most commonly used vegetation index. Its values vary between −1 and 1. The NDVI can be modified to obtained Transformed Vegetation Index (TVI):
In general, the radiance transformation should be performed before computing vegetation indices in order to obtain true vegetation indices. However, in this work, the vegetation indices are not used for monitoring the true phenology of the oil palm tree; they are actually used for differentiating oil palm tree and backgrounds. The true vegetation indices are not hence required.
2.4. Feature Selection
As it was discussed previously, different vegetation indices have been defined for specific tasks. Their relative performance in palm tree detection problem can vary. Another reason for performing feature selection is that some index cannot be always computed. For example, when NIR band is not available, NDVI, which is widely used in remote sensing for separating soil and vegetation, cannot be computed. The feature selection process will select a suitable index from all of the indices that can be computed from the image. The input data for the proposed method is hence not limited to only multi-spectral or satellite imagery. That is, RGB image or aerial photograph can be used. Moreover, the feature selection can make the proposed more robust when the radiometric contents are distorted or transformed, i.e., the case of pan-sharpened images. In this case, the computed indices are not the true ones; the commonly used index, e.g., NDVI is a suitable one for classification.
In statistical pattern classification, a suitable feature is one that clearly separates or has high discriminating power between classes. In this case, oil palm trees are needed to be separated from background. To evaluate the discriminating power of a feature, let us consider this process as the binary classification problem. The aim of this problem is to classify two objects, i.e., palm tree and background. A basic approach for measuring the discrimination ability of a vegetation index is to use the dissimilarity between two histograms generated from the index values for the two classes to be distinguished (palm tree and background samples, in our study). Such dissimilarity can be measured by the dissimilarity/distance metric between two histograms.
In this paper, only the measures follow the metric properties are used in the evaluation because of the symmetry and ease of the interpretation. Measures that satisfy this constraint are listed in Table 1. The performance evaluation for each spectral index will be reported in Section 3 and the vegetation index having highest discriminating power will used in our experiment. Since there are various measures, the discriminating power, in this study, is therefore formulated as the summation of all histogram measures. The concept of using the summation of measures to evaluated the similarity between histograms is similar to the work of Stricker and Orengo [26] using the sum of the weighted distances of the histograms first three moments as the similarity measure. In [27], the using of multiple dissimilarity measures in classification problem, i.e., 2-class classification was analyzed. It was reported that a better classification performance can be obtained by the combination of dissimilarity measures.
2.5. Estimation of Appropriate Window Size
To estimate an appropriate window size for rank transformation and non-maximal suppression, it is assumed that the spatial pattern of palm tree is well structured, e.g., two consecutive palm trees are equally spaced. The semi-variogram technique is employed to extract the spatial pattern of the palm tree farm. As a result, an approximate distance between two neighbor palm trees can be obtained and used as the upper-bound for the window size of rank transform and non-maximal suppression.
The semi-variogram, which is referred to experimental variogram in this paper, is a technique for image texture characterization (Atkinson and Lewis [28]). The spatial arrangement of objects in image can be extracted including the spatial distance between objects, surface roughness or orientation of the pattern. As an example, Trias-Sanz [29] used a 2D semi-variogram to analyze the structures of plantation fields. In [30], Szantoi et al. used semi-variogram to estimate the window size for different texture features. The semi-variogram V of an n-band image I can be obtained by first computing:
The normalized semi-variogram V of the image I can then be computed by first finding the minimum and maximum of D while ignoring the values near the origin:
As a result, the semi-variogram V is then normalized to the range [0, 1]. The average distance between local peaks on the 2D semi-variogram V and its neighbors is assumed to be the average distance between palm trees and will be used as the window size for rank transform and non-maximal suppression.
2.6. Rank Transformation
The rank transformation was originally developed for the problem of stereo matching, by Zabih and Woodfill [31] and Hirschmuller and Scharstein [32]. Precisely, it was proposed to improve the robustness of template matching. The expected result from the rank filter is the removal of blurred object borders. Hence, this filter may provide benefits in our application because the discontinuity between the palm and background intensities will be increased.
The concept of the rank filter is based on the relative order of the intensity values in a local region. The rank filter replaces the intensity of a pixel p by the number of pixels in the neighborhood of the pixel p whose intensity is less than the intensity of the pixel p. It can be formally defined as:
One of the factors affecting the result of the rank transformation is the window size. We proposed to use the average distance between a local peak and its nearest neighbor, which is obtained from 2D semi-variogram, because when the window is located at a local peak, which is hypothesized to be the position of palm tree, the window will not cover other local peaks. Thus the intensity of the single peak where the window is located will be dominant. In other words, if the window size is too large, the window will cover many local peaks. As a consequence, the result from the rank transform will be a smooth image and local peaks can disappear.
Promising results from applying the rank filter to enhance our image features in palm tree detection will be illustrated in Section 3.
2.7. Local Peak Detection
The result from the feature enhancement methods is then used for the detection of palm trees. Since the possible region of palm trees are the regions with high digital number, a local peak detector is used. However, a local peak detector cannot be directly applied to the image because the shapes of some areas on the image surface can be flat-topped hill. That is, the peak cannot be well localized if we are finding local peak on flat-topped hill area. To diminish this problem, the Gaussian filter is first applied to the image. Moreover, the Gaussian filter, which is a low pass filter, also reduces the potential problem of multiple peaks a local area.
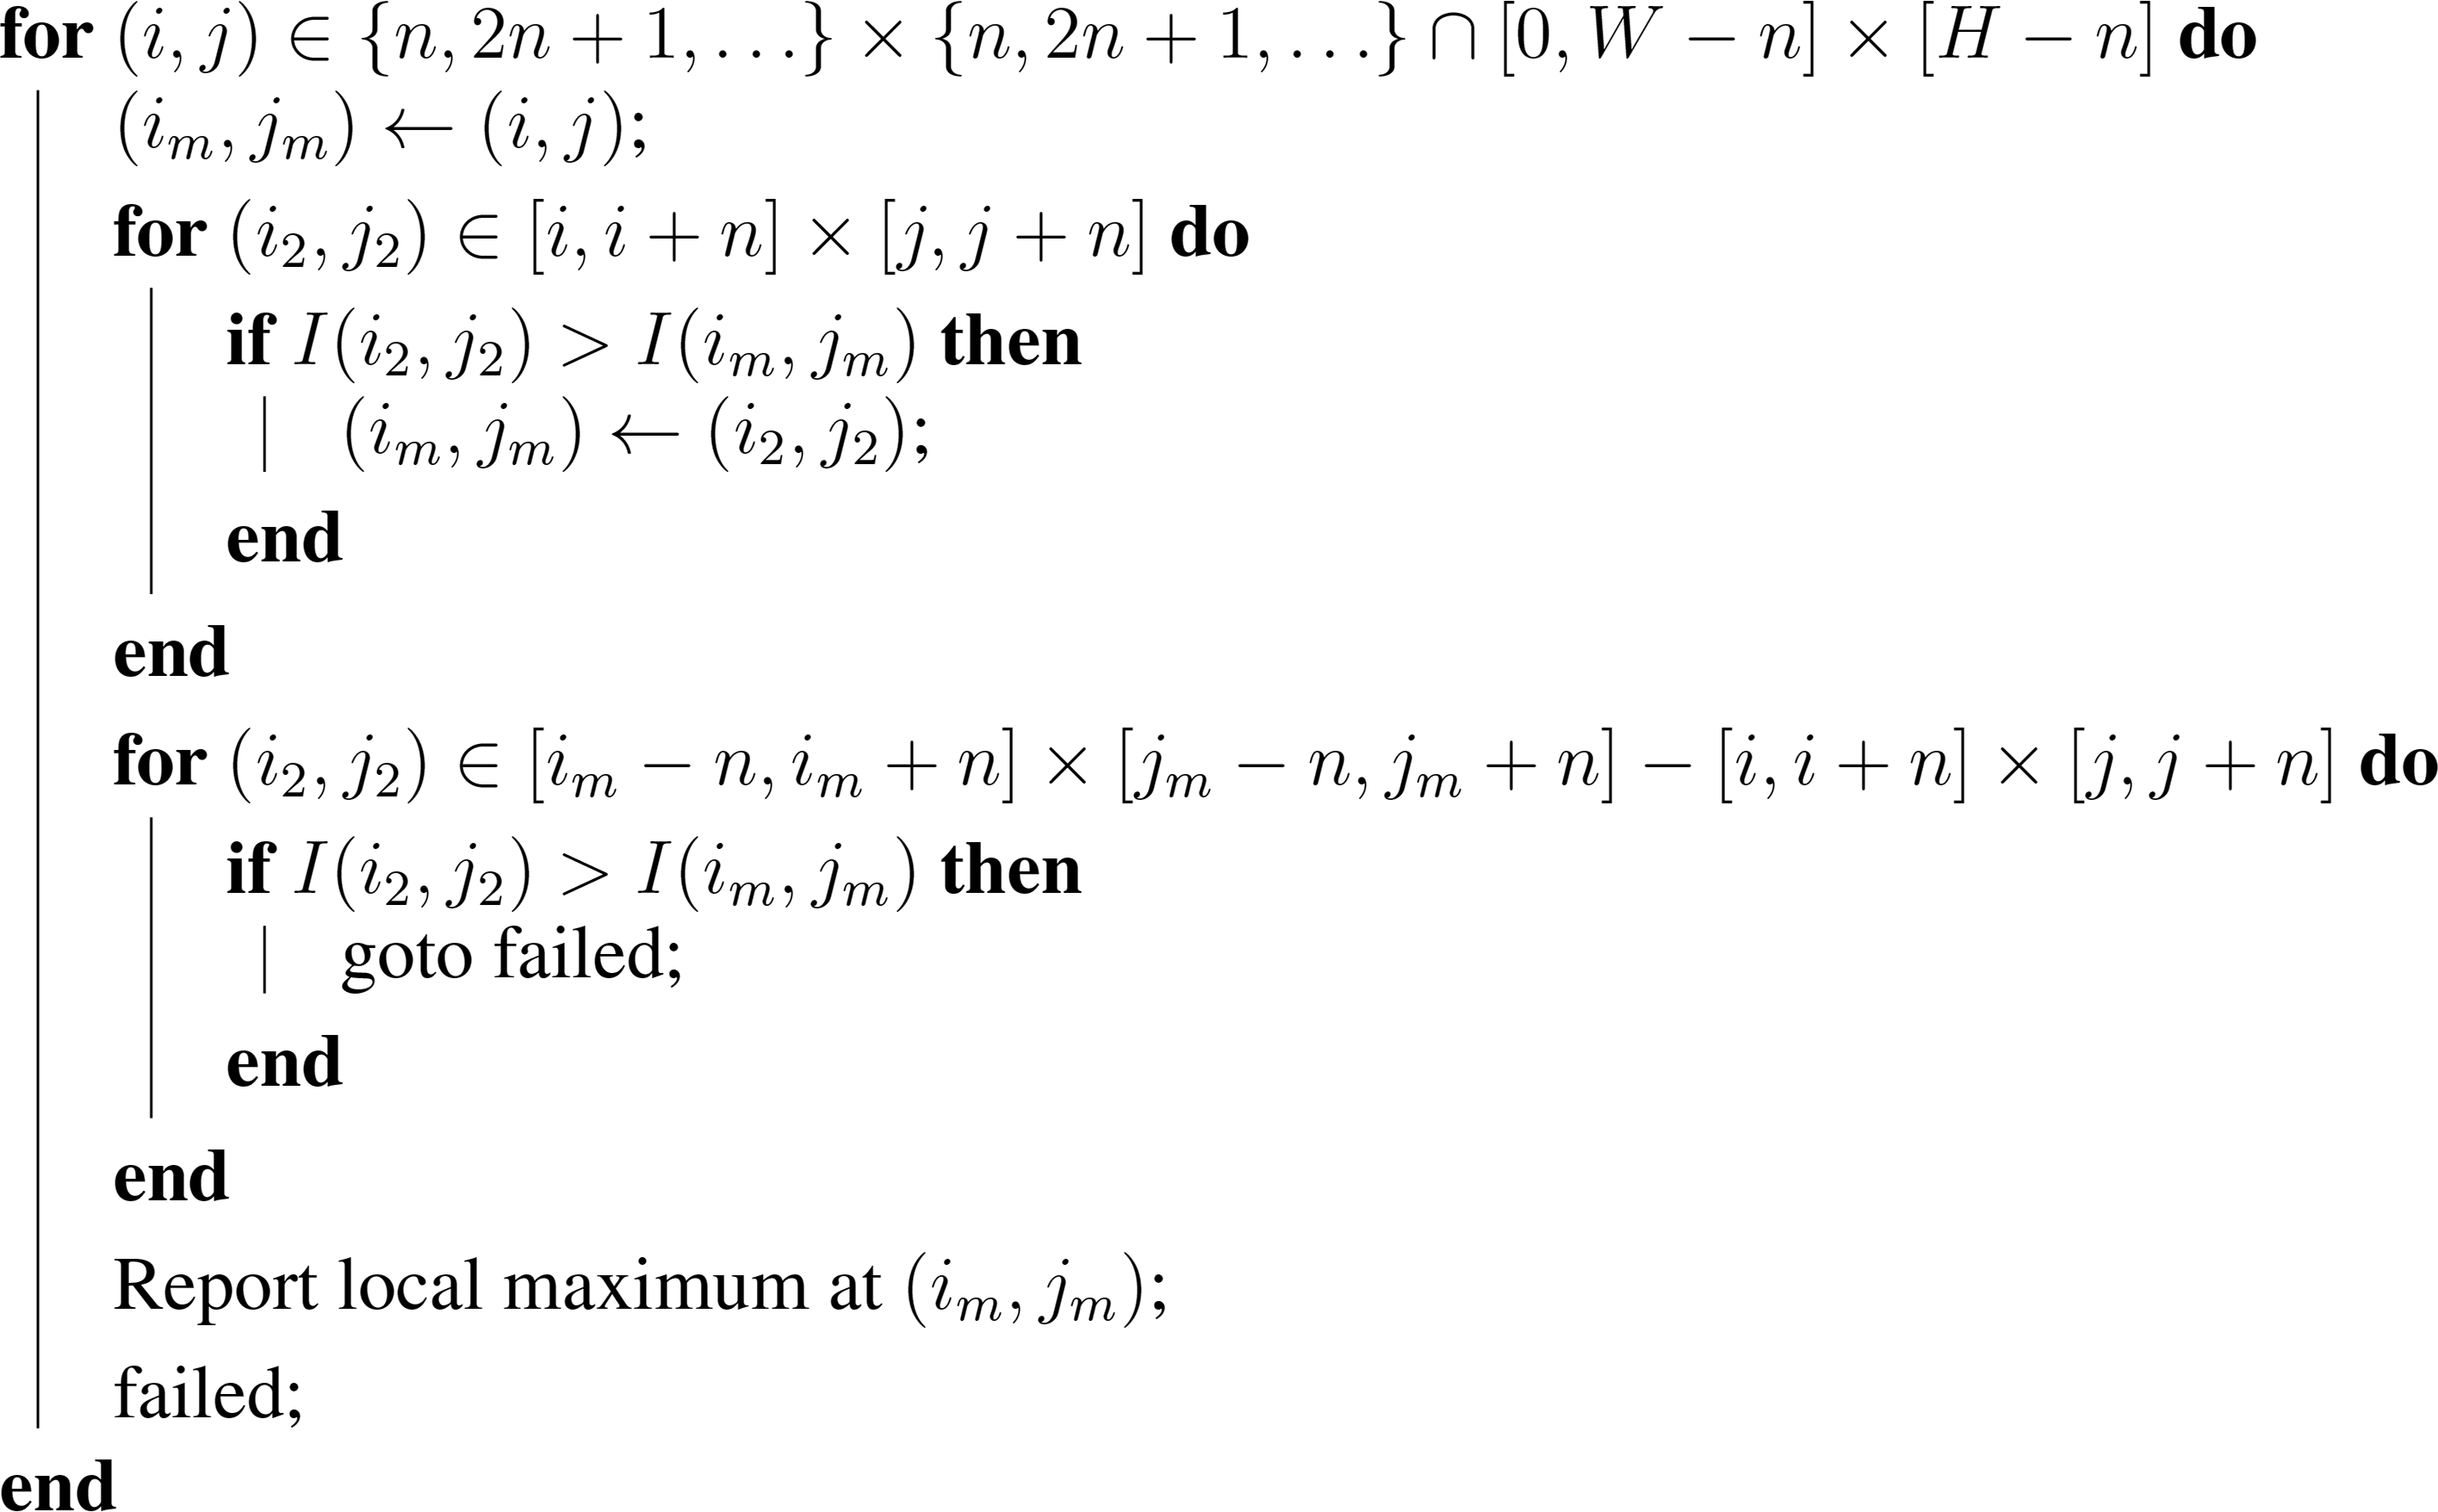
In this proposed work (Algorithm 1), a non-maximal suppression algorithm for detecting local peaks is employed. Particularly, the algorithm proposed by Neubeck and van Gool [33] is used. The algorithm seeks to find the local peak in (2n + 1) by (2n + 1) windows; the parameter n can be estimated such that 2n + 1 is close to the average distance between oil palm trees, as calculated by the semi-variogram technique explained in Section 2.5.
The crucial parameter for the non-maximal suppression is n. If n is too large, the searching window will contain many local peaks, only one of which will be selected by non-maximal suppression. Particularly, the non-maximal suppression is analogous to finding local peak in 2n by 2n window. Therefore, we suggest to used the half of the average distance between a local peak and its nearest neighbor obtained from the semi-variogram for the parameter n because the searching window is less likely to cover other local peaks which are hypothesized as the locations of other oil palm trees.
2.8. Performance Measures
To evaluate the performance of the proposed method, we compare the detection results from the proposed method with a reference solution based on manual interpretation. The comparison with the reference data can be quantitatively shown by common performance metrics. Before proceeding to the discussion about the performance metrics, let us first introduce some important terms which are. True Positive (TP), False Positive (FP) and False Negative (FN). A TP, in this context, is an oil palm tree that is correctly detected by the proposed method. A FN is an oil palm tree that is not detected. A FP represent a pixel that is identified as an oil palm tree but which is really something else.
For the object detection problem, common performance metrics for evaluating a detection strategy are the precision, recall and the F-measure [34–36]. These metrics are defined as following:
3. Experimental Results
To evaluate the performance of the proposed palm detection methods, several images of oil palm plantation areas were used to conduct experiment. Those images were subsets of of a multi-spectral satellite imagery. This section presents the detection results. To evaluate the quality of our results, we compared them with the results from manual detection by a human image interpreter. The performance of the proposed method is evaluated by using commonly used metrics such as precision and recall.
3.1. Feature Selection
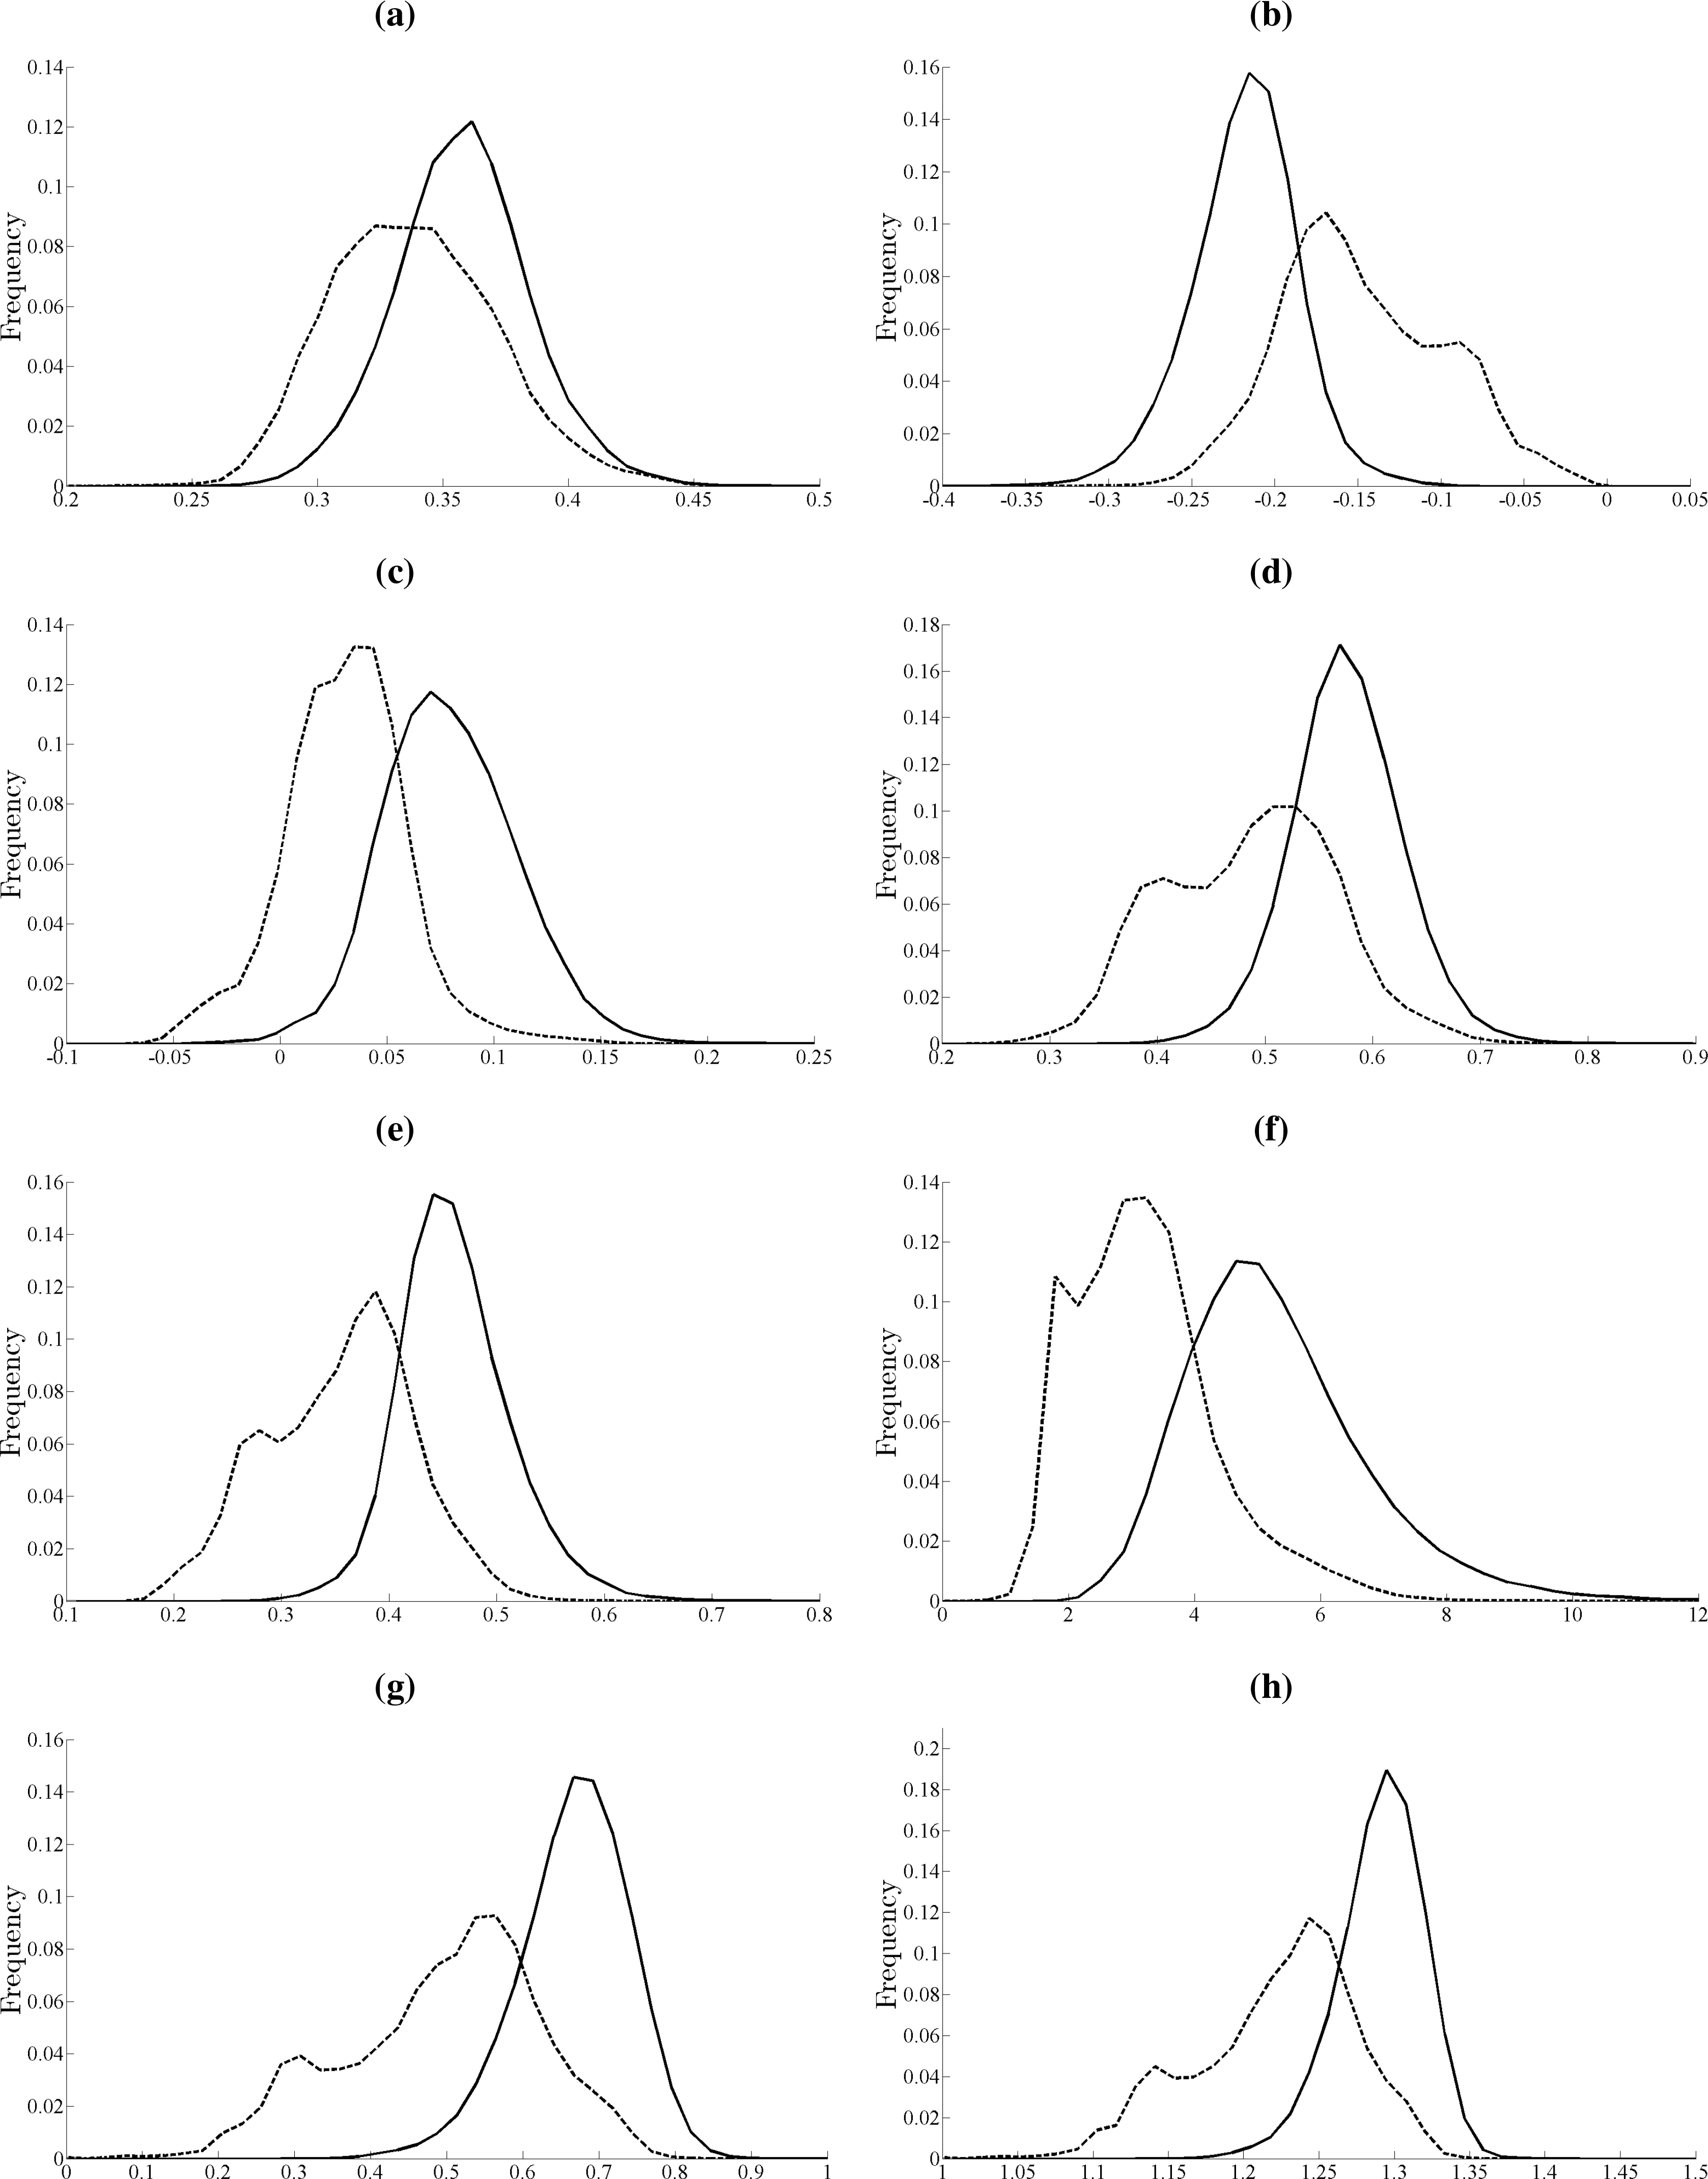
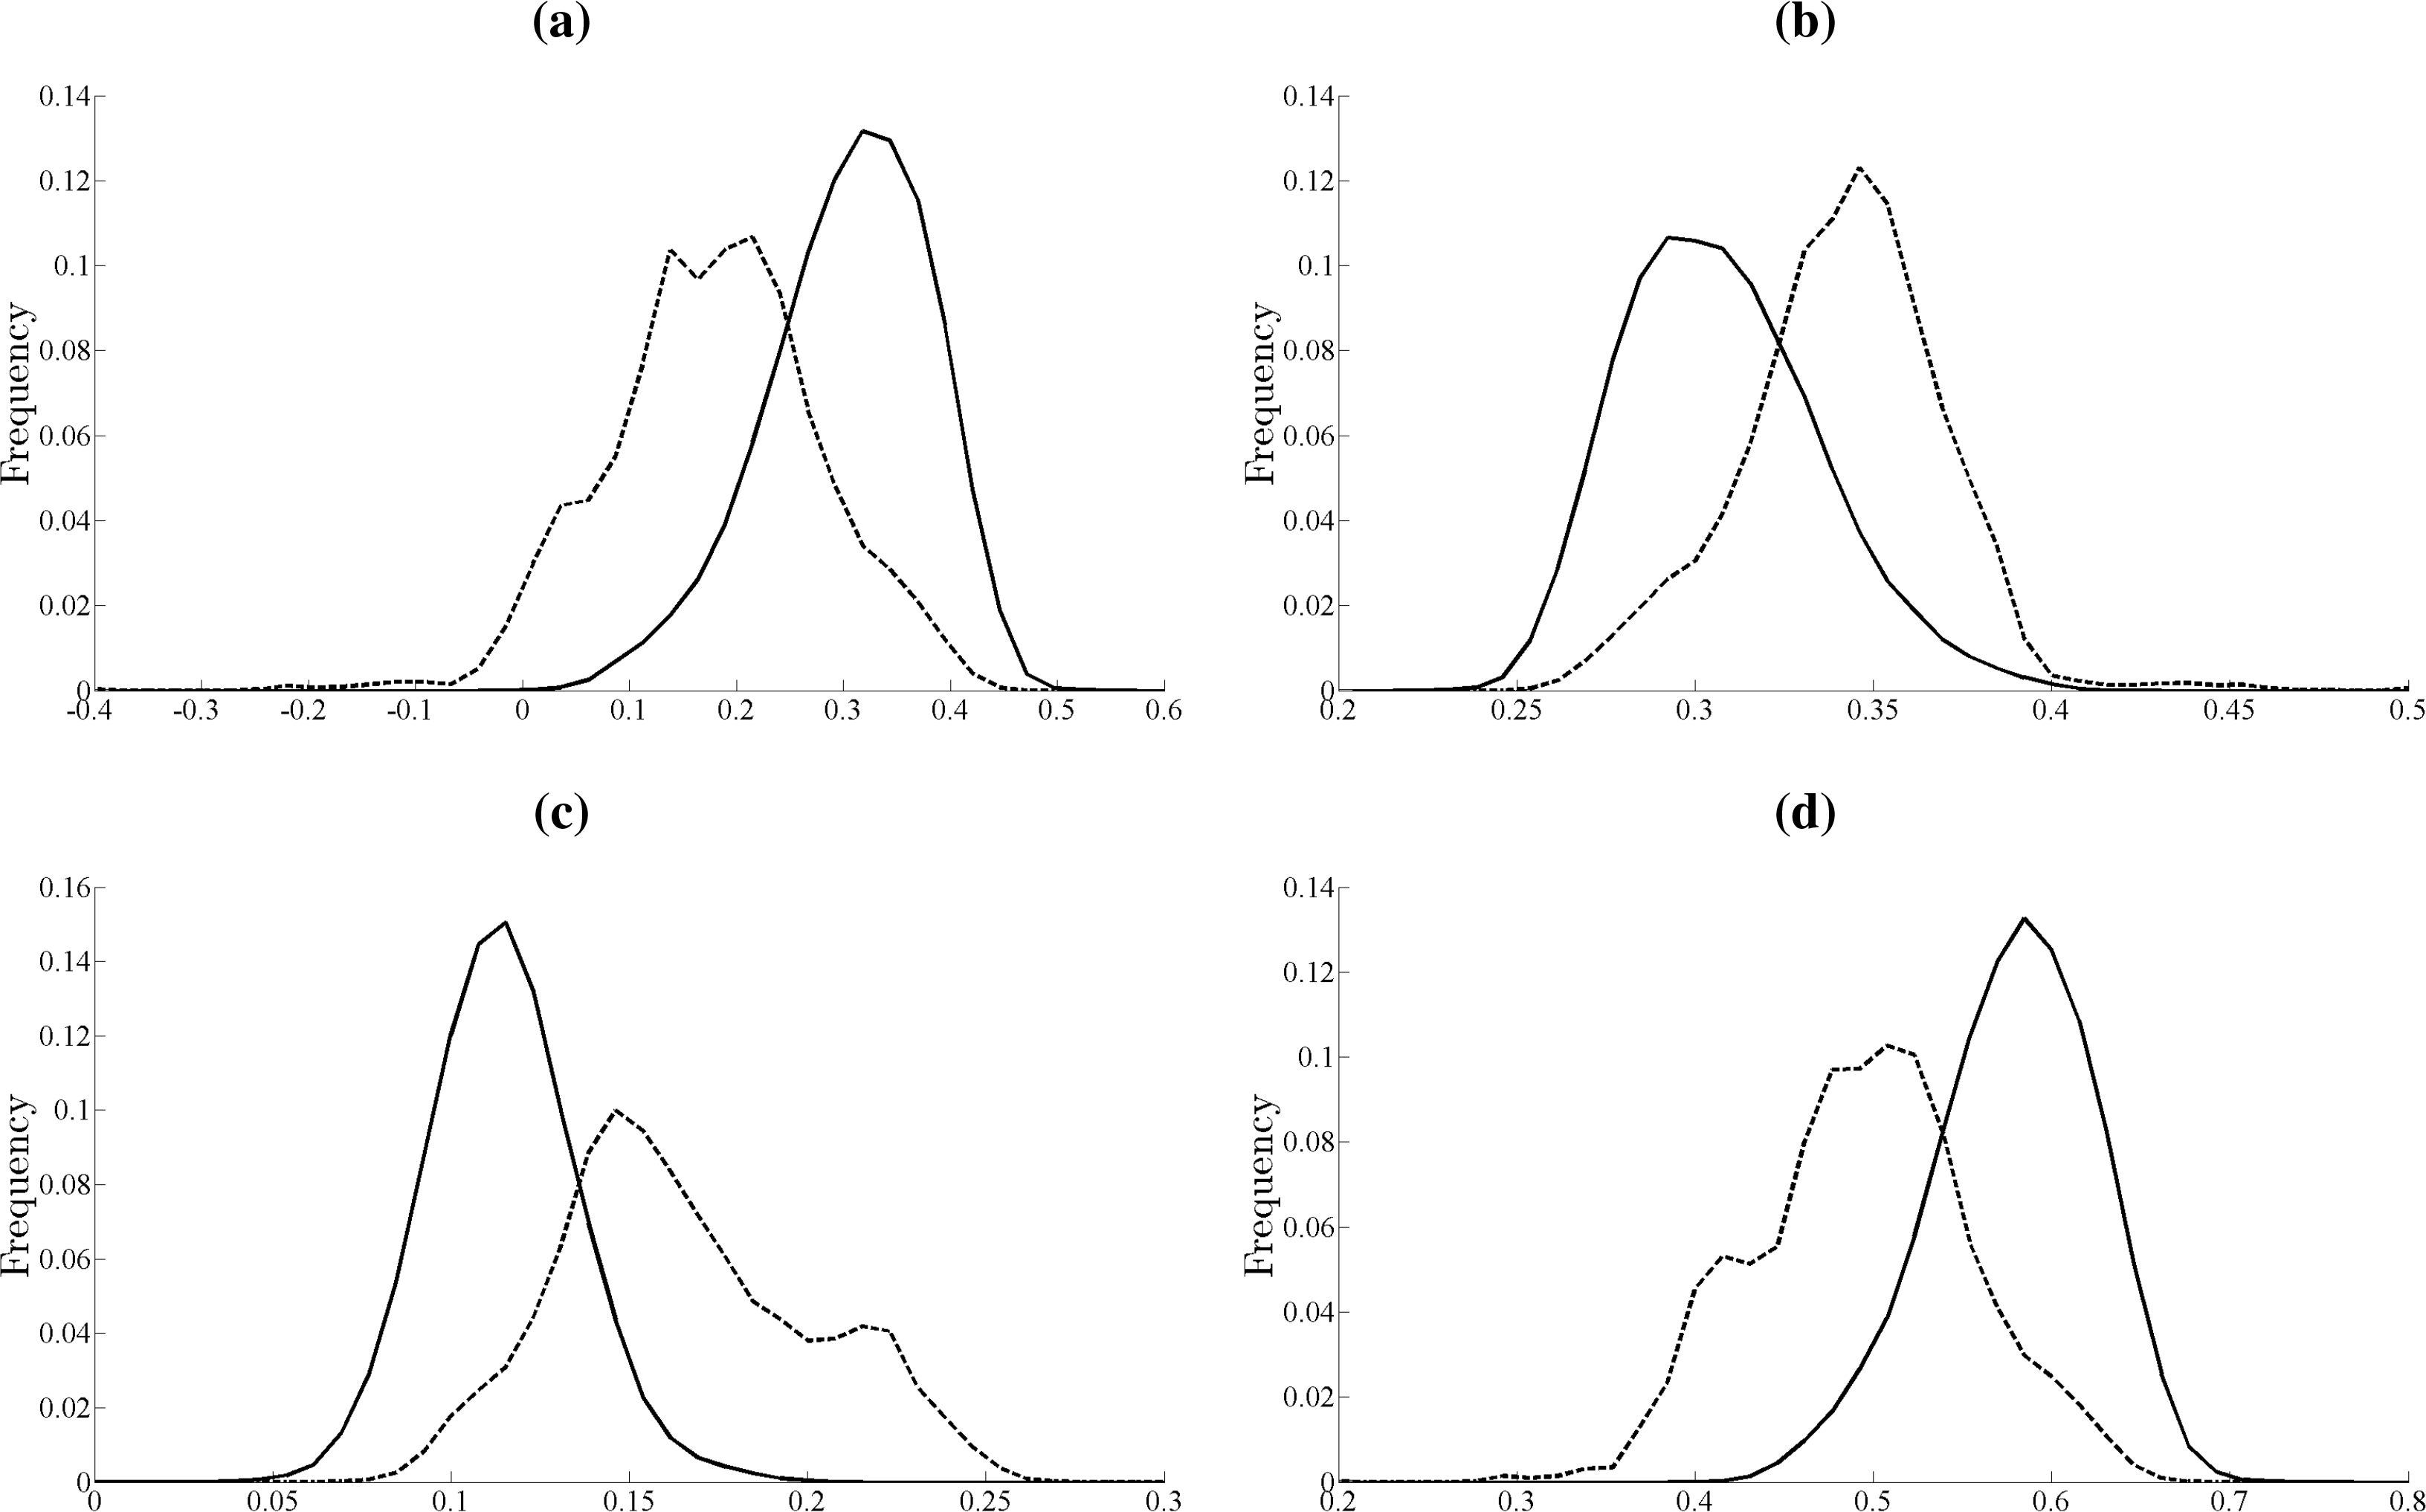
As explained in Section 2.4, the approach for feature selection used in this paper is based on the dissimilarity metric comparing the histograms of palm tree and background, for the various vegetation indices which are considered. To generate the histograms of palm tree and non-palm-tree areas, palm trees and background from subset images are sampled and all of the indices presented in Section 2.4 for each pixel is computed. Then, the histograms of the computed indices are generated. Figures 2 and 3 show the histograms of each index using QuickBird imagery. Next, the metrics comparing the histogram of palm-tree and background pixels are computed. Note that all the metrics presented in Table 1 except the intersection metric give a large value when two histograms are dissimilar. The intersection metric will give a large number if two histograms are similar. For example, the intersection metric between two identical histograms will be 1. To facilitate comparison of the metrics, we subtracted the intersection metric from its maximum of 1 and use that transformed value in our tables.
Table 2 reports the dissimilarity metrics from QuickBird imagery. The analysis shows that the ExGR index produced the lowest total metric value. In this index, palm tree and background are very similar. The NDI index gave the highest metric and thus can be considered to be the best feature for use in the detection process for QuickBird imagery.
3.2. Oil Palm Detection Results
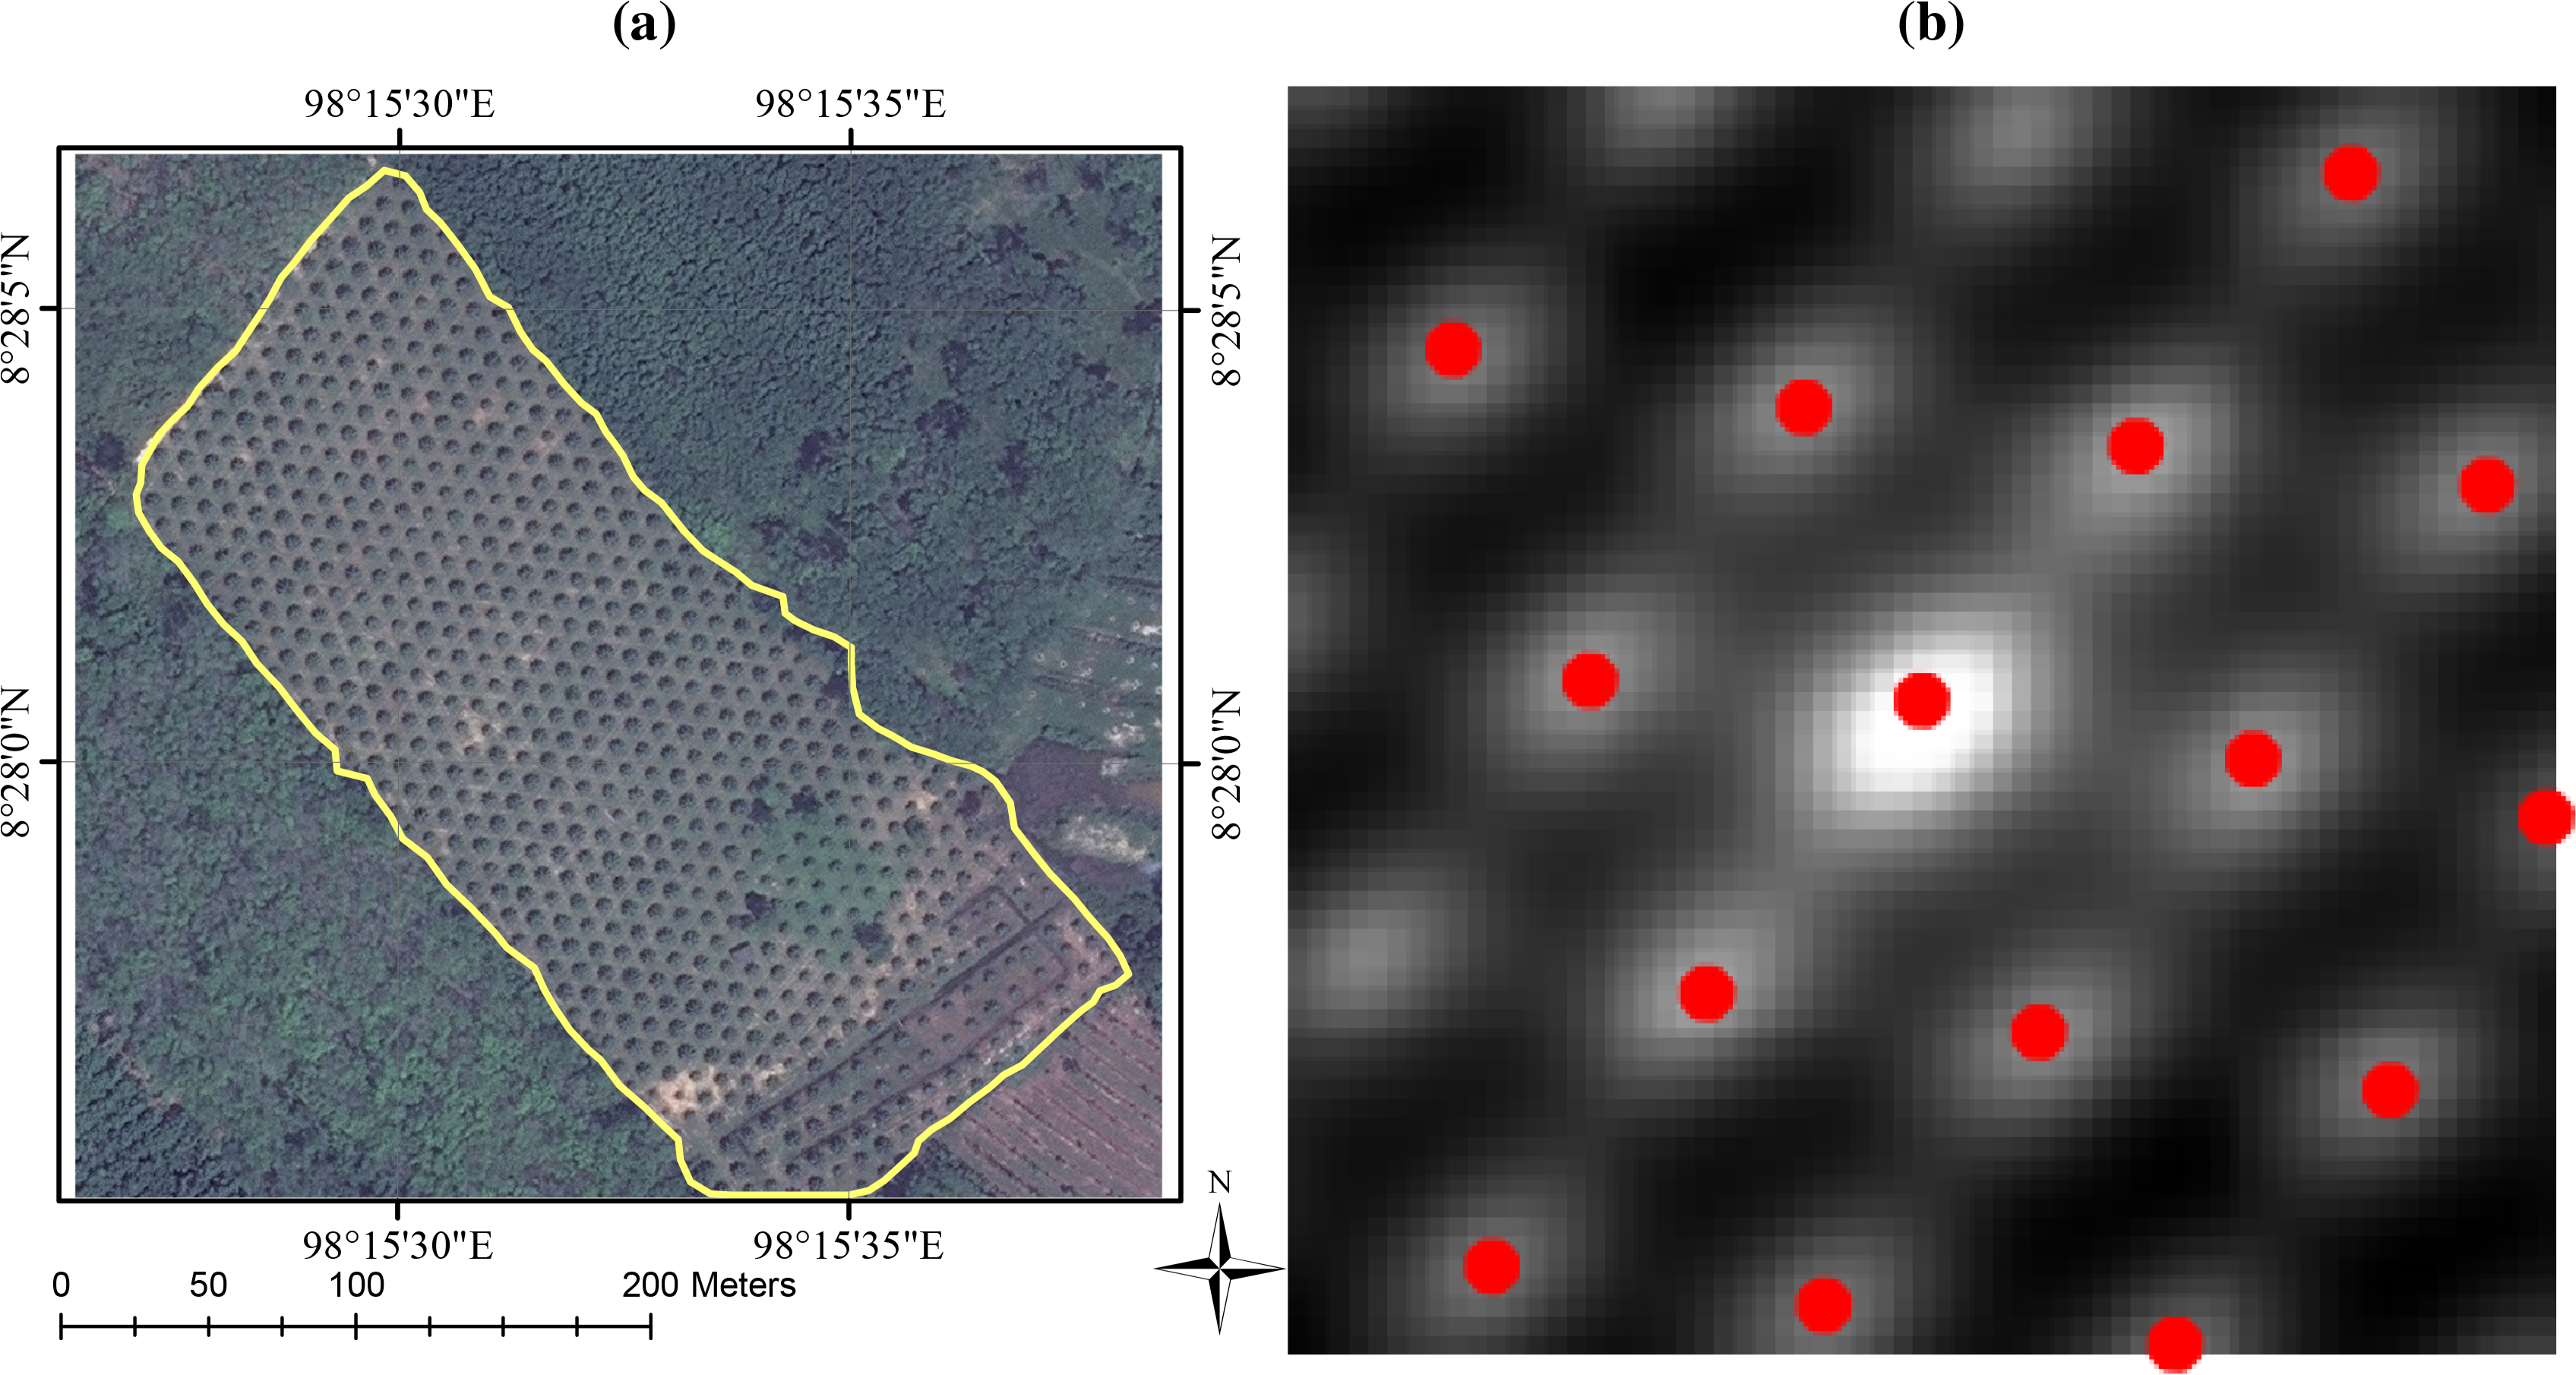
The appropriate window size by using semi-variogram approach are determined as described in Section 2.5. The lag u is defined as u ∈ {−um,...,um} × {−um,...,um} and the image I has 4 bands, i.e., blue, green, red and near-infrared. The parameter is set to be 32 which covers a sufficient number of oil palm trees because the approximate diameter of the oil palm canopy is about 3–4 m which corresponds to 8 pixels. This means to say, we want to analyze the spatial variation within the area of 64 by 64 square pixel which cover enough amount of oil palm tress. Figure 4 shows an example of the image used in the performance evaluation and its semi-variogram. The semi-variogram shows the approximate spatial variation of the palm trees. The average distance between a local peak and its nearest neighbor is used to determine the window size of rank transformation and the non-maximal suppression. For this image, the average distance is about 17 pixels. Remind that the detection of plantation area’s boundary is out of the scope of this paper, The boundary can be obtained using an existing automatic detection algorithm or GIS database.
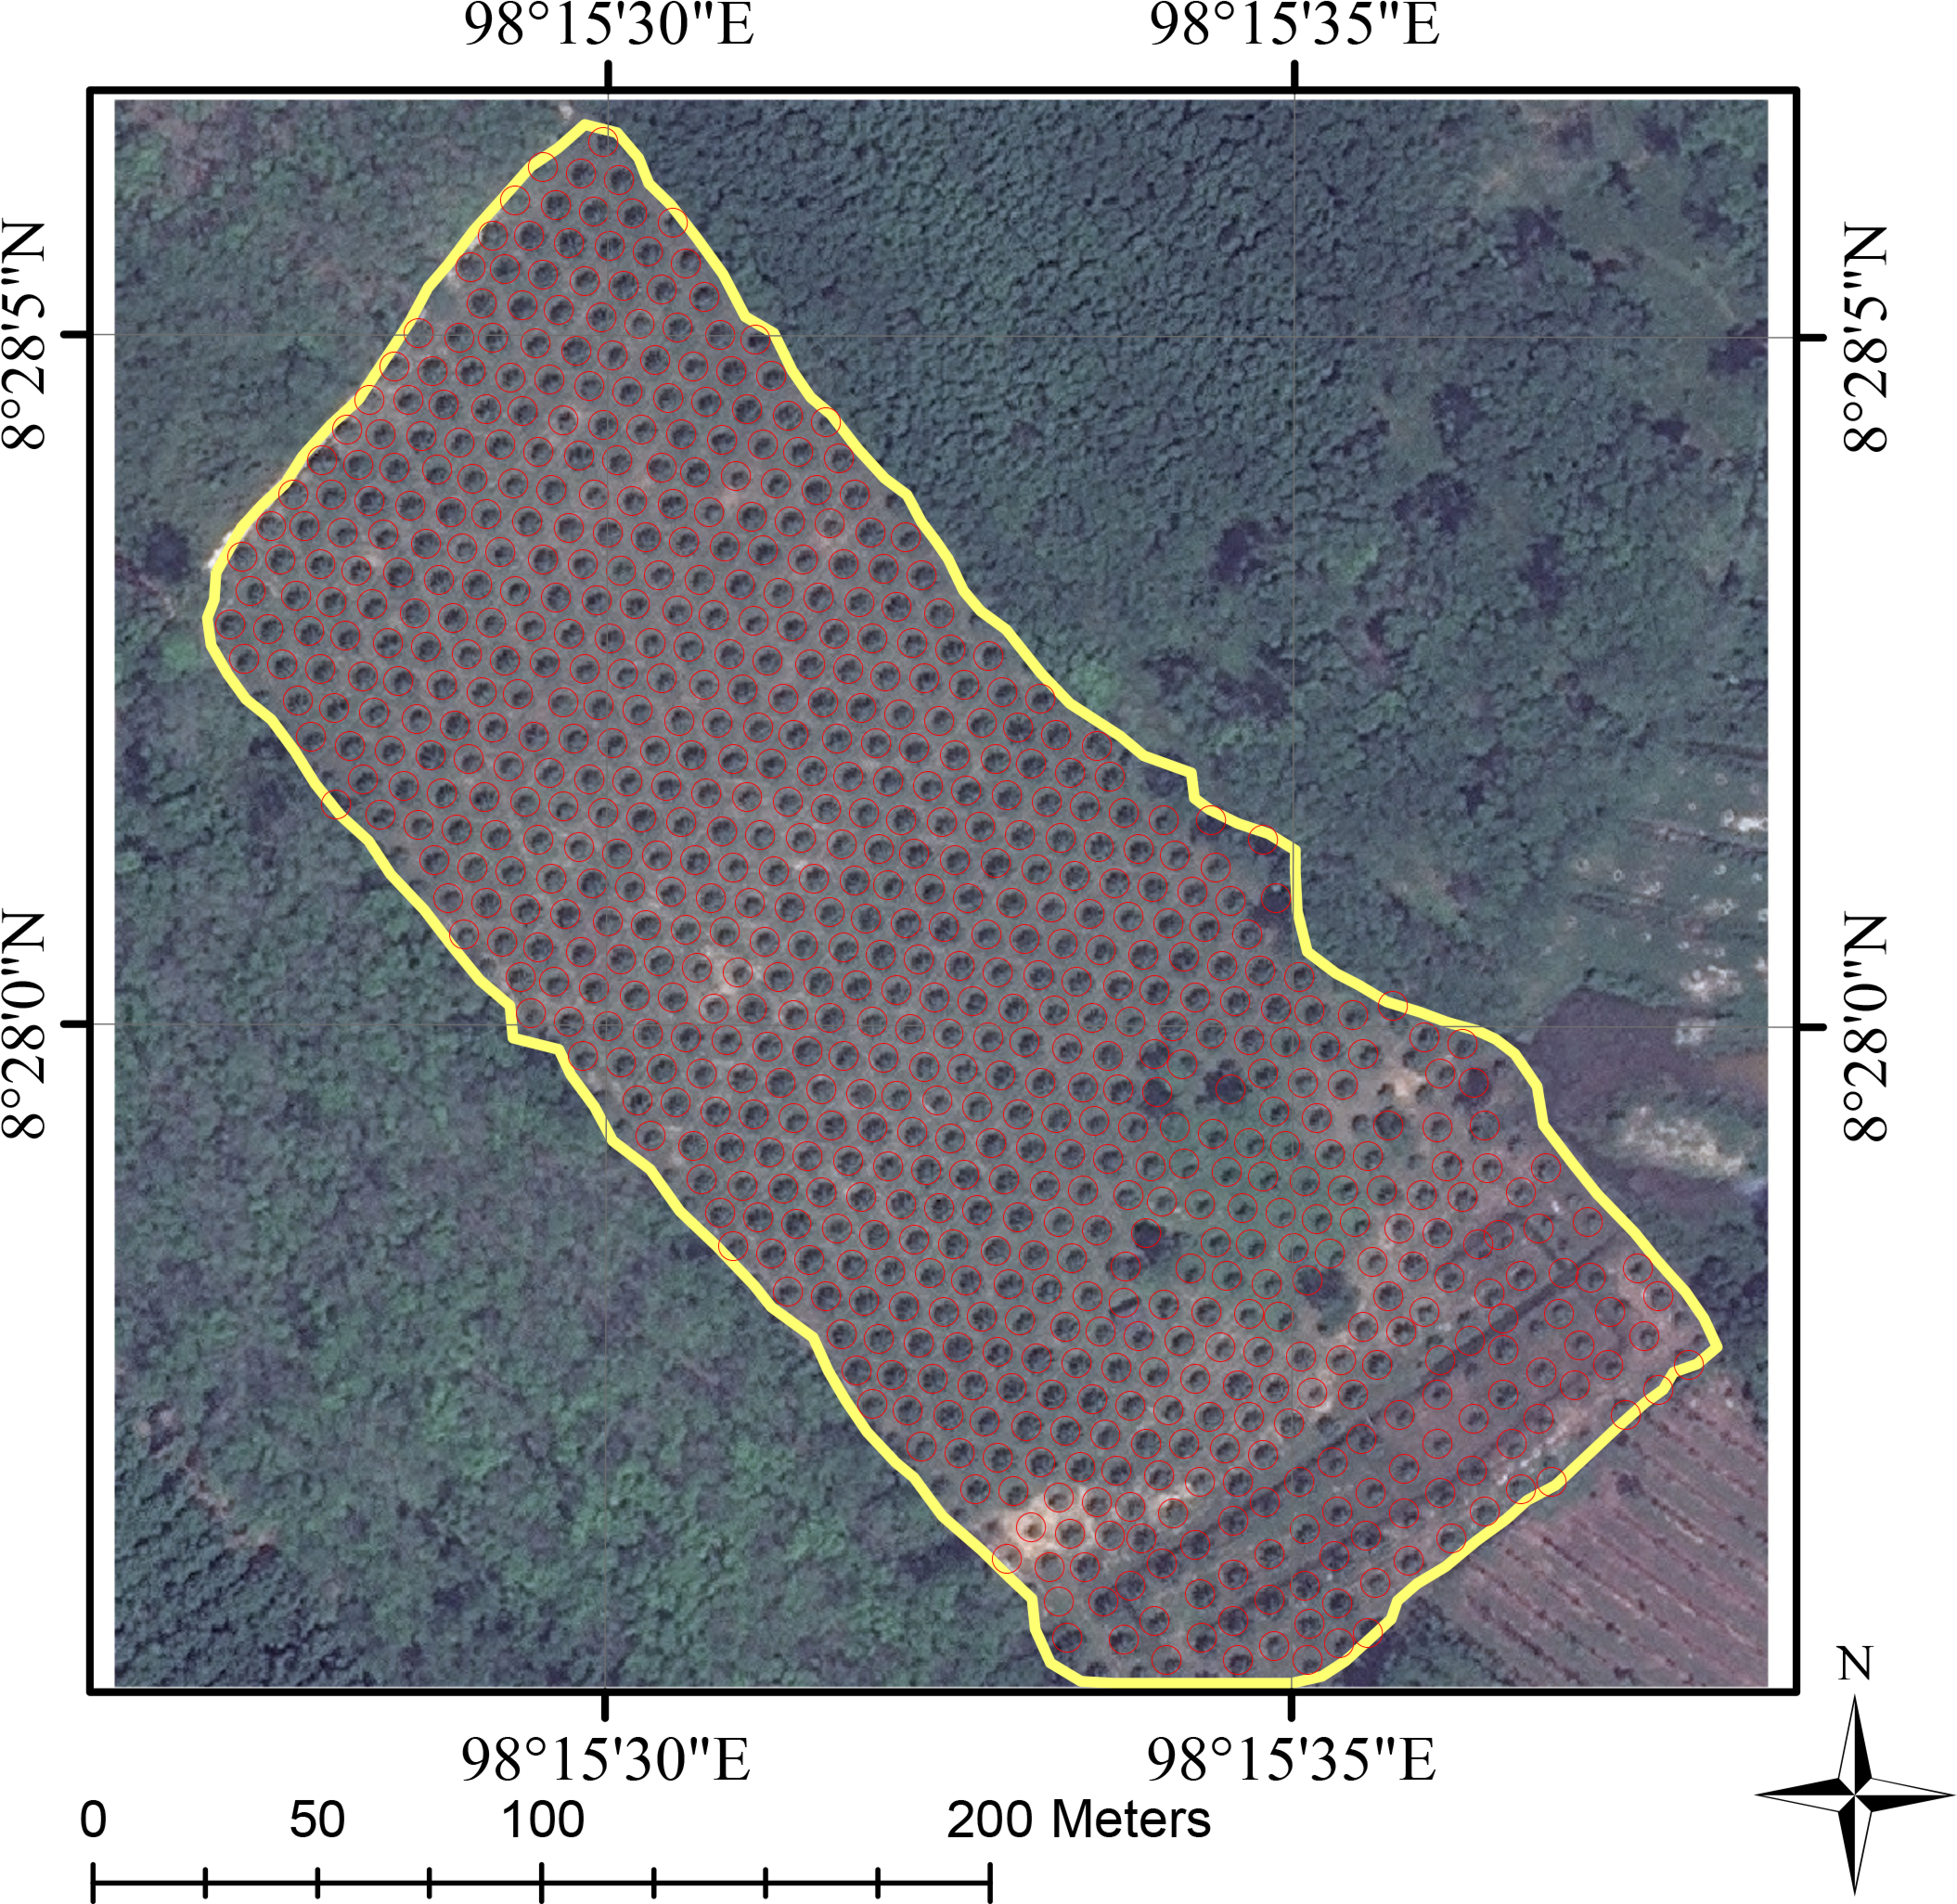
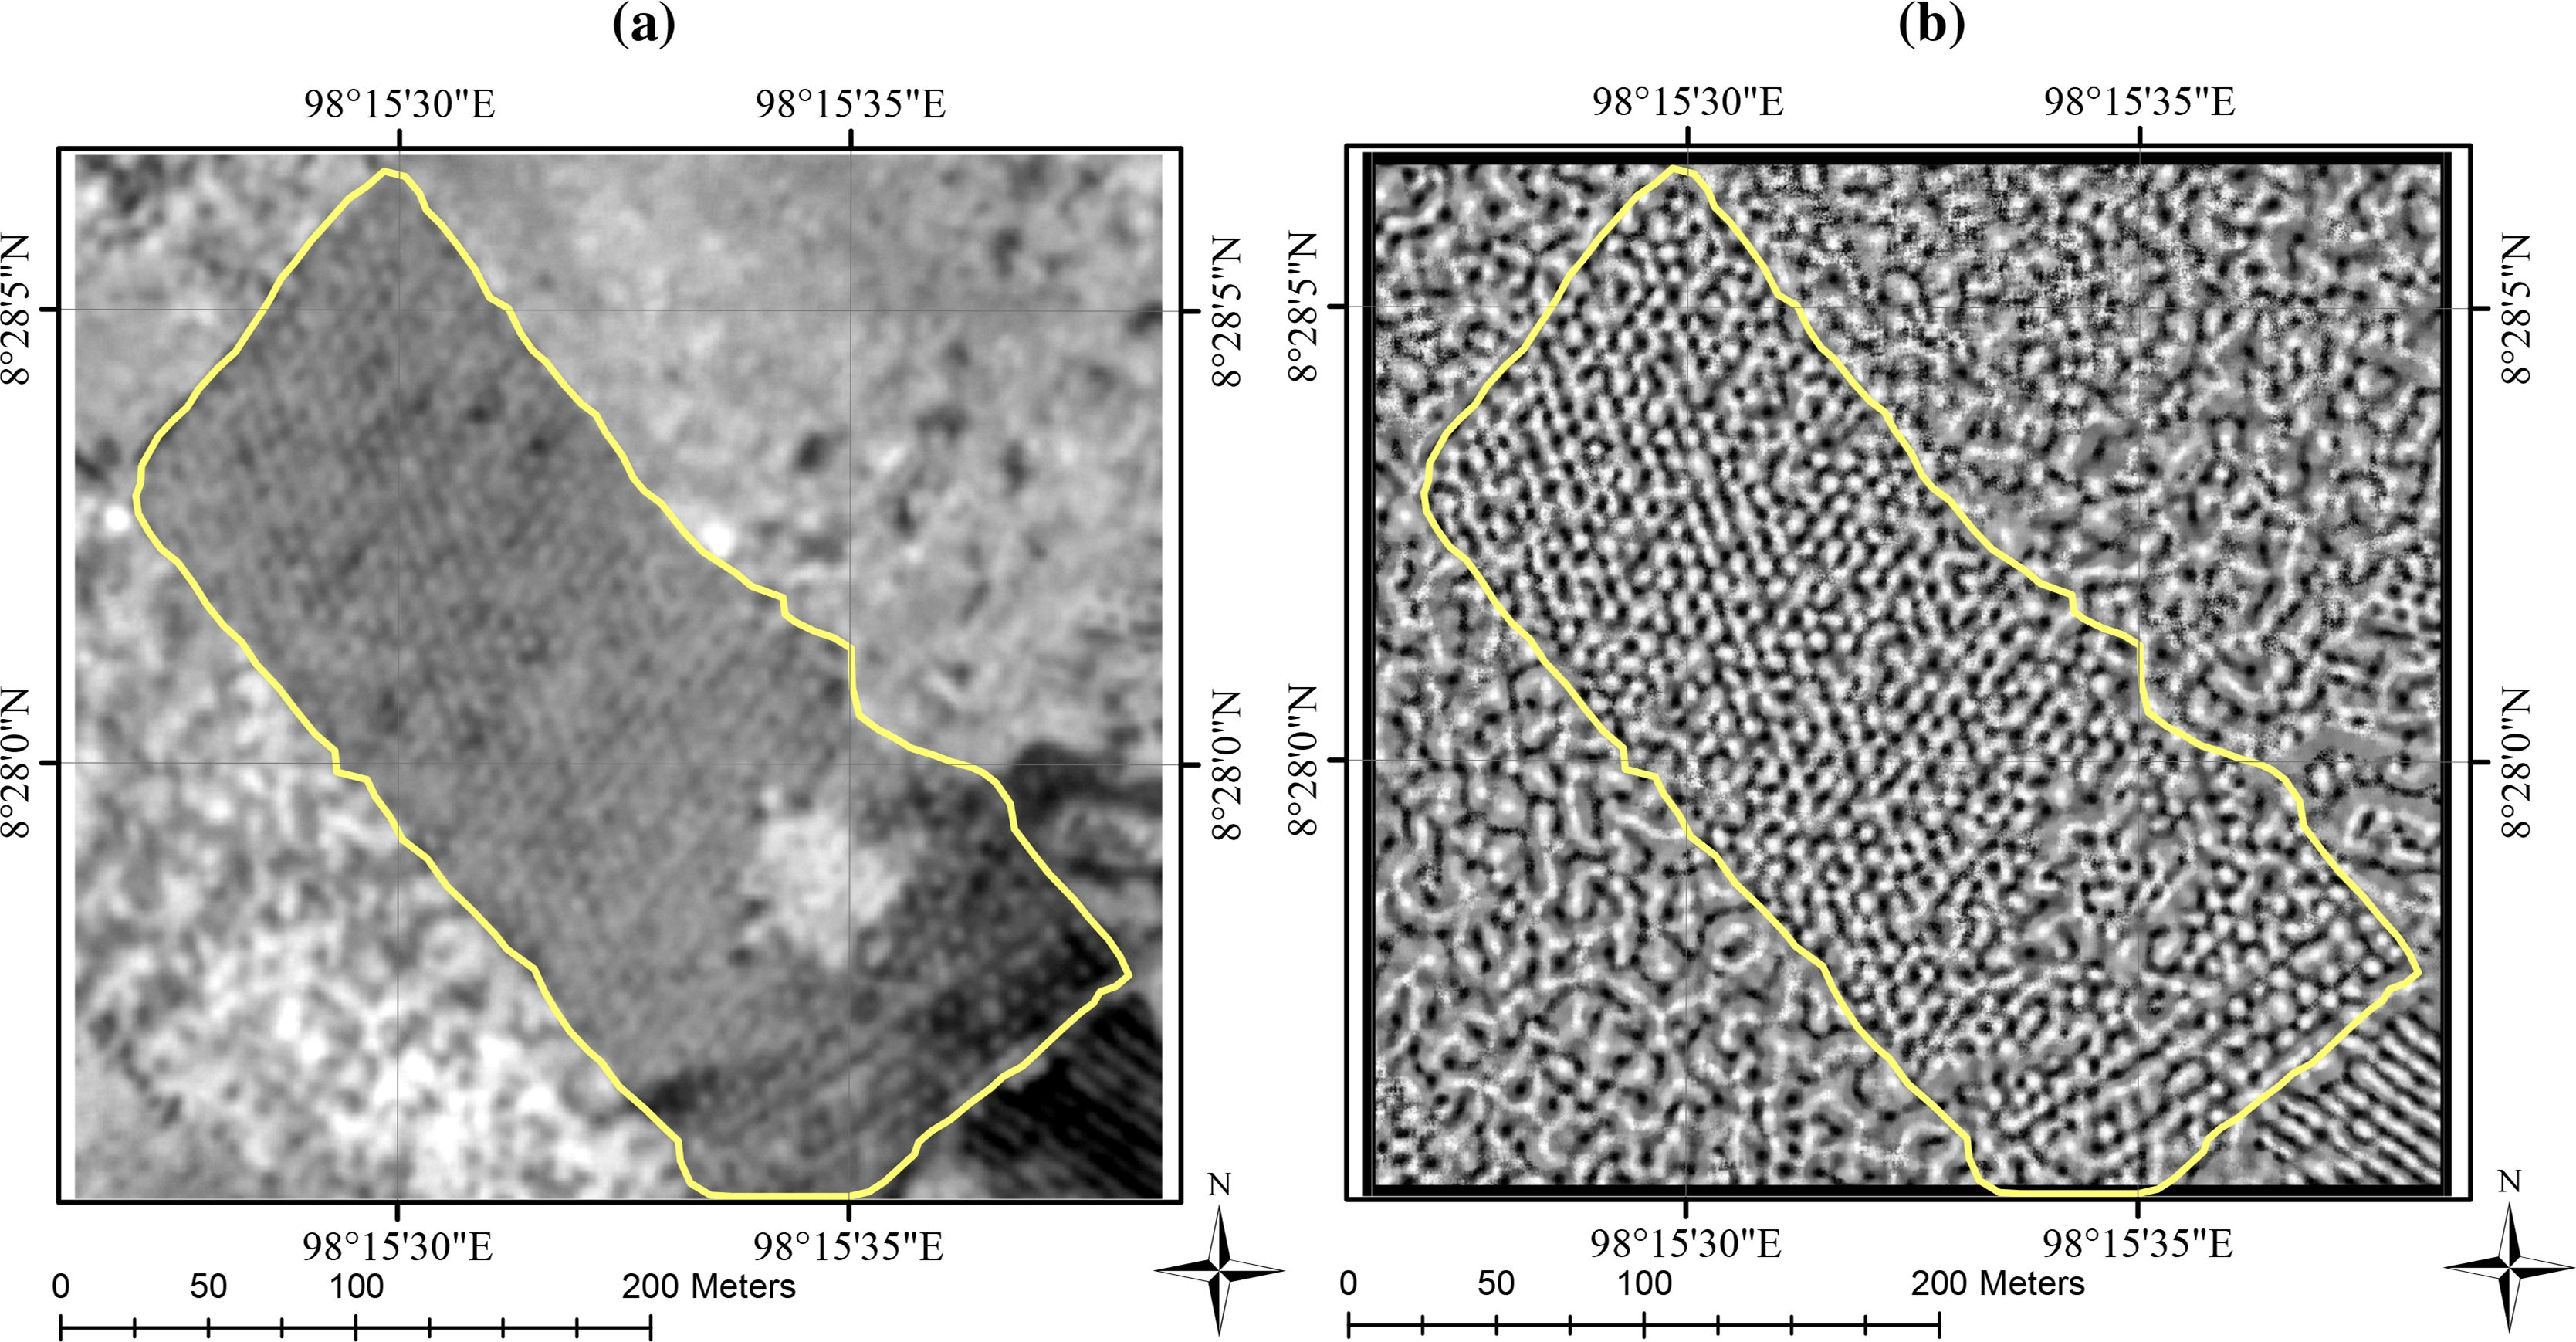
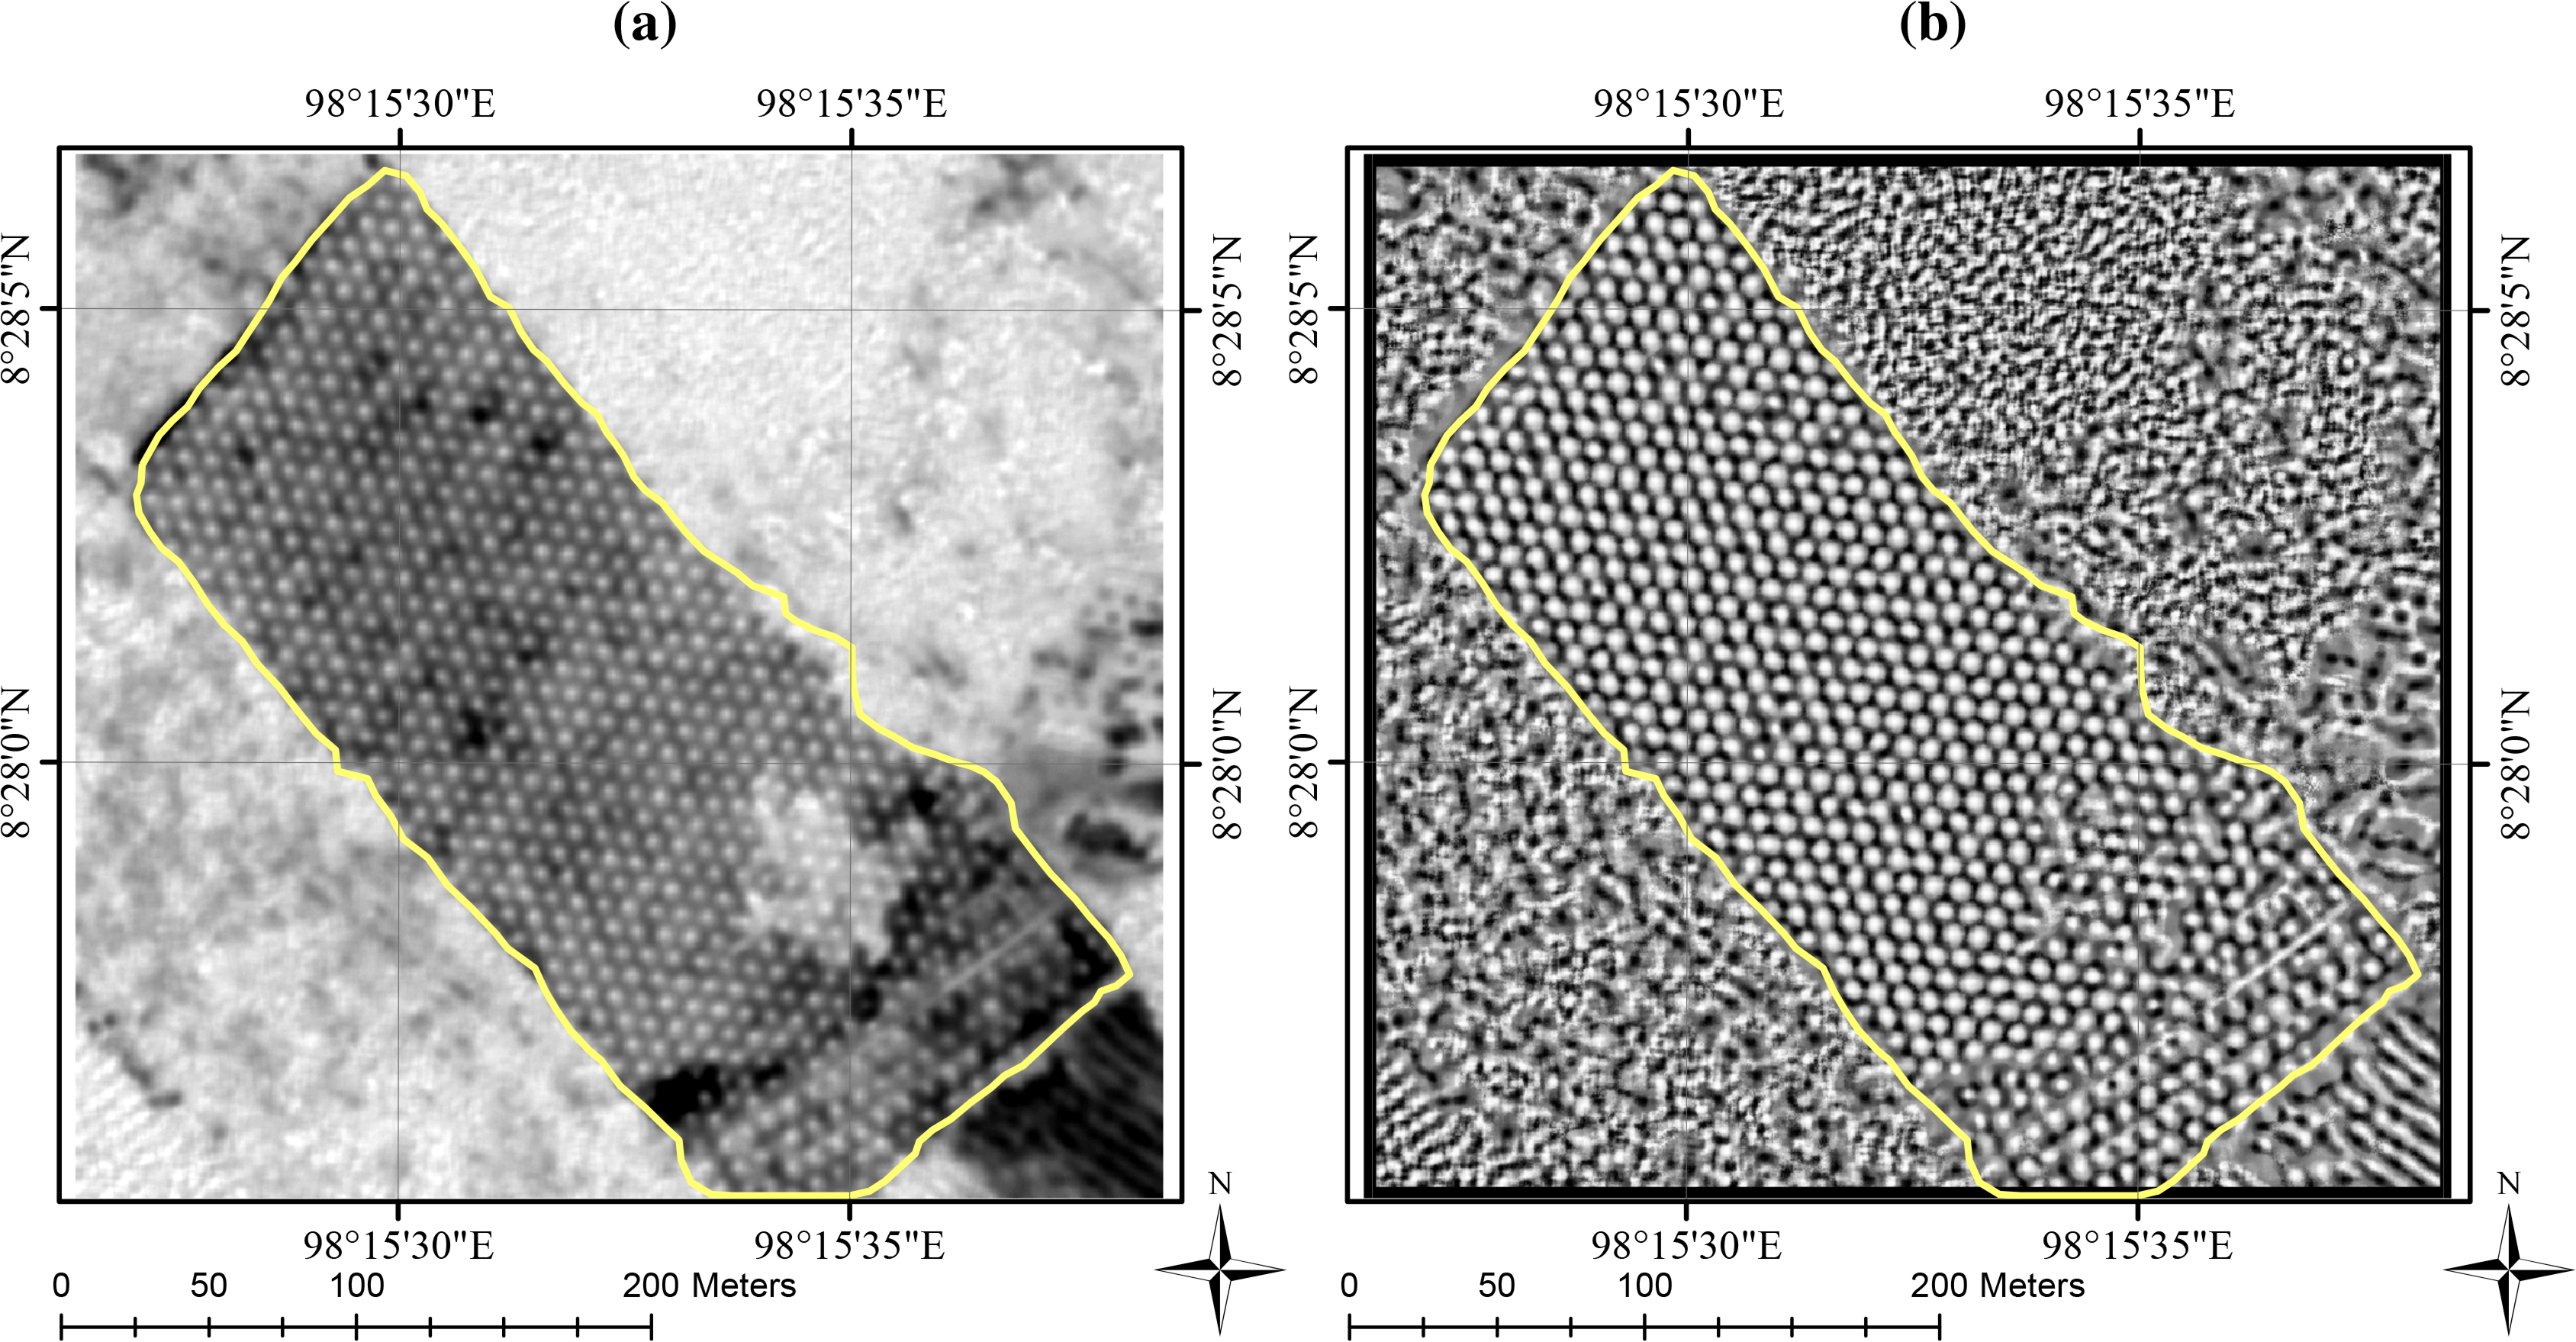
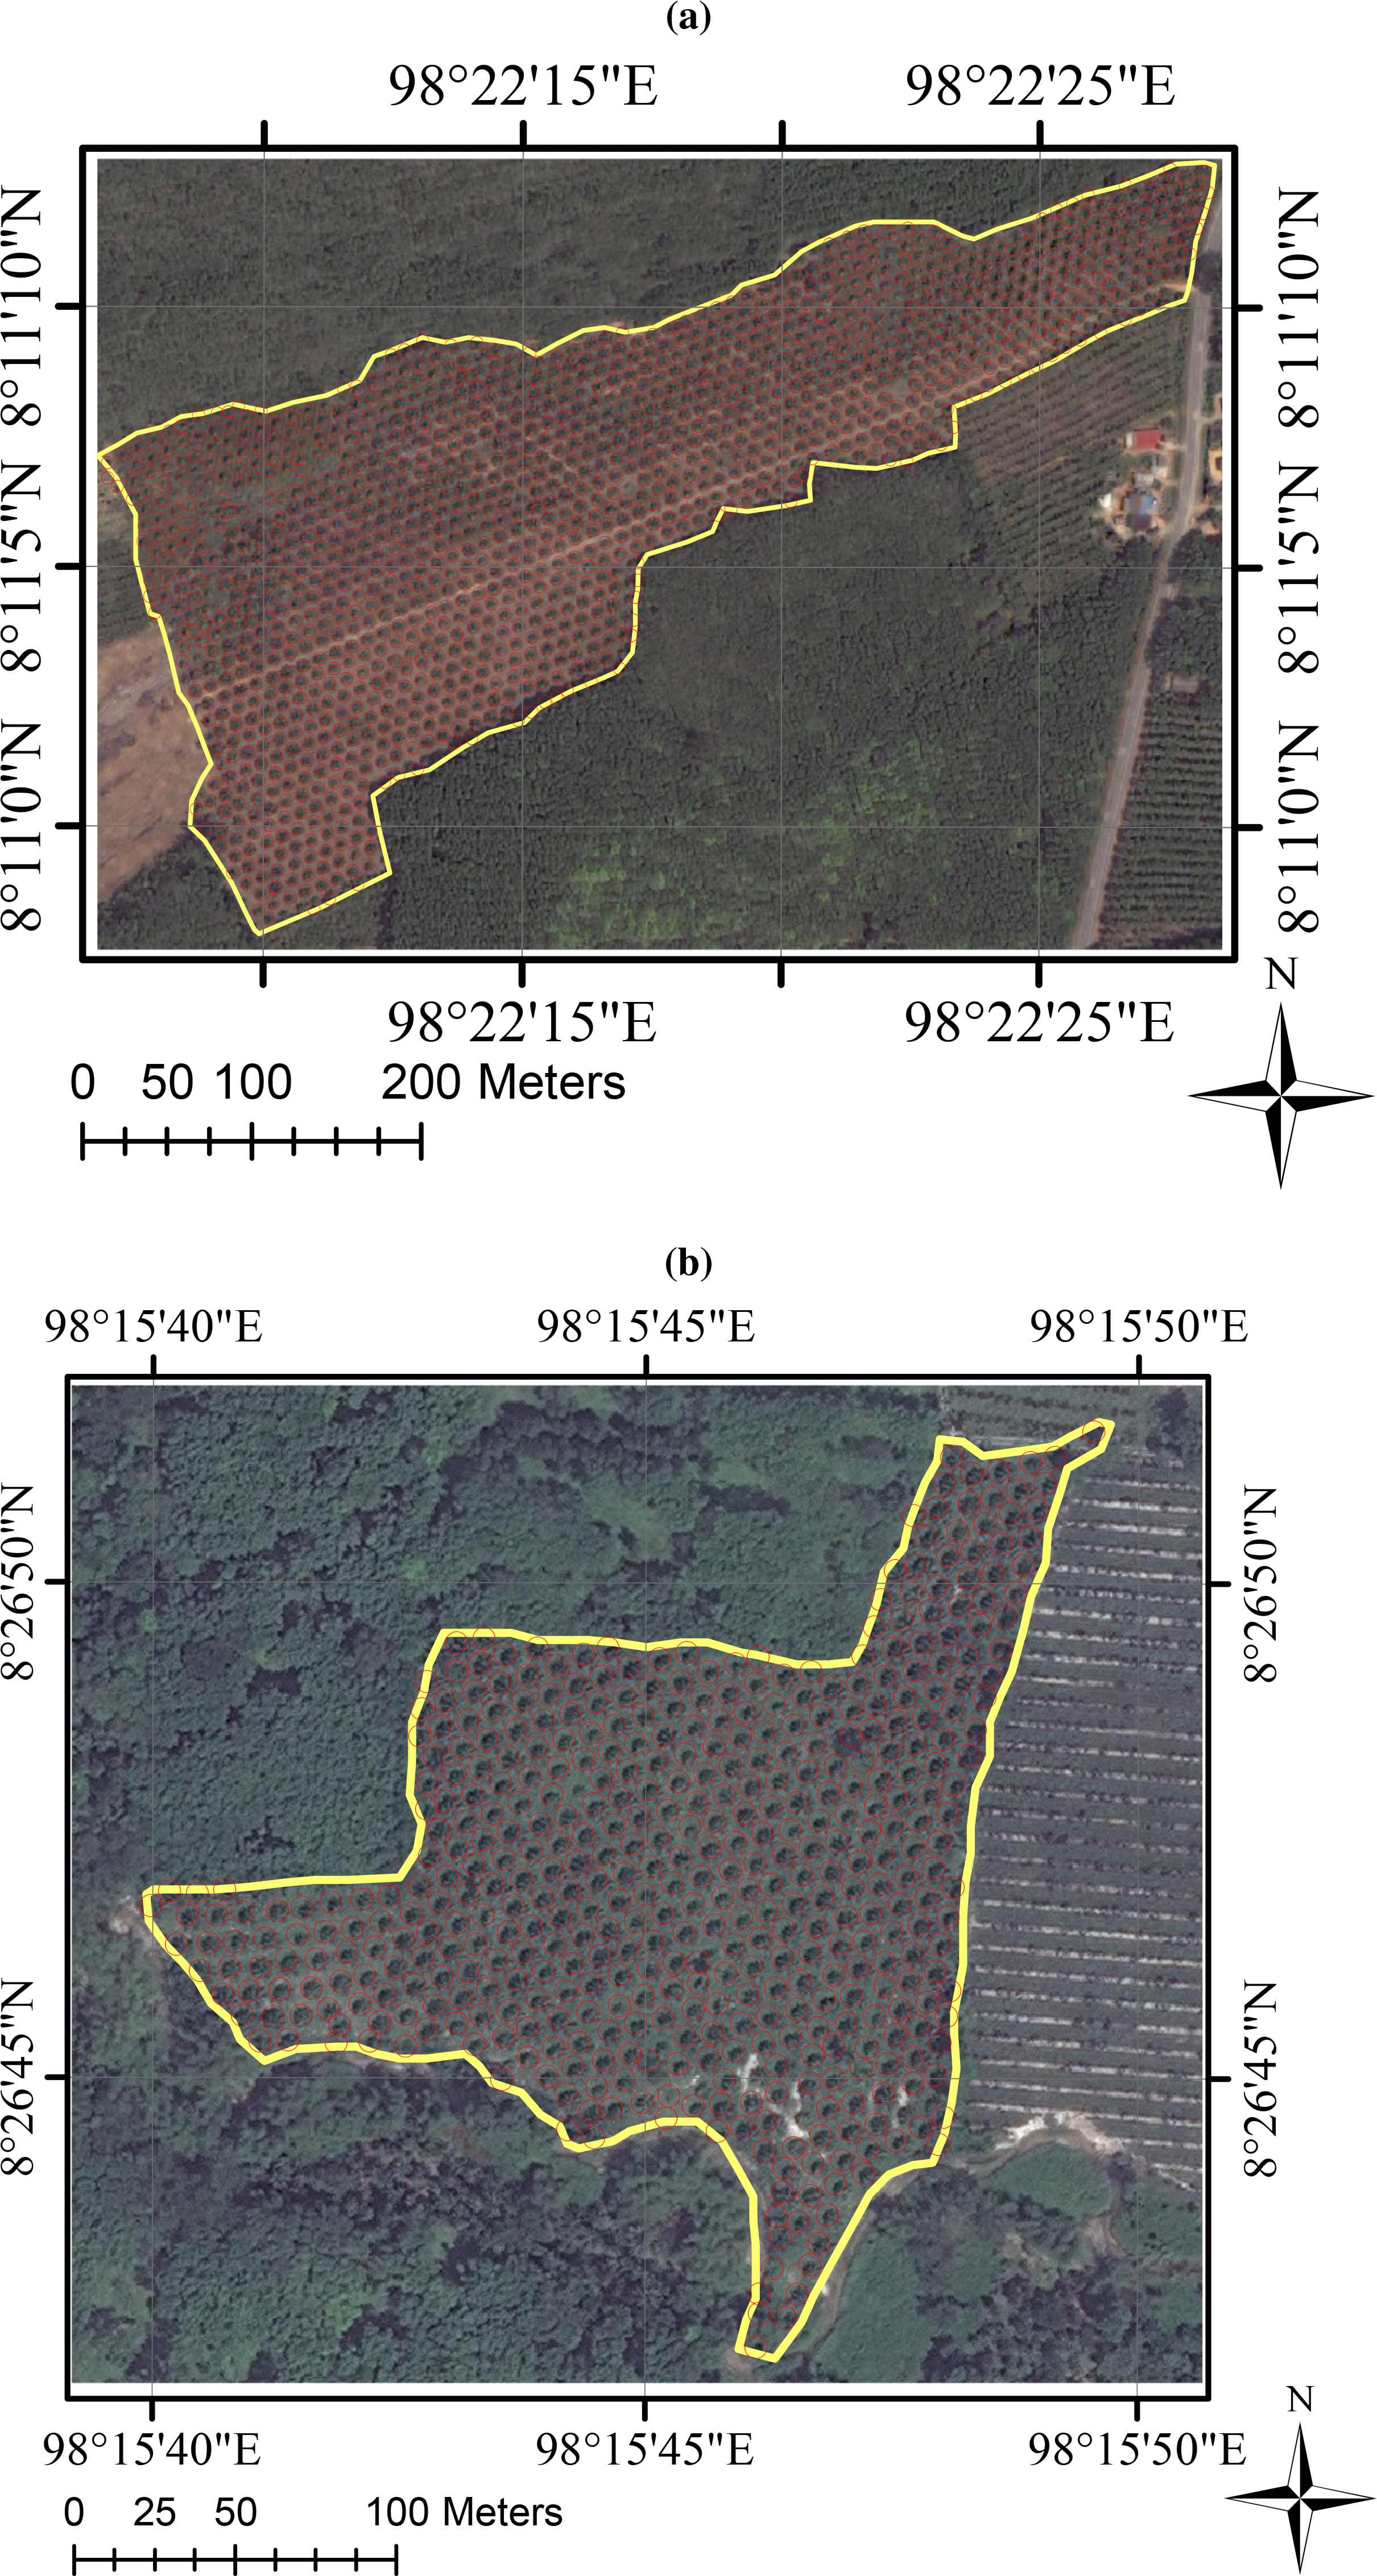
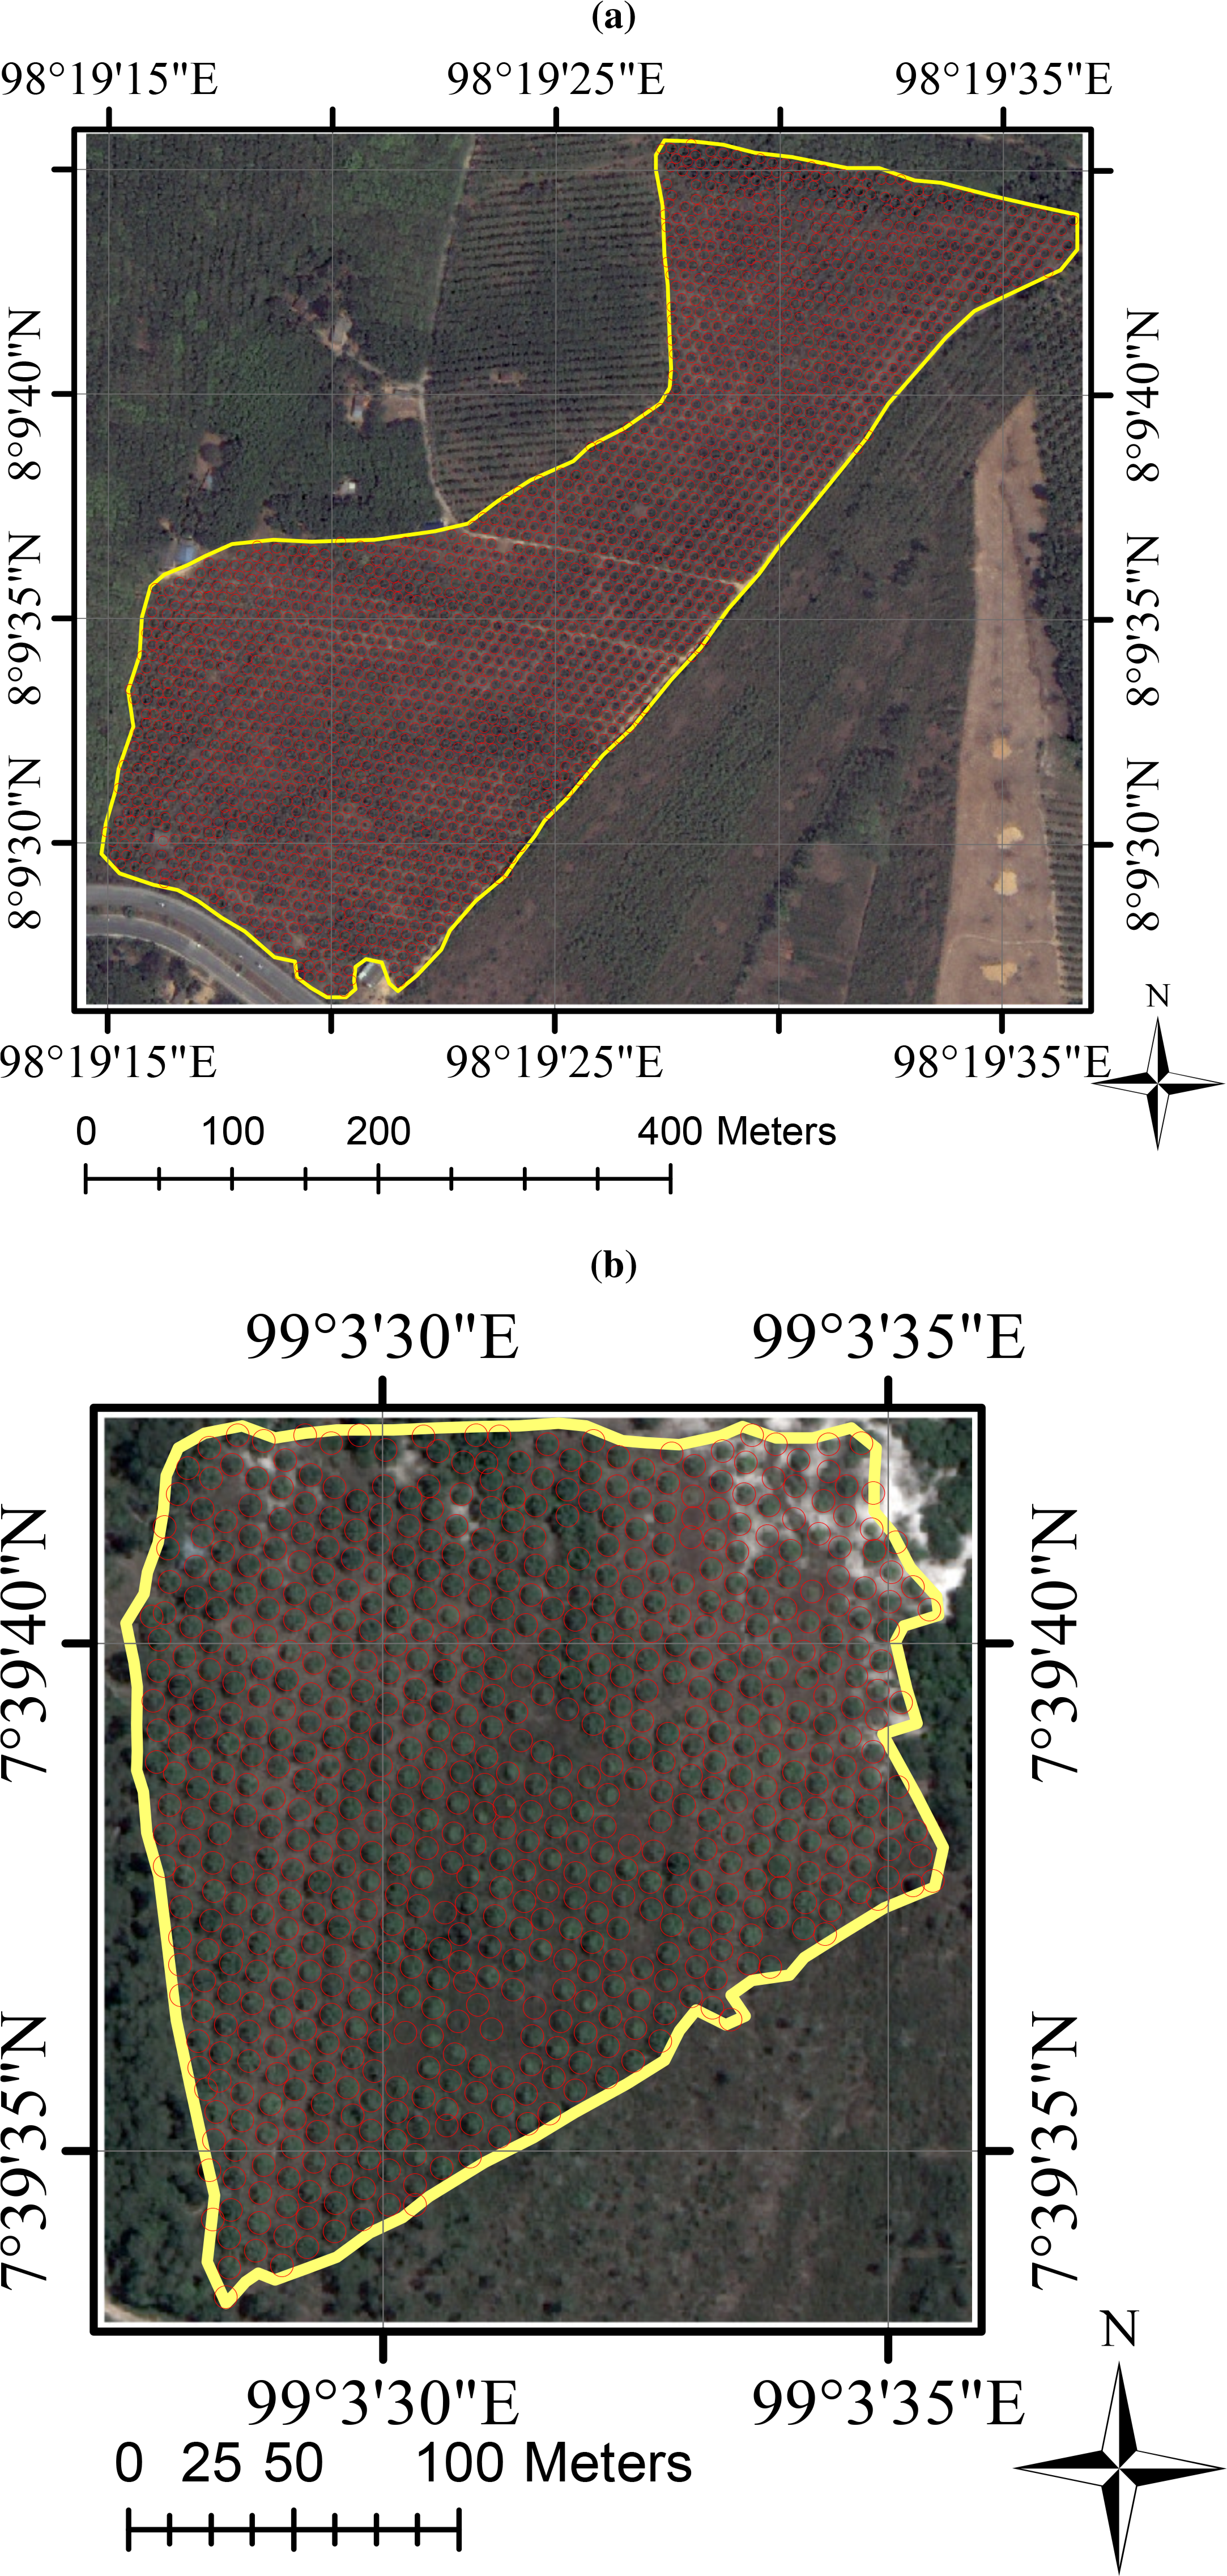
In order to reduce noise, each band of the image is then smoothed with the Gaussian filter prior to computing the index. The index image is then transformed using rank transformation. An example result from the rank transformation on the index image is illustrated in Figure 5. The boundary of oil palm tree region is drawn with solid red line. As it can be observed, the rank transform enhances the discontinuity between hypothesized palm tree locations and background. After the rank transform is applied, the local peaks on the index image are then detected by using the non-maximal suppression. The oil palm trees detected from the image shown in Figure 4 are illustrated in Figure 6. It can be observed that the spatial variation of detected oil palm trees is close to the computed semi-variogram. The palm tree region is heterogeneous, i.e., consisting of non-palm trees and other features such as buildings which can be false positives in the detection results. The detection results from two of the data subsets using QuickBird imagery are illustrated in Figure 7. In Figure 8 shows the detection results from two of the data subsets using WorlView-2 imagery.
4. Detection Accuracy and Discussion
To quantitatively show the performance of the proposed oil palm tree detection method, the F-measure presented in Section 2.8 is used as an overall performance measure. For the first experiment, the proposed method was tested with 7 oil palm tree areas on Quickbird imagery. The ground truth was labeled manually by specialist. The vegetation index, i.e., NDI is used in all test areas. The detection performance of the proposed method on each test image is reported in Table 3. It can be observed from F-measure that the overall performance is greater than 0.9. Note that, the windows sizes, which were determined using 2D semi-variogram technique, were not the same in all case.
To test the proposed method with other dataset, the WorldView-2 imagery was used. 5 oil palm plantation areas were selected. The feature used in the palm tree detection on this image is NDI, which was selected by using feature selection process presented in Section 2.4. The detection performance of the proposed method on each test image is reported in Table 4. The NDI index was used in this experiment. The F-measure is about 0.9. Comparing with method proposed in [17] which uses hyperspectral image, the method proposed in this work can provide the similar detection rate about 90% using only multispectral satellite imagery. This hence shows the advantage of the proposed method because multispectral image is cheaper and more obtainable than hyperspectral image. Moreover, in contrast to [15,16] which used very high resolution image, the proposed method used only high resolution image.
In order to show the need for feature selection process, the excess green index of the test area in Figure 4 is shown in Figure 9. The excess green index has the lowest metric between the histogram of palm tree and that of background. It can be observed that the excess green index of palm trees and that of background are very similar and difficult to discriminate. The detection result using the excess green index is illustrated in Figure 10. Its can be observed that detection result using excess green is worst than that of NDI, which gave the highest dissimilarity between oil palm tree and back ground. This is because the excess green index of palm trees and that of background are very similar.
In Figure 11, the detection result without using rank transformation prior to local peak detection is illustrated. That is, local peak detector is applied directly on the index image, i.e., NDI. It can be observed that a lot of oil palm trees are not detected. This is because the differences between the vegetation of palm trees and that of background are not amplified. This result shows usefulness of applying rank transformation on index image before performing local peak detection.
Figures 12 shows false positives in the detection result. It can be observed that this area is not homogeneous. Namely, it contains objects that are not oil palm trees, i.e., building, other trees, shadow. Although their vegetation indices are not as high as vegeation, they can have local peaks which are detected by the local peak detector. Another example of false positive is illustrated in Figure 13 in the blue rectangle. In this case, the area is still not homogeneous such that the area is bare soil and the local peak detector can still detect local peaks which are not corresponding to oil palm trees. In Figure 13, an example of false negative, which is the oil palm missing from detection, is illustrated in yellow rectangle. Since tree crowns are close together, oil palm trees can be missing from detection because the window for local peak detection covers more than one oil palm tree and the local peak detector can detect only one peak in the window.
5. Conclusions
The oil palm detection or counting is an important task in oil palm plantation area management. In this paper, a novel method for oil palm tree detection using high resolution multispectral satellite imagery is proposed. It is hypothesized that oil palm trees are located at the local peaks of the vegetation index image within the oil palm plantation area. The key success components and the contribution of the proposed algorithm are feature selection process and the rank transformation. In contrast to other methods which directly use NDVI as the feature for detection, in this work, the feature selection process is utilized to select the vegetation index having highest discriminating power between oil palm trees and background. The rank transformation is then applied to the vegetation index image in order to increase the separability between oil palm trees and background which result in the reduction of the missed detections.
The performance of the proposed method was tested on several plantation areas on high resolution satellite imageries, i.e., QuickBird and WorldView-2. The precision (detection rate), recall and F-measure were used for evaluating the performance of the proposed method. The overall performance was excellent, with precision (detection rate) ranging from 0.916 to 0.998, recall value ranging from 0.861 to 0.998 and F-measure values ranging from 0.897 to 0.993. Comparing with method proposed in [17] which uses hyperspectral image, the method proposed in this work can provide the similar detection rate about 90% using only multispectral satellite imagery. From the experiment results, it was shown that using the vegetation index image without separability enhancement, i.e., rank transformation can lead to missed detection. Moreover, it was also observed that appropriated vegetation index must be selected in order to obtain high detection rate.
The main advantage of the proposed method is that it is versatile. Particularly, the input data is not limited to only multispectral satellite imagery. The reason is that feature selection process will select appropriate feature which can be obtained from a particular sensor. As a result, the proposed method can use data from other sensors and platforms, e.g., aerial photograph from UAV with only RGB bands. Another advantage of the proposed method is that it is not computationally expensive.
The presence of non-oil palm objects in the oil palm tree area causes problem for this method. Namely, other objects in a heterogeneous area can be detected as false positives. To eliminate such problems, texture information could be used to suppress the presence the non-oil palm object in the future development. Another limitation of this proposed method is the fixed window size. The fixed window size will encounter a problem when the distance between oil palm tree is not constant. To fixed such problem, the adaptive window size will be utilized in the future work. However, the proposed method will fail when tree crowns are overlapped. For the computation time, only the semi-variogram computation is the bottleneck which can be fixed by using programming on GPU. To make the process fully automatic, the detection of oil palm plantation area and its boundary method will be developed in the future work.
Acknowledgments
We greatly acknowledge Geo-informatics ans Space Technology Development Agency (GISTDA), Thailand, for providing satellite imagery used in this study.
Author Contributions
P. Srestasathiern carried out data analysis and is the main author of all sections of the manuscript. P. Rakwatin supervised research and edited the manuscript.
Conflicts of Interest
The authors declare no conflict of interest.
References
- Palm Oil Facts and Figures. Available online: http://http://www.simedarby.com/upload/Palm_Oil_Facts_and_Figures.pdf (accessed on 6 June 2014).
- Tan, K.P.; Kanniah, K.D.; Cracknell, A.P. Use of UK-DMC 2 and ALOS PALSAR for studying the age of oil palm trees in southern peninsular Malaysia. Int. J. Remote Sens 2013, 34, 7424–7446. [Google Scholar]
- Santoso, H.; Gunawan, T.; Jatmiko, R.; Darmosarkoro, W.; Minasny, B. Mapping and identifying basal stem rot disease in oil palms in North Sumatra with QuickBird imagery. Precis. Agric 2011, 12, 233–248. [Google Scholar]
- Tan, K.P.; Kanniah, K.D.; Cracknell, A.P. A review of remote sensing based productivity models and their suitability for studying oil palm productivity in tropical regions. Prog. Phys. Geogr 2012, 36, 655–679. [Google Scholar]
- Thenkabail, P.S.; Stucky, N.; Griscom, B.W.; Ashton, M.S.; Diels, J.; van der Meer, B.; Enclona, E. Biomass estimations and carbon stock calculations in the oil palm plantations of African derived savannas using IKONOS data. Int. J. Remote Sens 2004, 25, 5447–5472. [Google Scholar]
- Morel, A.C.; Fisher, J.B.; Malhi, Y. Evaluating the potential to monitor aboveground biomass in forest and oil palm in Sabah, Malaysia, for 2000–2008 with Landsat ETM+ and ALOS-PALSAR. Int. J. Remote Sens 2012, 33, 3614–3639. [Google Scholar]
- Morel, A.C.; Saatchi, S.S.; Malhi, Y.; Berry, N.J.; Banin, L.; Burslem, D.; Nilus, R.; Ong, R.C. Estimating aboveground biomass in forest and oil palm plantation in Sabah, Malaysian Borneo using ALOS PALSAR data. For. Ecol. Manag 2011, 262, 1786–1798. [Google Scholar]
- Wulder, M.; Niemann, K.; Goodenough, D.G. Local maximum filtering for the extraction of tree locations and basal area from high spatial resolution imagery. Remote Sens. Environ 2000, 73, 103–114. [Google Scholar]
- Wulder, M.A.; Niemann, K.O.; Goodenough, D.G. Error reduction methods for local maximum filtering of high spatial resolution imagery for locating trees. Can. J. Remote Sens 2002, 28, 621–628. [Google Scholar]
- Wulder, M.; White, J.; Niemann, O.; Nelson, T. Comparison of airborne and satellite high spatial resolution data for the identification of individual trees with local maxima filtering. Int. J. Remote Sens 2004, 25, 2225–2232. [Google Scholar]
- Wulder, M.A.; White, J.C.; Coops, N.C.; Butson, C.R. Multi-temporal analysis of high spatial resolution imagery for disturbance monitoring. Remote Sens. Environ 2008, 112, 2729–2740. [Google Scholar]
- Gebreslasie, M.T.; Ahmed, F.B.; Van Aardt, J.A.N.; Blakeway, F. Individual tree detection based on variable and fixed window size local maxima filtering applied to IKONOS imagery for even-aged Eucalyptus plantation forests. Int. J. Remote Sens 2011, 32, 4141–4154. [Google Scholar]
- Szantoi, Z.; Malone, S.; Escobedo, F.; Misas, O.; Smith, S.; Dewitt, B. A tool for rapid post-hurricane urban tree debris estimates using high resolution aerial imagery. Int. J. Appl. Earth Observ. Geoinf 2012, 18, 548–556. [Google Scholar]
- Culvenor, D.S. TIDA: An algorithm for the delineation of tree crowns in high spatial resolution remotely sensed imagery. Comput. Geosci 2002, 28, 33–44. [Google Scholar]
- Jiang, M.; Lin, Y. Individual deciduous tree recognition in leaf-off aerial ultrahigh spatial resolution remotely sensed imagery. IEEE Geosci. Remote Sens. Lett 2013, 10, 38–42. [Google Scholar]
- Ardila, J.; Bijker, W.; Tolpekin, V.; Stein, A. Gaussian localized active contours for multitemporal analysis of urban tree crowns. In Proceedings of the 2012 IEEE International Geoscience and Remote Sensing Symposium (IGARSS), Munich, Germany, 22–27 July 2012; pp. 6971–6974.
- Shafri, H.Z.M.; Hamdan, N.; Saripan, M.I. Semi-automatic detection and counting of oil palm trees from high spatial resolution airborne imagery. Int. J. Remote Sens 2011, 32, 2095–2115. [Google Scholar]
- Smith, A.M.S.; Drake, N.A.; Wooster, M.J.; Hudak, A.T.; Holden, Z.A.; Gibbons, C.J. Production of Landsat ETM+ reference imagery of burned areas within Southern African savannahs: Comparison of methods and application to MODIS. Int. J. Remote Sens 2007, 28, 2753–2775. [Google Scholar]
- Jiang, Z.; Huete, A.R.; Didan, K.; Miura, T. Development of a two-band enhanced vegetation index without a blue band. Remote Sens. Environ 2008, 112, 3833–3845. [Google Scholar]
- Guijarro, M.; Pajares, G.; Riomoros, I.; Herrera, P.; Burgos-Artizzu, X.; Ribeiro, A. Automatic segmentation of relevant textures in agricultural images. Comput. Electron. Agric 2011, 75, 75–83. [Google Scholar]
- Woebbecke, D.M.; Meyer, G.E.; von Bargen, K.; Mortensen, D.A. Plant species identification, size, and enumeration using machine vision techniques on near-binary images. Proc. SPIE 1993, 1836, 208–219. [Google Scholar]
- Jordan, C.F. Derivation of leaf-area index from quality of light on the forest floor. Ecology 1969, 50, 663–666. [Google Scholar]
- Rouse, J.W.; Haas, R.H.; Schekk, J.A.; Deering, D.W. Monitoring vegetation systems in the great plains with ERTS. Available online: http://www.researchgate.net/publication/246866091_Monitoring_vegetation_systems_in_the_Great_Plains_with_ERTS?ev=auth_pub (accessed on 16 September 2014).
- Gitelson, A.A.; Kaufman, Y.J.; Merzlyak, M.N. Use of a green channel in remote sensing of global vegetation from EOS-MODIS. Remote Sens. Environ 1996, 58, 289–298. [Google Scholar]
- Sripada, R.P.; Heiniger, R.W.; White, J.G.; Meijer, A.D. Aerial color infrared photography for determining early in-season nitrogen requirements in corn. Agronomy 2006, 98, 968–977. [Google Scholar]
- Stricker, M.; Orengo, M. Similarity of color images. Proc. SPIE 1995, 2420, 381–392. [Google Scholar]
- Pekalska, E.; Duin, R.P. On combining dissimilarity representations. In Multiple Classifier Systems; Kittler, J., Roli, F., Eds.; Springer Berlin Heidelberg: Berlin/Heidelberg, Germany, 2001; Volume 2096, pp. 359–368. [Google Scholar]
- Atkinson, P.; Lewis, P. Geostatistical classification for remote sensing: An introduction. Comput. Geosci 2000, 26, 361–371. [Google Scholar]
- Trias-Sanz, R. Texture orientation and period estimator for discriminating between forests, orchards, vineyards, and tilled fields. IEEE Trans. Geosci. Remote Sens 2006, 44, 2755–2760. [Google Scholar]
- Szantoi, Z.; Escobedo, F.; Abd-Elrahman, A.; Smith, S.; Pearlstine, L. Analyzing fine-scale wetland composition using high resolution imagery and texture features. Int. J. Appl. Earth Observ. Geoinf 2013, 23, 204–212. [Google Scholar]
- Zabih, R.; Woodfill, J. Non-parametric local transforms for computing visual correspondence. In Computer Vision—ECCV; Springer: Berlin/Heidelberg, Germany, 1994; pp. 151–158. [Google Scholar]
- Hirschmuller, H.; Scharstein, D. Evaluation of stereo matching costs on images with radiometric differences. IEEE Trans. Pattern Anal. Mach. Intell 2009, 31, 1582–1599. [Google Scholar]
- Neubeck, A.; van Gool, L. Efficient non-maximum suppression. In Proceedings of the 18th International Conference on Pattern Recognition (ICPR ’06), Hong Kong, China, 20–24 August 2006; 3, pp. 850–855.
- Liu, T.; Yuan, Z.; Sun, J.; Wang, J.; Zheng, N.; Tang, X.; Shum, H.Y. Learning to detect a salient object. IEEE Trans. Pattern Anal. Mach. Intell 2011, 33, 353–367. [Google Scholar]
- Rosin, P.L. A simple method for detecting salient regions. Pattern Recognit 2009, 42, 2363–2371. [Google Scholar]
- Marchesotti, L.; Cifarelli, C.; Csurka, G. A framework for visual saliency detection with applications to image thumbnailing. In Proceedings of the IEEE 12th International Conference on Computer Vision, Kyoto, Japan, 29 September–2 October 2009; pp. 2232–2239.


| Measure | Formula |
|---|---|
| Jeffrey | |
| Bhattacharyya | |
| City block | |
| Euclidean | |
| Intersection | |
| Matusita |
| Vegetation Index | Jeffrey | Bhattacharryya | City block | Euclidean | 1-Intersection | Matusita | Total |
|---|---|---|---|---|---|---|---|
| ExG | 0.5473 | 0.0683 | 0.5793 | 0.1481 | 0.2896 | 0.3634 | 1.9960 |
| ExR | 2.6694 | 0.4135 | 1.2824 | 0.3012 | 0.6412 | 0.8230 | 6.1307 |
| ExB | 2.5847 | 0.3468 | 1.2300 | 0.3026 | 0.6150 | 0.7656 | 5.8447 |
| ExGR | 2.1691 | 0.2663 | 1.0230 | 0.2668 | 0.5115 | 0.6838 | 4.9205 |
| NDI | 3.2832 | 0.4422 | 1.3176 | 0.3152 | 0.6588 | 0.8454 | 6.8625 |
| SR | 3.2334 | 0.3858 | 1.2456 | 0.3121 | 0.6228 | 0.8001 | 6.5997 |
| NDVI | 2.7510 | 0.3886 | 1.2555 | 0.2911 | 0.6278 | 0.8025 | 6.1165 |
| TVI | 2.8353 | 0.3870 | 1.2573 | 0.3271 | 0.6286 | 0.8012 | 6.2365 |
| GNDVI | 1.9611 | 0.2531 | 1.0839 | 0.2708 | 0.5420 | 0.6688 | 4.7797 |
| NG | 1.3829 | 0.1833 | 0.9752 | 0.2474 | 0.4876 | 0.5788 | 3.8552 |
| NR | 2.5527 | 0.4178 | 1.2897 | 0.3010 | 0.6448 | 0.8265 | 6.0325 |
| NNIR | 2.3429 | 0.3136 | 1.1535 | 0.2806 | 0.5767 | 0.7338 | 5.4012 |
| Number of Detected Oil Palm Tree | Ground Truth | False Positive | Window Size (Pixel) | Precision | Recall | F-Measure | |
|---|---|---|---|---|---|---|---|
| Image 1 | 458 | 456 | 9 | 17 | 0.98 | 0.985 | 0.982 |
| Image 2 | 704 | 716 | 1 | 17 | 0.998 | 0.981 | 0.992 |
| Image 3 | 198 | 203 | 1 | 19 | 0.994 | 0.970 | 0.986 |
| Image 4 | 145 | 142 | 4 | 17 | 0.972 | 0.993 | 0.979 |
| Image 5 | 1104 | 1106 | 14 | 15 | 0.987 | 0.985 | 0.986 |
| Image 6 | 1920 | 1938 | 7 | 15 | 0.996 | 0.987 | 0.993 |
| Image 7 | 612 | 597 | 16 | 17 | 0.973 | 0.998 | 0.981 |
| Number of Detected Oil Palm Tree | Ground Truth | False Positive | Window Size (Pixel) | Precision | Recall | F-Measure | |
|---|---|---|---|---|---|---|---|
| Image 1 | 108 | 115 | 9 | 13 | 0.916 | 0.861 | 0.897 |
| Image 2 | 406 | 415 | 4 | 19 | 0.990 | 0.967 | 0.983 |
| Image 3 | 643 | 653 | 5 | 17 | 0.992 | 0.977 | 0.987 |
| Image 4 | 337 | 340 | 5 | 15 | 0.985 | 0.976 | 0.982 |
| Image 5 | 1189 | 1214 | 15 | 17 | 0.987 | 0.967 | 0.981 |
© 2014 by the authors; licensee MDPI, Basel, Switzerland This article is an open access article distributed under the terms and conditions of the Creative Commons Attribution license (http://creativecommons.org/licenses/by/4.0/).
Share and Cite
Srestasathiern, P.; Rakwatin, P. Oil Palm Tree Detection with High Resolution Multi-Spectral Satellite Imagery. Remote Sens. 2014, 6, 9749-9774. https://doi.org/10.3390/rs6109749
Srestasathiern P, Rakwatin P. Oil Palm Tree Detection with High Resolution Multi-Spectral Satellite Imagery. Remote Sensing. 2014; 6(10):9749-9774. https://doi.org/10.3390/rs6109749
Chicago/Turabian StyleSrestasathiern, Panu, and Preesan Rakwatin. 2014. "Oil Palm Tree Detection with High Resolution Multi-Spectral Satellite Imagery" Remote Sensing 6, no. 10: 9749-9774. https://doi.org/10.3390/rs6109749
APA StyleSrestasathiern, P., & Rakwatin, P. (2014). Oil Palm Tree Detection with High Resolution Multi-Spectral Satellite Imagery. Remote Sensing, 6(10), 9749-9774. https://doi.org/10.3390/rs6109749