Abstract
Land degradation of alpine rangeland in Dachigam National Park, Northern India, was evaluated in this study using MODerate resolution Imaging Spectroradiometer (MODIS) land products. The park has been used by a variety of livestock holders. With increasing numbers of livestock, the managers and users of the park are apprehensive about degradation of the grazing land. However, owing to weak infrastructure for scientific and statistical data collection and sociopolitical restrictions in the region, a lack of quality ground-based weather, vegetation, and livestock statistical data had prevented scientific assessment. Under these circumstances, the present study aimed to assess the rangeland environment and its degradation using MODIS vegetation, snow, and evapotranspiration products as primary input data for assessment. The result of the analysis indicated that soil water content and the timing of snowmelt play an important role in grass production in the area. Additionally, the possibility of land degradation in heavily-grazed rangeland was indicated via a multiple regression analysis at a decadal timescale, whereas weather conditions, such as rainfall and snow cover, primarily explained year-by-year differences in grass production. Although statistical uncertainties remain in the results derived in this study, the satellite-based data and the analyses will promote understanding of the rangeland environment and suggest the potential for unsustainable land management based on statistical probability. This study provides an important initial evaluation of alpine rangeland, for which ground-based information is limited.1. Introduction
Alpine rangelands that spread across the highlands of East and Central Asia, which serve as carbon sinks [1,2], play an important role in the mitigation of global warming. Degradation of these alpine rangelands is advancing in China [3], due mainly to inappropriate land management (e.g., overgrazing) and climatic changes. Land degradation reduces soil carbon storage [4,5] and additionally damages the natural environment and sustainable activities of local pasturage. As the degradation of alpine rangelands has become one of the important environmental issues of recent decades, several studies have been conducted on the alpine rangeland environment in China. Harris [6] summarized a number of studies about rangeland degradation on the Qinghai-Tibetan plateau after referring to more than 170 research papers and reports. In India, where nomadic pastoralism is predominant in the northern alpine regions, degradation of alpine rangelands is also a large issue. Owing to overgrazing, coupled with poor land management, these grazing lands have deteriorated to a large extent and require amelioration or rehabilitation [7]. However, in contrast to rangelands in China, very few scientific studies have been conducted on rangelands in India. Future studies in this field are demanded in India to accumulate more knowledge and information about Indian rangeland and its conditions.
Application of remote sensing in conjunction with GIS has been regarded as a promising tool for wide and heterogeneous rangeland monitoring, and several pieces of research have applied satellite-based vegetation indices to monitor vegetation conditions in alpine rangelands [3]. Although more advanced vegetation indices, such as the Soil Adjusted Vegetation Index (SAVI) [8] and the Enhanced Vegetation Index (EVI) [9], are available, the Normalized Difference Vegetation Index (NDVI) [10] remains the major vegetation index for pasture monitoring because the index can be used effectively to estimate grass coverage (e.g., [11]), grass yield [12], pasture productivity (e.g., [13]), and soil carbon stocks (e.g., [14]). Li et al. [15] pointed out that the NDVI is a better index than the EVI for distinguishing the vegetation condition in arid and semi-arid regions.
The ultimate goals of this research are to evaluate the condition and degradation status of the alpine rangeland in Dachigam National Park, Northern India, through the 10 years from 2001 to 2010 using MODerate resolution Imaging Spectroradiometer (MODIS) NDVI as a surrogate for vegetation amount and to evaluate the applicability of a satellite-based approach for the areas where ground-based weather information is difficult to obtain. MODIS is a sensor onboard NASA’s Terra and Aqua satellites. The sensor views the entire Earth’s surface with high temporal resolution (every one to two days), which is an advantage for application in cloudy regions such as Dachigam. In Dachigam, livestock holders have insisted that the park’s grazing conditions have degraded during the period, however, the details are unknown because no scientific and objective evidence of the degradation is available. This study aims to scientifically and objectively evaluate the rangeland environment by efficiently using MODIS satellite imaging products. The literature indicates that the growth of alpine vegetation and/or grassland biomass production is largely impacted by climate elements such as precipitation [15,16], solar radiation [17], and air temperature [16]. In this study, we applied MODIS evapotranspiration products in a unique way to express the spatial distribution of energy and soil water conditions within the study area. Degradation of the alpine rangeland was evaluated via multiple regression using satellite-derived climate and soil-water information, with information of year serving as independent variables and vegetation information as the dependent variable.
2. Methodology
2.1. Study Site
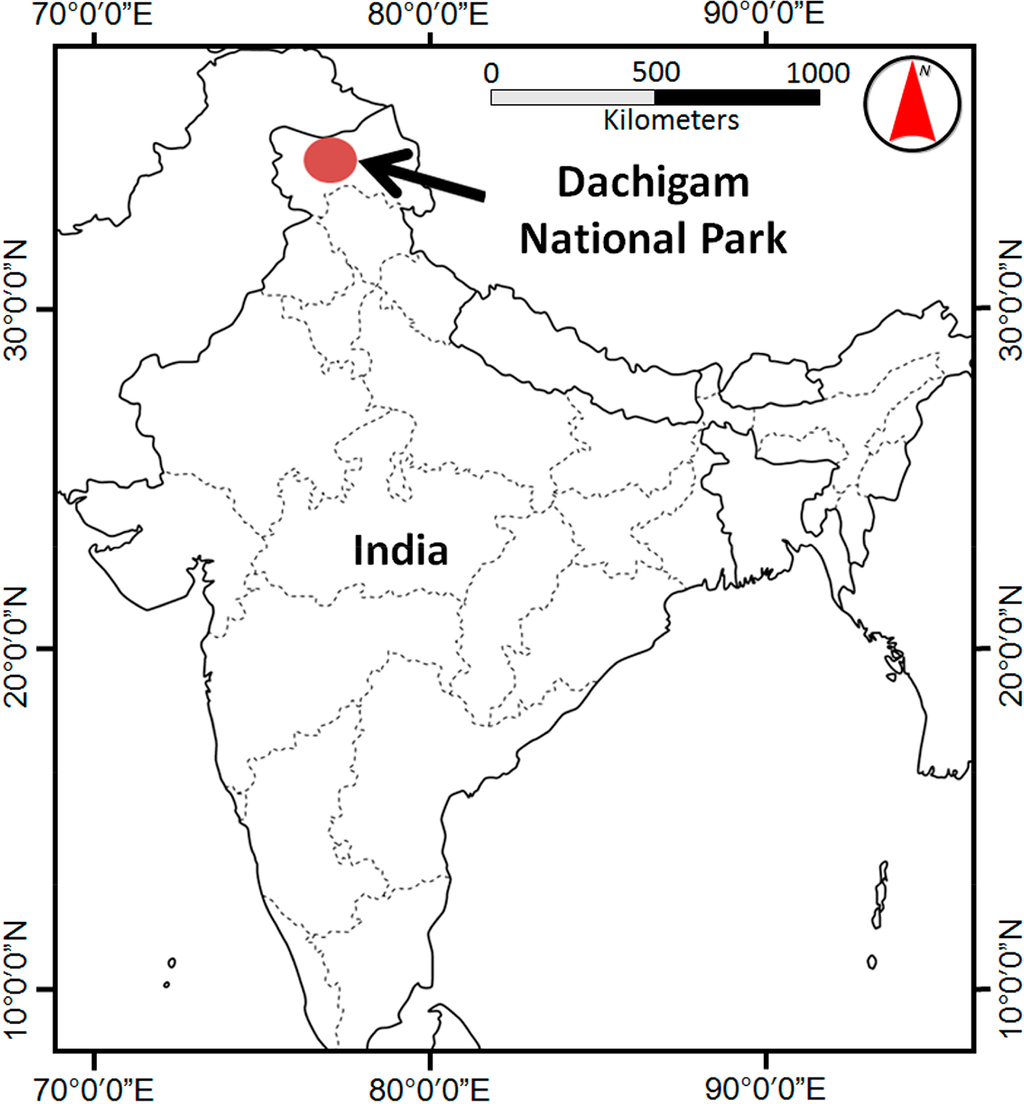
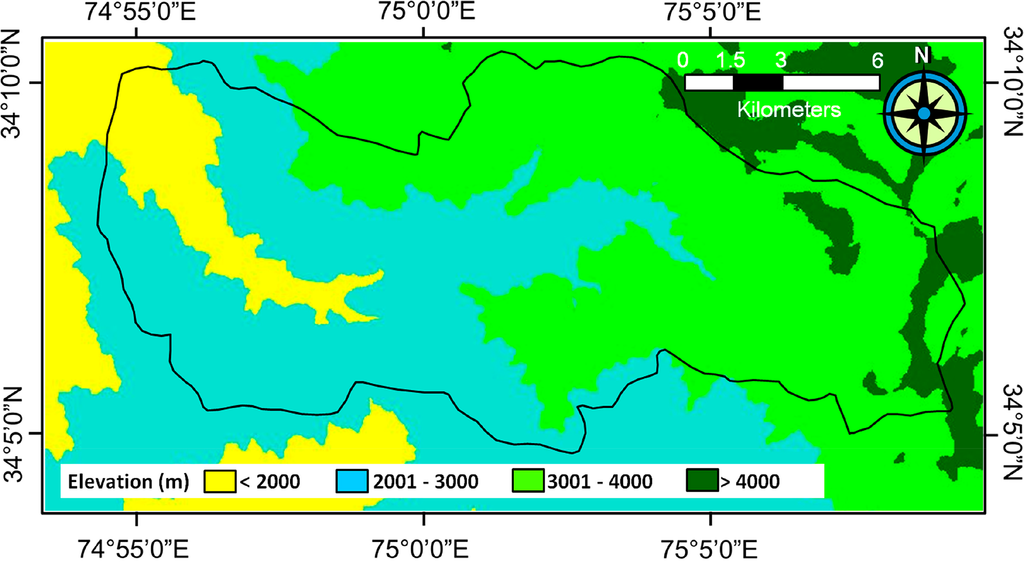
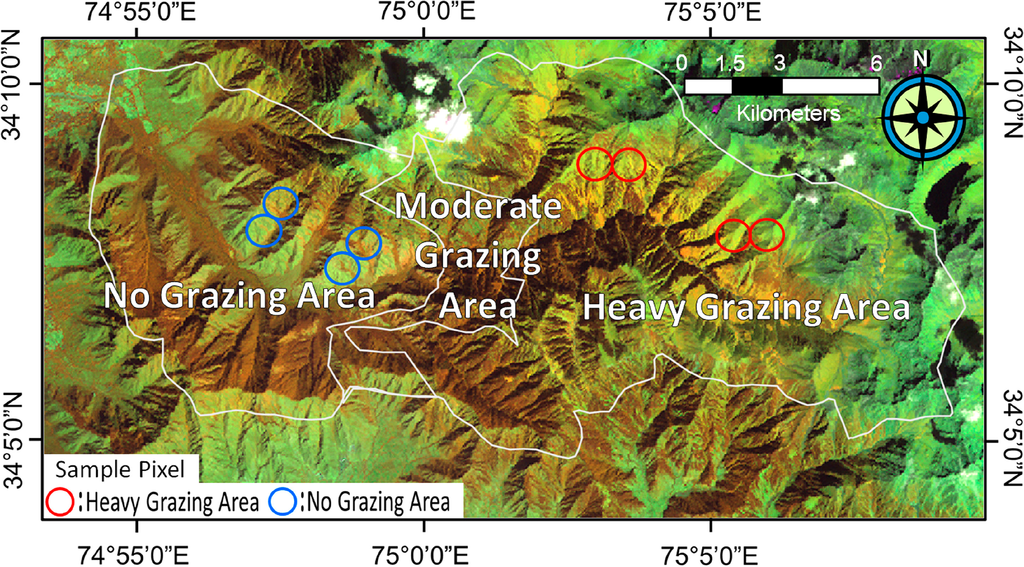
The study site is Dachigam National Park of Jammu and Kashmir (J&K) Province in Northern India (Figure 1). The park is located at 34°N, 75°E and occupies about 140 km2 of mountainous area in the western Himalayas. The elevation varies widely, ranging from 1700 to 4300 m (Figure 2). One challenge of this study was that ground-based weather data were not available for the region. In addition, the resolution of global meteorological datasets, such as JRA-25 reanalysis data (typical spatial resolution of about 120 to 200 km) [18], was too coarse to express the spatial variety of mountain weather within the study area. According to the Dachigam National Park Management Plan [19], which was the only accessible source of park meteorological and geological information, the park has a monthly average daily maximum temperature of 27 °C (July), minimum temperature of −5 °C (December), and annual rainfall of 2936 mm, with rainy seasons in May and August. However, considering the park’s wide range of elevation and mountainous topography, a large spatial and temporal variation of weather conditions is expected in the park. The park is divided into three subareas: lower, central, and upper. The western region of the park is the lowest region, and the eastern region is the highest. Several types of livestock use the national park as grazing land. A government-owned sheep breeding and research farm comprises about 800 sheep, which breed in the park. Local sheepherders (called Chopan), cowherders (called Gujjar), and nomadic goatherders (called Bakkarwal) also use the park to graze their livestock, although statistical data are not available for these animals. The primary land cover in the park is grassland and forest. The lower part of the park had historically been the Maharaja’s hunting field and had been isolated from the public. Continuing this tradition, no livestock grazing is conducted in the lower part of the park, while intense grazing is conducted in the upper part of the park. The park has been separated into 42 management blocks, and the grazing intensity differs by region [19]; no grazing is conducted in blocks 1–9a and 36–42; moderate grazing is conducted in blocks 9b, 10, 15, and 35; and heavy grazing is conducted in blocks 11–14 and 16–34. The spatial distribution of grazing intensity reported by Naqash et al. [19] is shown in Figure 3, along with the locations of sample pixels, which are explained in a later section.
Jammu and Kashmir is a region of conflict between India and Pakistan. According to an interview with local goatherders conducted in 2012, the number of livestock in Dachigam National Park has been increasing and the grazing land in the park has been degrading. The number of livestock increased rapidly around 1971 and again around 1999 owing to the Indo-Pakistani War and the Kargil War, respectively. During the wars, the government closed some grazing lands near the border by allowing an influx of nomads into the park. These closed grazing lands have yet to be opened, thus, the immigrated livestock continue to use the park.
2.2. Data
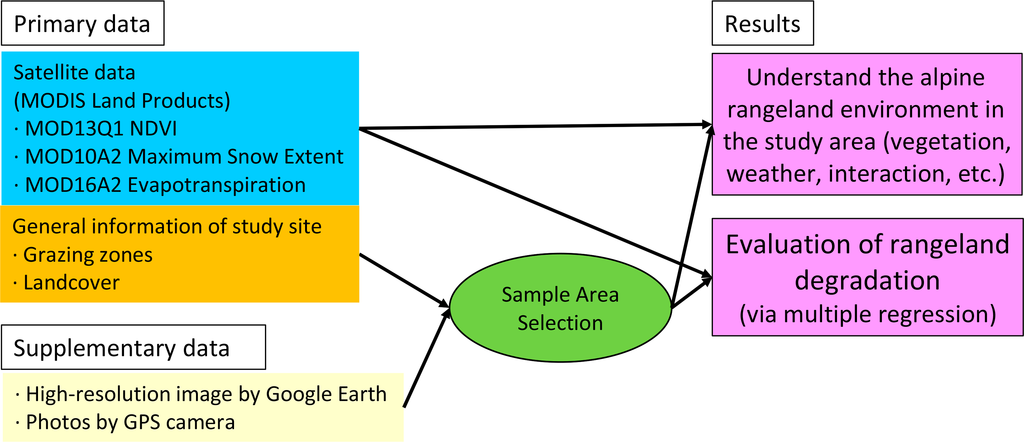
Owing to the weak infrastructure of scientific and statistical data collection and sociopolitical restrictions of the region, obtainable ground-based information was limited. Thus, this study relied largely on satellite-based information. Figure 4 illustrates an overview of the primary and supplementary data and the usage of these data in this study. These data are also described in the following sections.
2.2.1. MODIS Image Products for 10 Years (2001–2010)
A MOD13Q1, 16-day, 250 m, NDVI product [20] from 2001 to 2010 (MODIS tile = h24v05) was used as a relative indicator of the amount of vegetation in the rangelands of the park. The NDVI was quality controlled using the quality assurance (QA) data provided with the NDVI images. Pixels reported by the QA data as “cloud covered” (pixel reliability rank = 3) were treated as missing-data pixels because optical land observation would be prevented by cloud cover. In addition, pixels reported by the QA data as “marginal data” (pixel reliability rank = 1; explained as useful but with quality that is somewhat lower to lowest) were checked manually and categorized as “missing data” if the NDVI value showed an obvious, sudden, short-term dip during the plant growing season, because such a dip is most likely evidence of cloud contamination. The data-missing pixels were then filled by averaging NDVI values of the previous and subsequent sequential images. Because MODIS multiday composite products are designed to minimize the impact of clouds, data-missing pixels rarely occur, even in the study area, which is located in a cloudy region. Data-missing pixels occurred on average only about once per year in the sample area, and typically appeared in winter but not summer.
Snow information was anticipated to be an important weather parameter of the park, as the timing of snow melt is considered to be one of the most important factors for plant development in alpine regions [21]. Snow seems to affect the growth of vegetation, especially in the upper regions of the park, which are generally covered by snow for several months. The MOD10A2, 8-day, 500 m, maximum snow extent product [22–24] was finally selected as being representative of the snow conditions of the park. Other snow-cover products were either daily products, which are inconvenient to manipulate, or had a spatial resolution (0.05°) that was too coarse. MOD10A2 includes daily snow information in addition to 8-day maximum snow extent information. We evaluated the daily snow information in MOD10A2 as erroneous because it is frequently categorized as “no-snow” in the areas near mountain icecaps during mid-winter. According to Hall and Riggs [23], a similar misclassification also occurs in the 8-day maximum snow cover data. Owing to disturbance by clouds in winter, the product occasionally erroneously reports “no snow” for snow-covered areas. In this study, a maximum of three sequential no-snow periods wedged by snow-cover periods during winter was designated as snow-covered period, assuming that misclassification had occurred. This type of quality control was necessary in the study area, an alpine snowy (implying cloudy) region. Only three missing data occurred in the snow product: two in June and one in March. The missing data were filled by analyzing the previous and subsequent snow conditions.
The MOD16A2 8-day, 1 km, evapotranspiration (ET) product [25,26] over the same 10-year span was used in a unique way in this study. The MODIS ET product contains two different types of information: actual ET (ETact) and potential ET (ETpot). In the case of MOD16A2, a quality-control procedure using the QA information is incorporated into the estimation algorithm. Both ETact and ETpot are above-ground land surface processes and can essentially be used as the ET data-source. However, in this study, these parameters were used as indicators of general weather conditions and soil water content, to reinforce the parameters that might affect the growth of alpine vegetation in places where ground-based data are limited. Micrometeorologically, ETpot is a weather parameter determined by radiation, temperature, and aerodynamic conditions above the surface. In this study, ETpot was used as an indicator of weather conditions, such as radiation and temperature. ETact is determined by the combination of surface conditions, energy, and soil water availability. Tasumi and Kimura [27] reported that ETact/ETpot (actual ET divided by potential ET) provided a fair representation of soil water content in a rangeland in China. Here, the subjected depth of the volumetric soil water content is the depth at which the soil water is transited to ET. The direct source of water for surface evaporation is typically soil water available in the top 10 to 15 cm beneath the surface [28], and the direct source of water for transpiration is soil water available in the root zone of vegetation. A typical depth of the primary root zone of pasture in a moderate to humid area is zero to 25 cm [29]. Thus, in this study, ETact/ETpot calculated using MOD16A2 was used as an indicator of soil water content near the surface (e.g., zero to 25 cm from the surface). Missing data were not available. The mean absolute error of MOD16 ET products, evaluated by 46 AmeriFlux eddy covariance data for several land uses, including grassland, has been reported to be 0.33 mm·day−1 or 24.1% [25].
2.2.2. Literature Information
The Dachigam National Park Management Plan [19] contains some map data, such as land-cover classification and grazing intensity of the park. Land-cover and grazing-intensity information were used as basic information for sample area selection in this study.
2.2.3. Other Information
Field trips were conducted twice, in March and in September of 2012. Photographs of the study site were obtained using a Global Positioning System (GPS) camera to confirm the surface land coverage and vegetation conditions of the park. Interviews with governmental representatives (such as the wildlife wardens of the park and those of the Geographic Information System (GIS) section of the local government) and with local livestock holders were conducted to understand the historical and general conditions of grazing. High-resolution images from Google Earth, Google Inc., were used to reconcile GPS camera snapshots, a land-use map, and coarser MODIS imagery.
2.3. Method of Analysis
Among the four types of MODIS-based information employed in this study (i.e., NDVI, snow cover, ETpot and ETact/ETpot), two ET-related information sources had a spatial resolution of 1 km and were the coarsest. Thus, 250 m NDVI and 500 m snow cover pixels were resampled to 1 km by weighted averaging of the pixel area inside the 1 km pixel. Then, 1 km by 1 km sample pixels from relatively homogeneous grasslands spread over more than 2 km by 2 km (double the size of the pixel size considering the pixel georegistration accuracy and the resolution degradation due to the sensor angle) were selected. Because the total extent of the national park is relatively small (140 km2) and the land cover was fractionated, few suitable locations were available for the sample area. Finally, eight 1 km by 1 km sample pixels, four from the no-grazing area and four from the heavy-grazing area, were selected. The locations of the selected pixels are shown in Figure 3. For all of the selected sample pixels, the majority of the land coverage was grass, although every sample pixel contained some portions of tree and/or rock surfaces. Using high-resolution images from Google Earth, the average percentage of tree/rock contamination was estimated as 20%. The tree, rock, and grassland surfaces were visually detectable on the Google Earth image of the study site, thus, it was a convenient tool for analyzing the percentage of contamination within the 1 km by 1 km sample pixels. This contamination prevented evaluation of detailed spatial differences in the vegetation condition within the no-grazing or heavy-grazing areas. In this research, each of the four sample pixel values within no-grazing and heavy-grazing areas were averaged and used as representative values of the two areas.
The four MODIS-derived values were plotted in time series to understand the general vegetation and climatic conditions of the study area. Cross-relationships of parameters, such as NDVI vs. ETact/ETpot, were also evaluated. Degradation of alpine rangeland is difficult to evaluate by NDVI, unless the impacts of yearly differences in weather and soil-water conditions on vegetation growth are eliminated or reduced. Multiple regression is a convenient tool for extracting rangeland degradation (if available) by eliminating or reducing these yearly differences. Thus, after each parameter was evaluated, a backward multiple linear regression method, focusing on the difference between no-grazing and heavy-grazing areas, was conducted on an annual basis using IBM SPSS Statistics software (Ver. 22). The dependent variable was ΔNDVI, defined as the NDVI of the no-grazing area minus the NDVI of the heavy-grazing area (May to October average). Independent variables were (1) ΔSnow (days), defined as the days of snow cover in the no-grazing area minus those in the heavy-grazing area; (2) ΔETpot (mm·year−1), defined as the ETpot in the no-grazing area minus that in the heavy-grazing area; (3) ΔETact/ETpot, defined as the ETact/ETpot in the no-grazing area minus that in the heavy-grazing area; and (4) Year, a variable that consisted of the series of numbers from 2001 to 2010, expressing the change through the years. The model with the maximum number for the adjusted coefficient of determination (adjusted R-square) was determined to be the most suitable model. The collinearity problem must be considered when independent variables are correlated among themselves. Collinearity is evaluated via the variance inflation factor (VIF), and it becomes a serious problem when VIF exceeds 10 [30]. In our regression analysis, the maximum VIF was 1.329, indicating that the independent variables employed in this study were adequate.
3. Results and Discussion
3.1. General Vegetation and Climatic Conditions of the Study Area
Figure 5 shows the transitions of NDVI, snow cover, ETpot and ETact/ETpot for the 10 years from 2001 to 2010. The low-value range of NDVI (e.g., 0.2 or below) occurs during winter when the surface is covered by snow. During such a winter period, NDVI does not behave as an indicator of vegetation amount because NDVI reflects the snow-cover condition (snow or no-snow) rather than vegetation. Thus, in the following annual statistical analysis, only NDVI values during the snow-free period (May to October) were used as an indicator of vegetation amount. The NDVI graph indicates that vegetation growth begins earlier in the no-grazing area than in the heavy-grazing area because the heavy-grazing area is located at high altitude where the surface is typically covered by snow until mid-April. Visual observation of the NDVI graph shows no evidence of long-term degradation of vegetation in the high-grazing area. ETpot is slightly higher in the no-grazing area than in the heavy-grazing area during winter and early spring. The primary reason for this difference might be a difference in the snow condition, because snow reflects more solar radiation and thus reduces net radiation. ETact/ETpot was used as an indicator of soil water content. Typically, two peaks of ETact/ETpot, one in winter and another in summer, are recognized. The peak in summer reflects the rainy season during the summer period, and the peak in winter reflects the water supply coming from snow. ETact/ETpot might be a strong data source of soil water content where no ground-based precipitation and/or soil moisture data are available.
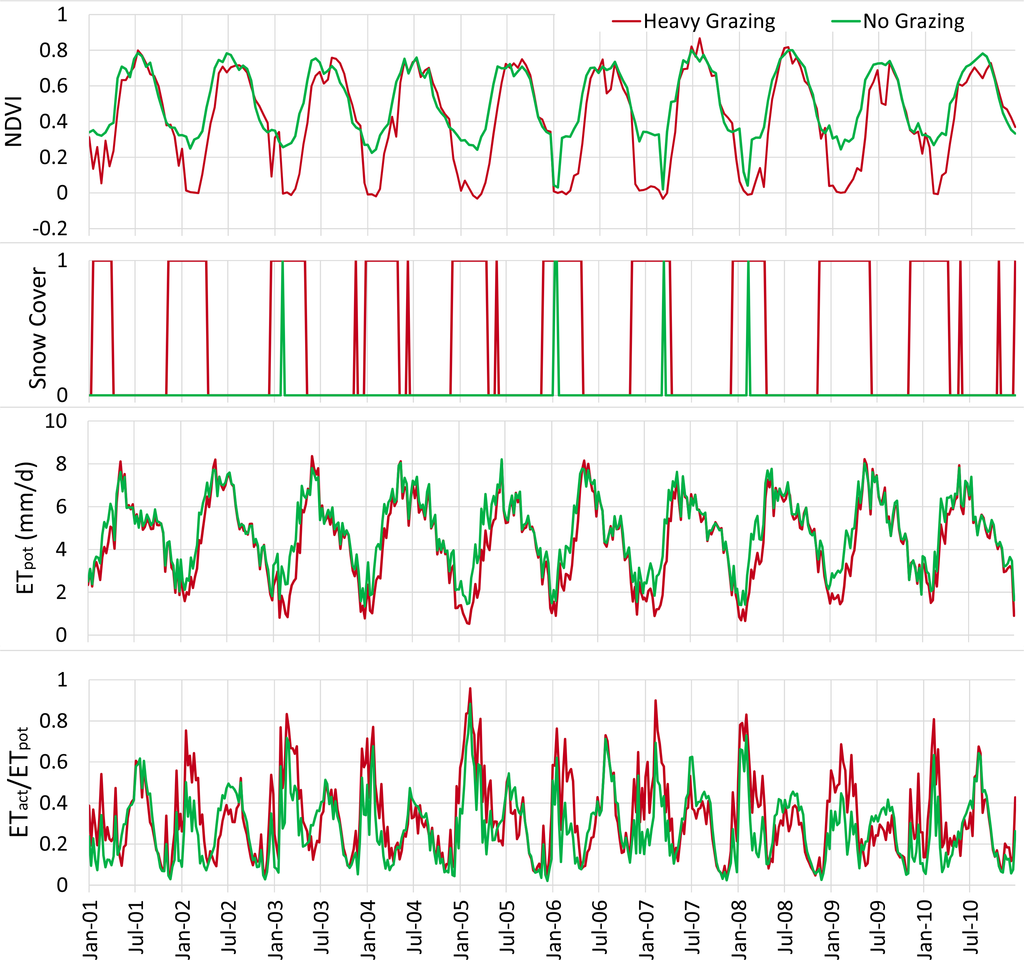
Figure 6 shows monthly NDVI (10-year average) in the heavy-grazing and no-grazing areas. During the period indicated by yellow in the graph (May to October), the land surface is rarely covered by snow and NDVI is expected to function as indicator of vegetation amount. NDVI was higher in the no-grazing area than in heavy-grazing area. Within the yellow-indicated period, the difference of NDVI between the two areas was largest (about 0.15) in May and smallest (near zero) in September to October. The difference of NDVI was most likely caused by the impact of snow. Grass begins to grow late in the heavy-grazing area of the park, probably because of late snowmelt in the area. This phenomenon agrees with the description of Shiping et al. [21] for alpine vegetation. The NDVI difference shown in Figure 6 is difficult to explain by the difference in grazing intensity. If the NDVI difference were due to the difference in grazing intensity, the NDVI difference would either be constant over the seasons, or the largest difference in NDVI would be observed during Summer, when the grazing in the park is expected to be most active, rather than in Spring.
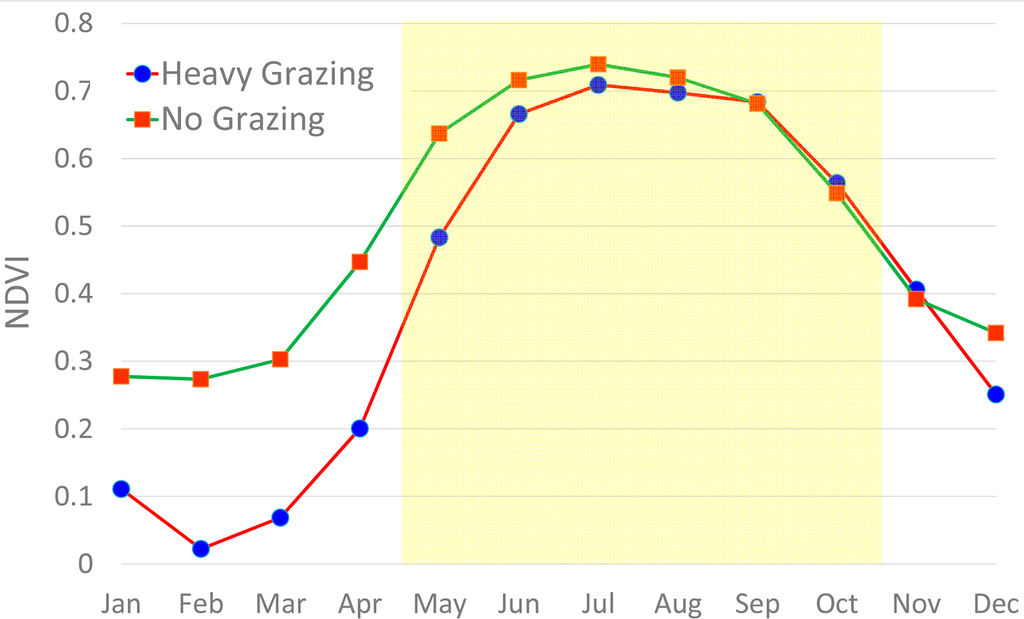
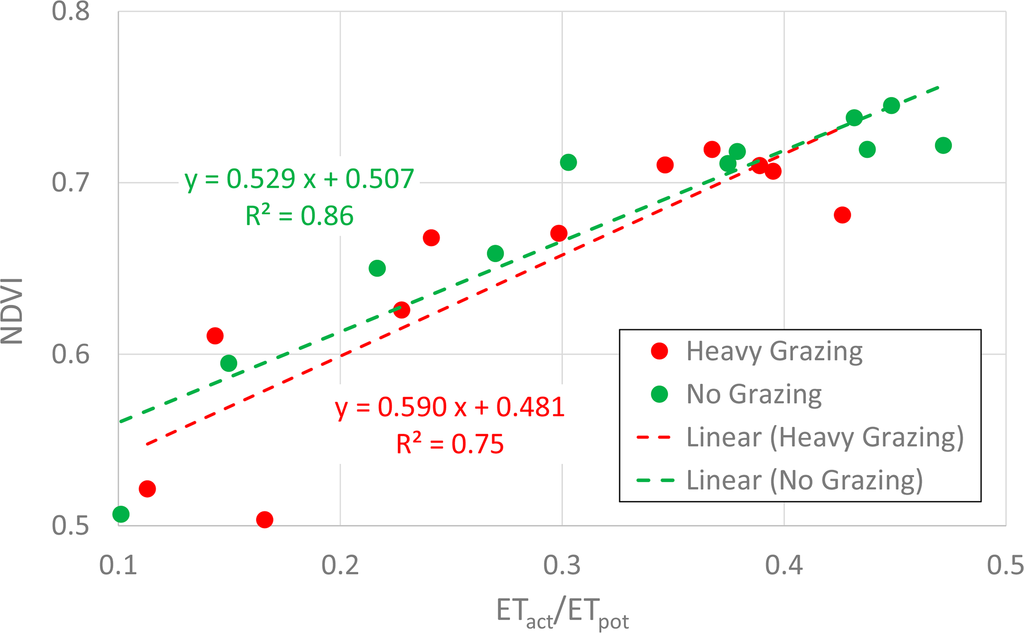
Figure 7 shows the relationship between NDVI and ETact/ETpot. This graph indicates that the amount of grass is closely related to soil water content in both the heavy-grazing and no-grazing areas, with high R-square (R2) values (0.75 and 0.86, respectively) of the linear regression lines. The highest NDVI and ETact/ETpot occur during summer. Summer rainfall in the park might have supported growth of pasture in both the heavy-grazing and no-grazing areas.
3.2. Annual Statistical Analysis
Table 1 shows a summary of the backward multiple linear regression. Unfortunately, a result with high confidence (e.g., p-value < 0.05) was not obtained through the analysis. As shown in the table, Model 1 uses all the individual input variables. The structure of Model 1 is described as follows:

The backward multiple linear regression method analyzes the least important independent variable for each model, and the least important variable is omitted in the next model. The least important variable is the one having the smallest absolute number in the “Standardized Coefficients” column of the table because the standardized coefficient, calculated by multiplying the partial slope (i.e., unstandardized coefficient) by the ratio of the standard deviations of the independent variable and dependent variable, shows the normalized impact of the independent variable. In the case of Model 1, ΔETact/ETpot was evaluated to be the least important variable. Thus, the parameter ΔETact/ETpot was not employed in Model 2. Model 3 was constructed by omitting “Year” from Model 2 because “Year” was evaluated as the least important independent variable in Model 2.
3.2.1. Selected Model
Model 2 in Table 1 showed the maximum adjusted R2. Thus, Model 2 was selected as the best model. In Model 2, the independent variable ΔETact/ETpot, representing the difference in soil water content between the two locations, was statistically dropped as compared with Model 1 because the parameter was regarded as least significant for explaining the vegetation difference between the two locations. This result, however, is apparently inconsistent with the result shown in Figure 7. If ETact/ETpot were an important factor of vegetation, as indicated in Figure 7, ΔETact/ETpot should have a strong relation with ΔNDVI. The primary difference in the two results is the difference in timescale: Figure 7 is a 16-day comparison and Table 1 is based on annual average data. The soil moisture and NDVI had a strong relation at the biweekly timescale, but no relation or only a weak relation was implied at the annual timescale.
According to Model 2, ΔNDVI can be explained in the following equation:
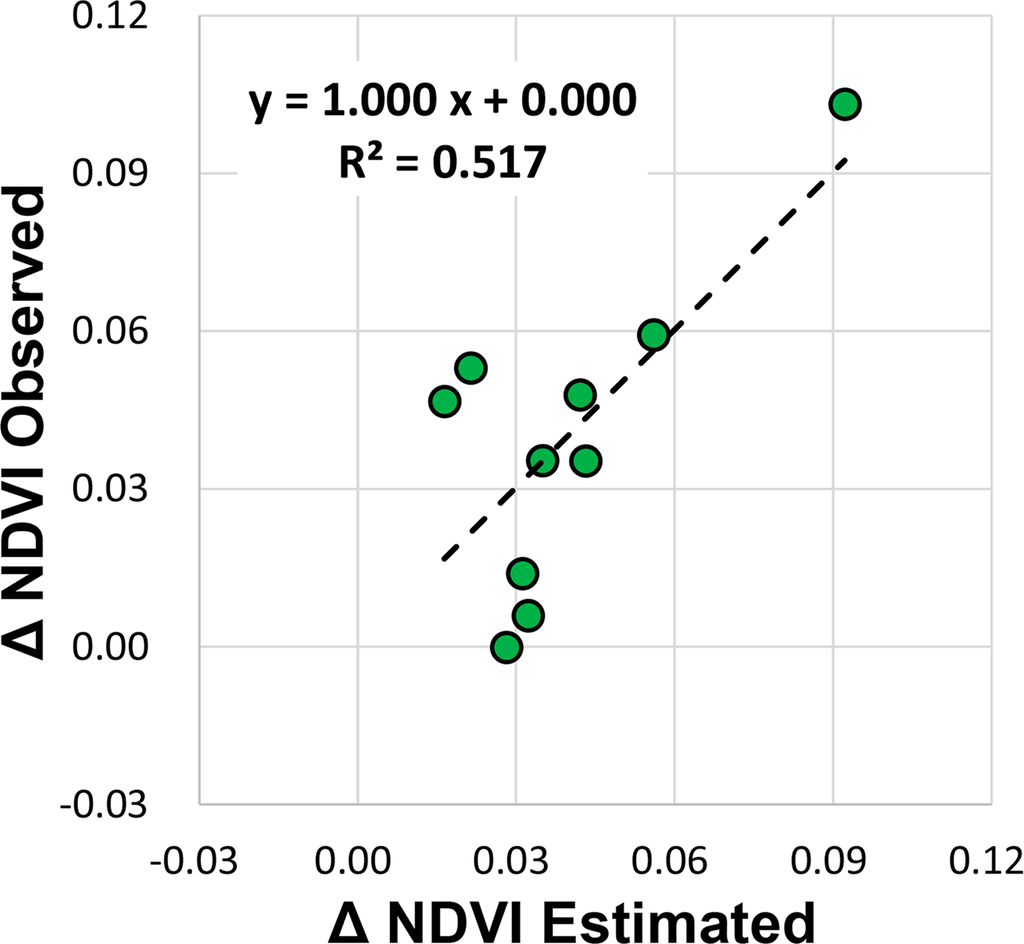
An estimated ΔNDVI using Equation (2) was plotted against the satellite-observed ΔNDVI (Figure 8). The model expressed in Equation (2) tended to represent observed ΔNDVI for the years when both the observed and estimated ΔNDVI were large.
3.2.2. Contribution of the Independent Variables
The contribution of the independent variables used in Equation (2) is shown as the “Standardized Coefficients” in Table 1. Higher absolute values of the standardized coefficients imply a larger contribution. The fact that absolute values of the standardized coefficient were the highest in ΔETpot indicated that the difference in weather condition, represented as ΔETpot, most affected the difference between vegetation amounts at the two locations. ΔSnow was the second contributor for explaining the difference in vegetation amount between the two locations. Year (standardized coefficient = 0.370) was the third, but not an ignorable, contributor for explaining the difference in vegetation amount between the non-grazing and the heavily grazed pasturelands.
3.2.3. Reality of the Selected Model
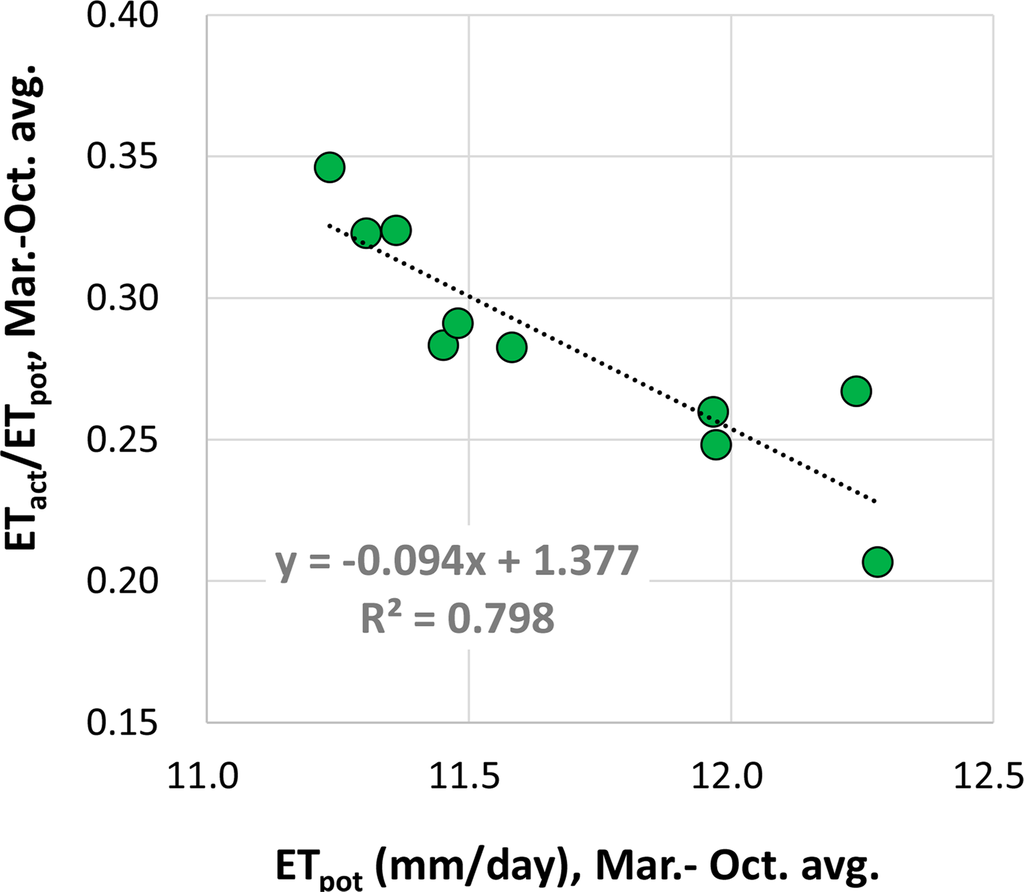
In Equation (2), the coefficient for ΔSnow has a negative sign, meaning that a relatively longer snow cover in the heavy-grazing area derives less vegetation in the area. This seems to be a theoretical result because pastures have difficulty growing before the snow melts, and it agrees with the discussion made for Figure 6. The coefficient for ΔETpot also has a negative sign, meaning that a relatively lower ETpot in the heavy-grazing area (low ETpot indicates lower radiation or colder temperature) derives more vegetation in the area. This result is incongruent with the common theory that vegetation prefers higher radiation and temperature. An interpretation of the result might be that lower radiation and colder temperature were the result of higher rainfall, and more rainfall derived more vegetation. Figure 9 shows the relationship between the March-to-October averages of ETpot and ETact/ETpot in the heavy-grazing area for the 10 years from 2001 to 2010. The figure clearly indicates that a year having high ETpot (i.e., better radiation and/or temperature conditions) has low ETact/ETpot (i.e., lower soil moisture condition). This is probably the reason that the coefficient for ΔETpot had a negative sign in Equation (2). In this research, soil water content was intended to be represented by ETact/ETpot, rather than ETpot. It was successful at the 16-day timescale (shown in Figure 7), but it was not successful at the annual timescale because soil water contents in winter did not contribute to vegetation growth in summer. At the annual timescale, ETpot apparently acted as an indicator of soil water content, contributing to the growth of grass.
The coefficient for Year has a positive sign, meaning that the vegetation condition in the heavy-grazing area is degrading compared with that in the no-grazing area. This agrees with the observation by livestock holders who use heavy-grazing pasturelands. Recent degradation was also mentioned in the park management plan [19]. Therefore, the composition of Equation (2) seems to be consistent and reasonable.
3.3. Accuracies, Errors, and Uncertainties
Within the key input data applied in this study, MODIS MOD16 ET product is a new product compared with other primary MODIS products, and the accuracy of MOD16 has not been examined well in cloudy, mountainous regions of Asia, which provide difficult conditions for general satellite-based observations and estimations. Absolute accuracy might be lower than that reported in Mu et al. [25], even though MOD16 uses daily global reanalysis weather data, which might mitigate the impact of the lack of satellite-based land observation due to cloudiness, as part of its inputs. To avoid potential uncertainty of accuracy as much as possible, this study used MODIS ET only as a relative indicator (spatially and temporally) and not as absolute values.
In the multiple regression analysis conducted in this study, the probability (p-value) of the factors selected via regression analysis (i.e., ΔSnow, ΔETpot and Year) ranged from 0.153 to 0.246, values too large to present the result with confidence as p-values of 0.05, or smaller, are generally regarded as indicating a statistical result with confidence. The large p-values indicate that some uncertainties remain in the analysis. A portion of the uncertainties might be due to noise in the input data. Additional input data, including ground-based scientific and statistical data, which are not available for the region at this time, would be necessary to better explain the vegetation condition. However, the multiple-regression result obtained in this research at least indicated the possibility that land degradation in heavy-grazing area had progressed during the evaluated 10-year period, with a p-value of 0.246.
4. Conclusions
In this study, the 10-year degradation condition of alpine rangeland in Dachigam National Park of Northern India was evaluated. Ground-based weather, vegetation, and grazing data were not obtainable in the area; thus, the evaluation relied primarily on satellite-based data products. MODIS NDVI, snow, and ET products over the area from 2001 to 2010 were used in the analysis. For ET products, ETpot was used as an indicator of the weather condition, and ETact/ETpot was used as an indicator of soil water content.
The result of the analysis for general vegetation and climatic conditions of the study area indicated that snow cover delays the growth of grass in heavy-grazing areas, which are located at higher altitudes. At the heavy-grazing areas, snow is generally available until around mid-April, and the late snowmelt most likely appeared as a 0.15 reduction of NDVI in May. Additionally, a strong short-term relation was found between vegetation amount and soil moisture. NDVI and ETact/ETpot for the 16-day period during May to October (10-year average) showed a strong linear relationship in both the heavy-grazing and no-grazing areas (R2 of 0.75 and 0.86, respectively). Summer rainfall in the park might have supported growth of pasture in both the heavy-grazing and no-grazing areas. An annual multiple regression analysis indicated that the relative amount of grass in the heavy-grazing area, if compared to the no-grazing area, was affected primarily by soil water content, which appeared not as ETact/ETpot but as ETpot, and the temporal extent of snow cover. The statistical analysis also indicated the possibility of degradation of the heavy-grazing rangeland at a decadal timescale. Some uncertainties exist in the input data and the results, as discussed in Section 3.3. However, the multiple-regression result obtained in this research at least indicated the possibility that land degradation in heavy-grazing area had progressed during the evaluated 10-year period. The indication agreed with the observations of livestock holders and the report of the park’s management plan.
All of the above-mentioned findings (i.e., the impacts of snow cover and soil moisture on vegetation growth and the indication of the possibility of year-by-year vegetation degradation with a p-value of 0.246) were able to be made only because of the usage of satellite observation. As indicated in this study, growth of alpine vegetation is affected by local weather and soil moisture conditions. This study applied MODIS ET products in a unique way to express the spatial distribution of energy and soil water conditions within the study area, in order to account the meteorological and soil physical conditions on land degradation analysis. Environmental evaluation of the remote site would not have otherwise been possible. Therefore, we conclude that satellite observation promoted understanding of the rangeland conditions, which is useful for initial evaluations of the natural environment in the remote area. A sustainable form of land and livestock management should be considered in the future after more detailed investigations including ground-based data collections have been conducted.
Acknowledgments
The authors acknowledge and thank Rashid Y. Naqash, former wildlife warden of Dachigam National Park, for providing the available data of the park and for his valuable advice for this research. This research was supported financially by Grand-in-Aids for Scientific Research (A) No. 23255015 (P.I. Nobumi Hasegawa) from the Japan Society for Promotion of Science.
Author Contributions
All authors contributed extensively to the work presented in the paper. Masahiro Tasumi is the main author who wrote the manuscript. Kiyomi Hirakawa processed the images. Masahiro Tasumi and Kiyomi Hirakawa analyzed the data. Nobumi Hasegawa, Aya Nishiwaki and Rikako Kimura advised and supported as specialists of alpine pastureland, vegetation condition and nomadism, respectively. Nobumi Hasegawa and Rikako Kimura conducted interviews with nomadic people and local government representatives and provided background information about the study area.
Conflicts of Interest
The authors declare no conflict of interest.
References
- Kato, T.; Tang, Y.; Gu, S.; Cui, X.; Hirota, M.; Du, M.; Li, Y.; Zhao, X.; Oikawa, T. Carbon dioxide exchange between the atmosphere and an alpine meadow ecosystem on the Qinghai–Tibetan Plateau, China. Agric. For. Meteorol 2004, 124, 121–134. [Google Scholar]
- Ohtsuka, T.; Hirota, M.; Zhang, X.; Shimono, A.; Senga, Y.; Du, M.; Yonemura, S.; Kawashima, S.; Tang, Y. Soil organic carbon pools in alpine to nival zones along an altitudinal gradient (4400–5300 m) on the Tibetan Plateau. Polar Sci 2008, 2, 277–285. [Google Scholar]
- Akiyama, T.; Kawamura, K. Grassland degradation in China: Methods of monitoring, management and restoration. Grassl. Sci 2007, 53, 1–17. [Google Scholar]
- He, N.; Wu, L.; Wang, Y.; Han, X. Changes in carbon and nitrogen in soil particle-size fractions along a grassland restoration chronosequence in northern China. Geoderma 2009, 150, 302–308. [Google Scholar]
- Li, Y.Y.; Dong, S.K.; Wen, L.; Wang, X.X.; Wu, Y. Soil carbon and nitrogen pools and their relationship to plant and soil dynamics of degraded and artificially restored grasslands of the Qinghai–Tibetan Plateau. Geoderma 2014, 213, 178–184. [Google Scholar]
- Harris, R.B. Rangeland degradation on the Qinghai–Tibetan plateau: A review of the evidence of its magnitude and causes. J. Arid Environ 2010, 74, 1–12. [Google Scholar]
- Roy, A.K.; Singh, J.P. Grasslands in India: Problems and perspectives for sustaining livestock and rural livelihood. In Proceedings of the 22nd International Grassland Congress, Sydney, Australia, 15–19 September 2013; pp. 1740–1742.
- Huete, A.R. A soil-adjusted vegetation index (SAVI). Remote Sens. Environ 1988, 25, 295–309. [Google Scholar]
- Huete, A.; Didan, K.; Miura, T.; Rodriguez, E.P.; Gao, X.; Ferreira, L.G. Overview of the radiometric and biophysical performance of the MODIS vegetation indices. Remote Sens. Environ 2002, 83, 195–213. [Google Scholar]
- Tucker, C.J. Red and photographic infrared linear combinations for monitoring vegetation. Remote Sens. Environ 1979, 8, 127–150. [Google Scholar]
- Liu, Y.; Zha, Y.; Gao, J.; Ni, S. Assessment of grassland degradation near Lake Qinghai, West China, using Landsat TM and in situ reflectance spectra data. Int. J. Remote Sens 2004, 25, 4177–4189. [Google Scholar]
- Yu, L.; Zhou, L.; Liu, W.; Zhou, H.K. Using remote sensing and GIS technologies to estimate grass yield and livestock carrying capacity of alpine grasslands in Golog prefecture, China. Pedosphere 2010, 20, 342–351. [Google Scholar]
- Numata, I.; Roberts, D.A.; Sawada, Y.; Chadwick, O.A.; Schimel, J.P.; Soares, J.V. Regional characterization of pasture changes through time and space in Rondonia, Brazil. Earth Interact 2007, 11, 1–25. [Google Scholar]
- Burgheimer, J.; Wilske, B.; Maseyk, K.; Karnieli, A.; Zaady, E.; Yakir, D.; Kesselmeier, J. Relationships between Normalized Difference Vegetation Index (NDVI) and carbon fluxes of biologic soil crusts assessed by ground measurements. J. Arid Environ 2006, 64, 651–669. [Google Scholar]
- Li, Z.; Huffman, T.; McConkey, B.; Townley-Smith, L. Monitoring and modeling spatial and temporal patterns of grassland dynamics using time-series MODIS NDVI with climate and stocking data. Remote Sens. Environ 2013, 138, 232–244. [Google Scholar]
- Xia, J.; Liu, S.; Liang, S.; Chen, Y.; Xu, W.; Yuan, W. Spatio-temporal patterns and climate variables controlling of biomass carbon stock of global grassland ecosystems from 1982 to 2006. Remote Sens 2014, 6, 1783–1802. [Google Scholar]
- Gao, Q.Z.; Wan, Y.F.; Xu, H.M.; Li, Y.; Jiangcun, W.Z.; Borjigidai, A. Alpine grassland degradation index and its response to recent climate variability in Northern Tibet, China. Quat. Int 2010, 226, 143–150. [Google Scholar]
- Onogi, K.; Tsutsui, J.; Koide, H.; Sakamoto, M.; Kobayashi, S.; Hatsushika, H.; Matsumoto, T.; Yamazaki, N.; Kamahori, H.; Takahashi, K.; et al. The JRA-25 reanalysis. J. Meteorol. Soc. Jpn 2007, 85, 369–432. [Google Scholar]
- Naqash, R.Y.; Sharma, L.K. Dachigam National Park Management Plan (2011–2016); Department of Wildlife Protection, Jammu & Kashmir Government: Srinagar, Kashmir, India, 2012; p. 154. [Google Scholar]
- Huete, A.; Justice, C.; van Leeuwen, W. MODIS Vegetation Index (MOD 13) Algorithm Theoretical Basis Document Version 3, Available online: http://modis.gsfc.nasa.gov/data/atbd/atbd_mod13.pdf (accessed on 19 April 2014).
- Wang, S.; Wang, C.; Duan, J.; Zhu, X.; Xu, G.; Luo, C.; Zhang, Z.; Meng, F.; Li, Y.; Du, M. Timing and duration of phenological sequences of alpine plants along an elevation gradient on the Tibetan plateau. Agric. For. Meteorol 2014, 189–190, 220–228. [Google Scholar]
- Hall, D.K.; Riggs, G.A.; Salomonson, V.V. Development of methods for mapping global snow cover using moderate resolution imaging spectroradiometer data. Remote Sens. Environ 1995, 54, 127–140. [Google Scholar]
- Hall, D.K.; Riggs, G.A. Accuracy assessment of the MODIS snow products. Hydrol. Process 2007, 21, 1534–1547. [Google Scholar]
- Riggs, G.A.; Hall, D.K.; Salomonson, V.V. MODIS Snow Products User Guide to Collection 5, Available online: http://modis-snow-ice.gsfc.nasa.gov/uploads/sug_c5.pdf (accessed on 17 April 2014).
- Mu, Q.; Zhao, M.; Running, S.W. Improvements to a MODIS global terrestrial evapotranspiration algorithm. Remote Sens. Environ 2011, 115, 1781–1800. [Google Scholar]
- Mu, Q.; Zhao, M.; Running, S.W. MODIS Global Terrestrial Evapotranspiration (ET) Product (NASA MOD16A2/A3) Algorithm Theoretical Basis Document Collection 5, Available online: https://secure.ntsg.umt.edu/publications/2013/MZR13/MOD16_ATBD.pdf (accessed on 19 April 2014).
- Tasumi, M.; Kimura, R. Estimation of volumetric soil water content over the Liudaogou river basin of the Loess Plateau using the SWEST method with spatial and temporal variability. Agric. Water Manag 2013, 118, 22–28. [Google Scholar]
- Allen, R.G.; Pereira, L.S.; Raes, D.; Smith, M. Crop Evapotranspiration—Guidelines for Computing Crop Water Requirements—FAO Irrigation and Drainage Paper 56; Food and Agricultural Organization of the United Nations: Rome, Italy, 1998; p. 300. [Google Scholar]
- Schenk, H.J.; Jackson, R.B. The global biogeography of roots. Ecol. Monogr 2002, 72, 311–328. [Google Scholar]
- Ott, R.L.; Longnecker, M. An Introduction to Statistical Methods and Data Analysis; Thomson Learning Inc.: Glendale, CA, USA, 2001; p. 1152.
© 2014 by the authors; licensee MDPI, Basel, Switzerland This article is an open access article distributed under the terms and conditions of the Creative Commons Attribution license (http://creativecommons.org/licenses/by/4.0/).