Article

Peat Mapping Associations of Airborne Radiometric Survey Data

British Geological Survey, Keyworth, Nottingham NG12 5GG, UK
Remote Sens. 2014, 6(1), 521-539; https://doi.org/10.3390/rs6010521
Submission received: 27 September 2013 / Revised: 13 December 2013 / Accepted: 23 December 2013 / Published: 3 January 2014
(This article belongs to the Special Issue Remote Sensing of Peatlands I)

Abstract

:
This study considers recent airborne radiometric (gamma ray) survey data, obtained at high-resolution, across various regions of the UK. The datasets all display a very evident attenuation of signal in association with peat, and intra-peat variations are observed. The geophysical response variations are examined in detail using example data sets across lowland areas (raised bogs, meres, fens and afforested peat) and upland areas of blanket bog, together with associated wetland zones. The radiometric data do not map soils per se. The bedrock (the radiogenic parent) provides a specific amplitude level. Attenuation of this signal level is then controlled by moisture content in conjunction with the density and porosity of the soil cover. Both soil and bedrock variations need to be jointly assessed. The attenuation theory, reviewed here, predicts that the behaviour of wet peat is distinct from most other soil types. Theory also predicts that the attenuation levels observed across wet peatlands cannot be generally used to map variations in peat thickness. Four survey areas at various scales, across England, Scotland, Wales and Ireland are used to demonstrate the ability of the airborne data to map peat zones. A 1:50 k national mapping of deep peat is used to provide control although variability in the definition of peat zones across existing databases is also demonstrated.

1. Introduction

Over the past decade, a number of high-resolution airborne geophysical surveys have been conducted across onshore UK [1,2]. These High Resolution Airborne Resource and Environmental (HiRES) surveys have typically acquired radiometric (gamma-ray spectroscopy), magnetic and electromagnetic (conductivity) measurements at 200 m line spacings and at low altitude (<60 m).
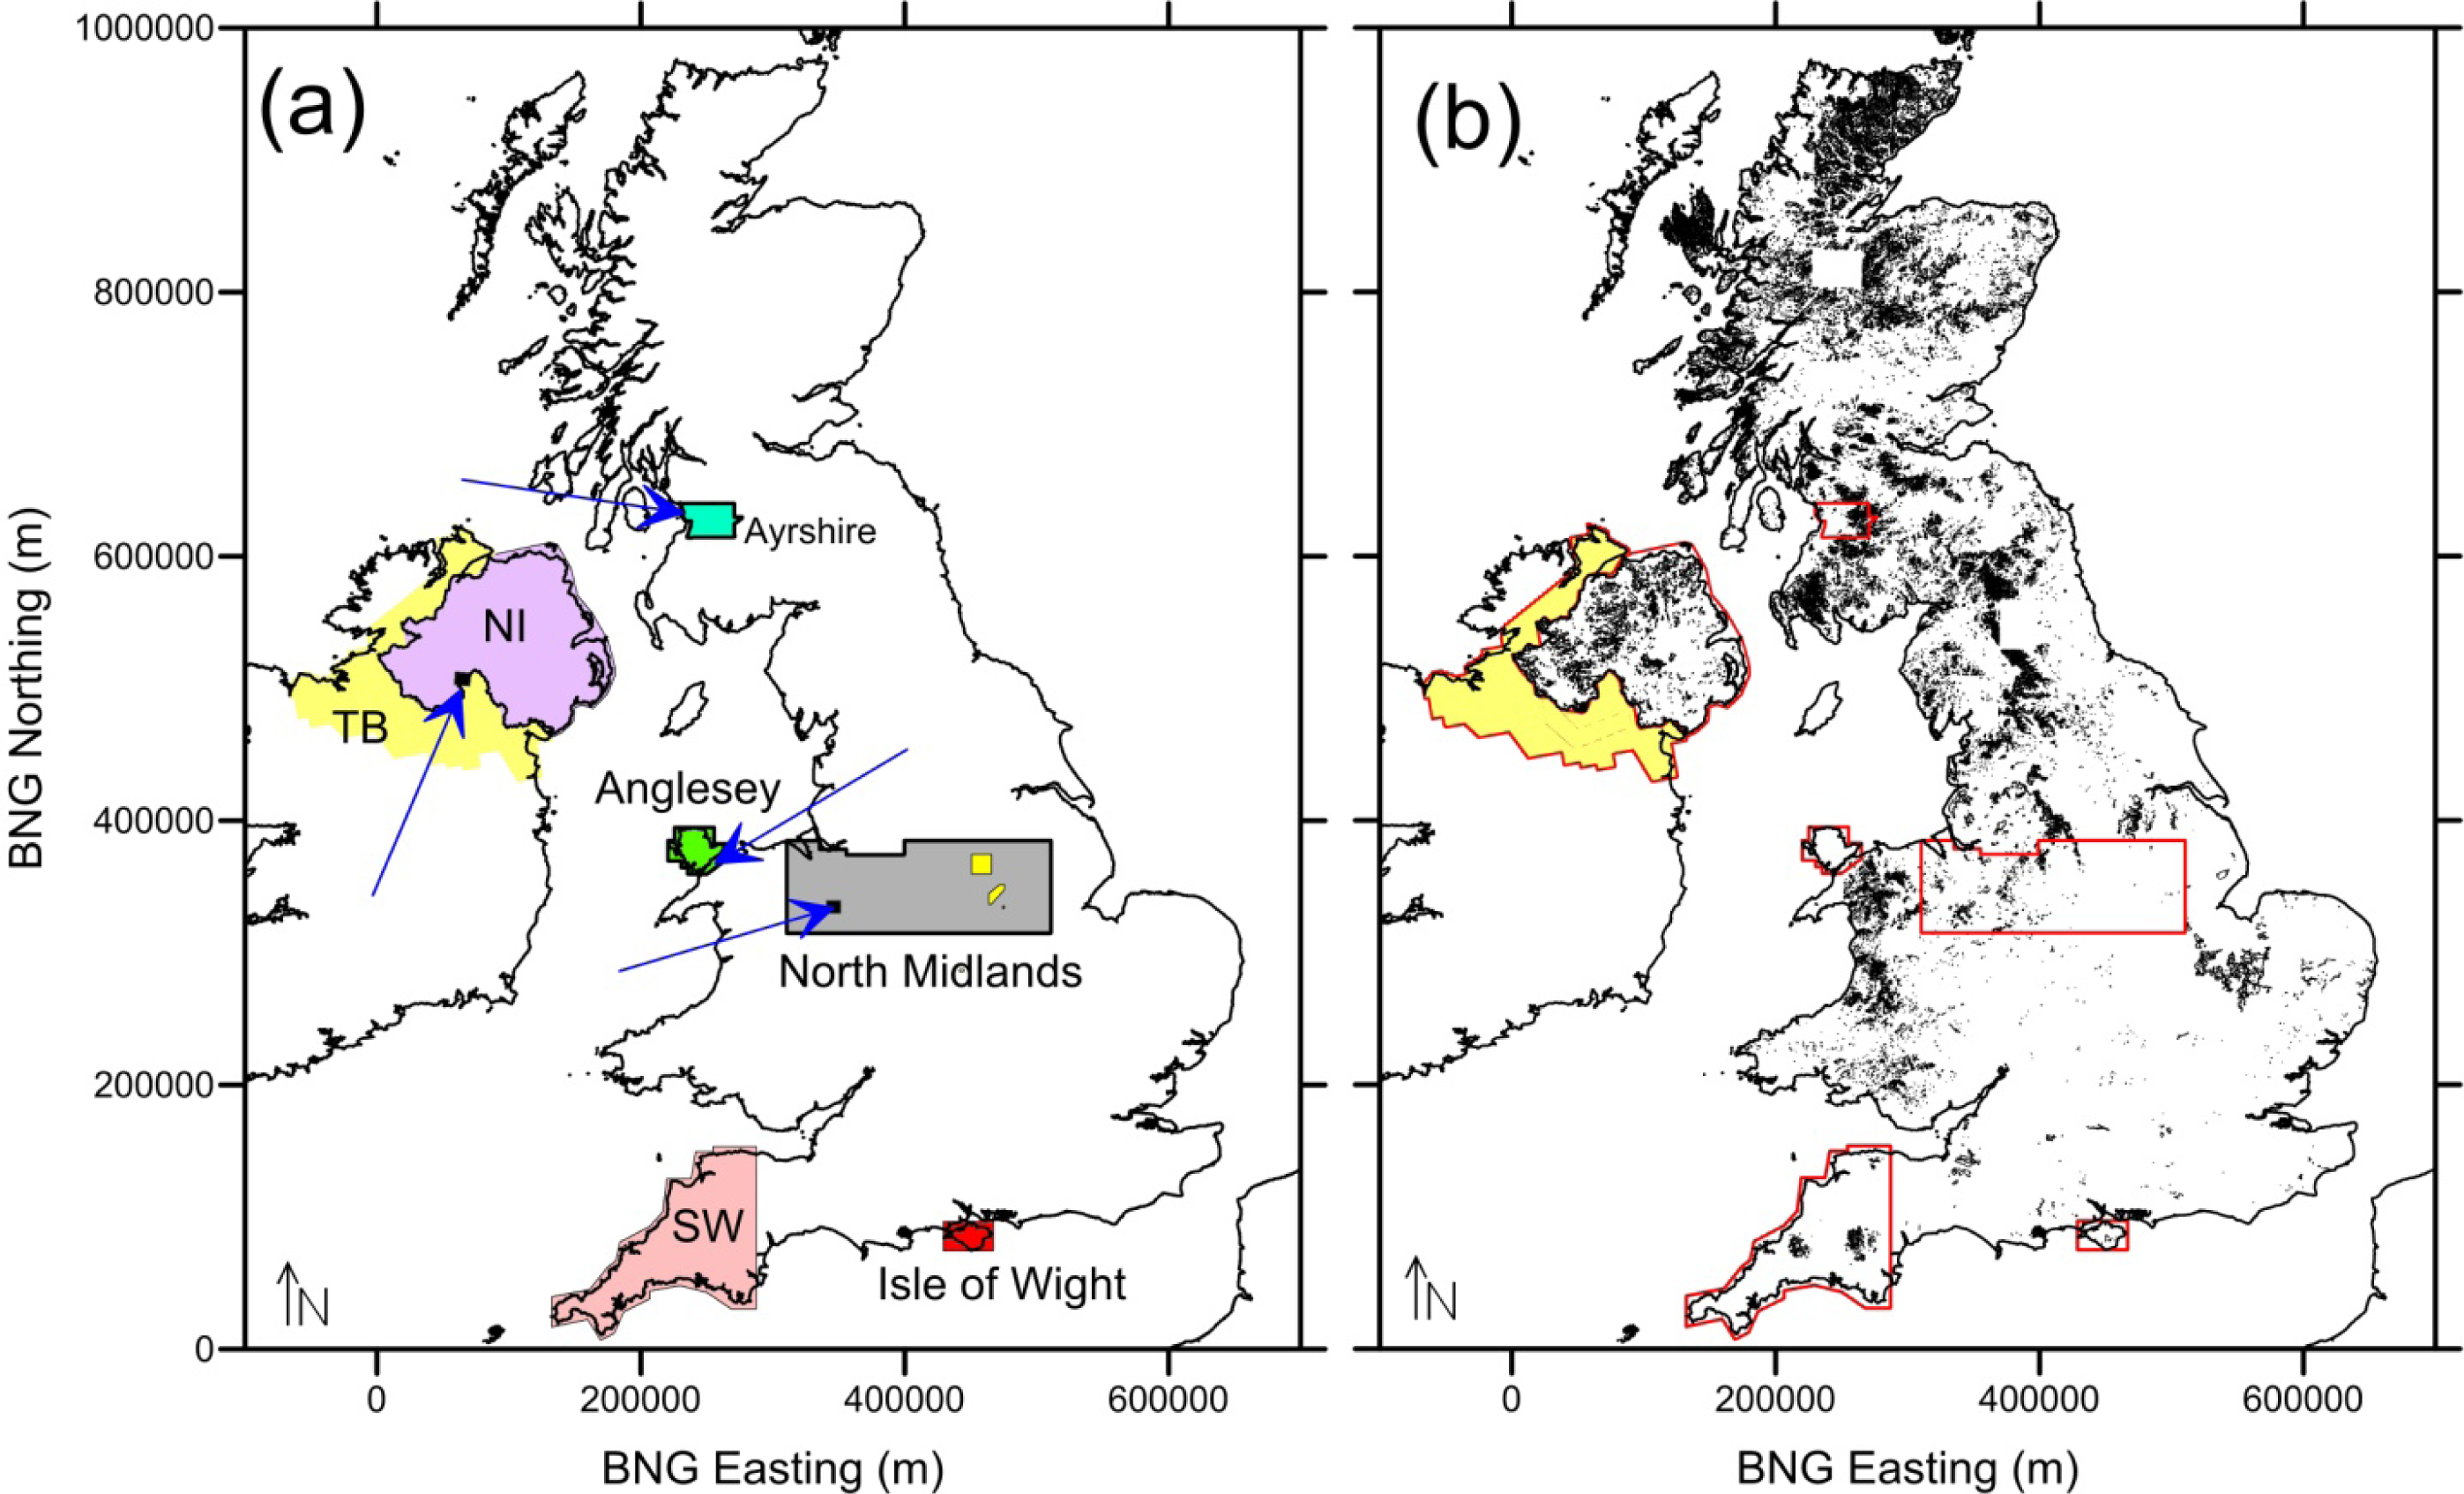
The UK, and recent Irish, surveys flown between 1998 and 2013 are shown in Figure 1a. The original North Midlands survey of 1998 was largely acquired at lower spatial resolution (400 m line spacing) and at a higher elevation (90 m) than later surveys. The South West (SW) England survey is currently acquiring data. The surveys were not targeted at specific science themes (e.g., soil survey), but as a multi-faceted approach to acquiring uniform-quality, modern resource and environmental information.
Airborne radiometric data, in particular, have long been used in soil-related studies [3,4] due to signal interactions within the soil profile (usually < 60 cm). Across the soils of eastern England, the study by Rawlins, Webster and Lark [5] indicated that the UK radiometric data are useful for making thematic maps of soil and confirmed that a large proportion of the thorium and potassium signals can be accounted for by parent material (bedrock). Additionally, the airborne data from Northern Ireland (NI) were used to study methods for improving current estimates of soil organic carbon (SOC) [6]. Within the data sets acquired, it has become evident that the gamma ray attenuation considered here, displays a very evident association with organic soils, and with peat, in particular. Beamish [7] noted that that attenuation across the soil profile is controlled by moisture content in conjunction with the density and porosity of the materials. The theory of attenuation is reprised here with special regard to peat and organic soils.
Peat assessments have become increasingly significant in relation to evaluation of sites for statutory protection, ecology and hydrogeology [8], greenhouse gas emissions [9] and carbon store assessments connected to climate change, land management and erosion [10]. Conventional (non-geophysical) peat mapping within the UK may be considered relatively advanced, particularly with regard to recent assessments of soil carbon stocks [11]. It may also be noted that many recent compilations are now regionally, and therefore spatially, devolved although UK-wide compilations exist [
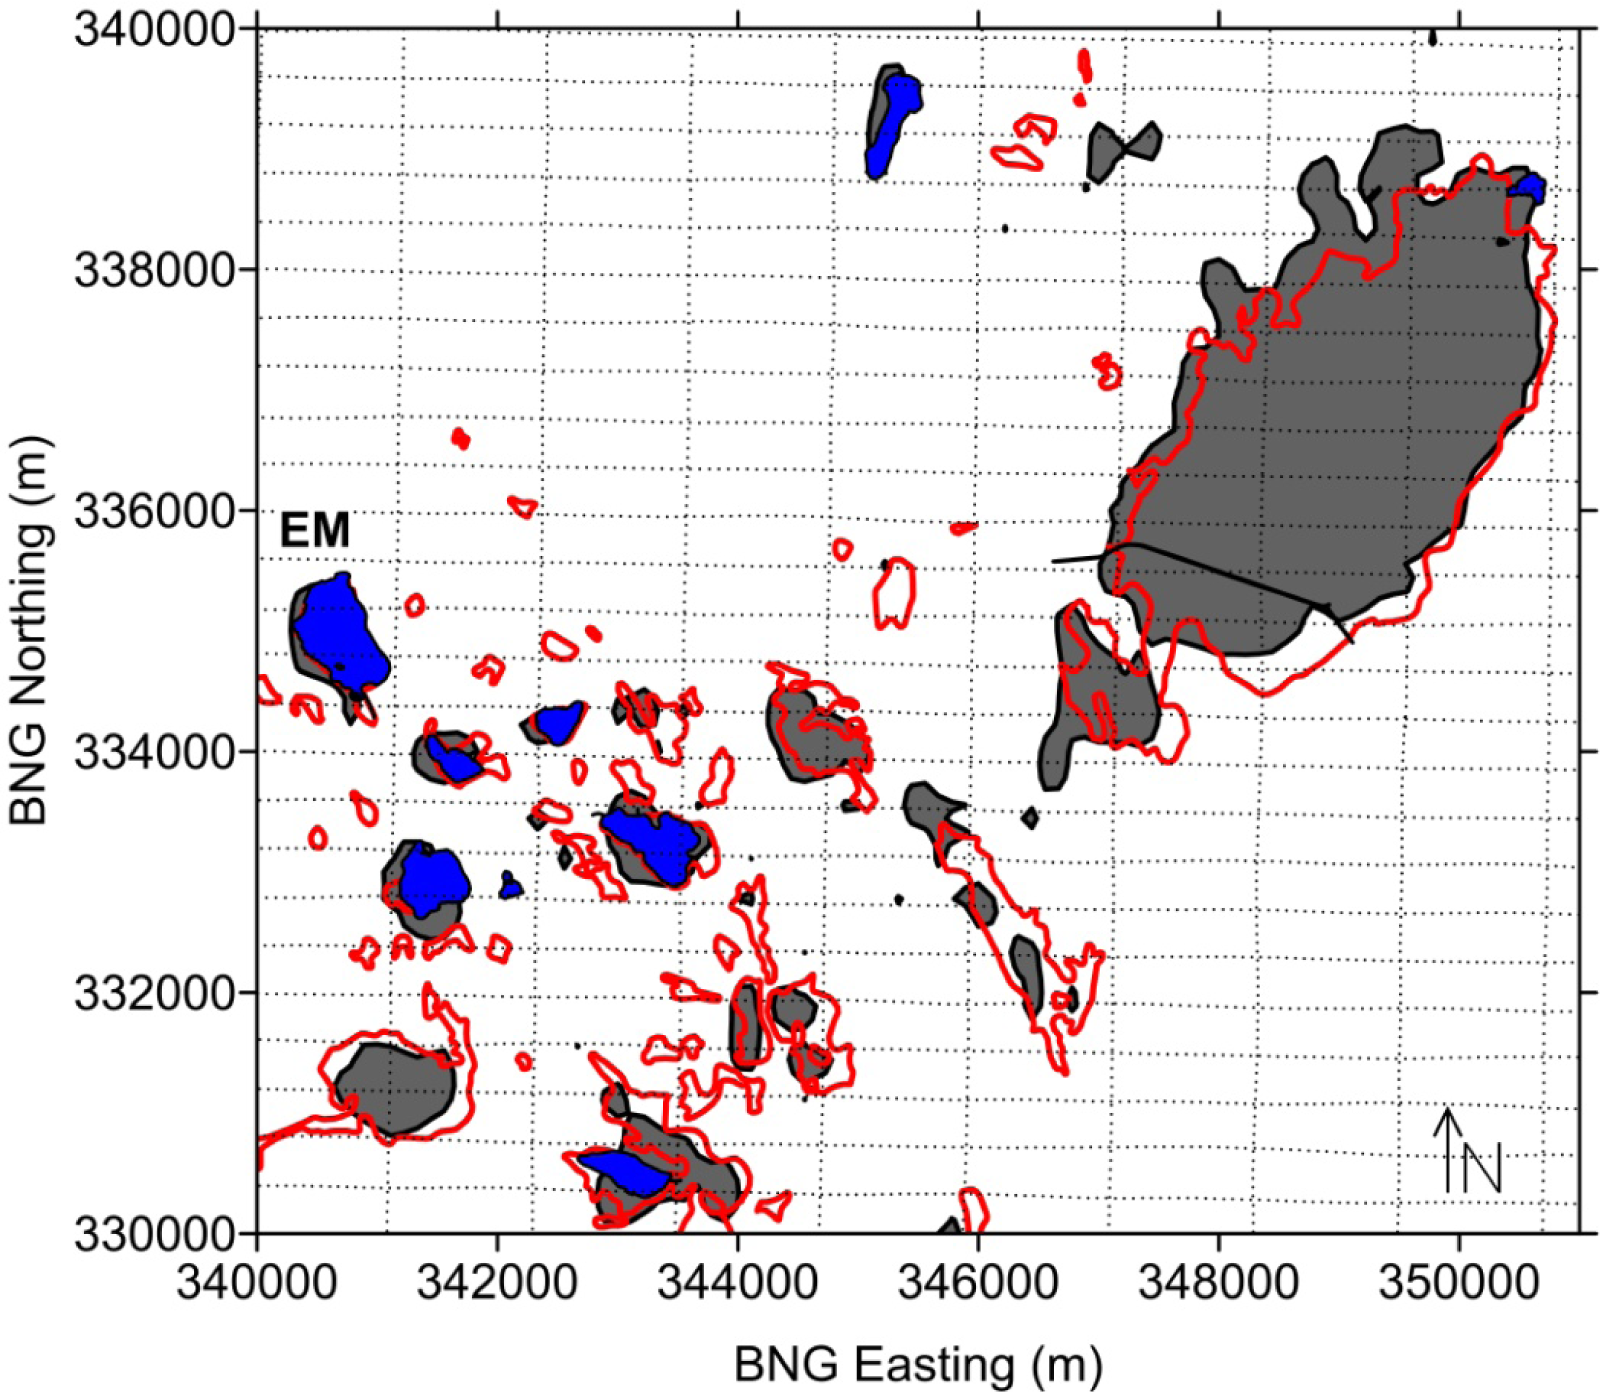
12]. In order to provide a coherent assessment of the peat associations of the airborne data across the whole UK, we use a national scale mapping of deep (> 1 m) peat, generated at a 1:10 k scale and available digitally at a 1:50 k scale. These data are shown alongside the airborne survey areas in Figure 1b.
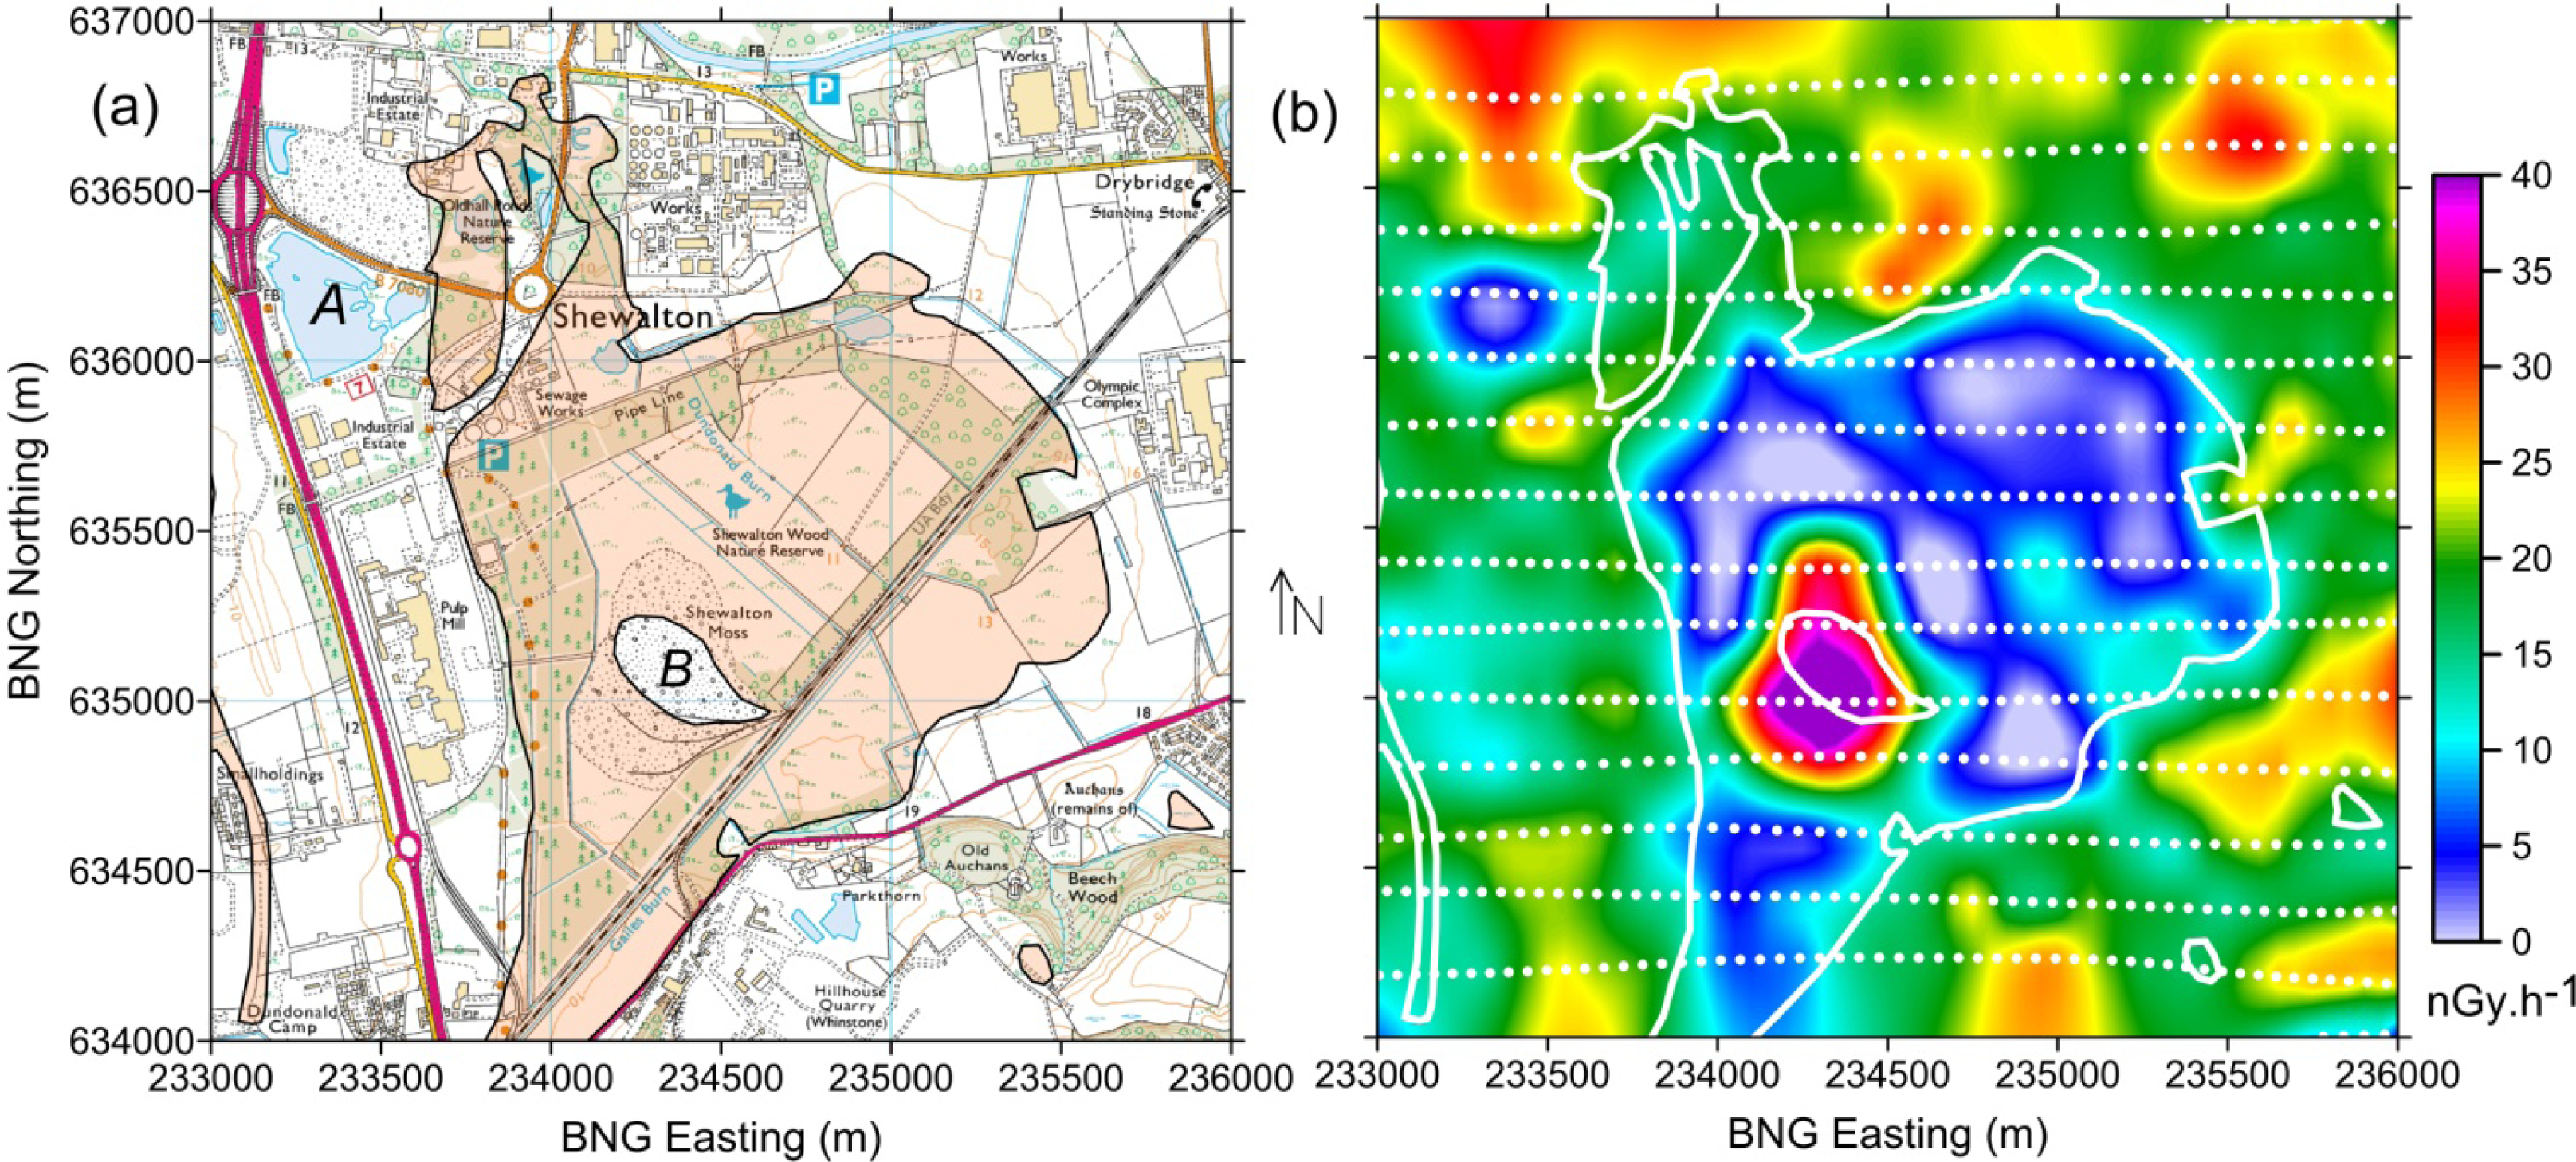
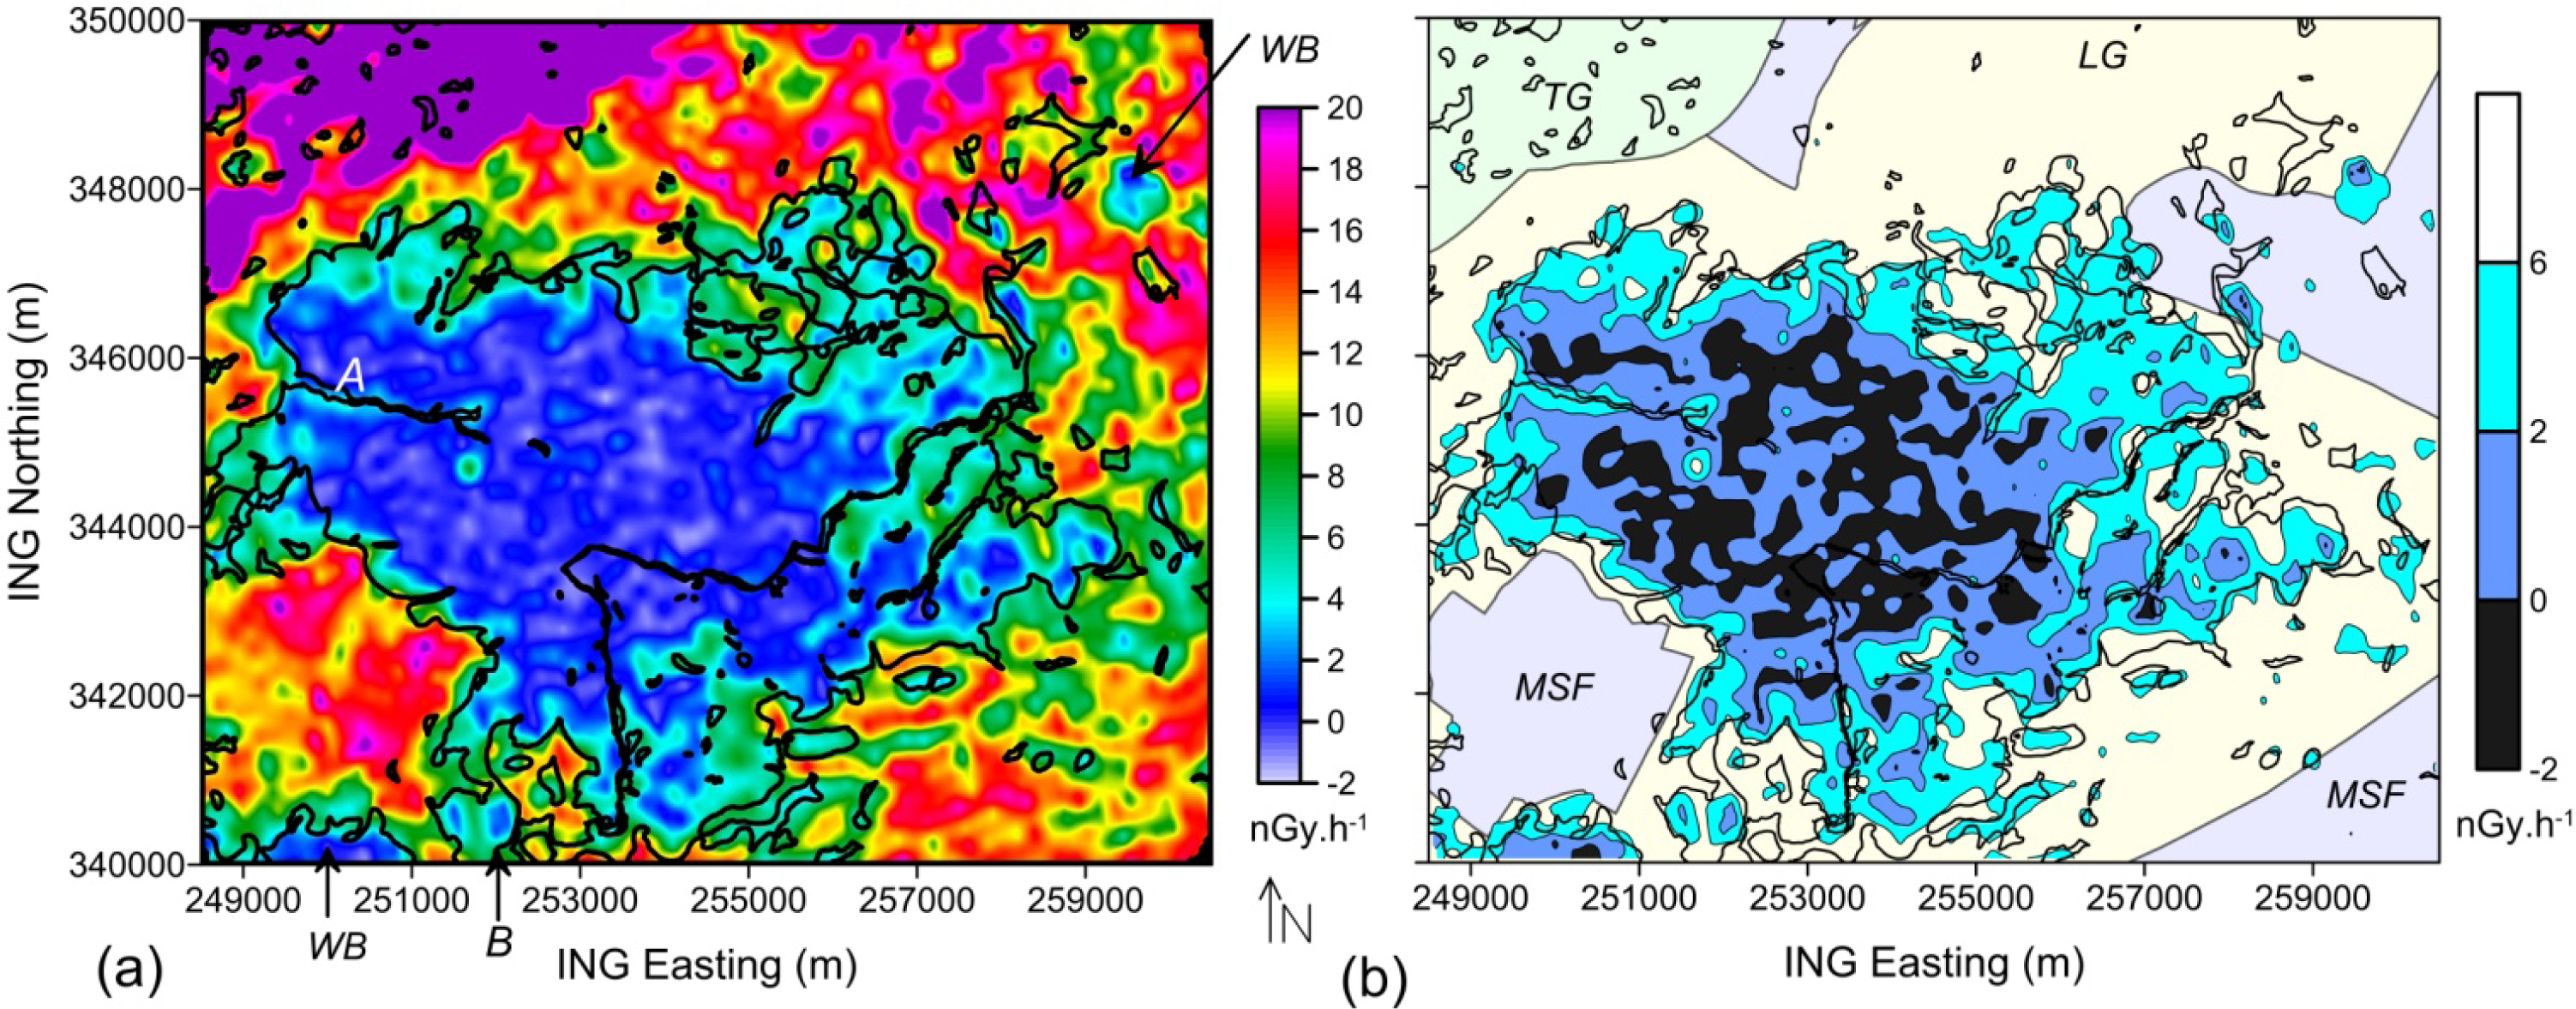
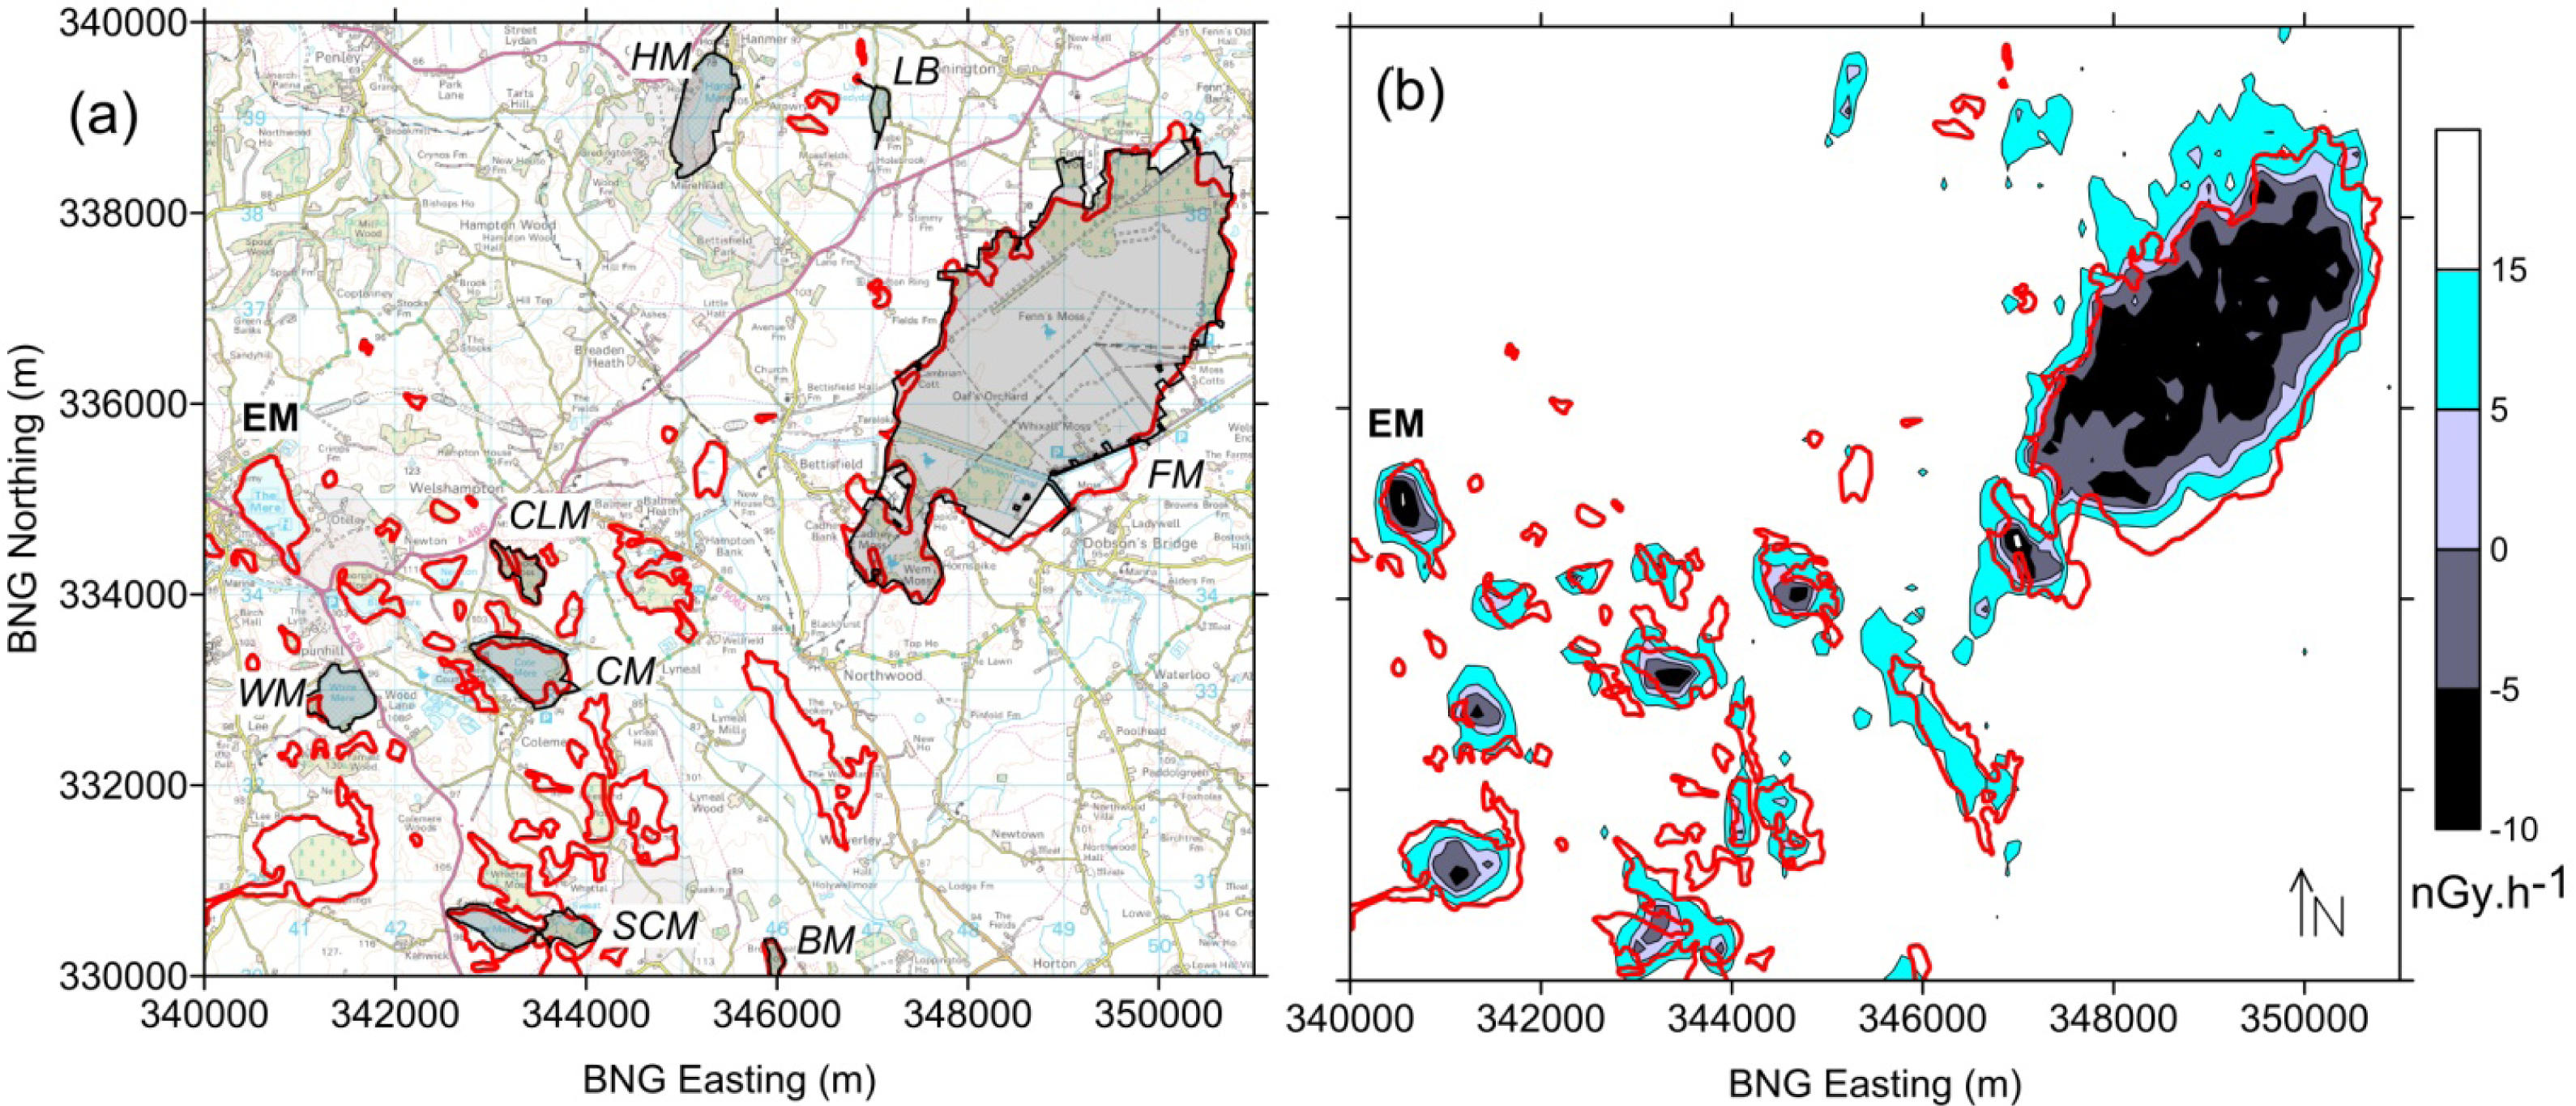
Four survey areas at various scales, across England, Scotland, Wales and Northern Ireland were selected to demonstrate the ability of the airborne data to map peat zones. The geophysical response variations are examined across lowland areas (raised bogs, meres and fens, afforested peat) and upland areas of blanket bog, together with associated wetland zones. The four areas considered are arrowed in Figure 1a.

2. Theory

When considering the amplitude of the radiometric response observed above the surface the simplest conceptual vertical model comprises two layers above bedrock. In the general case, the two upper layers would be defined by soil and superficial (Quaternary) deposits whose radiogenic content is assumed to be derived from the parent bedrock material. Whatever the near-surface material the observed response will be derived from a given radiometric source concentration (assumed vertically uniform in the first instance) that is primarily obtained from a shallow subsurface zone (often < 0.5 m).
A common approach to the modelling of gamma-ray fields considers the exponential absorption that characterizes the passage of electromagnetic radiation through a homogenous material:
I = I 0 exp ( μ x )
where I0 is the initial radiation intensity. The linear attenuation coefficient (μ) of the material is an intrinsic property of each material and would usually be associated with a specific element of given atomic number. The mass attenuation coefficient (μm) of the material is given by:
μ m = μ / ρ
where ρ is density. Løvberg [13] discusses the general principles of gamma-ray attenuation and the effect of the moisture content of materials. It is noted that Compton scattering (incoherent scattering) is the main significant attenuation interaction at the energies discussed here. In such circumstances the linear attenuation coefficient μ is proportional to the total number of electrons per unit volume of the material. Løvberg [13] indicates that all elements with an atomic number less than 30 will have comparable mass attenuation coefficients. In the absence of water, soil, superficial and bedrock materials will have comparable attenuation coefficients at a given source concentration. Attenuation in dry materials is controlled by density alone. Any hydrogen supplied to the material as absorbed or free water (e.g., pore water) then generates an additional attenuation provided by the additional electron content. Methods of making routine airborne soil moisture measurements are described by Carroll [14].
Soils are characterised as a three-phase system comprising solid, water and air. In the case of such mixtures it is necessary to replace the attenuation coefficient (μ) in Equation (1) by a summation over the three phases. In the case of a uniform surface layer (a half-space), each phase becomes a fractional component and the material may be described in terms of its porosity and degree of saturation [7]. Following Beamish [7], 
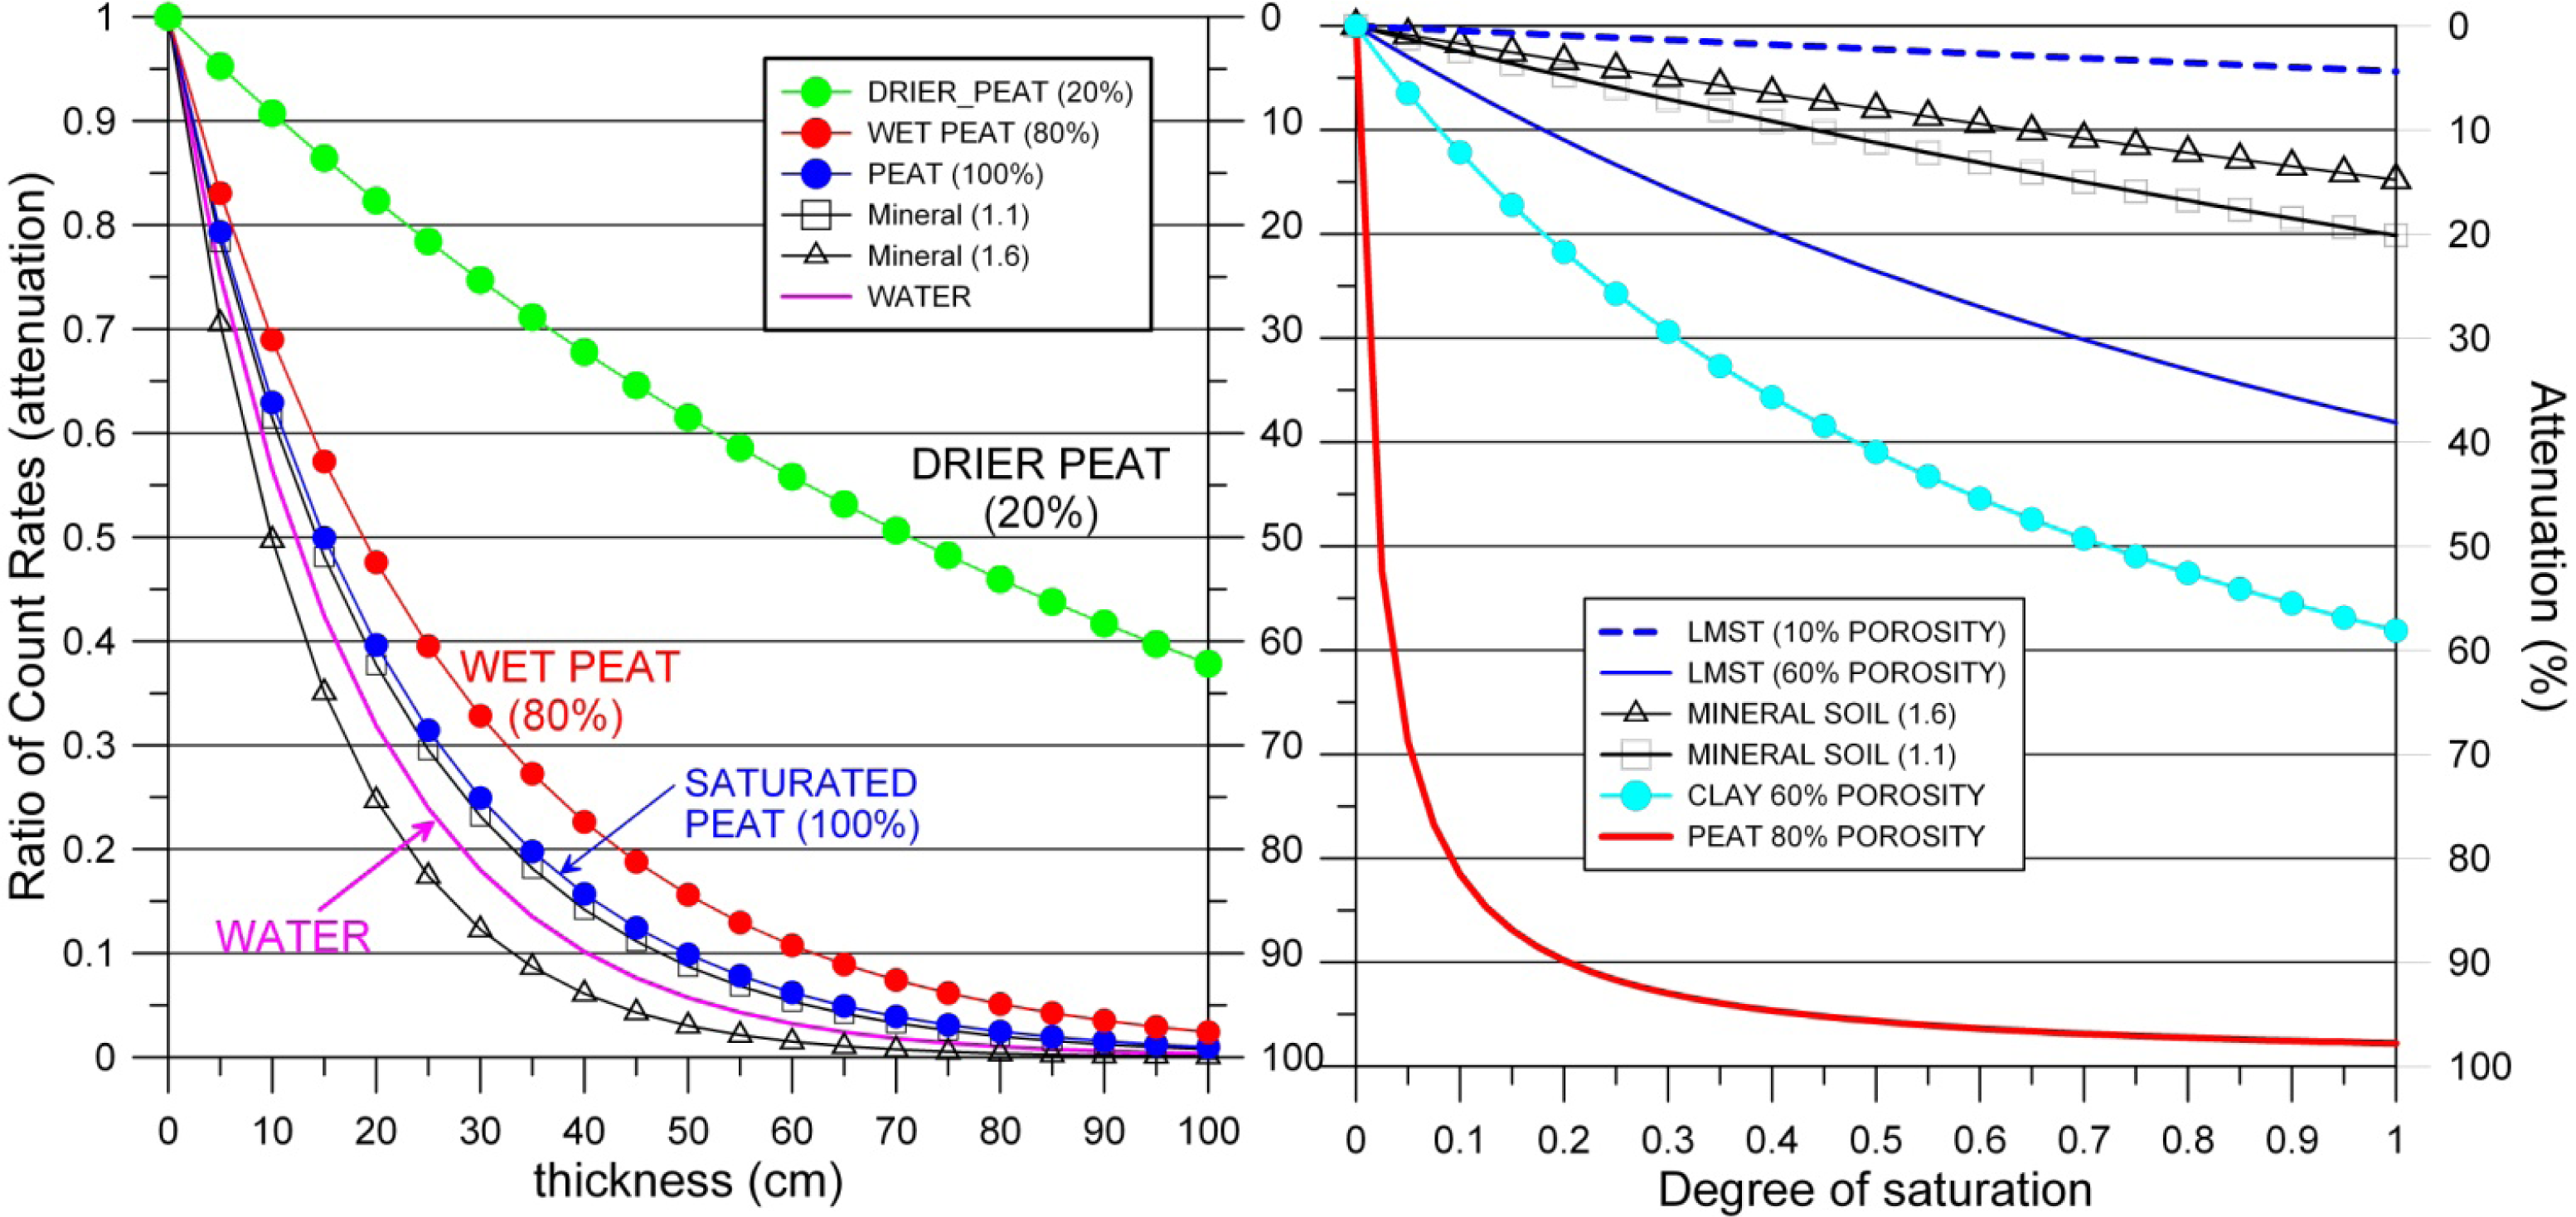
Figure 2a shows the attenuation curves obtained for two mineral soils (dry bulk densities of 1.1 to 1.6 g/cm3). A saturation of 20% and a porosity of 20% are used for both. It is observed that 90% of the signal (a common attenuation reference level) is observed between depths of 33 and 47 cm. The attenuation curve observed for fresh water is located between those of the mineral soils and 90% attenuation is observed at a depth of 40 cm.
A standard reference vertical peat profile is provided by Clymo [15] and this is used here when assigning dry bulk density values. The reference model displays dry density values down to 0.03 g/cm3 in the uppermost layer (the acrotelm) which then increase to 0.12 g/cm3 in the deeper catotelm layer (>12 cm). Here we employ a uniform value of 0.1 g/cm3 for simplicity. A peat porosity value of 80% is taken as typical for the depth range from 0 to 100 cm following the study of Kechavarzi, Dawson and Leeds-Harrison [16]. Figure 2a shows the attenuation observed in “dry” (20% saturation), “wet” (80% saturation) and fully saturated peat. The attenuation curves for wet peats indicate that the 90% threshold value is obtained at depths of between 50 and 60 cm. The “dry peat” attenuation curve is distinct from all other soils. The very low density and low water content provide an attenuation curve that would extend the 90% threshold value to several meters. The “wet peat” curves indicate that the at-surface radiometric response will have limited attenuation sensitivity to depths greater than 60 cm (for a uniformly radiogenic peat). The material properties, down to ∼60 cm, that control the degree of attenuation are dry density, porosity and degree of saturation. It is acknowledged that the peat profile may contain horizons such as the density variation noted in the Clymo model. Variations in other peat properties, such as carbon content, will only influence the radiometric response by virtue of any associated change in density and/or porosity. The major horizon in peat is that defined by the density variation of the Clymo model and the limiting values of this (0.03 and 1.20 g/cm3) produce very similar behavior to peat attenuation curves shown in Figure 2b.
The results discussed imply that the at-surface radiogenic response will have limited sensitivity to “wet peat” at depths in excess of 60 cm since a radiometric peat attenuation of >85% will exist under normal conditions of 10% at-surface soil moisture. Theory therefore suggests that the attenuation characteristics observed across wet peatlands cannot generally be used to map variations in peat depth. In the case of at-surface “wet-thin” peats (e.g., <20 cm in thickness), a localised increase in count rates may be detectable.
Again following Beamish [7], Figure 2b compares attenuation with degree of saturation for a range of near-surface materials. The behaviour of an intact bedrock material with bulk density of 2.7 g/cm3 (e.g., a limestone) with a porosity of 10% is shown; the curve displays the lowest sensitivity to degree of saturation and would represent relatively intact bedrock at outcrop. The increase in attenuation when the bedrock is weathered or fractured is indicated by the 60% porosity limestone curve.
Figure 2b also shows the saturation dependence of two reference mineral soils having bulk densities of 1.1 and 1.6 g/cm3 to a full range of saturation conditions. A porosity of 20% has been used. At full saturation, attenuation is in the range 15 to 20% and a quasi-linear decay behaviour is observed. A further curve for a higher porosity mineral soil (e.g., a clay with 60% porosity) with a bulk density of 1.2 g/cm3 again shows a rapid attenuation and the reduction in count rate approaches 60% at full saturation. The peat behaviour (80% porosity, density 0.1 g/cm3) is also shown. The sensitivity of the attenuation curve for peat is clearly distinct from all the other materials with a reduction in count rate of 80% at a water saturation of only 10%. Given that saturation, or soil moisture levels, of <10% might be regarded as atypical (in the UK), it is evident that peat is distinguishable in relation to the other materials studied.
The type behaviour of soils (and bedrock) summarised in Figure 2 is intended to provide a framework for the assessment of radiometric attenuation in different types of soils. It is anticipated that soil mixtures such as organo-mineral soils will display intermediate behaviour. Figure 2a is used to demonstrate the principal thickness of the material contributing to the soil surface gamma ray flux. Using a 90% contribution rule, the thicknesses range from 20 cm (limestone) to 60 cm (wet peat). In the unusual case of dry peat, the principal thickness may extend to several metres. Wet peat, when less than ∼20 cm thick, may begin to show significantly different (larger) fluxes than thicker zones. The same is true for the other non-organic materials but the behaviour would be confined to smaller thickness (e.g., <40 cm) as indicated in Figure 2a.
Given sufficiently thick materials, the attenuation of gamma rays in response to the degree of saturation would be as shown in Figure 2b. Mineral soils, with low porosity, would potentially display quite limited attenuation characteristics while any higher porosity materials (clays, weathered bedrock) would provide greater attenuation towards higher saturation levels. The clear outliers in behaviour are the high porosity, low density organic soils. The attenuation response is non-linear and appears highly sensitive to the amount of water in the interval from zero to 10% saturation. Beyond this interval (say >20% saturation) the organic soils would display essentially the same flux at all saturations. In comparative terms, the organic soils appear to be distinguishable by their gamma ray attenuation characteristics.

3. Methodology

3.1. Airborne Radiometric Data

The surveys in Figure 1 acquired radiometric data with a 256 channel gamma spectrometer system comprising 32 L of downward-looking NaI(Tl) detectors and 8 L of upward-looking detectors. Full spectrum sampling took place at 1 s intervals which equates to a distance of ∼60 to 70 m along each flight line. Standard procedures for the calibration and processing of the airborne data as described in AGSO publications [17] and IAEA [18] were carried out. Uranium (238U) is measured through the radon daughter 214B in its decay chain, while thorium (232Th) is measured through 208Tl in its decay chain. Potassium (40K) is measured directly at 1,461 keV. The standard energy windows used are shown in Table 1.
While it is noted that the individual radionuclides and their ratios do offer the most appropriate means of classifying materials, the total count data, covering a wider spectral range, offer a higher signal/noise ratio than the individual components. The present study uses absorbed dose rates (DOSE) in air (in units of nGy·h−1) as a measure of total count. This is defined, using the ground contributions:
DOSE ( nGy h 1 ) = 13.078 * % K + 5.675 * eU + 2.494 * eTh
as in [18], and excludes contributions from artificial (man-made) sources. The combined DOSE measurement therefore covers the energy range from 1.37 to 2.81 MeV.
The ground area or footprint, which contributes most radioactivity to each 1 s measurement, was assessed by Pitkin and Duval [19]. For a stationary measurement, at a height of 60 m, 90% of the airborne response will be provided from a circle of radius 160 to 180 m [20]. In practice, for a moving measurement, the footprint will be elliptical and the 90% contribution area would cover 109,000 m2 [21]. Within that ellipse, the greatest contribution will come from directly beneath the aircraft and will fall off exponentially with lateral distance from the flight line.
The radiometric data obtained by the airborne surveys are presented here in the form of grids using standard airborne interpolation procedures. The data are typically sampled every 60–70 m along-line but with lines separated at 200 m intervals. This means that data sampling is spatially highly regular but anisotropic in the line and cross-line directions. Guidelines for the mapping of radiometric data have been published [18] and these indicate the most frequently used algorithms are the bi-directional gridding and minimum curvature techniques. Kriging has not been widely used as it is difficult to account for the anisotropy in the sample density when modelling the semivariogram. Here the grids used are obtained using a minimum curvature algorithm which produces a smooth grid by iteratively solving a set of difference equations minimizing the total second horizontal derivative while attempting to honour the input data. The grid cell size generally used for HiRES data are 50 m. The grid cell size for the northern Midlands study (Figure 1) is 100 m.

3.2. Peat Mapping

Although there are a number of specific soil mapping spatial databases within the areas covered by the HiRES surveys, their application to UK-wide assessments is often made complex by variations in the lexicon descriptors of organic materials and their mixtures. In order to apply a consistent approach to the assessment of peat responses in the geophysical data, we here use the peat mapping provided by the BGS superficial geology data. The data used is the peat classification of superficial materials contained within the BGS DiGMAPGB50 data base [22]. The 1:50 k data have been generalised from ∼1:10 k maps captured by field surveyors from 1883 onwards. According to the BGS scheme, a map unit is defined as peat if (i) it is an organic deposit (i.e., predominantly non-mineral), (ii) its margin can be readily identified at the landscape scale during the survey (typically by vegetation/soil/topographical change) and (iii) where the unit can be augured and shown to be >1 m thick. The peat data are generally considered to reliably represent deep peat although discrepancies at the detailed scale inevitably exist.
Studies of peat resources across Wales [8] compared the DiGMAPGB50 distribution of deep peat with peat descriptors from other peaty soil mapping associations. The authors note that across the area of Wales currently covered by the BGS digital mapping there are 30,100 ha of peat identified by the geological data, which is additional to the area of deep peat identified by other key peaty soil associations. Over 90% of the additional deep peat was located within intermediate peaty soil associations.

4. Results

As noted previously the overall amplitude level of the observed radiometric response is largely determined by the parent bedrock material. This level is then potentially subject to attenuation by the cover material (soils and superficial deposits). When considering low count attenuation behaviour across soils, the potential lateral variations in bedrock radiogenic responses (changes in geology) also need to be addressed [7]. The majority of detailed case studies presented here, do not involve any significant changes in bedrock response. Where such changes exist, they are noted. The study areas are identified by arrows in Figure 1a.

4.1. Ayrshire Survey

The Ayrshire HiRES survey of 2004 was contained in a main rectangle of 41 by 26 km. The survey did not include the whole of Ayrshire. Lines were flown E–W at 200 m intervals. An eastward extension was flown to assess the industrial legacy geophysical responses across the Muirkirk valley. In the west, the coastal zone associated with the town of Ayr was omitted from the survey. The radiometric data obtained are shown as a ternary image in Figure 3a. The image is a normalised (to an equal-area histogram) 3-way colour stretching of the contributions from the individual radioelements with red representing potassium, blue representing uranium and green representing thorium. In areas where all three radioelement concentrations are low, the ternary image shows black; when all three concentrations are high, the ternary response tends to white.
At the large scale, bedrock geological responses are observed in association with the Mauchline Permian sandstone unit and in Lower Carboniferous units (stronger potassium responses in red). A number of localised and extensive zones of high radiometric responses (in white) are associated with opencast coal mines that occur across the area, particularly in the south and east. The recent workings are commonly associated with older (19th century) colliery sites and mineral concentrations occur in various mine spoil zones. At the scale shown, only a small number of water bodies (theoretically a null radiometric response) can be discerned as dark zones and two are identified (WB) along with the seawater null response in the west.
The DiGMAPGB50 peat classification locations are identified by black zones in Figure 3b and can be seen to be largely concentrated on the high ground in the east. Ground above 200 m is identified by light infill. At the broad scale there is clearly a high degree of correspondence between the low count (dark) areas of Figure 3a and the peat locations of Figure 3b. Two circles in both images identify just two of the lowland areas where more detailed associations are also observed. Rectangles in the NW of Figure 3 identify a 3 × 3 km coastal, lowland peat zone that is now used to illustrate some of the more detailed radiometric behaviour from this survey.
The 3 × 3 km area is shown on a topographic map in Figure 4a with the peat zone identified by transparent infill. The area considered is probably best described as peri-urban with roads, a railway line, an active quarry and industrial and domestic dwellings. It may also be appreciated that the DiGMAPGB50 peat mapping predates many modern developments. Due to regulatory requirements the area was flown at heights of between 56 and 137 m so data resolution footprints are variable. The peat zone is described as a relic raised bog and a modern nature reserve (Shewalton) occupies the central northern area. A small water body is labelled A and a landfill (labelled B) occupies the non-peat area in the centre. The Shewalton landfill currently occupies five cells and has increased in size since the 2004 airborne survey.
The radiometric data (DOSE values) are shown in Figure 4b using a continuous linear colour range from 0 to 40 nGy·h−1. The sampling of the 200 m E–W lines is indicated by white dots. The water body (A, Figure 4a) provides a reference level for a zero response due to 100% saturation. The water body is sampled on just two lines and body edge detection is clearly indistinct due to footprint overlap across materials. The peat zone is identified by a white contour. With the exception of the central landfill area, the majority of the mapped area of peat is identified as having DOSE values less than ∼12 nGy·h−1. The mapped peat zone extension to the north generally exceeds this value while the isolated western ribbon of peat is probably too narrow to be detected. Within the main body of peat the radiometric response indicates that there are detectable intra-peat variations. At the simple interpretation level (i.e., no ground control), the low value (<3 nGy·h−1) zones would be interpreted as being fully saturated with higher value zones having reduced moisture content. The landfill is unlikely to contain an enhanced concentration of radiogenic materials. The enhanced response across the landfill might be due to (i) clay capping of disused cells and/or (ii) the lack of attenuating cover (the absence of peat).

4.2. Lowland Raised Bog, Mere, Fens and Ramsar Sites

This case study uses an 11 × 10 km area from the HiRES-1 data set of the northern Midlands situated towards the English-Welsh border (Figure 1a). The area contains 4,766 data points which were obtained at lower resolution than the other HiRES surveys. East-west flight lines are every 400 m and the mean survey altitude across the area was 100 m. Additional N–S tie-lines (orthogonal to the survey lines) are also available at 1,200 m intervals. The area contains a number of lowland raised bogs (a highly threatened habitat) and mires together with eight Ramsar-designated wetland sites. Collectively the sites form a subset within the broader Midlands Meres and Mosses grouping of “natural areas” and are regarded as one of the most important wetland areas in Britain.
The labelled Ramsar wetland sites together with the extent of peat as defined by the DiGMAPGB50 superficial mapping are shown in Figure 5a. The largest Ramsar site is Fens Moss (FM) in the east which also takes in other sites. The sites included are called Fenn’s, Whixall, Bettisfield, Wem & Cadney Mosses and form Britain’s third largest lowland raised bog (2,340 acres, 946 ha). The Fenn’s, Whixall, Bettisfield sites form a National Nature Reserve. Commercial peat cutting ceased in 1991 and restoration work continues.
Six of the eight Ramsar sites are associated with zones of peat while one site (HM, noted in Figure 5a) which also contains a water body is mapped with other superficial deposits (till/diamicton). The largest water body in the area is that associated with Ellsemere Mere (EM) designated as an area of peat in Figure 5a,b.
Figure 5b shows contours of the DOSE rate data restricted to a threshold of <15 nGy·h−1. This value was chosen since it approximately maps the boundaries of the peat areas. The contours are based on a 100 m cell-size sampling of the data. Subdivisions are shown in colour at the 5, zero and −5 nGy·h−1 levels. These data show a slightly lower bias (to negative values) than other HiRES data sets. The largest water body in the area (EM) defines the null water level for this data set as −5 to −10 nGy·h−1.
In Figure 5b it is observed that the largest area of peat (FM) displays a low radiometric response that at values <5 nGy·h−1, displays a strong association with the peat boundary. In the interval from 10 to 15 nGy·h−1, the radiometric response extends to the north of the peat boundary. The other larger areas of peat also display detectable radiometric responses that show a close association with the mapped peat boundaries. The sampling/resolution limits of the airborne data inevitably limit low value detection to the set of larger peat polygons shown in Figure 5. It is also worth noting that a number of the mapped peat areas contain water bodies. Other land-classification databases such as Landcover2007 data set [23], not shown here, identify just a single unit of “Bog” associated with the FM site. Other classifications within the FM site include “Fen-Marsh and Swamp” (code 9) and “Heather” (code 10). Figure 6 shows the DOSE rate zones with a value of ≤12 nGy·h−1 (grey infill). The contour approximately maps the majority of the larger water bodies some of which are associated with both Ramsar and peat mapping polygons (Figure 5). The actual sampling of the airborne data, at the lower resolution of this survey is also shown. The comparison suggests that the use of the DiGMAPGB50 mapping of peat in conjunction with the airborne radiometric data is an optimum choice in the assessment of the geophysical mapping of peat.

4.3. Afforested Peat

A recent report [8] which considered the afforested peat resource in Wales noted that, despite only covering 5.6% of the land area of Wales, deep peat soils are estimated to contain approximately 30% of the country’s total soil carbon stock. The study generated a national peat map of Wales and partially used the DiGMAPGB50 mapping considered here. A small portion of deep peat occurs on the SE margin of the Anglesey survey on the mainland (Figure 1) and the data set across a 2 × 3 km area is considered in Figure 7. An aerial image across the area is draped on a DTM (Digital terrain Model) in Figure 7a. The image also shows the peat locations (white contours) defined using the DiGMAPGB50 database and the airborne survey sampling (dots) obtained using 200 m N–S survey lines. It will be appreciated that smaller zones of peat are necessarily not well sampled. The DOSE data with amplitudes <22 nGy·h−1 are shown as a series of infilled contours on a base topographic map in Figure 7b. The image also shows the peat contours in red. These show a correspondence with the woodland features on the 1:50 k base topographic map.
A water body, (WB, Figure 7b), together with a peat area, is contained within a woodland zone. The DOSE response is limited to higher range values probably due to limited sampling of the water body. Elsewhere, the majority of peat areas are associated with low value response characteristics. Again, the overall form of the low-value response is determined by the precise nature of the sampling. A well-defined low value response is observed, within and confined to, the southern-most forested area. This occurs in the absence of mapped peat. Thus the geophysical observations appear capable of predicting new zones of enhanced moisture levels within afforested peat zones. This general predictive ability of the geophysical data was a conclusion of the wetland study conducted by Beamish and Farr [24].

4.4. Upland Blanket Bog

The high resolution airborne surveys across Northern Ireland (NI, Tellus) and the Republic of Ireland (RoI, Tellus Border) are particularly notable in terms of their coverage of extensive areas of peat. Radiometric attenuation across the two largest blanket bogs in NI (i.e., the Garron Plateau and Cuilcagh Mountain) was studied by Beamish [7] using a Total Count (TC) measure of the radiometric response. Beamish [7] identifies a linear relationship between TC and air absorbed dose rate (DOSE) for the NI Tellus data set. Here a new analysis across the extensive cross-border Slieve Beagh blanket bog is conducted using the merged DOSE data set from both surveys. Further peat investigations using the airborne data, together with ground investigations, have also recently been reported [29].
The area studied (see Figure 1) contains the third largest intact expanse of upland peat in NI and the last remaining relatively intact blanket bog in County Monaghan (RoI). The area also contains the Slieve Beagh Ramsar site. The selected 12 × 10 km area is shown in Figure 8a using a background aerial image draped on a DTM. The Ramsar site is identified by the red contour and is largely associated with peat soil. The surveys provide 10,139 data points across the area using 200 m line separations at an azimuth of 345° geographic. The mean survey altitude across the area was 57 m.
The DiGMAPGB50 mapping of peat extends only to the border and this is shown by the white contours in Figure 8a. The central upland area of blanket bog is well defined with a number of downslope spurs and more isolated peat zones beyond the central upland zone. In order to complete the identification of peat across the area and into the RoI, a number of other sources of peat mapping information were examined. Figure 8b summaries the additional information in relation to the previous DiGMAPGB50 data (shown again as white contours). The red contours show information from soil mapping databases. In the case of Northern Ireland, the soil mapping database of the Department of Agricultural and Rural Development (DARD) was used. This was generated between 1987 and 1997 for the purposes of agricultural research [25]. The 1:250 k DARD database provides the red contour mapping of peat within NI shown in Figure 8b. In the case of the RoI, the soils data were obtained from the National Soil Survey (NSS) which was based in An Foras Talúntais (forerunner organisation to TEAGASC, the Agriculture and Food Development Authority). These data are derived from mapping individual counties at 1:127,560 scale for 44% of the country and the General Soil Map of Ireland and National Peatland map, both at 1:575 k scale [26]. The mapping of peat obtained by these data is shown in Figure 8b by red contours (within the RoI).
To further define variability in various peat mapping datasets, the extent of peat obtained using a CORINE [27] database available for both NI and the RoI was examined. The peat boundary, obtained from the CORINE (Coordination of Information on the Environment) has a resolution of ∼250 m. Here the land-use code 412 (peat bogs) boundary is identified in yellow in Figure 8b. There are known resolution and interpretation issues when comparing CORINE classifications with other databases on soils [28]. Broadly the information assembled indicates that a simple correlation of the geophysical responses with peat zone edges is not a precise procedure due to the variability in the existing definition of those edges.
Figure 9a shows the radiometric DOSE response across the area as a continuous colour image (50 m cell size). Overlaid contours in black denote (i) the DiGMAPGB50 peat boundaries (NI) and (ii) the TEAGASC peat soil boundaries (RoI). The peat boundary formed by the border is an artefact of cojoining the two datasets. It is evident that the upland area of peat forms a relatively continuous low response (DOSE < 2 nGy·h−1) with a halo of higher amplitude responses. Two of the larger water-bodies in the area (WB, Figure 9a) provide a low amplitude (100% saturation) reference for the study. The low response data show some quite detailed characteristics in association with the DiGMAPGB50 mapping. A valley zone (A) with an absence of mapped peat shows a distinct locally elevated response. Spurs of mapped peat (B) are tracked with low values into the lowland area.
In order to appreciate the significance of the areas of high attenuation, the potential variability of the bedrock (parent material) response across the area should also be assessed. Geologically the whole area comprises Carboniferous (Visean) mudstone and sandstone strata. Within this classification some variations exist and these are identified, at large scale, in Figure 9b. The entire central area is underlain by the Leitrim Group (LG, Figure 9b) and so response variations due to bedrock are not anticipated across the central area of peat. Four areas of marine shelf-facies (MSF) rocks are also identified. A more detailed assessment of the attenuation characteristics (DOSE < 8 nGy·h−1) is also provided by the infilled contour levels in Figure 9b. These indicate a quite intricate variation both within the Ramsar site (the spatial core of low values) and across the general area of peat. Off the peat, in the NW and SW, there are clear enhanced contributions that appear to be controlled by the areas of Tyrone Group (TG) and marine shelf facies (MSF) bedrock.
The correlation of the geophysical responses with peat zones should also take into account the perimeter soils. Soils grouped by major soil types are available within the NI DARD database but not (currently) within the RoI TEAGASC data. Figure 10a shows the major soil classifications within the NI DARD database. The major soils comprise Brown Earth (BE), Mineral Gley (G), Groundwater Humic Gley (HG) and Humic Ranker (HR). The peat zone is shown in white and a heavy black contour. The DOSE response, once again limited to values < 6 nGy·h−1, is coloured grey and is shown with transparency. Although the particular peat boundary used is not definitive; it provides a necessary broad reference for the geophysical response. Zones (A) identify a number of areas where the DOSE threshold of 6 nGy·h−1 does not extend to the reference peat boundary. The DOSE threshold of 6 nGy·h−1 also extends into the perimeter HG and HR soils at a number of locations.
The most precise information in the DOSE data is provided by continuous colour scale images of the response. Figure 10b shows the data across the NI sector of the area again restricted to a threshold of 6 nGy·h−1. The response data are compared with the peat mapping provided by the DiGMAPGB50 database which is shown in grey and is transparent so boundaries can be compared. There is clearly a broad level of agreement with the peat boundaries identified in both datasets. The more significant observation however is the degree of intra-peat variations that are observed in the response data across the blanket bog. If we accept that the DiGMAPGB50 database identifies thick peat, then the intra-peat response variations should reflect variations in moisture content.

5. Conclusions

This study has considered gamma ray attenuation characteristics using simple theory and modern airborne radiometric data across a range of peat environments across the UK and into Ireland. The attenuation theory, reviewed here, predicts that the behaviour of wet peat is distinct from most other soil types. The case studies undertaken have largely confirmed this. The behaviour of peat is made distinct due primarily to the high water content and low density of these soils. Theory also predicts that the attenuation levels observed across wet peatlands cannot, in general, be used to map variations in peat thickness. Research in this regard [29] continues to be further developed.
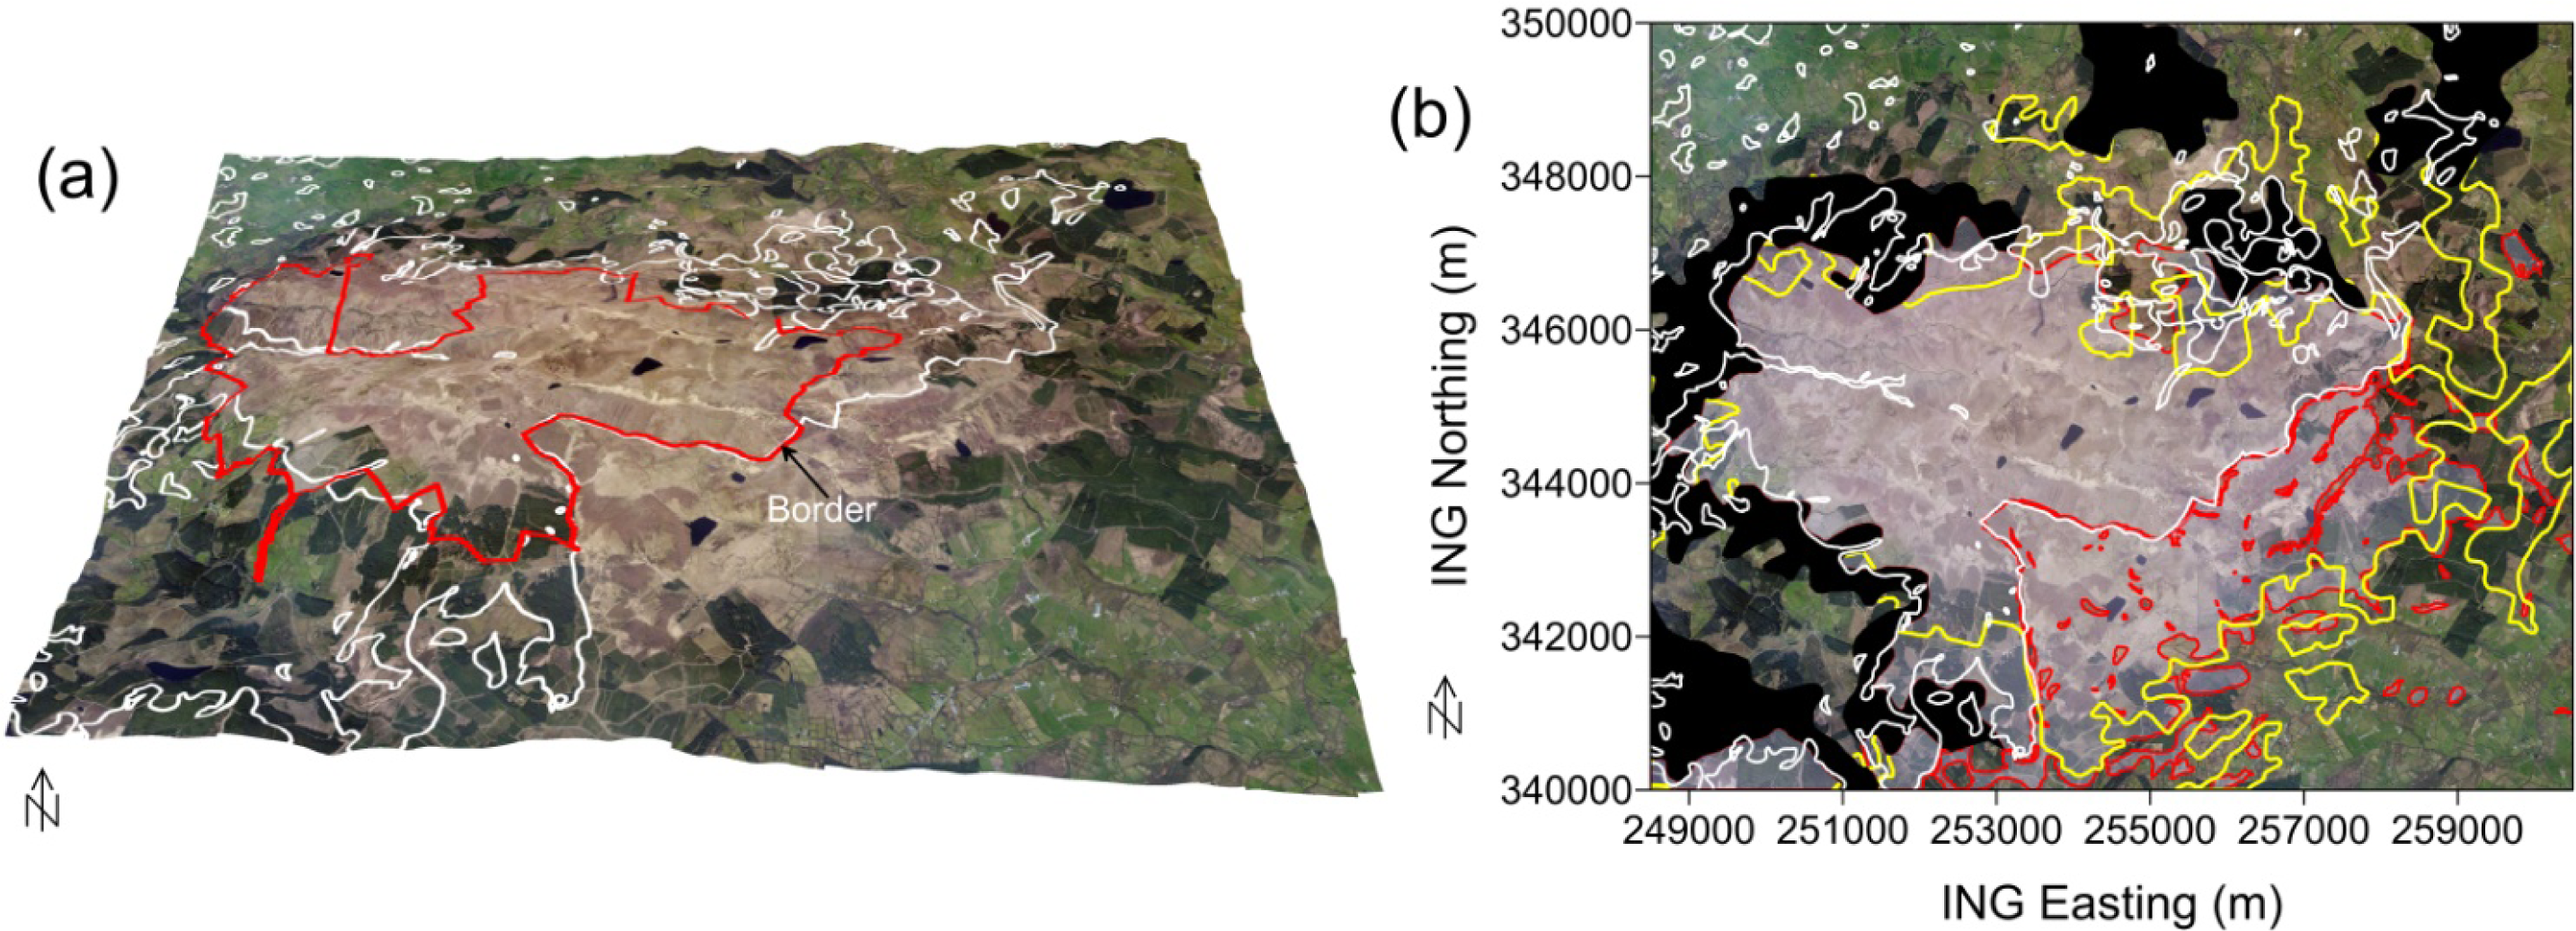
In order to demonstrate the peat mapping capability of the airborne data, a national-scale 1:50 k mapping of thick (>1 m) peat was employed. The studies broadly indicate that this mapping may be optimum in relation to the assessment of the airborne data. The variability in available control (peat-edge mapping) from alternative soil and land-use databases has also been demonstrated. A simple correlation of the geophysical information with peat zone edges is therefore not a precise procedure.
A modern UK standard for HiRES airborne acquisition uses 200 m line spacing. These data have a limited resolution in relation to small bodies of peat. Inherent sensor footprint resolution also limits lateral resolution at body edges. If finer detail is required, then 50 m line spacing can be adopted to achieve higher resolution; this resolution could potentially identify smaller peat bodies that lie outside of designated sites or that have been overlooked during geological mapping due to their small size. This type of systematic approach could help improve knowledge on the total coverage of peat across the UK.
At larger scales, both the soil and the bedrock variations (responsible for the radiometric amplitude level) require to be jointly assessed. The continuity of the airborne data particularly across wetland areas, taking in both lowland and upland contexts, is particularly useful. Given the clear association between radiometric attenuation responses and peat and wetland site boundaries, the data have the potential to identify additional areas where similar degrees of saturation exist. The methodology could therefore be used to identify new areas of peat, or rather areas of peat (e.g., small isolated bodies) that have not previously been mapped. It is also worth noting that many modern airborne geophysical data sets now exist, often over areas far larger than the UK, and across which peat and wetland mapping are probably less advanced than in UK.
It has been noted that the radiometric data do not map soils per se. Theory predicts that the attenuation characteristics observed are primarily associated with water content. Although the data contain information on the water content of all soils, the effect is most pronounced and therefore most detectable in peat soils. The intra-peat variations observed in this study are interpreted as variations in moisture content, with the lowest amplitude zones corresponding to 100% saturation. Density variations in the upper peat profile may also contribute and cannot be ruled-out. The conversion of the geophysical responses to degree of saturation would only be possible with ground calibrations performed at a scale appropriate to the airborne measurements.

Acknowledgments

My thanks go to the reviewers and editors for the assistance they provided. The Northern Ireland data used in the study come from the Tellus Project which was funded by DETI and by the Building Sustainable Prosperity scheme of the Rural Development Programme (Department of Agriculture and Rural Development of Northern Ireland). The Republic of Ireland data is from the Tellus Border project which is funded by the INTERREG IV development programme of the European Regional Development Fund, and is managed by the Special EU Programmes Body (SEUPB). Topographic base maps are reproduced from the OS by British Geological Survey with the permission of Ordnance Survey on behalf of the Controller of Her Majesty’s Stationery Office, Crown copyright. All rights reserved. A newscast of the Isle of Wight airborne geophysical survey is available on the BGS YouTube channel at http://www.youtube.com/watch?v=D4ECcUPNi_E, last accessed 17 December 2013. This paper is published with the permission of the Executive Director, British Geological Survey (NERC).

Conflict of Interest

The author declares no conflict of interest.

References

  1. Peart, R.J.; Cuss, R.J.; Beamish, D.; Jones, D.G. Locating and mapping potential environmental hazards in the UK with high resolution airborne geophysics. Geoscientist 2003, 13, 4–7. [Google Scholar]
  2. Beamish, D.; Young, M. Geophysics of Northern Ireland: The Tellus effect. First Break 2009, 27, 43–49. [Google Scholar]
  3. Schwarzer, T.F.; Adama, J.A.S. Rock and soil discrimination by low altitude airborne gamma-ray spectrometry in Payne County, Oklahoma. Econ. Geol 1973, 68, 1297–1312. [Google Scholar]
  4. Cook, S.E.; Corner, R.J.; Groves, P.R.; Grealish, G.J. Use of airborne gamma-radiometric data for soil mapping. Aust. J. Soil Res 1996, 34, 183–194. [Google Scholar]
  5. Rawlins, B.G.; Webster, R.; Lark, R.M. Understanding airborne radiometric survey signals across part of eastern England. Earth Surf. Proc. Landf 2007, 32, 1503–1515. [Google Scholar]
  6. Rawlins, B.G.; Marchant, B.P.; Smyth, D.; Scheib, C.; Lark, R.M.; Jordan, C. Airborne radiometric survey data and a DTM as covariates for regional scale mapping of soil organic carbon across Northern Ireland. Eur. J. Soil Sci 2009, 60, 44–54. [Google Scholar] [Green Version]
  7. Beamish, D. Gamma ray attenuation in the soils of Northern Ireland, with special reference to peat. J. Environ. Radioact 2013, 115, 13–27. [Google Scholar] [Green Version]
  8. Vanguelova, E.; Broadmeadow, S.; Anderson, R.; Yamulki, S.; Randle, T.; Nisbet, T.; Morison, J. A Strategic Assessment of Afforested Peat Resources in Wales and the Biodiversity, GHG Flux and Hydrological Implications of Various Management Approaches for Targeting Peatland Restoration; Report by Forest Research staff for Forestry Commission Wales Project, with Project Reference No 480.CY.00075 (T); Forest Research Agency: Farnham, Surrey, UK, 2012. [Google Scholar]
  9. Kip, N.; van Winden, J.F.; Pan, Y.; Bodrossy, L.; Reichart, G.J.; Smolders, A.J.P.; Jetten, M.S.M.; Damsté, J.S.S.; Op den Camp, H.J.M. Global prevalence of methane oxidation by symbiotic bacteria in peat moss ecosystems. Nat. Geosci 2010, 3, 617–621. [Google Scholar]
  10. Lilly, A.; Grieve, I.C.; Jordan, C.; Baggaley, N.J.; Birnie, R.V.; Futter, M.N.; Higgins, A.; Hough, R.; Jones, M.; Nolan, A.J.; et al. Climate Change, Land Management and Erosion in the Organic and Organo—Mineral Soils in Scotland and Northern Ireland; Scottish Natural Heritage Commissioned Report No. 325 (ROAME No. F06AC104-SNIFFER UKCC21); Scottish Natural Heritage: Edinburgh, UK, 2009. [Google Scholar]
  11. Bradley, R.I.; Milne, R.; Bell, J.; Lilly, A.; Jordan, C.; Higgins, A. A soil carbon and land use database for the United Kingdom. Soil Use Manag 2005, 21, 363–369. [Google Scholar]
  12. Joint Nature Conservation Committee. Towards an Assessment of the State of UK Peatlands; JNCC Report No. 445; JNCC: Peterborough, UK, 2011. [Google Scholar]
  13. Løvborg, L. The Calibration of Portable and Airborne Gamma-Ray Spectrometers—Theory, Problems and Facilities; Risø Report M-2456; Risø National Laboratory: Roskilde, Denmark, 1984; p. 207. [Google Scholar]
  14. Carroll, T.R. Airborne soil moisture measurement using natural terrestrial gamma radiation. Soil Sci 1981, 132, 358–366. [Google Scholar]
  15. Clymo, R. S. Models of peat growth. Suo 1992, 43, 127–136. [Google Scholar]
  16. Kechavarzi, C.; Dawson, Q.; Leeds-Harrison, P.B. Physical properties of low-lying agricultural peat soils in England. Geoderma 2010, 154, 196–202. [Google Scholar]
  17. Minty, B.R.S.; Luyendyk, A.P.J.; Brodie, R.C. Calibration and data processing for airborne gamma-ray spectrometry. AGSO J. Aust. Geol. Geophys 1997, 17, 51–62. [Google Scholar]
  18. International Atomic Energy Agency. Guidelines for Radioelement Mapping Using Gamma Ray Spectrometry; IAEA: Vienna, Austia, 2003. [Google Scholar]
  19. Pitkin, J.A.; Duval, J.S. Design parameters for aerial gamma ray surveys. Geophysics 1980, 45, 1427–1439. [Google Scholar]
  20. Kock, P.; Samuelsson, C. Comparison of airborne and terrestrial gamma spectrometry measurements—Evaluation of three areas in southern Sweden. J. Environ. Radioact 2011, 102, 605–613. [Google Scholar]
  21. Billings, S.; Hovgaard, J. Modelling detector response in airborne gamma-ray spectrometry. Geophysics 1999, 64, 1378–1392. [Google Scholar]
  22. McMillan, A.A.; Powell, J.H. BGS Rock Classification Scheme Volume 4. Classification of Artificial (Man-Made) Ground and Natural Superficial Deposits––Applications to Geological Maps and Datasets in the UK; British Geological Survey Research Report RR 99–04; British Geological Survey: Nottingham, UK, 1999. [Google Scholar]
  23. Morton, D.; Rowland, C.; Wood, C.; Meek, L.; Marston, C.; Smith, G.; Wadsworth, R.; Simpson, I. C. Final Report for LCM2007—The New UK Land Cover Map; CS Technical Report No 11/07; Centre for Ecology & Hydrology: Oxfordshine, UK, 2011. [Google Scholar]
  24. Beamish, D.; Farr, G. Airborne geophysics: A novel approach to assist hydrogeological investigations at groundwater dependent wetlands. Quart. J. Eng. Geol. Hydrogeol 2013, 46, 53–62. [Google Scholar]
  25. Jordan, C.; Higgins, A.; Hamill, K.; Cruickshank, J.G. The Soil Geochemical Atlas of Northern Ireland; Department of Agriculture and Rural Development: Belfast, UK, 2000. [Google Scholar]
  26. Hammond, R.F. The Peatlands of Ireland; Soil Survey Bulletin, No. 35; An Foras Taluntais: Dublin, Ireland, 1978. [Google Scholar]
  27. Büttner, G.; Feranec, J.; Jaffrain, G.; Mari, L.; Maucha, G.; Soukup, T. The CORINE land cover 2000 project. EARSeL eProc 2004, 3, 331–346. [Google Scholar]
  28. Cruickshank, M.M.; Tomlinson, R.W. Application of CORINE land cover methodology to the UK—Some issues raised from northern Ireland. Global Ecol. Biogeogr. Lett 1996, 5, 235–248. [Google Scholar]
  29. Keaney, A.; McKinley, J.; Graham, C.; Robinson, M.; Ruffell, A. Spatial statistics to estimate peat thickness using airborne radiometric data. Spat. Stat 2013, 5, 3–24. [Google Scholar]
Figure 1. (a) HiRES airborne geophysical surveys in the UK (2008–2013), coloured areas. The recent survey in the Republic of Ireland is labeled (TB, Tellus Border). Arrows denote the four areas studied here. (b) The airborne survey areas (red polygons) overlaid on the DiGMAPGB50 UK mapping of peat (onshore black contours). BNG refers to British National Grid.
Remotesensing 06 00521f1
Figure 2. Theoretical attenuation behaviour of soil/bedrock types. The parameters defining the soil types are discussed in the text. (a) Variation with thickness assuming a uniform half-space. A 90% attenuation level provides a reference level. (b) Variation with degree of saturation (soil moisture or moisture content). Other soil parameters are noted in the text.
Remotesensing 06 00521f2
Figure 3. (a) Radiometric data from the Ayrshire survey shown as a ternary colour image (a 3-way colour stretch of the Potassium, Thorium and Uranium components) of the data. WB denotes a water body. Circles denote two lowland areas of peat. (b) Areas of peat defined by DiGMAPGB50 mapping of peat (zones in black). Infilled area (in the south and east) defines elevations greater than 200 m. Red rectangle is a 3 × 3 km area of peat that is used for a more detailed study.
Remotesensing 06 00521f3
Figure 4. The 3 × 3 km detailed study area from the Ayrshire survey. (a) 1:50 k base topographic map with peat areas shown with transparent infill. “A” denotes a water body and “B” identifies a landfill. (b) Colour image of the radiometric DOSE data with peat outline in white. White dots denote airborne survey sampling along E–W flight lines.
Remotesensing 06 00521f4
Figure 5. The 11 × 10 km study area from the northern Midlands survey. (a) 1:50 k base topographic map with peat areas shown with red line polygons. Areas with grey transparent infill denote eight Ramsar wetland sites. Sites identified are: FM = Fenn’s and other Mosses, HM = Hanmer Mere (non-peat), LB = Llyn Bedydd (non-peat), WM = White Mere (largely non-peat), CLM = Clarepool Moss, CM = Cole Mere, SCM = Sweat and Crose Mere, BM = Brownheath Mere. Note that Ellesmere Mere (EM, non-Ramsar) is largely water. (b) Radiometric DOSE response across the area, shown as coloured contours with an upper limit of 15 nGy·h−1. Peat areas shown with red line polygons.
Remotesensing 06 00521f5
Figure 6. The 11 × 10 km study area from the northern Midlands survey. Peat areas are shown with red line polygons. Blue areas denote water bodies. Grey areas denote areas in which radiometric DOSE response is < 12 nGy·h−1. Black dots show airborne survey sampling along E–W flight lines (400 m line separation) and N–S tie lines (1,200 m line separations).
Remotesensing 06 00521f6
Figure 7. The 2 × 3 km study area (mainland area of Anglesey survey) across an area of afforested peat. (a) Perspective view, looking north, of aeriel image draped on DTM, with white dots showing airborne sampling locations. White polygons denote areas of peat. (b) 1:50 k base topographic map with colour contours of the radiometic DOSE response limited to values <22 nGy·h−1. Red polygons denote areas of peat. WB denotes a water body.
Remotesensing 06 00521f7
Figure 8. The 12 × 10 km study area across the Slieve Beagh blanket bog in both Northern Ireland and the Republic of Ireland. (a) Perspective view, looking north, with ariel image draped on DTM. Ramsar site shown by red contour (extends to border). Mapped peat locations (DiGMAPGB50) shown by white contours. (b) Orthographic view of ariel image with mapped peat locations (DiGMAPGB50, UK) shown by white contours. Red contours denote peat (soil) mapping in the Republic of Ireland (RoI). Yellow contours denote CORINE land-use mapping of peat bogs (UK and R0I). ING refers to Irish National Grid coordinates.
Remotesensing 06 00521f8
Figure 9. The 12 × 10 km study area across the Slieve Beagh blanket bog in both Northern Ireland and the Republic of Ireland. (a) Radiometric DOSE data shown as continuous colour image, limited to 20 nGy·h−1. Black contours denote peat locations. Two water bodies are labelled WB. Areas “A” and “B” are discussed in the text. (b) Radiometric DOSE data shown as contours, limited to 6 nGy·h−1. Black contours denote peat locations. Infill background colours denote bedrock geology: LG (Leitrim Group), MSF (Marine Shelf Facies), TG (Tyrone Group).
Remotesensing 06 00521f9
Figure 10. The 12 × 10 km study area across the Slieve Beagh blanket bog restricted to information within Northern Ireland. (a) Soil mapping (DARD): Peat in white (until border), BE (Brown Earth), G (Mineral Gley), HR (Groundwater Humic Ranker). Radiometric DOSE response limited to values < 6 nGy·h−1 shown in transparent grey. Letters “A” indicate zones of mismatch (see text). (b) Radiometric DOSE data shown as continuous colour image, limited to 6 nGy·h−1. Black contours, with grey infill, denote mapped peat locations.
Remotesensing 06 00521f10
Table 1. Spectral energy ranges of the airborne radiometric data.
WindowNuclideEnergy Range (MeV)
Thorium(eTh)208Tl (2.61 Mev)2.41–2.81
Uranium (eU)214Bi (1.76 Mev)1.66–1.86
Potassium (%K)40K (1.46 MeV)1.37–1.57

