A New Tree Cover Percentage Map in Eurasia at 500 m Resolution Using MODIS Data

Abstract
:1. Introduction
2. Study Area and Data
2.1. Study Area
2.2. Satellite Data
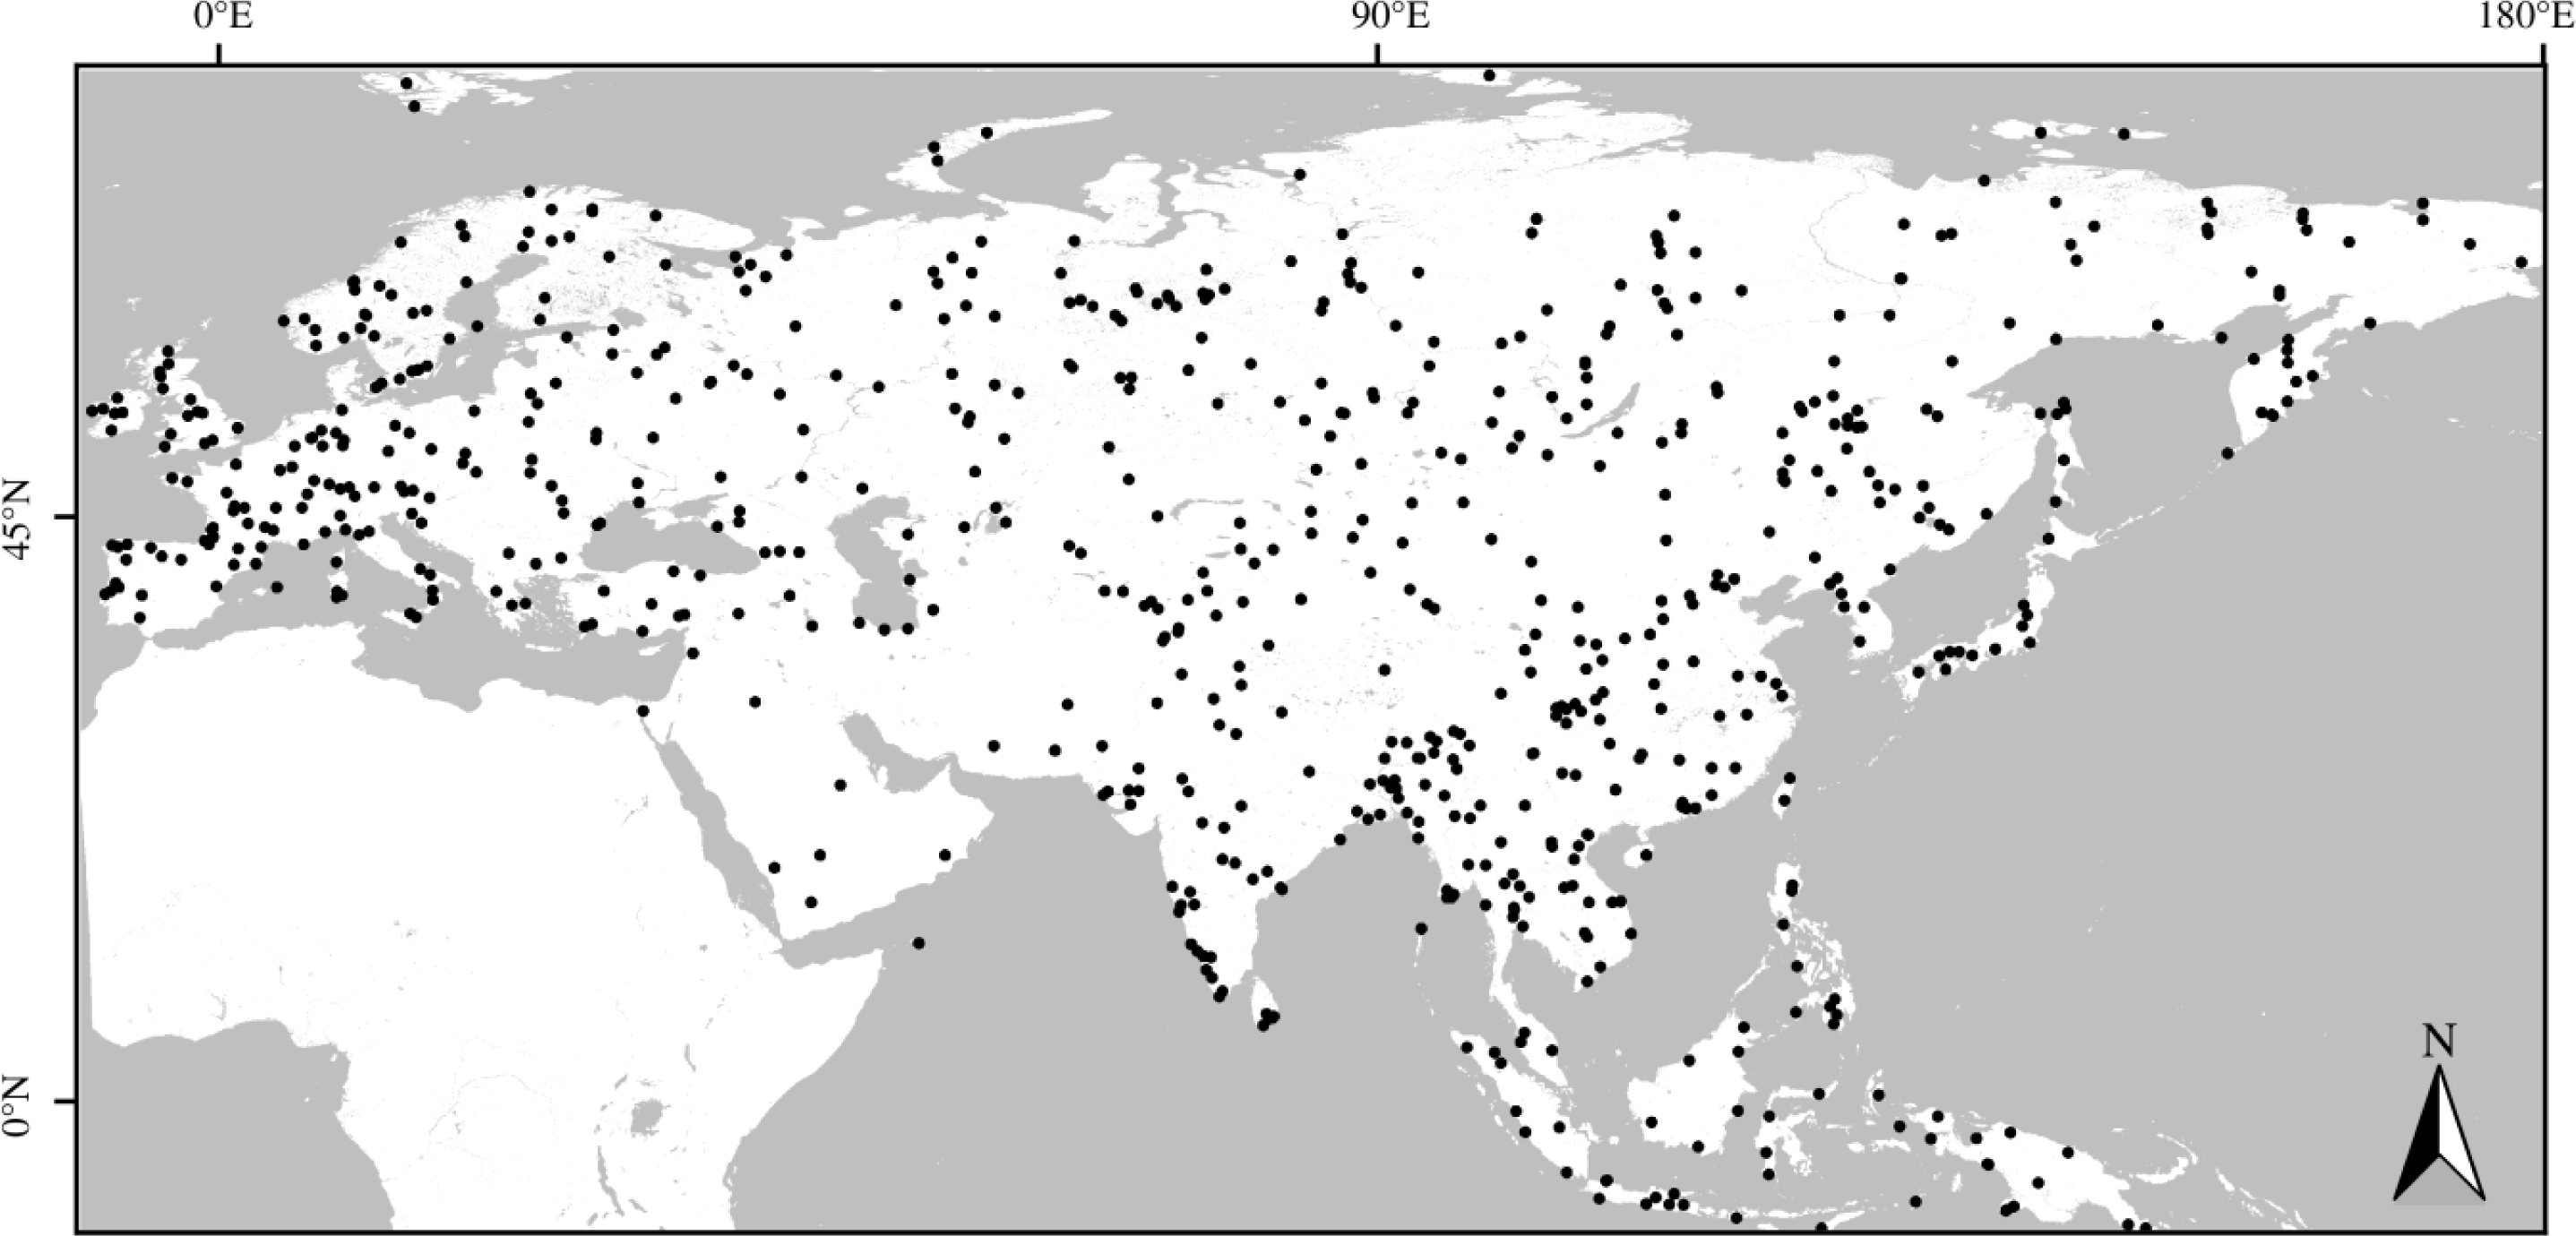
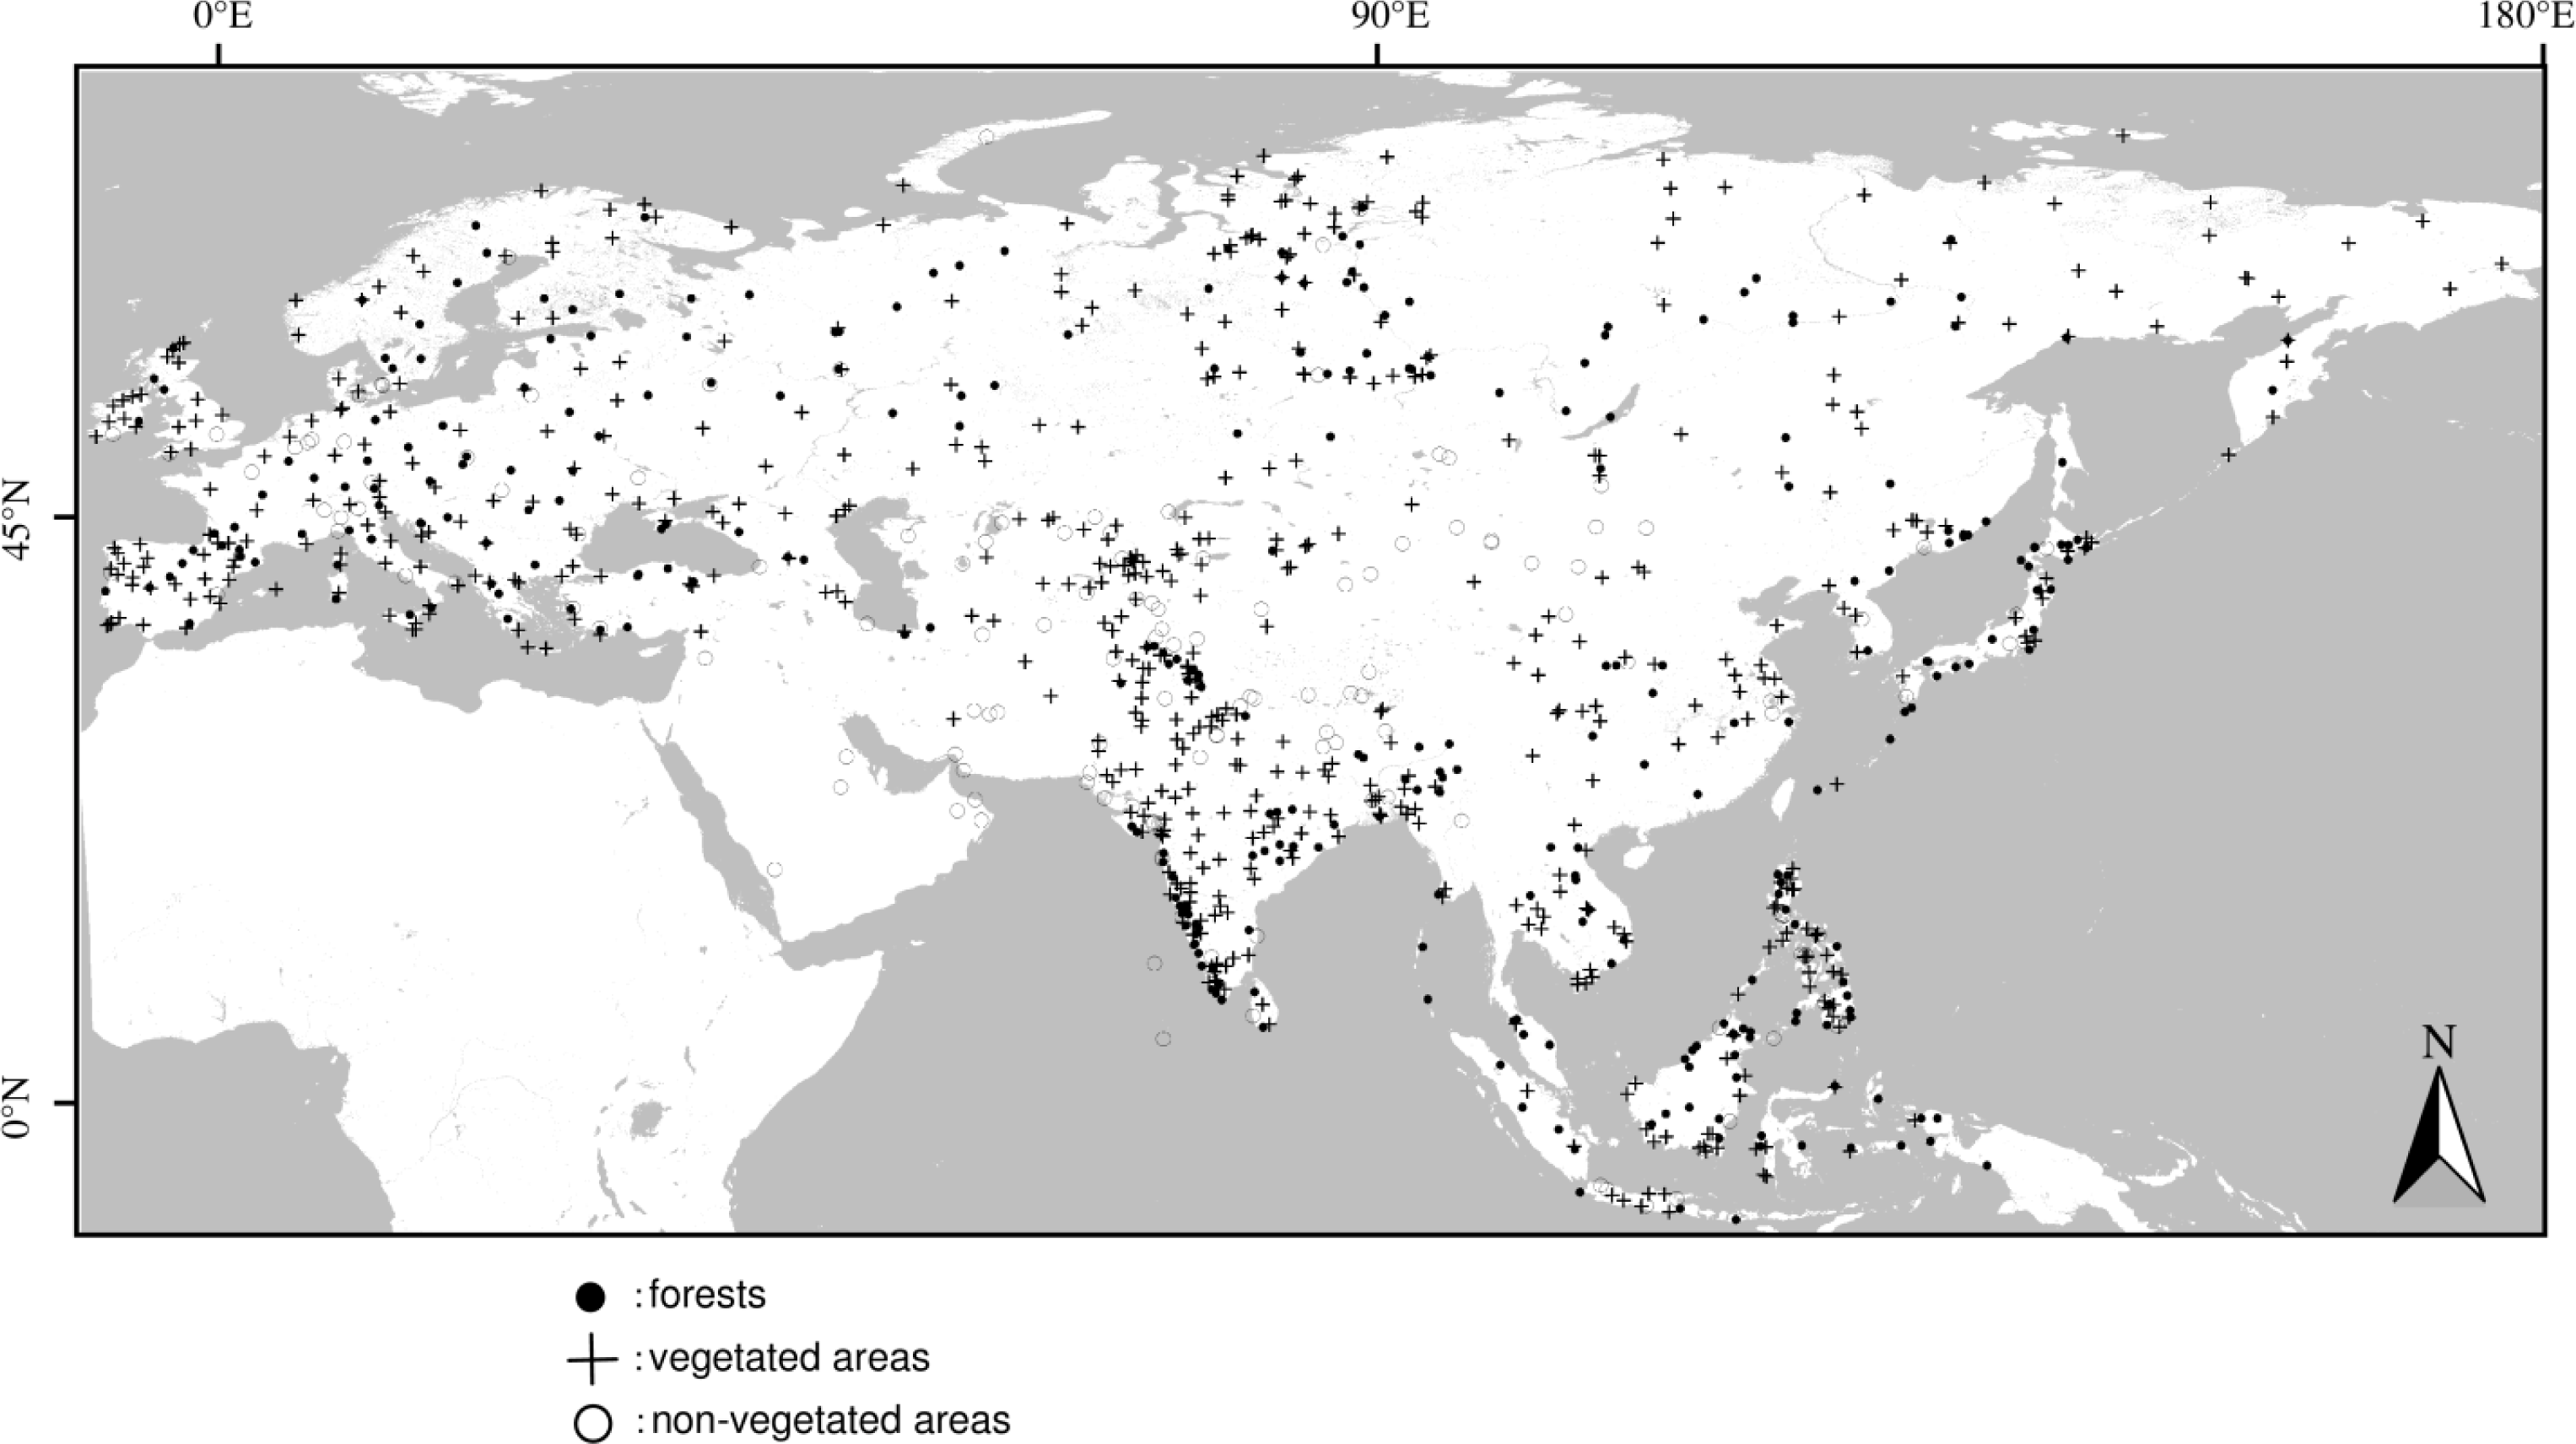
2.3. Reference Data
2.4. Percent Tree Cover Datasets Used for the Comparison
3. Methods
3.1. Estimate of Tree Cover Percentage
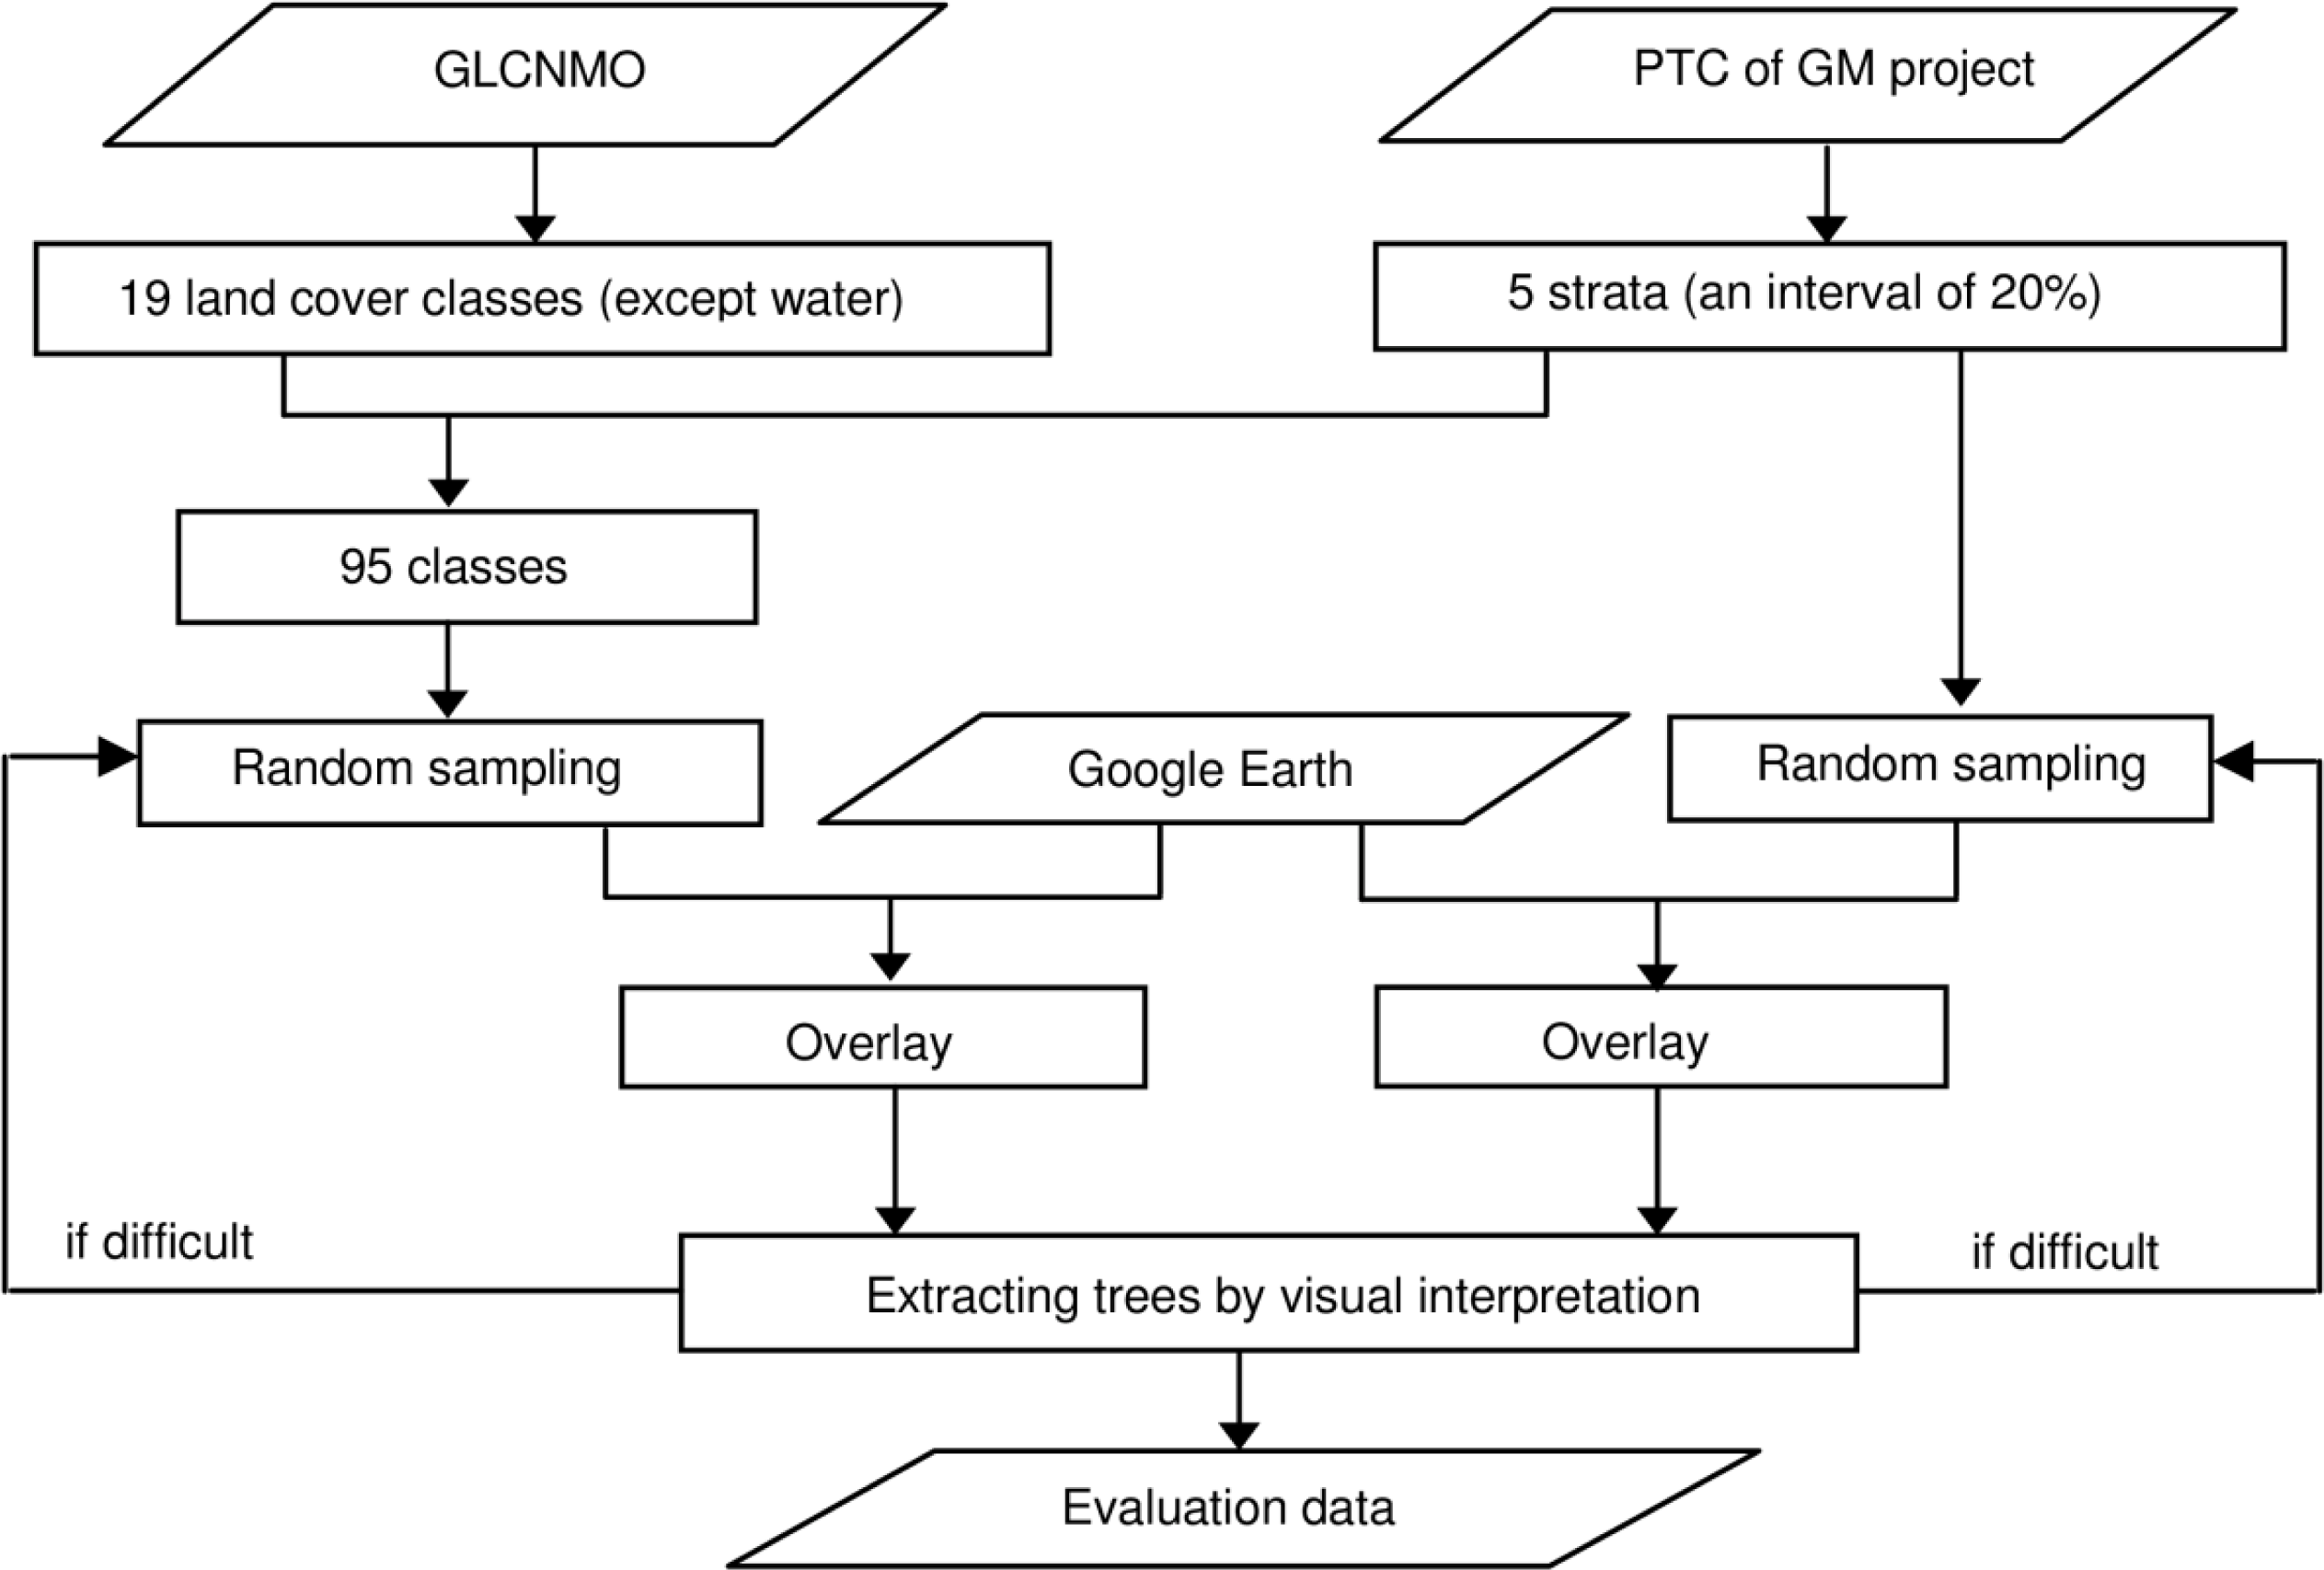
3.1.1. Creation of Evaluation Data for Modifying the Model
- ▪ It was difficult to estimate the tree cover percentage as the available images in Google Earth over the sampled site were not of high resolution.
- ▪ It was difficult to distinguish a tree from a shrub.
- ▪ Geo-location error of MODIS pixel caused poor estimate of tree cover percentage.
- ▪ Estimating the tree cover percentage at the peak of the growing season was difficult as the displayed image in Google Earth had been acquired in winter or during the dry season.
- ▪ Land cover change during the observation time of images in Google Earth and the year 2008 may result in wrong estimate of tree-cover percentage.
3.1.2. Creation of Training Data from Images in Google Earth and MODIS Band Values
| Sij | simulated reflectance of MODIS band i at period j |
| VFk,ij | reflectance of reference site k (land cover type: forest) of MODIS band i at period j |
| VVl,ij | reflectance of reference site l (land cover type: vegetation except forest) of MODIS band i at period j |
| VNm,ij | reflectance of reference site m (land cover type: non-vegetation) of MODIS band i at period j |
| a, b, c | area ratio of reference site (=0, 0.2, 0.4, 0.6, 0.8 or 1) |
| i | 1–7 |
| j | 1–23. |
3.1.3. Creation of Predictor Variables from MODIS Band Reflectance
3.1.4. Grouping of Training Data and Regression Tree Modeling
3.1.5. Creation of Classification-Tree Model and Modification
- (A)
- Mean NDVI, NDSI, and SI values and mean reflectance for Bands 1–7 at the peak of the growing season.
- (B)
- NDVI values at odd periods (periods 1, 3, 5, 7, 9, 11, 13, 15, 17, 19, 21, 23).
- (C)
- Mean NDVI, NDSI, and SI values and mean reflectance for Bands 1–7 at the peak of the growing season, and NDVI and SI values at odd periods.
- (D)
- Mean NDVI, NDSI, and SI values and mean reflectance for Bands 1–7 at the peak of the growing season, and NDVI, SI and Bands 2, 5, and 7 at odd periods.
3.1.6. Application of the Model to the Whole Study Area and Modification of the Model According to Evaluation Data
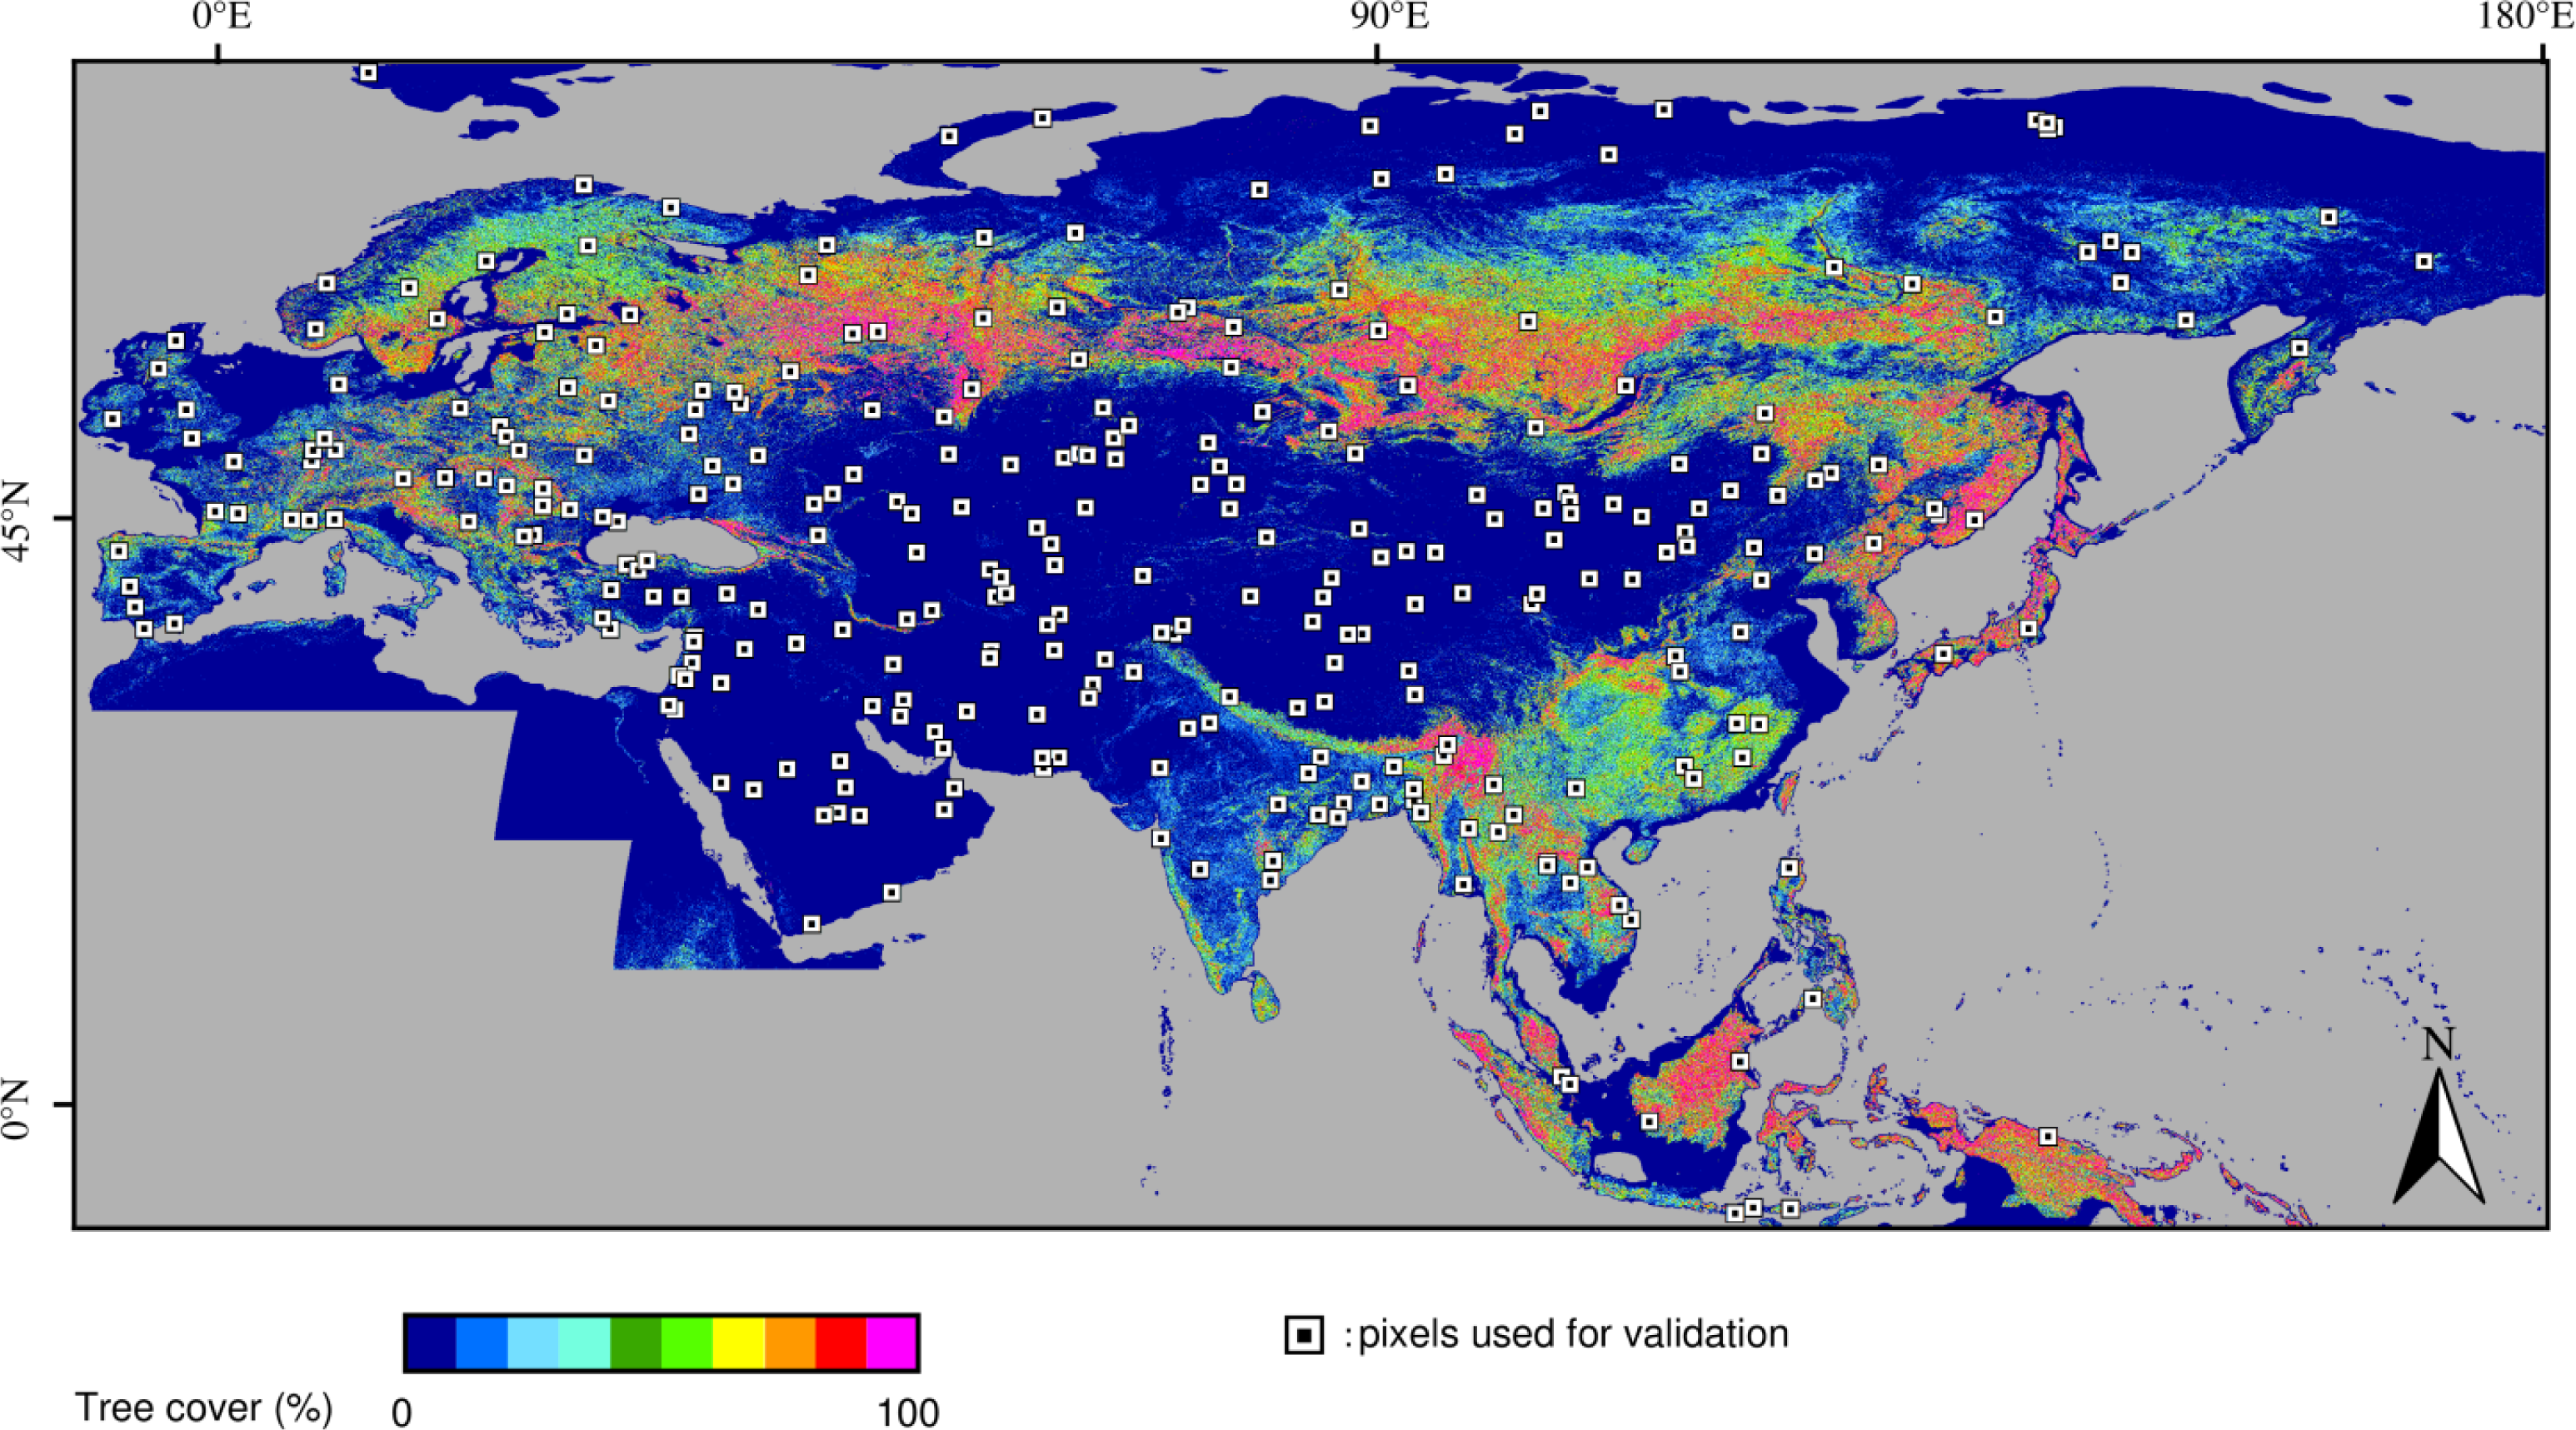
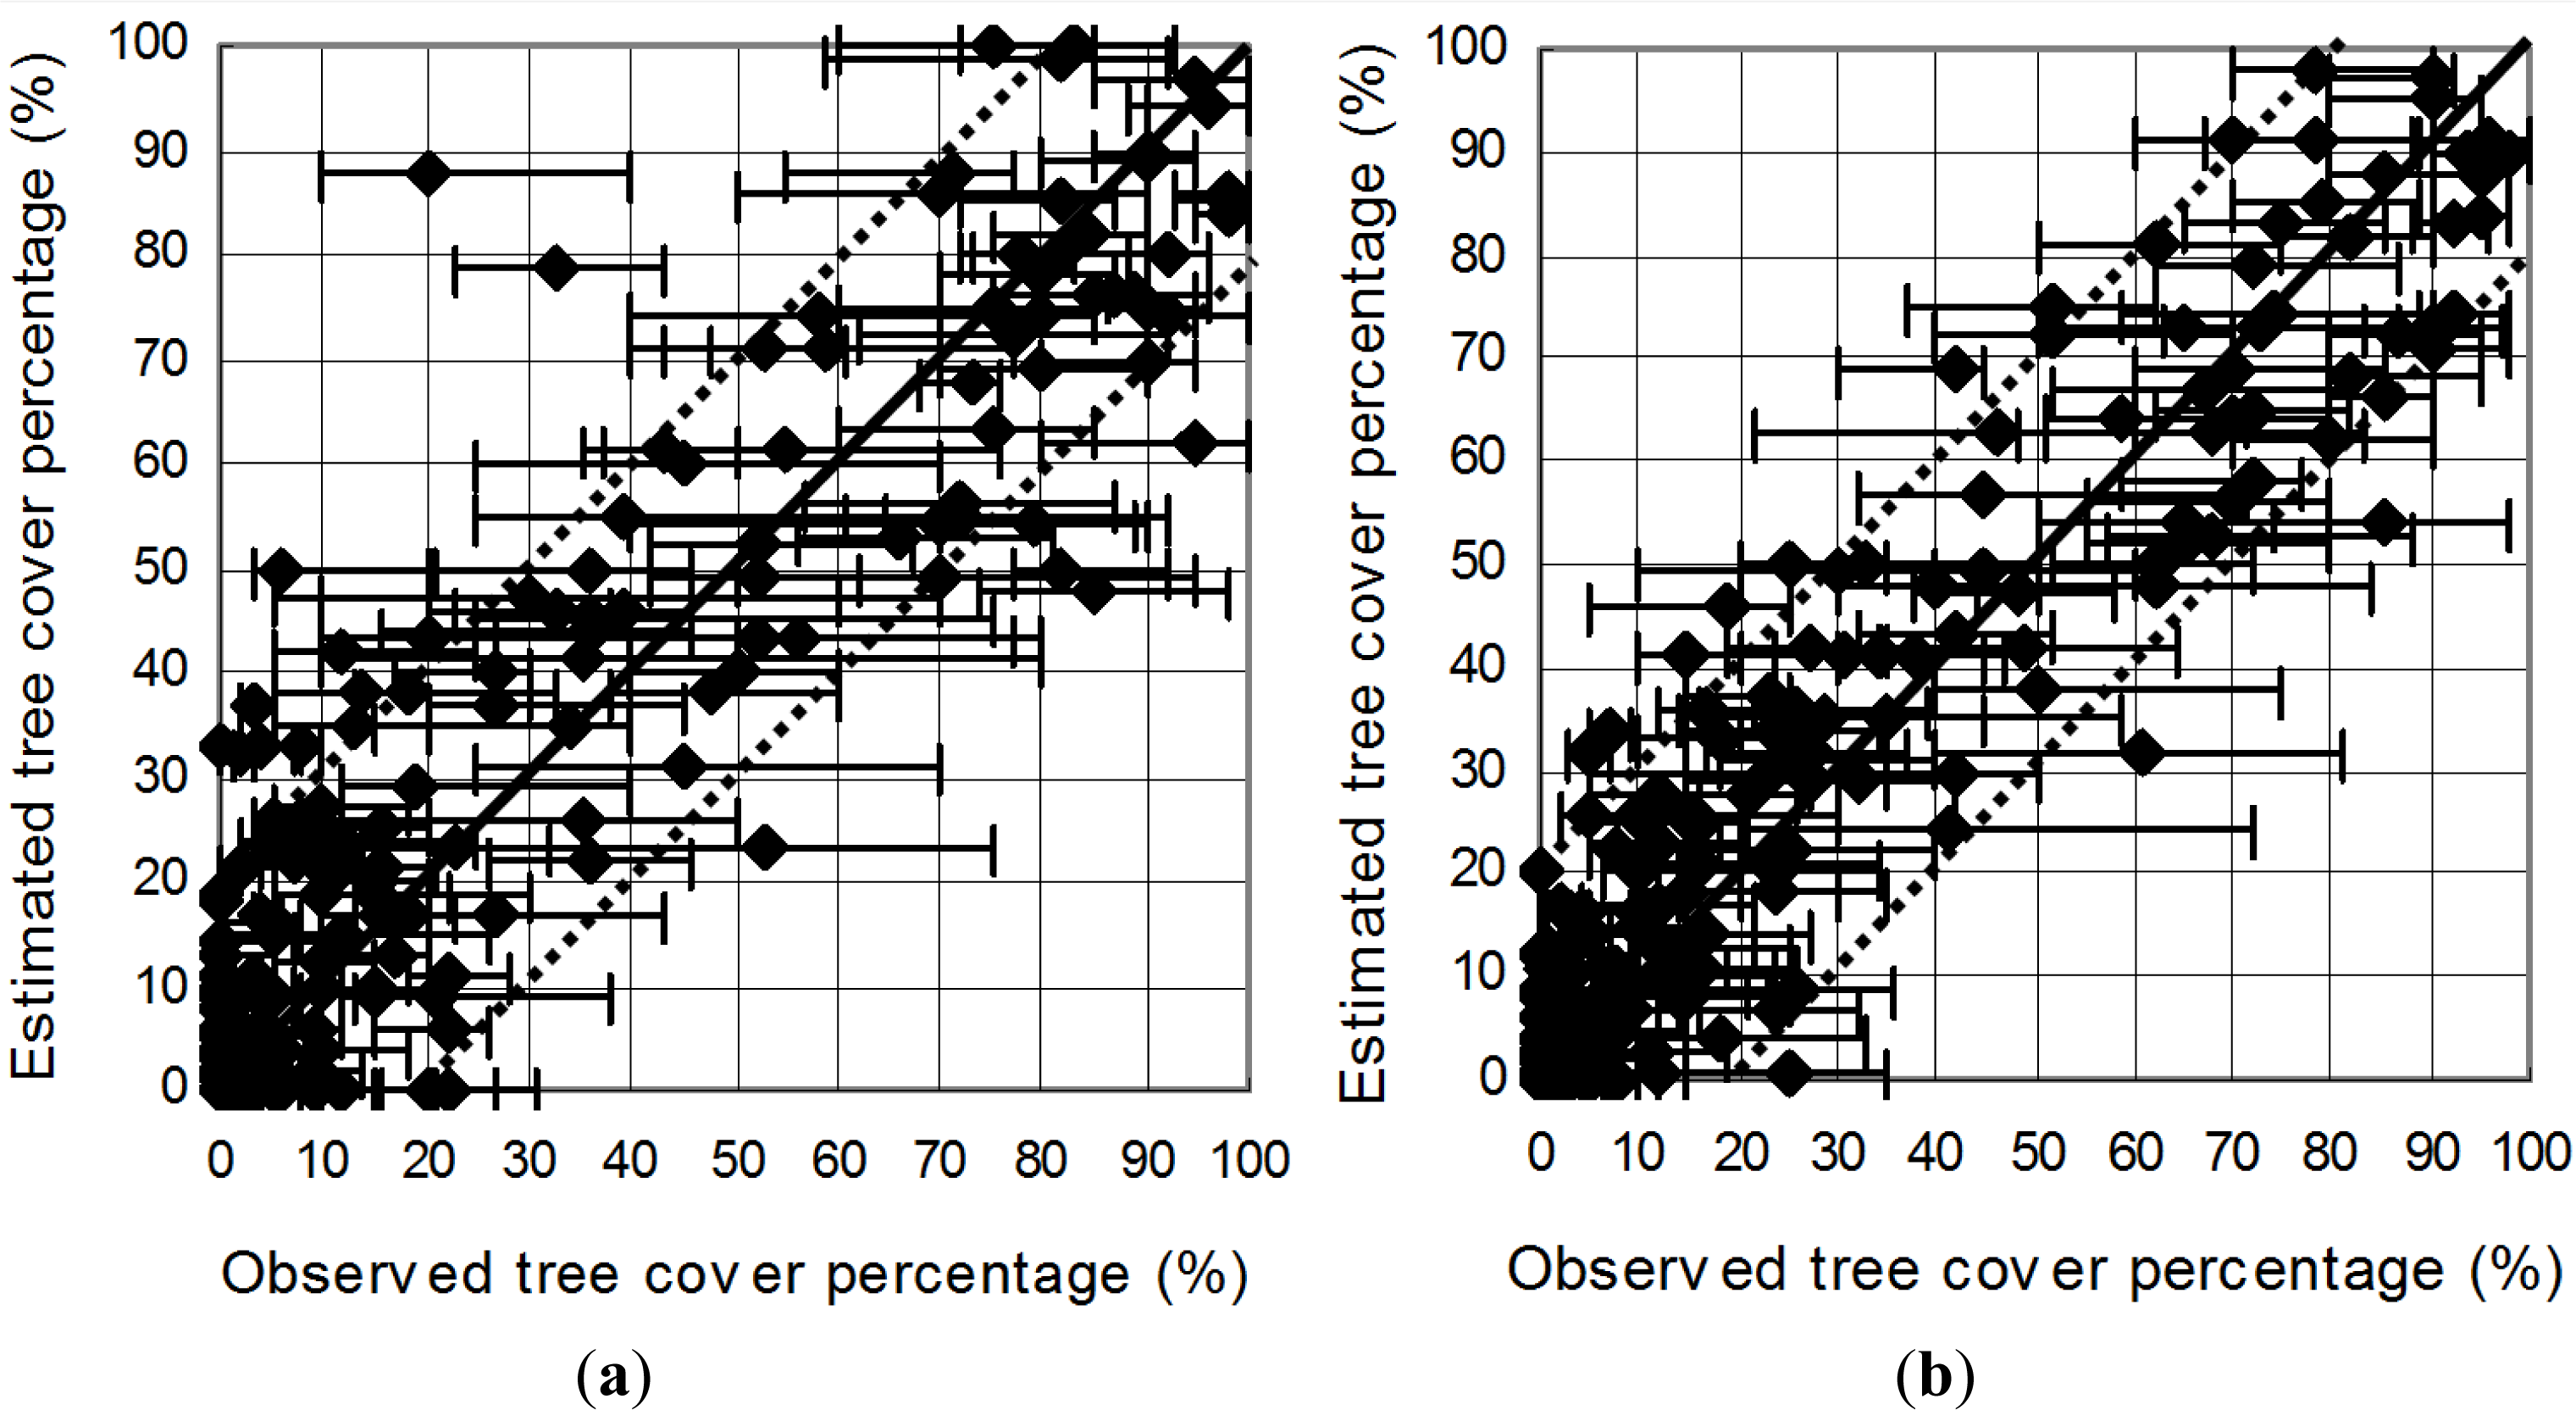
3.2. Validation
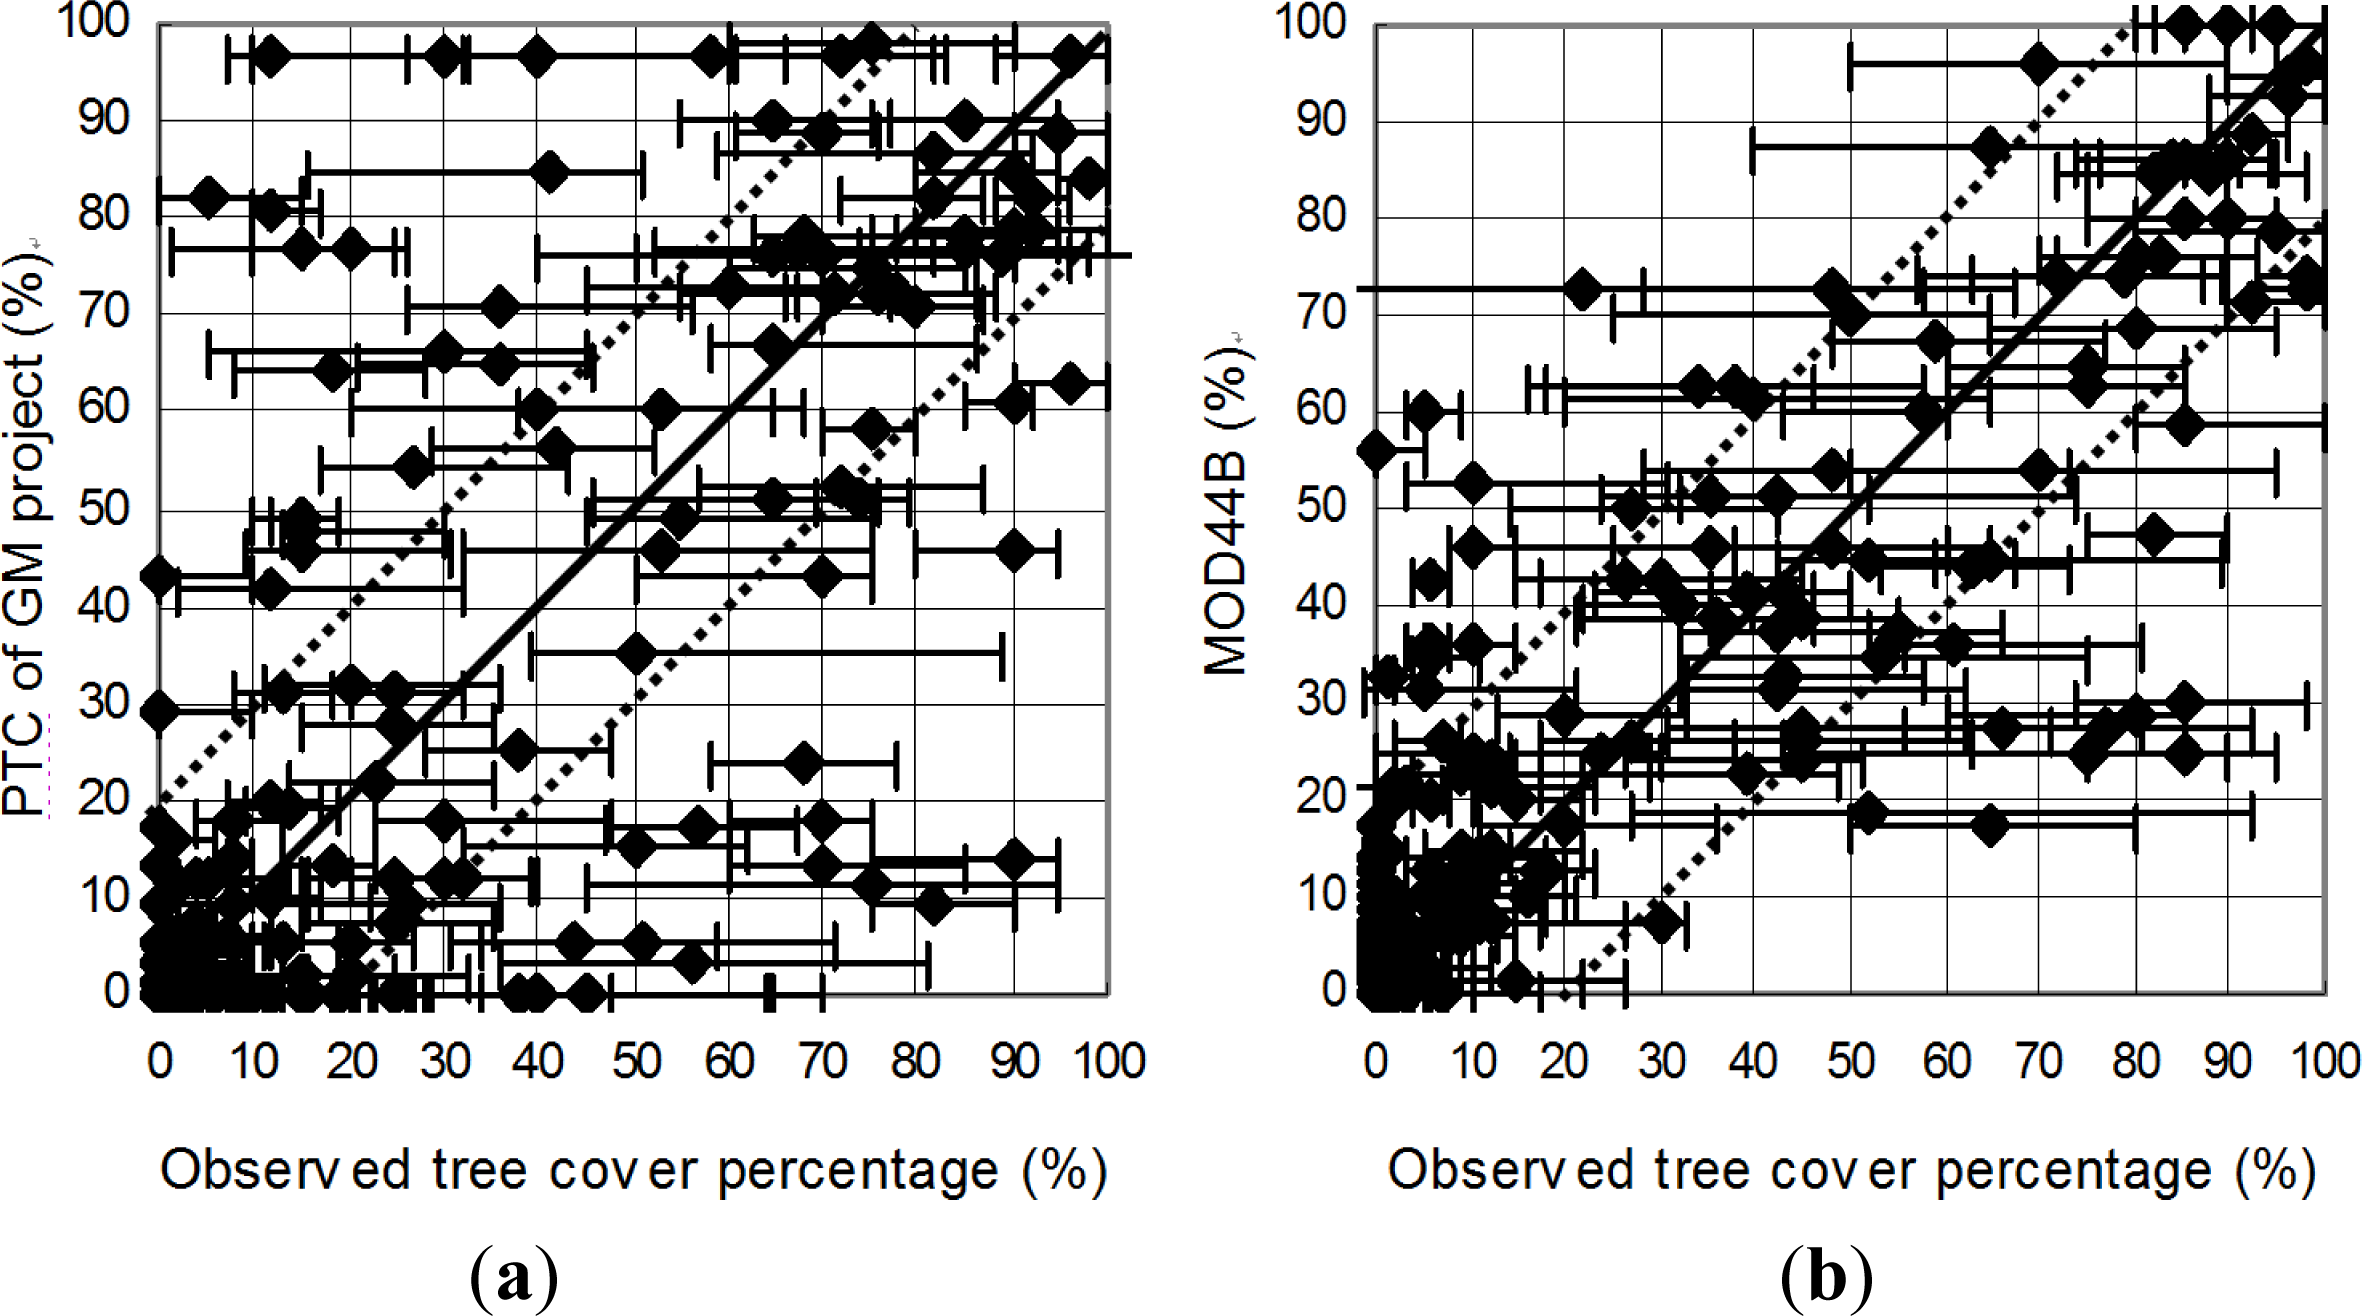
3.3. Comparison with Other Datasets
4. Results
4.1. The Result of Our New Map
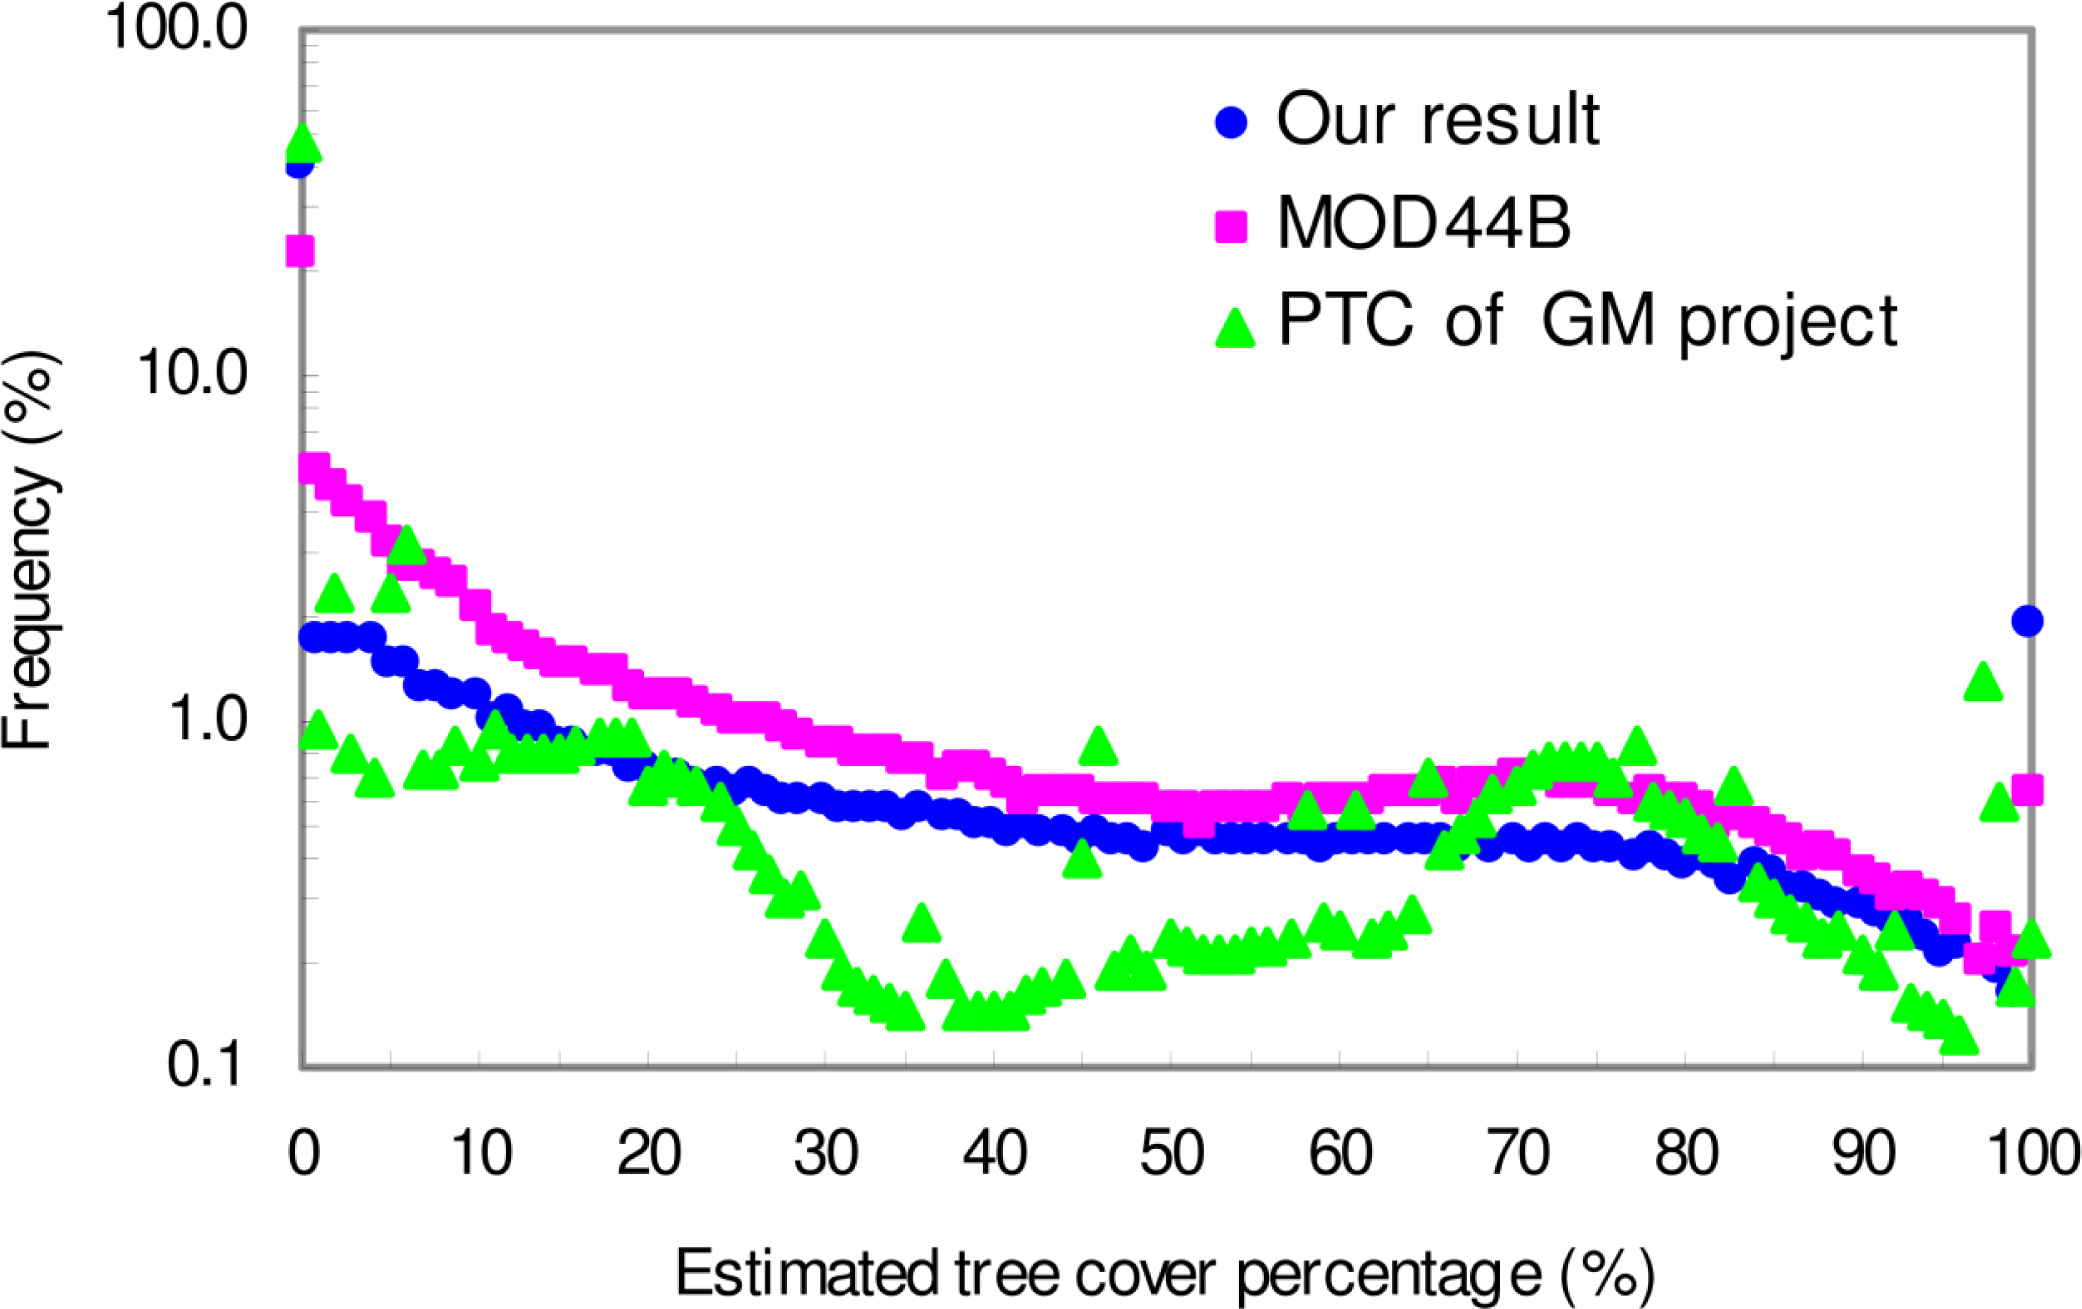
4.2. Comparison with Other Datasets
5. Discussion
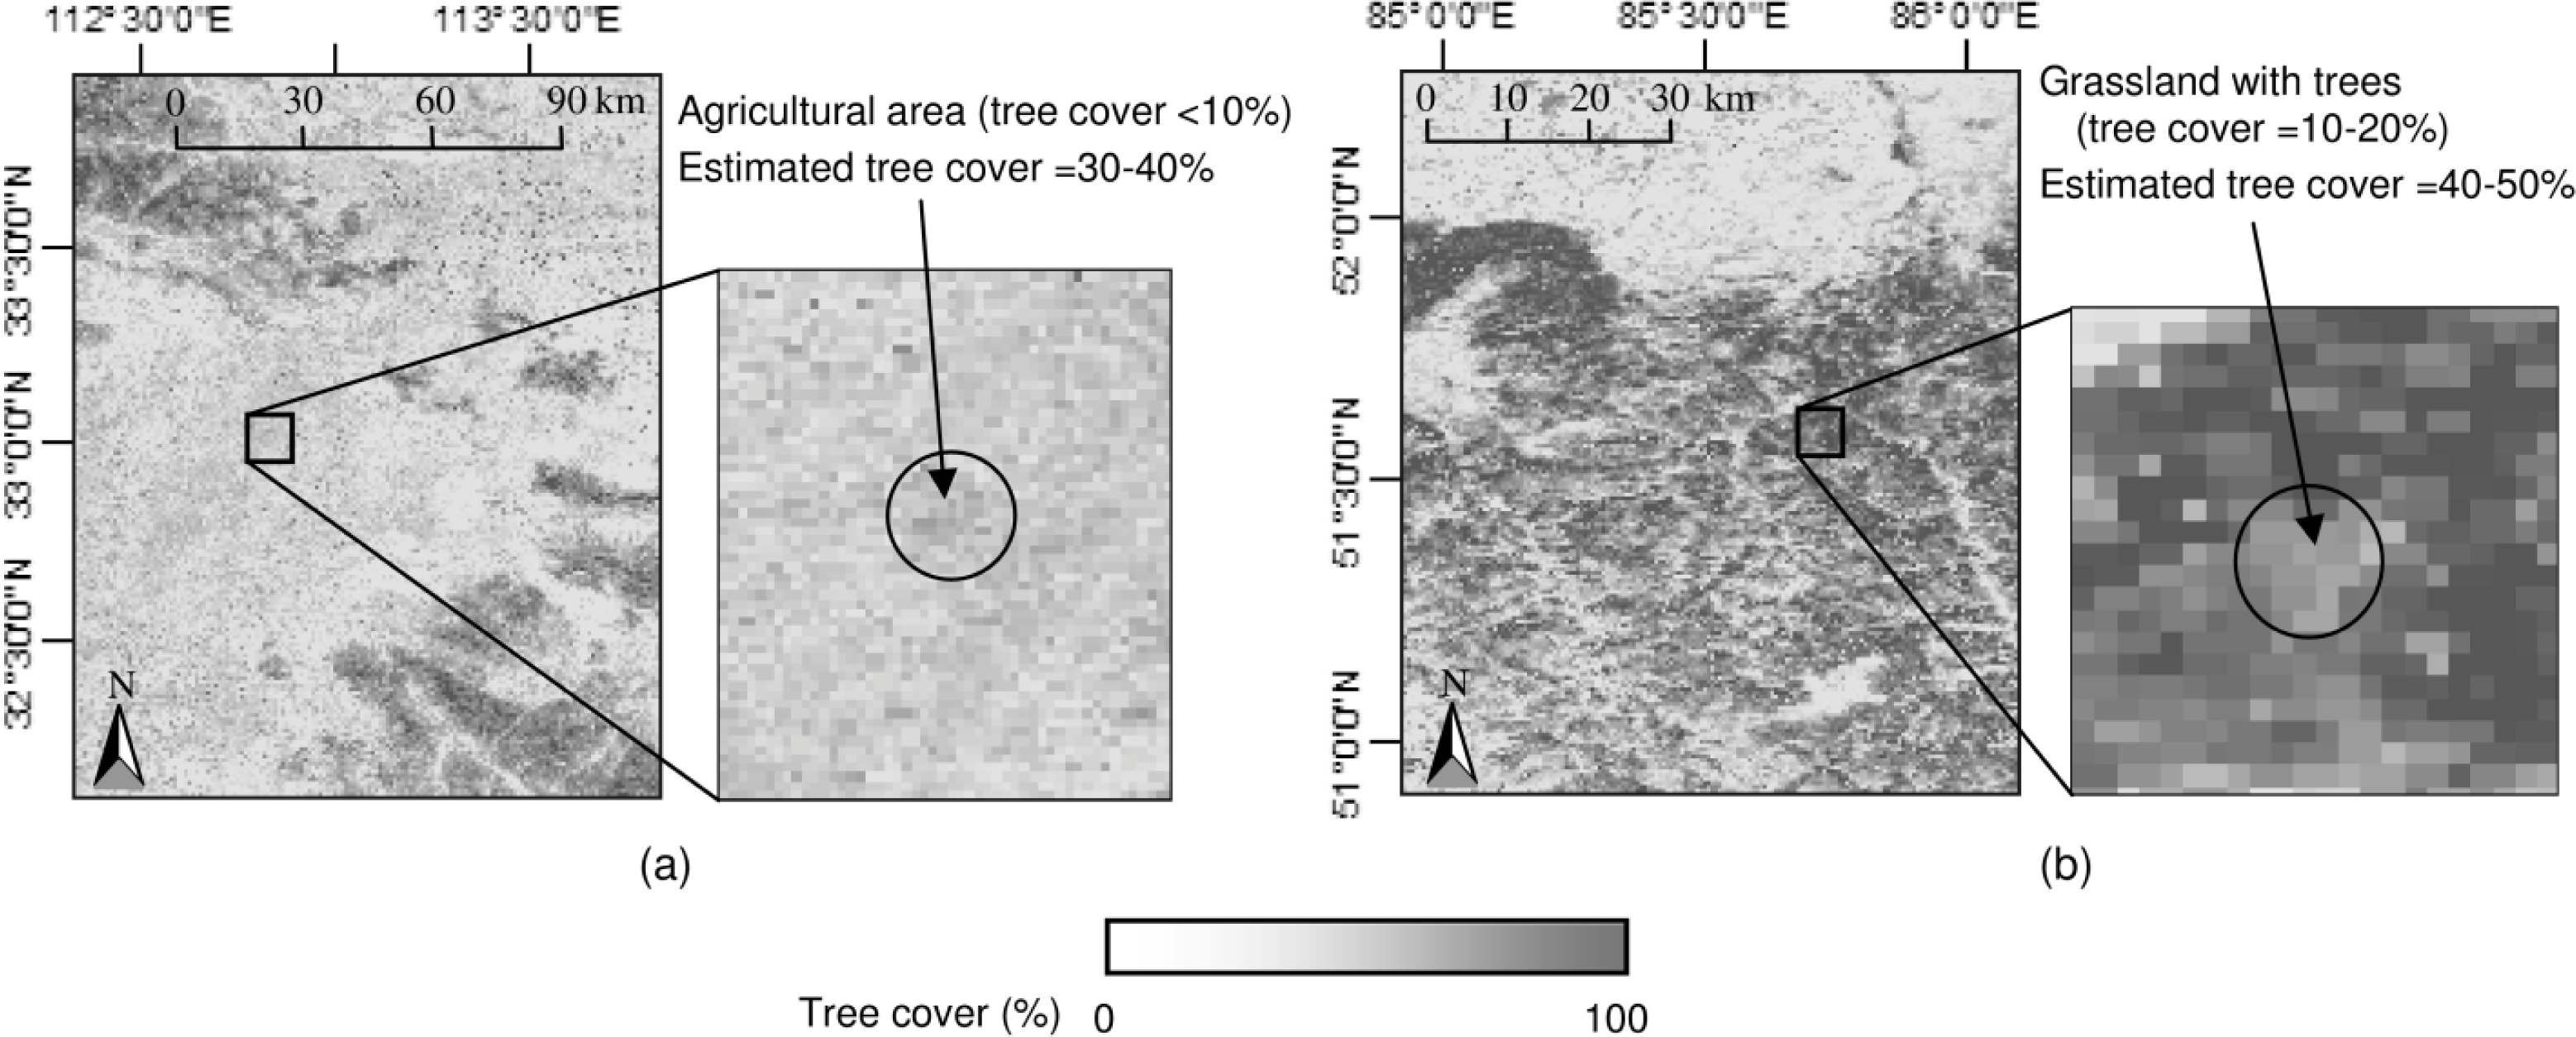
5.1. The New Tree Cover Percentage Map
5.2. Accuracy Assessment
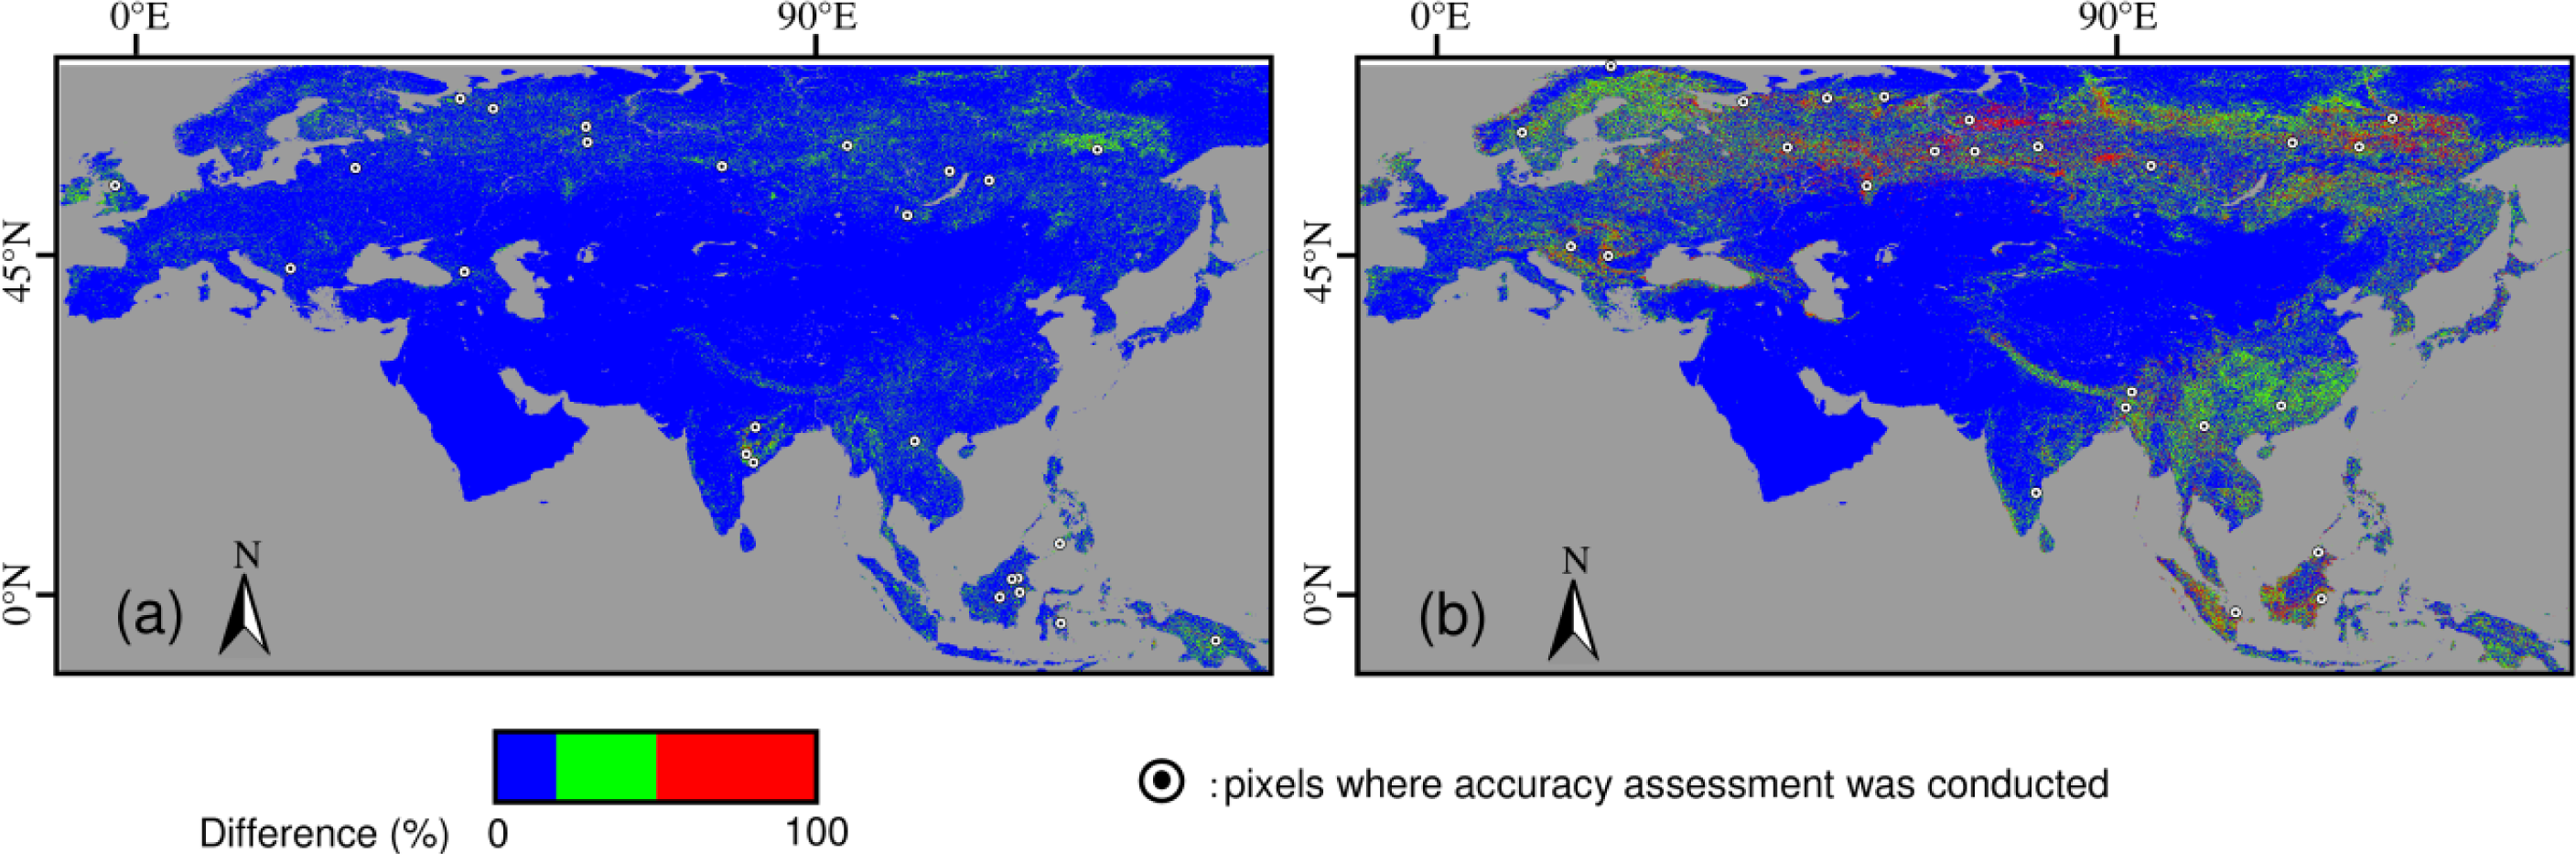
5.3. Comparison among Three Datasets
6. Conclusions
Acknowledgments
Conflicts of Interest
References
- FAO (Food and Agriculture Organization of the United Nations). Forest Resources Assessment Programme Working Paper 33: FRA 2000 on Definitions of Forest and Forest Change; FAO: Rome, Italy, 2000. [Google Scholar]
- FAO (Food and Agriculture Organization of the United Nations). Global Forest Resources Assessment 2010 Main Report; FAO: Rome, Italy, 2010. [Google Scholar]
- DeFries, R.S.; Hansen, M.C.; Townshend, J.R.G. Global continuous fields of vegetation characteristics: A linear mixture model applied to multi-year 8 km AVHRR data. Int. J. Remote Sens 2000, 21, 1389–1414. [Google Scholar]
- DeFries, R.S.; Hansen, M.C.; Townshend, J.R.G.; Janetos, A.C.; Loveland, T.R. A new global 1-km dataset of percentage tree cover derived from remote sensing. Glob. Chang. Biol 2000, 6, 247–254. [Google Scholar]
- Geospatial Information Authority of Japan, Chiba University and Collaborating Organizations. Global Map—Global Land Cover (GLCNMO), Global Map—Percent Tree Cover, 2008. Available online: http://www.iscgm.org/login.html (accessed on 1 April 2013).
- Hansen, M.C.; DeFries, R.S.; Townshend, J.R.G.; Carroll, M.; Dimiceli, C.; Sohlberg, R.A. Global percent tree cover at a spatial resolution of 500 meters: First results of the MODIS vegetation continuous fields algorithm. Earth Interact 2003, 7, 1–15. [Google Scholar]
- Rokhmatuloh; Nitto, D.; Al-Bilbisi, H.; Arihara, K.; Tateishi, R. Estimating percent of tree cover using regression tree method with very-high-resolution QuickBird images as training data. J. Remote Sens. Soc. Jpn 2007, 27, 1–12. [Google Scholar]
- Rokhmatuloh, R.; Tateishi, R.; Al-Bilbisi, H.; Arihara, K.; Kobayashi, T.; Nitto, D.; Lee, S.A.; Hirabayashi, K.; Lu, Y.Q.; Lu, C.; et al. Global percent tree cover mapping using regression tree method: An advantage of QuickBird images as training data. Asian J. Geoinform 2010, 10, 21–28. [Google Scholar]
- Berberoglu, S.; Satir, O.; Atkinson, P.M. Mapping percentage tree cover from Envisat MERIS data using linear and nonlinear techniques. Int. J. Remote Sens 2009, 30, 4747–4766. [Google Scholar]
- Heiskanen, J.; Kivinen, S. Assessment of multispectral, -temporal and -angular MODIS data for tree cover mapping in the tundra-taiga transition zone. Remote Sens. Environ 2008, 112, 2367–2380. [Google Scholar]
- Schwarz, M.; Zimmermann, N.E. A new GLM-based method for mapping tree cover continuous fields using regional MODIS reflectance data. Remote Sens. Environ 2005, 95, 428–443. [Google Scholar]
- Hansen, M.C.; DeFries, R.S.; Townshend, J.R.G.; Marufu, L.; Sohlberg, R. Development of MODIS tree cover validation data set for Western Province, Zambia. Remote Sens. Environ 2002, 83, 320–335. [Google Scholar]
- Hansen, M.C.; DeFries, R.S.; Townshend, J.R.G.; Sohlberg, R.; Dimiceli, C.; Carroll, M. Towards an operational MODIS continuous field of percent tree cover algorithm: Examples using AVHRR and MODIS data. Remote Sens. Environ 2002, 83, 303–319. [Google Scholar]
- White, M.A.; Shaw, J.D.; Ramsey, R.D. Accuracy assessment of the vegetation continuous field tree cover product using 3954 ground plots in the south-western USA. Int. J. Remote Sens 2005, 26, 2699–2704. [Google Scholar]
- Lefsky, M.A. A global forest canopy height map from the Moderate Resolution Imaging Spectroradiometer and the Geoscience Laser Altimeter System. Geophys. Res. Lett 2010, 37. [Google Scholar] [CrossRef]
- Heiskanen, J. Evaluation of global land cover data sets over the tundra-taiga transition zone in northernmost Finland. Int. J. Remote Sens 2008, 29, 3727–3751. [Google Scholar]
- Montesano, P.M.; Nelson, R.; Sun, G.; Margolis, H.; Kerber, A.; Ranson, K.J. MODIS tree cover validation for the circumpolar taiga-tundra transition zone. Remote Sens. Environ 2009, 113, 2130–2141. [Google Scholar]
- Arino, O.; Bicheron, P.; Achard, F.; Latham, J.; Witt, R.; Weber, J.L. GLOBCOVER: The most detailed portrait of Earth. Eur. Space Agency Bull 2008, 136, 24–31. [Google Scholar]
- Friedl, M.A.; Sulla-Menashe, D.; Tan, B.; Schneider, A.; Ramankutty, N.; Sibley, A.; Huang, X. MODIS Collection 5 global land cover: Algorithm refinements and characterization of new datasets. Remote Sens. Environ 2010, 114, 168–182. [Google Scholar]
- Herold, M.; Mayaux, P.; Woodcock, C.E.; Baccini, A.; Shmullius, C. Some challenges in global land cover mapping: An assessment of agreement and accuracy in existing 1 km datasets. Remote Sens. Environ 2008, 112, 2538–2556. [Google Scholar]
- Pflugmacher, D.; Krankina, O.N.; Cohen, W.B.; Friedl, M.A.; Sulla-Menashe, D.; Kennedy, R.E.; Nelson, P.; Loboda, T.V.; Kuemmerle, T.; Dyukarev, E.; et al. Comparison and assessment of coarse resolution land cover maps for Northern Eurasia. Remote Sens. Environ 2011, 115, 3539–3553. [Google Scholar]
- Hansen, M.C.; DeFries, R.S.; Townshend, J.R.G.; Carroll, M.; Dimiceli, C.; Sohlberg, R.A. Vegetation Continuous Fields MOD44B, 2008 Percent Tree Cover, Collection 5. 2011. Available online: http://www.glcf.umd.edu/data/vcf/ (accessed on 1 April 2013).
- FAO (Food and Agriculture Organization of the United Nations). Global Forest Resources Assessment Update 2005: Terms and Definitions; FAO: Rome, Italy, 2004. [Google Scholar]
- Hallé, F.; Oldeman, R.A.A.; Tomlinson, P.B. What is a Tree? In Tropical Trees and Forests: An Architectural Analysis; Springer-Verlag: Berlin, Germany, 1978; pp. 1–6. [Google Scholar]
- Nicholson, B.E.; Clapham, A.R. The Oxford Book of Trees; Oxford University Press: London, UK, 1975. [Google Scholar]
- Oldeman, R.A.A. Second Part: Forest Components. In Forests: Elements of Silvology; Springer-Verlag: Berlin, Germany, 1990; pp. 27–154. [Google Scholar]
- Thomas, P. Trees: Their Natural History; Cambridge University Press: Cambridge, UK, 2000. [Google Scholar]
- Peel, M.C.; Finlayson, B.L.; McMahon, T.A. Updated world map of the Koppen-Geiger climate classification. Hydrol. Earth Syst. Sci 2007, 11, 1633–1644. [Google Scholar]
- Hoan, N.T.; Tateishi, R.; Al-Bilbisi, H. Global MODIS 2008 Data User’s Manual; Chiba University: Chiba, Japan, 2011. [Google Scholar]
- Schaaf, C.B.; Gao, F.; Strahler, A.H.; Lucht, W.; Li, X.; Tsang, T.; Strugnell, N.C.; Zhang, X.; Jin, Y.; Muller, J.; et al. First operational BRDF, albedo nadir reflectance products from MODIS. Remote Sens. Environ 2002, 83, 135–148. [Google Scholar]
- Schaaf, C. MODIS BRDF/Albedo Product (MCD43) User’s Guide. 2004. Available online: http://www-modis.bu.edu/brdf/userguide/intro.html (accessed on 1 April 2013).
- Schaaf, C.; Liu, J.; Gao, F.; Jiao, Z.; Shuai, Y.; Strahler, A. Collection 005 Change Summary for MODIS BRDF/Albedo (MCD43) Algorithms. Available online: http://landweb.nascom.nasa.gov/QA_WWW/forPage/C005_Change_BRDF.pdf (accessed on 1 April 2013).
- Clark, M.L.; Aide, T.M.; Grau, H.R.; Riner, G. A scalable approach to mapping annual land cover at 250 m using MODIS time series data: A case study in the Dry Chaco ecoregion of South America. Remote Sens. Environ 2010, 114, 2816–2832. [Google Scholar]
- Joshi, C.; Leeuw, J.D.; Skidmore, A.K.; van Duren, I.C.; van Oosten, H. Remotely sensed estimation of forest canopy density: A comparison of the performance of four methods. Int. J. Appl. Earth Obs 2006, 8, 84–95. [Google Scholar]
- Hansen, M.C.; Townshend, J.R.G.; DeFries, R.S.; Carroll, M. Estimation of tree cover using MODIS data at global, continental and regional/local scales. Int. J. Remote Sens 2005, 26, 4359–4380. [Google Scholar]
- Rikimaru, A.; Roy, P.S.; Miyatake, S. Tropical forest cover density mapping. Trop. Ecol 2002, 43, 39–47. [Google Scholar]
- Pal, M. M5 model tree for land cover classification. Int. J. Remote Sens 2006, 27, 825–831. [Google Scholar]
- Quinlan, J.R. Learning with Continuous Classes. Proceedings of Australian Joint Conference on Artificial Intelligence, Hobart, Australia, 16–18 November 1992; World Scientific Press: Singapore, Singapore, 1992; pp. 343–348. [Google Scholar]
- Li, A.; Huang, C.; Sun, G.; Shi, H.; Toney, C.; Zhu, Z.; Rollins, M.G.; Goward, S.N.; Zhu, Z. Modeling the height of young forests regenerating from recent disturbances in Mississippi using Landsat and ICESat data. Remote Sens. Environ 2011, 115, 1837–1849. [Google Scholar]
- Quinlan, J.R. Induction of decision trees. Mach. Learn 1986, 1, 81–106. [Google Scholar]
- Quinlan, J.R. C4.5: Programs for Machine Learning; Morgan Kaufmann Publishers: San Mateo, CA, USA, 1993. [Google Scholar]
- Quinlan, J.R. Improved use of continuous attributes in C4.5. J. Artif. Intell. Res 1996, 4, 77–90. [Google Scholar]


| Dominant Land Cover Types | Number of Collected Reference Sites |
|---|---|
| Forest | 320 sites |
| Vegetation except forest | 575 sites |
| Non-vegetation | 145 sites |
| Period No. | Start Date | End Date |
|---|---|---|
| 1 | 2008/01/01 | 2008/01/16 |
| 2 | 2008/01/17 | 2008/02/01 |
| 3 | 2008/02/02 | 2008/02/17 |
| 4 | 2008/02/18 | 2008/03/04 |
| 5 | 2008/03/05 | 2008/03/20 |
| 6 | 2008/03/21 | 2008/04/05 |
| 7 | 2008/04/06 | 2008/04/21 |
| 8 | 2008/04/22 | 2008/05/07 |
| 9 | 2008/05/08 | 2008/05/23 |
| 10 | 2008/05/24 | 2008/06/08 |
| 11 | 2008/06/09 | 2008/06/24 |
| 12 | 2008/06/25 | 2008/07/10 |
| 13 | 2008/07/11 | 2008/07/26 |
| 14 | 2008/07/27 | 2008/08/11 |
| 15 | 2008/08/12 | 2008/08/27 |
| 16 | 2008/08/28 | 2008/09/12 |
| 17 | 2008/09/13 | 2008/09/28 |
| 18 | 2008/09/29 | 2008/10/14 |
| 19 | 2008/10/15 | 2008/10/30 |
| 20 | 2008/10/31 | 2008/11/15 |
| 21 | 2008/11/16 | 2008/12/01 |
| 22 | 2008/12/02 | 2008/12/17 |
| 23 | 2008/12/18 | 2009/01/02 |
| Types | Variables |
|---|---|
| Individual values for all the 16-day periods | Nadir BRDF-Adjusted Reflectance (Bands 1–7) |
| NDVI | |
| NDSI | |
| SI | |
| Mean values at the three greenest periods based on the temporal profile of NDVI | Nadir BRDF-Adjusted Reflectance (Bands 1–7) |
| NDVI | |
| NDSI | |
| SI | |
| Individual values based on the temporal profile of NDVI | Nadir BRDF-Adjusted Reflectance (Bands 1–7) |
| NDVI | |
| NDSI | |
| SI | |
| Annual mean values | Nadir BRDF-Adjusted Reflectance (Bands 1–7) |
| Mean values at the three highest periods of each band reflectance | Nadir BRDF-Adjusted Reflectance (Bands 1–7) |
| Minimum values of each band reflectance | Nadir BRDF-Adjusted Reflectance (Bands 1, 3) |
| Tree Cover Strata (Observed) | Single-Pixel Level | 3 × 3 Pixel Window | ||
|---|---|---|---|---|
| RMSE | Number of Sites | RMSE | Number of Sites | |
| 0–20 | 9.5% | 231 | 6.1% | 223 |
| 21–40 | 15.7% | 21 | 11.8% | 29 |
| 41–60 | 14.2% | 15 | 14.6% | 13 |
| 61–80 | 14.5% | 17 | 13.1% | 24 |
| 81–100 | 16.2% | 23 | 13.9% | 18 |
| 0–100 | 11.2% | 307 | 8.6% | 307 |
| 0–100 (WRMSE) | 14.2% | 307 | 12.3% | 307 |
| Tree Cover Strata (Observed) | PTC of GM Project | MOD44B | ||
|---|---|---|---|---|
| RMSE (%) | Number of Sites | RMSE (%) | Number of Sites | |
| 0–20 | 13.2 | 231 | 9.7 | 216 |
| 21–40 | 29.8 | 20 | 20.3 | 16 |
| 41–60 | 33.2 | 14 | 15.2 | 19 |
| 61–80 | 27.0 | 23 | 29.3 | 17 |
| 81–100 | 29.8 | 18 | 21.9 | 23 |
| 0–100 | 18.6 | 306 | 14.0 | 291 |
| 0–100 (WRMSE) | 27.5 | 306 | 20.4 | 291 |
| Tree Cover Strata | Difference of Estimated Tree Cover Percentage | Frequency of the Number of Pixels | |||||
|---|---|---|---|---|---|---|---|
| Our Result vs. MOD44B | Our Result vs. PTC of GM Project | MOD44B vs. PTC of GM Project | |||||
| Our Result | MOD44B | Our Result | PTC of GM Project | MOD44B | PTC of GM Project | ||
| 0–20 | 0–10 | 88.4% | 89.0% | 82.5% | 75.1% | 83.1% | 75.2% |
| 11–20 | 8.9% | 8.6% | 10.6% | 11.0% | 11.0% | 11.5% | |
| 21–30 | 1.9% | 1.5% | 1.9% | 4.7% | 1.8% | 4.8% | |
| 31–40 | 0.5% | 0.5% | 1.4% | 2.9% | 1.3% | 2.9% | |
| 41–50 | 0.2% | 0.2% | 1.1% | 2.0% | 0.8% | 2.0% | |
| 51–60 | 0.0% | 0.1% | 0.9% | 1.6% | 0.7% | 1.5% | |
| 61–70 | 0.0% | 0.1% | 0.7% | 1.2% | 0.6% | 1.0% | |
| 71–80 | 0.0% | 0.0% | 0.5% | 0.9% | 0.4% | 0.5% | |
| 81–90 | 0.0% | 0.0% | 0.3% | 0.5% | 0.2% | 0.3% | |
| 91–100 | 0.0% | 0.0% | 0.2% | 0.1% | 0.1% | 0.2% | |
| 21–40 | 0–10 | 52.6% | 48.8% | 17.4% | 28.5% | 19.0% | 35.2% |
| 11–20 | 31.2% | 32.1% | 23.2% | 26.8% | 23.1% | 28.0% | |
| 21–30 | 11.7% | 14.1% | 28.3% | 23.4% | 27.4% | 19.8% | |
| 31–40 | 3.0% | 3.6% | 16.2% | 11.4% | 15.5% | 8.4% | |
| 41–50 | 1.0% | 1.0% | 8.1% | 4.7% | 8.0% | 3.9% | |
| 51–60 | 0.4% | 0.4% | 4.5% | 3.1% | 4.5% | 2.7% | |
| 61–70 | 0.1% | 0.1% | 1.9% | 1.6% | 1.8% | 1.4% | |
| 71–80 | 0.0% | 0.0% | 0.6% | 0.4% | 0.6% | 0.5% | |
| 41–60 | 0–10 | 44.5% | 45.8% | 12.9% | 23.3% | 14.7% | 25.1% |
| 11–20 | 30.7% | 30.5% | 16.7% | 22.6% | 18.7% | 24.6% | |
| 21–30 | 16.2% | 16.1% | 25.1% | 21.4% | 24.8% | 22.9% | |
| 31–40 | 6.6% | 6.1% | 22.3% | 17.8% | 21.0% | 17.7% | |
| 41–50 | 1.8% | 1.4% | 16.4% | 12.0% | 15.4% | 8.2% | |
| 51–60 | 0.2% | 0.1% | 6.5% | 2.9% | 5.4% | 1.5% | |
| 61–80 | 0–10 | 47.7% | 49.9% | 34.2% | 30.1% | 39.4% | 33.7% |
| 11–20 | 30.1% | 31.0% | 24.0% | 24.3% | 23.7% | 23.5% | |
| 21–30 | 14.8% | 13.5% | 13.5% | 17.5% | 11.3% | 15.5% | |
| 31–40 | 4.8% | 4.0% | 5.5% | 11.5% | 4.3% | 11.4% | |
| 41–50 | 1.5% | 1.2% | 5.1% | 8.0% | 5.1% | 8.8% | |
| 51–60 | 0.8% | 0.3% | 7.2% | 5.2% | 7.8% | 5.2% | |
| 61–70 | 0.3% | 0.1% | 3.0% | 2.7% | 6.2% | 1.7% | |
| 71–80 | 0.0% | 0.0% | 0.0% | 0.8% | 2.1% | 0.2% | |
| 81–100 | 0–10 | 50.7% | 49.1% | 37.1% | 26.6% | 49.1% | 35.5% |
| 11–20 | 29.5% | 28.2% | 24.6% | 20.0% | 24.0% | 20.1% | |
| 21–30 | 12.4% | 13.5% | 11.8% | 15.8% | 7.6% | 12.2% | |
| 31–40 | 4.5% | 5.9% | 6.0% | 11.9% | 3.5% | 8.5% | |
| 41–50 | 1.5% | 2.3% | 2.7% | 8.4% | 2.2% | 6.8% | |
| 51–60 | 0.6% | 0.8% | 1.6% | 6.0% | 1.8% | 5.9% | |
| 61–70 | 0.4% | 0.2% | 3.8% | 4.3% | 3.0% | 5.0% | |
| 71–80 | 0.3% | 0.0% | 5.8% | 3.2% | 3.2% | 3.8% | |
| 81–90 | 0.1% | 0.0% | 5.5% | 2.3% | 3.4% | 1.7% | |
| 91–100 | 0.0% | 0.0% | 1.1% | 1.5% | 2.2% | 0.4% | |
| 0–100 | 0–10 | 73.5% | 73.5% | 60.2% | 60.2% | 62.0% | 62.0% |
| 11–20 | 17.1% | 17.1% | 14.9% | 14.9% | 15.3% | 15.3% | |
| 21–30 | 6.4% | 6.4% | 9.2% | 9.2% | 8.6% | 8.6% | |
| 31–40 | 2.1% | 2.1% | 5.9% | 5.9% | 5.5% | 5.5% | |
| 41–50 | 0.6% | 0.6% | 3.9% | 3.9% | 3.6% | 3.6% | |
| 51–60 | 0.2% | 0.2% | 2.5% | 2.5% | 2.4% | 2.4% | |
| 61–70 | 0.1% | 0.1% | 1.6% | 1.6% | 1.4% | 1.4% | |
| 71–80 | 0.0% | 0.0% | 1.0% | 1.0% | 0.7% | 0.7% | |
| 81–90 | 0.0% | 0.0% | 0.5% | 0.5% | 0.3% | 0.3% | |
| 91–100 | 0.0% | 0.0% | 0.2% | 0.2% | 0.2% | 0.2% | |
© 2014 by the authors; licensee MDPI, Basel, Switzerland This article is an open access article distributed under the terms and conditions of the Creative Commons Attribution license ( http://creativecommons.org/licenses/by/3.0/).
Share and Cite
Kobayashi, T.; Tsend-Ayush, J.; Tateishi, R. A New Tree Cover Percentage Map in Eurasia at 500 m Resolution Using MODIS Data. Remote Sens. 2014, 6, 209-232. https://doi.org/10.3390/rs6010209
Kobayashi T, Tsend-Ayush J, Tateishi R. A New Tree Cover Percentage Map in Eurasia at 500 m Resolution Using MODIS Data. Remote Sensing. 2014; 6(1):209-232. https://doi.org/10.3390/rs6010209
Chicago/Turabian StyleKobayashi, Toshiyuki, Javzandulam Tsend-Ayush, and Ryutaro Tateishi. 2014. "A New Tree Cover Percentage Map in Eurasia at 500 m Resolution Using MODIS Data" Remote Sensing 6, no. 1: 209-232. https://doi.org/10.3390/rs6010209
APA StyleKobayashi, T., Tsend-Ayush, J., & Tateishi, R. (2014). A New Tree Cover Percentage Map in Eurasia at 500 m Resolution Using MODIS Data. Remote Sensing, 6(1), 209-232. https://doi.org/10.3390/rs6010209