Over the past 60 years, Earth observing has evolved from aerial photographic studies to high-tech airborne 3-D imaging and global satellite-based monitoring. These technological advances have been driven by an increasing call for quantitative and information-rich data on changes in Earth properties and processes. Within the biospheric remote sensing arena, focus has mostly been placed on changes in land cover and land use, ecological disturbance including fire, and basic biophysical properties such as vegetation light absorption and greenness. In recent years, however, interest has rapidly increased in the area of biological diversity monitoring. This special issue of
Remote Sensing[
1] captures some of the latest thinking on how both traditional and newer mapping technologies can contribute to biodiversity monitoring and analysis.
The term biodiversity encompasses variation in the composition and functioning of life at scales ranging from genes to entire biomes. This special issue captures a critically important portion of this range. First, there has been an explosion of work at the “organismic” level with remote sensing. Large-area mapping and analysis of plant species was once considered highly unlikely; now we see a rolling out of methods and applications that bring the possibility to life. Several of the papers in the special issue report on the use of Light Detection and Ranging (LiDAR) and/or imaging spectroscopy (also known as hyperspectral remote sensing) for organismic remote sensing. LiDAR provides a quantitative, three-dimensional view of the vegetation, revealing the height of canopies, their branching and foliar distribution, and other properties. New LiDAR results indicate a fast expanding capability to detect and map species and communities, often with high precision and accuracy.
While LiDAR presents options for analyzing biodiversity via canopy structure, imaging spectroscopy provides an avenue for looking at plants through their detailed reflectance properties or “spectral traits”. In all plant canopies, spectral traits are determined by a combination of factors ranging in scale from the amount of foliage present (i.e., leaf area index) to the angular distribution of the foliage, and to the chemical composition of the leaves. Papers represented in the special issue repeatedly highlight the enormous leverage afforded by imaging spectroscopy for understanding species composition based on their often unique spectral traits. Several papers took organismic remote sensing to its current limits, by combining the structure and spectral properties derived from LiDAR and imaging spectroscopy, respectively, to derive highly accurate species maps. Such maps open the door for applications once considered out of reach, like geographically detailed analyses of plant community composition, beta and gamma diversity, and species-specific biomass patterns.
The special issue brings in another critically important element to the biodiversity monitoring challenge—rethinking the use of widely available, globally-relevant satellite data. Several authors advanced the use of workhorse sensors, such as NASA’s MODIS (Moderate Resolution Imaging Spectroradiometer) and Landsat, to push the frontier in biodiversity monitoring. Some studies focused on new ways of monitoring habitat, often combining Earth observation data with spatially-explicit climate and geological information. These results are powerful because they reveal the fundamental abiotic correlates with and controls over diversity at scales ranging from species to ecosystems, and from taxonomic composition to functional variation among taxa.
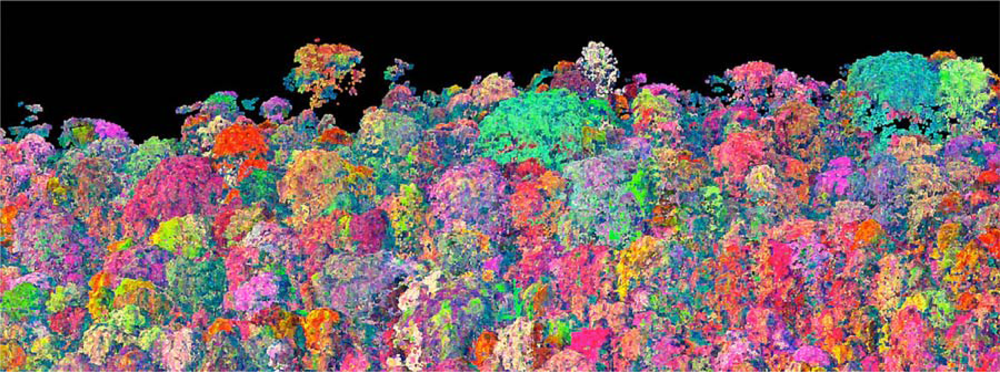
Finally, several papers presented biodiversity-monitoring advancements based on newer spaceborne technologies, including high spatial resolution and radar sensing. These studies demonstrate the enormous progress that can be achieved when enough effort is made to go to Earth orbit. These newer technologies, combined with a refreshed wave of the more traditional sensing systems such as Landsat 8 launching in February 2013, points to an ever more realistic future for biodiversity monitoring from space. Imagine what would be achievable with additional advanced technologies—particularly imaging spectroscopy and LiDAR (
Figure 1)—in the race to understand the non-linear changes underway in the composition of our unique biosphere.
Looking forward, I believe the most profound and societally important applications of biodiversity mapping will center on how the direct (
i.e., land cover change) and indirect (
i.e., climate change) impacts of human activities are altering the composition of our biosphere, and how changes in species composition mediate the services provided to humans by ecosystems. Through this understanding, we will not only more deeply appreciate the incredible biodiversity of our planet, but we will also gain a much clearer—and quantitative—understanding of how important biodiversity is to our survival. The unique studies presented in this special issue of
Remote Sensing[
1] represent another surge in the fast-moving current toward such a biodiversity monitoring future for Earth.

