Utility of Remotely Sensed Imagery for Assessing the Impact of Salvage Logging after Forest Fires


 ,
,
Abstract
:
1. Introduction
2. Study Areas and Data Sets
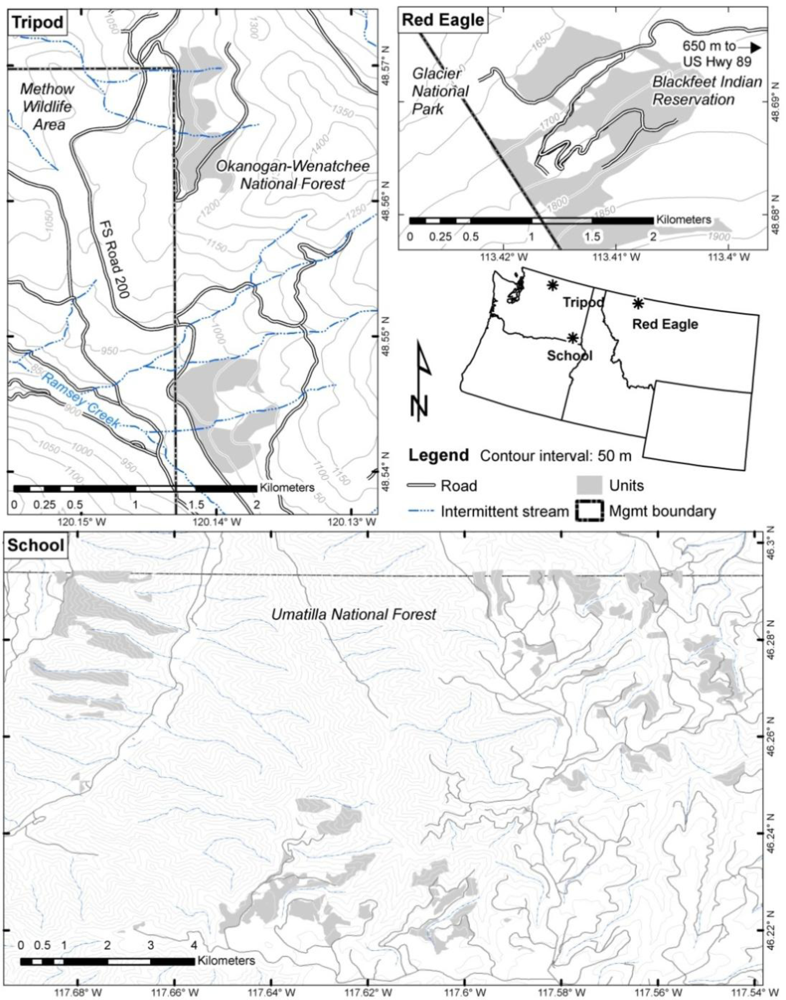
2.1. School Fire
2.2. Red Eagle Fire
2.3. Tripod Fire
2.4. Salvage Logging Operations
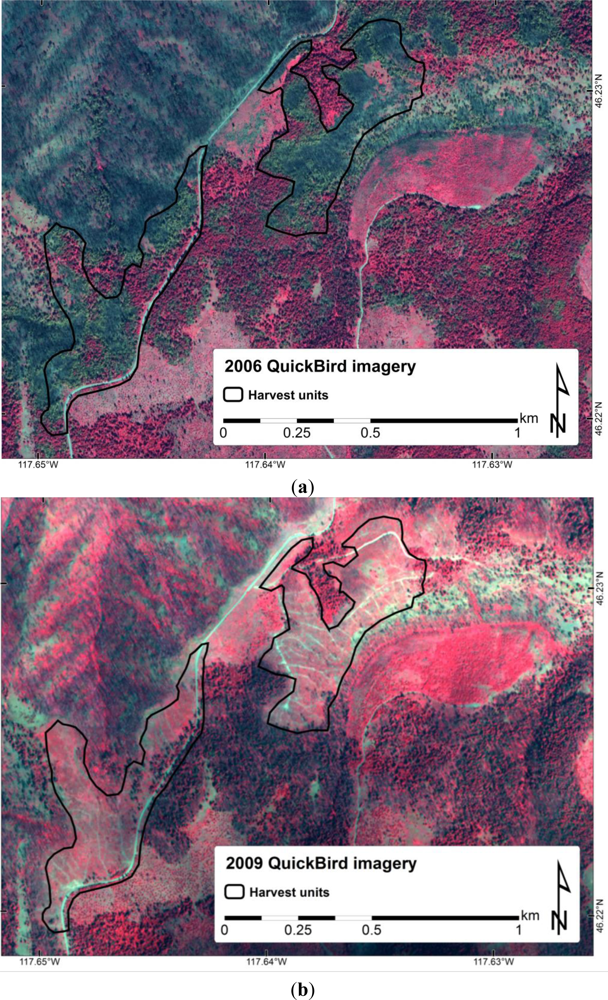
2.5. Remotely Sensed Imagery
3. Methods
3.1. Spectral Mixture Analysis (SMA)
3.2. Principal Components Analysis (PCA)
3.3. Statistics
4. Results
4.1 Exposed Soil Change at the School Fire
4.1.1. SMA Validation
4.1.2. PCA Validation
4.1.3. Modeling Soil Exposure and Disturbance
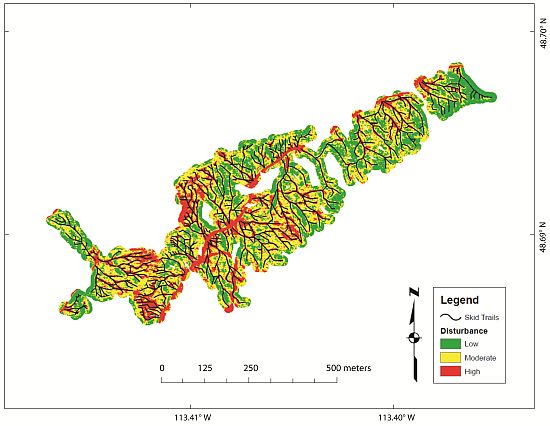
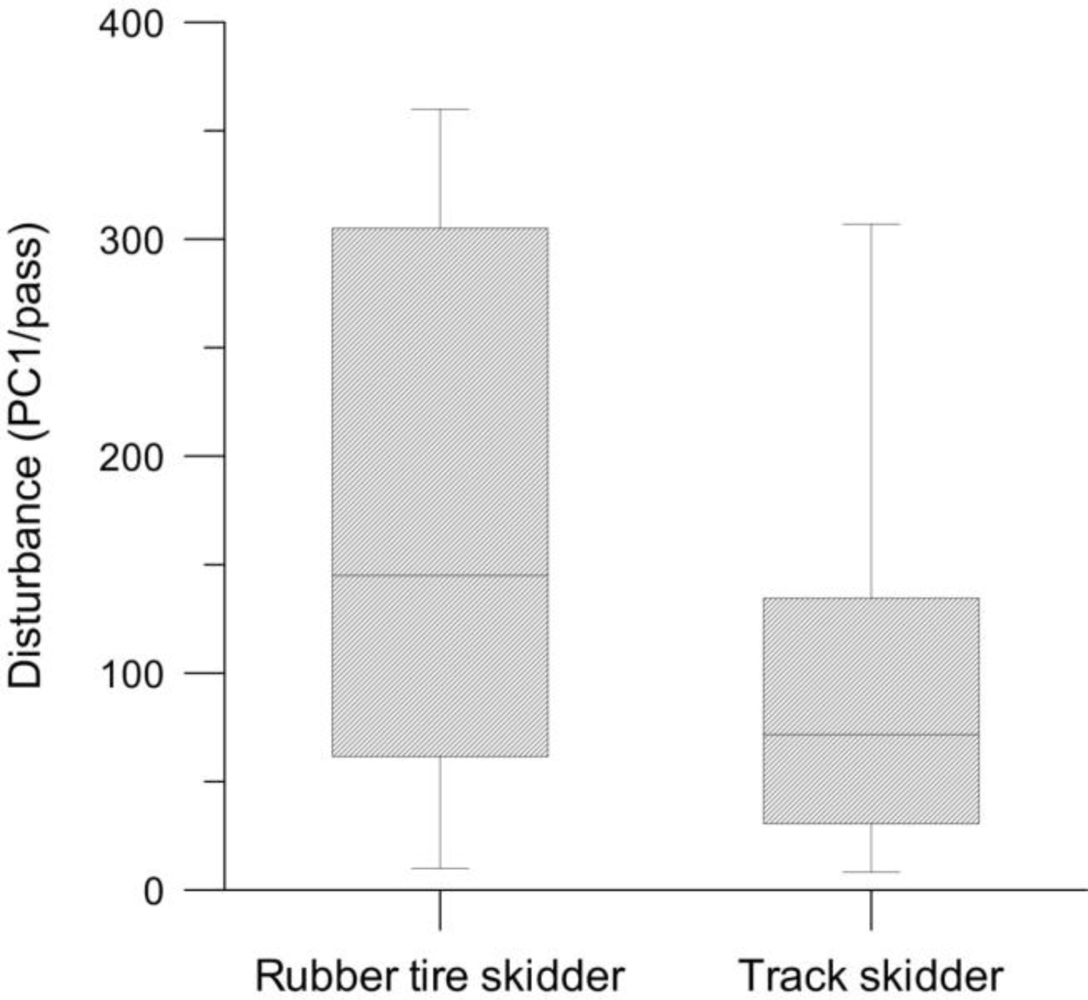
4.2. Soil Disturbance at the Red Eagle and Tripod Fires
5. Discussion
- Slope steepness and aspect, which interact with the view angle from the sensor and the sun elevation and azimuth angle in complex but quantifiable ways.
- Site-specific ‘albedo’ issues such as soil color and senesced vegetation.
- Spatial heterogeneity of the salvage sites—both from spatial variability in post-fire disturbance, spatial variability in salvage logging, and spatial variability in slash being placed after the skidder trails were no longer used—can lead to discrepancies between what was measured on the ground and inferred from the image. Also the influence of previous roads/trails.
- Plot geolocation errors and image georectification errors, which both contribute to errors in models relating field and remotely sensed data. The effect of mosaicing of several images (NAIP) of undocumented dates together likely produce edge-errors.
6. Conclusions
Acknowledgments
References
- Prestemon, J.P.; Wear, D.N.; Stewart, F.J.; Holmes, T.P. Wildfire, timber salvage, and the economics of expediency. Forest Policy Econ 2006, 8, 312–322. [Google Scholar]
- Beschta, R. L.; Rhodes, J.J.; Kauffman, J.B.; Gresswell, R.E.; Minshall, G.W.; Karr, J.R.; Perry, D.A.; Hauer, R.; Frissell, C.A. Postfire management on forested public lands of the western United States. Conserv. Biol 2004, 18, 957–967. [Google Scholar]
- Castro, J.; Moreno-Rueda, G.; Hodar, J.A. Experimental test of post fire management in pine forests: impact of salvage logging versus partial cutting and nonintervention on bird species assemblages. Conserv. Biol 2010, 24, 810–819. [Google Scholar]
- Karr, J.R.; Rohodes, J.J.; Minshall, G.W.; Hauer, F.R.; Beschta, R.L.; Frissell, C.A.; Perry, D.A. The effects of postfire salvage logging on aquatic ecosystems in the American west. BioScience 2004, 54, 1029–1033. [Google Scholar]
- Lindenmayer, D.B.; Foster, D.R.; Franklin, J.F.; Hunter, M.L.; Noss, R.F.; Schmiegelow, F.A.; Perry, D. Salvage harvesting policies after natural disturbance. Science 2004, 303, 1303. [Google Scholar]
- McIver, J.D.; Starr, L. A literature review of the environmental effects of post-fire logging. West. J. Appl. For 2001, 16, 159–168. [Google Scholar]
- Neary, D.G.; Ryan, K.C.; DeBano, L.F. (Eds.) Wildland Fire in Ecosystems: Effects of Fire on Soils and Water; Gen. Tech. Rep. RMRS-GTR-42-vol.4; Rocky Mountain Research Station, US Department of Agriculture, Forest Service: Ogden, UT, USA, 2005; p. 250.
- Parsons, A.; Robichaud, P.R.; Lewis, S.A.; Napper, C.; Clark, J.T. Field Guide for Mapping Post-Fire Soil Burn Severity; Gen. Tech. Rep. RMRS-GTR-243; Rocky Mountain Research Station, US Department of Agriculture, Forest Service: Fort Collins, CO, USA, 2010; p. 49. [Google Scholar]
- Shakesby, R.A.; Doerr, S.H. Wildfire as a hydrological and geomorphological agent. Earth-Sci. Rev 2006, 74, 269–307. [Google Scholar]
- Cobb, T.P.; Morissette, J.L.; Jacobs, J.M.; Koivula, M.J.; Spence, J.R.; Langor, D.W. Effects of postfire salvage logging on deadwood-associated beetles. Conserv. Biol 2011, 25, 94–104. [Google Scholar]
- Lindenmayer, D. Salvage harvesting—Past lessons and future issues. For. Chron 2006, 82, 48–53. [Google Scholar]
- Peterson, D.L.; Agee, J.K.; Aplet, G.H.; Dykstra, D.P.; Graham, R.T.; Lehmkuhl, J.F.; Pilliod, D.S.; Potts, D.F.; Powers, R.F.; Stuart, J.D. Effects of Timber Harvest Following Wildfire in Western North America; Gen. Tech. Rep. PNW-GTR-776; Pacific Northwest Research Station, US Department of Agriculture, Forest Service: Portland, OR, USA, 2009; p. 51. [Google Scholar]
- Benavides-Solorio, J.D.; MacDonald, L.H. Measurement and prediction of post-fire erosion at the hillslope scale, Colorado Front Range. Int. J. Wildland Fire 2005, 14, 1–18. [Google Scholar]
- Moody, J.A.; Martin, D.A. Initial hydrologic and geomorphic response following a wildfire in the Colorado Front Range. Earth Surf. Proc. Landf 2001, 26, 1049–1070. [Google Scholar]
- DeBano, L.F. The role of fire and soil heating on water repellency in wildland environments: A Review. J. Hydrol 2000, 231–232, 195–206. [Google Scholar]
- Robichaud, P. R. Fire effects on infiltration rates after prescribed fire in northern Rocky Mountain forests, USA. J. Hydrol 2000, 231–232, 220–229. [Google Scholar]
- Lindenmayer, D.; McCarthy, M.A. Congruence between natural and human forest disturbance: a case study from Australian montane ash forests. For. Ecol. Manag 2002, 155, 319–335. [Google Scholar]
- Silins, U.; Stone, M.; Emelko, M.B.; Bladon, K.D. Sediment production following severe wildfire and post-fire salvage logging in the Rocky Mountain headwaters of the Oldman River basin, Alberta. Catena 2009, 79, 189–197. [Google Scholar]
- Klock, G.O. Impact of five post-fire salvage logging systems on soils and vegetation. J. Soil Water Conserv 1975, 30, 78–81. [Google Scholar]
- Roberts, M.R. A conceptual model to characterize disturbance severity in forest harvests. For. Ecol. Manag 2007, 242, 58–64. [Google Scholar]
- Robichaud, PR; Lewis, S.A.; Lentile, L.; Morgan, P.; Hudak, A. Invasive Species Response to Fire and Post-Fire Rehabilitation Following the 2005 School Fire, Umatilla National Forest, A Rapid Response Project, (JFSP # 06-1-02-03); Final Report to the Joint Fire Science Program; Boise, ID, USA, 2010; 23.
- Hamilton, R.; Johnson, V.; Hunt, E.R., Jr.; Gillham, J.; Schrader-Patton, C.; Dewey, S.A.; Everitt, J.H. A Weed Manager’s Guide to Remote Sensing and GIS; Rep. No. RSAC-0077. Remote Sensing Applications Center, US Department of Agriculture, Forest Service: Salt Lake City, UT, USA, 2005. Available online: http://www.fs.fed.us/eng/rsac/invasivespecies/ (accessed on 1 August 2011).
- Goetz, S.J.; Wright, R.; Smith, A.J.; Zinecker, E.; Schaub, E. IKONOS imagery for resource management: tree cover, impervious surface, and riparian buffer analyses in the Mid-Atlantic Region. Remote Sens. Environ 2003, 88, 195–208. [Google Scholar]
- Chirici, G.; Corona, P. An overview of passive remote sensing for post-fire monitoring. Forest. 2005, 2, pp. 282–289. Available: http://www.sisef.it/forest/show.php?id=305 (accessed on 1 August 2011).
- Corona, P.; Lamonaca, A.; Chirici, G. Remote sensing support for post fire forest management. iForest. 2008, 1, pp. 6–12. Available online: http://www.sisef.it/iforest/show.php?id=305 (accessed on 1 August 2011).
- Robichaud, P.R.; Lewis, S.A.; Laes, D.Y.M.; Hudak, A.T.; Kokaly, R.F.; Zamudio, J.A. Postfire soil burn severity mapping with hyperspectral image unmixing. Remote Sens. Environ 2007, 108, 467–480. [Google Scholar]
- Lewis, S.A.; Lentile, L.B.; Hudak, A.T.; Robichaud, P.R.; Morgan, P.; Bobbit, M.J. Mapping ground cover using hyperspectral remote sensing after the 2003 Simi and Old wildfires in southern California. Fire Ecol 2007, 3, 109–128. [Google Scholar]
- Adams, J.B.; Smith, M.O.; Johnson, P.E. Spectral mixture modeling: A new analysis of rock and soil types at the Viking Lander 1 Site. J. Geophys. Res 1986, 91, 8098–8112. [Google Scholar]
- Roberts, D.A.; Smith, M.O.; Adams, J.B. Green vegetation, nonphotosynthetic vegetation and soils in AVIRIS data. Remote Sens. Environ 1993, 44, 255–269. [Google Scholar]
- Smith, M.O.; Ustin, S.L.; Adams, J.B.; Gillespie, A.R. Vegetation in deserts: I. A regional measure of abundance from multi-spectral images. Remote Sens. Environ 1990, 31, 1–26. [Google Scholar]
- Townshend, J.R.G.; Huang, C.; Kalluri, S.N.V.; Defries, R.S.; Liang, S. Beware of per-pixel characterization of land cover. Int. J. Remote Sens 2000, 21, 839–843. [Google Scholar]
- Theseira, M.A.; Thomas, G.; Taylor, J.C.; Gemmell, F.; Varjo, J. Sensitivity of mixture modeling to end-member selection. Int. J. Remote Sens 2003, 24, 1559–1575. [Google Scholar]
- Byrne, G.F.; Crapper, P.F.; Mayo, K.K. Monitoring land-cover change by principal component analysis of multitemporal landsat data. Remote Sens. Environ 1980, 10, 175–184. [Google Scholar]
- Richards, J.A. Remote Sensing Digital Image Analysis: An Introduction, 2nd ed.; Springer-Verlag: New York, NY, USA, 1993; p. 340. [Google Scholar]
- Lentile, L.B.; Morgan, P.; Hudak, A.T.; Bobbitt, M.J.; Lewis, S.A.; Smith, A.M.S.; Robichaud, P.R. Post-fire burn severity and vegetation response following eight large wildfires across the Western United States. Fire Ecol 2007, 3, 91–108. [Google Scholar]
- Key, C.H.; Benson, N.C. Landscape Assessment: Sampling and Analysis Methods. In FIREMON: Fire Effects Monitoring and Inventory System; Lutes, D.C., Ed.; RMRS-GTR-164-CD; Rocky Mountain Research Station, US Department of Agriculture, Forest Service: Fort Collins, CO, USA, 2006; pp. 219–273. [Google Scholar]
- Bauer, D.F. Constructing confidence sets using rank statistics. J. Amer. Stat. Assn 1972, 67, 687–690. [Google Scholar]
- Hudak, A.T.; Morgan, P.; Bobbitt, M.J.; Smith, A.M.S.; Lewis, S.A.; Lentile, L.B.; Robichaud, P.R.; Clark, J.T.; McKinley, R.A. The relationship of multispectral satellite imagery to immediate fire effects. Fire Ecol 2007, 3, 64–90. [Google Scholar]
- Serrano-Ortiz, P.; Marañón-Jiménez, S.; Reverter, B.R.; Sánchez-Cañete, E.P.; Castro, J.; Zamora, R.; Kowalski, A.S. Post-fire salvage logging reduces carbon sequestration in Mediterranean coniferous forest. For. Ecol. Manag 2011, 262, 2287–2296. [Google Scholar]
- Hudak, A.T.; Brockett, B.H. Mapping fire scars in a southern African savannah using Landsat imagery. Int. J. Remote Sens 2004, 25, 3231–3243. [Google Scholar]


| Wildfire (Elevation, m) | Soil Series (Taxonomic Class) | Texturea | Parent Material | Bulk Density (g·cm −3) | Overstory Species | Understory Species | ||
|---|---|---|---|---|---|---|---|---|
| 0–5 cm | 5–10 cm | |||||||
| School (1500) | Klicker (loamy-skeletal, isotic, frigid Vitrandic Argixerolls) | ashy silt loam | Basalt | High slope | 0.93 | 1.01 | Douglas-fir (Pseudotsuga menziesii) Grand fir (Abies grandis) | Bluebunch wheatgrass (Psuedorogneria spicata) Pinegrass (Calamagrostis rubescens) Geyers sedge (Carex geyeri) |
| Low slope | 0.69 | 0.78 | ||||||
| Red Eagle (1797) | Tenex (loamy-skeletal, mixed, superactive Spodic Dystrocryepts) | sandy loam | Argillite | 0.73 | 1.13 | Lodgepole pine(Pinus contorta) Douglas-fir (Pseudotsuga menziesii) | Grouse whortleberry (Vaccinium scoparium) Twinflower (Linnaea borealis) | |
| Tripod (1500) | Wapal, Brevco (sandy-skeletal, isotic, frigid Vitrandic Haploxerepts) (loamy-skeletal, isotic, frigid Vitrandic Haploxerepts) | very stony ashy coarse sandy loam | Mixed volcanic ash over glacial outwash | 1.31 | 1.0 | Douglas-fir (Pseudotsuga menziesii) Ponderosa pine (Pinus ponderosa) | Pinegrass (Calamagrostis rubescens) Crested wheatgrass (Agropyron cristatum) | |
| Wildfire/ Land Ownership | Fire start | Burn Severity | Salvage Harvest Date(s) | Field Sampling Date(s) | Equipment Used | Imagery [year] | Image Analysis | |
|---|---|---|---|---|---|---|---|---|
| Pre-salvage | Post-salvage | |||||||
| School/Umatilla National Forest | August 2005 | Low | Fall 2006 | Summer 2006–2009 | Track feller buncher, forwarder | NAIP, QB [2006] | NAIP, QB [2009] | PCA – pre- and post-harvest; SMA – pre- and post-harvest |
| Moderate | Spring, Summer 2007 | |||||||
| High | ||||||||
| Red Eagle/ Blackfeet Tribe | July 2006 | High | Spring, summer 2007 | Summer 2007 | Track feller buncher, rubber tire skidder, track skidder | — | NAIP [2009] | PCA – post-harvest |
| Tripod/ Wenatchee-Okanogan National Forest | July 2006 | High | Fall, winter 2008 | Summer 2010 | Track feller buncher, track skidder | — | NAIP [2009] | PCA – post-harvest |
| Imagery | Platform | Spectral Bands Used [Other Bands Available] | Resolution (nominal) | Acquisition Dates | Calibration Capabilities |
|---|---|---|---|---|---|
| QuickBird-2 | Satellite, multi-image mosaic | Blue, Green, Red, NIR [Panchromatic] | Panchromatic: 0.65m | 25 June 2006 | Radiometric balancing for multiple scene mosaics and conversion to top-of-atmosphere spectral reflectance; Orthorectified |
| Multi-spectral: 2.5m | 31 July 2009 | ||||
| NAIP (Montana, Washington) | Aerial, multi-image mosaic | Blue, Green, Red [NIR] | 1m | 10 June–15 August 2006* | Orthorectified |
| Harvest Status | Burn Severity | N | QuickBird SMA | QuickBird PCA | NAIP PCA | |||
|---|---|---|---|---|---|---|---|---|
| 2006 | 2009 | 2006 | 2009 | 2006 | 2009 | |||
| Cut | All | 53 | 0.45 | 0.73 | 405 | 515 | 212 | 160 |
| Cut | Low | 22 | 0.48 | 0.73 | 433 | 499 | 209 | 157 |
| Cut | Moderate | 19 | 0.45 | 0.71 | 403 | 511 | 217 | 152 |
| Cut | High | 12 | 0.40 | 0.76 | 354 | 550 | 212 | 179 |
| Uncut | All | 34 | 0.40 | 0.50 | 391 | 492 | 205 | 130 |
| Uncut | Low | 17 | 0.38 | 0.34 | 411 | 441 | 192 | 114 |
| Uncut | Moderate | 8 | 0.40 | 0.59 | 381 | 527 | 212 | 143 |
| Uncut | High | 9 | 0.41 | 0.71 | 362 | 559 | 222 | 147 |
| Image Analysis and Year | Status | Burn Severity | |||
|---|---|---|---|---|---|
| Cut | Uncut | Low | Moderate | High | |
| SMA soil 2006 | 0.44a | 0.40b | 0.43a | 0.42a | 0.41a |
| SMA soil 2009 | 0.74a | 0.55b | 0.54b | 0.65a | 0.74a |
| QB PC 2006 | 397a | 385a | 422a | 392b | 358b |
| QB PC 2009 | 520a | 513a | 475b | 519ab | 555b |
| NAIP PC 2006 | 213a | 208a | 199b | 214a | 217a |
| NAIP PC 2009 | 163a | 134b | 134b | 148ab | 163a |
| Image Analysis and Year | Status | |
|---|---|---|
| Cut | Uncut | |
| SMA soil 2009 | 0.84a | 0.40b |
| QB PC 2009 | 416a | 377a |
| NAIP PC 2009 | 123a | 87b |
Share and Cite
Lewis, S.A.; Robichaud, P.R.; Hudak, A.T.; Austin, B.; Liebermann, R.J. Utility of Remotely Sensed Imagery for Assessing the Impact of Salvage Logging after Forest Fires. Remote Sens. 2012, 4, 2112-2132. https://doi.org/10.3390/rs4072112
Lewis SA, Robichaud PR, Hudak AT, Austin B, Liebermann RJ. Utility of Remotely Sensed Imagery for Assessing the Impact of Salvage Logging after Forest Fires. Remote Sensing. 2012; 4(7):2112-2132. https://doi.org/10.3390/rs4072112
Chicago/Turabian StyleLewis, Sarah A., Peter R. Robichaud, Andrew T. Hudak, Brian Austin, and Robert J. Liebermann. 2012. "Utility of Remotely Sensed Imagery for Assessing the Impact of Salvage Logging after Forest Fires" Remote Sensing 4, no. 7: 2112-2132. https://doi.org/10.3390/rs4072112
APA StyleLewis, S. A., Robichaud, P. R., Hudak, A. T., Austin, B., & Liebermann, R. J. (2012). Utility of Remotely Sensed Imagery for Assessing the Impact of Salvage Logging after Forest Fires. Remote Sensing, 4(7), 2112-2132. https://doi.org/10.3390/rs4072112