Towards Deeper Measurements of Tropical Reefscape Structure Using the WorldView-2 Spaceborne Sensor

Abstract
:
1. Introduction
2. Methodology
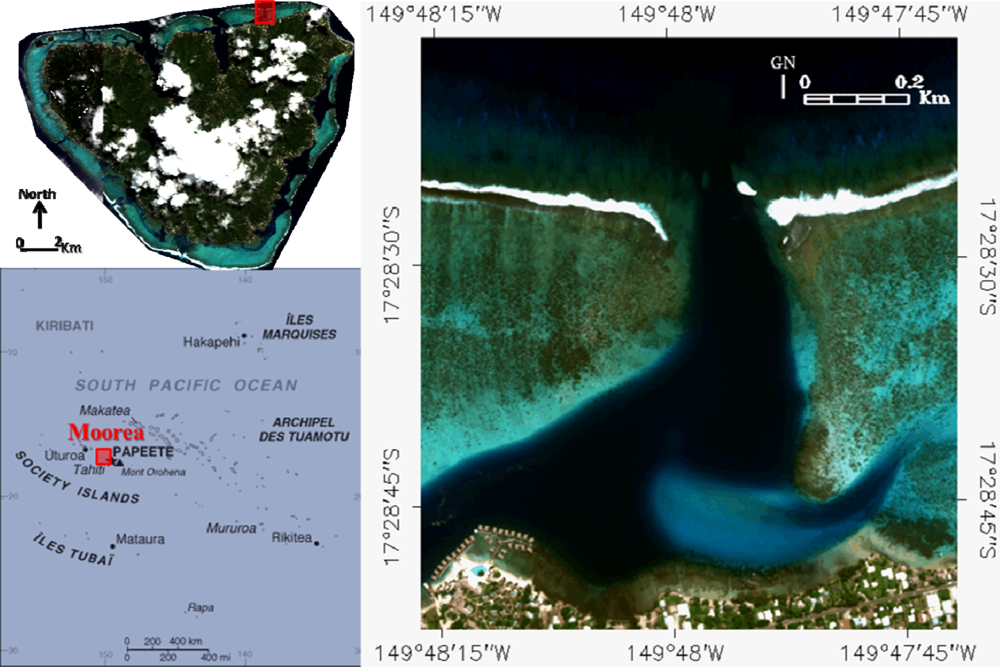
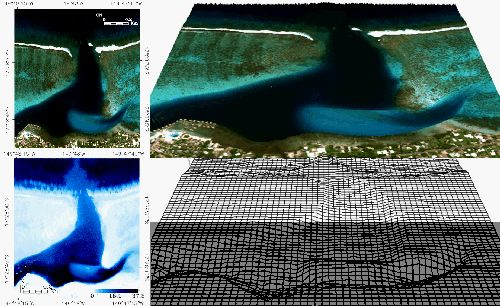
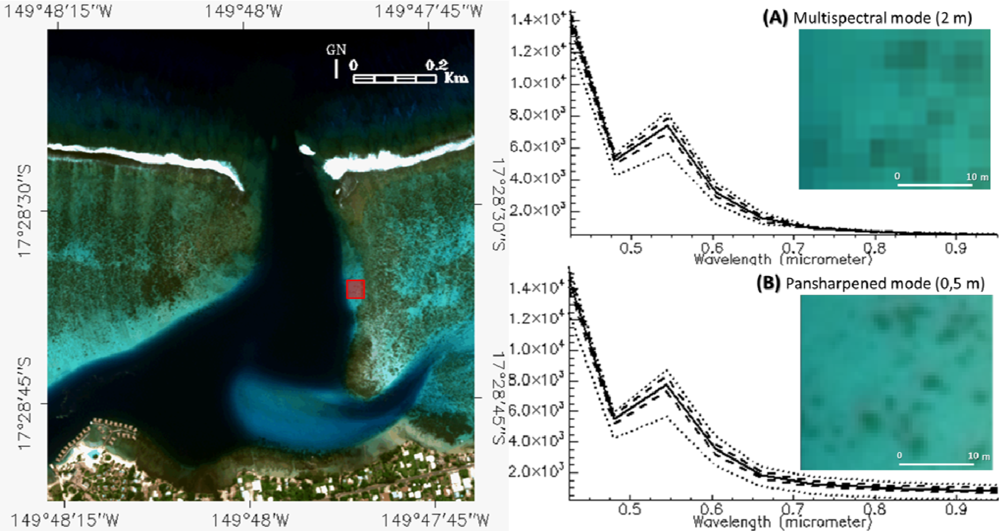
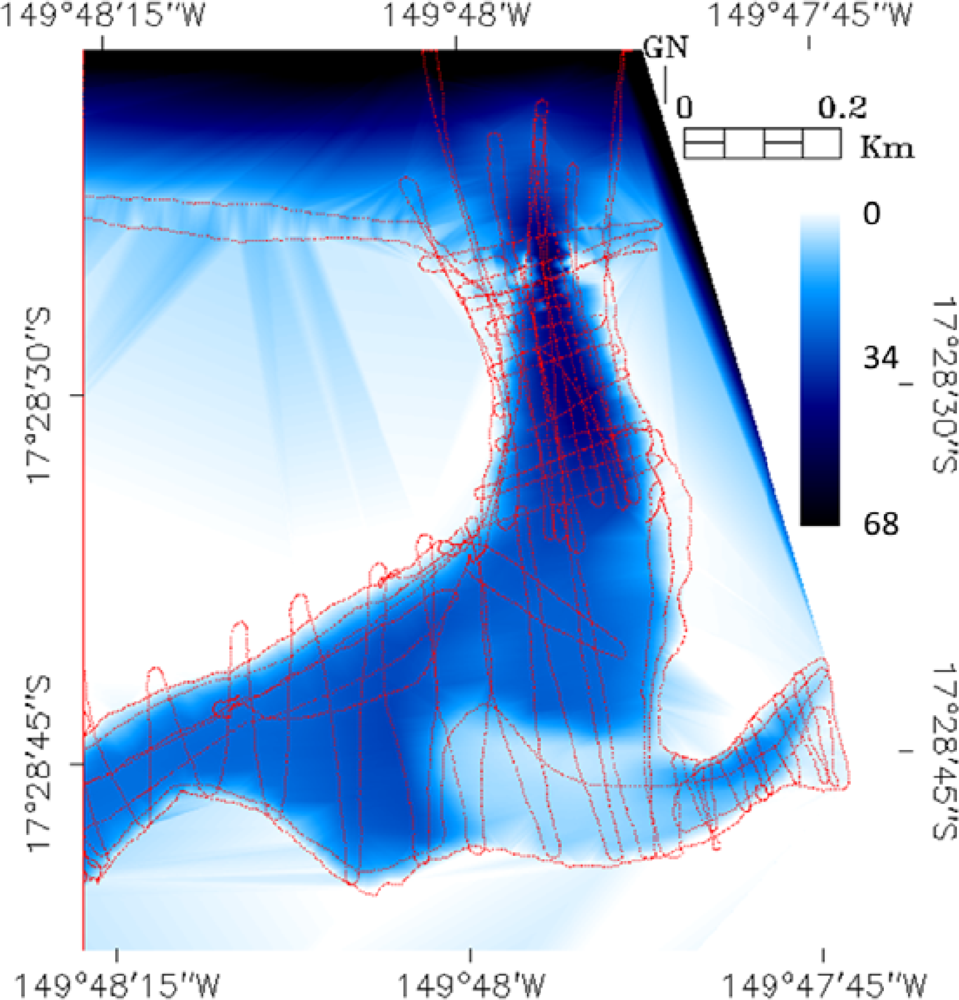
2.1. Study Area
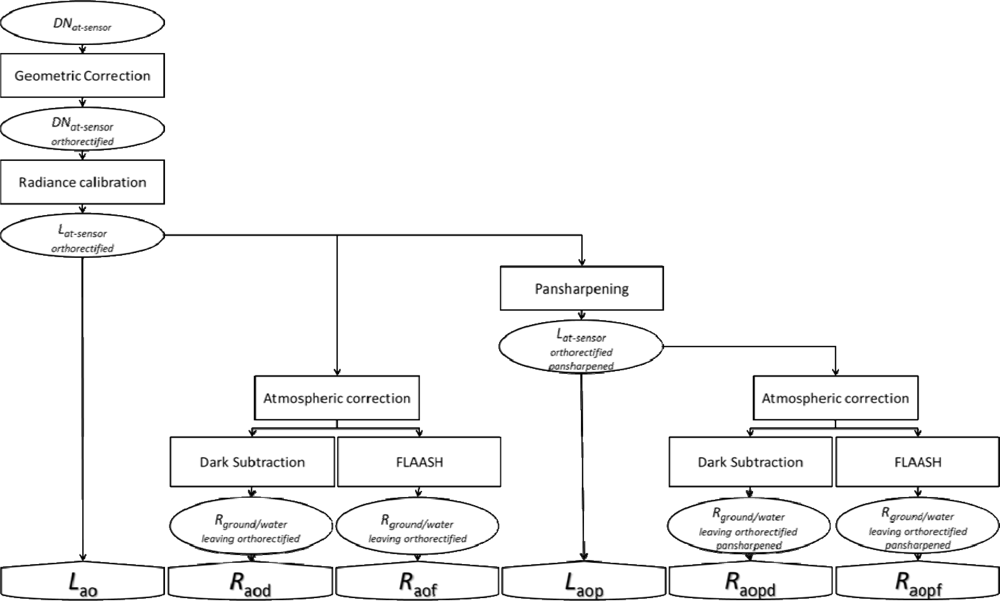
2.2. Image Acquisition and Processing
2.2.1. WorldView-2 Spaceborne Multispectral Data
2.2.2. Pansharpening
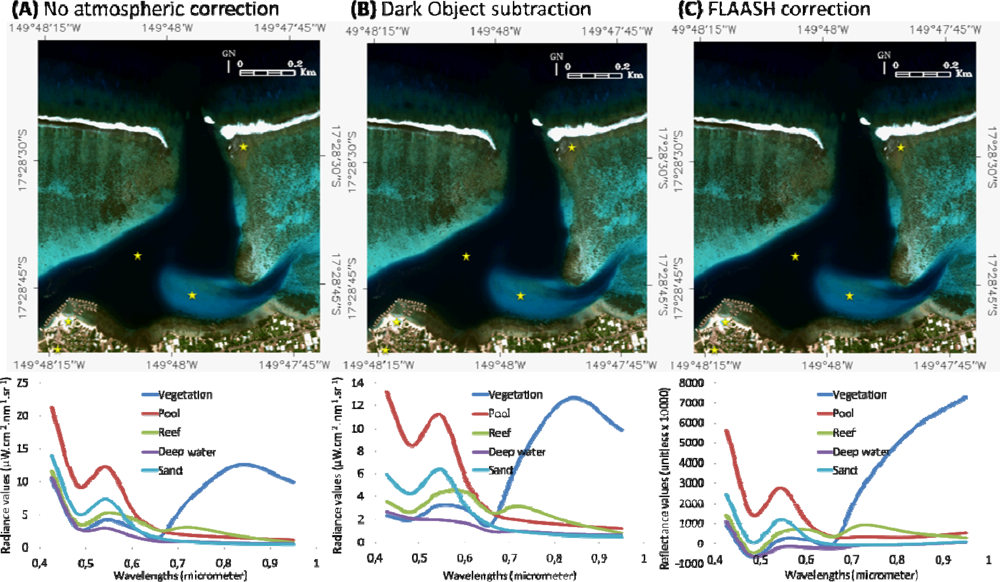
2.2.3. Atmospheric Correction
2.2.4. Bathymetry Retrieval
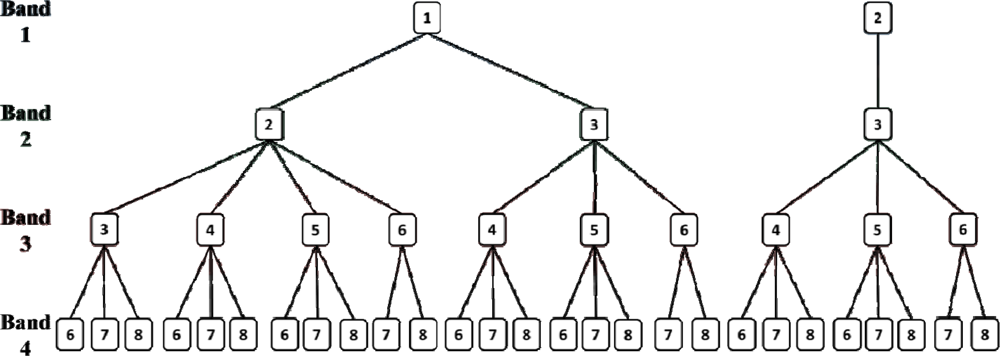
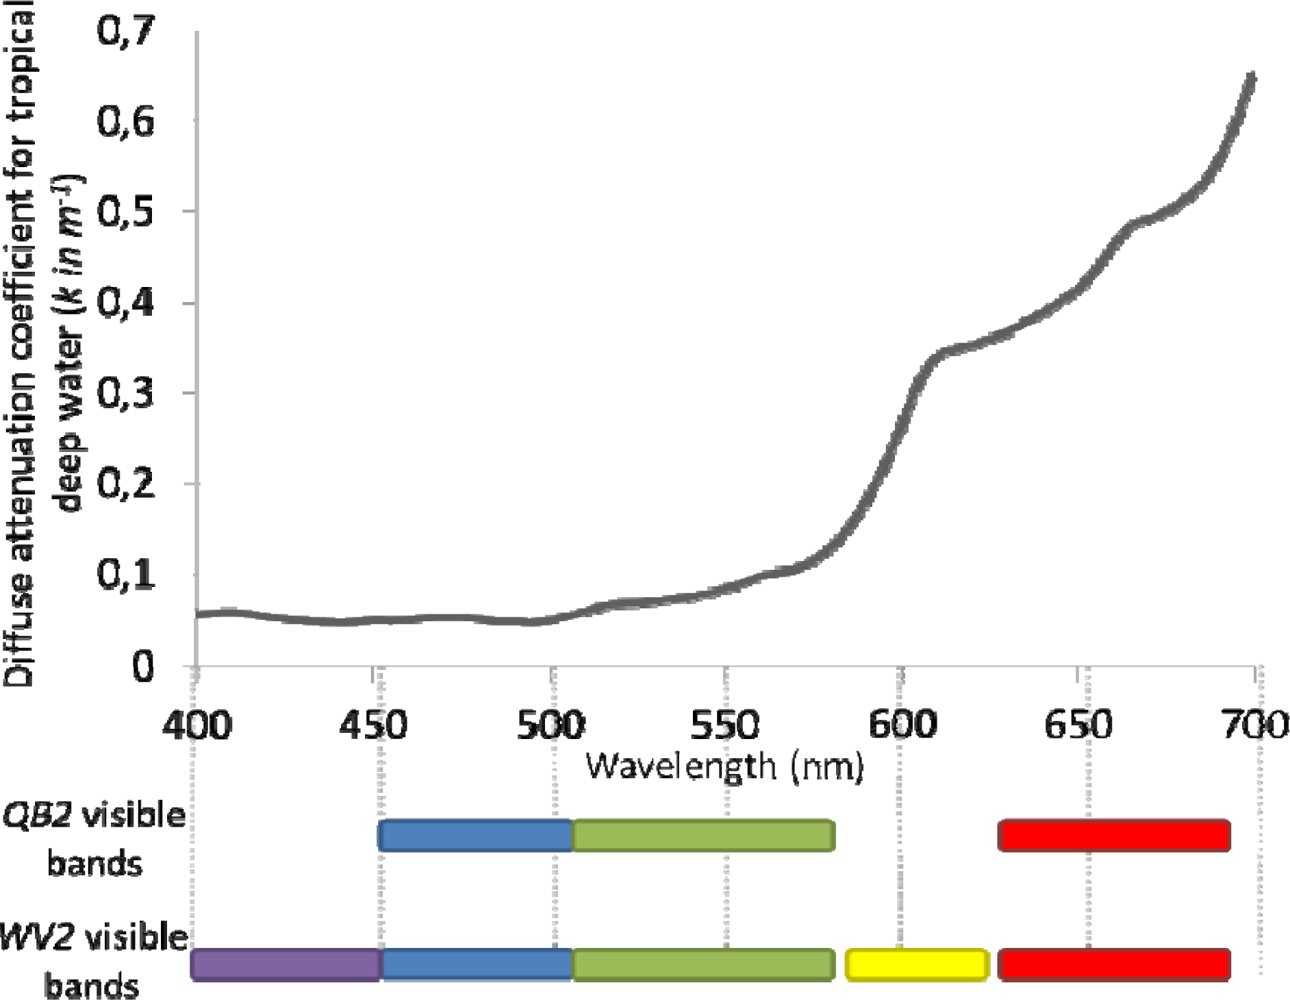
2.3. Spectral Combinations
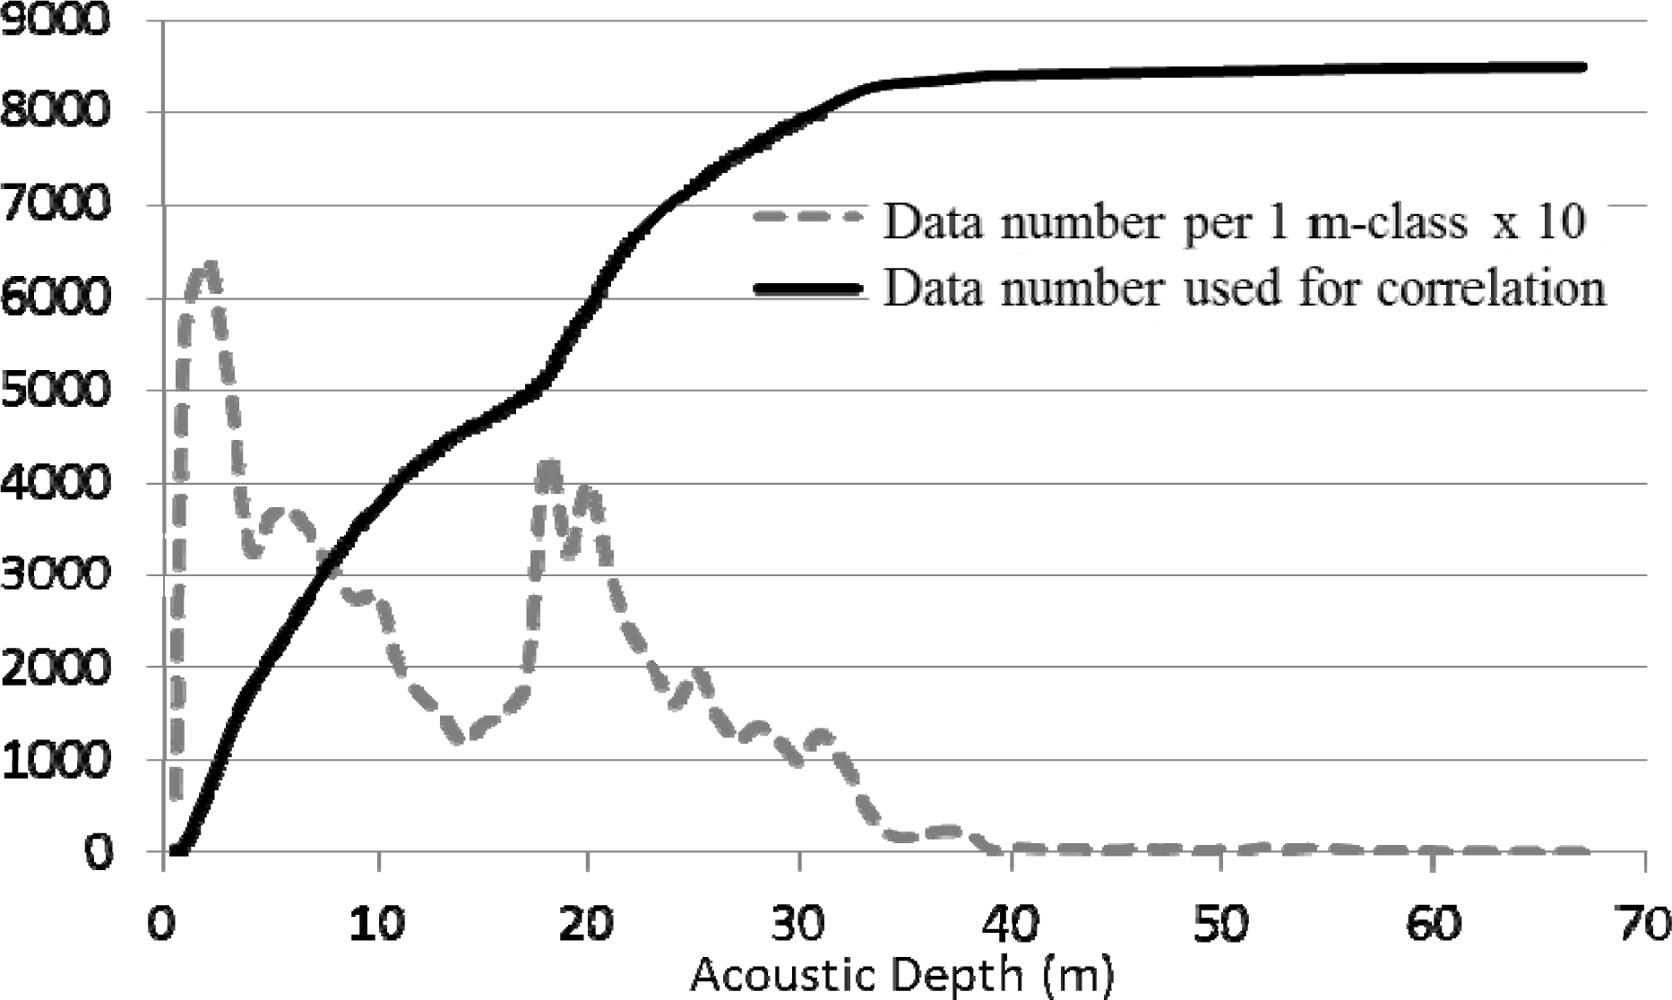
2.4. Acoustic Ground-Truthing
3. Results
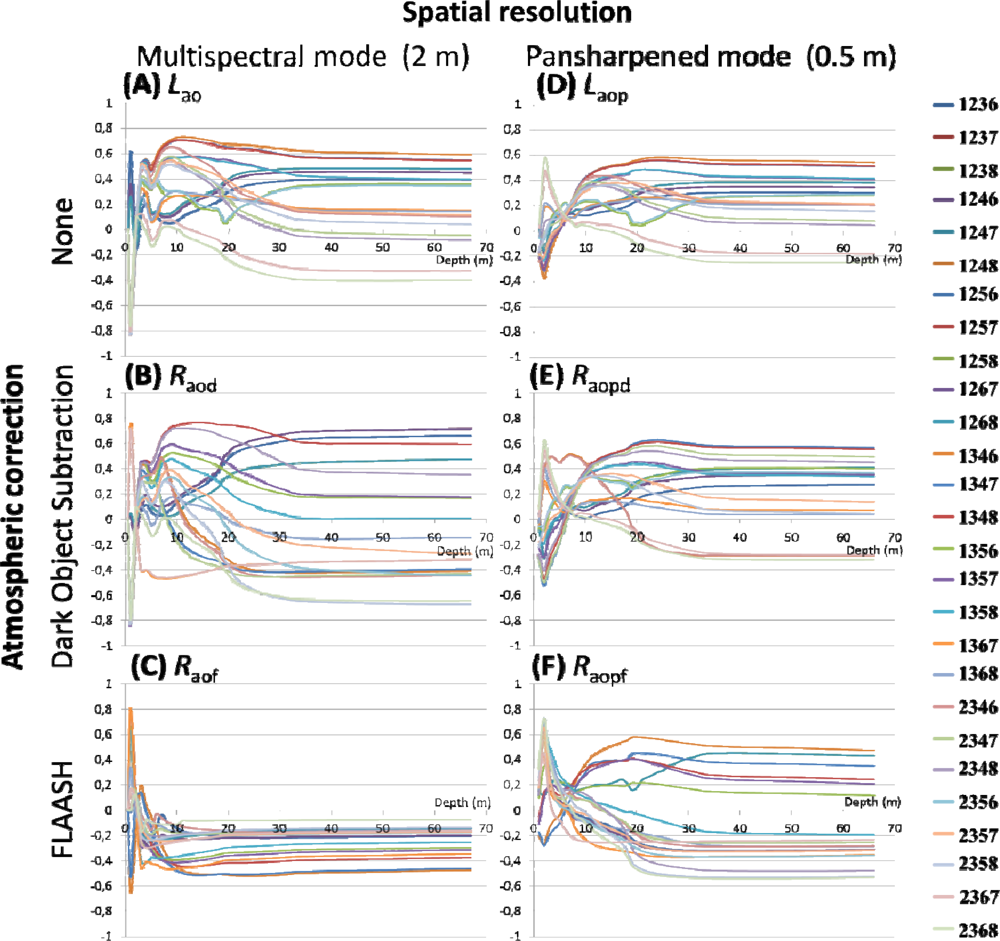
3.1. Performance of the Spectral Band Combinations
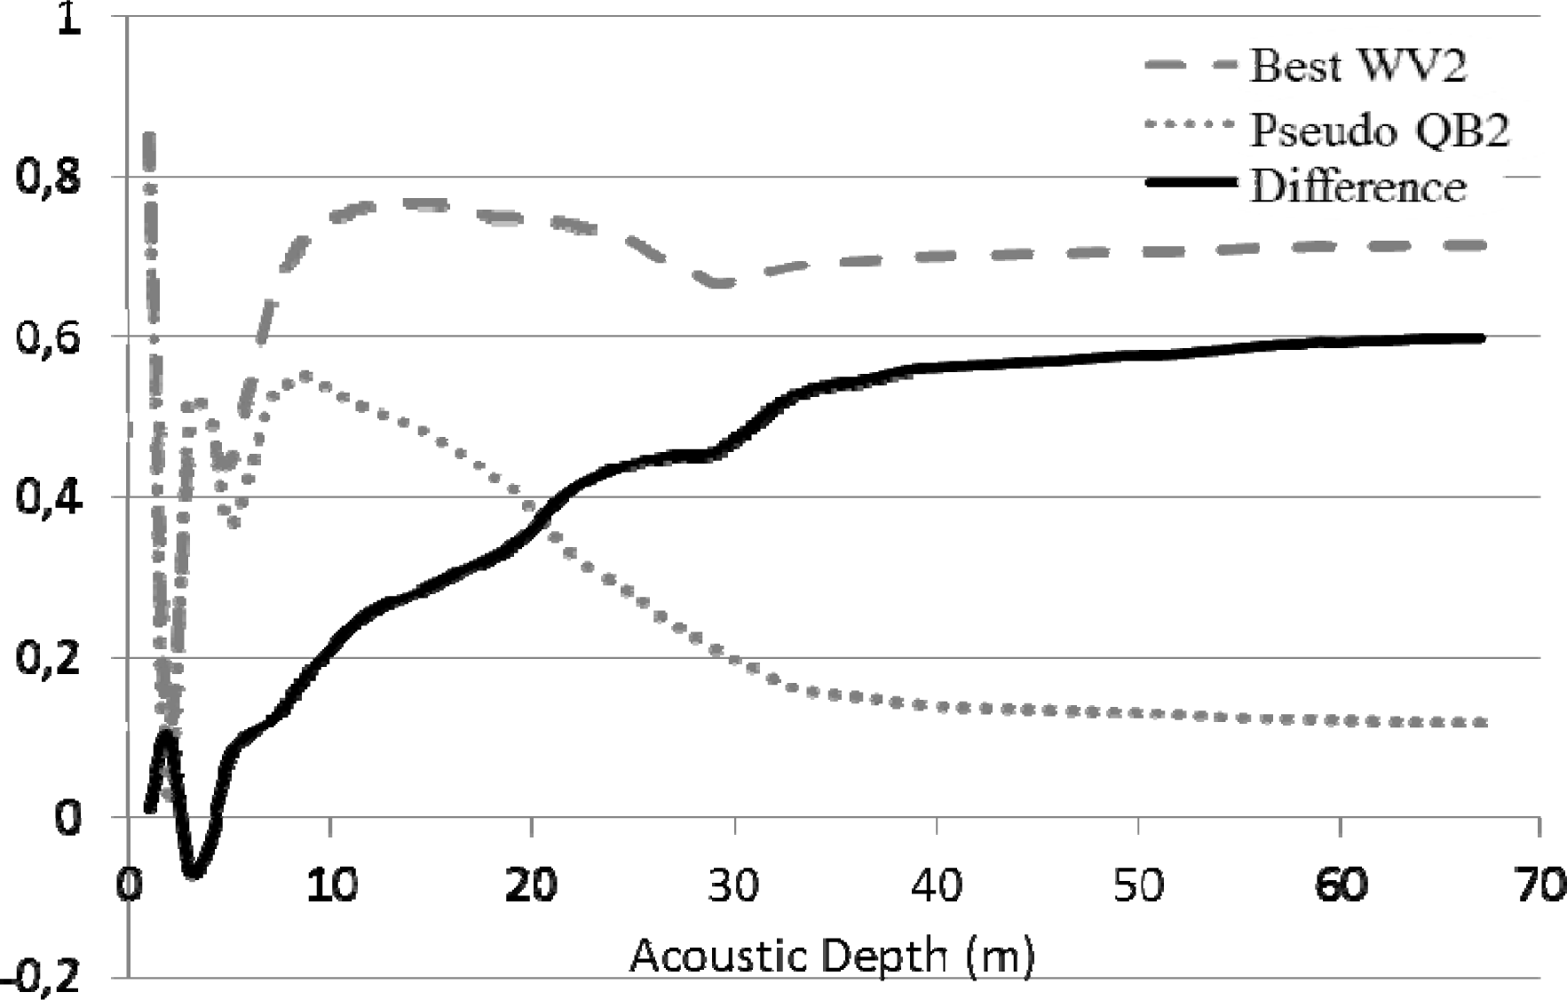
3.1.1. Influence of Spatial Resolution on Bathymetry Retrieval
3.1.2. Influence of the Atmospheric Correction on Bathymetry Retrieval
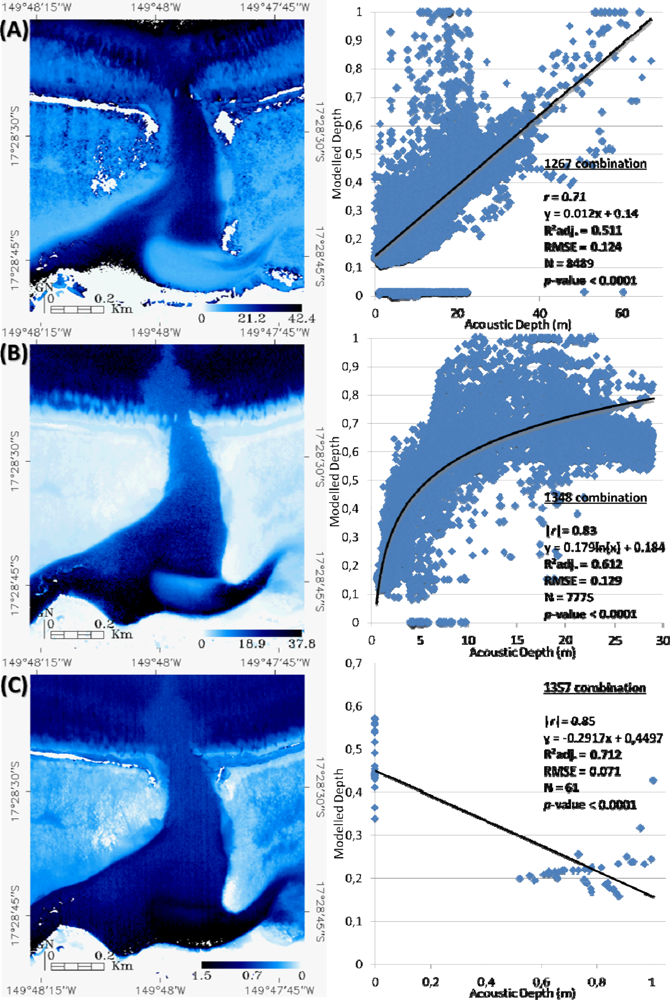
3.2. Mapping the Bathymetry Using the Best Spectral Band Combinations
4. Discussion
4.1. Differential Contributions of the Pansharpening and Atmospheric Corrections
4.2. Spectral Enhancement Implied a Refinement of the Bathymetry Retrieval
4.3. Towards an Improved Solution for Benthic Albedo
5. Conclusions
Acknowledgments
References
- Mumby, P.J.; Skirving, W.; Strong, A.E.; Hardy, J.T.; LeDrew, E.F.; Hochberg, E.J.; Stumpf, R.P.; David, L.T. Remote sensing of coral reefs and their physical environment. Mar. Pollut. Bull 2004, 48, 219–228. [Google Scholar]
- Guenther, G.C.; Brooks, M.W.; LaRocque, P.E. New capabilities of the “SHOALS” airborne lidar bathymeter. Remote Sens. Environ 2000, 73, 247–255. [Google Scholar]
- Isoun, E.; Fletcher, C.; Frazer, N.; Gradie, J. Multi-spectral mapping of reef bathymetry and coral cover, Kailua Bay, Hawaii. Coral Reefs 2003, 22, 68–82. [Google Scholar]
- Louchard, E.M.; Reid, R.P.; Stephens, F.C.; Davis, C.O.; Leathers, R.A.; Downes, T.V. Optical remote sensing of benthic habitats and bathymetry in coastal environments at Lee Stocking Island, Bahamas: A comparative spectral classification approach. Limnol. Oceanogr 2003, 48, 511–521. [Google Scholar]
- Mishra, D.R.; Narumalani, S.; Rundquist, D.; Lawson, M.; Perk, R.J. Enhancing the detection and classification of coral reef and associated benthic habitats: A hyperspectral remote sensing approach. J. Geophys. Res 2007, 112, C08014. [Google Scholar]
- Mishra, D.; Narumalani, S.; Rundquist, D.; Lawson, M. Benthic habitat mapping in tropical marine environments using QuickBird multispectral data. Photogramm. Eng. Remote Sensing 2006, 72, 1037–1048. [Google Scholar]
- Collin, A.; Planes, S. Highlighting three reef-building coral communities’ health state using spectral diversity indices from WorldView-2 imagery. Remote Sens. Environ 2011. submitted.. [Google Scholar]
- Gianinetto, M.; Lechi, G. A DNA Algorithm for the Bathymetric Mapping in the Lagoon of Venice Using QuickBird Multispectral Data. Proceedings of the XXXVth ISPRS Congress, Istanbul, Turkey, 12–23 July 2004. Paper 18.
- Adler-Golden, S.M.; Acharya, P.K.; Berk, A.; Matthew, M.W.; Gorodetzky, D. Remote bathymetry of the littoral zone from AVIRIS, LASH, and QuickBird imagery. IEEE Trans. Geosci. Remote Sens 2005, 43, 337–347. [Google Scholar]
- Collin, A.; Chancerelle, Y.; Pouteau, R. The Reefscape Ecology in the Middle of the Southern Pacific: Confluence of the Polynesia Mana Network and Very High Resolution Satellite. In Seascapes: Views and Actions; French Agency of Marine Protected Areas, Ed.; Springer: Berlin/Heidelberg, Germany, 2011. [Google Scholar]
- Lyzenga, D.R. Passive remote sensing techniques for mapping water depth and bottom features. Appl. Opt 1978, 17, 379–383. [Google Scholar]
- Philpot, W.D. Bathymetric mapping with passive multispectral imagery. Appl. Opt 1989, 28, 1569–1578. [Google Scholar]
- Lyons, M.; Phinn, S.; Roelfsema, C. Integrating Quickbird multi-spectral satellite and field fata: Mapping bathymetry, seagrass cover, seagrass species and change in Moreton Bay, Australia in 2004 and 2007. Remote Sens 2011, 3, 42–64. [Google Scholar]
- Lee, Z.P.; Carder, K.L.; Arnone, R.A. Deriving inherent optical properties from water color: A multiband quasi-analytical algorithm for optically deep waters. Appl. Opt 2002, 41, 5755–5772. [Google Scholar]
- Stumpf, R.P.; Holderied, K.; Sinclair, M. Determination of water depth with high-resolution satellite imagery over variable bottom types. Limnol. Oceanogr 2003, 48, 547–556. [Google Scholar]
- Hench, J.L.; Leichter, J.J.; Monismith, S.G. Episodic circulation and exchange in a wave-driven coral reef and lagoon system. Limnol. Oceanogr 2008, 53, 2681–2694. [Google Scholar]
- Adam, T.C.; Schmitt, R.J.; Holbrook, S.J.; Brooks, A.J.; Edmunds, P.J.; Carpenter, R.C.; Bernardi, G. Herbivory, connectivity, and ecosystem resilience: Response of a coral reef to a large-scale perturbation. PLoS One 2011, 6, e23717. [Google Scholar]
- Maritorena, S.; Morel, A.; Gentili, B. Diffuse reflectance of oceanic shallow waters: Influence of water depth and bottom albedo. Limnol. Oceanogr 1994, 39, 1689–1703. [Google Scholar]
- González-Audícana, M.; Otazu, X.; Fors, O.; Alvarez-Mozos, J. A low computational-cost method to fuse IKONOS images using the spectral response function of its sensors. IEEE Trans. Geosci. Remote Sens 2006, 44, 1672–1682. [Google Scholar]
- Laben, C.A.; Brover, B.V. Process for Enhancing the Spatial Resolution of Multispectral Imagery Using Pan-Sharpening. US Patent 6011875. 4 January 2000. [Google Scholar]
- Matthew, M.W.; Adler-Golden, S.M.; Berk, A.; Felde, G.; Anderson, G.P.; Gorodetzky, D.; Paswaters, S.; Shippert, M. Atmospheric correction of spectral imagery: Evaluation of the FLAASH algorithm with AVIRIS data. Proc. SPIE 2003, 5093, 474–482. [Google Scholar]
- Stamnes, K.; Tsay, S.-C.; Wiscombe, W.; Jayaweera, K. Numerically stable algorithm for discrete-ordinate-method radiative transfer in multiple scattering and emitting layered media. Appl. Opt 1988, 27, 2502–2509. [Google Scholar]
- Kaufman, Y.J.; Tanré, D.; Remer, L.A.; Vermote, E.F.; Chu, A.; Holben, B.N. Operational remote sensing of tropospheric aerosol over land from EOS Moderate Imaging Spectroradiometer. J. Geophys. Res 1997, 102, 17051–17067. [Google Scholar]
- Lyzenga, D.R. Shallow-water bathymetry using combined lidar and passive multispectral scanner data. Int. J. Remote Sens 1985, 6, 115–125. [Google Scholar]
- Montes, M.J.; Gao, B.-C. Improvements to the Tafkaa Atmospheric Correction Algorithm for Hyperspectral Ocean-Color Data. Proceedings of Hyperspectral Imaging and Sounding of the Environment, Santa Fe, NM, USA, 11–15 February 2007. Paper HThA3..
- Gao, B.-C.; Montes, M.J.; Ahmad, Z.; Davis, C.O. Atmospheric correction algorithm for hyperspectral remote sensing of ocean color from space. Appl. Opt 2000, 39, 887–896. [Google Scholar]
- Boardman, J.W. Post ATREM Polishing of AVIRIS Apparent Reflectance Data Using EFFORT: A Lesson in Accuracy versus Precision. Proceedings of Summaries of the 7th JPL Airborne Earth Science Workshop, Washington, DC, USA, 12–16 January 1998; 1. JPL Pub. 53..
- Brando, V.E.; Anstee, J.M.; Wettle, M.; Dekker, A.G.; Phinn, S.R.; Roelfsema, C. A physics based retrieval and quality assessment of bathymetry from suboptimal hyperspectral data. Remote Sens. Environ 2009, 113, 755–770. [Google Scholar]
- Dekker, A.G.; Phinn, S.R.; Anstee, J.; Bissett, P.; Brando, V.E.; Casey, B.; Fearns, P.; Hedley, J.; Klonowski, W.; Lee, Z.P.; et al. Intercomparison of shallow water bathymetry, hydro-optics, and benthos mapping techniques in Australian and Caribbean coastal environments. Limnol. Oceanogr.: Methods 2011, 9, 396–425. [Google Scholar]


| Waveband Colours | Waveband Numbers | Waveband Names | WV2 Wavelength Range (nm) | QB2 Wavelength Range (nm) |
|---|---|---|---|---|
| Purple | 1 | “Coastal blue” | 400–450 | |
| Blue | 2 | Blue | 450–510 | 450–520 |
| Green | 3 | Green | 510–580 | 520–600 |
| Yellow | 4 | Yellow | 585–625 | |
| Red | 5 | Red | 630–690 | 630–690 |
| NIR1 | 6 | “Red edge” | 705–745 | |
| NIR2 | 7 | Near InfraRed 1 | 770–895 | 760–890 |
| NIR3 | 8 | Near InfraRed 2 | 860–1040 | |
| Panchromatic | 450–800 | 450–900 |
| Altitude (km) | 770 |
| Ground Elevation (km) | 0 |
| Pixel size (m) | 2/0.5 |
| Flight Date | 17 March 2010 |
| Flight Time (GMT) | 20 h 13 min 3 s |
| Atmospheric model | Tropical |
| Aerosol Model | Maritime |
| Aerosol Retrieval | None |
| Initial Visibility (km) | 40 |
| Aerosol Scale Height (km) | 1.5 |
| CO2 Mixing Ratio (ppm) | 390 |
| Square Slit Function | None |
| Adjacency Correction | Yes |
| MODTRAN Resolution (cm−1) | 15 |
| MODTRAN Multiscatter Model | Scaled DISORT |
| Number of DISORT Streams | 8 |
| No Correction | Dark Object Subtraction | FLAASH | |||||
|---|---|---|---|---|---|---|---|
| 2 m | 0.5 m | 2 m | 0.5 m | 2 m | 0.5 m | ||
| Averaged | Maximum | 0.63 | 0.5 | 0.63 | 0.53 | 0.46 | 0.46 |
| Minimum | 0.16 | 0.13 | 0.13 | 0.08 | 0.08 | 0.16 | |
| Punctual | Maximum | 0.84 *** | 0.58 *** | 0.85 *** | 0.63 *** | 0.81 *** | 0.73 *** |
| Minimum | 5.78 × 10⁻⁴ (NS, p = 0.95) | 1.89 × 10⁻³ (NS, p = 0.92) | 4.81 × 10⁻⁴ (NS, p = 0.97) | 1.38 × 10⁻³ (NS, p = 0.94) | 1.25 × 10⁻¹⁶ (NaN) | 2.21 × 10⁻⁴ (NS, p = 0.99) | |
Share and Cite
Collin, A.; Hench, J.L. Towards Deeper Measurements of Tropical Reefscape Structure Using the WorldView-2 Spaceborne Sensor. Remote Sens. 2012, 4, 1425-1447. https://doi.org/10.3390/rs4051425
Collin A, Hench JL. Towards Deeper Measurements of Tropical Reefscape Structure Using the WorldView-2 Spaceborne Sensor. Remote Sensing. 2012; 4(5):1425-1447. https://doi.org/10.3390/rs4051425
Chicago/Turabian StyleCollin, Antoine, and James L. Hench. 2012. "Towards Deeper Measurements of Tropical Reefscape Structure Using the WorldView-2 Spaceborne Sensor" Remote Sensing 4, no. 5: 1425-1447. https://doi.org/10.3390/rs4051425
APA StyleCollin, A., & Hench, J. L. (2012). Towards Deeper Measurements of Tropical Reefscape Structure Using the WorldView-2 Spaceborne Sensor. Remote Sensing, 4(5), 1425-1447. https://doi.org/10.3390/rs4051425