Review

Collective Sensing: Integrating Geospatial Technologies to Understand Urban Systems—An Overview

1
Centre for Geoinformatics, University of Salzburg, Hellbrunner Str. 34, A-5020 Salzburg, Austria
2
Research Studio iSPACE, Research Studios Austria, Schillerstr. 25, A-5020 Salzburg, Austria
3
Department of Geography, University of Calgary, 2500 University Dr. N.W., Calgary, AB T2N 1N4, Canada
4
Center for Urban and Environmental Change, Department of Earth and Environmental Systems, Indiana State University, Terre Haute, IN 47809, USA
*
Author to whom correspondence should be addressed.
Remote Sens. 2011, 3(8), 1743-1776; https://doi.org/10.3390/rs3081743
Submission received: 24 June 2011 / Revised: 5 August 2011 / Accepted: 10 August 2011 / Published: 19 August 2011
(This article belongs to the Special Issue Urban Remote Sensing)

Abstract

:
Cities are complex systems composed of numerous interacting components that evolve over multiple spatio-temporal scales. Consequently, no single data source is sufficient to satisfy the information needs required to map, monitor, model, and ultimately understand and manage our interaction within such urban systems. Remote sensing technology provides a key data source for mapping such environments, but is not sufficient for fully understanding them. In this article we provide a condensed urban perspective of critical geospatial technologies and techniques: (i) Remote Sensing; (ii) Geographic Information Systems; (iii) object-based image analysis; and (iv) sensor webs, and recommend a holistic integration of these technologies within the language of open geospatial consortium (OGC) standards in-order to more fully understand urban systems. We then discuss the potential of this integration and conclude that this extends the monitoring and mapping options beyond “hard infrastructure” by addressing “humans as sensors”, mobility and human-environment interactions, and future improvements to quality of life and of social infrastructures.

1. Introduction

Cities are complex systems, composed of myriad biological and non-biological components that function and interact within multiple coincident spatio-temporal scales: from the split-second delay of a changing traffic light, to the diurnal pulse of city night-life, to the seasonal hum of power stations meeting increased energy demands. Cities are alive. They breathe, they evolve and within this new geological epoch—the Anthropocene or “The Age of Man” [1], we are changing the face of our planet in order to meet their increasing appetites. In the 1800s, the urban fraction of the global population was 3%. Today it is estimated that 50.6% of the world’s population currently live in urban areas that occupy only ≈1% of the planets total land area [2]. Additionally, annual urban growth rates continue to increase at a more rapid pace (1.91%), than rural populations (0.22%) [3] leading to a host of urban challenges from affordable housing, increased urban unemployment and traffic congestion, to rising energy demands, urban heat island effects and increased air and noise pollution to name just a few [4,5]. Understanding how these urban systems evolve (their past, present and future) is paramount to maximizing our human living experience within their changing boundaries; yet no single perspective is sufficient to achieve this task. In this article we provide a condensed perspective of critical geospatial technologies necessary to understand, model and monitor cities from above, below, within and from a distance-over multiple collection scales; with an emphasis on the importance of implementing open geospatial consortium (OGC) sensor standards (see Section 3.2).
The term “city” comprises not only a geographical area characterized by a dense accumulation of people or buildings, but implicitly includes a multi-layered construct containing multiple dimensions of social, technological and physical interconnections and services. A variety of terms have emerged to describe this evolving urban environment, including virtual city, city of bits, event city, cyber city, global city, network city, and renewable city [6]. Naturally, these terms depend on the specific viewpoint(s) representing the complexity of the phenomena being observed and analyzed. Hall [7] characterized this multi-dimensional complexity covering culture, politics, trade, communications infrastructure, finance, technology and universities. Hall and Pfeiffer [8] further state that a liveable city has many facets, which revolve around quality of life functions such as living space, elementary infrastructure, traffic and land utilization.
Castells [9] pursues another approach describing a city as “not a place, but a process”. In this context, processes are considered the connections between centers in a global network. Castells further imagines the city as a spatial system of advanced service activities, and claims that information and communication networks constitute the modern social morphology of our societies in the informational age—as opposed to the industrial age. A more economy-driven view is presented by Friedmann [10], who states that cities are the basing points of capital, and the resulting linkages create a complex spatial hierarchy. In his interpretation, this hierarchy is formed by taking a number of city characteristics into account: the importance of the city as a finance centre, corporate headquarters, international institutions, business services, manufacturing, transportation, and population size. Similarly, a very energy-centered description of urban environments is presented by Droege [11], who sees the common aspect of cities in their foundation as “creatures of their energy regimes”. He asserts that a large part of global financial transactions, trade, command and control, and cultural production occur in and among cities. Mitchell [12] also lays out a multi-dimensional definition of the term city, which is strongly motivated by technology. He states that the future city will be (i) unrooted to any definite geographic place on the surface of the earth; (ii) constrained by connectivity and bandwidth issues rather than by physical accessibility and land values; and (iii) widely asynchronous in its operation. The inhabitants are not humans, but agents, which Mitchell describes as “collections of aliases and agents”. More recently, several of these ideas have been realized within a growing research domain on cellular automata and agent-based models [13].
Despite their diversity of approaches, almost all studies reveal how the cities in which we live, have changed. There is no single universal way of describing cities and urbanity, but rather, numerous ways of exploring the city together with their inhabitants. Figure 1 depicts some of these methods. As illustrated, one commonly used method is to produce a map.
Figure 1. Informal settlements in Fortaleza, Brazil: (a) privately flown aerial photos (2005); (b) a digital classification of settlement structures, settlement in red (Blaschke, unpublished); (c) a ground inspection reveals various structural and social changes which are not depicted in the nadir optical images (photo: Blaschke, 2006).
Remotesensing 03 01743 g001
Remote sensing imagery (i.e., from satellite and or airborne sensors) often provides the primary data source to achieve a birds-eye, or plan-view of an urban setting. However, such traditionally static maps are increasingly inefficient for representing dynamic urban environments. Instead, we suggest that what is needed is a seamless integration of multiscale geospatial technologies, where real-time and near-real-time digital maps act as geospatial strange-attractors that dynamically harbor spatially referenced information and associated metadata. Our hypothesis is that remote sensing is well advanced in terms of technologies and methods including multi-sensor, multi-scale and multi-temporal analyses but that it is primarily limited to a “roof-top/treetop” view-although SAR platforms often provide oblique data-which represents an incomplete perspective for understanding urban systems.
Figure 2 illustrates this hypothesis and the different perspectives derived from both “remote” and “in situ” sensing. For simplicity we employ a “wall to wall” map metaphor for the remote sensing example, which should include feature extraction approaches. The in situ sensing process is characterized with the processing chain since most individual systems are not developed to derive a “complete” picture of the environment. Our objective is to contribute to a better understanding of these ideas, and to provide solutions. In the proceeding sections we will explore these ideas by describing key components of (i) Remote Sensing; (ii) Geographic Information Systems; (iii) object-based image analysis technologies; and (iv) the sensor web, and we will discuss opportunities to exploit each technology’s strengths to create an integrated understanding of dynamic urban systems. Finally, we will discuss multi-source sensing, “collective sensing” and germane terms used in Computer Science.
Figure 2. The “plan-view” concepts of remote sensing (1) and “personal” in situ sensing (2) are juxtaposed in terms of their results.
Remotesensing 03 01743 g002

2 Remote Sensing and the Urban Environment

2.1. Progress in Technology

Current airborne and satellite remote sensing sensors have significantly advanced, since the first recorded nadir air photograph was acquired from a hot air balloon over the city of Paris in 1858 ([14], p. 67). For example, airborne hyperspectral sensors such as the CASI 1500 [15] provide a 650 nm spectral range between 365 and 1,050 nm, 288 programmable spectral samples (<3.5 nm FWHM), and a spatial resolution of 25 cm–1.5 m; while satellite sensors such as GeoEye and Worldview-2 are capable of providing (sub 0.5 m) high spatial, spectral and temporal resolution imagery. For example, WorldView-2 is able to collect imagery for nearly 1 million km2 every day with a revisit frequency of 1.1 days at 1.1 m resolution.
Based on such high spatial resolutions and in combination with advancements in object-based image-processing methodologies (see Section 2.2), substantial increases in urban remote sensing applications can be observed. These include, but are not limited to, the mapping of mega-cities (such as Mumbai, Tokyo, New York City and Mexico City, see also the “100 cities project” http://cesa.asu.edu/urban-systems/100-cities-project/); the mapping and monitoring of fast evolving, sometimes uncontrolled settlements in developing countries, or the monitoring of informal settlements-routinely done by public administrations or commercial companies. At more advanced levels, Thomas et al. [16], Weng and Quattrochi [17], Ehlers [18], Herold and Rogers [19], Rashed and Jürgens [20] deal with a wider range of urban remote sensing methodological issues including urban mapping with high-resolution imagery, data fusion, land-use metrics, urban image-texture and distinguishing between urban and sub-urban areas. Extensive reviews of the current state of the art for different aspects of satellite and airborne data analyses relevant to urban applications such as impervious surface mapping, urban change detection, improved urban classification and others are also presented in [14,17,21,22,23] and Weng [24,25] provides comprehensive overviews on the remote sensing of urban landscapes and their environments.
From these studies, it is clear that, especially over the past two decades, the demand for timely urban mapping and monitoring has intensified due to increased access to high-resolution imagery, as well as to worldwide trends to better understand rapid urbanization and its accompanying concerns of environmental impacts and sustainable growth [26,27,28]. This increase in availability and demand also continues to drive urban studies research to exploit remote sensing capabilities to provide detailed data and information to better manage urban growth and its related challenges [29].
High resolution images were formerly the domain of airborne remote sensors. However, the advent of high resolution civilian satellite remote sensing is typically associated with the 1999 launch of Ikonos. Ikonos, Quickbird (2001) and numerous proceeding satellites of the “1 m-generation” of satellite sensors—so called because of their 1.0 m panchromatic images—also initiated a dramatic increase in the volume of images, scientific literature and new methods being developed [30,31]. These finer spatial resolution (or larger mapping scale) image data contain higher levels of detailed features than the preceding coarser resolution sensors (e.g., Landsat Thematic Mapper and SPOT). However, this greater level of detail with its increased digital number variability often led to complicated urban features—when viewed in the spectral domain [19,32,33].
While the (current) spatial resolution of satellite hyperspectral imagery are not as fine as multispectral airborne imagery (which can be a limitation for some applications), it will continue to be an important and valuable data source for urban studies into the future [19,34,35,36]. In fact, for many applications they complement the high-resolution multispectral imagery, through the use of image-fusion techniques [18]. While the domain of high spatial resolution hyperspectral satellite sensors is yet to come, there are many hyperspectral sensors used in airborne platforms (such as AVIRIS, CASI, DAIS, HyMap, etc.) which dominate the literature [37]. These sensors provide sufficient spatial resolution for a range of urban applications from urban forestry to impervious surface mapping.
Urban decision-making increasingly requires urban land-use and land-cover maps generated from very high spatial resolution data. For example, a remote sensing application to estimate population based on the number of dwellings of different housing types in an urban environment (single-family, multi-family), usually requires a pixel size ranging from about 0.25 to 5 m if individual structures are to be identified [38]. Optical imagery is not the only data resource available to planners. They also have access to LiDAR (Light Intensity Direction and Range) data derived from active sensors capable of providing detailed 3D point clouds from which detailed building structural information can be defined. Recent breakthroughs in LiDAR flight path planning which emphasizes building façade data capture, has greatly facilitated the potential for rapid auto-generation of 3D building models [39].
Figure 3. LiDAR and optical data are routinely combined in many applications. (a) Illustrates a Quickbird image of Salzburg from 2005 overlaid with polygons representing tall trees located close to buildings which interfere with the extraction of building surface models from LiDAR data (not displayed herein); (b) a zoom to the problematic areas for visual inspection or subsequent image analysis steps; (c) an NDVI mask of tall trees derived from a Quickbird image; (d) the resulting building mask displayed in 2D.
Remotesensing 03 01743 g003
While terrestrial LiDAR data campaigns are usually restricted to specific purposes in, e.g., archaeology, engineering disaster assessments or pseudo-realistic visualization effects, the majority of LiDAR sensing campaigns are from aerial platforms. The resulting large collections of point clouds and their unstructured nature makes them unsuitable for direct visualization and engineering purposes without further processing (see Figure 3). Effective visualization largely depends on the quality of the sampled points, on efficient scene representations and appropriate filtering and caching methods. Visualization is crucial to understanding and analyzing large datasets and is, therefore, a critical issue in large-scale urban planning. Goodwin et al. [40] provide convincing examples of the use of small-footprint, discrete LiDAR data in urban environments for extracting both primary attributes such as building outlines and a suite of secondary urban cover and structure attributes that are relevant for parameterising the surface in atmospheric modelling.

2.2. Progress in Image Analysis

Remote sensing technology has been applied widely in urban land use/land cover (LU/LC) classification and change detection [41]. However, it is rare that a classification accuracy of greater than 80% can be achieved (except in the case of homogenous water bodies) using per-pixel classification (so-called hard classification) algorithms [42] due to the h-res problem [43]. This is where the increased spatial resolution of high-resolution imagery, while visually meaningful, confuses traditional classifiers, resulting in reduced classification accuracy. Therefore, the soft/fuzzy approach to LU/LC classification has been applied, in which each pixel is assigned a class membership of each LU/LC type rather than a single label [44]. Nevertheless, as Mather [42] suggested, neither hard nor soft classification is an appropriate tool for the analysis of heterogeneous landscapes. Rather, he maintained that identification/description/quantification rather than classification should be applied to provide a better understanding of the composition and processes of heterogeneous landscapes such as urban areas.
While per-pixel multispectral image analysis has provided satisfactory results for coarse to medium resolution (≈30+ m) imagery for over 30 yrs [45], it is seldom sufficient for extracting fine urban features from very high resolution (VHR) satellite data. Instead, a combined spectral and spatial approach may be more useful to map urban features, particularly those with low spectral separability. Despite many innovative approaches, and technical progress in sub-pixel analysis [41], unsolved issues involving spectral confusion and mixed pixels have led to a paradigm shift in classification methods from per-pixel to object-based methods [46,47]. The need for an approach that goes beyond the pixel-based paradigm via the classification of spectral reflectance characteristics, and moves towards an “object-based paradigm” which incorporates size, shape, texture, pattern, color, tone, and the context of spectrally homogeneous units derived from high-resolution imagery is both necessary and inevitable [48,49]. That these defined objects are digital-models of a geographic referent has led some to refer to this new domain of image processing as Geographic or Geospatial Object-Based Image Analysis (GEOBIA) [47,50,51]. In fact there is growing consensus [32,33,46,47,52] that a whole new paradigm for image analysis (particularly for VHR data) needs to be developed in order to achieve satisfactory results [47,50].
Unlike spectral methods employed in Maximum Likelihood type of classifications, object-based methods are premised on segmenting the image into homogeneous pixels (image-objects) and classifying these objects using spectral, spatial, textural, relational and contextual methods. Rather than treating the image as a collection of pixels to be classified on their individual spectral properties, the image pixels can be initially grouped into segments and the object segments can then be classified according to spectral and other criteria, such as shape, size and relationship to neighboring objects. Analyst-based contextual information and experience can also be incorporated with the use of digital rule-sets, similar to those developed for decision tree classifiers.

2.3. Integrating Remote Sensing and GIS for Urban Analysis
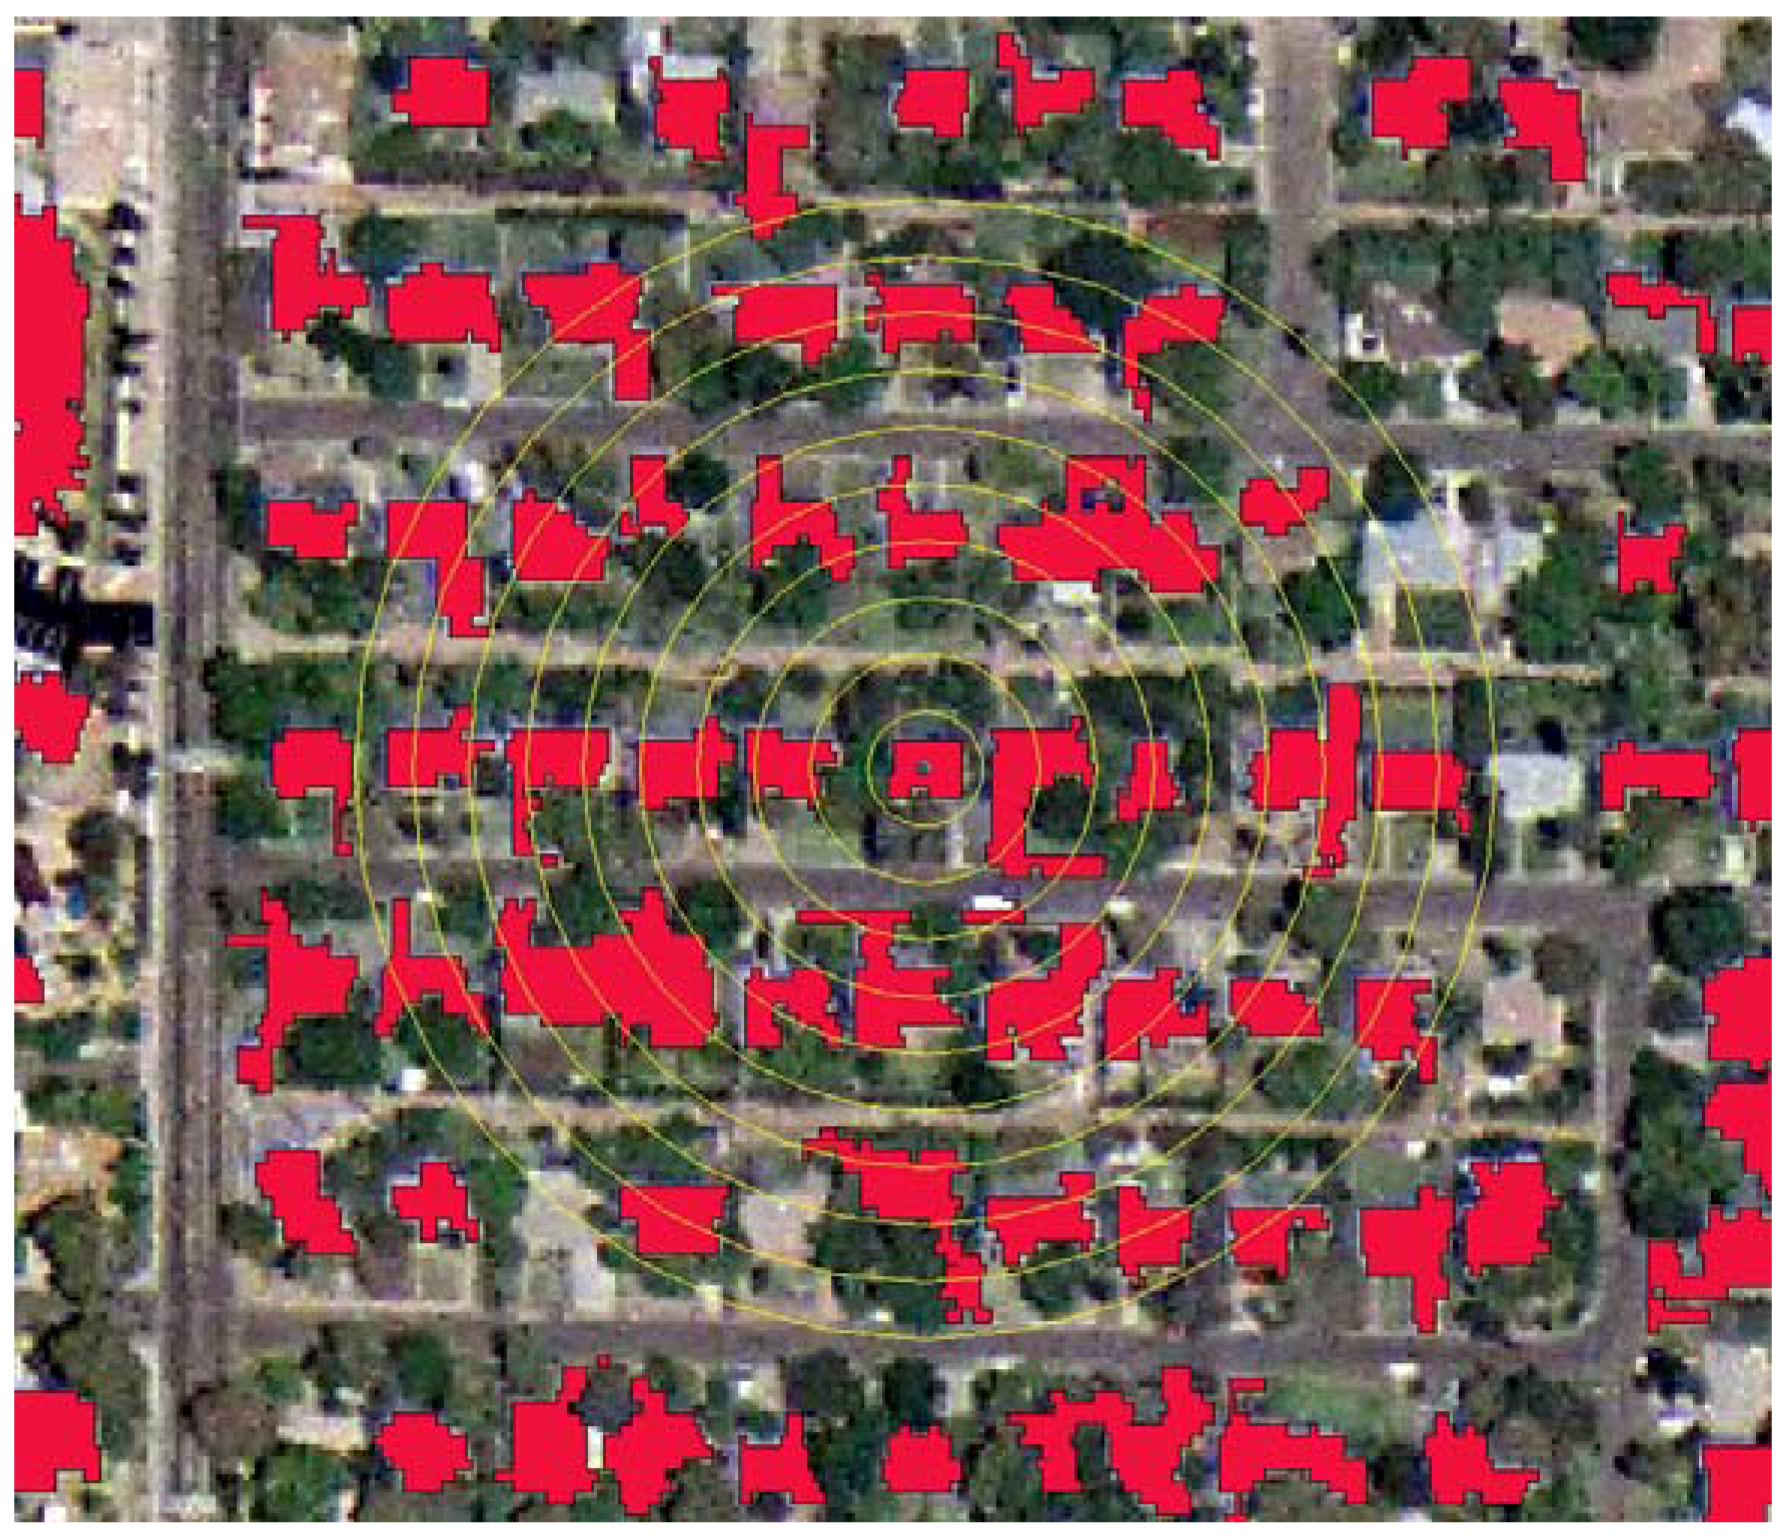
Urban analysis requires that remote sensing imagery be converted into tangible information for use in conjunction with other data sets, often within widely used Geographic Information Systems (GIS). As long as pixel sizes remained typically coarser than, or at the best, similar in size to the objects of interest, emphasis was placed on per-pixel analysis, or even sub-pixel analysis for this conversion, but with increasing image resolutions, alternative paths have been developed, aimed at deriving objects composed of several pixels or pixel clusters/groups [47]. For example, Herold et al. [37] used object-based methods to map urban land use in California using Ikonos imagery; they argue that spatial resolutions better than 5 m are required for such mapping. Thomas et al. [16] compared traditional pixel-based classification methods in an urban environment with two methods that incorporated shape, texture, and context. There are also convincing examples of combining remote sensing and GIS data to derive particular land use—rather than land cover—classes or environmental indicators, see for instance [53,54,55,56,57]. Zhou et al. [55] investigate how remotely sensed lawn characteristics, such as parcel lawn area and parcel lawn greenness, combined with household characteristics, can be used to predict household lawn fertilization practices on private residential lands.
The integration of remote sensing and GIS technologies has been widely applied and recognized as an effective tool in urban analysis and modelling [58,59,60,61]. Remotely sensed derived variables, GIS thematic layers, and census data are three essential data sources for urban analyses, and their integration is thus a central theme in urban analysis. Since census data collected within spatial units can be stored as GIS attributes, the combination of census and remote sensing data combined with a GIS can be envisaged in three main ways [62] that relate to urban analyses: (i) remote sensing imagery have been used in extracting and updating transportation networks [63,64,65,66] and buildings [67,68,69,70], providing land use/cover data and biophysical attributes [17,58,59,71,72,73], and detecting urban expansion [61,74,75]; (ii) Census data have been used to improve image classification in urban areas [60,76,77]; (iii) The integration of remote sensing and census data has been applied to estimate population and residential density [78,79,80,81,82,83,84,85,86,87,88], to assess socioeconomic conditions [89,90], and to evaluate the quality of life [91,92,93,94]. We note that census data are available at a number of different scales, as determined by independent (not remote sensing-based) spatial areas, typically down to census block levels. Through various downscaling techniques [78,79,80,81,82,83,84,85,86,87,88,89,90,91,92,93], this information is re-aggregated to the household or household-group levels.
Figure 4 illustrates one example from Möller and Blaschke [95], who developed an indicator for the estimation of surrounding vegetation for each building as a measurement of urban life quality. The categorization of “feeling comfortable and/or natural” in urban areas introduces a qualitative, human-centered perspective to remote sensing. In a case study in the Phoenix Metropolitan area (Arizona, USA) digital orthophotos are classified into major urban land use/land cover classes following an object-based approach. Building footprints and vegetation are then classified with a high accuracy. For all buildings in the study area ten surrounding circles (buffers) are created and the fraction of vegetation for each circle is calculated. The percentage of vegetated area inside every buffer represents the fraction of surrounding vegetation (FSV) as depicted in Table 1. This FSV index allows a direct measurement of “life quality” centered on each building, but mapped in aggregate, so that areas across parts of a city are comparable to facilitate planning.
Figure 4. Example of the integration of Geographic Information System (GIS)-based analysis results within a remote sensing classification process: constructing a “green index” based on average vegetation within concentric circles around buildings [95]. After deriving the buildings (in red), concentric circles are calculated for every single building as displayed for one example. Then the percentages of vegetation for each ring are calculated.
Remotesensing 03 01743 g004
Table 1. The number of buildings analyzed according to the fractions of surrounding vegetation. Subsequent calculations allow for a more “human-centric” expression of greenness in the vicinity of residences [95].
Area of surrounding vegetationDistance rings from the building under consideration (m)
<1010–2020–3030–4040–5050–6060–7070–8080–9090–100
<25%1,232646621589607527528517554551
<50%485596742772858947948962983979
<75%136482441465374377379375321329
>75%10139593724128954
More demanding for urban remote sensing systems is the analysis and monitoring of traffic flow, which requires high-spatial and -temporal resolutions in-order to identify or quantify moving objects. Though traffic monitoring is already undertaken by sensor webs (see Section 3), there are still useful opportunities for remote sensing to contribute to this critical urban function. Hinz et al. [96] present a generic scheme to extract traffic information from both optical satellite imagery and optical airborne image sequences. Their method is based on an explicit semantic model of traffic, from which, depending on the characteristics of the input data, different strategies for vehicle detection, vehicle queue extraction and motion estimation are derived. Their model comprises different spatio-temporal scales to exploit the scale-dependent properties of traffic acquired by optical sensors. It is furthermore extended by context information to include knowledge about background objects as well as metadata from a road database in a consistent way. These authors attest to the strong potential of airborne and spaceborne traffic monitoring, but also call for methodological improvements.

2.4. In depth Example of GIS-RS Integration: Thermal Urban Analysis

Land surface temperature (LST) and emissivity data derived from satellite thermal infrared (TIR) imagery have been used in urban climate studies primarily for analyzing LST patterns and its relationship with surface characteristics, assessing the urban heat island (UHI), and relating LSTs to surface energy fluxes for characterizing landscape properties, patterns, and processes [24,97,98]. Recent advancement in Landscape Ecology also facilitates the characterization of urban surface components and their quantitative links to UHI process [99,100]. Biophysical attributes from remotely sensed optical data also provide great potential to parameterize urban construction materials and the composition and structure of urban canopies, and for linking with pixel-based LST measurements to better understand and model the surface energy budget and the UHI phenomenon. Hay et al. [101,102] report on the HEAT (Home Energy Assessment Technologies) project, which uses high-resolution Thermal Airborne Broadband Imager data (TABI 320: 1.0 m spatial resolution, 0.1 °C temperature resolution) and geospatial analysis for individual home (community and city) wasteheat monitoring. They also provide related energy models, and greenhouse gas estimates delivered in a free-to-use Geoweb service, as easily as clicking on your house in Google Maps (see Figure 5).
From a spaceborne perspective Lu and Weng [103] applied linear spectral mixture analysis to derive hot-object and cold-object fractions from ASTER TIR bands, and biophysical variables from optical data in Indianapolis (USA). Statistical analyses were then conducted to examine the relationship between LST and five derived fraction variables at resolutions from 15 m to 90 m.
TIR data can also be useful for producing land cover and impervious surface maps with improved accuracy vs. using optical data alone. Lu and Weng [104] employed Landsat TIR data to remove pervious cover from impervious cover based on their distinct thermal response. They found this method was effective for reducing the underestimation in well-developed areas and the overestimation in the less-developed areas, with an overall RMSE of 9.22% for the entire Marion County, Indiana, United States. Weng et al. [105] also applied LSMA to estimate impervious surfaces in Indianapolis from ASTER images of different seasons, and found that using LST maps of water and vegetation as image masks can significantly improve estimation accuracy. The greatest improvement was observed in the April image (9%), followed by the October image (7%) and June image (3%). Increasingly, combinations of MODIS remote sensing observations together with the AErosol RObotic NETwork (AERONET) ground observations are taking place. Jin et al. [53] use MODIS and AERONET data to identify the spatial and temporal features of aerosol load, cloud fraction, water vapor, surface albedo, skin temperature, and land cover in Shanghai and nearby rural regions. By comparing the differences between the Shanghai city and the nearby rural areas, they provided quantitative measures of environmental changes in a dense urban system. These examples illustrate that ground-based observing networks are increasingly being used in conjunction with remote sensing.
Figure 5. This screen-capture from the HEAT (Home Energy Assessment Technologies) GeoWeb interface [102] shows (a) the community waste heat map which represents the average rooftop temperature of individual homes (colored polygons) classified into 10 temperature classes; (b) Illustrates a colorized heat signature for an individual home, and shows three hot-spots (i.e., hottest locations) within the roof envelope (inset colored circles); (c) Shows the Fuel Table which provides the cost of heating the home per day, along with estimated equivalent CO2 emissions (CO2e) produced for different fuel types; (d) Displays a Google Street view image linked to the defined house, which can be used to associate hotspot roof locations. (HEAT: www.wasteheat.ca login: beta, pwd: beta).
Remotesensing 03 01743 g005

3. In situ Measurement Systems, Sensor Webs and Mobile Sensing

Over the last decade, sensor webs which serve to gather measured data and combine them to generate an overall combined result, have become a rapidly emerging and increasingly ubiquitous technology. Generally speaking, sensor webs are a network of intra-communicating sensors, (which might be of different types), used to monitor the environment [106]. Monitored parameters are manifold, including temperature, precipitation, atmospheric constituents, processes within the human body, industrial control functions, and many more.
In contrast to typical sensor networks, sensor webs are characterized by three critical characteristics: (i) The characteristics of interoperability, thus different types of sensors should be able to communicate with each other and produce a common output; (ii) The requirement of scalability implies that new sensors can be easily added to an existing topology without necessitating aggravating changes in the present hardware and software infrastructure; (iii) Intelligence means that the sensors are able to “think” autonomously to a certain degree, which for example, could result in a data processing ability, sending only a filtered sub-set of the total data as required by the user. These properties of geo-sensor webs are the technological basis for the creation of an Earth-spanning sensor network for continuous monitoring.

3.1. Towards a Digital Skin for Planet Earth

In the next century, planet earth will don an electronic skin. It will use the Internet as a scaffold to support and transmit its sensations. This skin is already being stitched together. It consists of millions of embedded electronic measuring devices: thermostats, pressure gauges, pollution detectors, cameras, microphones, glucose sensors, EKGs, electroencephalographs. These will probe and monitor cities and endangered species, the atmosphere, our ships, highways and fleets of trucks, our conversations, our bodies–even our dreams”.
[107]
Following this comprehensive vision, it can be assumed that sensor network deployments will increase dramatically within the coming years, as pervasive sensing has recently become more feasible and affordable. This enriches environmental knowledge with previously uncharted real-time information layers. One overarching reality of this vision is that sensor networks are currently undergoing great performance enhancements combined with drastic price reductions [108], resulting in the deployment of a number of urban geo-sensor networks [109]. On the positive side, the growth of such networks will further decrease prices and improve component performance; particularly if the environmental regulatory organizations move from a mathematical modelling base to a more pervasive monitoring structure.
Generally speaking, geo-sensor networks are a recent and promising technology for current and future urban monitoring and modelling due to: (i) the recent emergence of small and inexpensive sensors based upon microelectronic/mechanical systems; (ii) the set of advantages they offer ahead of other monitoring technologies; and (iii) the wide range of real-world applications that have already been identified for this technology [110,111]. Essentially, these networks fall into the category of complex, distributed, interconnected, and rapidly changing systems [112]. This poses a variety of research challenges leading to new active areas of interest in hardware and software development. We note that an in-depth discussion on issues such as organizational structuring, coordination, collaboration, and distributed, real-time resource allocation are critical for their success but are beyond the scope of this paper.

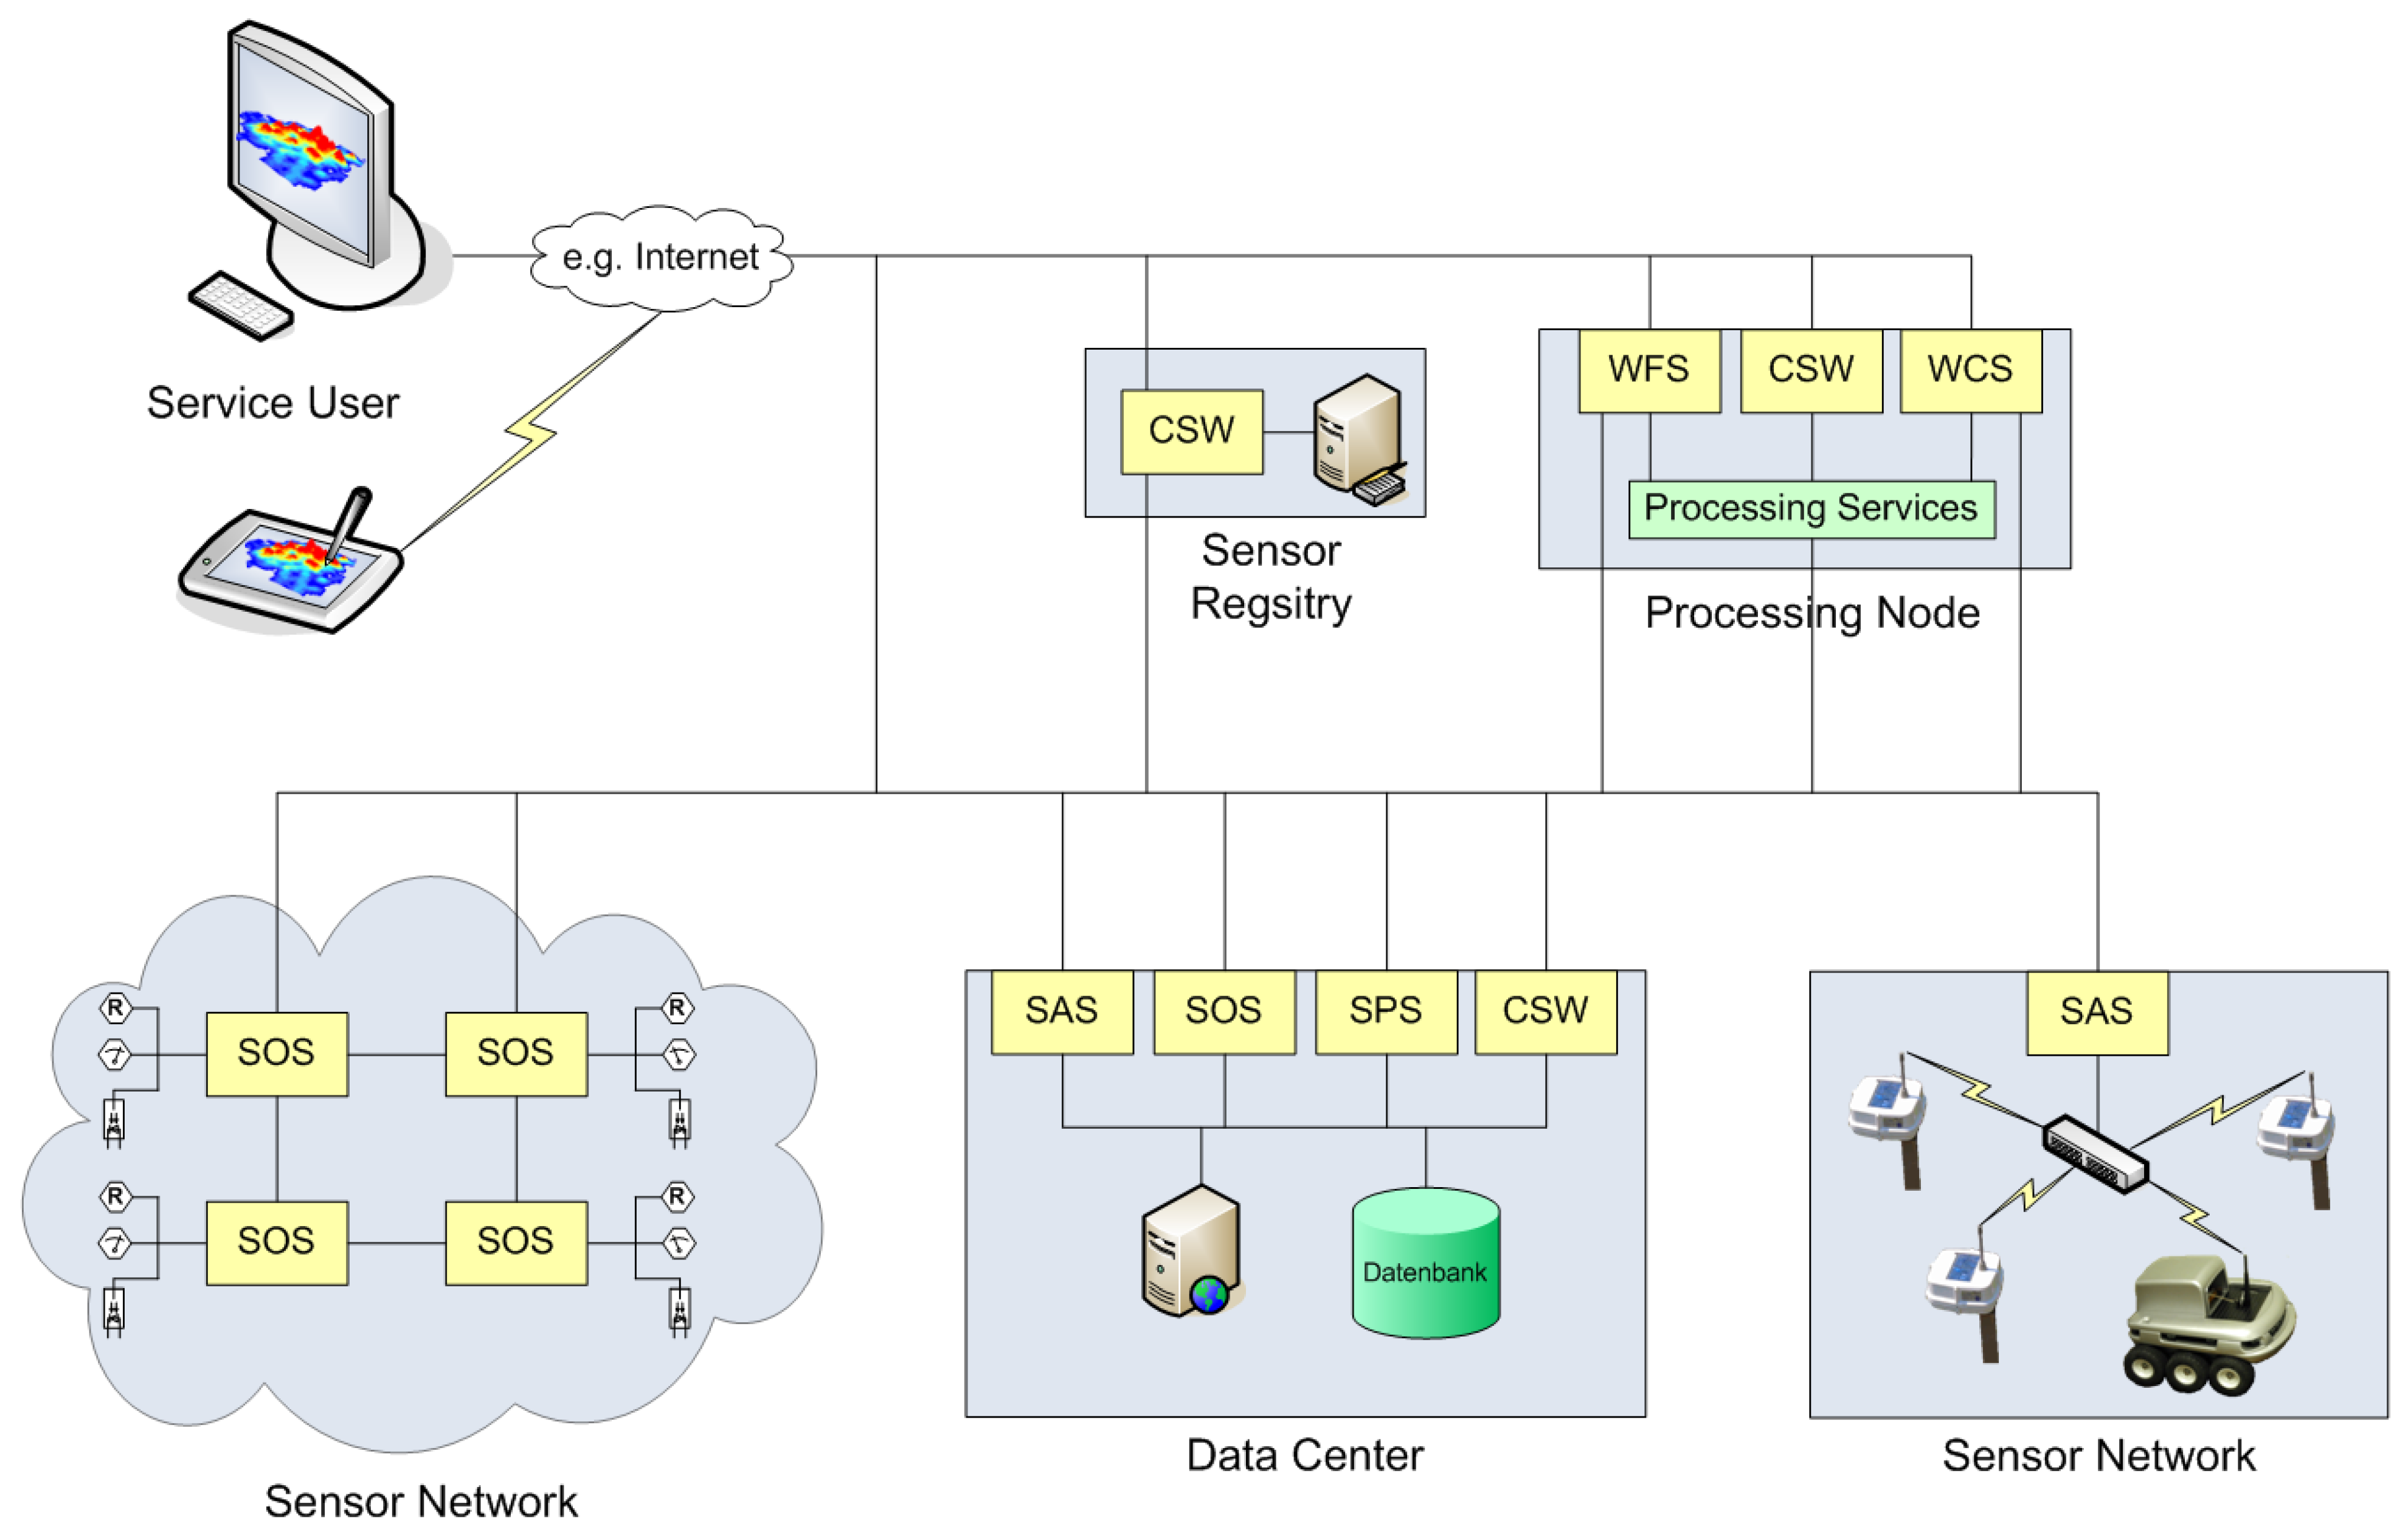
3.2. Technology Integration—Sensor Web Enablement

Sensor Networks in the Geospatial domain have become popular due to the Sensor Web Enablement Initiative (SWE) by the OGC (Open Geospatial Consortium) which seeks to provide open standards and protocols for enhanced operability within and between multiple platforms and vendors. The components in urban monitoring workflows are separated by several interfaces, which are defined using open standards. The first central group of standards is subsumed under the term Sensor Web Enablement (SWE), an initiative by the OGC that aims to make sensors discoverable, query-able, and controllable over the Internet [113]. Currently, the SWE family consists of seven standards:
Sensor Model Language (SensorML)—This standard provides an XML schema for defining the geometric, dynamic and observational characteristics of a sensor. Thus, SensorML assists in the discovery of different types of sensors, and supports the processing and analysis of the retrieved data, as well as the geo-location and tasking of sensors.
Observations & Measurements (O&M)—O&M provides a description of sensor observations in the form of general models and XML encodings. This framework labels several terms for the measurements themselves as well as for the relationship between them. Measurement results are expressed as quantities, categories, temporal or geometrical values as well as arrays or composites of these.
Transducer Model Language (TML)—Generally speaking, TML can be understood as O&M’s pendant or streaming data by providing a method and message format describing how to interpret raw transducer data.
Sensor Observation Service (SOS)—SOS provides a standardized web service interface allowing access to sensor observations and platform descriptions.
Sensor Planning Service (SPS)—SPS offers an interface for planning an observation query. In effect, the service performs a feasibility check during the set-up of a request for data from several sensors.
Sensor Alert Service (SAS)—SAS can be seen as an event-processing engine whose purpose is to identify pre-defined events such as the particularities of sensor measurements, and then generate and send alerts in a standardized protocol format.
Web Notification Service (WNS)—The Web Notification Service is responsible for delivering generated alerts to end-users by E-mail, over HTTP, or via SMS. Moreover, the standard provides an open interface for services, through which a client may exchange asynchronous messages with one or more other services.
Sensor Web Registry—The registry serves to maintain metadata about sensors and their observations. In short, it contains information including sensor location, which phenomena they measure, and whether they are static or mobile. Currently, the OGC is pursuing a harmonization approach to integrate the existing CS-W (Web Catalogue Service) into SWE by building profiles in ebRIM/ebXML (e-business Registry Information Model).
The functional connections between the SWE standards are illustrated in Figure 6.
Figure 6. Functional connections between the SWE standards.
Remotesensing 03 01743 g006
We also note that the OGC is currently establishing the so-called SWE Common namespace specification, which aims at grouping elements that are used in more than one standard of the SWE family. In effect, this will minimize redundancy, and optimize re-usability and efficiency of the standards. SWE Common will primarily comprise very general elements such as counts, quantities, time elements or simple generic data representations. More information on the Sensor Web Enablement initiative, the incorporated standards and the efforts to embed it into the OGC standard service development can be found on the OGC web site (http://www.opengeospatial.org).

3.3. Fine-Grained Urban Sensing Reveals Unseen Information Layers

Through the open standards described in the previous section, and many more new ways of widely connecting information between many different kinds of sensors is possible. Thus, the described Sensor Web becomes the backbone of an “intelligent communication infrastructure” and facilitates the vision that the “the network is the Computer” (slogan of Sun Microsystems in the late 1990s) and ultimately the communication metaphor [114]. While the previous sub-section may be regarded as “technical” the open standards developed by organizations like OGC and ISO are important in our discussion toward a “collective sensing approach”: geospatial applications can now be built across different hardware systems, different monitoring systems and it is now feasible for purchasers of geospatial software to select products whose interfaces and encodings match those of products used by data sharing partners—if the products are compliant with the same standards. Only through the existence—acceptance and implementation—of standards, can interoperable systems become feasible, such as sensor webs for public health applications or early warning systems. While standards are improving, there is still much to be done within the standards development process and in developing best practices for the communication of geospatial information in different communities.
This broad interoperability between sensors and measurements—as well as on service and data levels—is a vital pre-requisite to reach the vision of “Digital Earth” as formulated by Al Gore (former US Vice-President). He envisioned it as a multi-resolution, three-dimensional representation of the planet that would make it possible to find, visualize, and make sense of vast amounts of geo-referenced information on the physical and social environment. Such a system would allow users to navigate through space and time, to access historical data as well as future predictions based for example on environmental models, and to support access and use by scientists, policy-makers, and children alike [115]—for a comprehensive discussion see [116].
Google Earth, NASA World Wind and other geo-browsers have brought high resolution imagery to hundreds of millions of internet users, and a major industry has developed ways to explore data geographically, and to visualize information provided by both public and private sectors, as well as citizens who volunteer new data [117]. Similarly, we will soon face mass market applications based on sensing applications for non-expert users. As components of Al Gore’s Digital Earth become not only available but also used daily by hundreds of millions of people worldwide, we envision rapid advancements in sensor and application development, see example [102].

4. Collective Sensing: Beyond Monitoring of Physical Infrastructure

4.1. Demand for Recent and Holistic Urban Information

Remote sensing is an important factor in environmental monitoring and in a variety of urban applications. In fact, there are several international (UN, COOPUS, GEO, ICOS), supranational (e.g., European Union) and national legislative frameworks which explicitly legislate remote sensing methodologies and methods. Particularly the Group of Earth Observation (GEO) with its “System of Systems” (GEOSS) increasingly integrates satelliteborne and airborne remote sensing with in situ measurement systems. Weng [24,25] has recently provided several comprehensive overviews on remote sensing of urban landscapes and environments. Rather than repeating this material, we briefly juxtapose the technical realms of urban remote sensing to recent technological advancements in in situ sensing emphasizing interoperable, standardized data fusion options leading to a “collective sensing”.
Viewed from above, most cities appear as a sprawling mass of structures of varying size, shape, and construction, interwoven with particular street patterns which display regularities or irregularities. In most parts of the world these patterns are relatively well known and do not change rapidly. In typical North American cities, for instance, these patterns can lead to an impression of stereotyped monotony. In fact, they can be so characteristic that planners and social scientists make predictions about the social conditions of the inhabitants and neighborhoods based on particular arrangements of houses, building blocks structure and their sizes, shapes and spatial arrangements [75,77,118]. We may characterize prototypical urban areas as a typical complex combination of buildings, roads, parking lots, sidewalks, gardens, cemeteries, soil, water, and so on. It is obvious that remote sensing can detect these patterns if spatial data resolutions are fine enough. Remote Sensing will also define changes when buildings are removed, altered, replaced or if any constituents of the spatial arrangements change in a way which leads to visual changes in the appearance when seen from above. However, this restriction to a “bird’s eye view” may be limiting when changes in the social environment happen gradually or incrementally without changing the outside hull of buildings, street patterns or surface material. Urban planners and decision makers understandably want a “complete” picture and up-to-date information. These demands from planners require timely acquisition and analysis of spatial and temporal information for making informed decisions. Consequently, remote sensing can only be considered part of an information system which delivers a more complete picture of urban areas, their inhabitants and the resulting spatio-temporal human-environment interactions.

4.2. GIS as a Processing Platform

Advances in computer technology have increased dramatically since Faust et al. [119] identified five major “impediments” to the integration of remote sensing and GIS. What we do know is that these “impediments”, such as real time processing, database updating, and handling of a single image scene are essentially no longer considered as major challenges. For example, real time integration of remotely sensed imagery and GIS data has been carried out with expert knowledge in hazard mapping, wildfire monitoring, and crop disease surveillance [120]. It is a routine, with the current technologies in computing (CPU), graphic user interface, visualization, and computer networking to perform sophisticated GIS and/or remote sensing image analysis with desktop or laptop computers [77]. With the advent of Internet technology in the mid-1990s (i.e., Web 1.0, and now Web 2.0), GIS can display, analyze, and manage data over the web, making WebGIS a true reality [121].
In conjunction with GPS and wireless communicating technologies, mobile mapping is quickly becoming a ubiquitous activity. In particular, two mobile mapping techniques are gaining momentum in both the commercial domain, as well as in the daily life of the general public. (i) One relates to the development of location-aware personal digital assistants (PDA), which consists of a GPS-equipped handheld computer or a palmtop GIS and may use such datasets as geographic features and attributes, aerial and ground photos, satellite images, and digital pictures [122]; (ii) Another prospect for mobile mapping technology is distributed mobile GIS (DM-GIS) [122]. By principle, a DM-GIS is very similar to a PDA, and is typically composed of palmtop computers with GPS and camera [123]. They communicate via wireless networks with a cluster of backend servers where GIS and and/or remote sensing image data are stored. Digital pictures taken in the field can be relayed to the servers to update GIS database as frequently as needed [122]. Xue et al. [124] suggested that WebGIS, mobile mapping (they termed it “Mobile Geoprocessing”), and TeleGIS (an integration of GIS and other communication techniques) are shaping a new field of study, namely, “telegeoprocessing”. This is based on real-time spatial databases updated regularly by means of telecommunications to support problem solving and decision making at any time and any place. Telegeoprocessing requires a seamless integration of four components, i.e., (i) remote sensing, GIS, GPS; (ii) telecommunications; (iii) real-time remote sensing imaging and processing; and (iv) real-time GIS [124].
Real-time remote sensing imaging processing refers to the generation of images or other information to be made available for inspection simultaneously, or very nearly simultaneously, with their acquisitions [125]. To make a real-time GIS, several key issues must be considered, such as real-time spatial data structures, real-time GIS indexing, interoperability, geographic data interchange standards, parallel and distributed computing, networking, the human-machine interface, client-server architect, multimedia and wireless communications, and real-time integration of remote sensing image and GIS data [124]. With the advent of widely applied OGC standards, there is now opportunity for a tighter integration of imagery and in situ measurements. Torrens [126] introduces the term “WiFi-Geography” for urban areas and describes the potential of mapping and visualizing Wi-Fi presence in urban settings. He argues that charting the geography of Wi-Fi coverage encapsulates urban space for various activities. This would enable a “spectrum geography”: for any one point in space and time, fields of signals can be sampled according to the radio spectrum.
These developments—and others—let us conclude that GIS is becoming a processing platform. Though not a core focus of this article, we note that networked geospatial technologies allow for, and facilitate the integration of “crowdsourcing” or “Volunteered Geographic Information” (VGI) [127]. In these situations, individuals act independently, but their collective geospatial information is combined to serve the needs of local communities, ranging from cyclists to disaster victims. According to Goodchild [127] a geo-server with appropriate tools and standards plays a central part in this process, with the various patchwork pieces seamlessly fitting together, and distributed over the Web. In these integrated environments where “citizens as sensors” or “people as sensors” [128] are the norm, a number of considerations regarding data integrity, source validation and verification need to be incorporated into the “collective sensing” design.

4.3. Thoughts on Urban Morphology and Function

Today we possess Geospatial technologies which have the potential to provide for more holistic views of urban systems. By integrating urban remote sensing systems, image processing software and GIS (for an overview see [24]) we are able to generate new spatio-temporal and thematic information. A logical step in this integration is the inclusion of the third dimension for city modelling. 3D city models are becoming increasingly popular with Internet based software like Google Earth, which has promoted the importance and public awareness of spatial visualization to unexpected levels. In addition, the thematic components of urban systems are increasing in utility and importance in areas such as monitoring urban developments, land cover change detection and mapping of natural hazards. Technologies such as very high resolution remote sensing and airborne laser scanning (ALS) offer a wide range of new possibilities for modelling urban systems and require applied research to develop and implement new methodologies [54]. While LiDAR was introduced earlier, we note, that for ALS point clouds and derived products we may even more urgently need integrations methods. With high spatial resolution imagery, single pixels no longer capture the characteristics of classification targets. Instead, adjacent pixels tend to belong to the same class or some compatible classes with an ecological or functional association [129,130].
A logical step in urban system modelling is the integration of earth observation data with ancillary spatial and space-related information. This enables the transition of land cover to specific land uses [118,54]. For urban studies and especially for hazard and risk analyses the inclusion of population in these models is essential. For example, Chen [131] describes correlations between census dwelling data and remotely sensed data, and Banzhaf et al. [132] detect negative growth in the city of Leipzig by integrating remote sensing data.

4.4. Collective Sensing in the “Digital City” and “Smart City” Contexts

As discussed in the introduction section, the term “city” comprises not only a geographical area characterized by a dense accumulation of people or buildings, but it also encapsulates aspects of culture, politics, trade, communications infrastructure, finance, technology and universities [6,7,8,9,10]. In this section we propose that developments in remote sensing, sensing technologies in general and the Sensor Web in particular facilitates Castells’ [9] view of a city to be “not a place but a process”. When considering a city as a spatial system of advanced service activities [9], information and communication networks constitute the modern social morphology of today’s societies. “Collective sensing” may be regarding as the means to expedite the proceedings towards a “digital city” and facilitating the concept of a “smart city”. Hollands [133] states that we know little about so-called smart cities, “particularly in terms of what the label ideologically reveals as well as hides”. Also, both terms “digital city” and “smart city” lack definitional precision, recent attempts are being made. From a recent literature review, Giffinger et al. [134] conclude that the term is not used in a holistic way describing a city with certain attributes. Rather, it is used for various aspects which range from Smart City as an “IT-district” to the education (or “smartness”) of its inhabitants. The authors summarize that a Smart City is a city performing well in a forward-looking way in six characteristics, built on the “smart” combination of endowments and activities of self-decisive, independent and aware citizens. These six characteristics are presented in Table 2 and summarized within the role of current RS and sensor webs. We note that “smart city” concepts are not just a vision but are currently being deployed in cities like Brisbane, Glasgow, Amsterdam and Helsinki. For instance, in the “Living in Brisbane 2010” program, the Brisbane City Council describes its vision for Brisbane as a “smart city that actively embraces new technologies [135]. Accordingly, Brisbane should “seek to be a more open society where technology makes it easier for people to have their say, gain access to services and to stay in touch with what is happening around them, simply and cheaply. All residents will have access to the Internet, and the ability to use it.” (Brisbane City Council, 2001 cited in [135]).
Table 2. Six characteristics of a smart city based on Giffinger et al. [134], and an evaluation of remote sensing and Sensor Webs in terms of their recent and potential roles within the next five to ten years. Five stars is the maximum, which means a full exploitation of the respective technology and a vital role for the respective characteristic.
Characteristics of a smart cityRole of remote sensingRole of sensor webs
TodayPotentialTodayPotential
Smart economy******
Smart people(*)*-***
Smart governance(*)*-**
Smart mobility*********
Smart Environment*********(*)*****
Smart Living***(*)*****
Though not the core of our discussion, these characteristics may become integrated in future collective sensing approaches; thus allowing Friedmann’s [10], Droege’s [11] and Mitchell’s [12] views of cities (as described in the introduction) to become real. For instance, Mitchell’s claim that the future city will be unrooted to any definite geographic place on the surface of the earth and will be constrained by connectivity and bandwidth issues rather than by physical accessibility and land values, may soon come to fruition. The combination of technologies described in this article—and in many others—will allow us to verify many of the theoretical constructs and ultimately the underlying hypothesis stated in the introduction section. For instance, it is relatively easy to claim that over the last two decades, ways of exploring the city have changed–and so have their inhabitants. Additionally, from an investigative viewpoint, there is growing interest in the environmental and ecological issues within cities, especially sustainability and bio-diversity. This is primarily because of a more profound “faith” in the efficacy of the tools and methods of urban design and monitoring, which in-turn, can foster improved understanding and re-design of the urban environment [6].
Location-based services on mobile smart phones are penetrating our daily communication behavior more and more. In various ways anonymized location information from cell phones can be used to map activities of masses [136,137]. Figure 7 illustrates that—when in the hand of a city administration—such information may be aggregated further and used by decision makers or security managers. Real time (or near-real time like for 15 min aggregated cell-phone information as used in Figure 7) complements statistical information. In many countries no information exists about distribution of people over time.
Figure 7. This screenshot from “CurrentCity 2010” illustrates the problem of “night-time oriented” census information and new ways to derive spatio-temporally disaggregated population information.
Remotesensing 03 01743 g007
At the personal level locational information—together with sensorial information—may be increasingly used to coordinate and adjust our plans on-the-fly and at a distance by receiving up-to-date information on our environment (e.g., transit schedules and traffic flow reports). Mainly in urban areas, sensor information is being more and more integrated and the notion of a “sensorial city planning” [6] is created. Additionally, the rapid growth in the deployment of Smartphone devices illustrates the way towards mass population mobile computing, networking and sensor technologies. This trend is supported by an increasing availability of wireless networks such as WiFi allowing for a remarkable mobility beyond traditional laptop computers.

4.5. Thoughts on the Human-Environmental Processes

Cities in their multilayered complexity in terms of social interactions, living space provision, infrastructure development and other crucial human factors of everyday life have re-gained importance in scientific research. This arises in-part from major scientific developments and technological innovations that have taken place within the urban context [138,139]. If the city is considered as a living entity, this it is clear that the limited roof top or façade view provided by remote sensing needs to be supplemented by providing a more “complete” view of such urban landscapes which integrates information from inside buildings, from under the canopy of trees, and from anywhere within 3D urban space at relatively high temporal and spatial scales.
One may argue that a combination of in situ imagery like façade views (e.g., Google street view etc.) plus broader area remote sensing imagery will lead to increased demand for 3D urban perspectives. While Google SketchUp (http://sketchup.google.com/) provides an impressive 3D modelling environment to manually develop urban structures, at least for now, significant effort is required to derive realistic looking 3D city models. However, no matter how impressive these structures look, they are only snapshots in time and in space—that is, they end on rooftop and walls. What is really needed is a better understanding of human-environmental processes, i.e., direct measures of the impact of human activities on the environment and direct measures of environmental stressors on human functions. Such direct measures are needed to overcome the adherence of (remote) sensing to urban spatial patterns.
In our definition, “high temporal scales” indicates that such scales may range from seconds to hours to days, depending on the phenomenon under investigation. A “high temporal resolution” may be used correspondingly when the availability of the data is sufficient for a decision maker to be able to react in time and with actual data when needed. This is sometimes called “near-real time” to distinguish it from the technical “real time” realm. The latter is measured in Microseconds. Both in electrical and mechanical engineering, for instance, hard real-time systems are used when it is imperative that an event is reacted to within a strict deadline. Real-time programs must execute within strict constraints on response time. In order to distinguish less mission-critical approaches, Resch and co-workers call this “live Geography” [140,141]. It should provide the possibility to start a synchronous conversation at a certain time, which might often be important for geographical monitoring applications, e.g., to enable the generation of an exact development graph for temporal pollutant dispersion over a defined period of time in precise intervals. At least for the present situation, Sensor Webs and the “collective sensing” approach described herein are suited to support applications where new information can be created through a combination of individual data-threads before a decision is to be taken.
Such real-time monitoring has recently received much attention due to the rapid rise of inexpensive pervasive sensor technologies, which have made ubiquitous sensing feasible, while enriching research on cities with uncharted up-to-date information layers. In Figure 8 we use the example of first responder applications for a comparison in order to illustrate what would technically be possible. For the exploration of human-environment interactions (see two paragraphs above), fewer resources are available and privacy concerns are impeditive. First responder applications address local security and safety related threats, and an increasing number of applications builds on collecting sensing in an automated manner for the purpose of concerted strategies at local command centers. Information management is becoming a key issue for first responder applications, with access to mission relevant personal, security and safety related information via portable devices and wearable interfaces.
Figure 8. Example of personal sensing as part of a collective sensing. In security and safety applications, particularly in search and rescue operations, best practice examples demonstrate what is technically feasible today. For environmental applications to provide a “complete” picture of a city, privacy issues need to be resolved. This figure illustrates that a remote sensing roof-top view only plays a limited role: remote sensing (1) and in situ sensing (2) depict different activity patterns which may be integrated through GIS based Sensor Webs (3).
Remotesensing 03 01743 g008

4.6. Beyond Remote Sensing

Remote Sensing typically provides broad overviews with relatively high spatial and spectral details, however, the images are sparsely sampled data or snapshots in time. Many of the previously mentioned in situ systems (see Section 3) show high temporal resolution, but are limited to small areas or even points; consequently, each sensor or sensor network individually samples only a tiny proportion of the surrounding environmental phenomena Generally speaking, sensors-such as those that monitor urban pollution conditions-have a source area that depends on the characteristics of the sensor itself as well as atmospheric conditions and processes. Despite their small size, some sensors may sample a relatively large volume in a given time, and sensors for different elements may have different source areas. This leads to the importance of appropriate environmental sampling at multiple spatio-temporal scales. In Figure 9 we re-emphasized the communication metaphor inherent to Sensor Webs.
Figure 9. Sensor Web with Inter-communicating Sensors. From Resch et al. [142].
Remotesensing 03 01743 g009
As laid out in Section 3, the core idea of integrated sensor webs, for measuring different environmental parameters (e.g., water level, air temperature, air moisture, wind speed, soil moisture), is to answer user-specific questions and to derive new information rather than merely to concatenate sensor information. In Computer Science there is an increasing body of scientific literature describing the technical realms of large numbers of interlinked sensors [143]. Some of these approaches in “ubiquitous computing” or “pervasive computing” focus on sensory threads as a technologically mediated collective sensing expedition. While many of these approaches are beyond the scope of this article, we note that these approaches allow people to explore imperceptible phenomena in the world around them, which can potentially be linked with synoptic information from imagery.
The discussion in this paper represents a selective focus on issues that are most critical to current urban remote sensing and in situ measurement networks and are most promising for advancing future research. Clearly, this selective treatment reflects our interests, and is focused on urban applications. Urban applications have relied on remote sensing imagery for more than half a century. Airborne remote sensing has played an important role in exploring and mapping urban areas around the world and remains indispensable today for many applications. Satellite-derived information facilitates the day to day work of planners and decision makers, although a full exploitation of uncorrected data still requires expert image analysis knowledge. Increasingly, large-scale sensing efforts are being applied to urban planning with faster response times. Many of these efforts have relied upon custodial GIS and the majority of these base maps were limited to two-dimensional representations, with 3D functionalities being limited to a narrow set of applications (e.g., to assess the impact of natural disasters—which is out of the scope of this article).
More recently, as population and urbanization expand, threats to quality of life issues (e.g., preservation of natural resources, green spaces, air quality, historic structures, quiet zones and disaster management/mitigation) will continue to intensify. As such, better sensing capabilities related to these topics will be needed. We have demonstrated that technological progress in remote sensing instruments is significant, but workflows for cross-sensor exploitations of large datasets involved in city-scale surveys pose significant challenges. Remote sensing based maps represent the basis, the strange attractor upon which layers of complimentary geospatial urban data are laid, viewed, queried, mined and modeled in-order to better understand these dynamic systems.
Some of the approaches briefly discussed, are currently feasible as informed real-time decisions transform both the atmosphere of our cities and the hierarchy of our priorities on a daily basis [140]. For example, we are already using location-based services on mobile smart phones, to coordinate and adjust our plans on-the-fly and at a distance by receiving up-to-date information on our environment (e.g., transit schedules and traffic flow reports). Resch [140] concludes that the sensorial dimension beyond the prevalence of the vision—acoustic, olfactory, touch and other senses—which have not yet been integrated into urban spaces, is now becoming possible. It may even play an important role towards the development of “sensorial city planning” [6].

4.7. Towards a New Terminology for Collective Sensing

Collective sensing being a relatively new field it is not surprising that terminologies used may overlap or be used inconsistently. In Computer Science and in some electrical signal processing fields, the concept of location has gained popularity, partially in ignorance of mature Geographical concepts. In fact, localization and environment map building processes depend heavily on estimating the position of features within a surrounding [142,126]. This is different to “traditional” remote sensing where the sensor position plays an important role, but is carefully planned beforehand. This position is usuall very important for geometric correction etc. but is less used as an exploratory variable to understand the investigated phenomena. Sensors, in the widest possible sense- including humans carrying day-to-day measuring devices, need to measure information while additional processing and analysis operations are usually seen as independent from the initial sensor (see Section 3). More recently, raw data are progressively filtered before being provided to the observer. Thus, in large and complex wireless sensor networks the final sensor information product is relatively sparse, compared to the number of sensor sources, and their initial data volumes. Many authors call this “intelligence” or “geo-intelligence”, though we prefer the term “collective sensing”, which describes the simultaneous measuring, localization and mapping approaches that incorporate sensor networks. Various pre-processing and interpolation methods are incorporated within the Sensor Web; however a discussion of these technical options is beyond the scope of this paper. Though we note, that Ferscha et al. [144] propose context sensing, representation and delivery as a new approach called context-based computing: time and event-triggered context sensing for mobile devices.
Throughout this paper, we compared the term “collective sensing” with three other terms frequently used in Computer Science and signal processing scientific literature. For the following four terms-including “collective sensing”-we did a survey using Google Scholar on how many articles use the respective terms and how often the five most influential articles for every term are cited by other articles. We also differentiated between the overall amount of citations and those for the time period beginning in 2007. Results show that “collective sensing” is less frequently used compared to the three most popular terms in Computer Science and signal processing, namely (i) “ambient sensing”; (ii) “context sensing”; and (iii) “ubiquitous sensing”. It can be stated that “collective sensing” arose latest and the share of recent publication is highest.
Collective sensing reveals 170 hits (50% of them are published since the year 2007) in Google scholar, with the five most cited articles accounting for 305 citations.
Ambient sensing reveals 403 hits (38% of them are published since the year 2007) in Google scholar, with the five most cited articles accounting for 138 citations.
Context sensing reveals 1,568 hits (39% of them are published since the year 2007) in Google scholar, with the five most cited articles accounting for 3,400 citations.
Ubiquitous sensing reveals 1,359 hits (48% of them are published since the year 2007) in Google scholar, with the five most cited articles accounting for 1,395 citations.

5. Conclusions: Towards Collective Urban Sensing

Enormous progress in geospatial technologies is undoubtedly being made. Some aspects of this progress have been briefly discussed herein. Despite increasing spatio-temporal resolution and availability of image data, and greater access to data and derived products, the understanding of urban systems will not be satisfied by remote sensing as a stand-alone technology. While the integration of remote sensing and GIS has consistently accelerated over the last years, the modelling of urban systems based on earth observation and geospatial information techniques needs to go beyond 2D mappable features. The combination of in situ data and mobile sensor derived information supports new applications when addressing human-environment interactions, particularly in Public Health and for security and safety applications.
More and more classification systems match the fine-scale heterogeneity of city features and allow the expression of a multiplicity of scales. There are literally hundreds of examples of hierarchically organized, yet flexible systems that explicitly separate structure (land cover) from function (land use). Less so, we have classification systems at hand for holistic, integrative or even “collaborative” sensing approaches.
Coincidentally, the miniaturization of components has enabled sensor systems to be nearly invisible, and sometimes wearable, so that individuals can move around and interact freely, supported by their personal information domain. In this article we concentrated on the “collective use” and disregarded personal information systems. The “smartphone revolution” currently drives back the importance of laptops and personal digital assistants in this field while more and more taking over the role of organizational and personal information repositories.
Generally speaking, fine-grained urban sensing coupled with well-established remote sensing mechanisms greatly enhances our knowledge of the environment by adding objective and non-visible data layers in real-time. These systems help us increase our capacity to observe and understand the city, and the impacts on and by society. This seems to be a very desirable state, as more accurate data about local air temperature, atmospheric humidity, air pollution, and traffic flow can positively influence areas such as public health, traffic management and emergency response. Apart from this information enrichment, accurate sensor measurements also have a much broader influence: considering, for example, that “air quality” is only a surrogate for the effects of pollutants on humans, which make a fine-grained air quality map a very sensitive information layer. We have also described technical realms aiming to support a better understanding of the urban environment and “ubiquitous-” or “collective-sensing” and the visions of “people as sensors” [145] or “citizen as sensors” [128] may become more realistic. Some computer scientists claim a people-centric paradigm for urban sensing [146].
This article started from the hypothesis that while useful and important, traditional airborne and spaceborne remote sensing provides limited “snap-shots” of urban environments that are (currently) unable to fully capture urban dynamics. Urban areas are structurally complex 3D environments that evolve with time. Furthermore, the numerous activities within these environments are typically more dynamic than their physical structure. In an effort to better understand urban environments, we provided insight into two currently separate technologies: (i) remote sensing and (ii) in situ sensing-and argue that Sensor Webs and OGC standards provide the opportunity to combine the strengths of both, with potential to produce new, meaningful and useful “urban-intelligence”. At the moment, these two technologies remain predominantly separate but lay a foundation for a common use. A critical part of making sensors webs useful is an adherence to good measurement protocols: understanding the sensor, its source area and its siting, so that the user can understand what the measurement represents and how that fits with a particular application. Multiplying sensors (through lowered costs, better communications etc. [143]) does not solve this problem (i.e., more measurements does not necessarily equal better data). The intelligence part of sensor design could be critical here, but that intelligence must come from a specific understanding of what each sensor is measuring and the conditions under which measurements can be made so that they are useful. As an example, consider a city where hundreds of air temperature sensors are deployed to building rooftops. The resulting measurements would provide a huge data source compared to a single traditional airport measurement location. But neither the single airport nor the hundreds of rooftop sensors would adequately characterize the temperature of the urban area because, in the case of rooftop sensors, rooftops are a known thermal anomaly [147] and, in the case of the airport, it is likely to represent a rural temperature more accurately. So now you have a case of substantial sensor deployment that at best was a waste of resources and at worst provides unrepresentative data for subsequent decision-making, model development etc. [148].
While available information will always be incomplete, decision makers can be better informed through such technology integration-even if loosely coupled. Standards-based Sensor Webs allow for more “intelligent” and tailored user-information more applicable to specific groups and related technologies. As widely appreciated, reality cannot be digitally measured and mapped exhaustively. This will also hold true for collective sensing approaches of the future. In general, it will be nearly impossible (and impractical) to obtain digital measurements for every point across an entire cityscape, or landscape. Still, our discussion has shown that we are increasingly developing from a society with sparsely sampled footprints, to a data-rich environment enabling on-demand analyses of various urban activities and their constituents in space and time. We suggest that the integration of remote sensing and sensor webs within an OGC framework can expedite this urban reality.

Acknowledgements

Geoffrey Hay acknowledges critical support from The Institute for Sustainable Energy, Environment and Economy (www.iseee.ca), ITRES Research Limited (www.itres.com), the City of Calgary, the Urban Alliance (www.urban-alliance.ca), and NSERC (www.nserc.ca). We also acknowledge the HEAT contributions of Christopher Kyle and Bharanidharan Hemachandran. We want to thank three anonymous reviewers who helped to significantly improve the manuscript in two rounds of reviews. In particular, Reviewer B helped to shape the conclusions and we used some sentences from his/her own explanations in the last part of the paper.

References

  1. Crutzen, P.J. Geology of mankind. Nature 2002, 415, 23. [Google Scholar] [CrossRef] [PubMed]
  2. World Population Data Sheet 2009; PRB (Population Reference Bureau): Washington, DC, USA, 2009.
  3. United Nations Department of Economic and Social Affairs. Population Division; No.2; UN: New York, NY, USA, 2010. [Google Scholar]
  4. Energy Mapping Study; Canadian Urban Institute for the City of Calgary: Toronto, ON, Canada, 2008; Available online: http://www.calgary.ca/docgallery/BU/planning/pdf/plan_it/energy_mapping_study.pdf (accessed on 13 March 2011).
  5. Bailie, A.; Beckstead, C. Canada’s Coolest Cities; Sustainable Energy Solutions Technical Report; The Pembina Institute: Drayton Valley, AB, Canda, 2010; Available online: http://pubs.pembina.org/reports/coolest-cities-technical-report.pdf (accessed on 13 March 2011).
  6. Zardini, M. Sense of the City: An Alternate Approach to Urbanism; Lars Müller Publishers: Baden, Switzerland, 2006. [Google Scholar]
  7. Hall, P. The World Cities, 3rd ed.; Weidenfeld and Nicolson: London, UK, 1966. [Google Scholar]
  8. Hall, P.; Pfeiffer, U. URBAN 21–Expertenbericht Zur Zukunft der Städte; Deutsche Verlagsanstalt: Stuttgart, Germany, 2000. [Google Scholar]
  9. Castells, M. The rise of network society. In The Information Age: Economy, Society and Culture; Castells, M., Ed.; Blackwell: Oxford, UK, 1996; Volume 1. [Google Scholar]
  10. Friedmann, J. The world city hypothesis. Dev. Change 1986, 17, 69–83. [Google Scholar] [CrossRef]
  11. Droege, P. The Renewable City: A Comprehensive Guide to an Urban Revolution; John Wiley & Sons, Ltd.: Chichester, UK, 2006. [Google Scholar]
  12. Mitchell, W.J. City of Bits: Space, Place, and the Infobahn; MIT Press: Cambridge, MA, USA, 1996. [Google Scholar]
  13. Marceau, D.; Benenison, I. Advanced Geospatial Simulation Models; Bentham Science Publishers: Hilversum, The Netherlands, 2011; in press. [Google Scholar]
  14. Jensen, J.R. Remote Sensing of the Environment: An Earth Resource Perspective, 2nd ed.; Pearson Prentice Hall: Upper Saddle River, NJ, USA, 2007. [Google Scholar]
  15. ITRES. CASI-1500 Hyperspectral Imager. 2011. Available online: http://www.itres.com/products/imagers/casi1500 (accessed on 13 March 2011).
  16. Thomas, N.; Hendrix, C.; Congalton, R.G. A comparison of urban mapping methods using high-resolution digital imagery. Photogramm. Eng. Remote Sensing 2003, 69, 963–972. [Google Scholar] [CrossRef]
  17. Weng, Q.; Quattrochi, D.A. Urban Remote Sensing; CRC Press/Taylor and Francis: Boca Raton, FL, USA, 2006. [Google Scholar]
  18. Ehlers, M. New developments and trends for urban remote sensing. In Urban Remote Sensing; Weng, Q., Quattrochi, D.A., Eds.; CRC Press: Boca Raton, FL, USA, 2006; pp. 357–375. [Google Scholar]
  19. Herold, M.; Rogers, D.A. Remote sensing of urban and suburban areas. In Remote Sensing of Urban and Suburban Areas; Rashed, T., Jürgens, C., Eds.; Springer: Berlin, Germany, 2010; pp. 47–65. [Google Scholar]
  20. Rashed, T.; Jürgens, C. Remote Sensing of Urban and Suburban Areas; Springer: Berlin, Germany, 2010. [Google Scholar]
  21. Lu, D.; Mausel, P.; Brondízio, E.; Moran, E. Change detection techniques. Int. J. Remote Sens. 2004, 25, 2365–2407. [Google Scholar] [CrossRef]
  22. Jensen, J.R. Introductory Digital Image Processing: A Remote Sensing Perspective, 3rd ed.; Pearson Prentice Hall: Upper Saddle River, NJ, USA, 2005. [Google Scholar]
  23. Lu, D.; Weng, Q. A survey of image classification methods and techniques for improving classification performance. Int. J. Remote Sens. 2007, 28, 823–870. [Google Scholar] [CrossRef]
  24. Weng, Q. Thermal infrared remote sensing for urban climate and environmental studies: Methods, applications, and trends. ISPRS J. Photogramm. 2009, 64, 335–344. [Google Scholar] [CrossRef]
  25. Weng, Q. Advances in Environmental Remote Sensing: Sensors, Algorithms and Applications; CRC Press/Taylor and Francis: Boca Raton, FL, USA, 2011. [Google Scholar]
  26. Maktav, D.; Erbek, F.S.; Jürgens, C. Remote sensing of urban areas. Int. J. Appl. Earth Obs. Geoinf. 2005, 26, 655–659. [Google Scholar] [CrossRef]
  27. Andersson, E. Urban landscapes and sustainable cities. Ecol. Soc. 2006, 11, 34. [Google Scholar]
  28. Hardin, P.J.; Jackson, M.W.; Otterstrom, S.M. Mapping, measuring, and modeling urban growth. In Geo-Spatial Technologies in Urban Environments: Policy, Practice, and Pixels, 2nd ed.; Jensen, R.R., Gatrell, J.D., McLean, D.D., Eds.; Springer-Verlag: Berlin, Germany, 2007; pp. 141–176. [Google Scholar]
  29. Longley, P.A. Geographical Information Systems: Will developments in urban remote sensing and GIS lead to ‘better’ urban geography? Progr. Human Geogr. 2002, 26, 231–239. [Google Scholar] [CrossRef]
  30. Lu, D.; Weng, Q. Extraction of urban impervious surfaces from IKONOS imagery. Int. J. Remote Sens. 2009, 30, 1297–1311. [Google Scholar] [CrossRef]
  31. Hu, X.; Weng, Q. Impervious surface area extraction from IKONOS imagery using an object-based fuzzy method. Geocarto Int. 2011, 26, 3–20. [Google Scholar] [CrossRef]
  32. Bhaskaran, S.; Paramananda, S.; Ramnarayan, M. Per-pixel and object-oriented classification methods for mapping urban features using Ikonos satellite data. Appl. Geogr. 2010, 30, 650–665. [Google Scholar] [CrossRef]
  33. Myint, S.W.; Gober, P.; Brazel, A.; Grossman-Clarke, S; Weng, Q. Per-pixel versus object-based classification of urban land cover extraction using high spatial resolution imagery. Remote Sens. Environ. 2011, 115, 1145–1161. [Google Scholar] [CrossRef]
  34. Roessner, S.; Segl, K.; Heiden, U.; Kaufmann, H. Automated differentiation of urban surfaces based on airborne hyperspectral imagery. IEEE Trans. Geosci. Remote Sens. 2001, 39, 1525–1532. [Google Scholar] [CrossRef]
  35. Gamba, P.; Dell’Acqua, F. Spectral resolution in the context of very high resolution urban remote sensing. In Urban Remote Sensing; Weng, Q., Quattrochi, D.A., Eds.; CRC Press: Boca Raton, FL, USA, 2006; pp. 377–391. [Google Scholar]
  36. Yu, Q.; Gong, P.; Clinton, N.; Biging, G.; Kelly, M.; Schirokauer, D. Object-based detailed vegetation classification with airborne high resolution remote sensing imagery. Photogramm. Eng. Remote Sensing 2006, 72, 799–781. [Google Scholar] [CrossRef]
  37. Herold, M.; Liu, X.H.; Clarke, K.C. Spatial metrics and image texture for mapping urban land-use. Photogramm. Eng. Remote Sensing 2003, 69, 991–1001. [Google Scholar] [CrossRef]
  38. Jensen, J.R.; Cowen, D.C. Remote sensing of urban/suburban infrastructure and socioeconomic attributes. Photogramm. Eng. Remote Sensing 1999, 65, 611–622. [Google Scholar]
  39. Hinks, T.; Carr, H.; Laefer, D.F. Flight optimization algorithms for aerial LiDAR capture for urban infrastructure model generation. J. Comput. Civil Eng. 2009, 23, 330–339. [Google Scholar] [CrossRef]
  40. Goodwin, N.R.; Coops, N.C.; Tooke, T.R.; Christen, A.; Voogt, J.A. Characterizing urban surface cover and structure with airborne LiDAR technology. Can. J. Remote Sens. 2009, 35, 297–309. [Google Scholar] [CrossRef]
  41. Weng, Q.; Lu, D. Landscape as a continuum: An examination of the urban landscape structures and dynamics of Indianapolis city 1991–2000. Int. J. Remote Sens. 2009, 30, 2547–2577. [Google Scholar] [CrossRef]
  42. Mather, P.M. Land cover classification revisited. In Advances in Remote Sensing and GIS; Atkinson, P.M., Tate, N.J., Eds.; Wiley: New York, NY, USA, 1999; pp. 7–16. [Google Scholar]
  43. Hay, G.J.; Niemann, K.O.; McLean, G. An object-specific image-texture analysis of H-resolution forest imagery. Remote Sens. Environ. 1996, 55, 108–122. [Google Scholar] [CrossRef]
  44. Wang, F. Fuzzy supervised classification of remote sensing images. IEEE Trans. Geosci. Remote Sens. 1990, 28, 194–201. [Google Scholar] [CrossRef]
  45. Asner, G.P.; Hicke, J.A.; Lobell, D.B. Per-pixel analysis of forest structure. Vegetation indices, spectral mixture analysis and canopy reflectance modeling. In Remote Sensing of Forest Environments. Concepts and Case Studies; Wulder, M.A., Franklin, S.E., Eds.; Kluwer Academic Publishers: Dordrecht, The Netherlands, 2003; pp. 209–254. [Google Scholar]
  46. Blaschke, T.; Lang, S.; Hay, G. Object Based Image Analysis; Springer: Berlin, Germany, 2008. [Google Scholar]
  47. Blaschke, T. Object based image analysis for remote sensing. ISPRS J. Photogramm. 2010, 65, 2–16. [Google Scholar] [CrossRef]
  48. Lang, S.; Blaschke, T. Bridging remote sensing and GIS—What are the main supporting pillars? In International Archives of Photogrammetry, Remote Sensing and Spatial Information Sciences; ISPRS: Vienna, Austria, 2006; Vol. XXXVI-4/C42. [Google Scholar]
  49. Walker, J.; Blaschke, T. Object-based landcover classification for the Phoenix metropolitan area: Optimization vs. transportability. Int. J. Remote Sens. 2008, 29, 2021–2040. [Google Scholar] [CrossRef]
  50. Hay, G.J.; Castilla, G. Geographic object-based image analysis (GEOBIA): A new name for a new discipline? In Object-Based Image Analysis: Spatial Concepts for Knowledge-Driven Remote Sensing Applications; Blaschke, T., Lang, S., Hay, G.J., Eds.; Springer: Berlin, Germany, 2008; pp. 75–89. [Google Scholar]
  51. Castilla, G.; Hay, G.J. Image-objects and geo-objects. In Object-Based Image Analysis: Spatial Concepts for Knowledge-Driven Remote Sensing Applications; Blaschke, T., Lang, S., Hay, G.J., Eds.; Springer: Berlin, Germany, 2008; pp. 92–110. [Google Scholar]
  52. Liu, D.; Xia, F. Assessing object-based classification: Advantages and limitations. Remote Sens. Lett. 2010, 1, 187–194. [Google Scholar] [CrossRef]
  53. Jin, M.S.; Kessomkiat, W.; Pereira, G. Satellite-observed urbanization characters in Shanghai, China: Aerosols, Urban Heat Island effect, and land–atmosphere interactions. Remote Sens. 2011, 3, 83–99. [Google Scholar] [CrossRef]
  54. Aubrecht, C.; Steinnocher, K.; Hollaus, M.; Wagner, W. Integrating earth observation and GIScience for high resolution spatial and functional modeling of urban land use. Comput. Environ. Urban Syst. 2009, 33, 15–25. [Google Scholar] [CrossRef]
  55. Zhou, W.; Troy, A.; Grove, M. Object-based land cover classification and change analysis in the baltimore metropolitan area using multitemporal high resolution remote sensing data. Sensors 2008, 8, 1613–1636. [Google Scholar] [CrossRef]
  56. Kux, H.J.; Araujo, E.H.G. Object-based image analysis using QuickBird satellite images and GIS data, case study Belo Horizonte (Brazil). In Object Based Image Analysis; Blaschke, T., Lang, S., Hay, G.J., Eds.; Springer: Berlin, Germay, 2008; pp. 571–588. [Google Scholar]
  57. Kressler, F.; Steinnocher, K. Object-oriented analysis of image and LiDAR data and its potential for dasymetric mapping applications. In Object Based Image Analysis; Blaschke, T., Lang, S., Hay, G.J., Eds.; Springer: Berlin, Germay, 2008; pp. 611–624. [Google Scholar]
  58. Ehlers, M.; Jadkowski, M.A.; Howard, R.R.; Brostuen, D.E. Application of SPOT data for regional growth analysis and local planning. Photogramm. Eng. Remote Sensing 1990, 56, 175–180. [Google Scholar]
  59. Treitz, P.M.; Howard, P.J.; Gong, P. Application of satellite and GIS technologies for land-cover and land-use mapping at the rural-urban fringe: A case study. Photogramm. Eng. Remote Sensing 1992, 58, 439–448. [Google Scholar]
  60. Harris, P.M.; Ventura, S.J. The integration of geographic data with remotely sensed imagery to improve classification in an urban area. Photogramm. Eng. Remote Sensing 1995, 61, 993–998. [Google Scholar]
  61. Weng, Q. Land use change analysis in the Zhujiang Delta of China using satellite remote sensing, GIS, and stochastic modeling. J. Environ. Manage. 2002, 64, 273–284. [Google Scholar] [CrossRef] [PubMed]
  62. Wilkinson, G.G. A review of current issues in the integration of GIS and remote sensing data. Int. J. Geogr. Inf. Syst. 1996, 10, 85–101. [Google Scholar] [CrossRef]
  63. Harvey, W.; McGlone, J.C.; McKeown, D.M.; Irvine, J.M. User-centric evaluation of semi-automated road network extraction. Photogramm. Eng. Remote Sensing 2004, 70, 1353–1364. [Google Scholar] [CrossRef]
  64. Song, M.; Civco, D. Road extraction using SVM and image segmentation. Photogramm. Eng. Remote Sensing 2004, 70, 1365–1372. [Google Scholar] [CrossRef]
  65. Doucette, P.; Agouris, P.; Stefanidis, A. Automated road extraction from high resolution multispectral imagery. Photogramm. Eng. Remote Sensing 2004, 70, 1405–1416. [Google Scholar] [CrossRef]
  66. Kim, T.; Park, S.; Kim, M.; Jeong, S.; Kim, K. Tracking road centerlines from high resolution remote sensing images by least squares correlation matching. Photogramm. Eng. Remote Sensing 2004, 70, 1417–1422. [Google Scholar] [CrossRef]
  67. Mayer, H. Automatic object extraction from aerial imagery—A survey focusing on building. Comput. Vis. Image Understand. 1999, 74, 138–139. [Google Scholar] [CrossRef]
  68. Lee, D.S.; Shan, J.; Bethel, J.S. Class-guided building extraction from IKONOS imagery, Photogramm. Eng. Remote Sensing 2003, 69, 143–150. [Google Scholar] [CrossRef]
  69. Lee, D.H.; Lee, K.M.; Lee, S.U. Fusion of lidar and imagery for reliable building extraction. Photogramm. Eng. Remote Sensing 2008, 74, 215–225. [Google Scholar] [CrossRef]
  70. Miliaresis, G.; Kokkas, N. Segmentation and object-based classification for the extraction of the building class from LiDAR DEMs. Comput. Geosci. 2007, 33, 1076–1087. [Google Scholar] [CrossRef]
  71. Haack, B.; Bryant, N.; Adams, S. Assessment of Landsat MSS and TM data for urban and near-urban land cover digital classification. Remote Sens. Environ. 1987, 21, 201–213. [Google Scholar] [CrossRef]
  72. Lu, D.; Weng, Q. Spectral mixture analysis of the urban landscape in Indianapolis with Landsat ETM+ imagery. Photogramm. Eng. Remote Sensing 2004, 70, 1053–1062. [Google Scholar] [CrossRef]
  73. Weng, Q.; Hu, X. Medium spatial resolution satellite imagery for estimating and mapping urban impervious surfaces using LSMA and ANN. IEEE Trans. Geosci. Remote Sens. 2008, 46, 2397–2406. [Google Scholar] [CrossRef]
  74. Yeh, A.G.O.; Li, X. An integrated remote sensing and GIS approach in the monitoring and evaluation of rapid urban growth for sustainable development in the Pearl River Delta, China. Int. Plan. Studies 1997, 2, 193–210. [Google Scholar] [CrossRef]
  75. Cheng, J.; Masser, I. Urban growth pattern modeling: A case study of Wuhan City, PR, China. Landscape Urban Plan. 2003, 62, 199–217. [Google Scholar] [CrossRef]
  76. Mesev, V. The use of census data in urban image classification. Photogramm. Eng. Remote Sensing 1998, 64, 431–438. [Google Scholar]
  77. Weng, Q. Remote Sensing and GIS Integration: Theories, Methods, and Applications; McGraw-Hill: New York, NY, USA, 2009. [Google Scholar]
  78. Langford, M.; Maguire, D.J.; Unwin, D.J. The areal interpolation problem: Estimating population using remote sensing in a GIS framework. In Handling Geographical Information: Methodology and Potential Applications; Masser, I., Blakemore, M., Eds.; John Wiley & Sons, Inc.: New York, NY, USA, 1991. [Google Scholar]
  79. Lo, C.P. Automated population and dwelling unit estimation from high resolution satellite images: A GIS approach. Int. J. Remote Sens. 1995, 16, 17–34. [Google Scholar] [CrossRef]
  80. Sutton, P. Modeling population density with nighttime satellite imagery and GIS. Comput. Environ. Urban Syst. 1997, 21, 227–244. [Google Scholar] [CrossRef]
  81. Yuan, Y.; Smith, R.M.; Limp, W.F. Remodeling census population with spatial information from Landsat imagery. Comput. Environ. Urban Syst. 1997, 21, 245–258. [Google Scholar] [CrossRef]
  82. Harris, R.J.; Longley, P.A. New data and approaches for urban analysis: Modeling residential densities. Trans. GIS 2000, 4, 217–234. [Google Scholar] [CrossRef]
  83. Martin, D.; Tate, N.J.; Langford, M. Refining population surface models: Experiments with Northern Ireland census data. Trans. GIS 2000, 4, 343–360. [Google Scholar] [CrossRef]
  84. Harvey, J. Small area population estimation using satellite imagery. Trans. GIS 2000, 4, 611–633. [Google Scholar]
  85. Harvey, J.T. Estimation census district population from satellite imagery: Some approaches and limitations. Int. J. Remote Sens. 2002, 23, 2071–2095. [Google Scholar] [CrossRef]
  86. Qiu, F.; Woller, K.L.; Briggs, R. Modeling urban population growth from remotely sensed imagery and TIGER GIS road data. Photogramm. Eng. Remote Sensing 2003, 69, 1031–1042. [Google Scholar] [CrossRef]
  87. Li, G.; Weng, Q. Using Landsat ETM+ imagery to measure population density in Indianapolis, Indiana, USA. Photogramm. Eng. Remote Sensing 2005, 71, 947–958. [Google Scholar] [CrossRef]
  88. Li, G.; Weng, Q. Fine-scale population estimation: How Landsat ETM+ imagery can improve population distribution mapping? Can. J. Remote Sens. 2010, 36, 155–165. [Google Scholar] [CrossRef]
  89. Thomson, C.N. Remote sensing/GIS integration to identify potential low-income housing sites. Cities 2000, 17, 97–109. [Google Scholar] [CrossRef]
  90. Hall, G.B.; Malcolm, N.W.; Piwowar, J.M. Integration of remote sensing and GIS to detect pockets of urban poverty: The case of Rosario, Argentina. Trans. GIS 2001, 5, 235–253. [Google Scholar] [CrossRef]
  91. Weber, C.; Hirsch, J. Some urban measurements from SPOT data: Urban life quality indices. Int. J. Remote Sens. 1992, 13, 3251–3261. [Google Scholar] [CrossRef]
  92. Lo, C.P.; Faber, B.J. Integration of landsat thematic mapper and census data for quality of life assessment. Remote Sens. Environ. 1997, 62, 143–157. [Google Scholar] [CrossRef]
  93. Li, G.; Weng, Q. Measuring the quality of life in city of Indianapolis by integration of remote sensing and census data. Int. J. Remote Sens. 2007, 28, 249–267. [Google Scholar] [CrossRef]
  94. Liang, B.; Weng, Q. Assessing urban environmental quality change of Indianapolis, United States, by the remote sensing and GIS integration. IEEE J. Sel. Top. Appl. Earth Obs. Remote Sens. 2011, 4, 43–55. [Google Scholar] [CrossRef]
  95. Möller, M.; Blaschke, T. GIS-gestützte Bildanalyse der städtischen vegetation als Indikator urbaner Lebensqualität. Photogramm. Fernerkundung Geoinformation 2006, 10, 19–30. [Google Scholar]
  96. Hinz, S.; Lenhart, D; Leitloff, J. Traffic extraction and characterisation from optical remote sensing data. Photogramm. Rec. 2008, 23, 424–440. [Google Scholar] [CrossRef]
  97. Heiple, S.; Sailor, D.J. Using building energy simulation and geospatial modeling techniques to determine high resolution building sector energy consumption profiles. Energy Build. 2008, 40, 1426–1436. [Google Scholar] [CrossRef]
  98. Roth, M.; Oke, T.R.; Emery, W.J. Satellite derived urban heat islands from three coastal cities and the utilisation of such data in urban climatology. Int. J. Remote Sens. 1989, 10, 1699–1720. [Google Scholar] [CrossRef]
  99. Weng, Q.; Liu, H.; Lu, D. Assessing the effects of land use and land cover patterns on thermal conditions using landscape metrics in city of Indianapolis, United States. Urban Ecosyst. 2007, 10, 203–219. [Google Scholar] [CrossRef]
  100. Liu, H.; Weng, Q. An examination of the effect of landscape pattern, land surface temperature, and socioeconomic conditions on WNV dissemination in Chicago. Environ. Monit. Assess. 2009, 159, 143–161. [Google Scholar] [CrossRef] [PubMed]
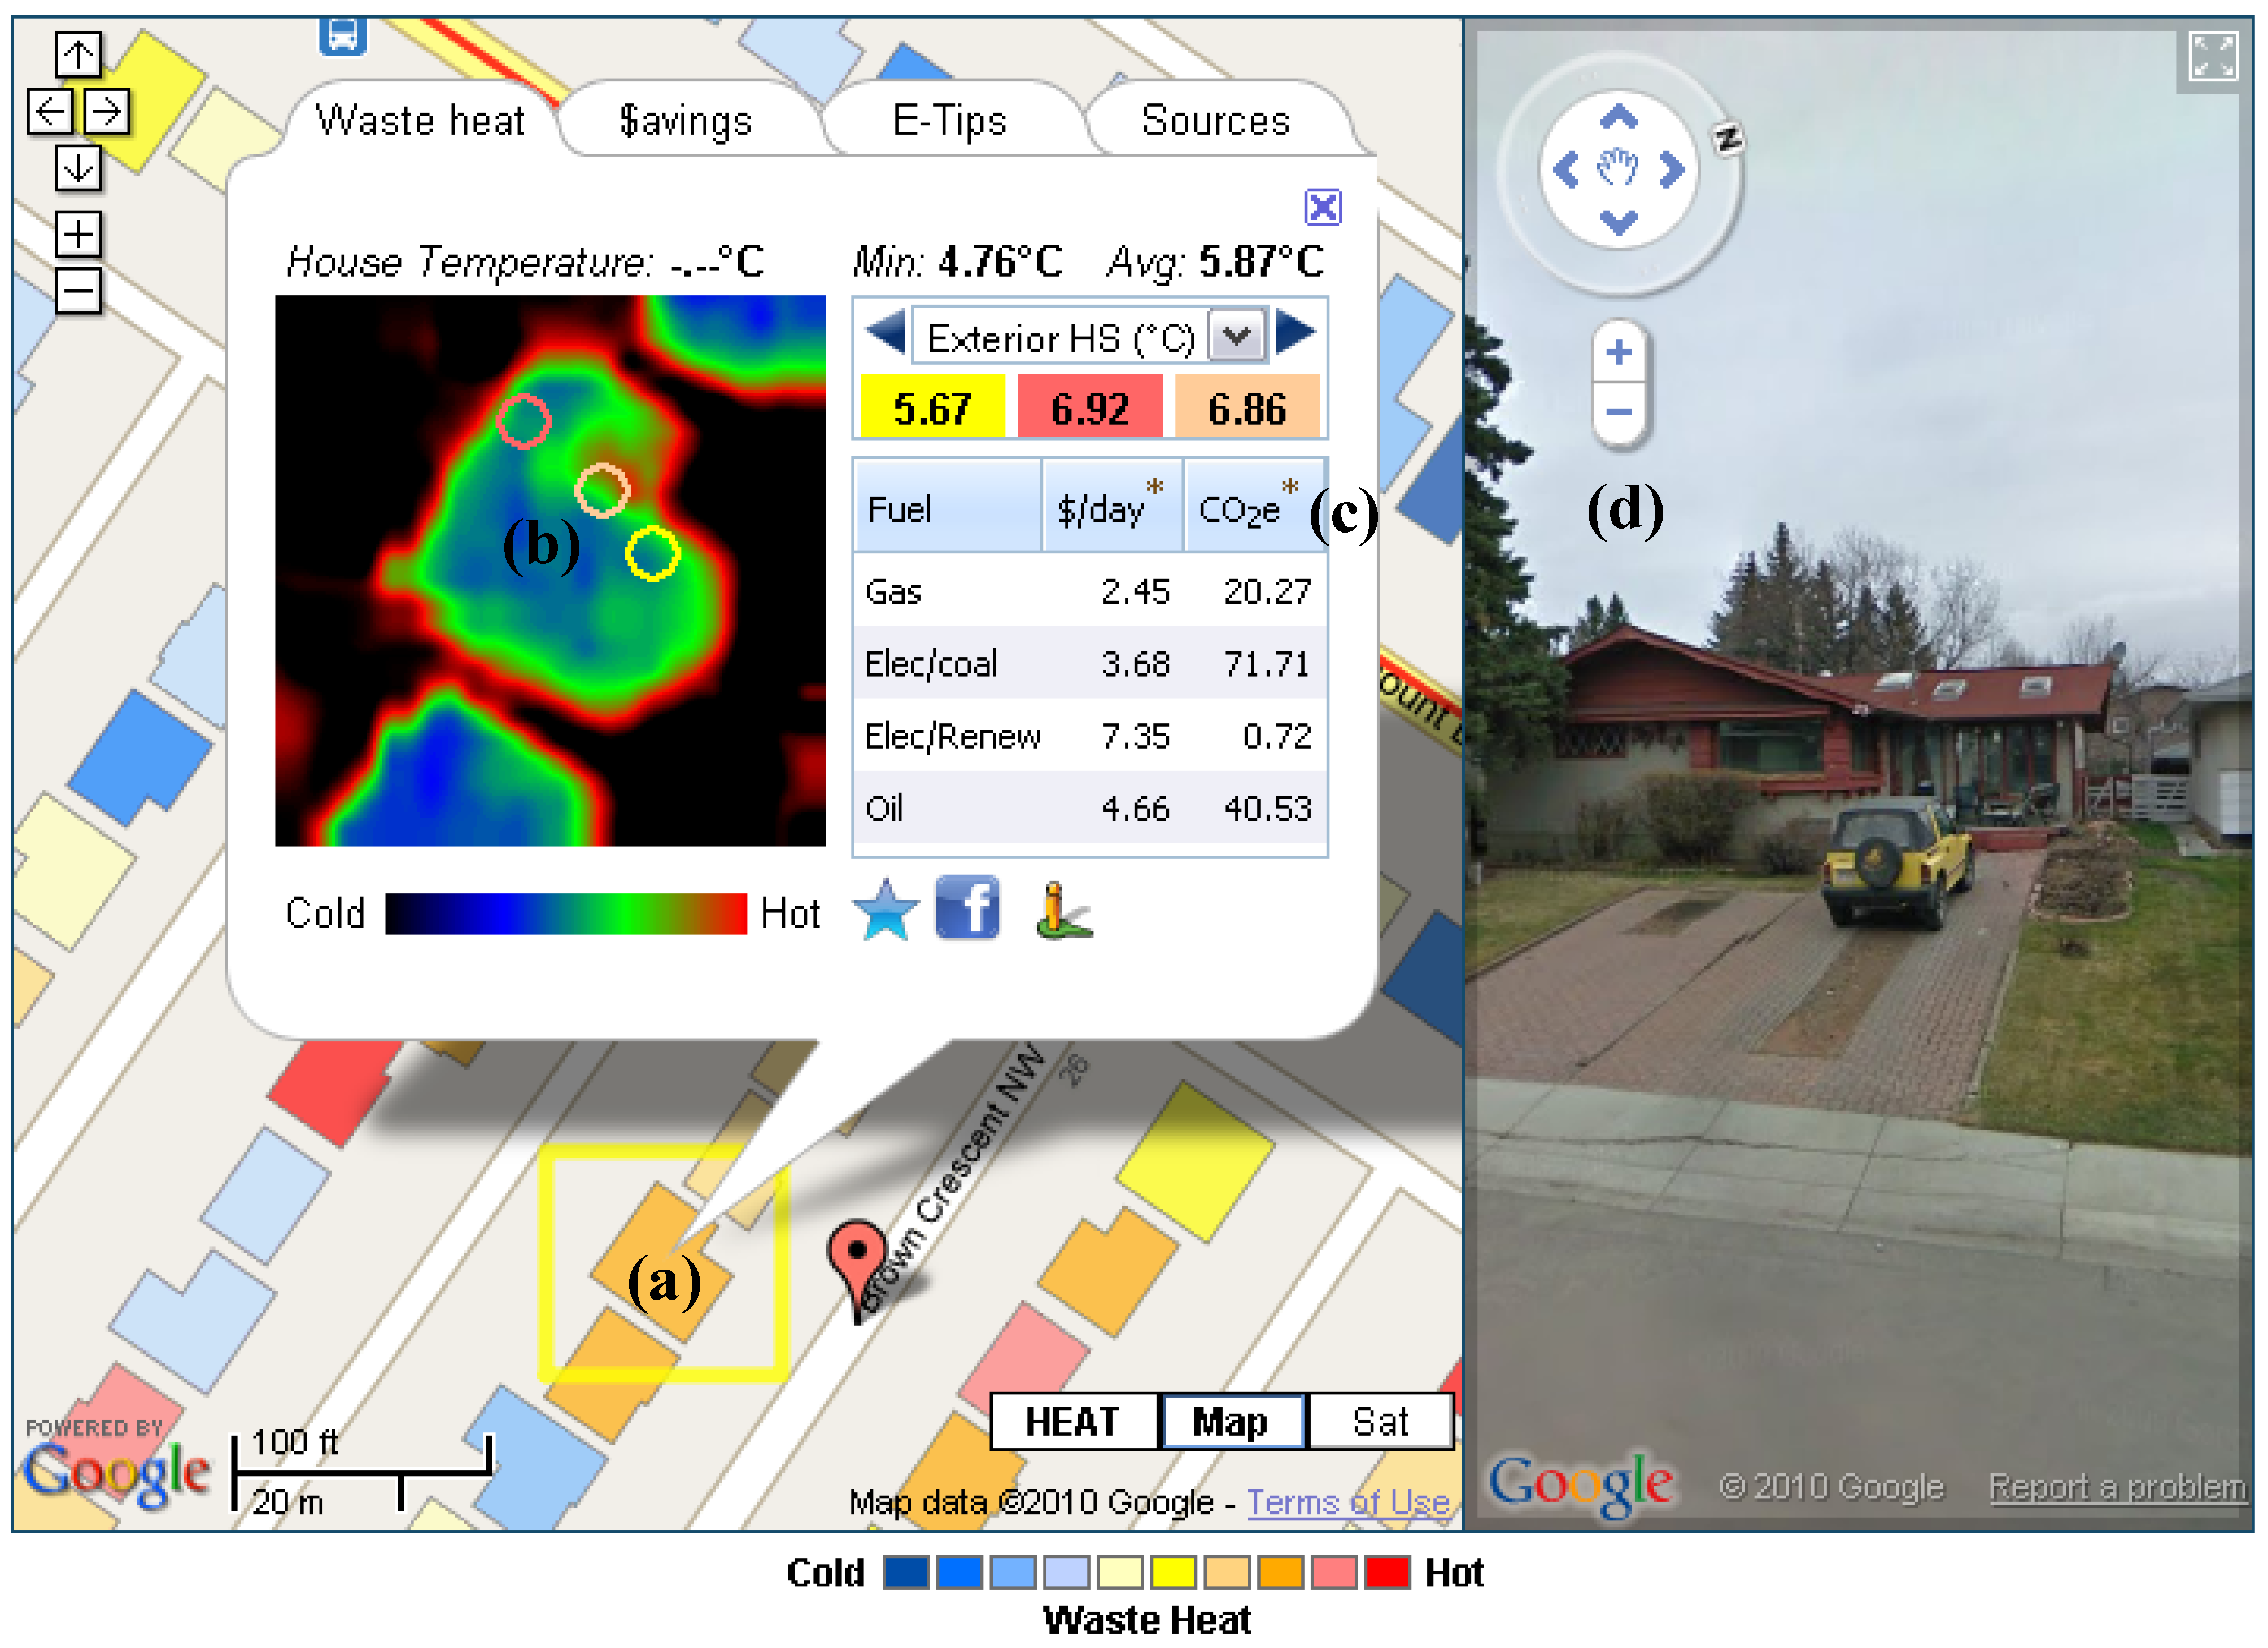
  101. Hay, G.J.; Hemachandran, B.; Kyle, C.D. HEAT (Home Energy Assessment Technologies): Residential waste heat monitoring, google maps and airborne thermal imagery. Alberta, Canada. GIM Int. 2010, 24, 13–15. [Google Scholar]
  102. Hay, G.J.; Kyle, C.D.; Hemachandran, B.; Chen, G.; Rahman, M.; Fung, T.S.; Arvai, J.L. Geospatial technologies to improve urban energy efficiency. Remote Sens. 2011, 3, 1380–1405. [Google Scholar] [CrossRef]
  103. Lu, D.; Weng, Q. Spectral mixture analysis of ASTER imagery for examining the relationship between thermal features and biophysical descriptors in Indianapolis, Indiana. Remote Sens. Environ. 2006, 104, 157–167. [Google Scholar] [CrossRef]
  104. Lu, D.; Weng, Q. Use of impervious surface in urban land use classification. Remote Sens. Environ. 2006, 102, 146–160. [Google Scholar] [CrossRef]
  105. Weng, Q.; Hu, X.; Liu, H. Estimating impervious surfaces using linear spectral mixture analysis with multi-temporal ASTER images. Int. J. Remote Sens. 2009, 30, 4807–4830. [Google Scholar] [CrossRef]
  106. Resch, B.; Lippautz, M.; Mittlboeck, M. Pervasive monitoring-a standardised sensor web approach for intelligent sensing infrastructures. Sensors 2010, 10, 11440–11467. [Google Scholar]
  107. Gross, N. The Earth will don an electronic skin. BusinessWeek Online. 30 August 1999. Available online: http://www.businessweek.com/1999/99_35/b3644024.htm (accessed on 20 February 2011).
  108. Paulsen, H.; Riegger, U. SensorGIS-Geodaten in Echtzeit. GIS-Bus. 2006, 8, 17–19. [Google Scholar]
  109. Resch, B.; Britter, R.; Ratti, C. Live urbanism-towards the senseable city and beyond. In Sustainable Architectural Design: Impacts on Health; Pardalos, P., Rassia, S., Eds.; 2011; in press. [Google Scholar]
  110. Chong, C.; Kumar, S. Sensor networks: Evolution, opportunities, and challenges. Proc. IEEE 2003, 91, 1247–1256. [Google Scholar] [CrossRef]
  111. Lesser, V.; Ortiz, C.; Tambe, M. Distributed Sensor Networks: A Multiagent Perspective; Springer: Berlin, Germany, 2003. [Google Scholar]
  112. De Wolf, T.; Holvoet, T. Towards Autonomic Computing: Agent-Based Modelling, Dynamical Systems Analysis, and Decentralised Control. In Proceedings of the IEEE International Conference on Industrial Informatics, 2003, INDIN 2003, Banff, AB, Canada, 21–24 August 2003; pp. 470–479.
  113. Botts, M.; Robin, A.; Davidson, J.; Simonis, I. OpenGIS Sensor Web Enablement Architecture; OpenGIS Discussion Paper OGC 06-021r1; Version 1.0; Open Geospatial Consortium Inc.: Wayland, MA, USA, 4 March 2006. [Google Scholar]
  114. Goodchild, M.F. Communicating geographic information in a digital age. Ann. Assoc. Am. Geogr. 2000, 90, 344–355. [Google Scholar] [CrossRef]
  115. Gore, A. The digital earth: Understanding our planet in the 21st Century. Photogramm. Eng. Remote Sensing 1999, 65, 528–530. [Google Scholar] [CrossRef]
  116. Craglia, M.; Goodchild, M.F.; Annoni, A.; Camara, G.; Gould, M.; Kuhn, W.; Mark, D.M.; Masser, I.; Maguire, D.J.; Liang, S.; et al. Next-generation digital earth. A position paper from the Vespucci initiative for the advancement of geographic information science. Int. J. Spat. Data Infrastruct. Res. 2008, 3, 146–167. [Google Scholar]
  117. Goodchild, M.F. Citizens as voluntary sensors: Spatial data infrastructure in the world of Web 2.0. Int. J. Spat. Data Infrastruct. Res. 2007, 2, 24–32. [Google Scholar]
  118. Mesev, V. Identification and characterisation of urban building patterns using IKONOS imagery and point-based postal data. Comput. Environ. Urban Syst. 2005, 29, 541–557. [Google Scholar] [CrossRef]
  119. Faust, N.L.; Anderson, W.H.; Star, J.L. Geographic information systems and remote sensing future computing environment. Photogramm. Eng. Remote Sensing 1991, 57, 655–668. [Google Scholar]
  120. Kimes, D.S.; Harrison, P.R.; Ratcliffe, P.A. A knowledge-based expert system for inferring vegetation characteristics. Int. J. Remote Sens. 1991, 12, 1987–2020. [Google Scholar] [CrossRef]
  121. Steiniger, S.; Hay, G.J. Free and open source geographic information tools for landscape ecology: A review. Ecol. Inf. 2009, 4, 183–195. [Google Scholar] [CrossRef]
  122. Gao, J. Integration of GPS with remote sensing and GIS: reality and prospect. Photogramm. Eng. Remote Sensing 2002, 68, 447–453. [Google Scholar]
  123. Karimi, H.A.; Khattak, A.H; Hummer, J.E. Evaluation of mobile mapping systems for roadway data collection. J. Comput. Civil Eng. 2000, 14, 168–173. [Google Scholar] [CrossRef]
  124. Xue, Y.; Cracknell, A.P.; Guo, H.D. Telegeoprocessing: The integration of remote sensing, geographic information system (GIS), global positioning system (GPS) and telecommunication. Int. J. Remote Sens. 2002, 23, 1851–1893. [Google Scholar] [CrossRef]
  125. Sabins, F.F. Remote Sensing: Principles and Interpretation; W.H. Freeman: New York, NY, USA, 1987. [Google Scholar]
  126. Torrens, P.M. Wi-Fi geographies. Ann. Assoc. Am. Geogr. 2008, 98, 59–84. [Google Scholar] [CrossRef]
  127. Goodchild, M.F. Citizens as sensors: The world of volunteered geography. GeoJournal 2007, 69, 211–221. [Google Scholar] [CrossRef]
  128. Resch, B.; Mittlboeck, M.; Kranzer, S.; Sagl, G.; Heistracher, T.; Blaschke, T. “People as sensors” mittels personalisertem geo-tracking. In Angewandte Geoinformatik; Strobl, J., Blaschke, T., Griesebner, G., Eds.; Wichmann Verlag: Heidelberg, Germany, 2011; pp. 682–687. [Google Scholar]
  129. Yu, Q.; Gong, P.; Clinton, N.; Biging, G.; Kelly, M.; Schirokauer, D. Object-based detailed vegetation classification with airborne high resolution remote sensing imagery. Photogramm. Eng. Remote Sensing 2006, 72, 799–781. [Google Scholar] [CrossRef]
  130. Liu, D.; Kelly, M.; Gong, P. A spatial–temporal approach to monitoring forest disease spread using multi-temporal high spatial resolution imagery. Remote Sens. Environ. 2006, 101, 167–180. [Google Scholar] [CrossRef]
  131. Chen, K. Correlations between Census Dwelling Data and Remotely Sensed Data. In Proceedings of the SIRC 98: 10th Annual Colloquium of the Spatial Information Research Centre, Dunedin, New Zealand, 16–19 November 1998.
  132. Banzhaf, E.; Kindler, A.; Haase, D. Monitoring and Modelling Indicators for Urban Shrinkage—The City of Leipzig, Germany. In Proceedings of the Second Workshop of the EARSeL SIG on Remote Sensing of Land Use and Land Cover, Bonn, Germany, 28–30 September 2006.
  133. Hollands, R.G. Will the real smart city please stand up? Intelligent, progressive or entrepreneurial? City 2008, 12, 303–320. [Google Scholar] [CrossRef]
  134. Giffinger, R.; Fertner, C.; Kramar, H.; Meijers, E.; Pichler-Milanović, N. Smart Cities: Ranking of European Medium-Sized Cities; Final Report; Centre of Regional Science, Vienna UT: Vienna, Austria, October 2007; Available online: www.smart-cities.eu/download/smart_cities_final_report.pdf (accessed on 9 August 2011).
  135. Partridge, H. Developing a Human Perspective to the Digital Divide in the Smart City. In Presented at ALIA 2004, Brisbane, QLD, Australia, 21–24 September 2004; Available online: http://eprints.qut.edu.au/1299/1/partridge.h.2.paper.pdf (accessed on 9 August 2011).
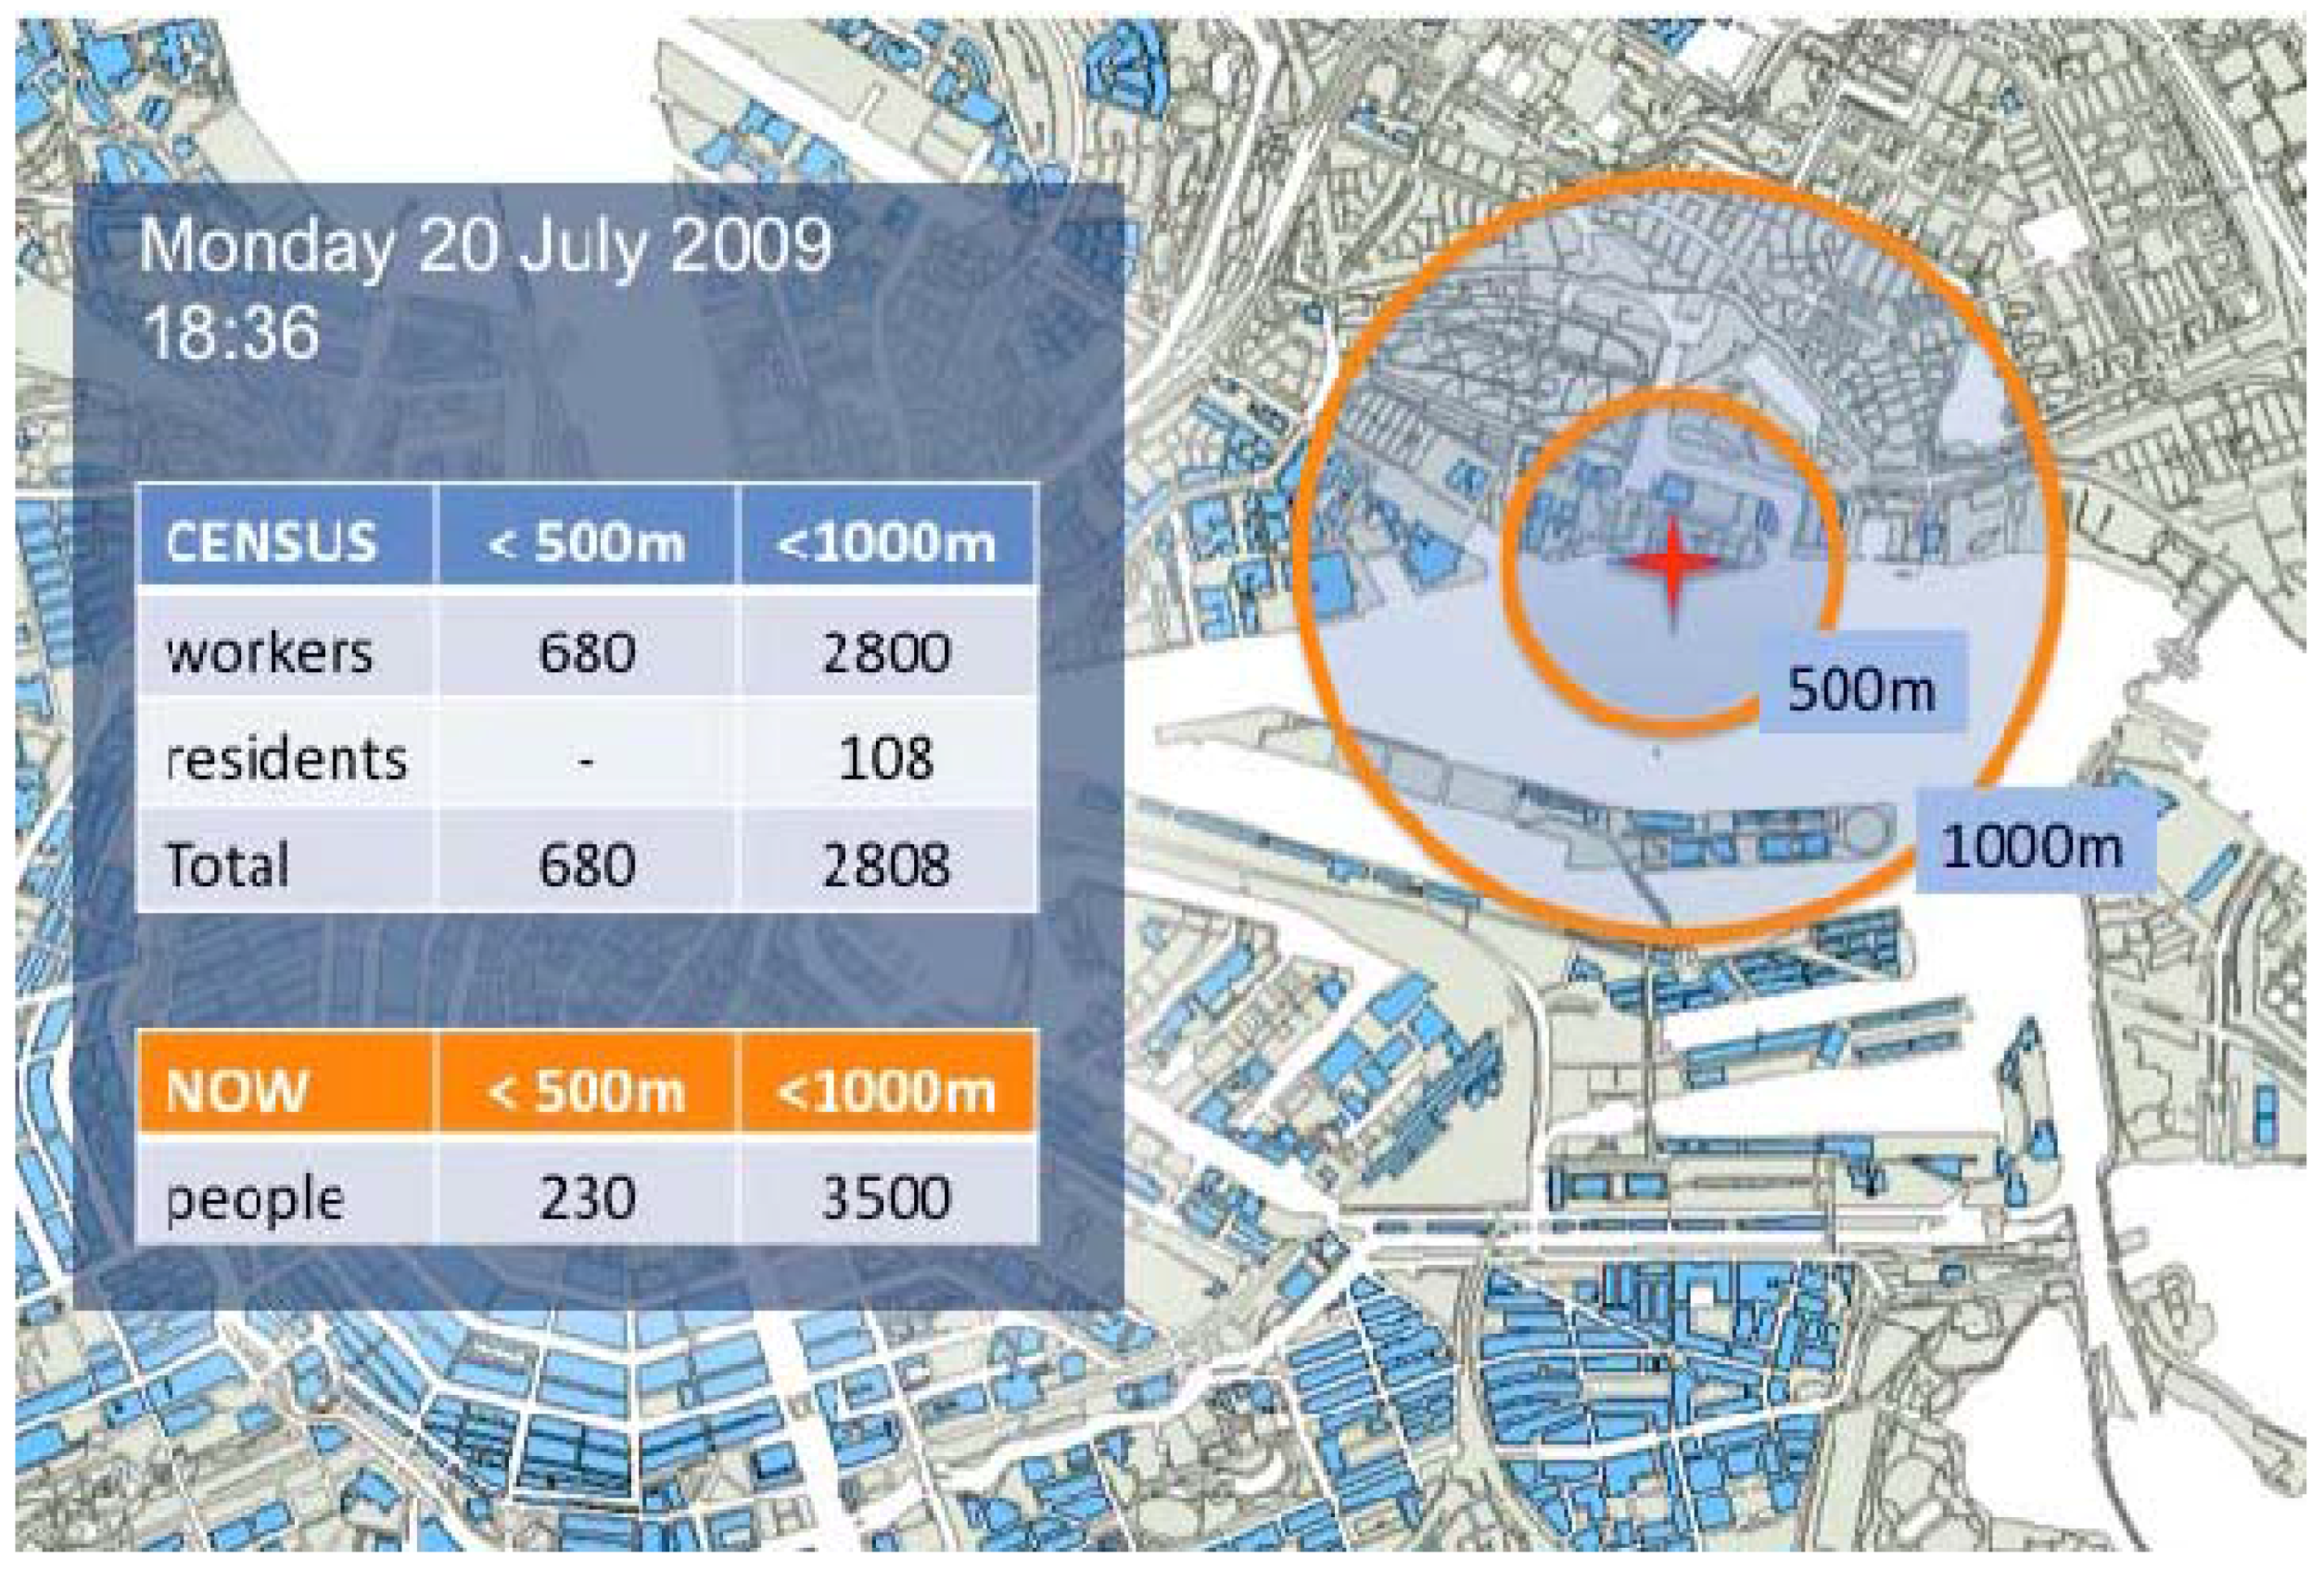
  136. Calabrese, F.; Ratti, C. Real time rome. Netw. Commun. Stud. 2006, 20, 247–258. [Google Scholar]
  137. Reades, J.; Calabrese, F.; Sevtsuk, A.; Ratti, C. Cellular census: Explorations in urban data collection. Pervasive Comput. 2007, 6, 30–38. [Google Scholar] [CrossRef]
  138. Dierig, S.; Lachmund, J.; Mendelsohn, A. Science and the City; Workshop, Max Planck Institute for the History of Science: Berlin, Germany, 1–3 December 2000; Available online: http://vlp.mpiwg-berlin.mpg.de/exp/dierig/science_city.html (accessed on 10 September 2010).
  139. Netherlands Organization for Scientific Research. Urban Sciences. Interdisciplinary Research Programme on Urbanization & Urban Culture in The Netherlands. 2007. Available online: http://www.urbansciences.eu (accessed on 26 August 2010).
  140. Resch, B. Live Geography—Standardised Geo-sensor Networks for Real-Time Monitoring in Urban Environments. Ph.D. Thesis, University of Salzburg, Salzburg, Austria, December 2009. [Google Scholar]
  141. Resch, B.; Mittlboeck, M.; Girardin, F.; Britter, R.; Ratti, C. Live geography-embedded sensing for standardised urban environmental monitoring. Int. J. Adv. Syst. Meas. 2009, 2, 156–167. [Google Scholar]
  142. Resch, B.; Lippautz, M.; Mittlboeck, M. Pervasive monitoring-a standardised sensor web approach for intelligent sensing infrastructures. Sensors 2010, 10, 11440–11467. [Google Scholar] [CrossRef] [PubMed] [Green Version]
  143. Nittel, S.A. Survey of geosensor networks: Advances in dynamic environmental monitoring. Sensors 2009, 9, 5664–5678. [Google Scholar] [CrossRef] [PubMed]
  144. Ferscha, A.; Vogl, S.; Beer, W. Context sensing, aggregation, representation and exploitation in wireless networks. Sci. Int. J. Parallel Distrib. Comput. 2005, 6, 77–81. [Google Scholar]
  145. Goodchild, M.F. Citizens as sensors: The world of volunteered geography. GeoJournal 2007, 69, 211–221. [Google Scholar] [CrossRef]
  146. Campbell, A.T.; Eisenman, S.B.; Lane, N.D.; Miluzzo, E.; Peterson, R. People-Centric Urban Sensing. In Proceedings of the 2nd ACM/IEEE Annual International Wireless Internet Conference, Boston, MA, USA, 2–5 August 2006.
  147. Oke, T.R. Initial Guidance to Obtain Representative Meteorological Observations at Urban Sites; IOM Report No.81, WMO/TD. No. 1250; World Meteorological Organization: Geneva, Switzerland, 2006. [Google Scholar]
  148. Anonymous. Reviewer B, comments to the second submission of Manuscript ID: remotesensing-8447-Blaschke-at. 15 June 2011. [Google Scholar]

