Article

Global Distribution of Cloud Top Height as Retrieved from SCIAMACHY Onboard ENVISAT Spaceborne Observations

Institute of Environmental Physics, University of Bremen, D-28334 Bremen, Germany
*
Author to whom correspondence should be addressed.
Remote Sens. 2011, 3(5), 836-844; https://doi.org/10.3390/rs3050836
Submission received: 21 February 2011 / Revised: 13 April 2011 / Accepted: 19 April 2011 / Published: 27 April 2011
(This article belongs to the Special Issue Atmospheric Remote Sensing)

Abstract

:
The spatial and temporal analysis of the SCanning Imaging Absorption SpectroMeter for Atmospheric CHartographY (SCIAMACHY) onboard ENVISAT global cloud top height data for 2003–2006 is presented. The cloud top height is derived using a semi-analytical cloud top height retrieval algorithm based on an asymptotic solution of the radiative transfer equation in the oxygen A-band. The analysis is valid for thick clouds only. As expected, clouds are higher in the equatorial region. The cloud altitudes decrease towards the Poles due to the general decrease of the troposphere height. The global average cloud top height as derived from SCIAMACHY measurements is 7.3 km. We also studied the planetary reflectivity R at 443 nm and found that the annual average is R = 0.49 ± 0.08 for the years analyzed.

1. Introduction

Clouds play a major role in the water and energy cycles. They bring rain and floods, and are of importance for the global energy balance, clearing of the atmosphere, and the supply of surface water. Cloudiness is the least understood and the most important component of the weather and climate on Earth. This was the reason for the establishment of several cloud observation programs using global satellite observations. The most extended database of cloud properties is provided by The International Satellite Cloud Climatology Project (ISSCP, http://isccp.giss.nasa.gov/). ISSCP was established in 1982 as part of the World Climate Research Program. Data collection began on 1 July 1983. The main products are cloud cover fraction (CF), cloud top height, and the vertical profile of the atmospheric temperature. The ISCCP global average cloud top pressure ( CTP ) H ¯ is equal to 574 hPa, which roughly corresponds to the cloud top height (CTH) ~ 4.5 km. It was found that the global average cloud optical thickness is close to 4.
ISCCP CTHs are derived using IR measurements and, therefore, they often give the heights of upper level clouds (e.g., cirrus), while the clouds positioned at lower levels (not seen by IR measurements in case of multi-layered cloud systems) can have an important radiative impact. Oxygen A-band spectrometry [1,2,3,4,5,6,7] is capable of detecting lower level clouds in the presence of cirrus clouds. Therefore, correspondent measurements provide a valuable addition to the ISCCP CTH climatology. IR retrievals, however, can see low level clouds if there is no cloud above and there is sufficient contrast to the ground (especially if measurements in the CO2 absorption band that are positioned around 15 μm are used).
The task of the present paper is to present the results for CTH measurements for 4 years of The SCanning Imaging Absorption SpectroMeter for Atmospheric CHartographY (SCIAMACHY) global measurements (2003–2006). SCIAMACHY is the spectrometer operating in the spectral range 0.24–2.4 μm with eight channels, where the measurements are made with the spectral resolution of 2.4–14.8 Å, depending on the channel [8]. The results are derived by fitting the measured oxygen A–band reflectance spectra with the modeled ones for single-layered homogeneous water clouds. Radiative transfer calculations are very time demanding for calculations in the gaseous absorption bands. Therefore, we applied the asymptotic theory valid at COT > 5 for the determination of CTH from SCIAMACHY data [3]. This speeds up all the calculations considerably. However, the price for this is the fact that only thick clouds can be analyzed. The corresponding analysis can be still useful for various applications. In addition, it contains complimentary information compared to thermal infrared measurements. In particular, it is well known that SCIAMACHY oxygen A-band measurements provide better sensitivity and higher accuracy for low clouds compared to thermal infrared measurements (e.g., at 11 μm). On the other hand (unlike thermal infrared measurements), retrievals during the night are not possible. Due to the ENVISAT forenoon-orbit there is no data available above ≈60°N during the northern winter. The same applies for the southern winter in the Southern Hemisphere. This feature is of importance for several Level-3 products such as annual averages.

2. A Brief Description of the Algorithm

The comprehensive description of the inversion algorithm is given in [3]. It is based on the fitting of the SCIAMACHY reflectance spectrum in the oxygen A-band using the radiative transfer model, which accounts (approximately) for multiple light scattering and absorption in a vertically homogeneous cloud. The vector nature of light is ignored in the retrieval procedure. The inhomogeneity is entirely due to the well known variation of the oxygen absorption coefficient with the height. The scattering above cloud is accounted in the framework of the single scattering approximation assuming the vertically inhomogeneous light scattering layer [9]. The radiative interaction of a cloud layer with the underlying surface, which is of importance for moderately thick clouds, is fully accounted for. In addition, it is taken into account that the single scattering albedo varies along the vertical due to the variation of oxygen concentration with height. The details of the forward model and its errors (smaller than 5% at COT ≥ 5 for most of underlying surfaces) are studied in [9]. The algorithm retrieves the cloud optical thickness (needed for the oxygen A-band fit in the spectral range 759–767 nm) at 757 nm, where the absorption of light by oxygen can be neglected. It is possible to obtain high quality fits with different CTHs if different cloud geometrical thicknesses (CGT) L are assumed in the retrieval procedure. Therefore, we did not assume the value of CGT but rather retrieved it with CTH H simultaneously. The following procedure is used. We started from the assumed value of CGT equal to 0.1 km, then we retrieved CTH using the fitting procedure. This also enables the calculation of the maximal error of the fit δ. Repeating the procedure for the sequence of CGTs, we derive the function δ(L) for L in the range 0.1–10 km. The minimal value of this function gives the results of retrievals, namely, the pair (L,H). This enables an accurate determination of H. The accuracy of the determined L is rather low, however. This is due to very similar influences of both unknown parameters on the oxygen A-band spectrum (with the dominated influence of CTH). However, our numerical experiments show that the simultaneous retrievals of (L,H) do in fact improve the accuracy of CTH determination [3]. Therefore, we follow this scheme in our Semi-Analytical CloUd Retrieval Algorithm (SACURA, see http://www.iup.uni-bremen.de/sacura/). The application of the first version of SACURA to one year of SCIAMACHY measurements (2004) is described in [10]. Since then, SACURA was improved and the next version of the code (SACURA_2.1) was created. SACURA_2.1 was implemented in the DLR operational SCIANACHY retrieval scheme [11]. The improvements were as follows:

3. Results

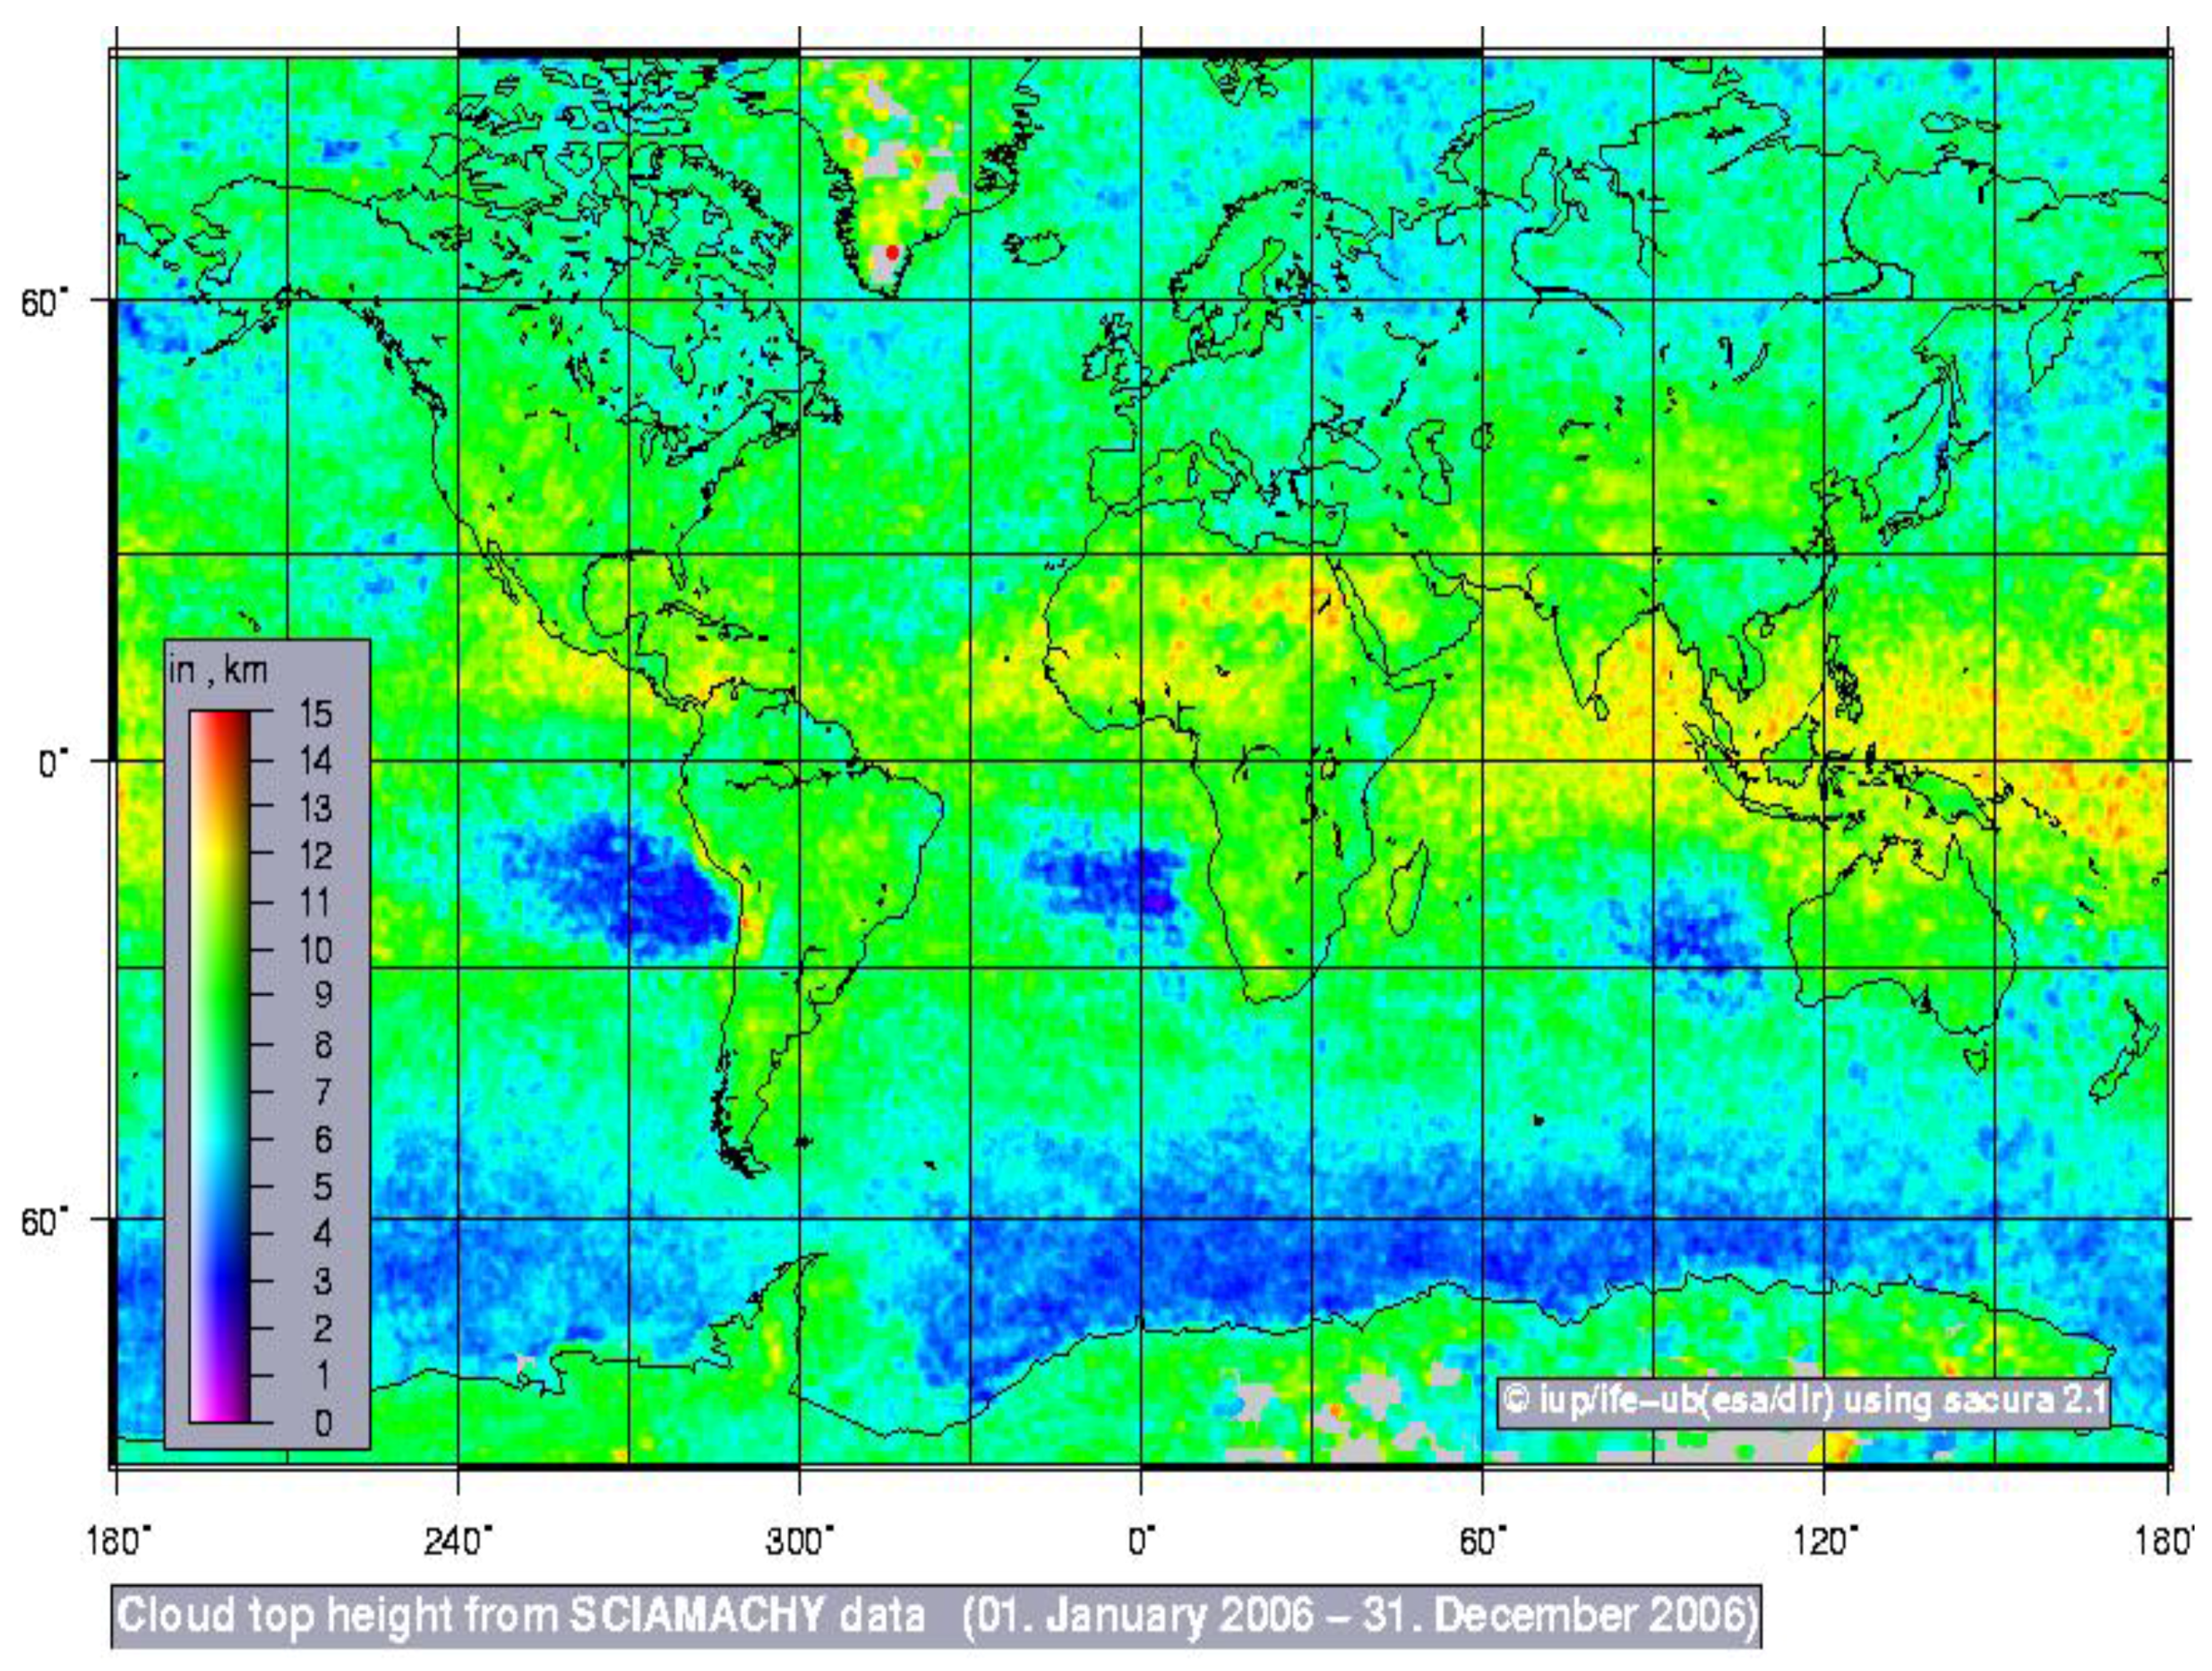
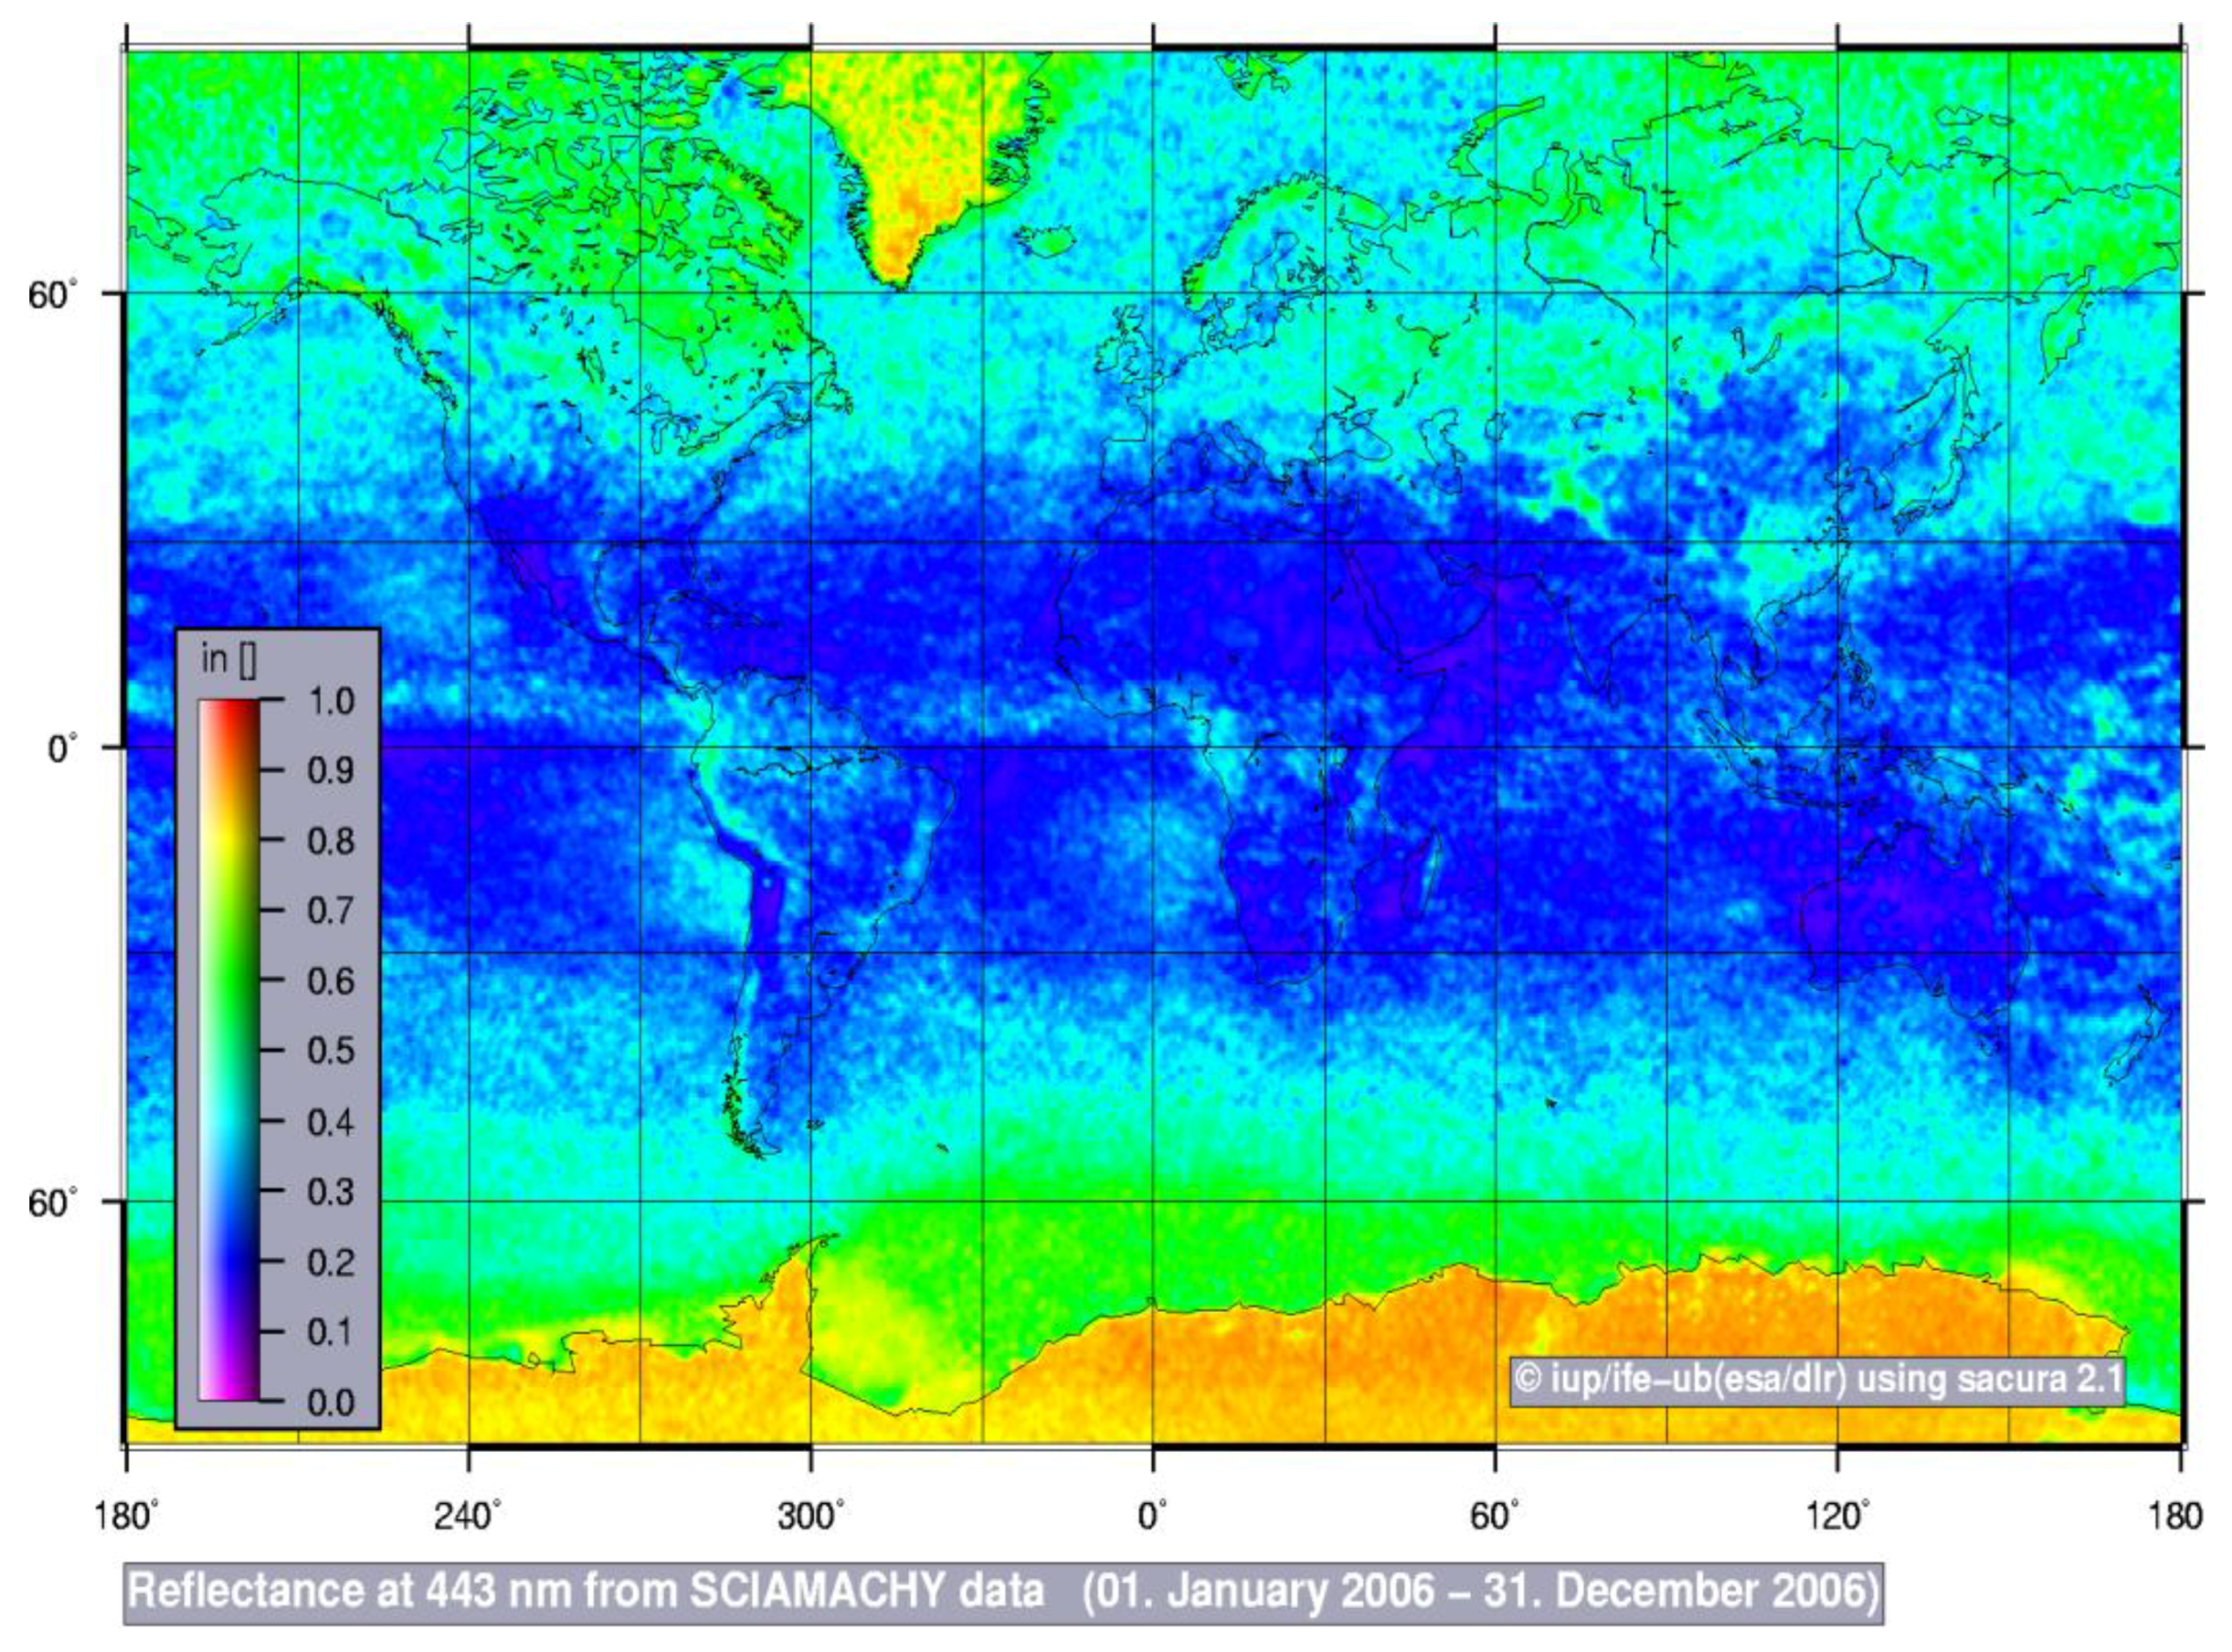
The derived CTH global map for 2006 is shown in Figure 1. We see that the derived CTH spatial pattern distribution is similar to other existing products (see, e.g., [5,6,7]). The results over Greenland and Antarctica are less reliable due to problems with the snow screening procedure. The CTH increases in the area close to the equator, where deep convection takes place. Furthermore, large values of CTH are retrieved over the Pacific Ocean to the north of Australia, which is a general feature of other available cloud climatologies. Small values of CTH are observed east of Australia, South Africa, and South America, and also north of Antarctica. The clouds north of Antarctica are not only low but they are optically thick as demonstrated in Figure 2, where we present the global map of reflectance R as measured by SCIAMACHY at the wavelength 443 nm. The reflectance (or reflectivity) is defined as R = π I r e f l / μ 0 E 0 . Here, I r e f l is the top-of-atmosphere intensity of upwelling radiation, μ0 is the cosine of the solar zenith angle, and E0 is the top-of-atmosphere solar irradiance. Large values of R (say, above 0.4) correspond to thick clouds or snow/ice surfaces. Snow/ice has values of R above 0.8 in most of cases. Figure 2 demonstrates how the atmosphere of our planet looks from space in yearly average visible light reflectance. All the pixels have been considered. Note that the reflectance of the surfaces except snow/ice is generally low at the wavelength 443 nm and the contribution from the surface does not distort the general atmospheric patterns seen on the map. This is also confirmed by almost absent contrast between land in the ocean as seen on this map of R (443 nm). Higher reflectivity in the polar regions is not only due to clouds but also due to the seasonal snow and ice cover. Generally, we see that the most reflective surfaces on a global scale are north of 45°N latitude and south of 45°S latitude.
Figure 1. The cloud top height map for year 2006.
Remotesensing 03 00836 g001
Figure 2. The reflectivity (443 nm) map for 2006. The global average value is 0.49.
Remotesensing 03 00836 g002
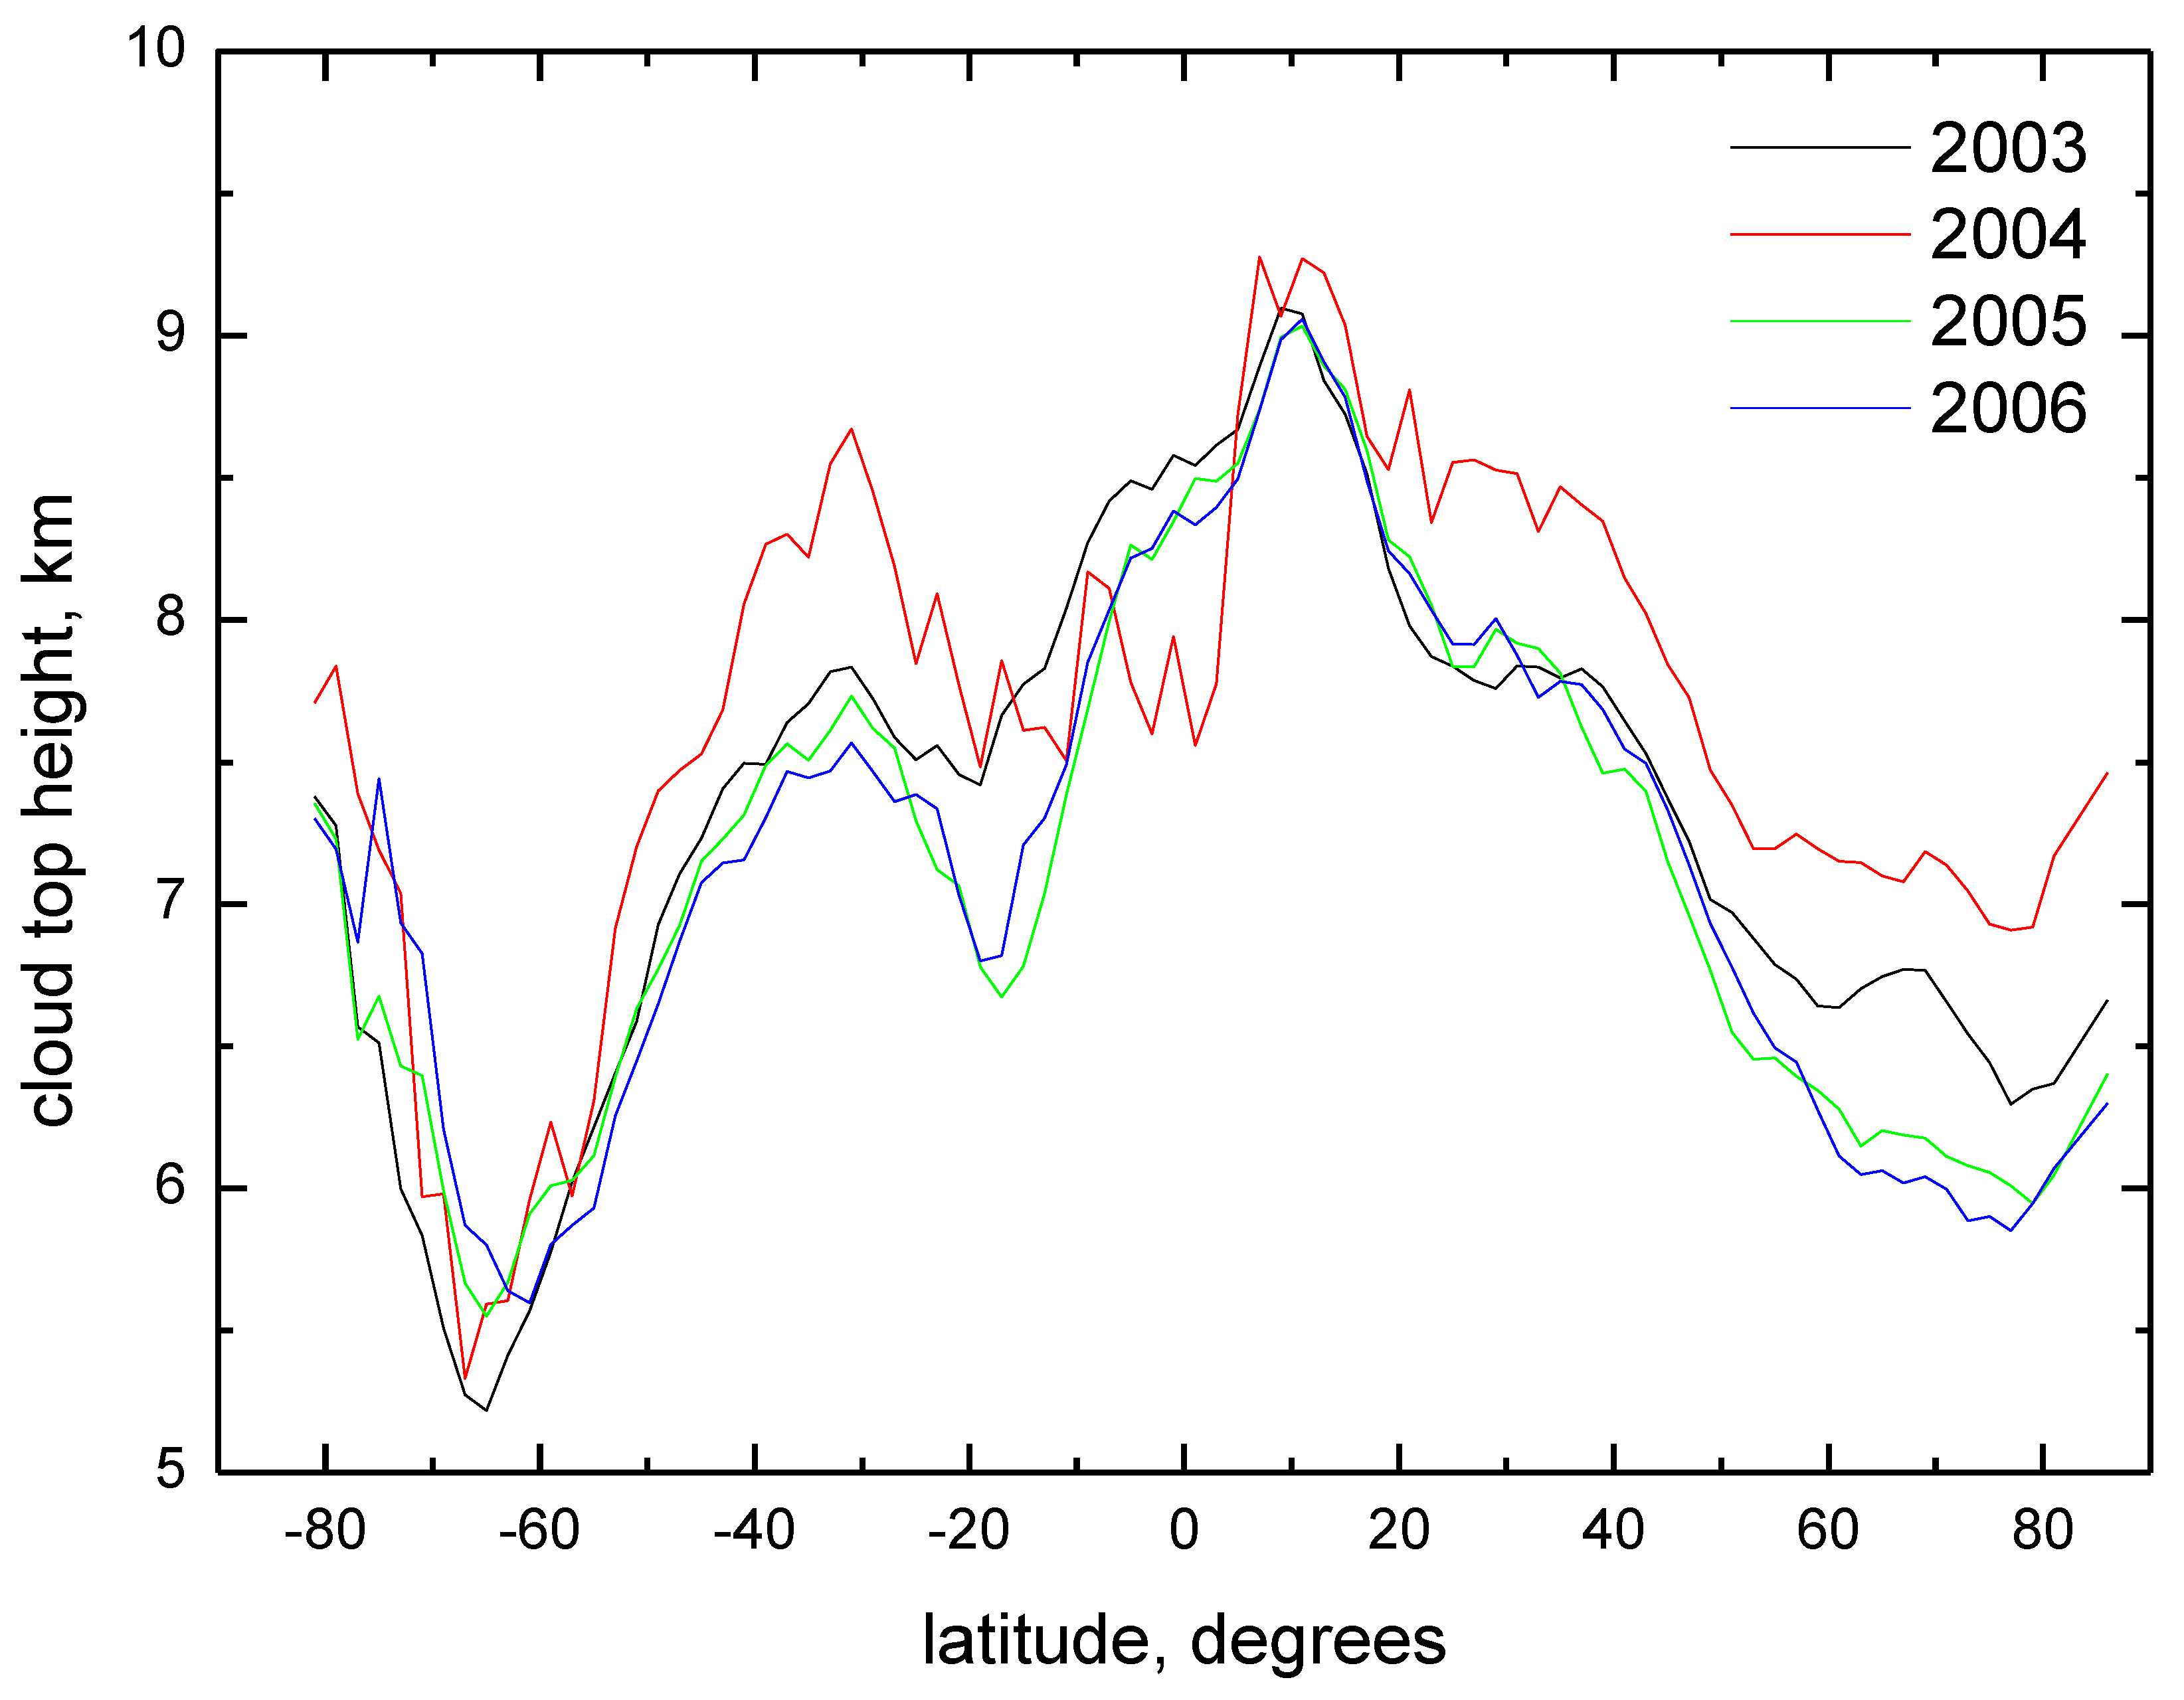
The distribution of CTH over latitude for 2003–2006 is shown in Figure 3. We find that the largest CTHs are found in the region of the Inter Tropical Convergence Zone (ITCZ) around 10°N. With the departure from ITCZ, the CTH decreases (due to the downward air streams in the Hadley cell). The distribution of CTHs is not symmetrical with respect to the Equator with the shift towards the Northern Hemisphere and with the secondary maximum of the CTH around 30°S. Clouds are generally lower towards the poles due to the decrease in the tropopause height. The results in the bands of about 20 degrees around both poles are less reliable due to the decrease of accuracy related to the problems related to the identification of clouds over snow and ice.
Figure 3. The latitudinal behavior of cloud top height (CTH) for 2003–2006.
Remotesensing 03 00836 g003
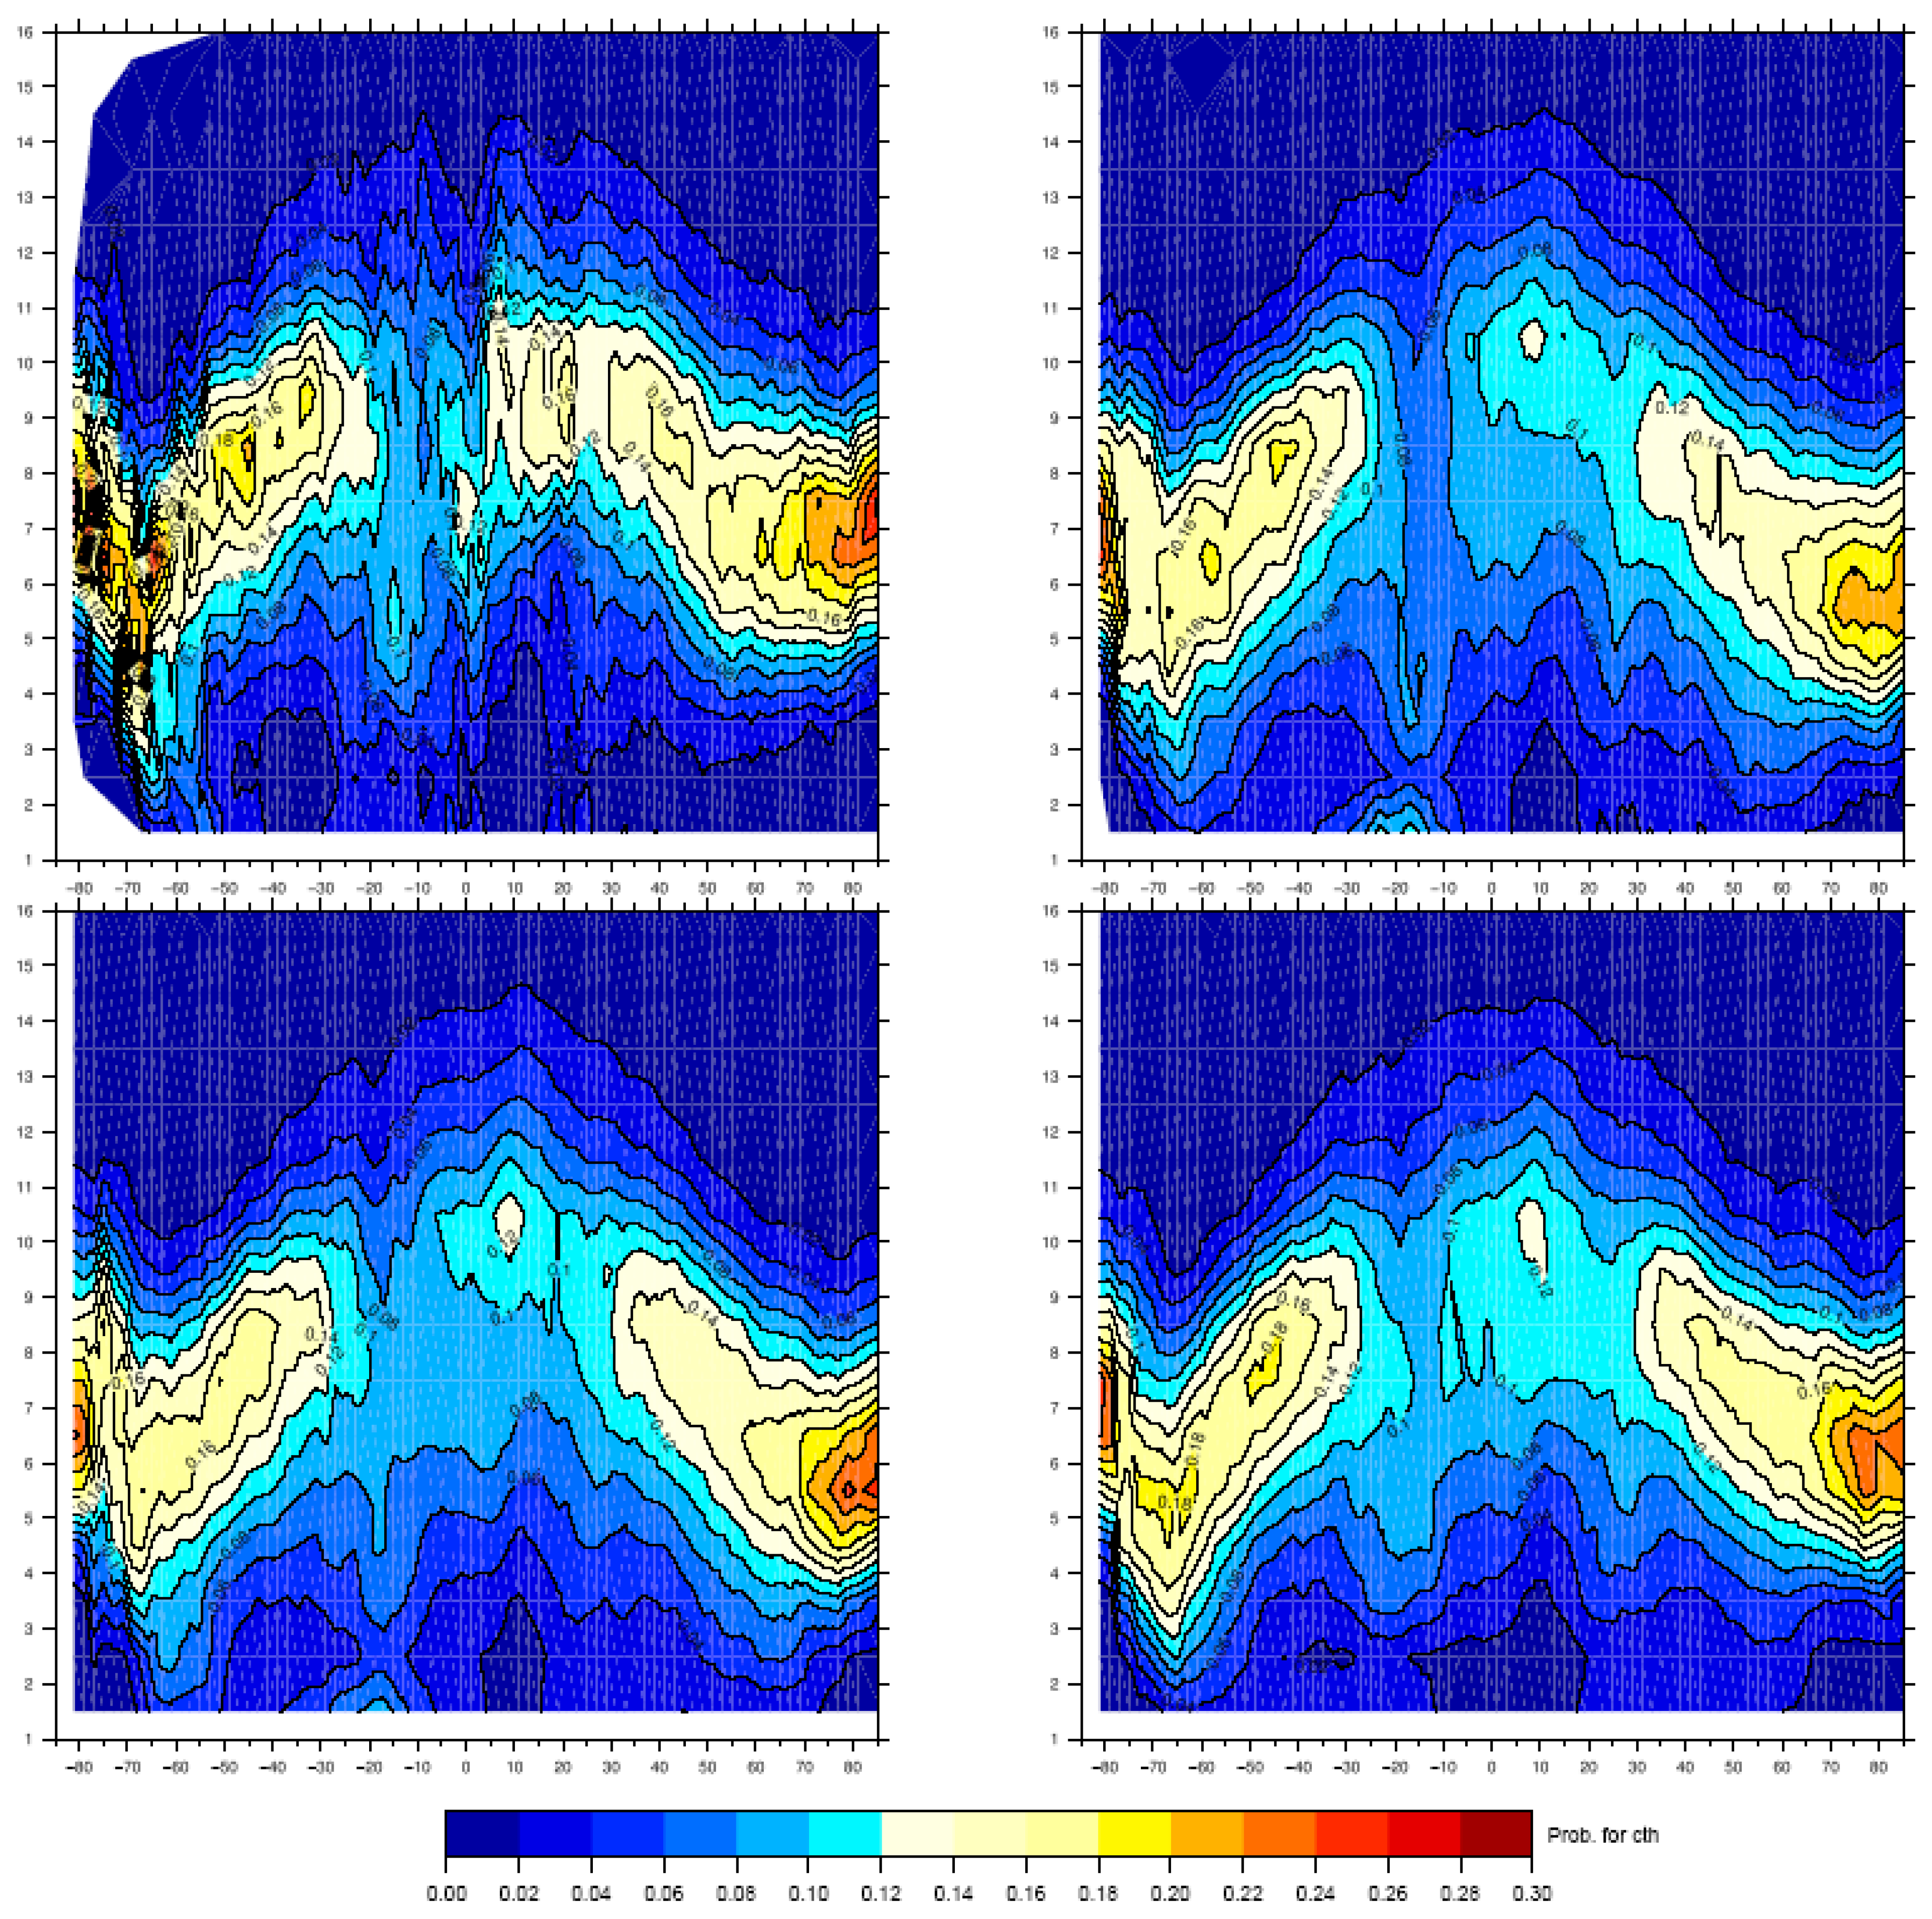
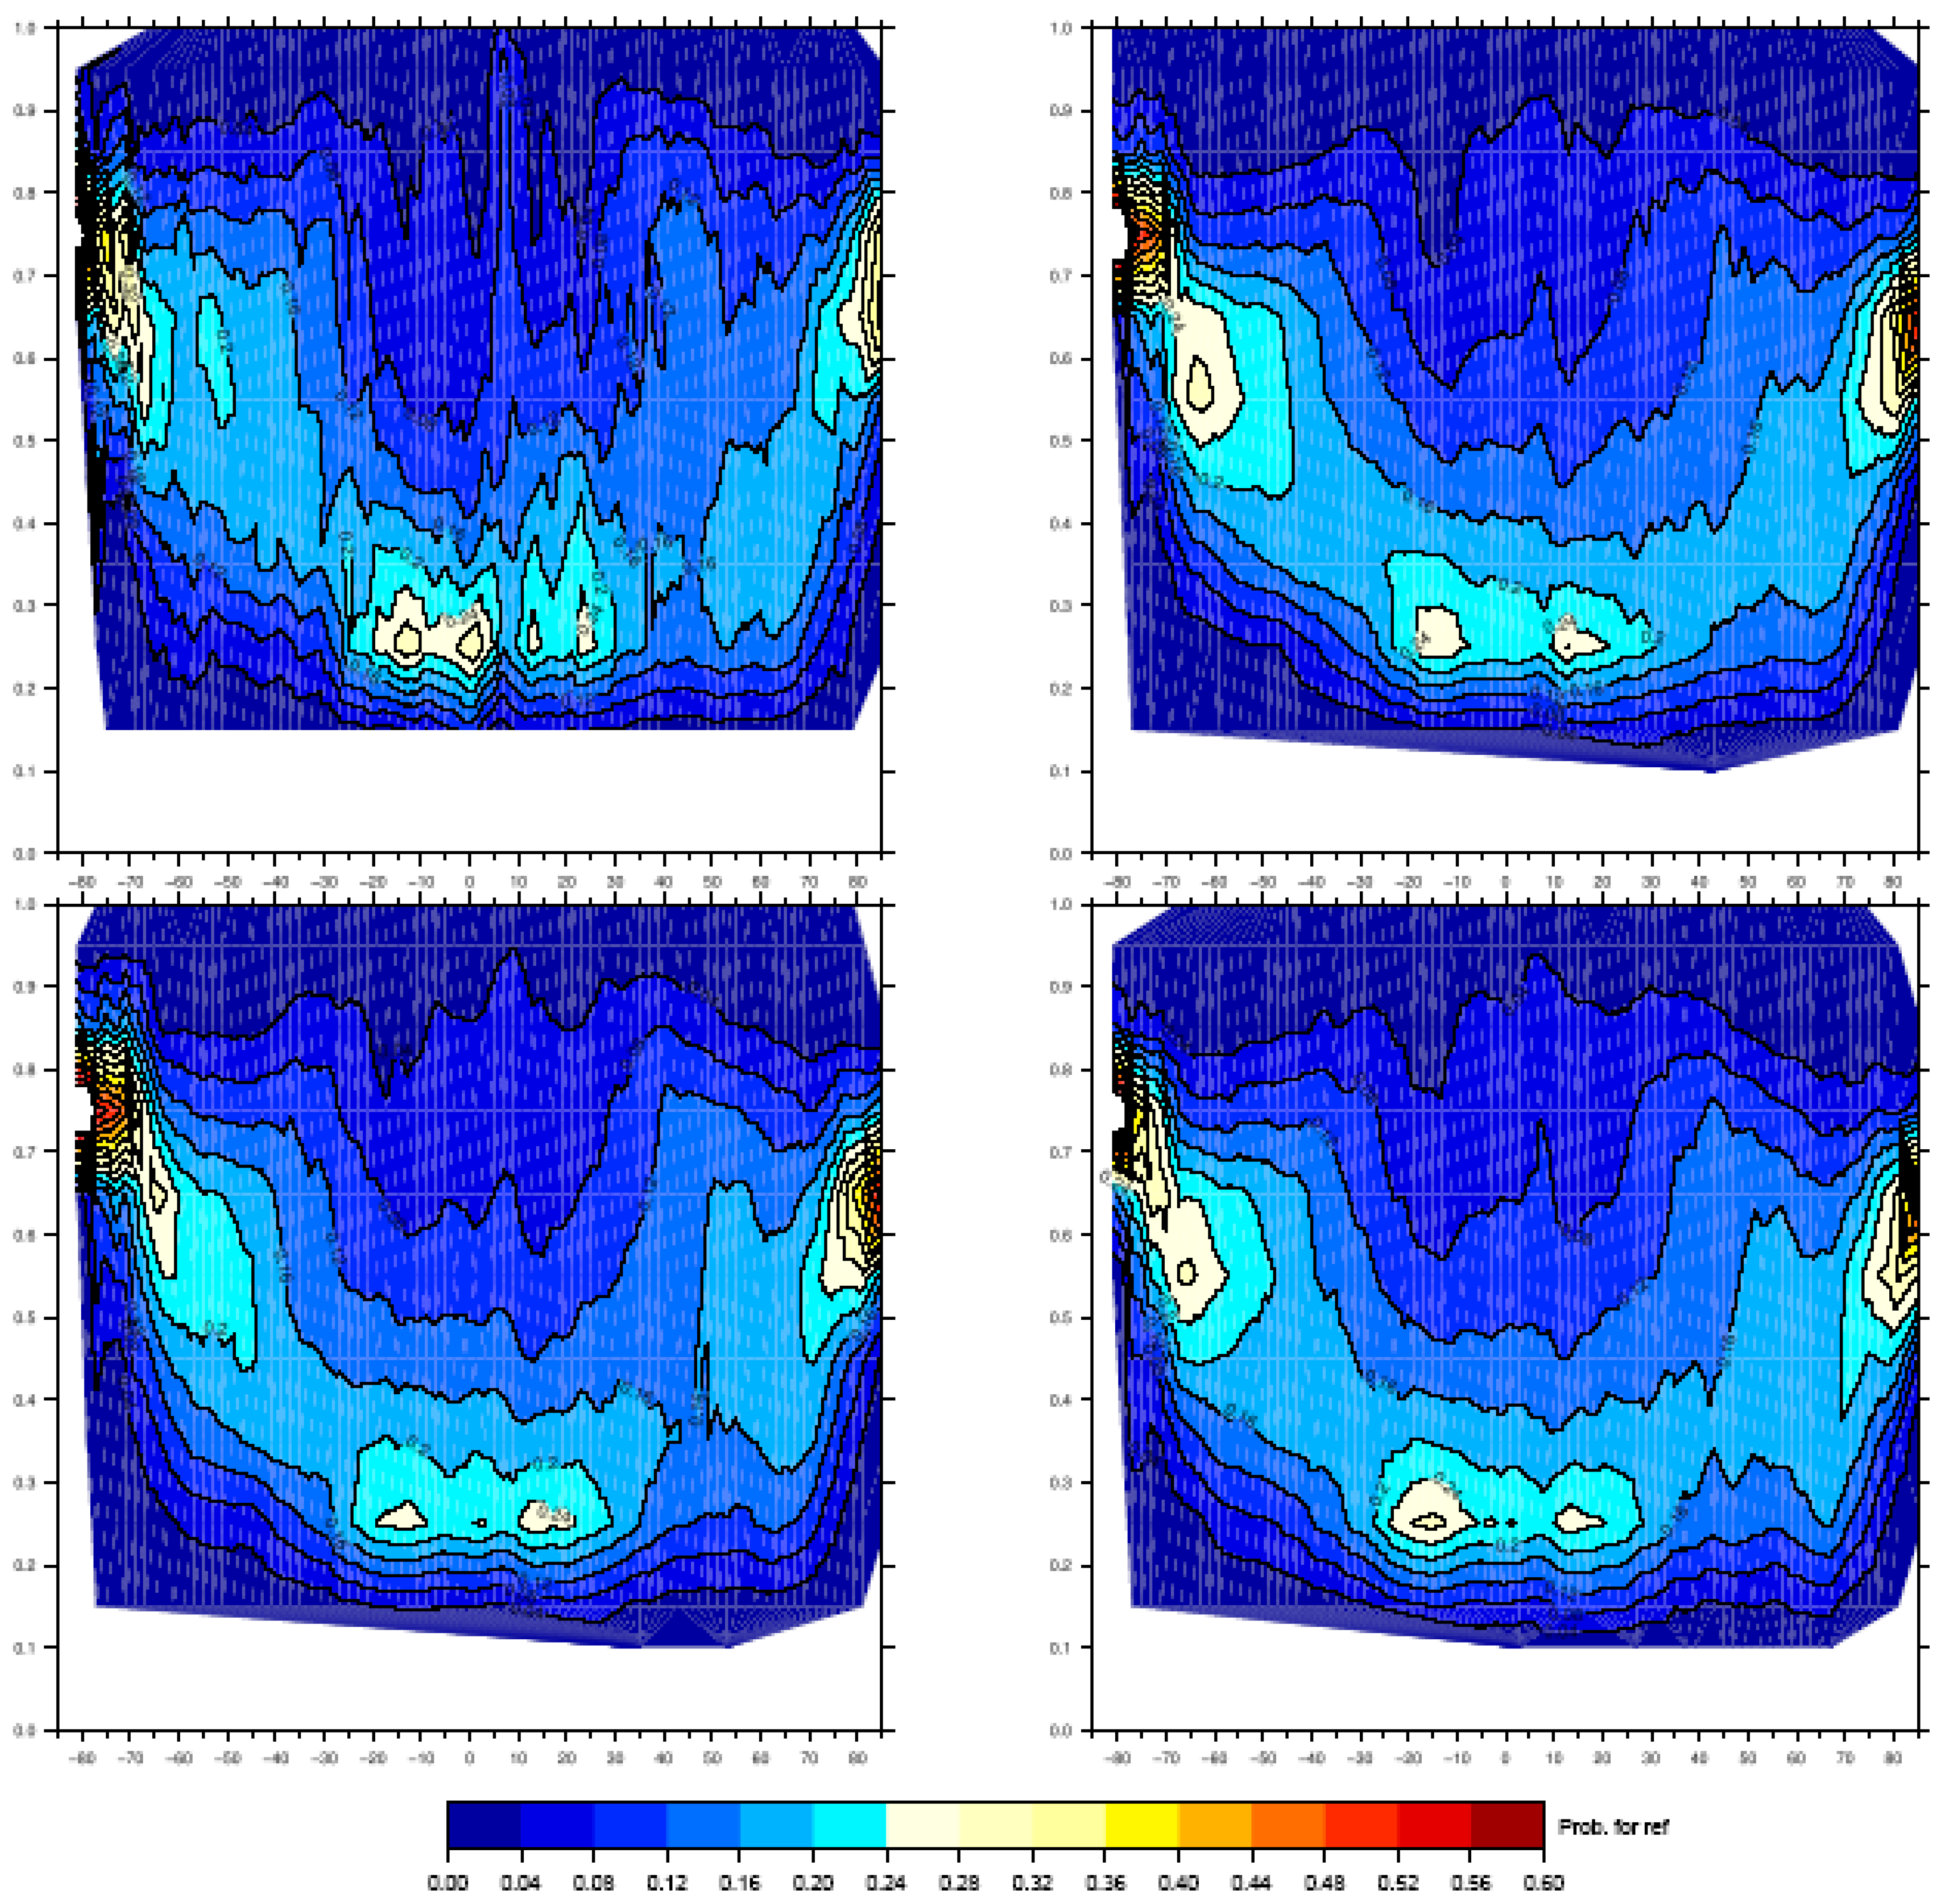
The probability of a given cloud top height for 4 years of measurements is shown in Figure 4 for 2003–2006. Here, the latitude is plotted along the OX axis and CTH along the OY axis. It follows that there is some variability of the pattern from one year to another but generally we see that the clouds are higher at ICTZ, as reported in the figures above as well. The derived (from Level 2 data) global average CTH is 7.3 ± 0.9. The corresponding results for cloud fraction and cloud optical thickness derived using SACURA as applied to SCIAMACHY [3] are 0.65 ± 0.07 and 22.5 ± 9.5, respectively. As was mentioned hereinabove, the obtained results are applicable to the case of optically thick clouds only. This explains the difference with the ISCCP results.
Figure 4. The probability plot of cloud top height (CTH) for 2003–2006 (Top: 2003 (left) and 2005 (right), Bottom: 2004 (left), 2006 (right)). OX: latitude (degrees), OY:CTH (km).
Remotesensing 03 00836 g004
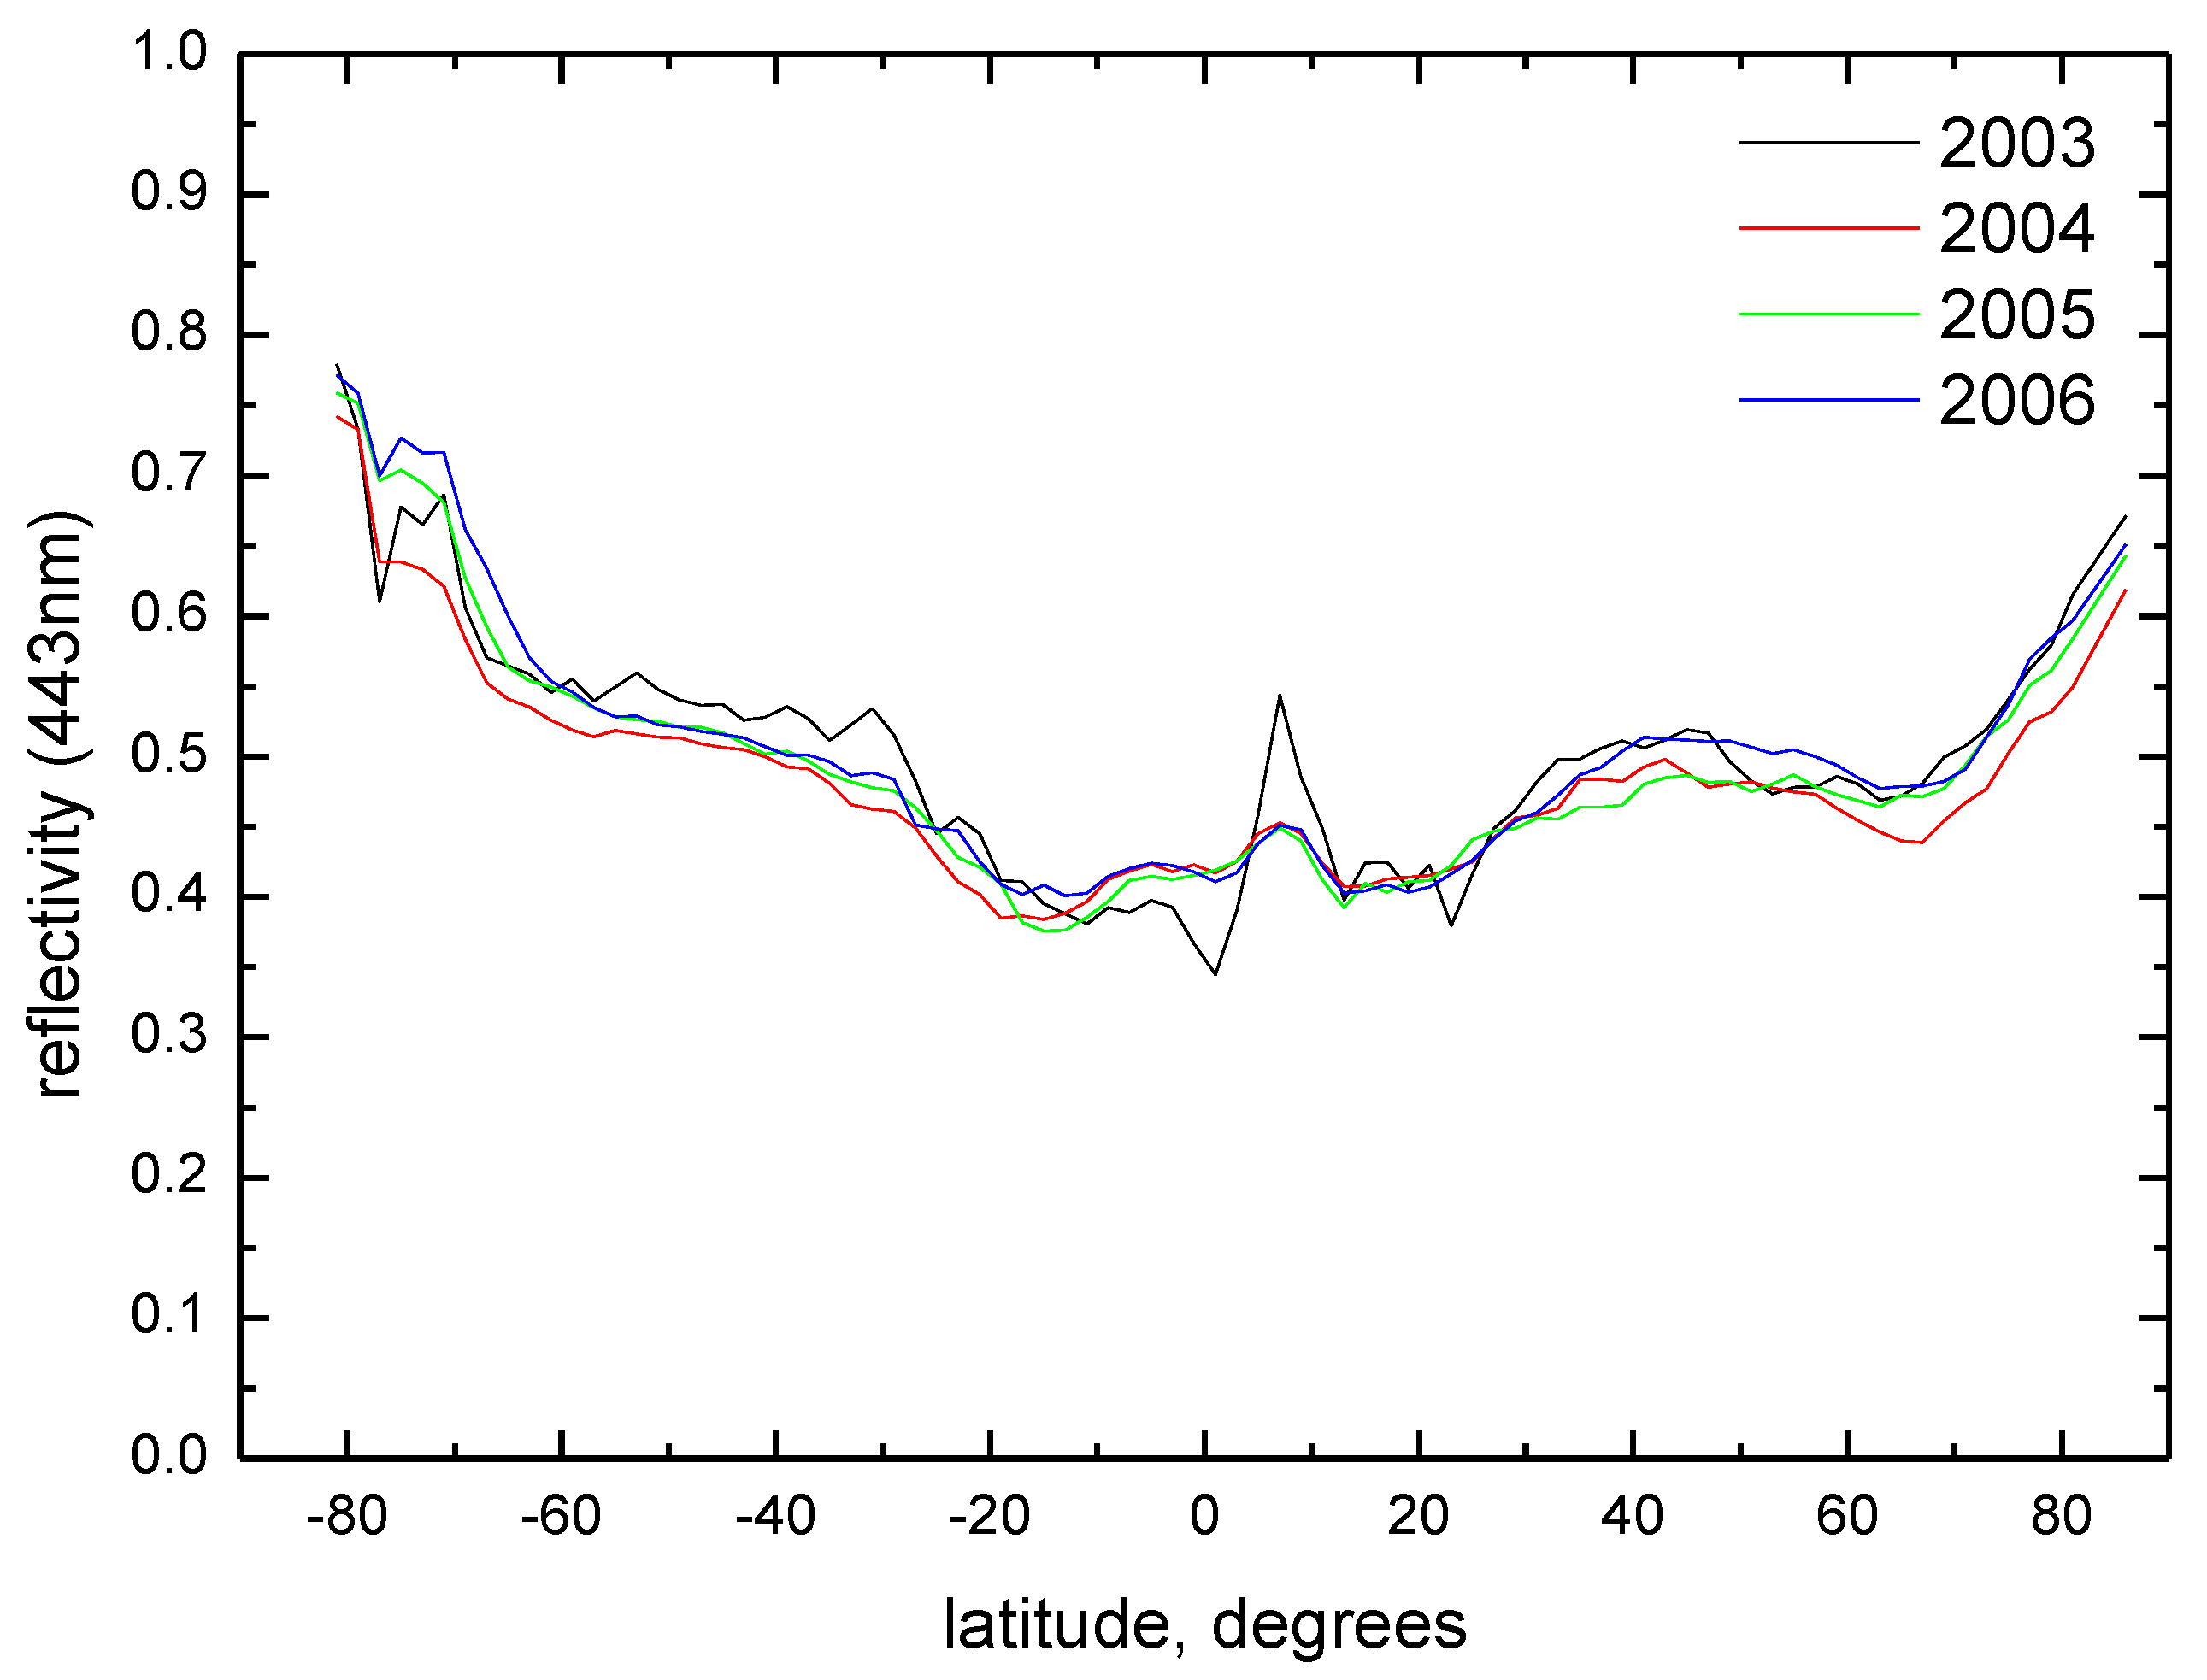
The reflectivity R(443 nm) is shown in Figure 5 in the same format as in Figure 4. The distribution of reflectivity along the latitude is shown in Figure 6. The reflectivity is defined as the ratio of the reflected intensities for a given scene to that of the Lambertian surface with albedo equal to 1.0. The cloud optical thickness is estimated directly from the reflectivity. We see that the shape of reflectivity follows a parabola (x2) with the increase of reflectance towards the polar regions. On the other hand, the CTH general behavior is quite different (with the general decrease of CTH towards poles). It follows from Figure 5 that 2003 is in some way exceptional (e.g., see the area around ITCZ in Figure 5).
Figure 5. The probability plot of reflectivity (443nm) for 2003–2006 (Top: 2003 (left) and 2005 (right), Bottom: 2004 (left), 2006 (right)). OX: latitude (degrees), OY:CTH (km).
Remotesensing 03 00836 g005

4. Conclusions

In the present paper, we analyzed the cloud top height products derived from SCIAMACHY spectral reflectance measurements for the period 2003–2006. The accuracy of SACURA as applied to SCIAMACHY was studied using radar measurements as reported in [13]. It was found that the average error is approximately 0.5 km (underestimation of CTH). The analysis is valid for thick clouds only.
No trends in cloud parameters were discovered. This is, possibly, because of the short time series analyzed. In future, our analysis will be extended (from 1995, using GOME data). The derived data are similar to those obtained using dedicated cloud instruments, such as CloudSat radar (e.g., compare our Figure 4 with Figure 3 in [14]). The shift of the cloud top height from the Equator to the Northern Hemisphere with the maximum around 10N corresponds to the same maximum for the precipitation rate as detected on CloudSat [15]: Figure 1(b). The results shown in Figure 1 are consistent with MODIS L3 Products (see Figure 1 in [16]). All of this confirms the quality of the SCIAMACHY cloud top height product, which can be used to enhance our understanding of global cloud fields [17] and their influence on the Earth’s climate. We also studied the planetary reflectivity R at the wavelength 443nm and found that the annual average is R = 0.49 ± 0.08 for the years analyzed. The SCIAMACHY cloud products are freely available for download at www.iup.physik.uni-bremen.de/~sacura.
Figure 6. The latitudinal behavior of reflectivity (443 nm) for 2003–2006.
Remotesensing 03 00836 g006

Acknowledgements

The authors are grateful to V. V. Rozanov for the useful discussions and also to ESA for providing the SCIAMACHY data. This work was supported by the ESA Cloud_cci Project and DFG Project “Resinc-II”.

References

  1. Yamamoto, G.; Wark, D.Q. Discussion of the letter by R. A. Hanel, “Determination of cloud altitude from a satellite”. J. Geophys. Res. 1961, 66, 3596. [Google Scholar] [CrossRef]
  2. Koelemeijer, R.B.A.; Stammes, P.; Hovenier, J.P.; de Haan, J.F. A fast method for retrieval of cloud parameters using oxygen A-band measurements from GOME. J. Geophys. Res. 2001, 106, 3475–3490. [Google Scholar] [CrossRef]
  3. Rozanov, V.V.; Kokhanovsky, A.A. The semi-analytical cloud retrieval algorithm as applied to the cloud top altitude and the cloud geometrical thickness determination from the top of atmosphere reflectance measurements in the oxygen absorption bands. J. Geophys. Res. 2004, 109. [Google Scholar] [CrossRef]
  4. Grzegorski, M.; Wenig, M.; Platt, U.; Stammes, P.; Fournier, N.; Wagner, T. The Heidelberg iterative cloud retrieval utilities (HICRU) and its application to GOME data. Atmos. Chem. Phys. 2006, 6, 4461–4476. [Google Scholar] [CrossRef]
  5. Loyola, D. Automatic Cloud Analysis from Polar-Orbiting Satellites Using Neural Network and Data Fusion Techniques. In Proceedings of 2004 IEEE International Geoscience and Remote Sensing Symposium, Anchorage, AK, USA, 20–24 September 2004; pp. 2530–2533.
  6. Loyola, D.; Thomas, W.; Livschitz, Y.; Ruppert, T.; Albert, P.; Hollmann, R. Cloud properties derived from GOME/ERS-2 backscatter data for trace gas retrieval. IEEE Trans. Geosci. Remote Sens. 2007, 45, 2747–2758. [Google Scholar]
  7. Loyola, D.; Thomas, W.; Spurr, R.; Mayer, B. Global patterns in daytime cloud properties derived from GOME backscatter UV-VIS measurements. Int. J. Remote Sens. 2010, 31, 4295–4318. [Google Scholar] [CrossRef]
  8. Gottwald, M.; Bovensmann, H.; Lichtenberg, G.; Noël, S.; von Bargen, A.; Slijkhuis, S.; Piters, A.; Hoogeveen, R.; von Savigny, C.; Buchwitz, M.; et al. SCIAMACHY: Monitoring the Changing Earth’s Atmosphere; DLR: Oberpfaffenhofen, Germany, 2006. [Google Scholar]
  9. Kokhanovsky, A.A.; Rozanov, V.V. The physical parameterization of the top of atmosphere reflection function for a cloudy atmosphere-underlying surface system: The oxygen A-band case study. J. Quant. Spectrosc. Radiative Transfer 2004, 85, 35–55. [Google Scholar] [CrossRef]
  10. Kokhanovsky, A.A.; Vountas, M.; Rozanov, V.V.; Lotz, W.; Bovensmann, H.; Burrows, J.P.; Schumann, U. Global cloud top height and thermodynamic phase distribution as obtained by SCIAMACHY on ENVISAT. Int. J. Remote Sens. 2007, 28, 4499–4507. [Google Scholar] [CrossRef]
  11. von Bargen, A.; Schröder, T.; Kretschel, K.; Hess, M.; Lerot, C.; Van Roozendael, M.; Vountas, M.; Kokhanovsky, A.; Lotz, W.; Bovensmann, H. Operational SCIAMACHY Level 1B-2 Off-Line Processor: Total Vertical Columns of O3 and NO2 and Cloud Products. In Proceedings of ENVISAT Symposium, Montreux, Switzerland, 23–27 April 2007. SP636, [CD-ROM].
  12. Koelemeijer, R.B.A.; de Haan, J.F.; Stammes, P. A database of spectral surface reflectivity in the range 335–772 nm derived from 5.5 years of GOME observations. J. Geophys. Res. 2003, 108, 4070. [Google Scholar] [CrossRef]
  13. Kokhanovsky, A.A.; Naud, C.M.; Devasthale, A. Intercomparison of ground-based satellite cloud-top height retrievals for overcast single-layered cloud fields. IEEE Trans. Geosci. Remote Sens. 2009, 47, 1901–1908. [Google Scholar] [CrossRef]
  14. Mace, G.G.; Marchand, R.; Zhang, Q.; Stephens, G. Global hydrometeor occurrence as observed by CloudSat: Initial observations from summer 2006. Geophys. Res. Lett. 2007, 34, L09808. [Google Scholar] [CrossRef]
  15. Haynes, J.M.; Stephens, G.L. Tropical oceanic cloudiness and the incidence of precipitation: Early results from Cloudsat. Geophys. Res. Lett. 2007, 34, L09811. [Google Scholar] [CrossRef]
  16. Meyer, K.; Yang, P.; Gao, B.-C. Tropical ice optical depth, ice water path, and frequency fields inferred from the MODIS level-3 data. Atmos. Res. 2007, 85, 171–182. [Google Scholar] [CrossRef]
  17. Sherwood, S.C.; Minnis, P.; McGill, M. Deep convective cloud—Top heights and their thermodynamic control during CRYSTAL-FACE. J. Geophys. Res. 2004, 109, D20119. [Google Scholar] [CrossRef]