Article

SAREval: A Multi-Dimensional and Multi-Task Benchmark for Evaluating Visual Language Models on SAR Image Understanding


1
Space Information Academic, Space Engineering University, Beijing 101407, China
2
Key Laboratory of Intelligent Processing and Application Technology of Satellite Information, Beijing 100192, China
*
Author to whom correspondence should be addressed.
Remote Sens. 2026, 18(1), 82; https://doi.org/10.3390/rs18010082
Submission received: 26 November 2025 / Revised: 19 December 2025 / Accepted: 23 December 2025 / Published: 25 December 2025

Highlights

What are the main findings?
  • We establish SAREval, the first comprehensive benchmark specifically designed for evaluating Vision-Language Models on SAR image understanding, comprising 20 tasks across perception, reasoning, and robustness dimensions with 14,950 expert-verified image–text pairs.
  • Current VLMs demonstrate significant limitations in SAR image interpretation, particularly in fine-grained target discrimination and physical-attribute reasoning tasks, while exhibiting unexpected performance improvements under certain noise conditions that challenge conventional robustness understanding.
What are the implications of the main findings?
  • The benchmark provides a standardized platform for developing and evaluating SAR-specific VLMs, addressing the critical gap in specialized evaluation frameworks for radar remote sensing and enabling fair comparison across different model architectures.
  • Our findings reveal fundamental domain adaptation challenges in VLMs and establish a new paradigm for constructing multimodal benchmarks in specialized remote sensing domains, with direct implications for maritime surveillance, infrastructure monitoring, and environmental observation applications.

Abstract

Vision-Language Models (VLMs) demonstrate significant potential for remote sensing interpretation through multimodal fusion and semantic representation of imagery. However, their adaptation to Synthetic Aperture Radar (SAR) remains challenging due to fundamental differences in imaging mechanisms and physical properties compared to optical remote sensing. SAREval, the first comprehensive benchmark specifically designed for SAR image understanding, incorporates SAR-specific characteristics, including scattering mechanisms and polarization features, through a hierarchical framework spanning perception, reasoning, and robustness capabilities. It encompasses 20 tasks from image classification to physical-attribute inference with over 10,000 high-quality image–text pairs. Extensive experiments conducted on 11 mainstream VLMs reveal substantial limitations in SAR image interpretation. Models achieve merely 25.35% accuracy in fine-grained ship classification tasks and demonstrate significant difficulties in establishing mappings between visual features and physical parameters. Furthermore, certain models exhibit unexpected performance improvements under certain noise conditions that challenge conventional robustness understanding. SAREval establishes an essential foundation for developing and evaluating VLMs in SAR image interpretation, providing standardized assessment protocols and quality-controlled annotations for cross-modal remote sensing research.

1. Introduction

Intelligent algorithms have recently achieved extensive progress in remote sensing image interpretation. Dedicated models tailored for specific tasks, based on Convolutional Neural Networks (CNNs) [1], Recurrent Neural Networks (RNNs) [2], and self-attention mechanisms [3], have attained high accuracy and efficiency across a range of perception tasks, including aircraft detection [4], ship detection [5], and sea–land segmentation [6]. However, such models are typically designed for unimodal, single-task visual processing, lacking the capability to understand natural language instructions. Consequently, they struggle to meet the demands of complex tasks such as open-domain Visual Question Answering (VQA) [7], fine-grained semantic description [8], and Referring Expression Comprehension (REC) [9]. In this context, Vision-Language Models (VLMs) [10], a class of multimodal intelligent models that fuse visual features from imagery with semantic information from natural language, have ushered in a transformative advance for remote sensing interpretation. Distinct from traditional dedicated models, VLMs can simultaneously process both image and text information, effectively bridging the semantic gap between imagery and language. This enables the deep integration of visual perception and semantic reasoning, reduces reliance on expert manual interpretation, and offers a more flexible and intelligent interpretation paradigm for applications in Earth observation, environmental monitoring, disaster prevention and mitigation, and land use planning. Ultimately, VLMs facilitate the transition of remote sensing data from being merely “accessible” to becoming “understandable and actionable.”
To address early cross-modal generation needs, initial research typically employed separate encoders to extract visual and textual features independently, coupled with specially designed fusion modules for feature interaction. This approach enabled basic tasks such as image captioning and visual grounding, thereby validating the feasibility of VLMs in remote sensing. Within these models, CNNs [11] and Fully Convolutional Networks (FCNs) [12] were commonly used to extract spatial visual features, while RNNs and their variants, such as Long Short-Term Memory (LSTM) [13] networks, were responsible for encoding textual sequence information. For instance, in remote sensing image captioning, Shi and Zou [12] introduced FCNs to perform multi-scale ground object semantic extraction and decomposed the captioning process into subtasks like instance detection and environmental analysis. Zhang et al. [14] designed a visual aligning loss function to explicitly constrain the similarity between attention weights and word vector spaces, thereby enhancing modal alignment. In visual grounding, the RSVG [15] combined a language encoder to construct geospatial relation graphs, an adaptive region attention visual encoder, and a fusion module, achieving an accuracy of 59.4% at IoU@0.5. After end-to-end optimization on specific tasks and datasets, such as UCM-caption [16] and RSVQA [17], these models can achieve competitive performance metrics. Nevertheless, these models were generally designed for a single task, requiring independent training and maintenance of a dedicated set of parameters for each task. Their capabilities are relatively closed, making it difficult to transfer to new scenarios or novel object categories and fundamentally lacking the flexibility to respond to open-domain natural language instructions. Furthermore, their performance is highly dependent on training data, resulting in limited generalization ability.
The success of VLMs pre-trained on large-scale image–text pairs in the natural image domain has paved the way for a unified visual-language modeling paradigm. Models such as Contrastive Language–Image Pre-training (CLIP) [18] and Align Before Fuse (ALBEF) [19] align visual and linguistic modalities through contrastive learning, providing a powerful representational foundation for downstream tasks. Subsequently, Multimodal Large Language Models (MLLMs) represented by Large Language and Vision Assistant (LLaVA) [20] and BLIP-2 [21] have further integrated visual encoders with large language models, demonstrating remarkable zero-shot generalization and reasoning capabilities, thereby extending model functionality from single-task processing to multi-dimensional tasks. Advances in efficient fine-tuning techniques and the emergence of high-quality remote sensing image–text training datasets have created opportunities for applying VLMs in the vertical domain of remote sensing. Optical remote sensing, being the most widely used and data-rich modality, has taken the lead in exploring and deploying remote sensing VLMs. For example, GeoChat [22], building upon the LLaVA framework and infused with remote sensing domain knowledge, supports multi-task dialogue and zero-shot understanding of high-resolution optical imagery, establishing itself as the first unified multimodal large model for multiple remote sensing tasks. EarthMarker [23] introduced visual prompt learning to enable multi-granularity interpretation of optical imagery at the image, region, and point levels. SkySenseGPT [24] proposed a large-scale instruction-tuning dataset, FIT-RS, covering complex comprehension tasks from relation understanding to scene graph generation, and constructed a model excelling in multiple tasks through instruction tuning. EarthDial [25] extended support to multi-sensor, multi-temporal, and multi-resolution remote sensing data, achieving broader task coverage and stronger generalization. TEOChat [26] designed spatiotemporal reasoning modules for temporal optical data, expanding model applications to spatiotemporal reasoning tasks such as change detection and disaster damage assessment. Remote sensing VLMs are typically constructed upon powerful visual encoders and language decoders, and are aligned through supervised fine-tuning or reinforcement learning using large-scale, high-quality, and task-diverse remote sensing instruction datasets. This enables a single model to respond to open-ended natural language instructions and adapt to multiple downstream tasks—such as scene classification, VQA, image captioning, visual grounding, object detection, and change analysis—in a zero-shot or few-shot manner. Consequently, these models significantly enhance generality, interactivity, and knowledge transferability, marking a paradigm shift toward unified, semantically aware remote sensing intelligence.
In contrast, the development of SAR remote sensing VLMs remains in its early stages. Although SAR offers unique advantages in cloudy and rainy regions, nighttime observation, and military reconnaissance due to its all-weather imaging capability and sensitivity to surface dielectric properties, its coherent imaging mechanism introduces speckle noise and geometric distortions [27], resulting in significant visual differences between SAR and optical imagery. As a result, traditional VLMs designed for optical features are not directly applicable to SAR data. Until recently, only a few studies have explored the integration of SAR imagery with VLMs. TACMT [28] investigated natural language-guided target detection in SAR images for visual grounding, but it was limited to a single category of objects, with limited generalization ability. EarthGPT [29] adapted VLMs using the multimodal instruction-tuning dataset MMRS-1M, achieving preliminary extension beyond optical data. However, SAR target samples constitute only a small portion of the dataset, and the covered tasks are basic, making it insufficient for training and evaluating models on complex SAR-specific tasks.
Compared to gradual technological progress, the development of SAR-oriented evaluation benchmarks has lagged significantly, severely hindering objective assessment and equitable exploration of VLM applicability to SAR data. As shown in Table 1, existing remote sensing benchmarks are predominantly designed for optical imagery, with established benchmarks such as RSI-Eval [30], FIT-RSFG [24], and VRSBench [31] focusing exclusively on optical data. Although some benchmarks, such as GeoBench-VLM [32], have attempted to include limited SAR data, they only support restricted tasks such as land use classification and object counting, and fail to incorporate evaluation criteria tailored to core SAR characteristics such as microwave scattering mechanisms and geometric distortion. SARChat-Bench [33], as the first dedicated SAR visual-language benchmark, partially addresses the scarcity of SAR data in terms of quantity, but its framework lacks diversity and comprehensiveness. Overall, existing SAR-oriented benchmarks exhibit notable shortcomings, largely due to three major technical challenges:
  • Limited Support for SAR-VLM Alignment Needs: Existing benchmarks do not adequately meet the alignment requirements for SAR-VLM evaluation. For instance, they lack image–text pairs that reflect SAR-specific characteristics such as microwave scattering mechanisms (e.g., metallic targets appearing as bright spots due to strong reflection, while water bodies appear dark due to weak reflection). Textual descriptions also often fail to balance technical accuracy with semantic readability, which makes conventional optical image–text alignment paradigms unsuitable for SAR data.
  • High Cost of Professional SAR Annotation: Interpreting SAR imagery requires deep domain expertise. Manual annotation involves not only delineating object boundaries but also providing specialized information such as scattering mechanisms and imaging parameters, leading to low annotation efficiency and difficulty in maintaining consistency.
  • Lack of SAR-Adapted Task Paradigms: General-purpose benchmarks designed for optical imagery cannot fully address the interpretation needs of the SAR domain. Meanwhile, SAR-specific tasks—such as polarization mode inference, speckle noise robustness, and geometric distortion correction—have not yet established mature evaluation paradigms or quantifiable metrics, further hindering the development of SAR benchmarks.
To address these challenges, this paper introduces SAREval, a multimodal benchmark for SAR imagery. The main contributions are as follows:
  • We construct a multi-level evaluation benchmark centered on perception, reasoning and robustness dimensions, deeply integrating SAR-specific characteristics. Unlike existing benchmarks that focus primarily on optical data or include only limited SAR tasks, SAREval is designed specifically for SAR data, with tasks closely aligned with SAR imaging mechanisms and scattering characteristics. It covers 20 specialized tasks ranging from image classification and object detection to physical interpretation and sensor parameter inversion. This offers a standardized platform for fine-grained assessment of model adaptability to SAR’s unique properties.
  • We propose a task-adaptive hybrid annotation framework and introduce an innovative distractor generation strategy based on “physical constraints + gradient divergence.” To tackle the challenges of SAR image–text alignment and high annotation cost, we combine a label-driven method, LLM-assisted method, and expert verification into a unified data generation pipeline. Specifically, for numerical reasoning tasks, we design a three-tier distractor system based on physical constraints and gradient divergence, ensuring that distractors are both physically plausible and capable of discriminating between different levels of reasoning ability. Under this framework, we produce over ten thousand high-quality test samples across diverse scenarios, balancing professionalism and scale.
  • We conduct systematic benchmarking of multiple state-of-the-art VLMs and provide critical performance insights and analysis. We comprehensively evaluate 11 mainstream models on SAREval, quantifying their performance differences across various tasks and deeply analyzing their limitations in specialized tasks such as geometric measurement and physical state reasoning. This offers empirical evidence to guide future development and optimization of VLMs for SAR data.

2. Related Works

2.1. Remote Sensing Multimodal Benchmarks

The advancement of remote sensing Visual Language Models has brought the objective and fair evaluation of model performance to the forefront of scholarly attention, necessitating the design and development of specialized evaluation benchmarks. Early remote sensing VLM benchmarks primarily focused on assessing single tasks or foundational capabilities. While they laid the groundwork for domain evaluation, they suffered from significant limitations, including incomplete task coverage, limited data scale, and modality specificity. RSI-Eval [30], as the first benchmark in this field, innovatively designed quantitative evaluation metrics for remote sensing scenarios, providing an assessment basis for fundamental generative tasks like image captioning and Visual Question Answering. However, its evaluation scope was confined to these basic tasks and did not extend to complex capabilities such as object localization and semantic reasoning. Its relatively small data scale also limited its ability to comprehensively characterize overall model performance. LHRS-Bench [34] enriched the granularity of foundational task evaluation by constructing multi-dimensional Q&A samples from limited imagery, improving the discriminative power of assessments. FIT-RSFG [24] focused on understanding object semantic relationships in complex scenes, enhancing the evaluation of precise alignment between visual features and textual semantics in optical imagery, an approach aligned with the contemporaneous FIT-RSRC for object relation understanding in remote sensing. However, its data relies entirely on optical imagery and does not incorporate SAR or other remote sensing modalities with distinct imaging mechanisms, resulting in significant limitations in its evaluative scenarios. Although VRSBench [31] significantly increased data scale and expanded the diversity of basic tasks, its task design remains confined to image captioning and dialogue, and it lacks coverage of SAR modalities, thus failing to support cross-modal evaluation needs. GEOBench-VLM [32] attempted to break the single-modality constraint by including SAR imagery in its evaluation system. However, SAR samples constitute less than 20% of its dataset and only support basic tasks like land use classification and ship object counting. It cannot test models’ understanding of SAR-specific microwave scattering mechanisms or their interpretation capabilities under unique scenarios involving geometric distortions. CHOICE [36], although establishing a hierarchical evaluation system, suffers from insufficient pixel-level task assessment, a limited sample size for advanced reasoning tasks, and low compatibility with visual grounding, which restricts its evaluation scope. SARChat-Bench [33], as the first dedicated image–text benchmark dataset for SAR imagery, constructed 2 million annotated samples across six typical tasks, representing a preliminary exploration of SAR-specific benchmarks. However, it emphasizes dialogue generation tasks, features a monolithic benchmark evaluation architecture, and lacks completeness in its task system design. Notably, the vast majority of existing benchmarks focus solely on model performance under ideal conditions, overlooking the pervasive issues of data perturbation and quality degradation common in real-world application scenarios. Although REOBench [38] provides valuable insights for robustness evaluation in optical remote sensing, overall, current benchmarks still exhibit significant limitations requiring breakthroughs, particularly in terms of modality coverage completeness, task type diversity, and adaptability to the unique technical challenges posed by SAR modalities.

2.2. Strategies for Constructing Visual Language Benchmark Data

Visual language benchmark data typically appears in the form of question–answer pairs, encompassing both image and text modalities. The construction of multimodal benchmarks relies on high-quality image–text matching and systematic task design. Current strategies for building these benchmark datasets primarily revolve around three paradigms: meticulous manual annotation, automated rule-based generation, and large model-assisted generation. Early datasets like RSIEval [30] and LHRS-Bench [34] were constructed using manual annotation, involving domain experts to label or meticulously curate data to ensure accuracy and objectivity. However, this approach incurs high temporal and economic costs, making it difficult to scale to very large dataset construction. This is particularly challenging for highly specialized remote sensing modalities like SAR, where annotators need not only a solid foundation in radar remote sensing theory but also an understanding of physical principles like microwave scattering mechanisms and polarization characteristics. The scarcity of such expert resources further exacerbates the difficulty of data acquisition, rendering purely manual annotation inadequate for large-scale benchmark construction. Automated rule-based generation strategies create images or question–answer pairs in bulk using predefined algorithms or rules in a structured manner. CHOICE [36] generates answers from predefined labels and creates distractors based on labels from other samples. GeoBench-VLM [32] converts detection data into questions about specific object counts in counting tasks, providing rules for generating correct counts and alternative options with controlled deviations to automatically produce Multiple-Choice Question (MCQ) options. This strategy significantly improves annotation efficiency and generates data with a uniform format and strong controllability. It is particularly suitable for building benchmarks that require specific distributions or aim to test particular capabilities, enabling the generation of large-scale, standardized data samples. Its limitation lies in the heavy reliance on deep domain knowledge for rule design, and the generated data may lack diversity and semantic complexity. For SAR-specific physical phenomena like speckle noise, geometric distortion, and polarization sensitivity, rules traditionally designed for optical imagery are difficult to transfer directly, requiring the reconstruction of a generation framework adapted to SAR imaging mechanisms, which places higher demands on the expertise of rule designers. LLM-assisted generation is currently the mainstream paradigm for efficient large-scale dataset construction. VRSBench [31] uses attribute information extracted from detection labels to design prompts that guide GPT-4 in generating annotations. This strategy leverages the inherent capabilities of large models to generate data and is the predominant method for efficient, large-scale dataset creation today. Subsequent datasets like SARChat-Bench [33] and XLRS-Bench [35] have all utilized LLM to generate multi-turn dialogues and complex instructions, effectively expanding dataset scale and task coverage, and greatly enhancing the efficiency and diversity of data production. However, the quality of the generated content depends on the capability of the base model used, and it carries the unavoidable risk of hallucination and potential error propagation. Therefore, it is often combined with human verification to ensure data quality. In summary, balancing generality and specialization, scale and cost, and constructing a hybrid data construction framework that deeply integrates domain knowledge while maintaining both scale and quality represents a key challenge for advancing the development of SAR visual language models.

3. SAREval

3.1. Hierarchical Capability Taxonomy

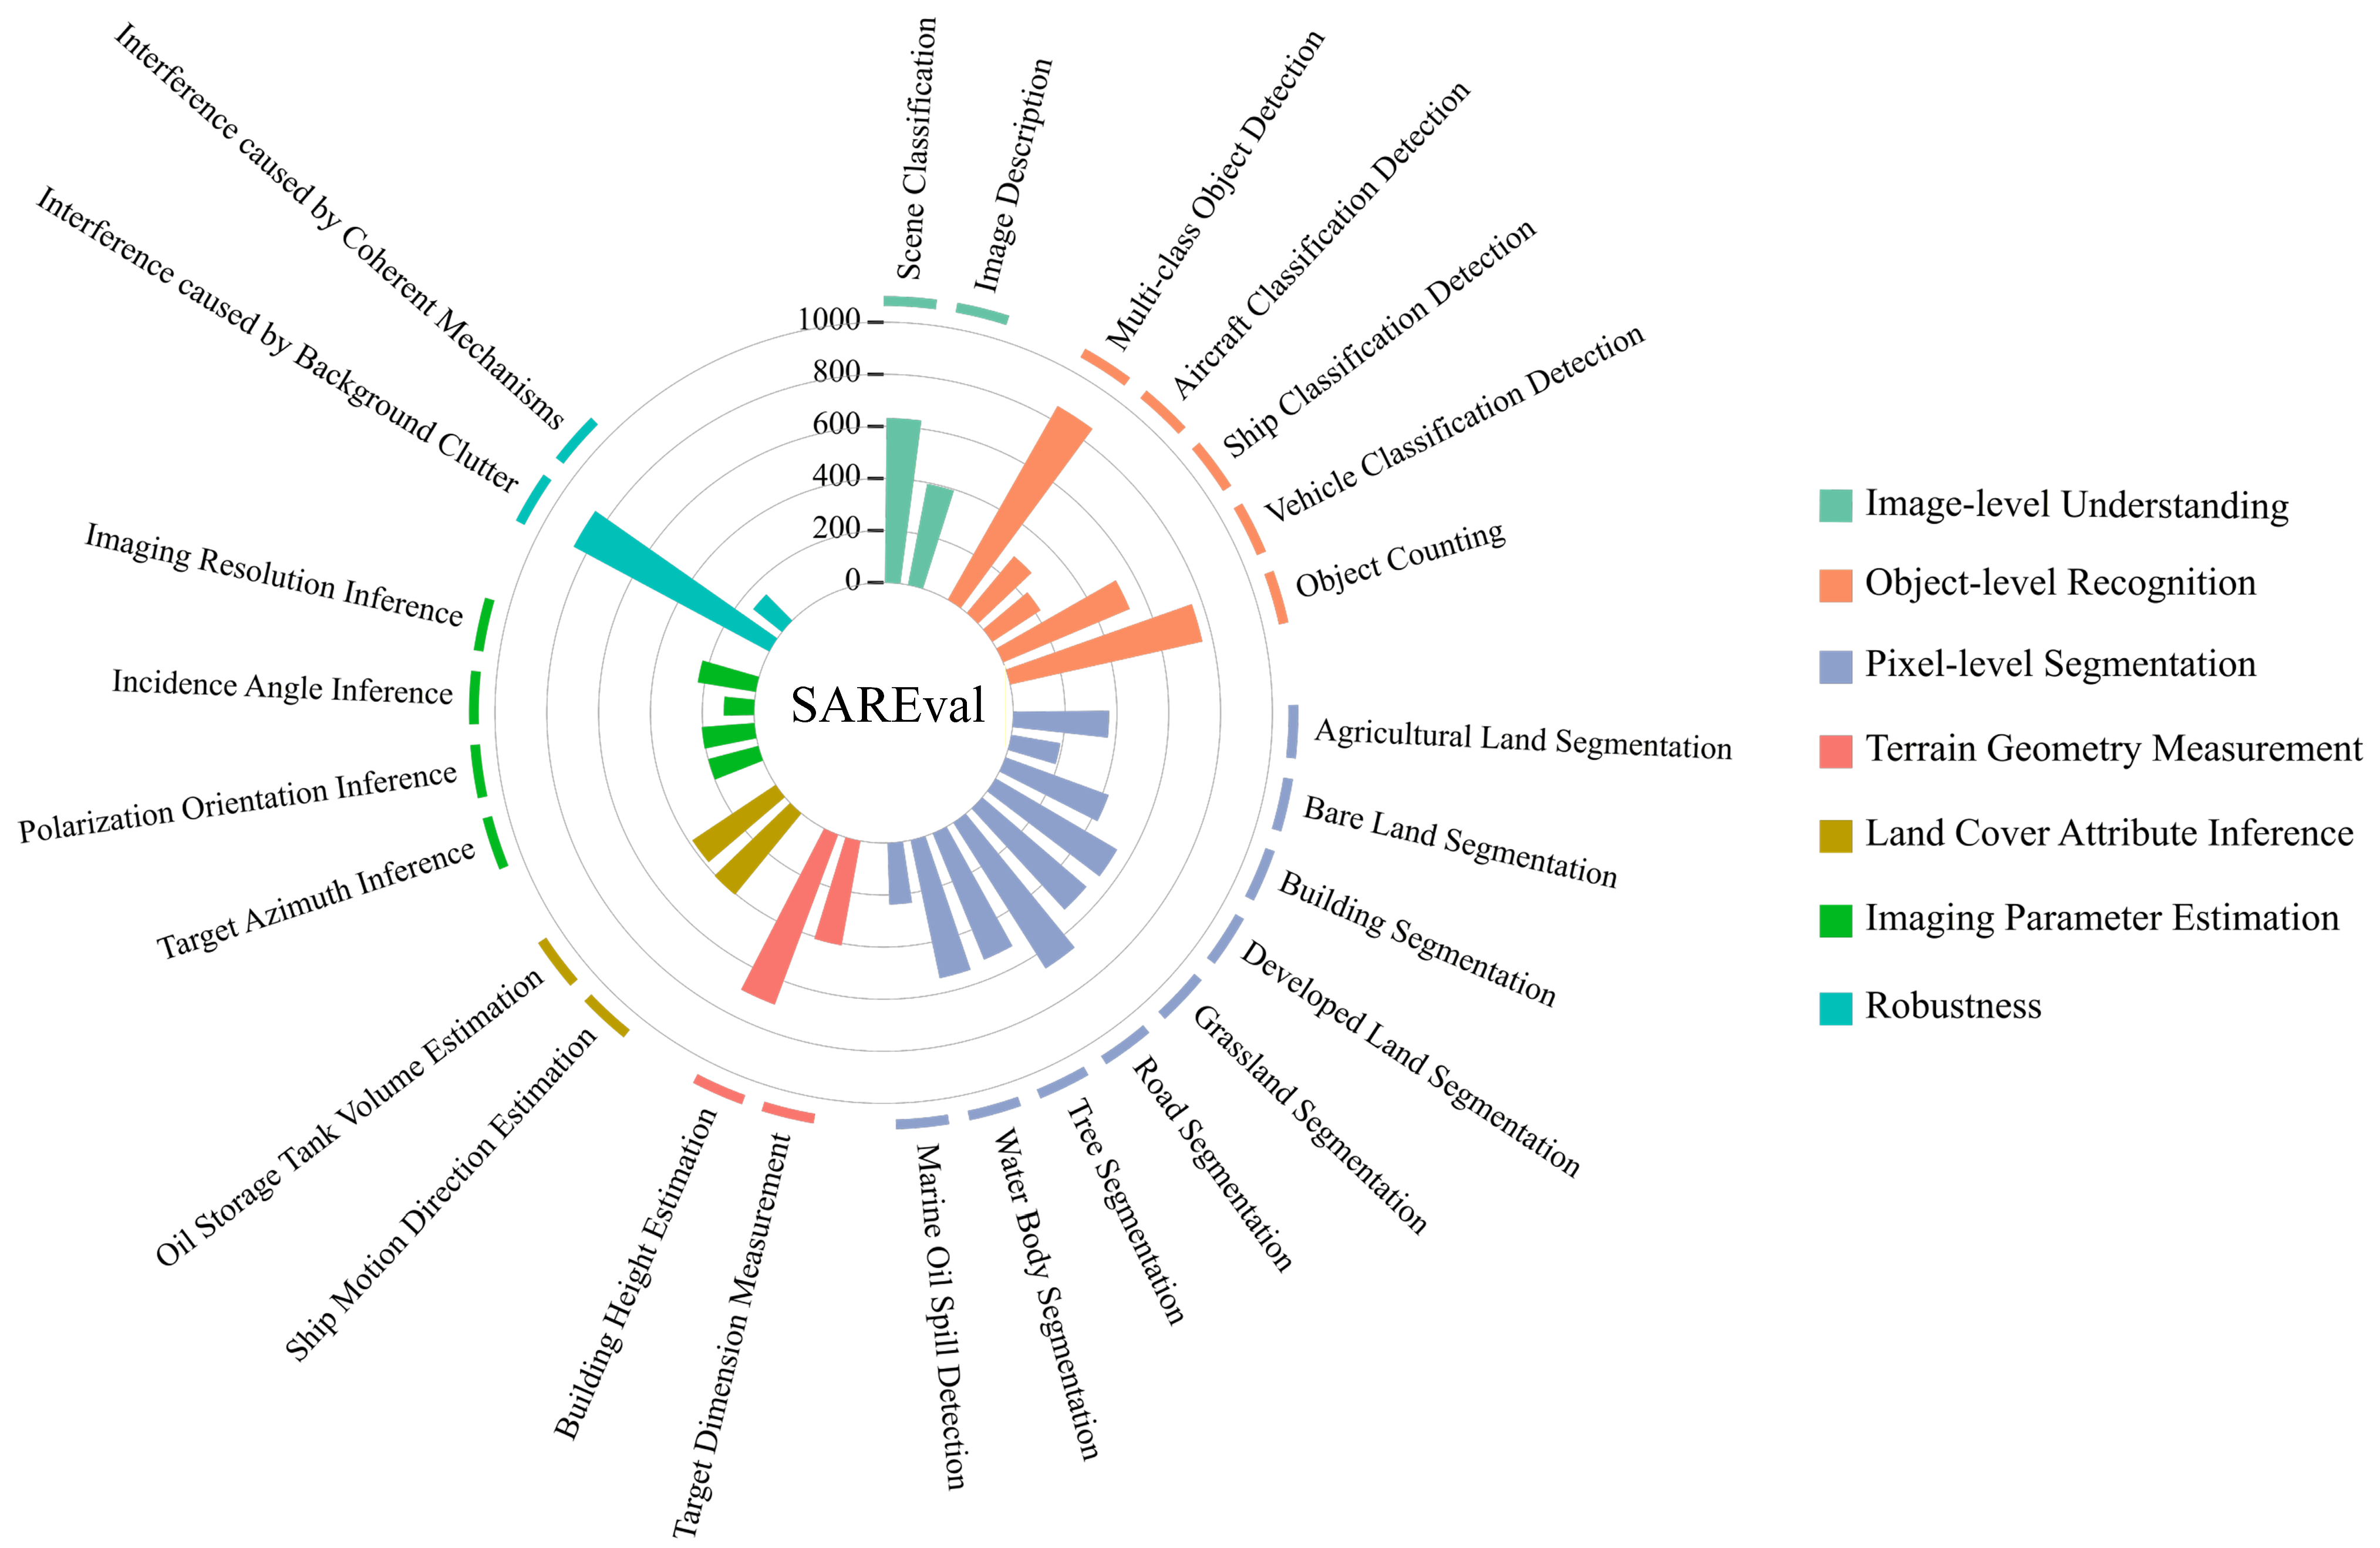
As illustrated in Figure 1, SAREval is structured around three core capability dimensions, comprising a total of 20 fine-grained tasks. This architecture is designed to comprehensively evaluate the overall performance of Vision-Language Models in interpreting SAR imagery. A detailed description of each dimension and its constituent tasks is provided below.

3.1.1. Perception Capability Dimension

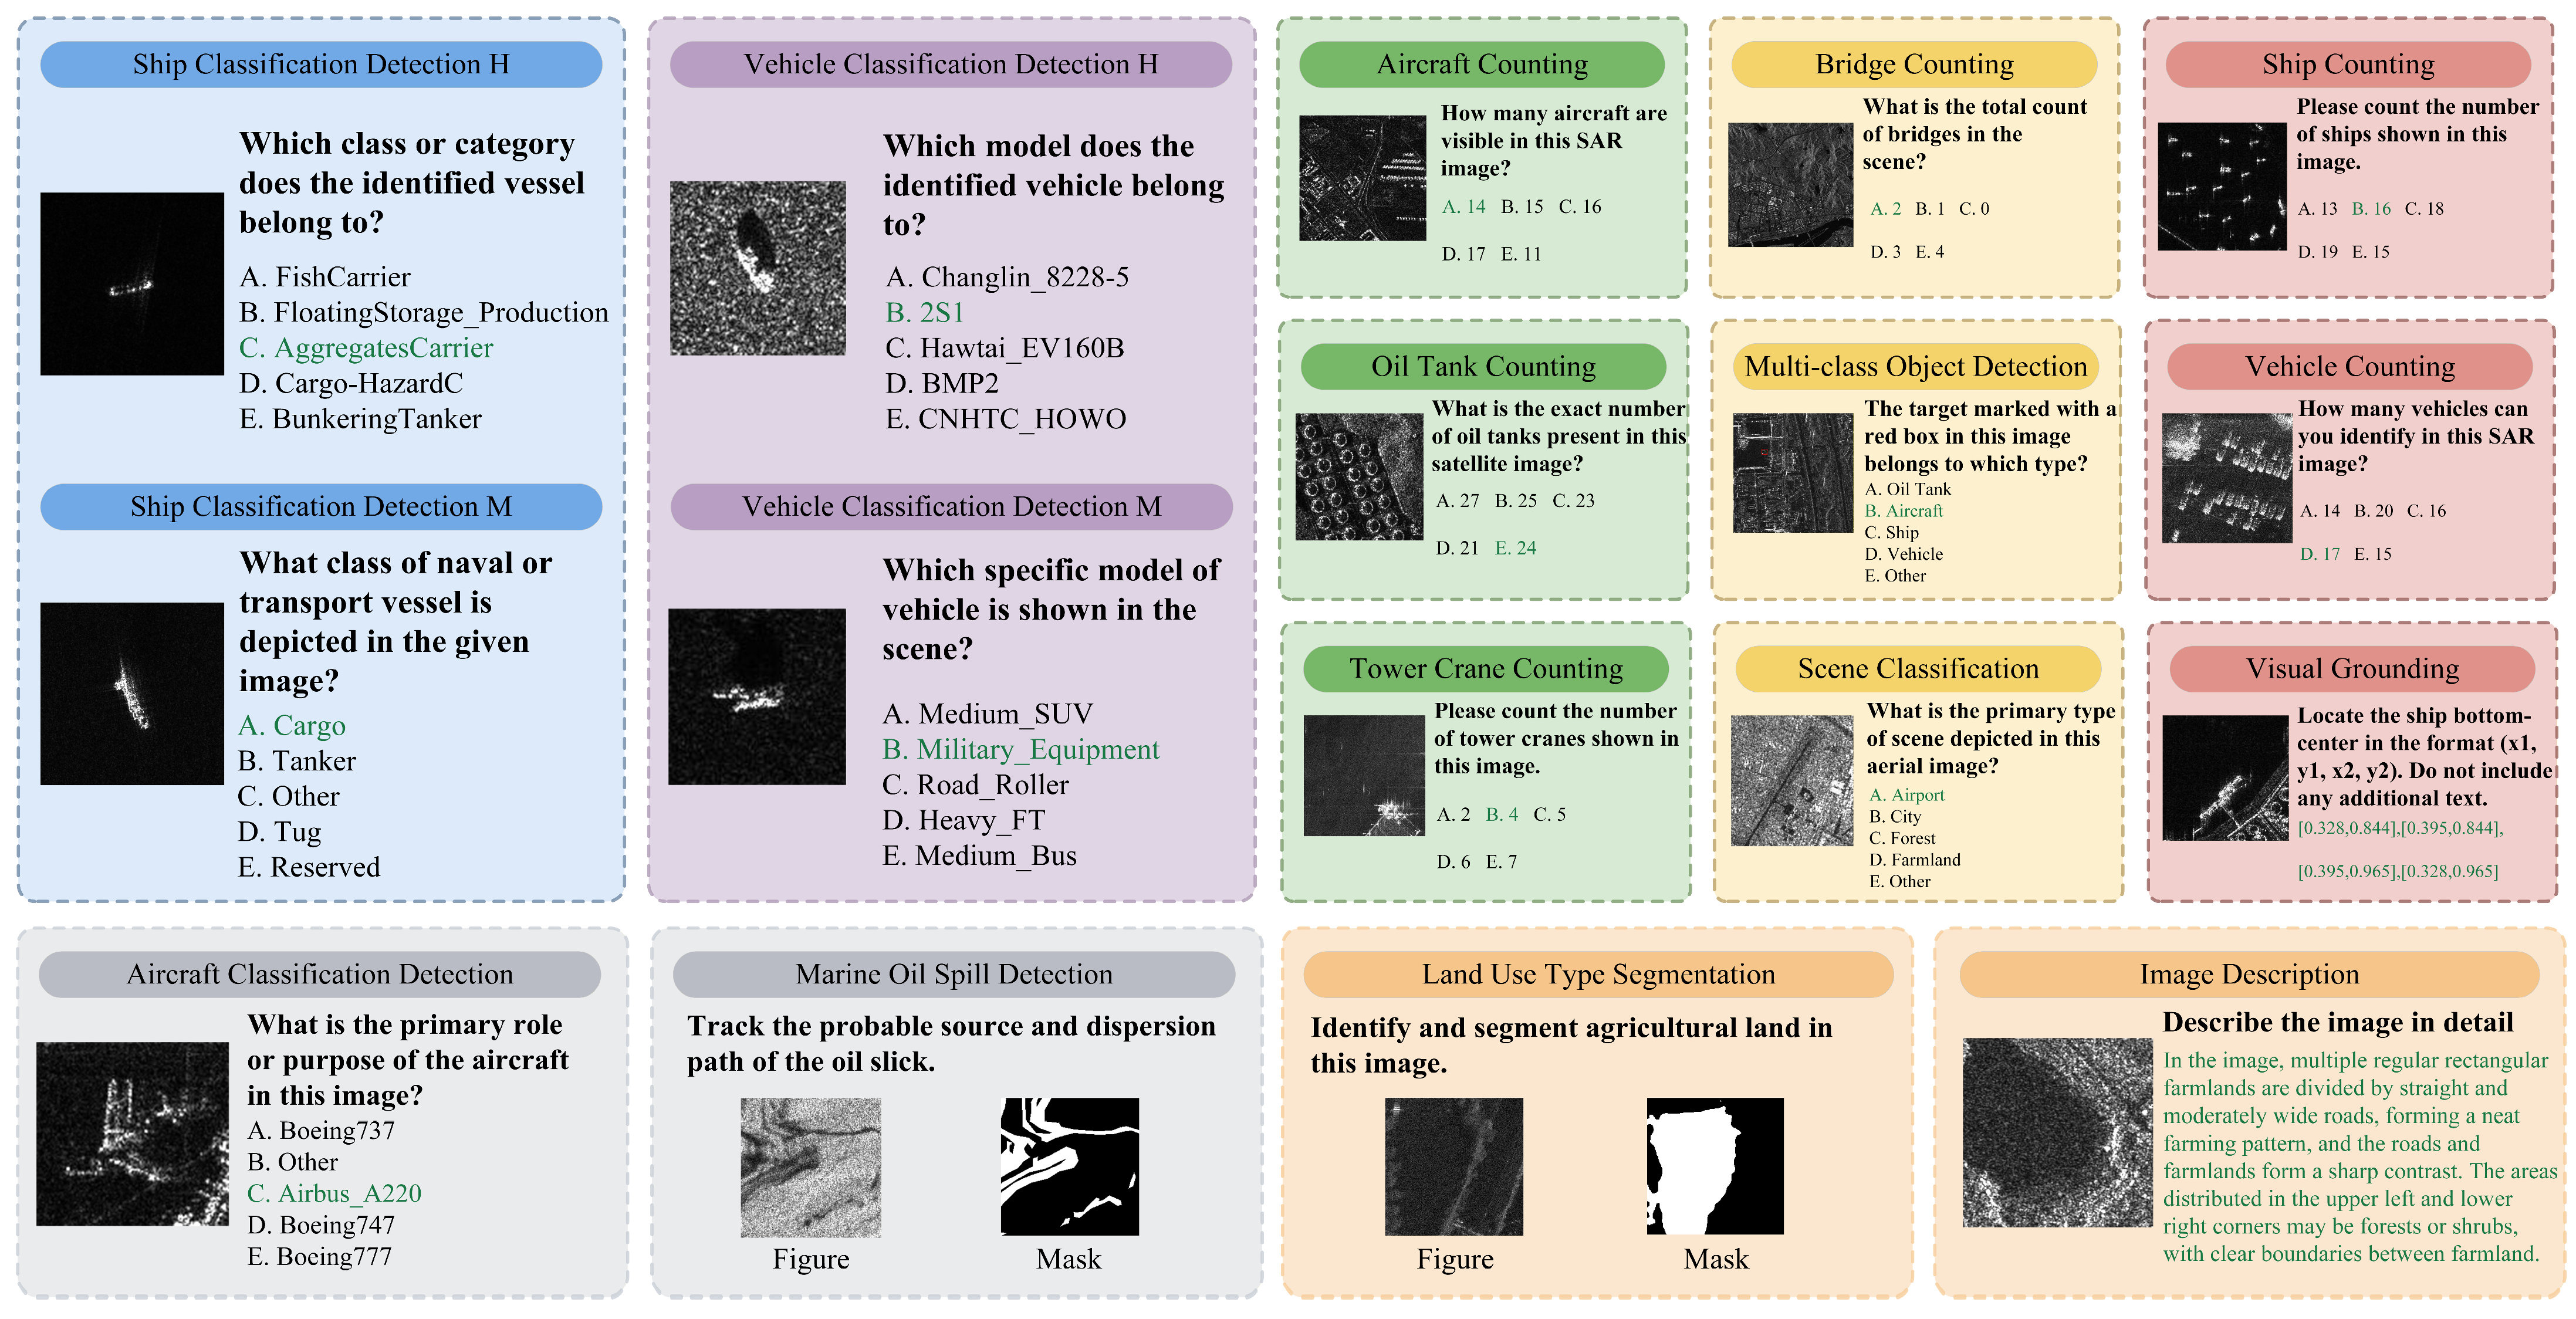
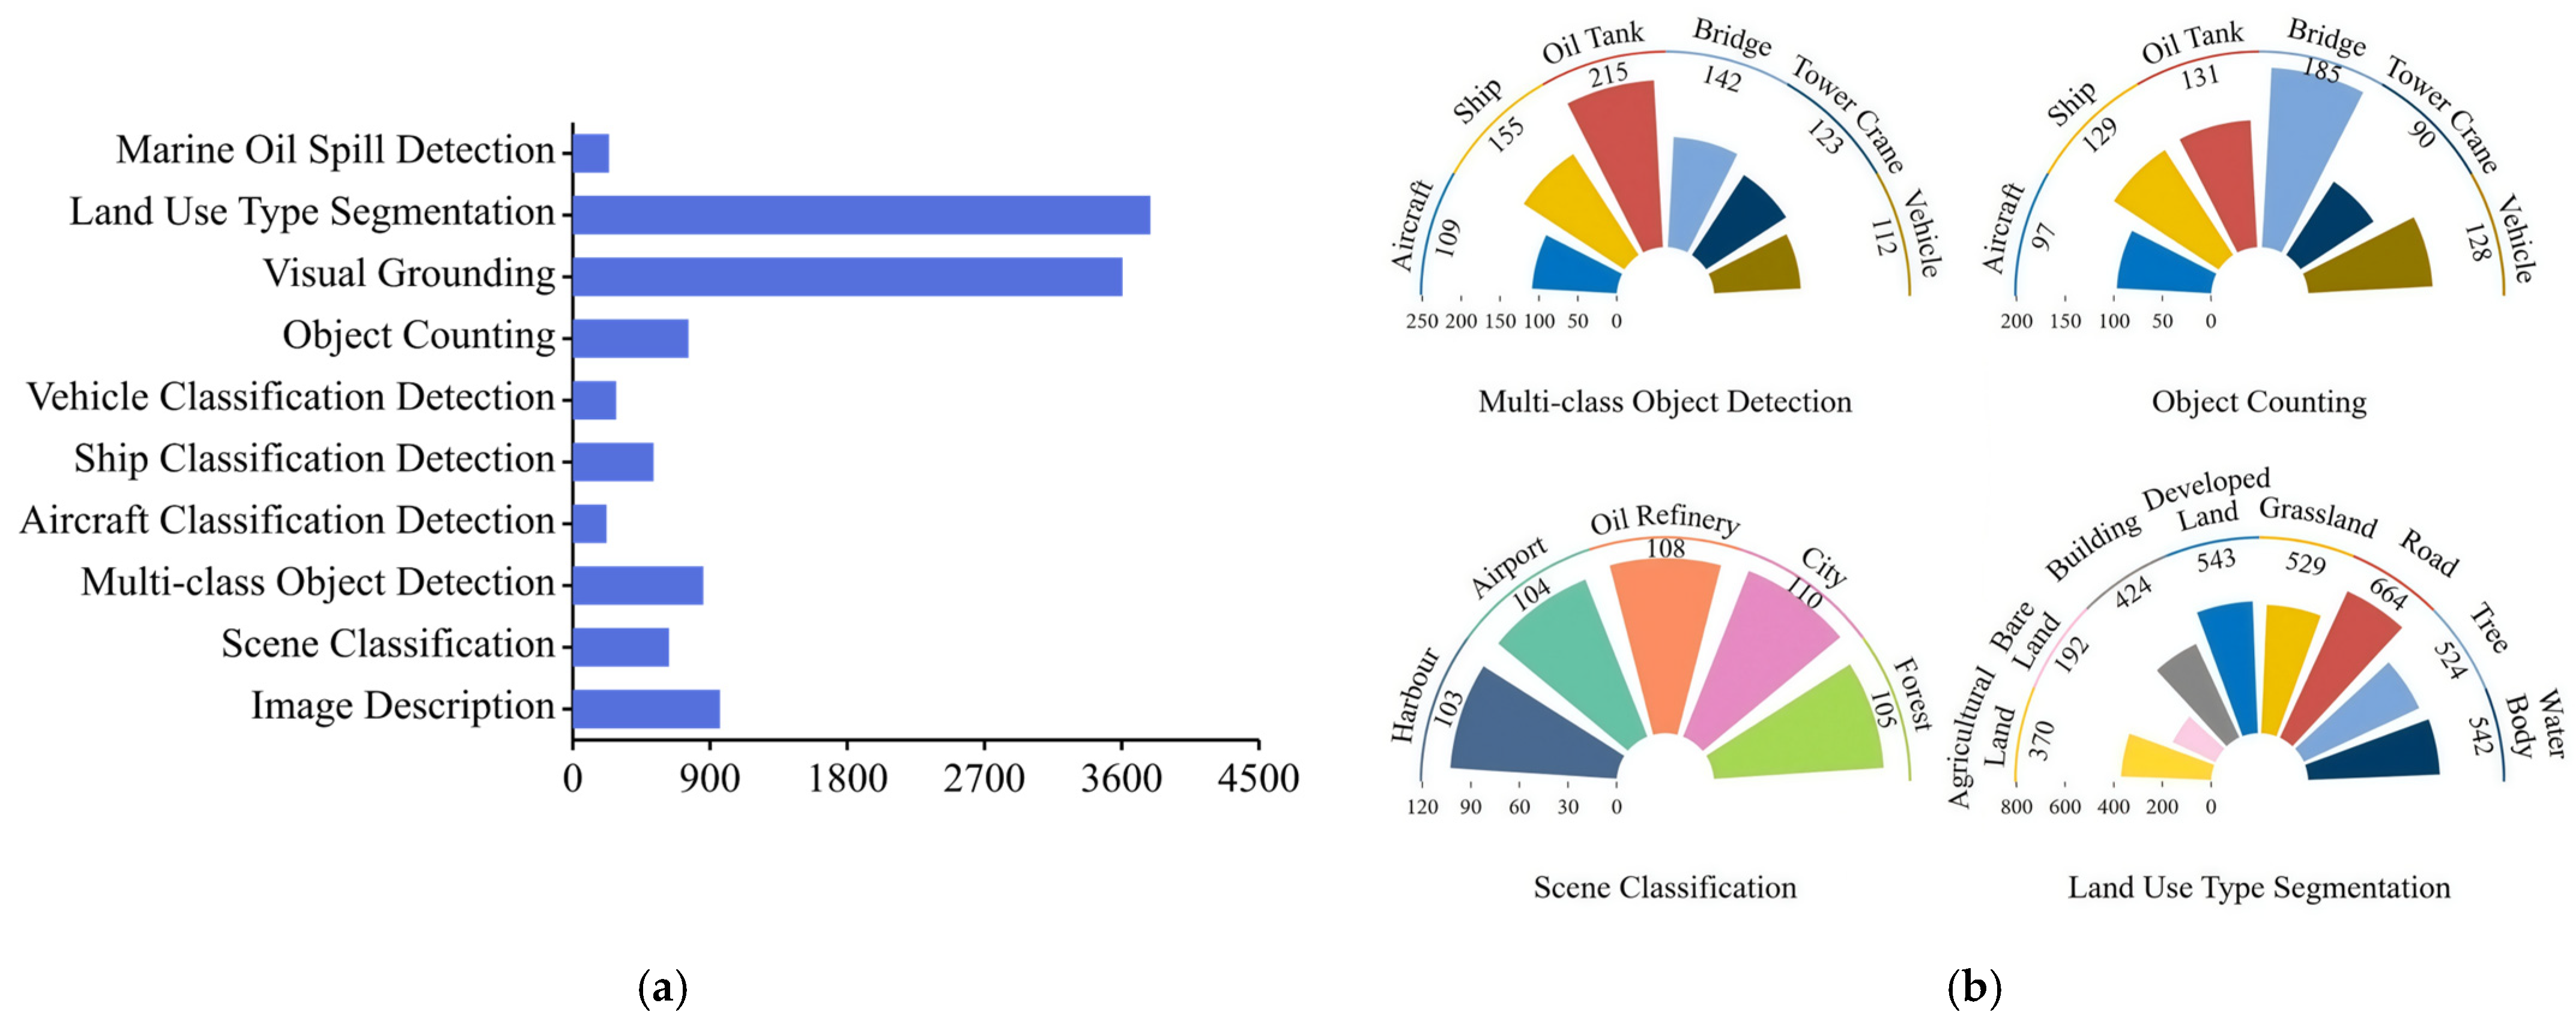
Perceptual capability forms the foundation of remote sensing image interpretation. It requires models to identify various ground objects within an image, distinguish their physical properties, and provide support for harder reasoning tasks. Since SAR imagery, based on coherent imaging principles, lacks intuitive visual features such as color and texture found in optical imagery, object discrimination relies heavily on microwave scattering characteristics and scene structure. To systematically and comprehensively evaluate the perceptual capabilities of VLMs on SAR data, this dataset constructs evaluation tasks across three levels: Image-level Understanding, Object-level Recognition, and Pixel-level Segmentation. Each level is closely aligned with typical SAR remote sensing applications, such as ocean monitoring and land use mapping. To intuitively illustrate the design of each subtask in the Perception dimension, Figure 2 presents visualization examples of key tasks across Image-level Understanding, Object-level Recognition, and Pixel-level Segmentation.
Image-level Understanding: These tasks focus on the model’s ability to grasp the overall theme and central content of an entire SAR image. SAREval selects natural environments (e.g., farmland, forest, and water bodies) and man-made environments (e.g., airports, ports, refineries, urban areas), covering the most critical application scenarios for SAR remote sensing, thereby providing a comprehensive assessment of a model’s practical potential. Representative tasks include Typical Scene Classification and Image Description: (1) Scene Classification: This task focuses on coarse-grained theme identification, requiring the model to accurately distinguish core categories of natural versus man-made environments. It simulates the practical need for rapidly screening imagery for specific scenes, testing the model’s ability to capture overall scene characteristics. This provides technical support for the preliminary classification and filtering of large-scale remote sensing datasets. (2) Image Description: This task requires the model to generate natural language text describing the scene type, key objects, and their spatial relationships. Since SAR imagery lacks color information, descriptions must incorporate scattering characteristics and spatial layout. This tests the model’s ability in multimodal semantic fusion and professional expression, aiding non-experts in quickly understanding SAR image content.
Object-level Recognition: These tasks focus on the recognition, counting, and localization of high-value ground objects, such as aircraft, ships, oil tanks, bridges and vehicles in SAR imagery, which are often central to scenarios like maritime surveillance, military reconnaissance, and infrastructure monitoring. They evaluate the model’s progressive capability from basic recognition to complex semantic localization, meeting fine-grained information needs across different scenarios. (1) Object Detection: Beyond foundational multi-category detection, this task emphasizes fine-grained classification of three high-value targets, including vessels, aircraft, and vehicles. For vessels, it accommodates varying difficulty levels: a moderate-difficulty task defines 14 relatively general categories, while a high-difficulty task refines these into 81 more discriminative fine-grained categories. Aircraft detection covers 13 common categories. Vehicles are meticulously divided into 22 major and 50 minor subcategories. This design thoroughly and precisely validates the model’s ability to distinguish between object categories at different levels of granularity. (2) Object Counting: Building upon detection, this task requires precise quantification of target numbers. It primarily assesses the model’s recognition stability and precision in scenes with dense targets or complex backgrounds. The absence of color and texture features in SAR imagery makes small targets prone to being missed and clutter prone to false detection, placing higher demands on the quantitative accuracy of counting results. (3) Visual Grounding: Differing from traditional object detection, this task requires the model to process complex natural language queries in an open-vocabulary context. It must not only identify predefined categories but also localize targets and judge attributes based on natural language descriptions. This tests the model’s multimodal semantic fusion and implicit constraint resolution capabilities, closely aligning with real-world scenarios where users query specific targets using natural language.
Pixel-level Segmentation: These tasks demand a higher level of fine-grained understanding from the model. SAR imagery covers areas ranging from square-kilometer-scale urban agglomerations to sub-meter individual objects, with small targets like ships and vehicles often coexisting with large-scale features like airports and ports in the same scene. Such tasks require the model to generate pixel-level masks for precise contour extraction, testing its ability to handle challenges like edge blurring and object adhesion in fine-grained segmentation. (1) Land use Segmentation: This task requires the model to perform precise pixel-level segmentation for eight land cover categories—agricultural land, bare land, buildings, developed land, grassland, roads, forest, and water bodies—using pixel-level masks. The model must ensure the fineness of object boundary extraction, providing detailed spatial distribution information for precise land use planning, management, and ecological environment monitoring. (2) Marine Oil Spill Detection: This task directly addresses environmental monitoring and disaster emergency response scenarios. It requires the model to accurately identify areas of changed sea surface roughness caused by oil spills in SAR imagery. Typically, when an oil spill occurs, an oil film forms on the sea surface, significantly reducing its backscatter intensity and creating dark areas in the image that contrast markedly with the surrounding water. Identifying and extracting oil spill areas provides critical support for marine pollution emergency response, oil spill source identification, and cleanup operation planning, effectively mitigating losses from marine pollution.

3.1.2. Reasoning Capability Dimension

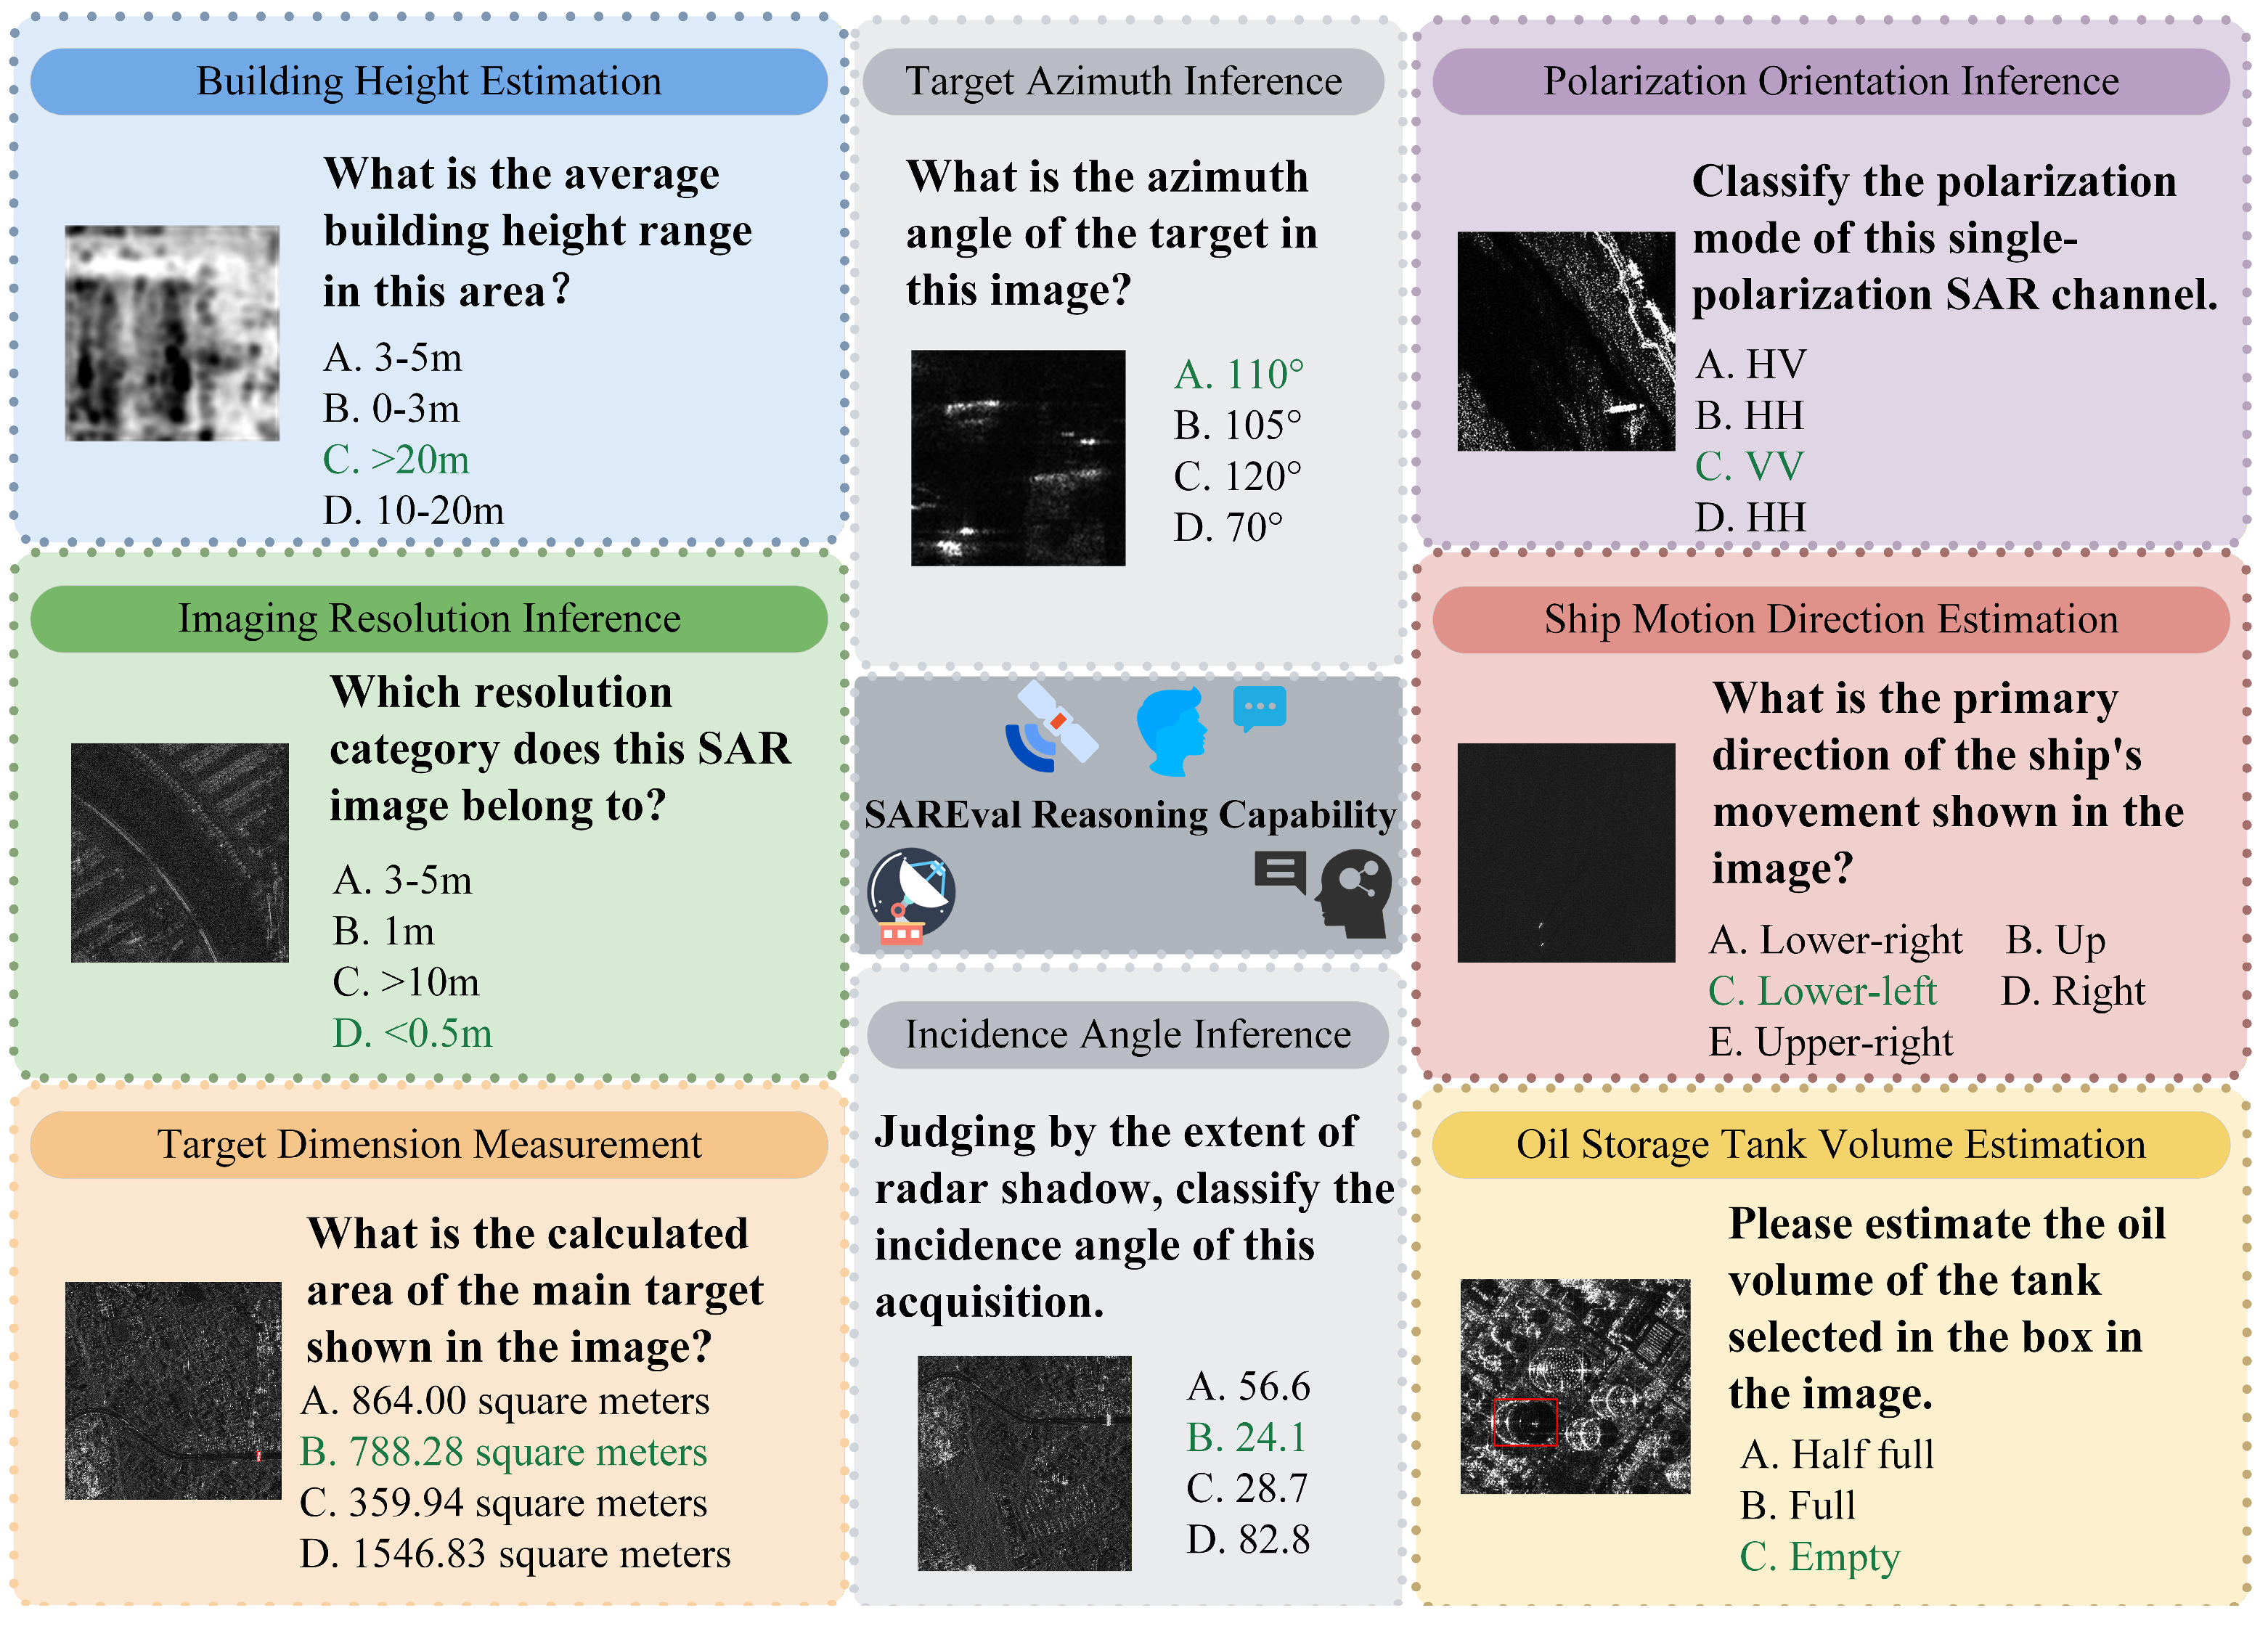
Reasoning capability represents the core advanced skill of VLMs, building upon the foundational perception of SAR imagery. Interpreting SAR data requires not only visual features but also integration of specialized knowledge, such as microwave scattering physics and the geometric distortion principles of side-looking imaging, to deduce physical essence and quantitative parameters from image phenomena, thereby providing decision support for quantitative remote sensing applications. This dimension designs three categories of progressive tasks to systematically test the model’s deep reasoning and analytical abilities, as shown in Figure 3.
Object Attribute Inference: These tasks require the model to fully understand the microwave scattering characteristics of objects during the SAR imaging process, combining visual features and domain knowledge to infer the dynamic physical states and related attributes of targets. They have practical applications in maritime supervision and energy management. (1) Ship Motion Direction Estimation: A crucial requirement for maritime dynamic monitoring and safety control, this task evaluates the model’s ability to infer a target’s motion state based on the texture features of its wake and ocean dynamics principles. In SAR images, ship movement generates features like turbulent wakes and narrow-V wakes, which have definite physical relationships with the ship’s dynamics. Accurately inferring the ship’s motion direction enables direct application in various key scenarios, such as real-time vessel track monitoring in maritime traffic management, identifying suspicious vessels deviating from routes, judging illegal fishing in restricted zones combined with current data, and predicting future positions for search and rescue or oil spill dispersion warnings. (2) Oil Storage Tank Volume Estimation: This task requires the model to leverage the dihedral corner reflector effect inherent in SAR imaging mechanisms. By estimating the height difference between the tank roof and the floating roof surface, it infers the oil storage volume, enabling timely detection of anomalies like oil theft or leakage. This provides crucial support for energy supply chain control and oil depot safety monitoring.
Imaging Parameter Estimation: These tasks aim to evaluate the model’s ability to invert key sensor imaging parameters from SAR imagery. Parameter estimation directly reflects SAR image quality and object scattering characteristics, holding significant importance for multi-source SAR data fusion, image quality assessment, and enhancement of specific targets. They test whether the model has developed a deep physical understanding of SAR imaging geometry and its interaction with ground objects. (1) Target Azimuth Inference: Utilizing a dataset built from SAR images of the same vehicle target at different azimuth angles under the same polarization, this task assesses whether the model can capture scattering differences caused by orientation changes, evaluating its ability to infer the imaging azimuth angle based on local target scattering characteristics. This can serve applications like dynamic target tracking. (2) Polarization Orientation Inference: This task is designed based on the differing reflection characteristics of objects under various polarization modes, facilitating the effective use of multi-polarization SAR data and enhanced identification of specific targets like metallic objects and vegetation. (3) Incidence Angle Inference: Useful for cross-scenario data fusion, this task critically assesses whether the model can move beyond superficial cognition of object brightness and infer the imaging geometry from the global intensity gradient of the image. Once the model accurately infers the incidence angle for different images, it can standardize the intensity values of images from different sensors based on the physical relationship between incidence angle and scattering intensity, thereby eliminating fusion interference caused by geometric differences. This provides a crucial geometric anchor for collaborative analysis of SAR data across time, platforms, and sensors. (4) Imaging Resolution Inference: This task requires the model to infer the resolution parameter based on imaging detail and dimensional accuracy, providing a fundamental basis for extended applications like imaging mission planning and super-resolution reconstruction.

3.1.3. Robustness Capability Dimension

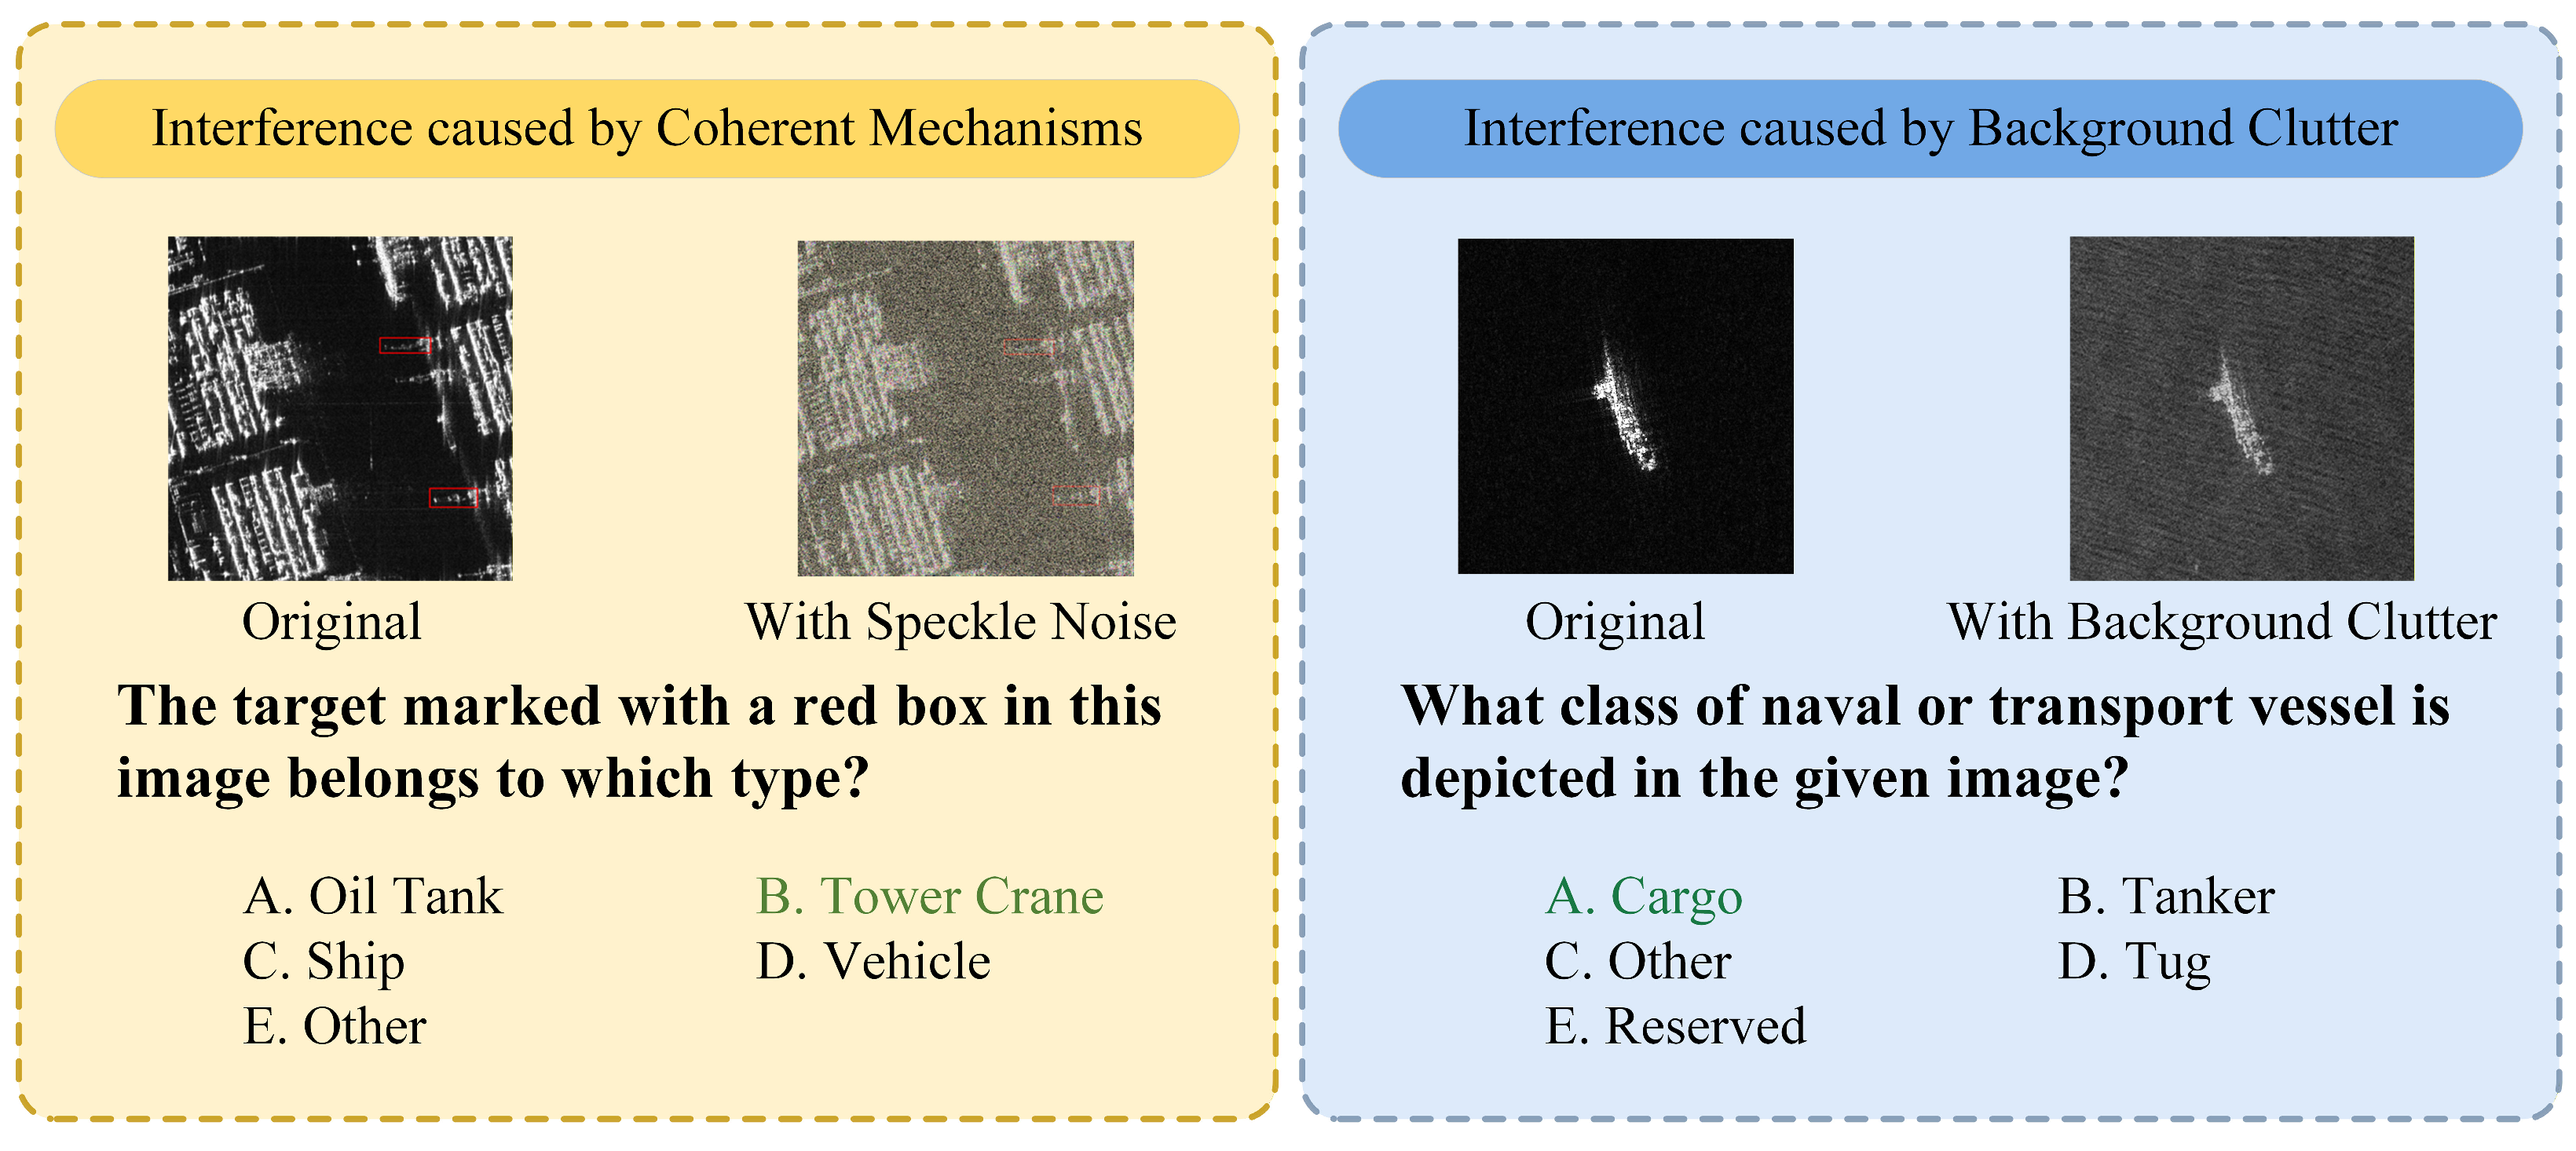
The design of the robustness dimension originates from the inherent interference in real SAR imagery and the practical need for application robustness. Numerous interference factors in reality severely affect imaging quality, constraining model performance in perception and reasoning. Constructing capabilities in this dimension aim to comprehensively evaluate the stability of VLMs under non-ideal conditions, exposing model overfitting issues that are difficult to detect on clean data, and prompting models to perform stably and reliably in complex, challenging environments. It specifically focuses on in-depth investigation of two primary interference types, evaluating the model’s Robustness against Interference. Figure 4 provides comparative visualizations for the two core interference types in the Robustness dimension, clearly showing SAR image changes before and after interference addition and the corresponding task evaluation scenarios.
Interference caused by Coherent Mechanisms: Speckle noise, stemming from the unique coherent imaging mechanism of SAR systems, is an unavoidable intrinsic ailment of SAR imagery. When the coherent electromagnetic waves emitted by the radar illuminate a target, the scattered echoes from the target interfere with each other at the sensor. Because a resolution cell contains multiple scatterers, the phase of each scatterer’s echo varies randomly due to different distances from the sensor, causing the composite amplitude to fluctuate. This finally manifests as granular noise with alternating bright and dark spots in the image. Speckle noise obscures fine object textures, blurs target contours, and alters the image’s statistical distribution. Robustness evaluation based on speckle noise effectively tests the essential invariance of the model’s feature representations, helping to uncover VLMs with better generalization performance.
Interference caused by Background Clutter: Clutter noise originates from complex echoes generated by numerous random scatterers in the scene background. It is highly non-stationary and scene-dependent, exhibiting significant spatiotemporal dynamic characteristics. Unlike global speckle noise, clutter is a localized interference strongly correlated with the background environment. In maritime scenes, sea clutter intensity is influenced by sea state, wind speed, radar frequency, and polarization mode, exhibiting non-Gaussian distribution characteristics that change dynamically with waves, forming irregular textures of alternating brightness in the image. In terrestrial scenes, clutter characteristics are determined jointly by topography, object types, and radar frequency. For example, building walls and roofs in urban areas cause multipath scattering, easily generating strong clutter regions, while the periodic textures of flat farmland form regular clutter patterns. Clutter noise significantly reduces the local signal-to-clutter ratio, masks real targets, and increases the false alarm probability, posing major challenges for target detection and recognition tasks. Robustness evaluation based on clutter noise examines the model’s ability to discriminate object features and resist confusion.

3.2. Dataset Construction and Quality Control

The construction of SAREval is structured around the Perception, Reasoning, and Robustness dimensions. Leveraging multi-source open datasets and integrating commercial model assistance with expert manual verification, it establishes a comprehensive benchmark encompassing multiple formats, including multiple-choice questions, subjective open-ended questions, and objective label outputs. This provides a unified, fair, and comprehensive evaluation standard for large Vision-Language Models on SAR image understanding tasks, effectively facilitating performance comparison and capability assessment across different models and task types.

3.2.1. Data Source

The SAREval dataset is built upon publicly available datasets. For the diverse tasks under the three core capability dimensions, specialized SAR datasets with corresponding technical characteristics were selected or constructed to suit varying task requirements. The Perception dimension utilizes data sources such as MSAR-1.0 [39], SAR-Airport [40], and OpenEarthMap-SAR [41], covering typical scenes including harbors, airports, oil refineries, urban areas, and forests. It integrates object detection datasets to form a labeling system encompassing 13 aircraft categories, 14 major and 81 fine-grained ship categories, and 22 major and 50 fine-grained vehicle categories. Finely annotated datasets like OpenEarthMap-SAR [41] and Deep-SAR Oil Spill [30] are used to implement land use classification and marine oil spill detection tasks. The Reasoning dimension utilizes geospatial datasets (e.g., FAIR-CSAR [42] and BHdataset [43] ) that are stored in standard geoTIFF format with fine annotations and high bit-depth, compatible with GIS software such as ArcGIS. These alongside datasets with prominent feature attributes such as OpenSARWake [44] and ATRNet-STAR [45], to construct tasks for geometric measurement, attribute judgment, and imaging parameter inference. The Robustness dimension is constructed using image samples from the multi-class object detection task and simulated noise data introduced into image samples from the ship classification detection task. Notably, to prevent potential data leakage during model training, all data are exclusively drawn from the predefined test splits of the public source datasets, ensuring the objectivity and fairness of evaluation results. Specific data sources are detailed in Appendix A.1.

3.2.2. Task-Adaptive Hybrid Annotation Framework

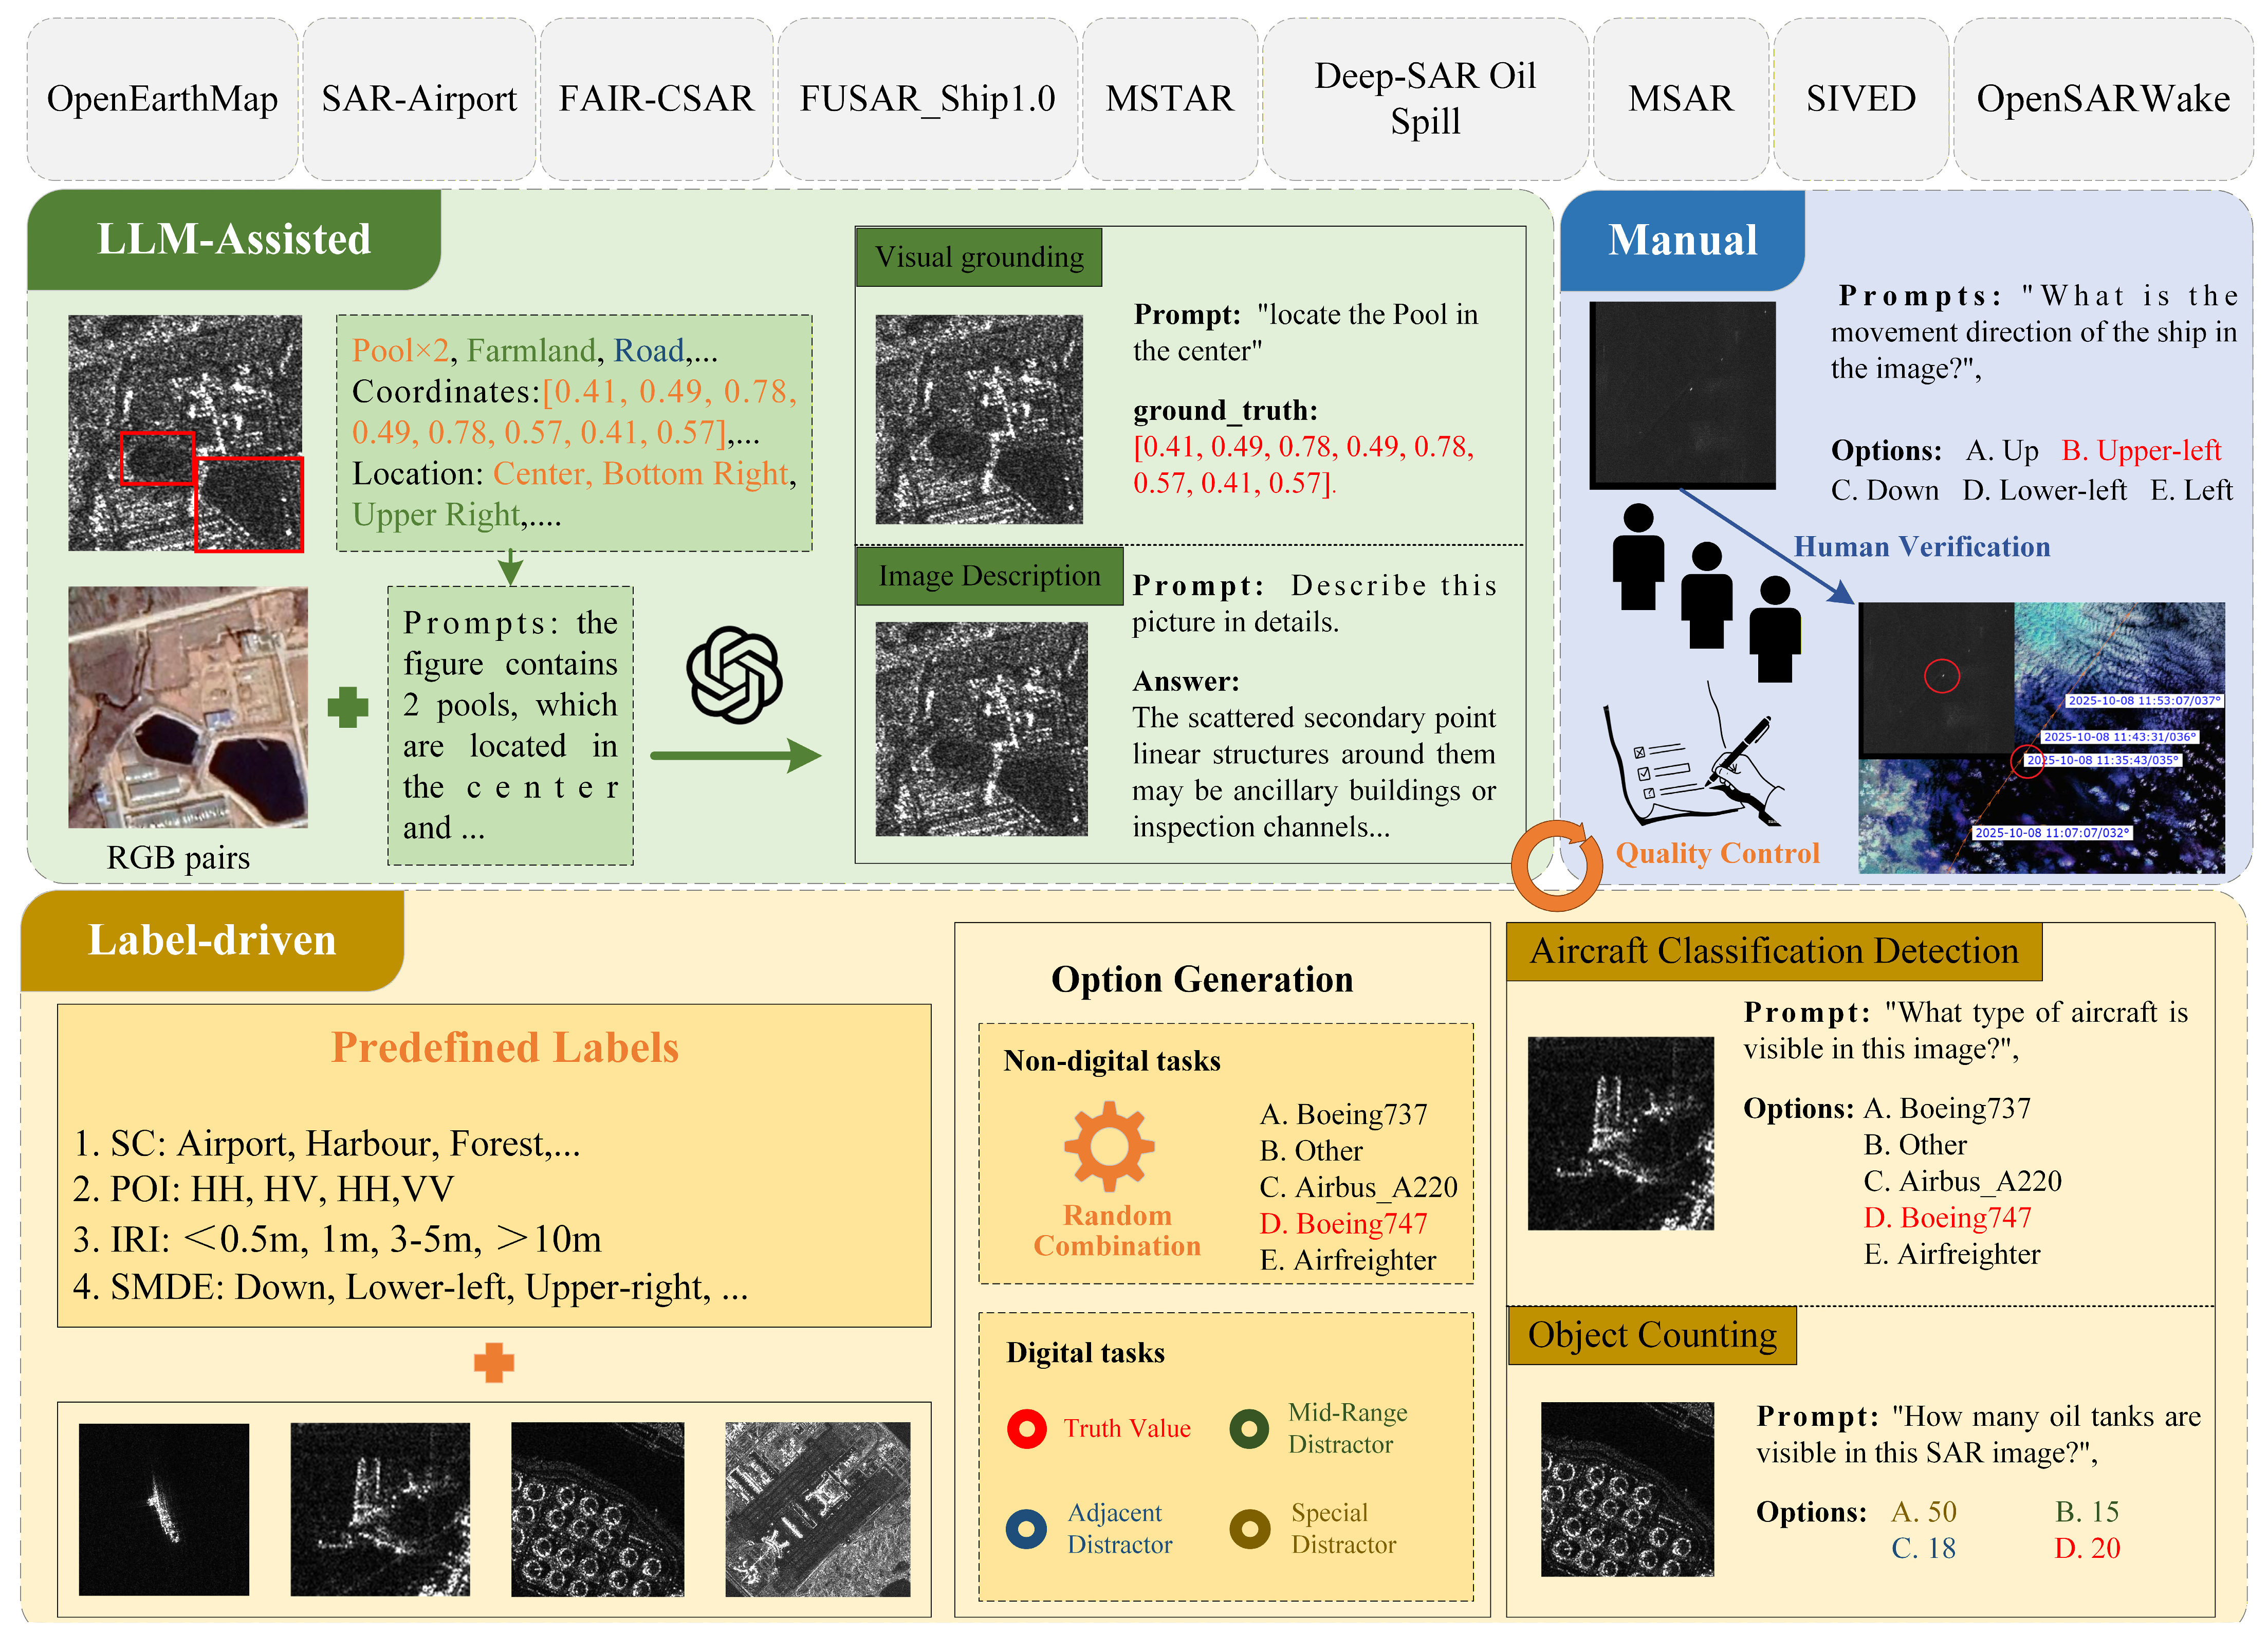
To balance data scale, annotation efficiency, and professional accuracy requirements, the SAREval benchmark employs a hybrid annotation framework combining label-driven methods, manual annotation, and LLM-assisted approaches, as illustrated in Figure 5. Tailored to task characteristics, it generates question–answer pairs adapted for three formats: MCQs, free form, and objective label output.
Label-driven Structured Annotation Method: This method centers on the annotation metadata of SAR images. It generates standardized question–answer pairs through key field extraction and rule-based mapping, serving foundational tasks with definitive objective answers, such as scene classification, land use classification, object detection, and polarization mode determination. Objective labels typically serve as the ground truth in answers for MCQs and objective label output tasks. MCQs convert open-ended answers into predefined option sets, prompting the model to select the correct letter from the given choices. This format is suitable for tasks with a single, objectively correct answer. Objective Label Output tasks primarily visual grounding and pixel-level segmentation. Models are required to output the spatial location of targets within the image, either as rotated bounding box coordinates [x1, y1, x2, y2, x3, y3, x4, y4] or as masks.
In designing MCQs, the strategic construction of distractors is crucial for enhancing the assessment’s discriminative power. Accordingly, SAREval employs differentiated distractor generation strategies based on task characteristics. For non-numerical tasks like scene classification, object detection, polarization orientation inference, and ship motion direction estimation, distractors are randomly selected from predefined label sets. For numerical reasoning tasks like object counting, target dimension estimation, incidence angle inference, and target azimuth inference, distractors must align with realistic SAR imaging scenarios, simulating potential cognitive confusion in practical applications while effectively identifying random model selection. Thus, a “Physical Constraints + Gradient Divergence” generation strategy is adopted, constructing a three-tier distractor system comprising Adjacent Distractor, Mid-Range Distractor, and Special Distractor based on ground truth values. This ensures physical plausibility while utilizing differentiated numerical values to precisely evaluate model reasoning depth.
(1) Object Counting: Adjacent Distractors are true count ±1–3, simulating minor errors from visual fatigue or partial occlusion in manual counting; Mid-Range Distractors are true count ±3–6, simulating counting deviations from target overlap or edge blurring in dense scenes; Special Distractors are set to 0 or values exceeding scene capacity, eliminating model reliance on shallow default counting range memorization while ensuring distractors reflect actual counting uncertainties and accurately evaluate precise target quantity reasoning capability.
(2) Target Size Measurement: True values for target dimensions are calculated from object detection bounding boxes annotated with Oriented Bounding Boxes (OBBs). Adjacent interference items are set to ±5–15% of the true area, with step sizes dynamically adjusted based on actual area size: 0.1-meter increments for small targets and 1.0-meter increments for large targets. This simulates common minor errors in practical annotation, such as rounding discrepancies and pixel-level measurement inaccuracies, testing the model’s ability to distinguish subtle area variations and preventing misjudgments due to numerical precision issues. Med-range interference parameters are set at ±30% to ±60% of the actual area, simulating estimation deviations caused by varying target specifications in real scenarios. Special interference items employ a multidimensional strategy incorporating extreme values (±80–120% of true area), typical proportional values (e.g., 0.5×, 2×), and integer approximations. This approach eliminates reliance on shallow memory while precisely evaluating the model’s deep reasoning capabilities regarding area essence and its interference resistance through physically plausible yet cognitively biased numerical values.
(3) Incidence Angle Inference: Distractor generation strictly follows SAR imaging physics, ensuring angles within a conventional range (10–60°). Adjacent Distractors are true value ±3–5°, simulating subtle sampling interval variations; range-edge items are plausible values near 10° lower bound or 60° upper limit, testing global incidence angle range understanding; Special Distractors are set near attitude angles, preventing confusion between incidence/attitude angle physical meanings and reinforcing fundamental parameter comprehension.
(4) Target Azimuth Inference: Distractor design leverages ATRNet-STAR [45] acquisition characteristics (airborne SAR, 5° sampling interval). Adjacent Distractors are true value ±5–10°, aligning with minimal practical sampling differences; Mid-Range Distractors differ by 30–60°, representing significant orientation changes; Special Distractors utilize 360° azimuth periodicity, verifying model understanding of angular periodicity.
LLM-Assisted Generative Annotation Method: To significantly enhance annotation efficiency and scale, SAREval employs an LLM-assisted strategy for generating labels, aiding in question generation, prompt generation for visual grounding, and answer generation for image description. For question generation, the task definition and requirements for the model under test are first determined. DeepSeek is then used to generate 10–20 sets of question variants with different phrasings. Finally, five unambiguous questions are selected as the final prompts for each task.
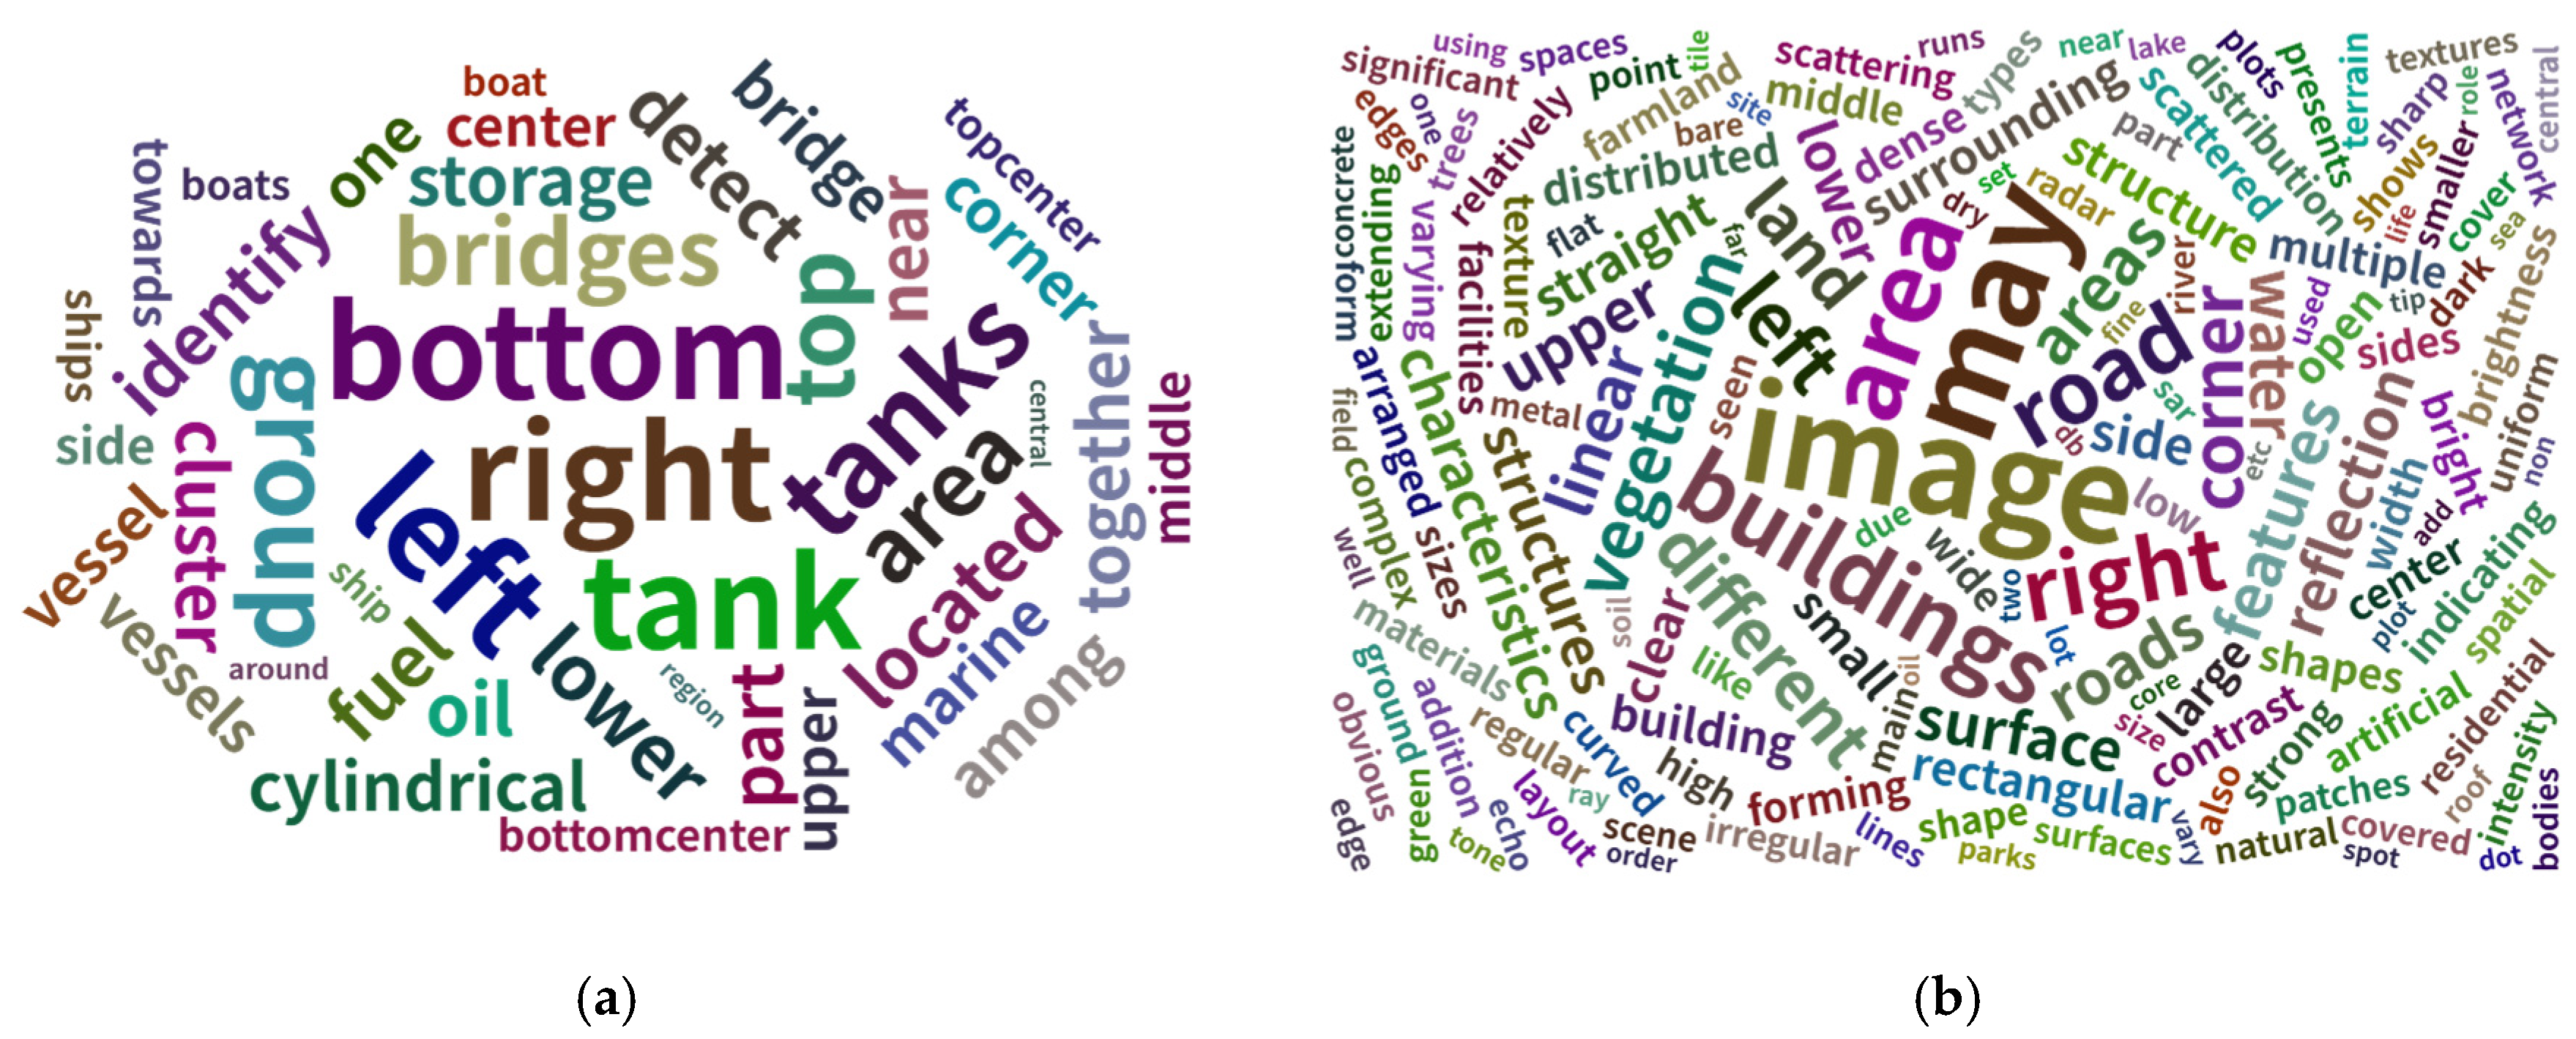
For the complex needs of visual grounding prompt generation and image description answer generation, this study utilizes GPT-4o, combined with paired visible-light and SAR image data, to improve the accuracy of SAR image description generation. Firstly, basic information, such as image source, resolution, polarization mode and attribute information, including target category, bounding box, location, and size, are extracted from paired visible-SAR datasets like OpenEarthMap-SAR [41], assessing target uniqueness within the image to build accurate reference descriptions. Secondly, structured prompts are designed based on the reference descriptions and fed into GPT-4o along with the images, generating descriptions for both the SAR and visible-light images that cover global scene context and local details, with outputs organized in JSON format. Finally, professionals cross-compare, filter, and integrate the outputs, focusing on identifying common issues like hallucinations and attribute errors, to produce accurate and credible final descriptions, thus implementing quality control. This process yielded 3605 pairs for the visual grounding task and 395 pairs for the image description task. This method leverages the generative power of large models to drastically reduce manual annotation costs, while relying on attribute extraction and human verification to ensure data quality, effectively balancing the dual demands of scale and precision.
Expert Annotation Method for High-Difficulty Specialized Reasoning: To thoroughly test models’ understanding of SAR imaging mechanisms, this study innovatively introduced challenging reasoning tasks like ship motion direction detection and oil tank volume estimation. As public datasets lack corresponding professional annotations for such tasks, and their accuracy directly impacts the assessment of models’ understanding of SAR target physical properties, an expert-driven manual fine annotation approach was employed. Specifically, three professionals with over five years of experience in remote sensing were rigorously selected for annotation. Two annotators independently labeled the same target without communication, while a third reviewer performed verification. A data point was directly adopted only if the annotations from the first two annotators were consistent. For disputed samples, the third reviewer made the final judgment based on professional knowledge and image characteristics. This process resulted in 404 valid data points for ship motion direction judgment and 386 for oil tank volume estimation. This “dual independent annotation + third-party review” quality control process minimizes subjective bias, ensures annotation reliability, and provides high-quality benchmark data for subsequent performance evaluation of models on these challenging reasoning tasks. Quality control details are provided in Appendix A.4.

4. Evaluation Based on SAREval

4.1. Experimental Setup

To systematically evaluate the adaptability of mainstream VLMs for SAR image understanding tasks, this study conducts comprehensive multi-dimensional assessments of 11 representative open-source VLMs with the SAREval benchmark dataset. The selected models include Qwen2.5-VL-7B, DeepSeek-VL2-tiny, Phi-3.5-vision, along with models from the LLaVA series (LLaVA-1.5-7B, LLaVA-Next, LLaVA-OneVision) and the Intern series (InternVL2-4B, Mono-InternVL-2B, InternVideo2.5-8B, InternVL2.5-4B, InternVL3-9B). Detailed comparisons of model architectures and parameter sizes are provided in Appendix A.3. To ensure fair comparisons, all VLMs were evaluated under a zero-shot setting with standardized prompts, while accommodating specific input requirements of different models. Image inputs were uniformly resized to 512 × 512 pixels throughout the experiments.
For tasks employing MCQs, accuracy serves as the primary evaluation metric. This is defined as the ratio of correctly predicted samples to the total number of test samples. The metric precisely matches model outputs against ground truth answers, effectively quantifying model performance across various SAR image understanding capabilities. To eliminate potential bias from option ordering, correct answers for all multiple-choice questions were randomly distributed within option sequences during experimental design. This ensured equal probability for each option position to contain the correct answer, thereby preventing evaluation distortion that might arise from model learning positional preferences. For the Visual Grounding tasks, accuracy at specific Intersection over Union (IoU) thresholds—specifically Acc@0.5 and Acc@0.25—serves as the core evaluation metric. Standardized prompts guided models to output target coordinate information, which was then converted into rectangular bounding boxes within a unified pixel coordinate system. These predicted boxes were compared against manually annotated ground truth boxes using IoU calculations. A prediction was considered correct if the IoU value between the predicted and ground truth boxes exceeded the specified threshold. The number of correctly localized samples was then counted to calculate localization accuracy.
For the Image Description task, we employ three established automated metrics to quantify textual similarity from complementary perspectives. BLEU (Bilingual Evaluation Understudy) [46] measures n-gram precision (1 g to 4 g), emphasizing lexical exactness between generated and reference descriptions. ROUGE-L (Recall-Oriented Understudy for Gisting Evaluation) [47] focuses on the longest common subsequence, capturing sentence-level structural similarity and fluency. BERTScore [48] computes semantic similarity using contextual embeddings from pre-trained language models, aiming to better correlate with human judgment by recognizing paraphrases and semantic equivalence beyond surface lexical overlap. Concurrently, we introduce a LLM-as-a-Judge [49] subjective assessment using DeepSeek, prompted to score descriptions across three SAR-relevant dimensions: accuracy, professionalism, and completeness. The system generates quantitative scores ranging from 0 to 100 based on these criteria. This paradigm leverages the superior semantic understanding and domain adaptability of modern LLMs, offering an evaluation more aligned with expert human judgment for complex, technical descriptions. The specific prompts and scoring rubric for the LLM judge are detailed in Appendix A.5.
Additionally, for robustness evaluation, model performance degradation (ΔAccuracy) between the original test set and noise-corrupted versions is calculated to quantify interference resistance, providing a comprehensive assessment of model stability in practical applications.

4.2. Main Results

4.2.1. Perception Capability Assessment

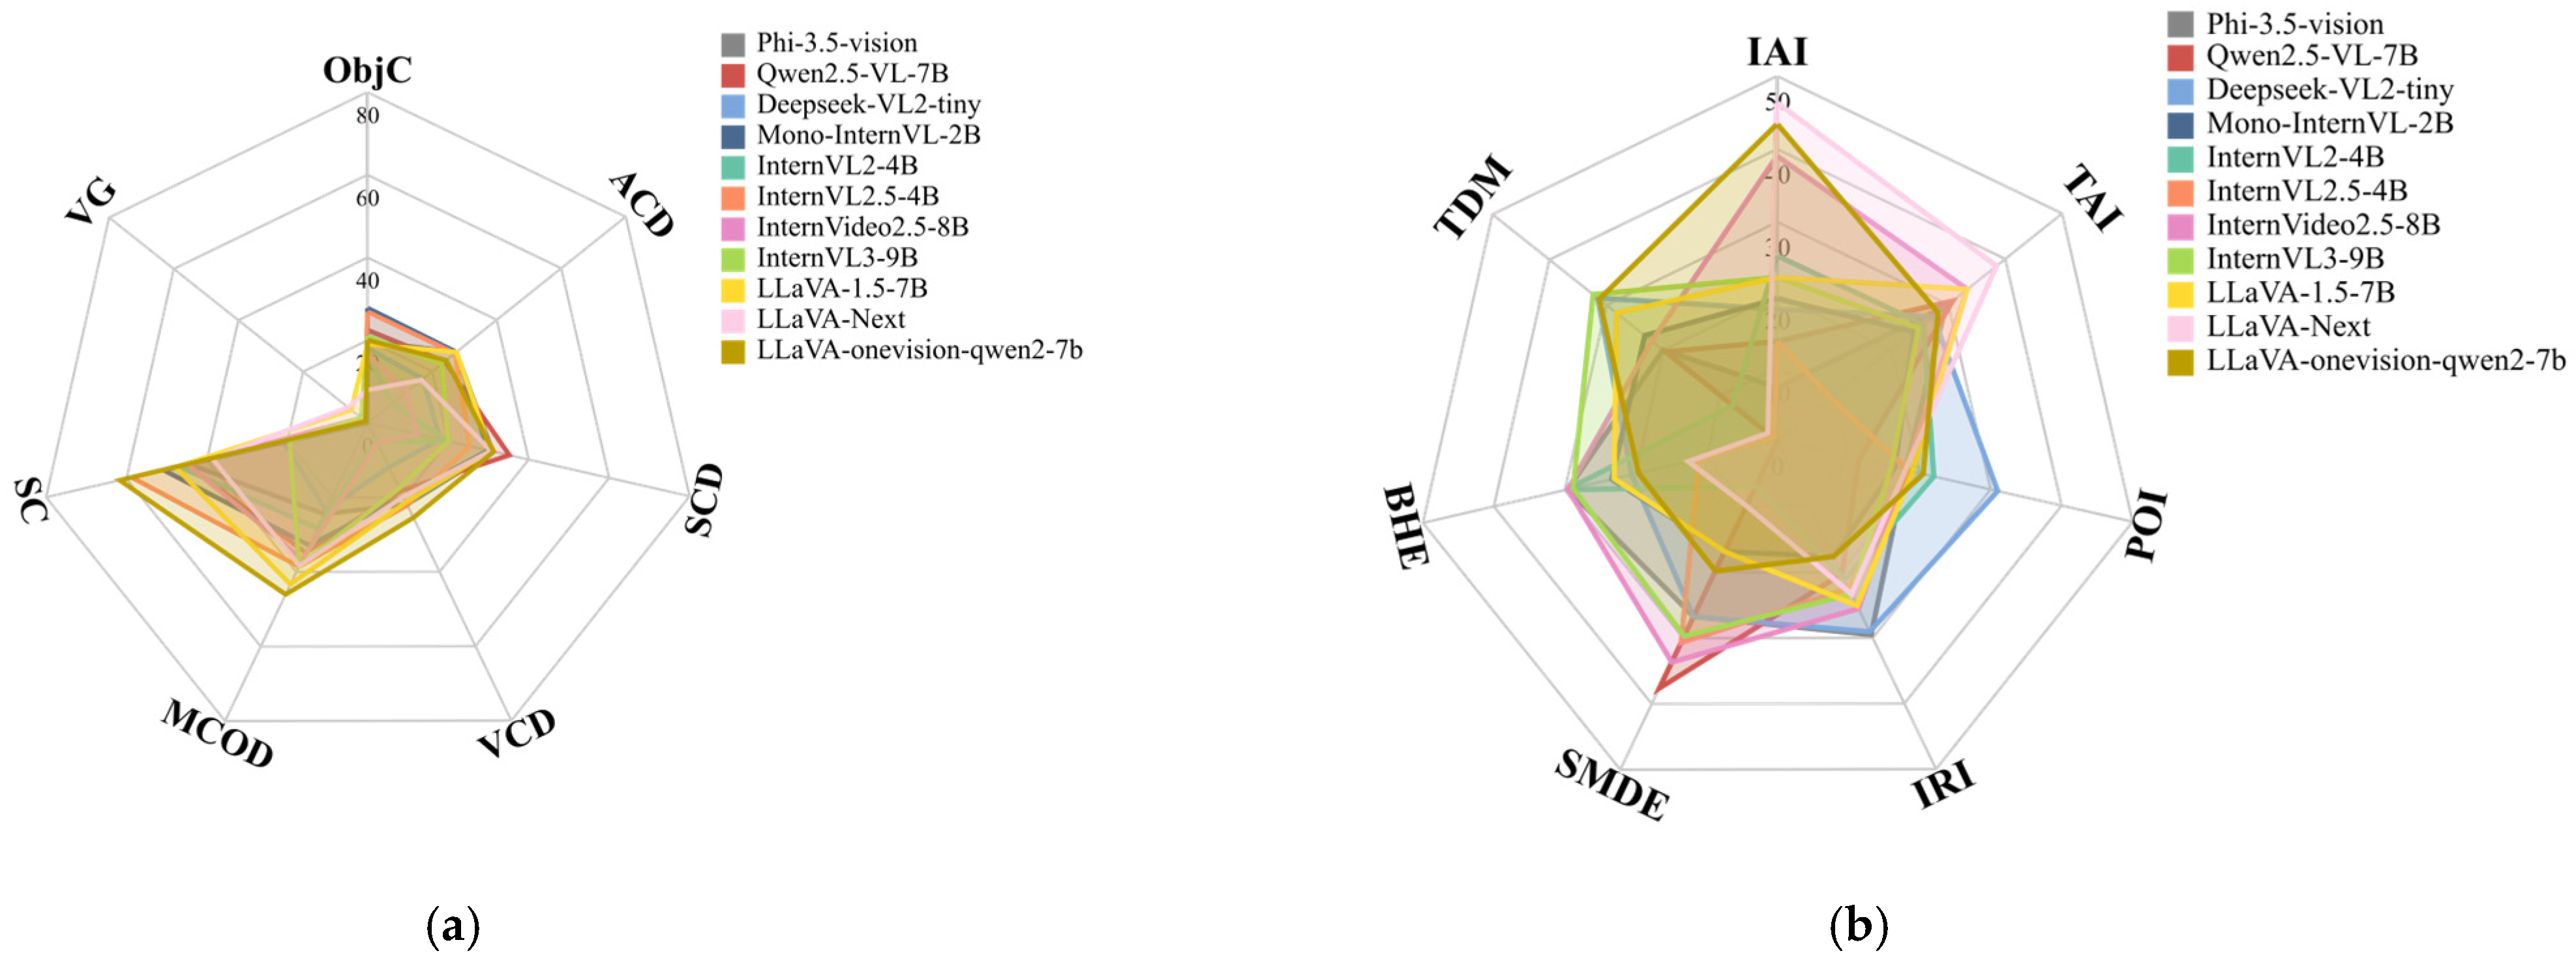
Perceptual capability constitutes the foundation of remote sensing image interpretation. Our experiments focused on fundamental visual tasks, including object detection, counting, and scene classification, primarily evaluating models’ capacity for extracting and recognizing SAR visual features. Results are presented in Figure 6 and Table 2, Table 3 and Table 4.
In image-level understanding tasks, results for Typical Scene Classification revealed that the LLaVA-OneVision-Qwen2-7B model achieved the best performance, followed by InternVL2.5-4B and Mono-InternVL-2B. These models demonstrated strong capabilities in grasping overall features for coarse-grained scene classification, meeting practical requirements for rapid screening of specific scene imagery. For Image Description (Table 3), InternVL3-9B achieved the highest subjective LLM evaluation score, showcasing advantages in natural language generation and professional semantic integration. However, all models scored notably low on automated evaluation metrics such as BLEU and ROUGE-L, indicating significant challenges remain in generating text descriptions that conform to SAR imagery expertise.
In object-level recognition tasks, LLaVA-onevision-qwen2-7b achieved the highest accuracy of 46.03% in Multi-class Object Detection, representing a 22.55% improvement over DeepSeek-VL2-tiny. For fine-grained classification and counting tasks, model performance exhibited a clear gradient effect as task difficulty increased. Qwen2.5-VL-7B performed best on the medium-difficulty Ship Classification Detection task, achieving 47.89%, whereas all models showed significant performance degradation on the high-difficulty task, with the highest accuracy reaching only 25.35%. This indicates limited capability in distinguishing highly similar fine-grained categories. In Object Counting tasks, bridges demonstrated the best overall performance due to their strong scattering characteristics and regular geometric shapes. DeepSeek-VL2-tiny achieved 41.62% accuracy in Bridge Counting but only 6.67% in Tower Counting (TCC), reflecting uneven adaptability to different ground object features. This imbalance particularly manifests in insufficient extraction capability for small targets and weak scattering features, directly attributable to SAR imagery’s lack of texture information and reliance solely on scattering intensity variations for fine category discrimination.
As shown in Table 4, performance in Visual Grounding tasks remained generally low, with all models achieving Acc@0.5 values below 3%. LLaVA-Next performed best at 2.89%, less than one-tenth of the optimal performance observed in optical image localization tasks. This phenomenon stems from SAR imagery’s lack of texture and color anchors, making it difficult for models to establish precise mappings between target visual features and linguistic descriptions. Additionally, geometric distortions caused by side-looking imaging further exacerbate localization deviations, indicating significant capability gaps in VLMs for fine-grained interpretation tasks like SAR target localization.

4.2.2. Reasoning Capability Assessment

The reasoning dimension focuses on deriving target physical attributes and SAR imaging parameters, primarily evaluating models’ logical mapping capabilities from visual features to deep semantics. Results are presented in Table 5.
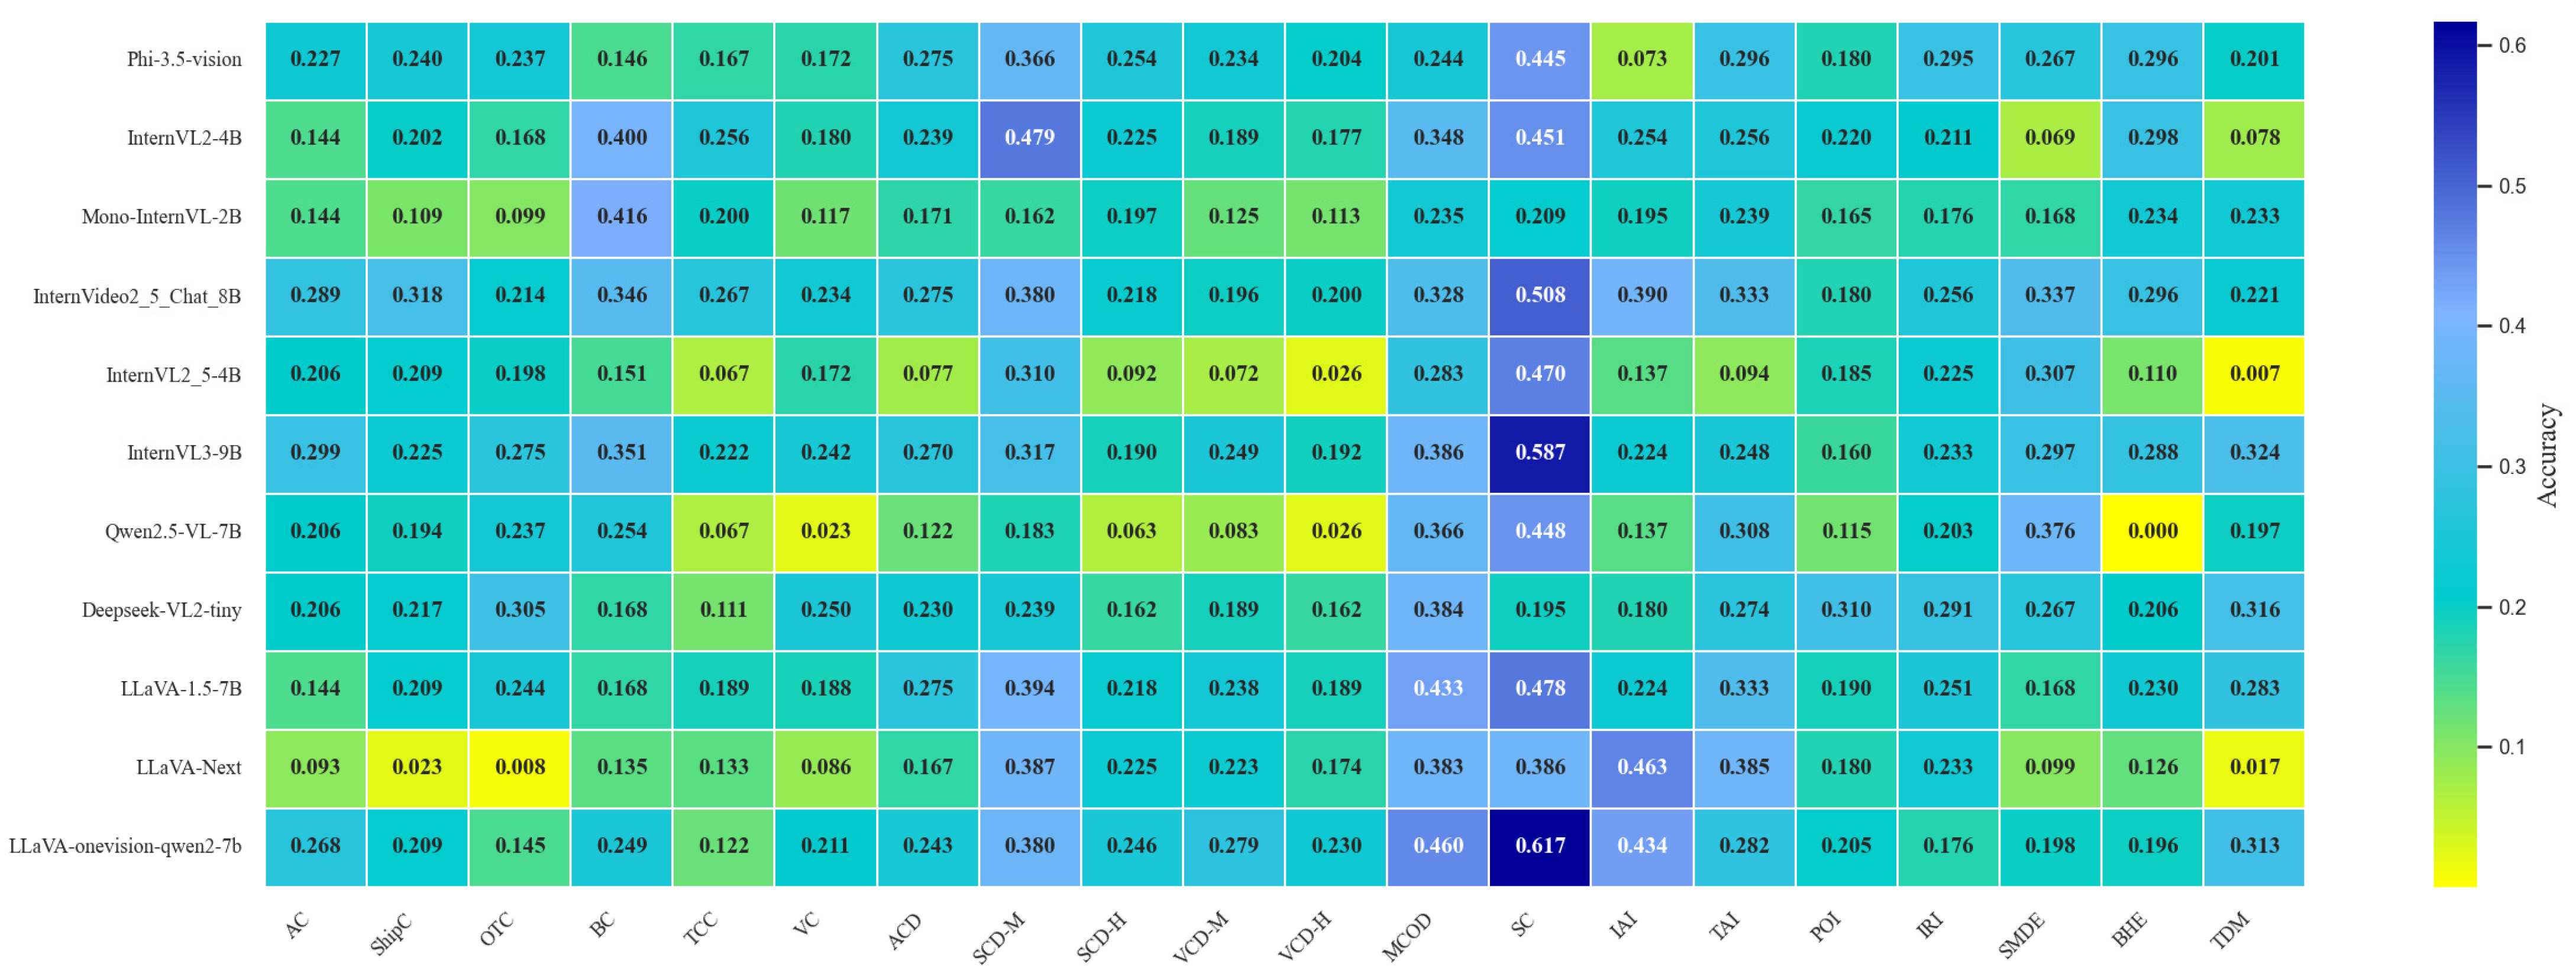
In Imaging Parameter Estimation tasks, models demonstrated relatively prominent performance in Incidence Angle Inference (IAI) and Target Azimuth Inference (TAI). LLaVA-Next achieved the best accuracy of 46.34% in IAI, while Qwen2.5-VL-7B reached the highest accuracy of 38.46% in TAI. However, overall performance in Polarization Orientation Inference (POI) remained low, with only DeepSeek-VL2-tiny exceeding 30%. This reflects insufficient model comprehension of multi-polarization scattering mechanisms, directly attributable to the lack of polarimetric SAR data in existing VLMs’ pre-training.
In Object Attribute Inference tasks, Ship Motion Direction Estimation showed the best performance. Qwen2.5-VL-7B effectively combined wake texture features with hydrodynamic principles for dynamic state inference, achieving the best performance of 37.62% in this task. However, this model performed extremely poorly in Building Height Estimation, revealing uneven reasoning capabilities across different physical attributes. In contrast, models like InternVL2-4B and Phi-3.5-vision could establish height correlations using features like layover and shadows, achieving nearly 30% accuracy. Meanwhile, InternVL3-9B, LLaVA-OneVision-Qwen2-7B, and DeepSeek-VL2-tiny all exceeded 30% accuracy in Target Dimension Measurement, indicating preliminary capability to establish pixel-to-physical size mappings and derive key spatial parameters of ground objects.

4.2.3. Robustness Capability Assessment

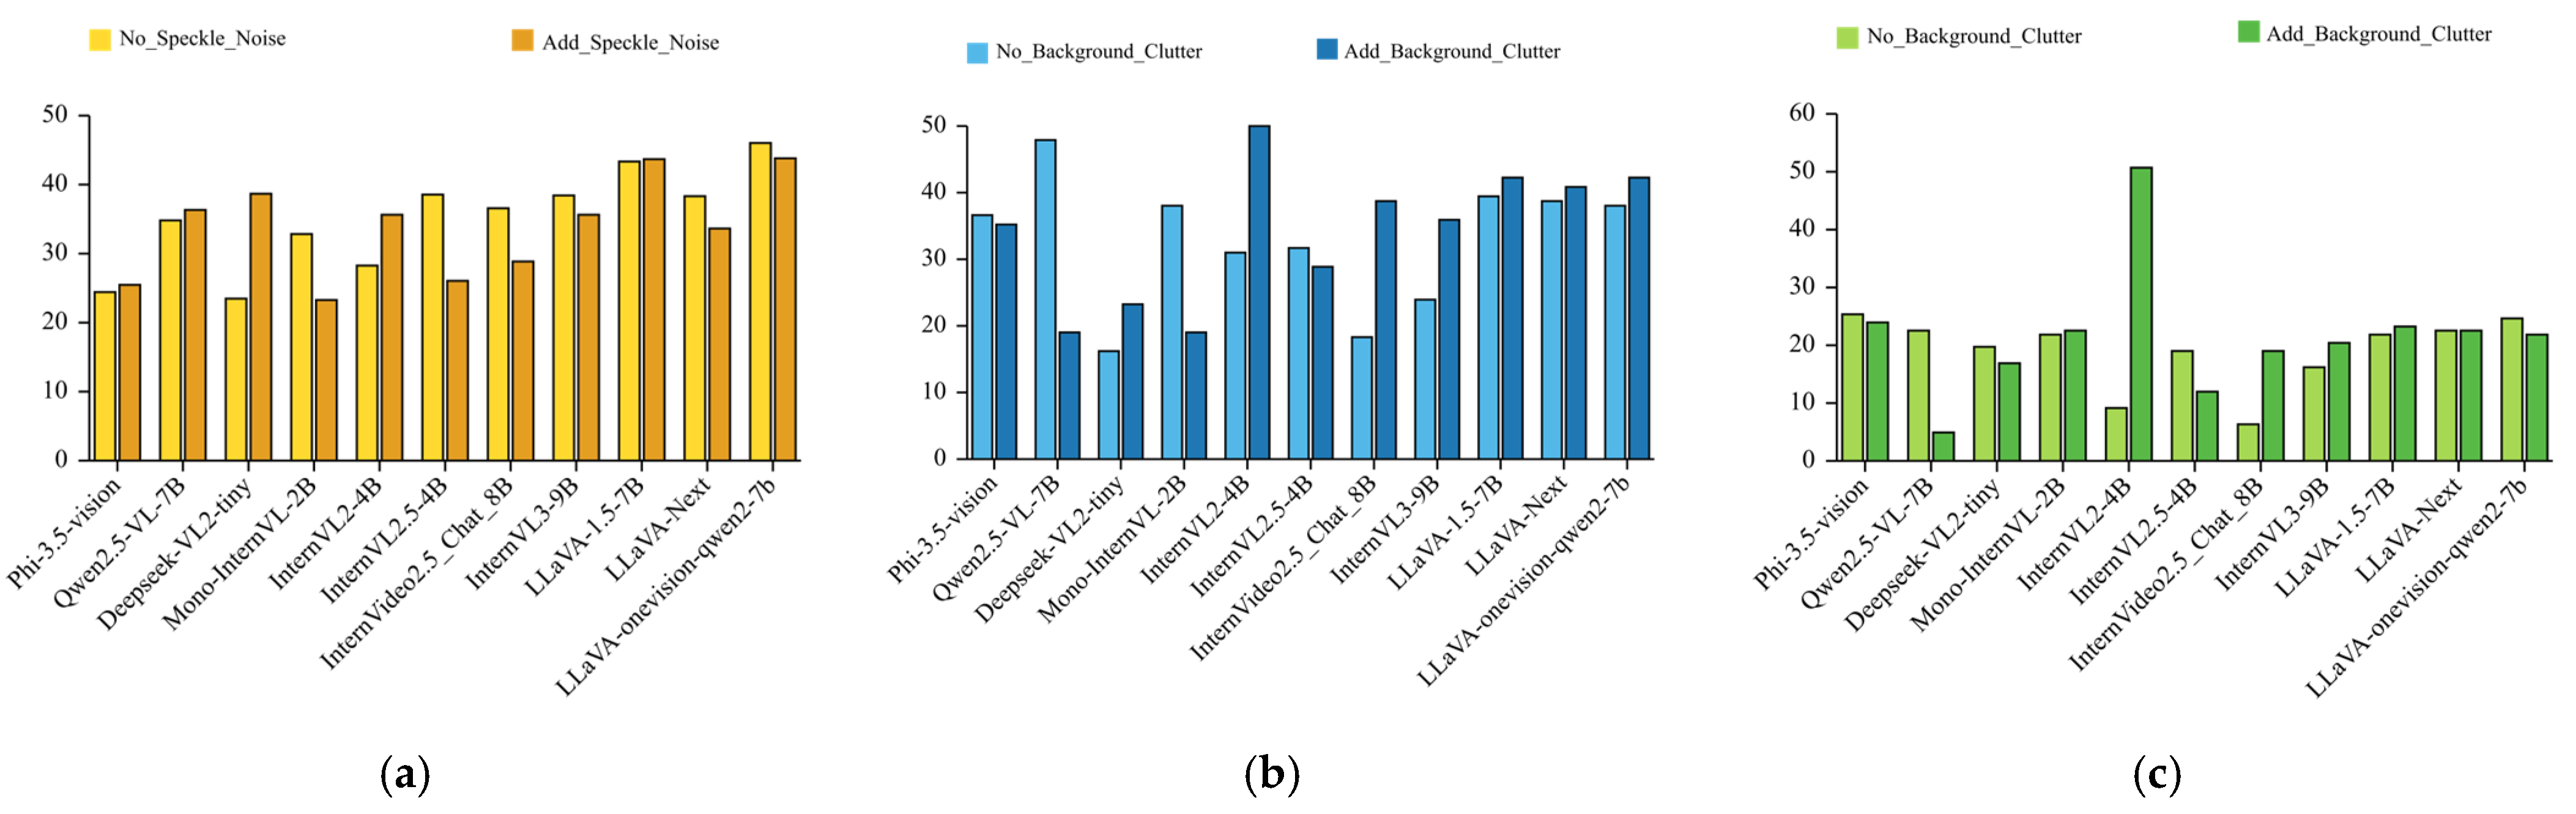
The robustness dimension focuses on evaluating interference resistance, primarily assessing VLMs’ stability in maintaining target recognition and classification performance when SAR images are affected by noise or clutter interference. Testing centered on two core SAR interference sources—speckle noise from coherent mechanisms and background clutter—using Multi-class Object Detection and Ship Classification Detection as benchmark tasks. Results are presented in Table 6 and Table 7, and Figure 7.
In speckle noise interference tests based on Multi-class Object Detection (Table 6), we compared model performance before and after noise introduction. Models exhibited three distinct response patterns: InternVL2.5-4B, Mono-InternVL-2B, and InternVideo2.5-8B suffered severe performance degradation, showing extreme sensitivity to coherent speckle noise. In contrast, LLaVA-1.5-7B and LLaVA-OneVision-Qwen2-7B demonstrated exceptional stability, with performance fluctuations confined within ±2% under noise interference, making them ideal candidates for deployment in stable operational environments. Most strikingly, DeepSeek-VL2-tiny showed a significant +15.19% performance improvement after speckle noise introduction.
This phenomenon similarly manifested in background clutter interference tests benchmarked against Ship Classification Detection, as shown in Table 7. LLaVA series models maintained optimal stability across different difficulty levels, with variation amplitudes generally controlled within ±3%. Meanwhile, InternVL2-4B, InternVideo2.5-8B, and DeepSeek-VL2-tiny again demonstrated performance improvements under noise conditions, with InternVL2-4B achieving a remarkable 41.55% improvement in high-difficulty tasks.

5. Discussion and Analysis

Based on the experimental data from the SAREval, this chapter conducts an in-depth discussion across three dimensions, namely performance disparity analysis, critical bottlenecks, and future directions. Through cross-dimensional correlation analysis and cross-model comparative performance assessment, it reveals the current technical limitations of SAR-VLMs and outlines future development pathways. This study provides both theoretical foundation and practical guidance for developing reliable and high-performance visual-language models in SAR remote sensing.

5.1. Performance Disparity Analysis

Cross-dimensional correlation analysis reveals a capability fragmentation phenomenon in SAR-VLMs, where significant disparities exist between perceptual and reasoning capacities, while certain models exhibit unexpected pseudo-robustness characteristics. In the perception dimension, model capabilities degrade significantly along the “scene—object—pixel” hierarchy. For Scene Classification tasks, LLaVA-OneVision-Qwen2-7B and InternVL2.5-4B have reached practically useful levels, benefiting from the relative stability of scene-level scattering distribution patterns. However, performance remains generally poor in fine-grained Object Detection and Visual Grounding tasks, highlighting models’ inadequate adaptation to SAR-specific geometric distortions and scattering details. The unique side-looking imaging geometry of SAR systems imposes particularly demanding requirements on models’ spatial perception capabilities.
The reasoning dimension shows the weakest overall performance and exhibits a unique decoupling from model parameter scale. For instance, InternVL3-9B and DeepSeek-VL2-tiny achieve comparable performance in Target Dimension Measurement tasks, indicating that current models generally lack an internalized understanding of SAR physical mechanisms. Reasoning tasks typically require models to establish mappings from image appearances to physical realities, such as estimating building heights from layover features or inferring ship motion directions from wake textures, where deep domain knowledge dependency transcends purely data-driven learning paradigms.
In robustness evaluation, certain models exhibit anomalous performance improvement rather than degradation. This counterintuitive phenomenon, particularly DeepSeek-VL2-tiny’s significant improvement under speckle noise interference, challenges conventional understanding of robustness. Our analysis suggests this does not reflect genuine generalization capability but may stem from overfitting to specific noise patterns in training data. Since SAR speckle inherently contains scattering mechanism information, models might leverage memorized noise patterns for response matching, exhibiting a form of pseudo-robustness to specific noise types. This interpretation finds support in the LLaVA series’ stable performance—their open-vocabulary training paradigm may more effectively drive models to learn noise-invariant features, pointing toward a promising direction for developing genuinely robust SAR VLMs.
Through cross-model comparative analysis, we systematically reveal the capability boundaries and characteristic differences in various VLM architectures in SAR image interpretation, demonstrating a decoupling phenomenon between model scale and performance outcomes. Parameter scaling does not universally guarantee performance improvement. The LLaVA series models demonstrate robust overall performance in Image Description, Object Detection, and Visual Grounding tasks, showing particular strengths in semantic generation and spatial alignment. Their architecture combining CLIP visual encoders with dual-layer projectors provides a solid foundation for cross-modal alignment. However, this series shows weaker performance in inversion tasks involving SAR physical mechanisms, such as Imaging Parameter Estimation and geometric measurement, indicating their visual encoders lack prior knowledge of SAR-specific scattering mechanisms and imaging geometry.
The Intern series models possess advantages in parameter scale and training data volume, with InternVL3-9B and InternVideo2.5-8B demonstrating particularly strong cross-modal reasoning capabilities. InternVL3-9B leads in subjective Image Description ratings, while InternVideo2.5-8B excels in Ship Motion Direction Estimation. Through large-scale multimodal pre-training, these models develop more generalizable visual representations. However, the series shows unremarkable performance in certain foundational perception tasks, revealing imperfect balancing between high-level semantic understanding and low-level visual feature extraction.
Notably, as shown in Figure 8b, lightweight models like Mono-InternVL-2B achieve excellent performance in certain Object Counting tasks, even surpassing larger models. Meanwhile, the largest model InternVL3-9B fails to demonstrate advantages commensurate with its parameter count, suggesting that moderate model scales facilitate more efficient feature alignment in data-scarce specialized domains. This finding provides crucial guidance for model selection under resource constraints.

5.2. Critical Bottleneck

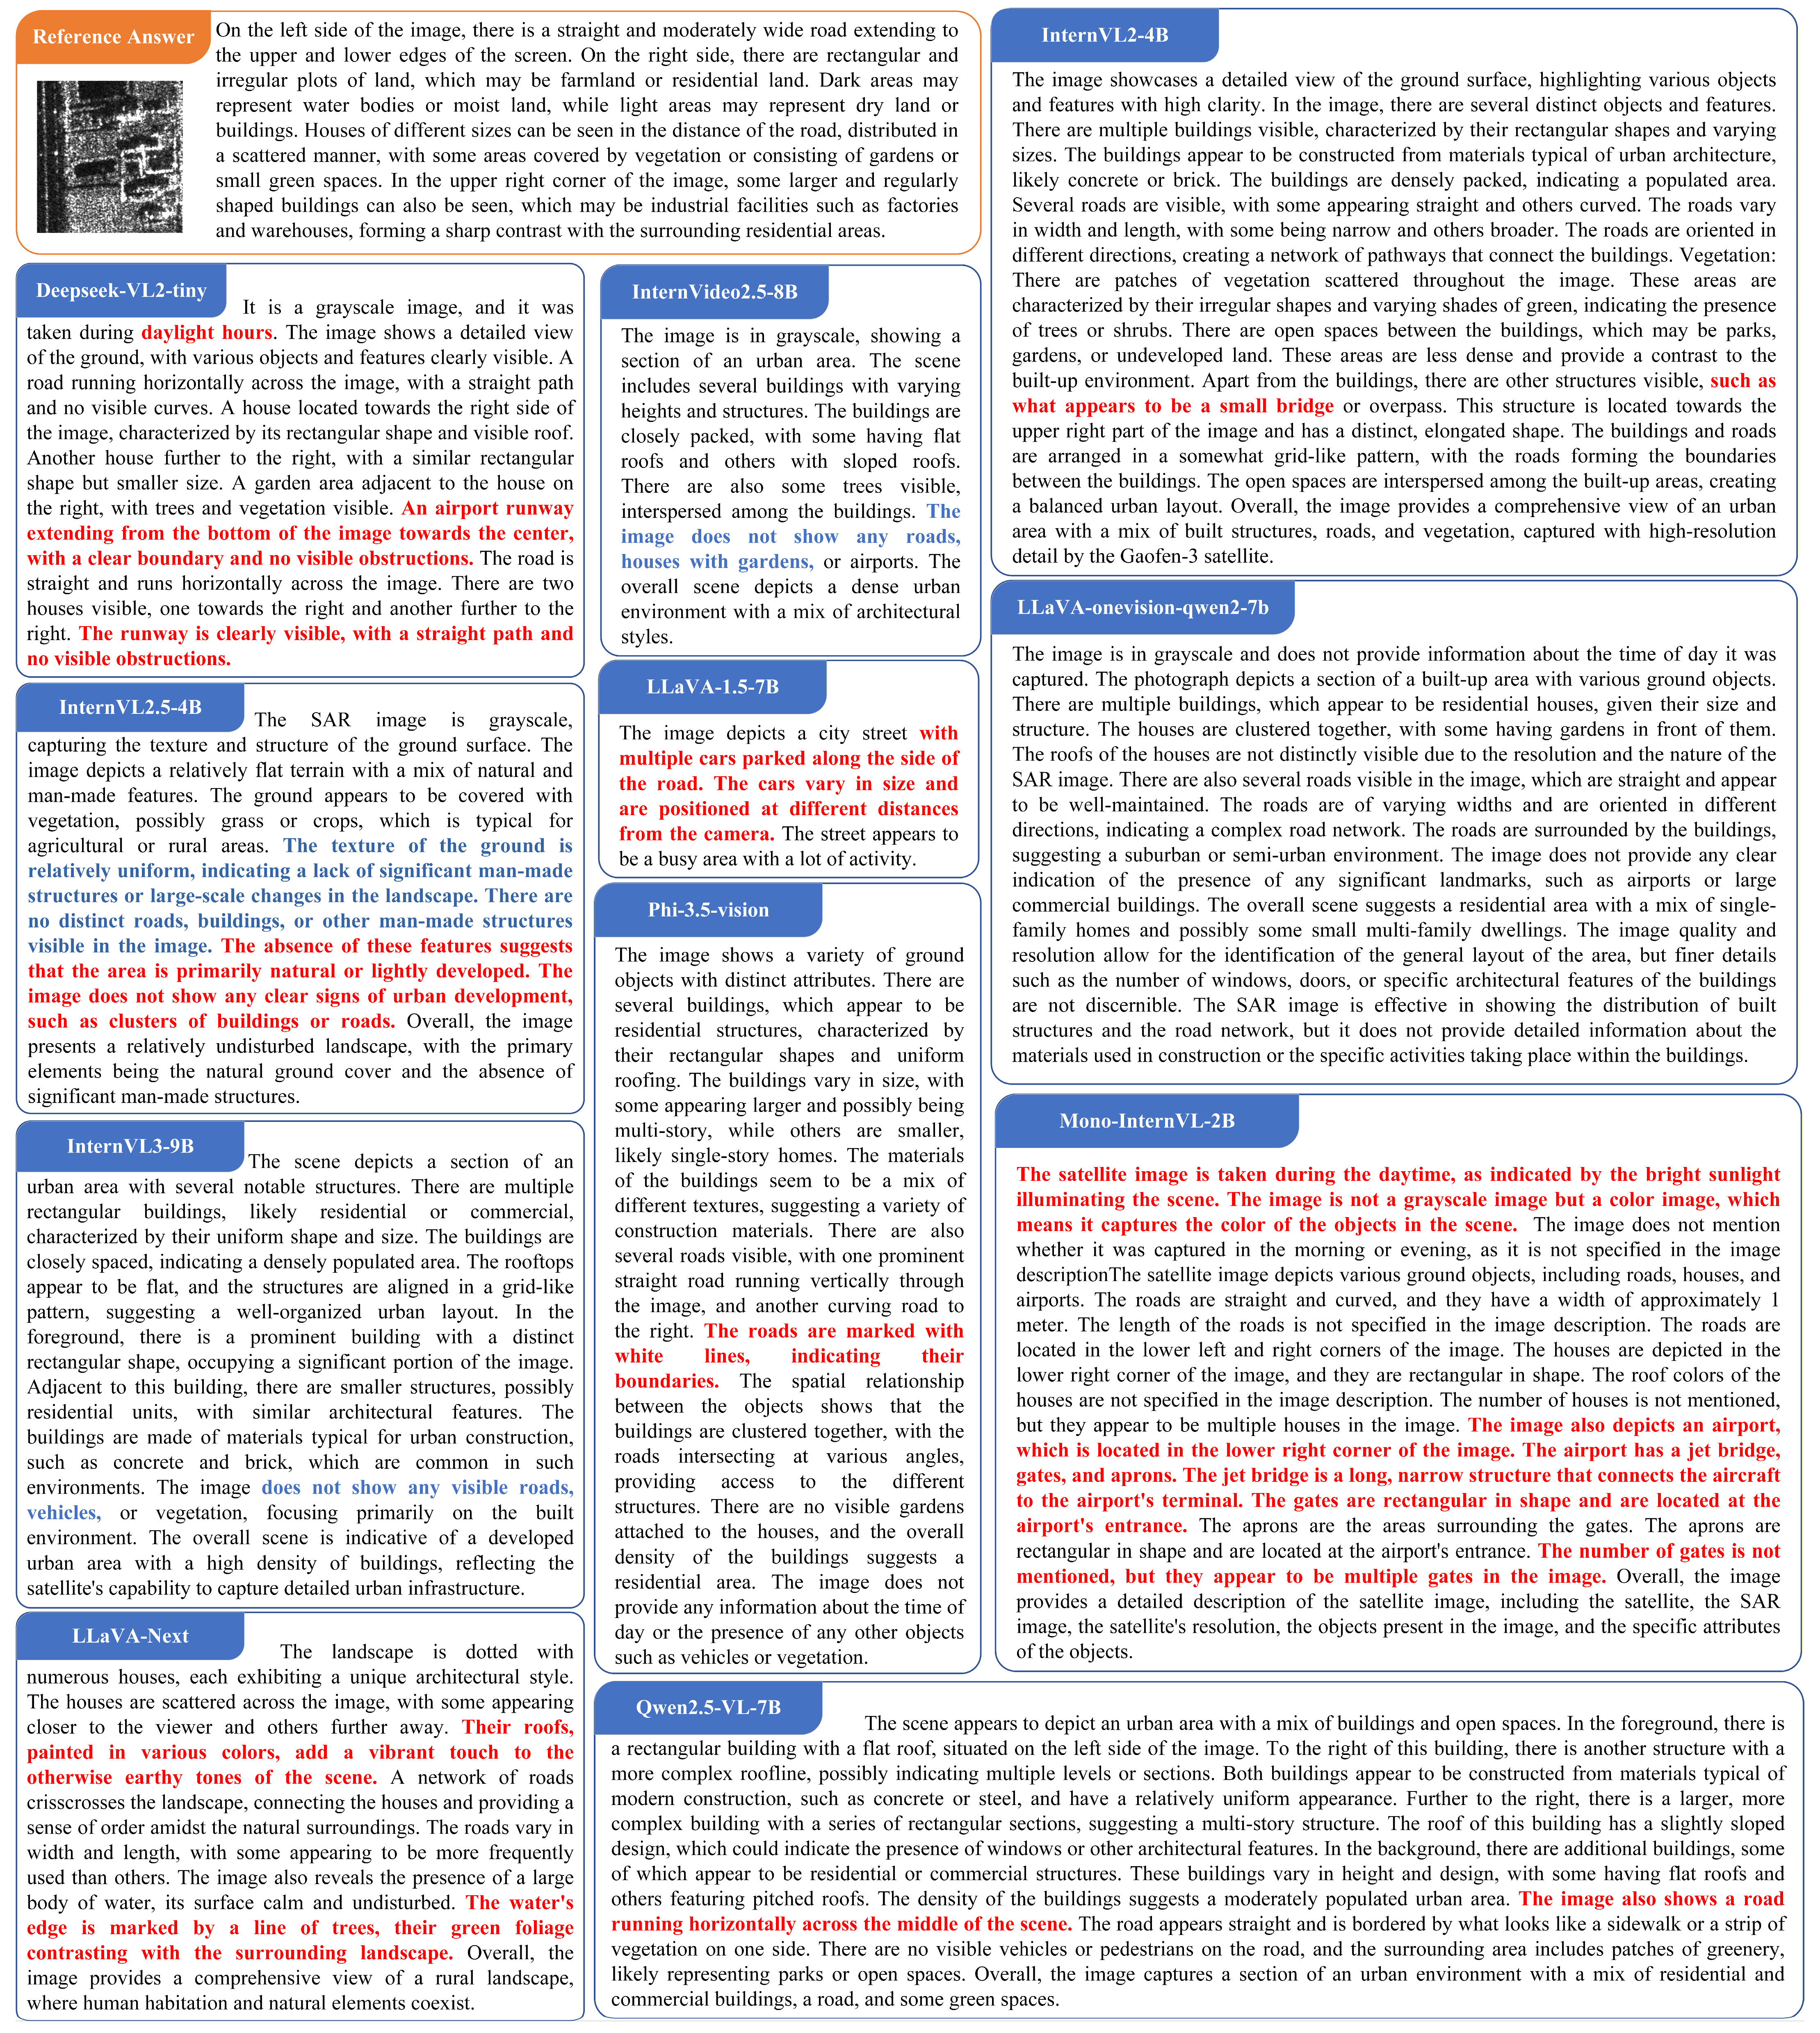
Data Perspective: Optical Prior Bias and Annotation Scarcity. With optical imagery constituting over 95% of general VLM training data, models exhibit significant optical-prior bias, typically manifesting as semantic mapping errors. As illustrated by the qualitative failure cases in Appendix A.6, models consistently apply erroneous optical analogies: strong, localized radar scatterers are misclassified as “white lines”, the inherent grayscale nature of SAR leads to incorrect inferences about scene illumination (e.g., “daytime”), and geometric structures exhibiting strong double-bounce reflections are mistaken for familiar optical objects like “bridges.” These are not mere recognition errors but fundamental misinterpretations stemming from a lack of physical understanding of SAR imaging mechanisms. Furthermore, the scarcity of professional SAR annotations exacerbates this issue. High-quality SAR interpretation requires expertise in microwave physics and imaging geometry, resulting in prohibitively high annotation costs. Consequently, existing annotated SAR data exhibits significantly lower density and precision compared to optical imagery, limiting models’ learning of fine-grained scattering features.
Model Perspective: Architectural Design and SAR Feature Misalignment. Current multimodal fusion architectures remain unoptimized for SAR characteristics. During visual encoding, ViT architectures designed for optical imagery struggle to effectively capture SAR-specific features like strong scatterer distributions and textural periodicity. Cross-modal alignment modules lack semantic understanding of technical terminology, often treating concepts like “incidence angle” and “polarization” as common vocabulary, resulting in deficient physical reasoning capabilities. Additionally, model input resolution limitations conflict with SAR’s high-resolution nature. Most VLMs support maximum input resolutions ≤ 1024 × 1024, while practical applications often use SAR imagery with 0.5–1 m resolution. During feature downsampling, substantial details of strong scatterers and small targets are lost, causing inadequate fine-grained recognition performance.
Evaluation Perspective: The Gap in Domain-Adapted Evaluation for SAR Descriptions. A critical challenge in evaluating open-ended tasks like Image Description is the significant divergence between traditional automated metrics (e.g., BLEU, ROUGE) and LLM-based subjective scores. This stems from a fundamental mismatch between general Natural Language Processing (NLP) evaluation paradigms and the specialized nature of SAR imagery. First, metrics relying on exact lexical matching [50] penalize legitimate technical paraphrasing, such as describing the same scatterer as a “bright signature” or “strong backscatter,” thereby underestimating semantically correct outputs. Second, they are domain-agnostic [51,52], unable to assess whether key SAR attributes are captured, conflating wording variation with factual error. In addition, they lack sensitivity to technical completeness, as a description may score highly by matching generic scene words while missing essential physical mechanisms, or be penalized for including qualifying details that actually enhance accuracy [53]. While LLM-based evaluation advances semantic understanding, it currently lacks standardized, fine-grained frameworks, and results can vary with prompt design and model knowledge. The absence of a domain-adapted evaluation suite that combines automated efficiency with expert-level semantic judgment hinders reliable performance measurement and constrains the deployment of generative VLMs in mission-critical SAR applications where descriptive precision is paramount.

5.3. Future Directions

Addressing the critical bottlenecks facing SAR VLMs, future research should pursue breakthroughs in data construction, model architecture, and evaluation frameworks to advance SAR image understanding from superficial correlation to mechanistic cognition.
Developing Physics-Aware Training Data Frameworks. Current VLMs pre-trained on optical imagery exhibit severe optical prior bias, necessitating SAR-specific multimodal training data. We recommend a dual-track strategy combining expert-guided semi-automatic annotation and physics-driven data augmentation to ensure data quality while scaling for large-model training. Specifically, synthetic data generation integrating electromagnetic simulation and physical rendering can simulate SAR imaging under multi-angle and multi-polarization conditions, establishing complete mappings from scattering mechanisms to image features. Simultaneously, constructing SAR-optical paired datasets through multi-modal data alignment in unified geographic coordinate systems establishes cross-domain semantic bridges, mitigating domain shift-induced cognitive biases. For data augmentation, introducing SAR-specific degradations like speckle noise models and geometric distortion transformations enhances model adaptability to real imaging environments.
Advancing Physics-Informed Model Architectures. Existing architectures suffer from inaccurate feature capture and misaligned cross-modal correspondence, hindering effective utilization of SAR physical priors. These limitations undermine model performance on complex tasks. At the visual encoder level, small convolutional kernels could capture local scattering features, while polarization attention mechanisms dynamically fuse multi-channel information, and geometric distortion invariance modules alleviate side-looking imaging effects. For cross-modal fusion, encoding physical priors like microwave scattering models and imaging geometry constraints as semantic vectors to participate in multimodal alignment would strengthen physical concept-visual feature associations. Simultaneously, exploring chain-of-thought reasoning could help models establish proper inference processes, while reinforcement learning mechanisms with carefully designed reward functions could guide models to uncover deep relationships in SAR imaging, establishing inference pathways from image features to physical parameters for deep comprehension of SAR imaging mechanisms.
Establishing Physics-Guided Evaluation Frameworks. Current evaluation metric development primarily migrates from natural language processing, remaining largely confined to semantic matching with untapped potential for visual-linguistic alignment in specialized domains. For SAR imaging, developing physically consistent evaluation metrics that quantify alignment between model outputs and electromagnetic scattering principles constraints, or establishing domain-knowledge-infused assessment mechanisms that incorporate microwave physics priors for judging output plausibility, could more objectively measure generative models’ application potential in vertical domains.

6. Conclusions

The advancement of VLMs presents new opportunities for intelligent interpretation of SAR imagery. Addressing the current lack of systematic evaluation benchmarks for SAR image interpretation, SAREval innovatively constructs 14,950 high-quality image–question pairs utilizing SAR data from diverse maritime, terrestrial, and urban scenarios through a hybrid annotation strategy combining a label-driven method, LLM-assisted generation, and expert verification. This benchmark systematically integrates 20 fine-grained tasks across three core capabilities and comprehensively evaluates model performance from basic object recognition to advanced semantic reasoning. Through comparative analysis of 11 mainstream vision-language models on the SAREval, this study reveals that current VLMs exhibit inherent optical prior bias due to modality imbalance in pre-training, demonstrating inadequate adaptation to geometric distortions and scattering characteristics in SAR imagery, thereby limiting their effectiveness in fine-grained object recognition and complex reasoning tasks. The development of SAREval establishes a reliable testing platform for the research and performance evaluation of SAR-oriented vision-language models, while its systematic evaluation framework and high-quality annotated data will accelerate the practical deployment of SAR-VLMs in real-world applications, including maritime surveillance, energy infrastructure management, and land resource monitoring.
We acknowledge, however, that the current construction of SAREval is inevitably shaped by the scope of publicly available datasets. This results in a benchmark that predominantly covers StripMap and TOPSAR imaging modes, while offering limited representation of other critical modalities. Furthermore, the existing task suite is currently constrained to maritime and terrestrial object understanding, indicating significant potential for expansion into broader application domains. To transcend these limitations and guide the evolution of SAR-VLM evaluation, we outline corresponding pathways for future work. First, to address the gap in task diversity, future iterations should introduce complex tasks such as multi-temporal SAR change detection and cross-modal (SAR-optical) collaborative understanding, directly responding to the core operational needs of dynamic monitoring and data fusion. Second, to overcome the constraints of data modality and scenario coverage, the benchmark will integrate continuous satellite observation streams and high-resolution polarimetric SAR data to enhance coverage of underrepresented regions (e.g., polar zones) and support more sophisticated land-cover inversion tasks. Third, to ensure the evaluation framework remains robust and practically relevant, the design of anti-interference tasks requires continuous refinement. This involves incorporating a wider array of realistic imaging degradation scenarios, thereby better aligning the benchmark with the challenges of real-world deployment and more effectively steering the technological iteration of SAR-VLMs.

Author Contributions

Conceptualization, Z.W., L.L., G.W., G.S. and X.L.; Methodology, Z.W.; Software, Z.W.; Validation, Z.W.; Formal analysis, Z.W., Y.L. and X.L.; Investigation, Z.W., Y.L., Y.H., S.G. and X.L.; Resources, Z.W. and L.Y.; Data curation, Z.W., S.G. and L.Y.; Writing—original draft, Z.W., Y.L., Y.H., S.G., X.L. and L.Y.; Writing—review & editing, L.L., F.Z. and G.S.; Visualization, Z.W., Y.L., Y.H., S.G., X.L. and L.Y.; Supervision, L.L., G.W., F.Z. and G.S.; Project administration, L.L. and G.W.; Funding acquisition, L.L. and G.W. All authors have read and agreed to the published version of the manuscript.

Funding

This research was funded by the Science and Technology Committee Project, grant number 2024-YYTJ-QD-011-00 (Intelligent Compilation and Rapid Generation of Thematic Maps: KeyTechnology Research and Application). The APC was funded by the same grant.

Data Availability Statement

The data supporting the findings of this study are openly available in publicly accessible repositories, with details provided in the cited publications. Specific datasets and access links are as follows: MSAR-1.0: Accessible at https://radars.ac.cn/web/data/getData?dataType=MSAR (accessed on 1 November 2025) (DOI: 10.3390/rs14061488). SAR-AIRcraft-1.0: Accessible at https://radars.ac.cn/web/data/getData?newsColumnId=f896637b-af23-4209-8bcc-9320fceaba19 (accessed on 1 November 2025) (DOI: 10.12000/JR23043). FUSAR-Ship-1.0: Accessible at https://radars.ac.cn/web/data/getData?dataType=FUSAR (accessed on 1 November 2025) (DOI: 10.1007/s11432-019-2772-5). SAR-Airport: Associated with https://radars.ac.cn/web/data/getData?dataType=SAR-Airport (accessed on 1 November 2025) (DOI: 10.1109/JSTARS.2022.3192063). SIVED: Hosted on GitHub at https://github.com/CAESAR-Radi/SIVED (accessed on 1 November 2025) (DOI: 10.3390/rs15112825). ATRNet-STAR: Hosted on GitHub at https://github.com/waterdisappear/ATRNet-STAR (accessed on 1 November 2025). OpenEarthMap-SAR: Associated with https://zenodo.org/records/14622048, https://arxiv.org/abs/2501.10891 (accessed on 1 November 2025). SOS: Accessible at http://grzy.cug.edu.cn/zhuqiqi/en/yjgk/32384/list/index.htm (accessed on 1 November 2025) (DOI: 10.1109/TGRS.2021.3115492). OpenSARWake: Available on GitHub at https://github.com/libzzluo/OpenSARWake (accessed on 1 November 2025) (DOI: 10.1109/LGRS.2024.3392681). FAIR-CSAR: Available at https://radars.ac.cn/web/data/getData?dataType=FAIR_CSAR (accessed on 1 November 2025) (DOI: 10.1109/TGRS.2024.3519891). QXS-SARPOT: Hosted on GitHub at https://github.com/yaoxu008/QXS-SAROPT (accessed on 1 November 2025) (DOI: 10.48550/arXiv.2103.08259). BHdataset: Hosted on GitHub at https://github.com/lauraset/Super-resolution-building-height-estimation (accessed on 1 November 2025) (DOI: 10.1016/j.rse.2024.114241). SARBuD: Hosted on GitHub at https://github.com/CAESAR-Radi/SARBuD (accessed on 1 November 2025) (DOI: 10.11834/jrs.20220296). Our benchmark is publicly available at https://github.com/Dilys2022/SAREval (accessed on 21 November 2025).

Conflicts of Interest

The authors declare no conflicts of interest.

Abbreviations

The following abbreviations are used in this manuscript:
VLMsVision Language Models
SARSynthetic Aperture Radar
RECReferring Expression Comprehension
CLIPContrastive Language–Image Pre-training
ALBEFAlign Before Fuse
RNNsRecurrent Neural Networks
FCNsFully Convolutional Networks
LLaVALarge Language and Vision Assistant
MLLMsMultimodal Large Language Models
CNNsConvolutional Neural Networks
LSTMLong Short-term Memory
LLMLarge Language Model
IDImage Description
SCScene Classification
MCODMulti-Class Object Detection
ACDAircraft Classification Detection
SCDShip Classification Detection
VCDVehicle Classification Detection
ObjCObject Counting
VGVisual Grounding
LUTSLand Use Type Segmentation
MOSDMarine Oil Spill Detection
IBCInterference Caused by Background Clutter
ICMInterference Caused by Coherent Mechanisms
IRIImaging Resolution Inference
IAIIncidence Angle Inference
POIPolarization Orientation Inference
TAITarget Azimuth Inference
OST-VEOil Storage Tank Volume Estimation
SMDEShip Motion Direction Estimation
BHEBuilding Height Estimation
TDMTarget Dimension Measurement
Img-UImage-Level Understanding
Obj-RObject-Level Recognition
Pix-SPixel-Level Segmentation
RIRobustness Against Interference
IPEImaging Parameter Estimation
LCAILand Cover Attribute Inference
TGMTerrain Geometry Measurement
ROUGE-LRecall-Oriented Understudy for Gisting Evaluation—Longest common subsequence
BLEUBilingual Evaluation Understudy
NLPNatural Language Processing
OBBsOriented Bounding Boxes
ViTVision Transformer

Appendix A

Appendix A.1. Dataset Sources

The SAREval dataset is constructed upon multiple publicly available SAR datasets, with specific sources and characteristics detailed in Table A1. This comprehensive compilation ensures broad coverage of various SAR imaging scenarios and task requirements.
Table A1. Overview of data sources for the SAREval.
DatasetImaging PlatformResolutionBandPolarizationTask Scenarios
MSAR-1.0 [39]Haisi-1, Gaofen-31 mCHH, VV, HV, VHMulti-class Object Detection, Object Counting, Visual Grounding, Scene Classification, Polarization Orientation Inference
SAR-AIRcraft-1.0 [40]Gaofen-31 mCVV, HHMulti-class Object Detection, Aircraft Classification Detection
FUSAR-Ship 1.0 [54]Gaofen-31 mCVV, HHShip Classification Detection
SAR-Airport [55]Sentinel-1B5 mCVHScene Classification
SIVED [56]Airborne SAR0.1–0.3 mX, Ku, KaVV, HHMulti-class Object Detection, Object Counting
ATRNet-STAR [45]Airborne SAR0.1–0.3 mX, KuVV, HH, HV, VHVehicle Classification Detection, Target Azimuth Inference, Imaging Resolution Inference
OpenEarthMap-SAR [41]-0.15–0.5 m-VV, HHScene Classification, Land Use Type Segmentation
SOS [57]ALOS-PALSAR, Sentinel-1A5 m, 10 mL, C-Marine Oil Spill Detection
OpenSARWake [44]ALOS-PALSAR, Sentinel-1A, TerraSAR-X1.25–12.5 mL, C, XVV, HHShip Motion Direction Estimation
FAIR-CSAR [42]Gaofen-3SL: 1 m, FSI: 5 mCVV, HHMulti-class Object Detection, Aircraft Classification Detection, Object Counting, Oil Storage Tank Volume Estimation, Incidence Angle Inference, Target Dimension Measurement
QXS-SARPOT [58]Gaofen-31 mCVV, HHImage Description, Imaging Resolution Inference
BHdataset [43]Sentinel-1A2.5 mCVV, VHBuilding Height Estimation
SARBuD [59]Gaofen-310 mCVV, HHImaging Resolution Inference

Appendix A.1.1. Perception Dimension

For Image-level Understanding tasks, a multi-dataset collaborative strategy was employed. Harbor and oil refinery scene labels were sourced from MSAR-1.0 [39], airport scenes from the globally diverse SAR-Airport dataset [55], and urban/forest scenes from OpenEarthMap-SAR [41]. Object-level Recognition tasks prioritized categorical diversity through dataset integration. Aircraft annotations merged SAR-AIRcraft-1.0 [40] and FAIR-CSAR [42], forming a 13-subcategory system. Ship labels from FUSAR-Ship 1 [54] cover 14 major and 81 fine-grained categories. Vehicle labels from ATRNet-STAR [45] include 22 major and 50 sub-categories. Object Counting utilized dense-target scenarios for enhanced challenge. Aircraft, ship, oil tank, and bridge samples came from MSAR-1.0 [21], supplemented by vehicle and pylon targets from SIVED [56] and FAIR-CSAR [42] to ensure target variety. Pixel-level Segmentation employed high-resolution (0.15–0.5 m) OpenEarthMap-SAR [41] for Land Use Type Segmentation, featuring eight mask-annotated categories, namely agricultural land, bare land, buildings, developed land, grassland, roads, forest, and water bodies. Marine Oil Spill Detection used a similarly mask-annotated SOS dataset [57], maintaining annotation consistency.

Appendix A.1.2. Reasoning Dimension

Terrain Geometry Measurement tasks derived specialized datasets from SAR elevation data and pixel coordinates. Target Dimension Measurement calculated physical dimensions from pixel coordinates and resolution, while Building Height Estimation inferred heights from regional elevation data and image phase information. Object Attribute Inference selected key targets from marine and terrestrial domains with Ship Motion Direction Estimation from OpenSARWake [44], and Oil Storage Tank Volume Estimation from the 1 m resolution sub-dataset of FAIR-CSAR [42]. Imaging Parameter Estimation prioritized annotation completeness: Polarization Orientation Inference used MSAR-1.0 [21] with full quad-polarization; Incidence Angle Inference leveraged the richly annotated FAIR-CSAR complex image dataset; Target Azimuth Inference employed EOC_azimuth data for a specific vehicle from ATRNet-STAR [45]; Imaging Resolution Inference integrated datasets from 0.15 m (OpenEarthMap-SAR [41]) to 10 m (SARBuD [59]) for full spectral coverage.

Appendix A.1.3. Robustness Dimension

For speckle noise assessment, multiplicative noise following a Gamma distribution was added to images from Multi-class Object Detection tasks, simulating inherent SAR speckle. For clutter interference, realistic sea clutter patches were extracted from actual SAR imagery and superimposed onto Ship Classification Detection samples, creating environmentally representative test conditions.

Appendix A.2. Data Structure Analysis

Appendix A.2.1. Overall Dataset Architecture

The SAREval is designed with the primary objective of comprehensively evaluating SAR Vision-Language Models. It systematically establishes an evaluation framework encompassing three core capabilities: Perception, Reasoning, and Robustness. Through a three-level hierarchical design, the dataset achieves comprehensive task coverage. The composition and sample sizes for tasks across each dimension are detailed in Table A2. The dataset comprises 20 fine-grained tasks with a total of 14,950 samples, forming a multi-level evaluation system characterized by foundational perception tasks as the base, deep reasoning tasks as the core, and robustness testing tasks as supplements. This architecture supports both quantitative assessment of fundamental SAR-VLM capabilities, such as basic semantic understanding and object recognition, and evaluation of advanced competencies, including complex reasoning and interference resistance. The distribution of question counts across individual tasks is visualized in Appendix A Figure A1.
Table A2. Task Composition of SAREval Capability Dimensions.
L1 LevelL2 LevelL3 LevelNumber of Tasks
PerceptionImage-level UnderstandingScene Classification632
Image Description395
Object-level RecognitionMulti-class Object Detection856
Ship Classification Detection284
Aircraft Classification Detection222
Vehicle Classification Detection530
Object Counting760
Visual Grounding3605
Pixel-level SegmentationLand Use Type Segmentation3788
Marine Oil Spill Detection237
ReasoningTerrain Geometry MeasurementTarget Dimension Measurement408
Building Height Estimation697
Object Attribute InferenceShip Motion Direction Estimation404
Oil Storage Tank Volume Estimation386
Imaging Parameter EstimationTarget Azimuth Inference200
Polarization Orientation Inference 204
Incidence Angle Inference117
Imaging Resolution Inference227
RobustnessRobustness against InterferenceSpeckle Noise Interference856
Clutter Interference142
To accommodate diverse evaluation needs across different tasks, the dataset incorporates three question formats: MCQs, objective output, and subjective free form. MCQs constitute the primary format, with 6925 instances (46.32% of the total), facilitating standardized automated scoring and equitable large-scale assessment of model discrimination and reasoning capabilities on tasks with definitive answers. Objective label output tasks, comprising Visual Grounding and Pixel-level Segmentation, account for 7630 samples (51.04%), primarily evaluating spatial perception and precise quantification. The remaining 395 samples are subjective questions, which, despite their smaller proportion, are crucial for assessing language generation and deep semantic understanding in open-ended tasks like Image Description.
Figure A1. Distribution of sample counts across tasks in the SAREval. 3625 Visual Grounding tasks in total, not displayed in this figure.
Remotesensing 18 00082 g0a1

Appendix A.2.2. Quantitative Analysis of Dataset Composition

The Perception Dimension serves as the foundational component, encompassing three L2 sub-dimensions across ten L3 tasks, totaling 11,309 samples. Appendix A Figure A2 illustrates the composition of Perception Dimension tasks. The distribution reveals that Land Use Type Segmentation and Visual Grounding tasks dominate the perception assessment, highlighting the benchmark’s emphasis on spatial reasoning and language-guided localization capabilities.
Multi-class Object Detection and Object Counting tasks represent significant portions. Within category distributions, targets such as vessels, oil tanks, and bridges appear most frequently, consistent with their importance in typical SAR applications like maritime monitoring, energy infrastructure inspection, and defense. Scene Classification covers five representative scenarios—harbors, airports, oil refineries, urban areas, and forests—with balanced distribution to enable comprehensive evaluation of semantic discrimination across environments and prevent generalization bias from scenario imbalance. Land Use Type Segmentation further delineates eight surface cover categories, with roads, developed land, water bodies, and buildings comprising the largest shares, reflecting the dataset’s focus on human activity-intensive regions and aligning with SAR’s practical applications in land monitoring and urban analysis.
Figure A2. Category distribution across Perception Dimension tasks. (a) Task Number Distribution Across L2 Sub-dimensions and (b) Target Number Distribution of Four Major L2 Sub-dimensions.
Remotesensing 18 00082 g0a2
Word cloud analysis of Visual Grounding tasks (Appendix A Figure A3a) shows high-frequency terms concentrated on specific target entities (“tank,” “vessel”) and spatial descriptors (“bottom,” “right”). For Image Description tasks (Appendix A Figure A3b), keywords include scene elements (“buildings,” “vegetation”), microwave imaging characteristics (“texture,” “scattering”), and spatial layout terms, reflecting requirements for comprehensive description of global scenes, imaging mechanisms, and multi-dimensional visual features.
Figure A3. Word frequency distributions for (a) Visual Grounding and (b) Image Description tasks.
Remotesensing 18 00082 g0a3
The Reasoning Dimension focuses on deep cognitive capabilities, comprising three L2 sub-dimensions across eight L3 tasks with 2643 total samples. While smaller than the Perception Dimension, these tasks require specialized reasoning based on SAR imaging mechanisms and are derived from professional annotations or expert manual labeling, ensuring high quality. Core task answer design follows balance principles to ensure evaluation fairness. The Polarization Orientation Inference task contains 50 samples each for HH, VV, HV, and VH polarizations, demonstrating no bias. Imaging Resolution Inference covers four ranges (<0.5 m, 1 m, 3–5 m, >10 m) with 66, 60, 51, and 50 samples, respectively, providing reasonable gradient distribution to comprehensively validate model performance across resolution variations.
The robust dimension task design comprises a total sample size of 998 instances, accounting for 6.68% of the entire dataset. Speckle noise and clutter interference tasks are derived from Multi-class Object Detection and Ship Classification Detection tasks in the Perception Dimension, maintaining identical sample sizes to enable direct quantification of interference impact and ensure scientific validity and comparability of robustness evaluation results.

Appendix A.3. VLMs Selection

This study selected 11 representative VLMs for comprehensive evaluation, as detailed in Table A3.
Table A3. Comparison of Visual Language Large Models.
Model TypeModel NameVisual EncoderLanguage ModelRelease DateParametersTraining Scale
Intern SeriesInternVL2–4BInternViT-6BInternLM2-7BJune 20244B1.25 B image–text pairs + 1.25 M instructions
Mono-InternVL-2BInternViT-6BInternLM2-7BOctober 20242B980 M image–text pairs + 1.15 M instructions
InternVideo2.5-4BInternViT-300MInternLM2.5-4BJanuary 20254B28 M videos + 1.25 B images + 950 K instructions
InternVL2.5-8BInternViT-300MInternLM2.5-8BJanuary 20258B28 M videos + 1.25 B images + 960 K instructions
InternVL3-9BInternViT-6BInternLM3-8BApril 20259B1.5 B multimodal pairs + 1.4 M instructions
LLaVA SeriesLLaVA-1.5-7BCLIP-ViT-L/14Vicuna-7BOctober 20237B558 K image–text pairs + 665 K instructions
LLaVA-NextCLIP-ViT-L/14Vicuna-13BJanuary 202413B558 K image–text pairs + 1.32 M instructions
LLaVA--onevision-qwen2-7bCLIP-ViT-L/14Vicuna-7BOctober 20247B250 M multimodal pairs + 9.39 M instructions
OthersQwen2.5-VL-7BViTQwen2.5-7BFebruary 20247B1.35 B multimodal pairs + 3.2 M instructions
Phi-3.5-visionCLIP-ViT-L/14Phi-3 MiniAugust 20244.2B420 M image–text pairs + 1.8 M instructions
DeepSeek-VL2-tinySigLIP-LDeepSeek-MoE 3BMarch 20251B850 M image–text pairs + 2.2 M instructions
1. Intern Series Models:
(1) InternVL2-4B serves as an early lightweight multimodal benchmark in the InternVL series, employing a modular architecture that connects visual and language components. Trained on 1.25 million image–text pairs, its core innovations include AnyRes high-resolution processing and enhanced multimodal understanding, achieving competitive performance across 11 mainstream benchmarks. This model provides a crucial reference for evaluating SAR image feature extraction and semantic description capabilities at a moderate parameter scale.
(2) Mono-InternVL-2B represents a significant architectural innovation, adopting a monolithic design that embeds visual experts directly within the language model. Trained on 8 A100 GPUs, this 2B-parameter model achieves 30% faster inference than conventional architectures with substantially reduced resource consumption. Its inclusion tests whether lightweight monolithic architectures can maintain effective SAR image perception in resource-constrained environments, providing an experimental basis for edge deployment.
(3) InternVL2.5-4B enhances its predecessor through improved multimodal alignment and complex reasoning while maintaining 4B parameters. Optimized on 8 A100 GPUs with 1.3 million training samples, it demonstrates approximately 15% performance improvement. This model examines whether architectural and training optimizations can enhance SAR task performance—including land cover classification and contextual reasoning—without parameter increases.
(4) InternVideo2.5-8B specializes in video understanding through innovations in long-sequence processing and spatiotemporal modeling. Despite its video focus, its strong temporal and complex scene analysis capabilities offer novel technical pathways for SAR dynamic target tracking tasks.
(5) InternVL3-9B represents the series’ cutting-edge integration, optimized on 32 A100 GPUs with advanced pre-training techniques. Its strengths in cross-modal reasoning and hallucination control establish it as a technological frontier representative, enabling systematic evaluation of upper-bound performance in high-precision SAR image interpretation.
2. LLaVA Series Models:
(1) LLaVA-1.5-7B stands as a widely adopted open-source benchmark, achieving state-of-the-art performance with minimal computational requirements. Its innovations in high-resolution processing and hallucination reduction provide a reliable baseline for evaluating foundational SAR image perception. However, its natural image-optimized visual encoder may lack sufficient domain prior for SAR’s unique characteristics.
(2) LLaVA-Next incorporates key optimizations, including higher-resolution visual tokens and enhanced encoding, trained on 1.31 million instruction samples. Its strong performance in reasoning tasks validates whether specialized optimizations can improve fine-grained SAR target detection and analysis.
(3) LLaVA-OneVision-Qwen2-7B combines LLaVA’s visual processing with Qwen’s language capabilities, employing extensive mixed-source pre-training for improved cross-modal generalization. This model tests whether general visual pre-training strategies enhance adaptability to SAR’s domain shifts.
3. Other Representative Models
(1) Qwen2.5-VL-7B demonstrates excellent performance in general visual understanding and cross-modal interaction. The 7B parameter scale ensures deployment feasibility while providing crucial benchmarking for SAR visual feature processing capabilities.
(2) Phi-3.5-vision incorporates lightweight architecture optimizations, including enhanced visual encoding and multi-frame processing capabilities. This 4.2B-parameter model represents lightweight architecture performance in SAR pattern recognition tasks.
(3) DeepSeek-VL2-tiny employs a lightweight design emphasizing real-world visual-language alignment. Its evaluation provides critical insights into efficient VLM deployment potential for SAR applications, given the significant domain differences from natural imagery.

Appendix A.4. Expert Annotation and Quality Control

Appendix A.4.1. Expert Annotation Protocol

To ensure annotation quality for highly specialized reasoning tasks, this study established an expert annotation team comprising three professional annotators with extensive SAR image interpretation experience. The team was deeply involved in annotating and validating tasks, including Ship Motion Direction Estimation and Oil Storage Tank Volume Estimation. Their responsibilities encompassed independent SAR target annotation, cross-validation of annotations, resolution of discrepancies, and final verification using multi-source auxiliary data, ensuring all annotations maintained high accuracy and professional standards.
Professional Qualifications and Expertise: All three annotators hold master’s degrees or higher in photogrammetry, remote sensing, or related disciplines. With over five years of specialized training and research experience in remote sensing, they possess solid theoretical foundations in SAR imaging principles and extensive practical expertise in SAR image interpretation, enabling accurate identification and analysis of complex target characteristics in SAR imagery.
Training and Assessment Protocol: Before commencing formal annotation, all annotators completed a comprehensive one-week training program covering SAR imaging fundamentals, target characteristic analysis, task-specific criteria and standards, annotation tools, and quality control protocols. Following training, annotators underwent rigorous testing using sample datasets to ensure a consistent understanding of task requirements before participating in formal annotation.
Ethical Considerations: All annotators were explicitly informed of the dataset’s intended research applications and required to ensure annotations avoided social biases, ethical concerns, or privacy violations throughout the process, thereby maintaining dataset compliance and fairness.
Quality Assessment Results: To quantify annotation quality, we employed Cohen’s κ coefficient to evaluate inter-annotator agreement. Detailed statistical results are presented in Table A4.
Table A4. Statistical results of personnel consistency.
Task TypeInitial Annotated Sample CountDirectly Matched Sample SizeDirect Concordance RateCohens κValid Data After Review
Ship Motion Direction Estimation45035278.2%0.76404
Oil Storage Tank Volume Estimation42029871.0%0.68386
The statistical results show Cohen’s κ coefficients of 0.76 and 0.68 for the two tasks, respectively, both falling within the substantial agreement range (0.61–0.80), confirming the annotators’ professional comprehension of SAR image characteristics and consistency in evaluation standards.
Notably, in Ship Motion Direction Estimation, combined translational and rotational vessel motions exacerbated SAR image challenges, including target defocusing and contour blurring. One annotator misinterpreted blur-induced directional artifacts as actual motion directions. The third reviewer corrected these errors by analyzing the azimuth-range geometric relationships at SAR imaging moments using Automatic Identification System (AIS) track data, enabling accurate final determinations. This case demonstrates how third-party review effectively corrects potential errors from initial annotators, enhancing final determination accuracy and reliability.

Appendix A.4.2. Quality Control for LLM-Assisted Generation

For LLM-assisted generation of Visual Grounding prompts and Image Description tasks, we established rigorous expert correction mechanisms to ensure output accuracy and credibility. The same professional annotation team implemented the following quality control procedures:
Multi-dimensional Quality Verification: We implemented systematic manual verification where experts evaluated GPT-4o generated descriptions for both SAR and optical imagery across four dimensions: (1) Cross-comparison between SAR and optical descriptions to ensure accurate content representation; (2) Hallucination detection to verify all described elements actually exist in the imagery; (3) Attribute accuracy checking for critical information including target categories, counts, positions, and dimensions; (4) Ensuring Visual Grounding descriptions uniquely identify targets without ambiguous expressions.
Iterative Refinement Mechanism: To eliminate uncertain expressions (e.g., “unspecified,” “uncertain”) from generated content, we adopted an iterative generation strategy. If outputs contained exclusion phrases, the model was recursively called for regeneration with up to 5 attempts. Samples identified with issues during expert verification were returned to the generation phase for discussion and refinement until meeting quality standards. Each iterative refinement for initially substandard samples required approximately 10–15 min additional effort, including problem analysis, prompt optimization, regeneration, and re-verification. Statistics show approximately 6% of samples required more than one refinement iteration, accumulating over 150 h of additional refinement effort.
Human Resource Investment: Each description verification required approximately 120 s on average, encompassing image observation, description verification, consistency comparison, and issue documentation. Given the SAR interpretation complexity, verification for samples containing multiple targets or complex scenes extended to 180–240 s. The entire verification process consumed over 800 professional person-hours, with Visual Grounding task verification accounting for approximately 450 h and Image Description verification comprising around 350 h.
Question Generation Quality Control: For question generation tasks, after DeepSeek produced 10–20 question variants with different phrasings, two professionals independently evaluated and retained only mutually agreed-upon high-quality questions. Selection criteria required generated questions to be: (1) Unambiguous and clearly expressed; (2) Compliant with remote sensing domain terminology standards; (3) Adaptable to different difficulty levels. Ultimately, five optimal questions per task were selected as standard prompts.
This quality control framework effectively leverages large models’ generative capabilities to significantly reduce manual annotation costs while ensuring data quality through attribute extraction and multi-round expert verification, successfully balancing efficiency and accuracy requirements. Compared to purely manual annotation, this approach improved annotation efficiency by approximately 60% while maintaining quality standards. Through rigorous manual verification, we ultimately generated 3605 Visual Grounding pairs and 395 Image Description pairs, all passing expert quality review and providing rich, reliable descriptive content for the dataset.

Appendix A.5. Large Model Generation Details

Table A5. Prompts employed for LLM-assisted Image Description evaluation.
Prompt:
You are a senior expert in SAR remote sensing and image description evaluation. Please act as an automatic scorer to comprehensively evaluate the quality of the predicted SAR image description based on three core dimensions: accuracy, professionalism, and completeness. Provide a quantitative score between 0 and 100 (integer), where a higher score indicates better description quality.
[Evaluation Dimensions & Weighting]
1. Accuracy (Weight: 0.4):
  - Whether the predicted description is completely consistent with the reference content (e.g., target category, attributes, spatial relationships, SAR image characteristics such as polarization and scattering properties);
  - No hallucinated information (e.g., non-existent targets, incorrect attributes) or missing key factual content.
2. Professionalism (Weight: 0.3):
  - Whether the description uses standardized SAR remote sensing terminology (e.g., “backscattering coefficient”, “polarization mode (HH/HV/VV/VH)”, “speckle noise”, “ship target”) instead of colloquial or ambiguous expressions;
  - Whether the technical expression conforms to academic norms in the SAR remote sensing field.
3. Completeness (Weight: 0.3):
  - Whether the description covers both global scene information (e.g., image coverage, main ground object types, overall environment) and local detail information (e.g., target quantity, position, size, morphological features, SAR-specific characteristics);
  - Whether all key elements in the reference description are fully reflected without omitting critical content.
[Reference Materials]
Reference Description (Ground Truth): {ref_caption}
Predicted Description (to be evaluated): {pred_caption}
[Scoring Requirements]
1. Calculate the sub-score for each dimension first (0–100 points), then compute the final score using the weighted sum formula: Final Score = (Accuracy Score × 0.4) + (Professionalism Score × 0.3) + (Completeness Score × 0.3);
2. The final score must be an integer between 0 and 100 (no decimals);
3. Only return the final quantitative score, without any additional explanations, comments, or formatting (e.g., no “Score:” prefix).
Table A6. Prompts used for LLM-assisted Image Description generation.
Prompt:
You are an expert in SAR remote sensing and cross-modal image interpretation. Based on the reference attribute information of visible light-SAR paired data, you need to generate a structured description for the given SAR image that is accurate, comprehensive, and professional. The SAR image is sourced from OpenEarthMap-SAR, with the satellite platform: Gaofen-3, imaging parameters: C-band spotlight imaging mode, and spatial resolution of 1 m; the paired visible light image provides cross-modal reference support. Please strictly follow the following generation principles and requirements:
1. Specifications for Image Attributes:
  - Must clearly describe core metadata: image source, satellite platform, sensor type (SAR image), imaging parameters (C-band, spotlight imaging mode), and spatial resolution (1 m);
  - Do not mention undefined information such as image color mode (e.g., grayscale image/color image) or acquisition time (e.g., morning/evening), and avoid subjective speculative statements.
2. Core Requirements for Ground Object Description:
  - Fully cover the target categories specified in the reference attributes, and detailedly label key ground object attributes: quantity, material, morphological characteristics, actual size, and spatial location (including pixel-level/geographic coordinate references and relative positional relationships between ground objects);
  - Utilize the cross-modal complementary information from visible light images to calibrate ambiguous or easily confused ground object features in SAR images (e.g., verifying target boundaries and supplementing structural details that are difficult to identify via SAR with visible light) to improve description accuracy;
  - Determine target uniqueness based on reference attributes: if the target is unique, clearly label its distinctive identification features; if there are multiple targets of the same type, distinguish them by differences in location, size, and morphology.
3. Logic for Description Structure:
  - Strictly follow the progressive structure of “global scene overview → local detail focus”: first outline the overall coverage of the image, composition of core ground objects, and scene type (e.g., offshore area, suburban area); then conduct refined descriptions of individual target ground objects to ensure clear hierarchy and coherent logic.
4. Refined Standards for Typical Ground Objects:
  - Roads: Clarify shape (straight/curved/polyline), width magnitude, extended length characteristics, and direction; label road surface roughness-related features based on SAR scattering properties;
  - Buildings: Describe distribution density, single-building size, and roof structural features (color cannot be identified by SAR images, so no need to describe); if auxiliary facilities (e.g., courtyards, parking lots) are mentioned in the reference attributes, they can be supplemented;
  - Airports: Cover core facilities such as terminals, aprons, jet bridges, and boarding gates, and refine facility layout, relative positions, and scale characteristics;
  - Typical remote sensing targets such as ships/bridges: Supplement descriptions of strong/weak scattering features based on polarization mode and scattering properties, and calibrate target boundaries and size parameters.
5. Accuracy and Output Specifications:
  - Strictly generate descriptions based on reference attribute information and visible features of bimodal images; verify the authenticity of each piece of content one by one to eliminate hallucinations, attribute errors, and unfounded speculations;
  - Adopt coherent paragraph-style expression and avoid using lists; focus on objective feature descriptions of ground objects, reduce irrelevant expressions such as aesthetic evaluations and subjective feelings, and use concise and professional language;
  - The output must be compatible with JSON structured organization requirements to ensure that the description content can be directly extracted into fields without format confusion or redundant information.
The prompts used for LLM-assisted question generation are illustrated in Table A7, taking the Oil Tank Counting task as a representative example.
Table A7. Prompts used for LLM-assisted question generation.
Prompt:
You are a professional expert in SAR remote sensing and target counting. Based on the following task definition and generation requirements, generate problem variants that comply with academic standards and are suitable for the oil tank target counting scenario in single-modal SAR images.
[Core Task Definition]
  - Task Type: Oil tank target counting in single-modal SAR images
  - Core Objective: Guide the model under test to accurately identify and count the total number of oil tank targets in SAR images, adapting to the characteristics of SAR images and the remote sensing recognition features of oil tank facilities
  - Input Data: Single-modal SAR images (SAR sensor characteristics such as polarization mode and spatial resolution do not need to be explicitly reflected in the questions, but the question expression must adapt to the target presentation logic of SAR images)
  - Output Requirement: A clear integer representing the number of oil tank targets, without additional attribute descriptions (e.g., size, location, material, etc.)
[Detailed Generation Requirements]
1. Domain Adaptability:
  -Use professional and diverse terminology related to oil tanks, alternating between “oil tanks” (core term), “oil storage tanks” (more precise expression), and “oil storage facilities” (general term for oil tank-type storage facilities) to conform to remote sensing field expression habits;
  -Use standardized expressions for images, such as “SAR image” (core expression), “satellite image” (associating with satellite remote sensing scenarios), and “the scene” (scenario-based expression), avoiding colloquial expressions unrelated to the remote sensing field;
  -Focus on the core task of “counting” and do not introduce judgments on other attributes of oil tank targets (e.g., type, status), ensuring the task is single and clear.
2. Problem Diversity:
  -Quantity: Generate 10–15 problem variants covering 3 types: Direct Question Type (explicitly requiring “count” or asking about “number”), Scenario-based Question Type (combining image/scene expressions), and Generalized Facility Type (using generalized terms such as “oil storage facilities”);
  -Sentence Structure Variation: Flexibly adjust sentence structures, adopting different interrogative forms such as “How many…?”, “What is the total count of…?”, and “Please count the number of…?” to avoid repetition and redundancy;
  -Vocabulary Variation: Alternate core verbs (count), core nouns (oil tanks), and image expressions (SAR image/satellite image) to enhance the richness of problem variants.
3. Logical Rigor:
  -Each question must clearly present the logical chain of “Input (SAR image) → Task (counting) → Output (quantity)” without ambiguity;
  -Avoid vague expressions, and use words such as “visible”, “shown”, “present”, and “identify” to limit the counting scope to “oil tank targets identifiable in the image”;
  -Appropriately add words like “exact” to emphasize the requirement for counting accuracy without increasing task complexity.

Appendix A.6. Qualitative Failure Cases in SAR Image Description

Figure A4. Example response of different models on the Image Description task. Red annotations denote misinterpretations, while blue annotations denote undetected interpretation results.
Remotesensing 18 00082 g0a4

Appendix B. SAREval Dataset Documentation

This appendix provides comprehensive technical documentation for the SAREval benchmark, covering its structure, annotation formats, and usage examples. The aim is to lower the barrier to entry and promote the standardized application of the dataset within the research community.

Appendix B.1. Dataset Structure

Upon downloading and unzipping, the SAREval dataset follows the task-centric hierarchical structure. Each task has dedicated folders for images and corresponding annotation files. The detailed organization is presented in Table A8.
Table A8. Directory organization of the SAREval Dataset.
Text
Remotesensing 18 00082 i001
  • Image Storage: Each subfolder under ‘images/’ contains the image files associated with its specific task (e.g., ‘aircraft_1.png’ is located in ‘images/AircraftClassificationDetection/’).
  • Dual Annotation Mapping:
  • JSON Files: Provide detailed annotations with multiple prompt templates and structured fields, directly corresponding to the task folders under ‘images/’.
  • TSV Files: Located in the ‘LMUData/’ folder, these files offer condensed, tab-separated summaries of the same task’s annotations, facilitating efficient batch processing.

Appendix B.2. Annotation Format Details

Appendix B.2.1. JSON Format

Each entry within a task-specific JSON file adheres to the structured format illustrated in Table A9.
Table A9. Field Structure of a JSON Annotation Entry in the SAREval Dataset.
JSON
{
 "image_path": "aircraft_1.png",         # Relative path to the image
 "ground_truth": "Airbus_A220",        # Ground-truth label
 "ground_truth_option": "C",           # Correct option index
 "options_list": [                    # List of options
   "Boeing737",
   "Other",
   "Airbus_A220",
   "Boeing747"
 ],
 "options": "A. Boeing737 B. Other C. Airbus_A220 D. Boeing747",
 "prompts": [                       # Multiple prompt templates for the task
   "What type of aircraft is visible in this image?",
   "Which model does the identified aircraft belong to?"
 ],
 "task": "Aircraft Type Classification",      # Task name
 "image_name": "aircraft_1.png",        # Image filename
 "question_id": 0,                   # Unique ID for the question
 "cls_description": "High Difficulty"      # Difficulty level of the sample
}

Appendix B.2.2. TSV Format

The TSV files in the ‘LMUData/’ folder provide tab-separated annotation summaries designed for efficient batch loading. Table A10 shows an example excerpt from the ‘Bridge_Counting.tsv’ file.
Table A10. Example of a TSV Annotation File in the SAREval Dataset.
image_pathground_truthAnswerQuestionIndexABCDE
01080.jpg 2 A How many bridges are visible in this SAR image? 0 2 1 0 3 4
014417.jpg 2 E What is the total count of bridges in the scene? 1 0 3 1 4 2
The fields in the TSV files correspond to those in the JSON format. Their detailed descriptions are provided in Table A11.
Table A11. Description of Fields in the TSV Annotation Files of the SAREval Dataset.
FieldDescription
image_path Relative path to the image (e.g., ‘ aircraft_1.png ’ maps to ‘ images/AircraftClassificationDetection/aircraft_1.png ’ )
ground_truth Task-specific ground truth (category label for classification, coordinates for detection, numerical value for reasoning tasks)
answer/ground_truth_option Correct option letter (A/B/C/D/E) for multiple-choice tasks (randomized to avoid positional bias)
options_list Complete list of options for multiple-choice tasks (JSON: direct list; TSV: serialized string list)
A/B/C/D/E Individual option values (TSV-only, for quick access without parsing lists)
question/prompts Multiple question templates to test model generalization (JSON: list; TSV: serialized string list)
task Task name (consistent across JSON/TSV formats)
index/question_id Unique identifier for the sample (ensures traceability)
cls_description Difficulty label (High/Medium/Low) for stratified evaluation

Appendix B.3. Evaluation Scripts

To facilitate model evaluation on SAREval, we recommend using the Evalscope framework, configured via YAML files. Table A12 provides a complete configuration example for the Image_Captioning task. The evaluation experiments were conducted on a server equipped with two NVIDIA V100-32GB GPUs (NVIDIA Corporation, Santa Clara, CA, USA) and the software environment was Ubuntu 22.04 with Python 3.10, PyTorch 2.1.2, and CUDA 11.8.
Table A12. Example Evaluation Configuration for SAREval Using the Evalscope Framework.
yaml
eval_backend: VLMEvalKit
eval_config:
  model:
  - type: llava-1.5-7b-hf                     # Model type (supports mainstream VLMs like LLaVA, Qwen-VL2)
  name: CustomAPIModel                  # Model name (for result logging)
  api_base: http://localhost:8000/v1/chat/completions       # Local API endpoint
  key: EMPTY                         # API key (set to "EMPTY" for local deployment)
  temperature: 0.0                        # Set to 0 for deterministic results
  img_size: −1                         # Auto-adapt to image size
  data:
  - Image_Captioning                       # Target task (match task name in dataset)
  mode: all                           # Evaluate all samples in the task
  reuse: false                           # Disable result reuse
  work_dir: outputs                       # Directory to save evaluation results
  nproc: 1                             # Number of parallel processes
Usage Notes:
  • Replace ‘api_base’ with the actual API endpoint of your deployed VLM.
  • Modify the ’data’ field to switch tasks (e.g., ’Aircraft_Classification_Detection’ for the aircraft classification task).
  • Remove the ‘limit’ field to run a full evaluation on the task.

References

  1. Chen, Y.; Cong, Y.; Zhang, L. Deformable Scattering Feature Correlation Network for Aircraft Detection in SAR Images. IEEE Geosci. Remote Sens. Lett. 2023, 20, 4007205. [Google Scholar] [CrossRef] [Scilit]
  2. Fan, Q.; Chen, F.; Cheng, M.; Lou, S.; Xiao, R.; Zhang, B.; Wang, C.; Li, J. Ship Detection Using a Fully Convolutional Network with Compact Polarimetric SAR Images. Remote Sens. 2019, 11, 2171. [Google Scholar] [CrossRef] [Scilit]
  3. Zhao, Y.; Zhao, L.; Li, C.; Kuang, G. Pyramid Attention Dilated Network for Aircraft Detection in SAR Images. IEEE Geosci. Remote Sens. Lett. 2021, 18, 662–666. [Google Scholar] [CrossRef] [Scilit]
  4. Chen, L.; Luo, R.; Xing, J.; Li, Z.; Yuan, Z.; Cai, X. Geospatial Transformer Is What You Need for Aircraft Detection in SAR Imagery. IEEE Trans. Geosci. Remote Sens. 2022, 60, 5225715. [Google Scholar] [CrossRef] [Scilit]
  5. Chen, S.-W.; Cui, X.-C.; Wang, X.-S.; Xiao, S.-P. Speckle-Free SAR Image Ship Detection. IEEE Trans. Image Process. 2021, 30, 5969–5983. [Google Scholar] [CrossRef] [Scilit]
  6. Ai, J.; Xue, W.; Zhu, Y.; Zhuang, S.; Xu, C.; Yan, H.; Chen, L.; Wang, Z. AIS-PVT: Long-Time AIS Data Assisted Pyramid Vision Transformer for Sea-Land Segmentation in Dual-Polarization SAR Imagery. IEEE Trans. Geosci. Remote Sens. 2024, 62, 5220712. [Google Scholar] [CrossRef] [Scilit]
  7. Mohamud, S.A.M.; Jalali, A.; Lee, M. Hierarchical Reasoning Based on Perception Action Cycle for Visual Question Answering. Expert Syst. Appl. 2024, 241, 122698. [Google Scholar] [CrossRef] [Scilit]
  8. Li, Y.; Zhang, X.; Cheng, X.; Tang, X.; Jiao, L. Learning Consensus-Aware Semantic Knowledge for Remote Sensing Image Captioning. Pattern Recognit. 2024, 145, 109893. [Google Scholar] [CrossRef] [Scilit]
  9. Ke, X.; Liu, H.; Xu, P.; Lin, X.; Guo, W. Text-Based Person Search via Cross-Modal Alignment Learning. Pattern Recognit. 2024, 152, 110481. [Google Scholar] [CrossRef] [Scilit]
  10. Li, X.; Wen, C.; Hu, Y.; Yuan, Z.; Zhu, X.X. Vision-Language Models in Remote Sensing: Current Progress and Future Trends. IEEE Geosci. Remote Sens. Mag. 2024, 12, 32–66. [Google Scholar] [CrossRef] [Scilit]
  11. Zhang, X.; Li, X.; An, J.; Gao, L.; Hou, B.; Li, C. Natural Language Description of Remote Sensing Images Based on Deep Learning. In Proceedings of the 2017 IEEE International Geoscience and Remote Sensing Symposium (IGARSS), Fort Worth, TX, USA, 23–28 July 2017; IEEE: Fort Worth, TX, USA, 2017; pp. 4798–4801. [Google Scholar]
  12. Shi, Z.; Zou, Z. Can a Machine Generate Humanlike Language Descriptions for a Remote Sensing Image? IEEE Trans. Geosci. Remote Sens. 2017, 55, 3623–3634. [Google Scholar] [CrossRef] [Scilit]
  13. Zhang, X.; Wang, X.; Tang, X.; Zhou, H.; Li, C. Description Generation for Remote Sensing Images Using Attribute Attention Mechanism. Remote Sens. 2019, 11, 612. [Google Scholar] [CrossRef] [Scilit]
  14. Zhang, Z.; Zhang, W.; Diao, W.; Yan, M.; Gao, X.; Sun, X. VAA: Visual Aligning Attention Model for Remote Sensing Image Captioning. IEEE Access 2019, 7, 137355–137364. [Google Scholar] [CrossRef] [Scilit]
  15. Zhan, Y.; Xiong, Z.; Yuan, Y. RSVG: Exploring Data and Models for Visual Grounding on Remote Sensing Data. IEEE Trans. Geosci. Remote Sens. 2023, 61, 5604513. [Google Scholar] [CrossRef] [Scilit]
  16. Lu, X.; Wang, B.; Zheng, X.; Li, X. Exploring Models and Data for Remote Sensing Image Caption Generation. IEEE Trans. Geosci. Remote Sens. 2018, 56, 2183–2195. [Google Scholar] [CrossRef] [Scilit]
  17. Lobry, S.; Marcos, D.; Murray, J.; Tuia, D. RSVQA: Visual Question Answering for Remote Sensing Data. IEEE Trans. Geosci. Remote Sens. 2020, 58, 8555–8566. [Google Scholar] [CrossRef] [Scilit]
  18. Papadopoulos, S.; Ioannidis, K.; Vrochidis, S.; Kompatsiaris, I.; Patras, I. Vision-Language Pretraining for Variable-Shot Image Classification. In MultiMedia Modeling; Ide, I., Kompatsiaris, I., Xu, C., Yanai, K., Chu, W.-T., Nitta, N., Riegler, M., Yamasaki, T., Eds.; Springer Nature: Singapore, 2025; pp. 283–297. [Google Scholar]
  19. Ak, K.E.; Mohta, J.; Dimitriadis, D.; Manchanda, S.; Xu, Y.; Shen, M. Aligning Vision Language Models with Contrastive Learning. In Computer Vision—ECCV 2024 Workshops; Lecture Notes in Computer Science; Del Bue, A., Canton, C., Pont-Tuset, J., Tommasi, T., Eds.; Springer Nature: Cham, Switzerland, 2025; Volume 15640, pp. 32–45. ISBN 978-3-031-91671-7. [Google Scholar]
  20. Yang, J.-H.; Lin, J. Toward Automatic Relevance Judgment Using Vision–Language Models for Image–Text Retrieval Evaluation. arXiv 2024, arXiv:2408.01363. [Google Scholar]
  21. Li, J.; Li, D.; Savarese, S.; Hoi, S. BLIP-2: Bootstrapping Language-Image Pre-Training with Frozen Image Encoders and Large Language Models. PMLR 2023, 202, 19730–19742. [Google Scholar]
  22. Kuckreja, K.; Danish, M.S.; Naseer, M.; Das, A.; Khan, S.; Khan, F.S. GeoChat:Grounded Large Vision-Language Model for Remote Sensing. In Proceedings of the IEEE Computer Society Conference on Computer Vision and Pattern Recognition, Seattle, WA, USA, 17–21 June 2024; pp. 27831–27840. [Google Scholar]
  23. Zhang, W.; Cai, M.; Zhang, T.; Li, J.; Zhuang, Y.; Mao, X. EarthMarker: Visual Prompt Learning for Region-Level and Point-Level Remote Sensing Imagery Comprehension. arXiv 2024, arXiv:2407.13596. [Google Scholar]
  24. Luo, J.; Pang, Z.; Zhang, Y.; Wang, T.; Wang, L.; Dang, B.; Lao, J.; Wang, J.; Chen, J.; Tan, Y.; et al. SkySenseGPT: A Fine-Grained Instruction Tuning Dataset and Model for Remote Sensing Vision-Language Understanding. arXiv 2024, arXiv:2406.10100. [Google Scholar]
  25. Soni, S.; Dudhane, A.; Debary, H.; Fiaz, M.; Munir, M.A.; Danish, M.S.; Fraccaro, P.; Watson, C.D.; Klein, L.J.; Khan, F.S.; et al. EarthDial: Turning Multi-Sensory Earth Observations to Interactive Dialogues. In Proceedings of the Computer Vision and Pattern Recognition Conference, Nashville, TN, USA, 15 June 2025; pp. 14303–14313. [Google Scholar]
  26. Irvin, J.A.; Liu, E.R.; Chen, J.C.; Dormoy, I.; Kim, J.; Khanna, S.; Zheng, Z.; Ermon, S. TEOChat: A Large Vision-Language Assistant for Temporal Earth Observation Data. arXiv 2024, arXiv:2410.06234. [Google Scholar] [CrossRef] [Scilit]
  27. Argenti, F.; Lapini, A.; Bianchi, T.; Alparone, L. A Tutorial on Speckle Reduction in Synthetic Aperture Radar Images. IEEE Geosci. Remote Sens. Mag. 2013, 1, 6–35. [Google Scholar] [CrossRef] [Scilit]
  28. Li, T. TACMT: Text-Aware Cross-Modal Transformer for Visual Grounding on High-Resolution SAR Images. ISPRS J. Photogramm. Remote Sens. 2025, 222, 152–166. [Google Scholar] [CrossRef] [Scilit]
  29. Zhang, W.; Cai, M.; Zhang, T.; Zhuang, Y.; Mao, X. EarthGPT: A Universal Multimodal Large Language Model for Multisensor Image Comprehension in Remote Sensing Domain. IEEE Trans. Geosci. Remote Sens. 2024, 62, 5917820. [Google Scholar] [CrossRef] [Scilit]
  30. Hu, Y.; Yuan, J.; Wen, C.; Lu, X.; Liu, Y.; Li, X. RSGPT: A Remote Sensing Vision Language Model and Benchmark. ISPRS J. Photogramm. Remote Sens. 2025, 224, 272–286. [Google Scholar] [CrossRef] [Scilit]
  31. Li, X.; Ding, J.; Elhoseiny, M. VRSBench: A Versatile Vision-Language Benchmark Dataset for Remote Sensing Image Understanding. Adv. Neural Inf. Process. Syst. 2024, 37, 3229–3242. [Google Scholar]
  32. Danish, M.S.; Munir, M.A.; Shah, S.R.A.; Kuckreja, K.; Khan, F.S.; Fraccaro, P.; Lacoste, A.; Khan, S. GEOBench-VLM: Benchmarking Vision-Language Models for Geospatial Tasks. In Proceedings of the IEEE/CVF International Conference on Computer Vision, Paris, France, 19–25 October 2025. [Google Scholar]
  33. Ma, Z.; Xiao, X.; Dong, S.; Wang, P.; Wang, H.; Pan, Q. SARChat-Bench-2M: A Multi-Task Vision-Language Benchmark for SAR Image Interpretation. arXiv 2025, arXiv:2502.08168. [Google Scholar]
  34. Muhtar, D.; Li, Z.; Gu, F.; Zhang, X.; Xiao, P. LHRS-Bot: Empowering Remote Sensing with VGI-Enhanced Large Multimodal Language Model. In European Conference on Computer Vision; Lecture Notes in Computer Science (including subseries Lecture Notes in Artificial Intelligence and Lecture Notes in Bioinformatics); 15132 LNCS; Springer: Cham, Switzerland, 2025; pp. 440–457. [Google Scholar]
  35. Wang, F.; Wang, H.; Chen, M.; Wang, D.; Wang, Y.; Guo, Z.; Ma, Q.; Lan, L.; Yang, W.; Zhang, J.; et al. XLRS-Bench: Could Your Multimodal LLMs Understand Extremely Large Ultra-High-Resolution Remote Sensing Imagery? In Proceedings of the 2025 IEEE/CVF Conference on Computer Vision and Pattern Recognition (CVPR), Nashville, TN, USA, 11–15 June 2025. [Google Scholar]
  36. An, X.; Sun, J.; Gui, Z.; He, W. CHOICE: Benchmarking the Remote Sensing Capabilities of Large Vision-Language Models. arXiv 2024, arXiv:2411.18145. [Google Scholar]
  37. Zhang, C.; Wang, S. Good at Captioning, Bad at Counting: Benchmarking GPT-4V on Earth Observation Data. arXiv 2024, arXiv:2401.17600. [Google Scholar] [CrossRef] [Scilit]
  38. Li, X.; Tao, Y.; Zhang, S.; Liu, S.; Xiong, Z.; Luo, C.; Liu, L.; Pechenizkiy, M.; Zhu, X.X.; Huang, T. REOBench: Benchmarking Robustness of Earth Observation Foundation Models. arXiv 2025, arXiv:2505.16793. [Google Scholar] [CrossRef] [Scilit]
  39. Chen, J.; Huang, Z.; Xia, R.; Wu, B.; Sheng, L.; Sun, L.; Yao, B. Large-Scale Multi-Class SAR Image Target Detection Dataset-1.0. J. Radars 2022, 14, 1488. [Google Scholar]
  40. Wang, Z.; Kang, Y.; Zeng, X.; Wang, Y.; Zhang, T.; Sun, X. SAR-AIRcraft-1.0: High-Resolution SAR Aircraft Detection and Recognition Dataset. J. Radars 2023, 12, 906–922. [Google Scholar] [CrossRef]
  41. Xia, J.; Chen, H.; Broni-Bediako, C.; Wei, Y.; Song, J.; Yokoya, N. OpenEarthMap-SAR: A Benchmark Synthetic Aperture Radar Dataset for Global High-Resolution Land Cover Mapping. arXiv 2025, arXiv:2501.10891. [Google Scholar] [CrossRef] [Scilit]
  42. Wu, Y.; Suo, Y.; Meng, Q.; Dai, W.; Miao, T.; Zhao, W.; Yan, Z.; Diao, W.; Xie, G.; Ke, Q.; et al. FAIR-CSAR: A Benchmark Dataset for Fine-Grained Object Detection and Recognition Based on Single-Look Complex SAR Images. IEEE Trans. Geosci. Remote Sens. 2025, 63, 5201022. [Google Scholar] [CrossRef] [Scilit]
  43. Cao, Y.; Weng, Q. A Deep Learning-Based Super-Resolution Method for Building Height Estimation at 2.5 m Spatial Resolution in the Northern Hemisphere. Remote Sens. Environ. 2024, 310, 114241. [Google Scholar] [CrossRef] [Scilit]
  44. Xu, C.; Wang, X. OpenSARWake: A Large-Scale SAR Dataset for Ship Wake Recognition with a Feature Refinement Oriented Detector. IEEE Geosci. Remote Sens. Lett. 2024, 21, 4010105. [Google Scholar] [CrossRef] [Scilit]
  45. Liu, Y.X.; Li, W.J.; Liu, L.; Zhou, J.; Peng, B.W.; Song, Y.F.; Xiong, X.Y.; Yang, W.; Liu, T.P.; Liu, Z.; et al. ATRNet-STAR: A Large Dataset and Benchmark towards Remote Sensing Object Recognition in the Wild. arXiv 2025, arXiv:2501.13354. [Google Scholar]
  46. Papineni, K.; Roukos, S.; Ward, T.; Zhu, W.-J. BLEU: A Method for Automatic Evaluation of Machine Translation. In Proceedings of the 40th Annual Meeting on Association for Computational Linguistics—ACL ’02, Philadelphia, PA, USA, 7–12 July 2002; Association for Computational Linguistics: Philadelphia, PA, USA, 2001; p. 311. [Google Scholar]
  47. Lin, C.-Y. ROUGE: A Package for Automatic Evaluation of Summaries. In Proceedings of the Annual Meeting of the Association for Computational Linguistics, Barcelona, Spain, 21–26 July 2004. [Google Scholar]
  48. Zhang, T.; Kishore, V.; Wu, F.; Weinberger, K.Q.; Artzi, Y. BERTScore: Evaluating Text Generation with BERT. arXiv 2019, arXiv:1904.09675. [Google Scholar]
  49. Zheng, L.; Chiang, W.-L.; Sheng, Y.; Zhuang, S.; Wu, Z.; Zhuang, Y.; Lin, Z.; Li, Z.; Li, D.; Xing, E.P.; et al. Judging LLM-as-a-Judge with MT-Bench and Chatbot Arena. Adv. Neural Inf. Process. Syst. 2023, 36, 46595–46623. [Google Scholar]
  50. Callison-Burch, C.; Osborne, M.; Koehn, P. Re-Evaluating the Role of Bleu in Machine Translation Research. In Proceedings of the 11th Conference of the European Chapter of the Association for Computational Linguistics, Trento, Italy, 3–7 April 2006; McCarthy, D., Wintner, S., Eds.; Association for Computational Linguistics: Trento, Italy, 2006; pp. 249–256. [Google Scholar]
  51. Zeng, Z.; Sun, J.; Zhang, H.; Wen, T.; Su, Y.; Xie, Y.; Wang, Z.; Chen, B. HICEScore: A Hierarchical Metric for Image Captioning Evaluation. In Proceedings of the 32nd ACM International Conference on Multimedia, Melbourne, Australia, 28 October–1 November 2024; ACM: New York, NY, USA, 2024; pp. 866–875. [Google Scholar]
  52. Cui, Y.; Yang, G.; Veit, A.; Huang, X.; Belongie, S. Learning to Evaluate Image Captioning. In Proceedings of the 2018 IEEE/CVF Conference on Computer Vision and Pattern Recognition (CVPR), Salt Lake City, UT, USA, 18–22 June 2018. [Google Scholar]
  53. Hessel, J.; Holtzman, A.; Forbes, M.; Bras, R.L.; Choi, Y. CLIPScore: A Reference-Free Evaluation Metric for Image Captioning. In Proceedings of the 2021 Conference on Empirical Methods in Natural Language Processing, Punta Cana, Dominican Republic, 7–11 November 2021. [Google Scholar]
  54. Hou, X.; Ao, W.; Song, Q.; Lai, J.; Wang, H.; Xu, F. FUSAR-Ship: Building a High-Resolution SAR-AIS Matchup Dataset of Gaofen-3 for Ship Detection and Recognition. Sci. China Inf. Sci. 2020, 63, 140303. [Google Scholar] [CrossRef] [Scilit]
  55. Wang, D.; Zhang, F.; Ma, F.; Hu, W.; Tang, Y.; Zhou, Y. A Benchmark Sentinel-1 SAR Dataset for Airport Detection. IEEE J. Sel. Top. Appl. Earth Obs. Remote Sens. 2022, 15, 6671–6686. [Google Scholar] [CrossRef] [Scilit]
  56. Lin, X.; Zhang, B.; Wu, F.; Wang, C.; Yang, Y.; Chen, H. SIVED: A SAR Image Dataset for Vehicle Detection Based on Rotatable Bounding Box. Remote Sens. 2023, 15, 2825. [Google Scholar] [CrossRef] [Scilit]
  57. Zhu, Q.; Zhang, Y.; Li, Z.; Yan, X.; Guan, Q.; Zhong, Y.; Zhang, L.; Li, D. Oil Spill Contextual and Boundary-Supervised Detection Network Based on Marine SAR Images. IEEE Trans. Geosci. Remote Sens. 2022, 60, 5213910. [Google Scholar] [CrossRef] [Scilit]
  58. Huang, M.; Xu, Y.; Qian, L.; Shi, W.; Zhang, Y.; Bao, W.; Wang, N.; Liu, X.; Xiang, X. The QXS-SAROPT Dataset for Deep Learning in SAR-Optical Data Fusion. arXiv 2021, arXiv:2103.08259. [Google Scholar]
  59. Wu, F.; Zhang, H.; Wang, C.; Li, L.; Li, J.J.; Chen, W.R.; Zhang, B. SARBuD1.0: A SAR Building Dataset Based on GF-3 FSII Imageries for Built-up Area Extraction with Deep Learning Method. Natl. Remote Sens. Bull. 2022, 26, 620–631. [Google Scholar] [CrossRef] [Scilit]
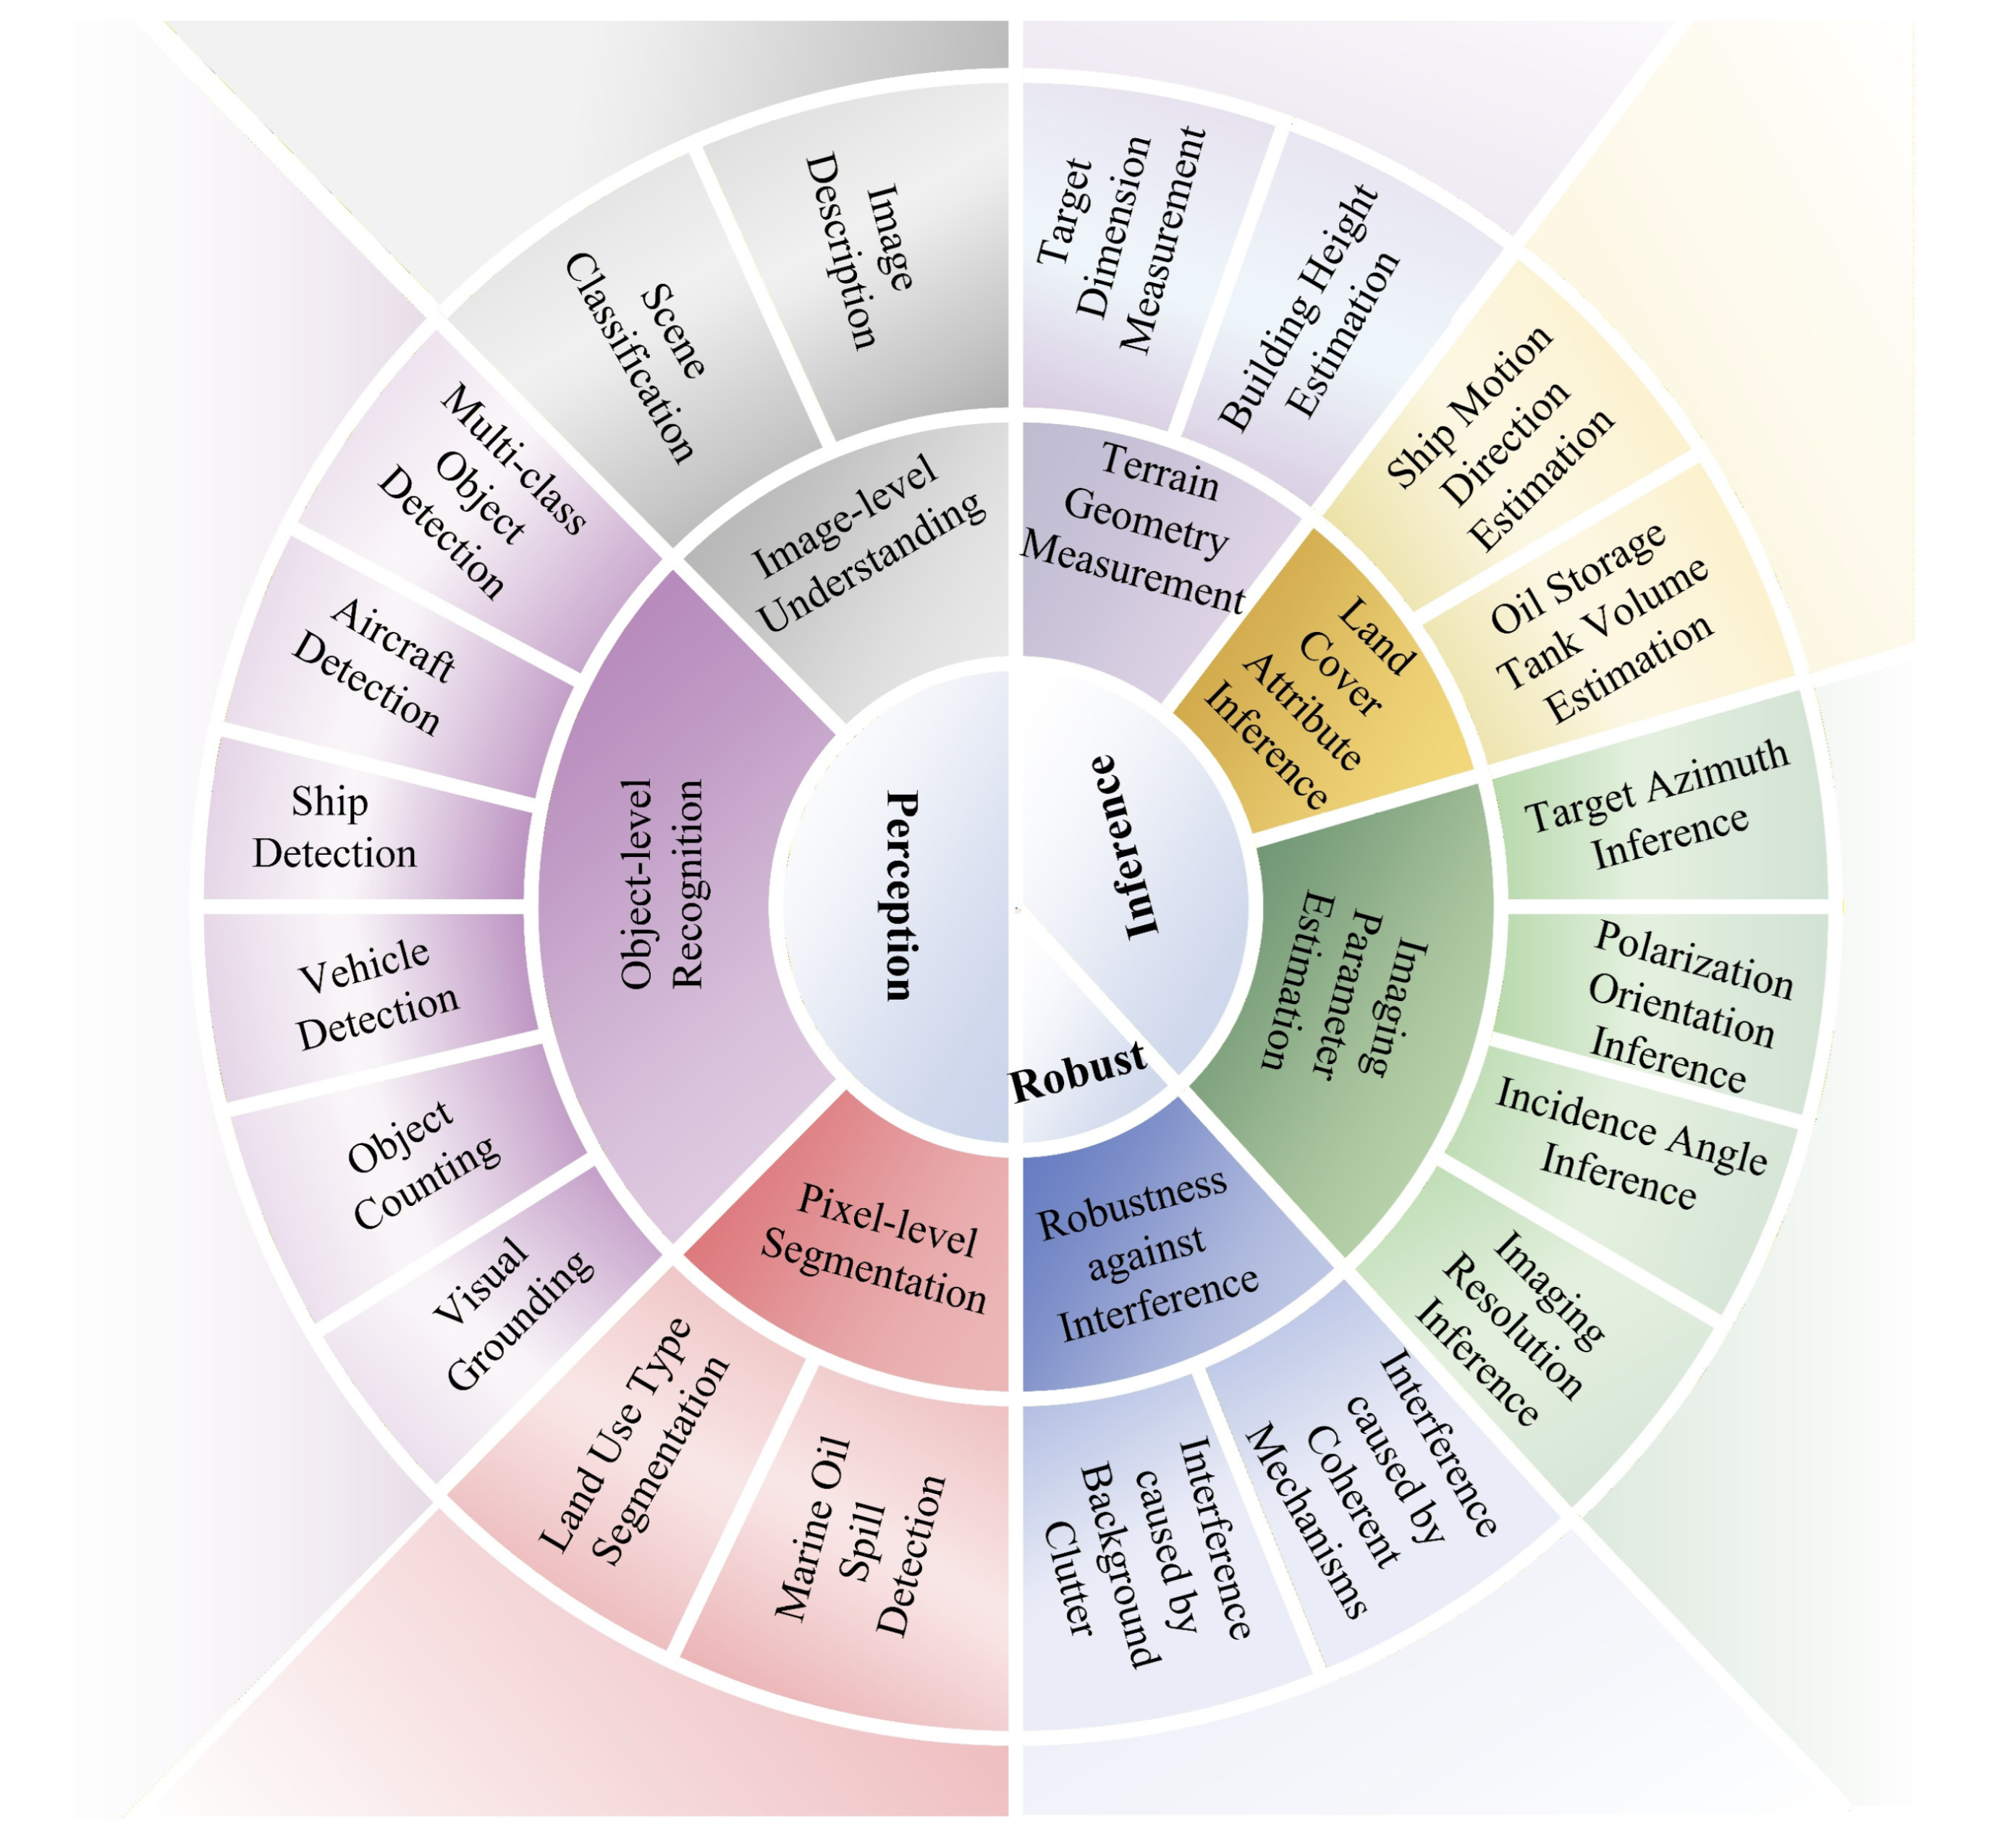
Figure 1. The SAREval benchmark dataset is a multidimensional and multi-task evaluation framework structured around three core capabilities, namely Perception, Reasoning, and Robustness, integrating SAR-specific characteristics across three hierarchical levels and 20 fine-grained tasks.
Remotesensing 18 00082 g001
Figure 2. Perception Capability Task Visualization. The text in green indicates the correct answer.
Remotesensing 18 00082 g002
Figure 3. Reasoning Capability Task Visualization. The text in green indicates the correct answer.
Remotesensing 18 00082 g003
Figure 4. Robustness Capability Task Visualization. The text in green indicates the correct answer.
Remotesensing 18 00082 g004
Figure 5. Data pipeline for the SAREval. In this figure, text and circles in different colors indicate different types of answer options: red denotes the correct answer; green denotes mid-range distractors; blue denotes adjacent distractors; and yellow denotes special distractors.
Remotesensing 18 00082 g005
Figure 6. Overview of VLMs’ performance in the MCQs Tasks.
Remotesensing 18 00082 g006
Figure 7. Comparison of VLMs’ performance on the Robustness Dimension. (a) Performance of VLMs under speckle noise interference based on the Multi-class Object Detection task. (b) Performance of VLMs under background clutter interference based on the medium-difficulty Ship Classification Detection task. (c) Performance of VLMs under background clutter interference based on the high-difficulty Ship Classification Detection task.
Remotesensing 18 00082 g007
Figure 8. Radar charts illustrating the performance of VLMs on the reasoning dimension. (a) Performance of VLMs on Perception Dimension tasks. (b) Performance of VLMs on the Reasoning Dimension tasks.
Remotesensing 18 00082 g008
Table 1. Comparison of existing benchmark datasets with SAREval.
DatasetSARRobustness TestAnswer TypeDimensionAnnotation Method
RSIEval [30]××FF6M
LHRS-Bench [34]××MCQ11M
FIT-RSFG [24]××MCQ, BBox, FF11A + M
GeoChat-Bench [22]××FF, BBox6A + M
SARChat-Bench [33]×BBox, FF6A + M
VRSBench [31]××BBox, FF3A + M
XLRS-Bench [35]××MCQ, BBox, FF16A + M
CHOICE [36]×MCQ, BBox, Seg23A + M
VLEO-Bench [37]××MCQ, BBox, FF6A + M
GeoBench-VLM [32]×MCQ, BBox, Seg31A + M
REOBench [38]×BBox, Seg, FF6A + M
SAREvalMCQ, BBox, Seg, FF20A + M
Abbreviations adopted: MCQ for multiple-choice questions, FF for free form, BBox for bounding box, and Seg for segmentation masks; in annotation formats, M for manual annotation, and A denotes automatic annotation.
Table 2. Performance (%) of VLMs on the Perception Dimension tasks.
Model NameACShipCOTCBCTCCVCACDSCD-MSCD-HVCD-MVCD-HMCODSC
Phi-3.5-vision22.6824.0323.6614.5916.6717.1927.4836.6225.3523.4020.3824.4244.46
Qwen2.5-VL-7B14.4320.1616.7940.0025.5617.9723.8747.8922.5418.8717.7434.8145.09
Deepseek-VL2-tiny14.4310.859.9241.6220.0011.7217.1216.2019.7212.4511.3223.4820.89
Mono-InternVL-2B28.8731.7821.3734.5926.6723.4427.4838.0321.8319.6220.0032.8350.79
InternVL2-4B20.6220.9319.8515.146.6717.197.6630.999.157.172.6428.2746.99
InternVL2.5-4B29.9022.4827.4835.1422.2224.2227.0331.6919.0124.9119.2538.5558.70
InternVideo2.5-8B20.6219.3823.6625.416.672.3412.1618.316.348.302.6436.5744.78
InternVL3-9B20.6221.7130.5316.7611.1125.0022.9723.9416.2018.8716.2338.4319.46
LLaVA-1.5-7B14.4320.9324.4316.7618.8918.7527.4839.4421.8323.7718.8743.3447.78
LLaVA-Next9.282.330.7613.5113.338.5916.6738.7322.5422.2617.3638.3238.61
LLaVA-onevision-qwen2-7b26.8020.9314.5024.8612.2221.0924.3238.0324.6527.9223.0246.0361.71
Abbreviations adopted: AC for Aircraft Counting; ShipC for Ship Counting; OTC for Oil Tank Counting; BC for Bridge Counting; TCC for Tower Crane Counting; VC for Vehicle Counting; ACD for Aircraft Category Detection; SCD for Ship Category Detection; VCD for Vehicle Category Detection; MCOD for Multi-Class Object Detection; SC for Scene Classification. “M” denotes medium-difficulty tasks; “H” denotes high-difficulty tasks. Values in bold red indicate the maximum; values with a blue underline indicate the minimum.
Table 3. Scores of VLMs on the Image Description task. Values in bold red indicate the maximum; values with a blue underline indicate the minimum.
Model NameBLEU-1BLEU-2BLEU-3BLEU-4ROUGE-LBERTScoreSubjective Score
Phi-3.5-vision0.24620.10370.04450.02440.17450.58348.0739
Qwen2.5-VL-7B0.23860.1140.05230.02910.17590.594850.9989
Deepseek-VL2-tiny0.18320.08610.03760.02060.15190.556351.393
Mono-InternVL-2B0.08680.04290.02020.01140.09620.506234.9366
InternVL2-4B0.17590.08440.03720.02040.15520.577547.4545
InternVL2.5-4B0.22860.11110.05260.02970.17870.593648.7487
InternVideo2.5-8B0.27720.12920.05820.03350.19550.588350.7744
InternVL3-9B0.20930.1010.04810.02540.16710.594758.0316
LLaVA-1.5-7B0.24090.11790.05430.03160.19080.555554.8532
LLaVA-Next0.1870.08390.03440.01850.15890.568956.9065
LLaVA-onevision-qwen2-7b0.19250.09050.04120.02260.16240.582946.0764
Table 4. Performance (%) of VLMs on the Visual Grounding task. Values in bold red indicate the maximum; values with a blue underline indicate the minimum.
Model NameAcc@0.25Acc@0.5
Phi-3.5-vision0.880.05
Qwen2.5-VL-7B0.440.15
Deepseek-VL2-tiny1.420.20
Mono-InternVL-2B0.060.00
InternVL2-4B1.720.39
InternVL2.5-4B0.830.10
InternVideo2.5-8B1.960.59
InternVL3-9B2.010.44
LLaVA-1.5-7B5.101.37
LLaVA-Next6.082.89
LLaVA-onevision-qwen2-7b0.640.15
Table 5. Performance (%) of VLMs on the Reasoning Dimension tasks.
Model NameIAITAIPOIIRISMDEBHETDM
Phi-3.5-vision7.3229.5618.0029.5226.7329.5620.10
Qwen2.5-VL-7B13.6630.7711.5020.2637.620.0219.66
Deepseek-VL2-tiny18.0527.3531.0029.0726.7320.5931.56
Mono-InternVL-2B19.5123.9316.5017.6216.8323.3923.28
InternVL2-4B25.3725.6422.0021.156.9329.847.84
InternVL2.5-4B13.669.4018.5022.4730.6911.050.74
InternVideo2.5-8B39.0233.3318.0025.5533.6629.5622.06
InternVL3-9B22.4424.7916.0023.3529.7028.8432.35
LLaVA-1.5-7B22.4433.3319.0025.1116.8323.0428.26
LLaVA-Next46.3438.4618.0023.359.9012.581.72
LLaVA-onevision-qwen2-7b43.4128.2120.5017.6219.8019.6131.28
Abbreviations adopted: IAI for Incidence Angle Inference; TAI for Target Azimuth Angle Inference; POI for Polarization Orientation Inference; IRI for Image Resolution Inference; SMDE for Ship Motion Direction Estimation; BHE for Building Height Estimation; TDM for Target Dimension Measurement. Values in bold red indicate the maximum; values with a blue underline indicate the minimum.
Table 6. Performance (%) of VLMs on Interference caused by Background Clutter task.
Model NameNo Speckle NoiseAdd Speckle NoiseΔAccuracy
Phi-3.5-vision24.4225.471.05
Qwen2.5-VL-7B34.8136.331.52
Deepseek-VL2-tiny23.4838.6715.19
Mono-InternVL-2B32.8323.28−9.54
InternVL2-4B28.2735.637.36
InternVL2.5-4B38.5526.05−12.50
InternVideo2.5-8B36.5728.86−7.71
InternVL3-9B38.4335.63−2.80
LLaVA-1.5-7B43.3443.690.35
LLaVA-Next38.3233.64−4.67
LLaVA-onevision-qwen2-7b46.0343.81−2.22
This scenario uses the Multi-Class Object Detection task as the benchmark. Values in bold red indicate the maximum; values with a blue underline indicate the minimum.
Table 7. Performance (%) of VLMs on Interference caused by Background Clutter task.
Model NameSCD-MSCD-H
No Background ClutterAdd Background ClutterΔAccuracyNo Background ClutterAdd Background ClutterΔAccuracy
Phi-3.5-vision36.6235.21−1.4125.3523.94−1.41
Qwen2.5-VL-7B47.8919.01−28.8722.544.93−17.61
Deepseek-VL2-tiny16.2023.247.0419.7216.90−2.82
Mono-InternVL-2B38.0319.01−19.0121.8322.540.70
InternVL2-4B30.9950.0019.019.1550.7041.55
InternVL2.5-4B31.6928.87−2.8219.0111.97−7.04
InternVideo2.5-8B18.3138.7320.426.3419.0112.68
InternVL3-9B23.9435.9211.9716.2020.424.23
LLaVA-1.5-7B39.4442.252.8221.8323.241.41
LLaVA-Next38.7340.852.1122.5422.540.00
LLaVA-onevision-qwen2-7b38.0342.254.2324.6521.83−2.82
This scenario uses the Ship Category Detection task as the benchmark. “M” denotes medium-difficulty tasks, “H” denotes high-difficulty tasks. Values in bold red indicate the maximum; values with a blue underline indicate the minimum.
Disclaimer/Publisher’s Note: The statements, opinions and data contained in all publications are solely those of the individual author(s) and contributor(s) and not of MDPI and/or the editor(s). MDPI and/or the editor(s) disclaim responsibility for any injury to people or property resulting from any ideas, methods, instructions or products referred to in the content.