Article

A Practical Framework for Estimating Façade Opening Rates of Rural Buildings Using Real-Scene 3D Models Derived from Unmanned Aerial Vehicle Photogrammetry

1
School of Remote Sensing and Information Engineering, Wuhan University, Wuhan 430079, China
2
Hubei Luojia Laboratory, Wuhan 430079, China
*
Author to whom correspondence should be addressed.
Remote Sens. 2025, 17(9), 1596; https://doi.org/10.3390/rs17091596
Submission received: 3 March 2025 / Revised: 20 April 2025 / Accepted: 29 April 2025 / Published: 30 April 2025
(This article belongs to the Section Remote Sensing Image Processing)

Abstract

:
The Façade Opening Rate (FOR) reflects a building’s capacity to withstand seismic loads, serving as a crucial foundation for seismic risk assessment and management. However, FOR data are often outdated or nonexistent in rural areas, which are particularly vulnerable to earthquake damage. This paper proposes a practical framework for estimating FORs from real-scene 3D models derived from UAV photogrammetry. The framework begins by extracting individual buildings from 3D models using annotated roof outlines. The known edges of the roof outline are then utilized to sample and generate orthogonally projected front-view images for each building façade, enabling undistorted area measurements. Next, a modified convolutional neural network is employed to automatically extract opening areas (windows and doors) from the front-view façade images. To enhance the accuracy of opening area extraction, a vanishing point correction method is applied to open-source street-view samples, aligning their style with the front-view images and leveraging street-view-labeled samples. Finally, the FOR is estimated for each building by extracting the façade wall area through simple spatial analysis. Results on two test datasets show that the proposed method achieves high accuracy in FOR estimation. Regarding the mean relative error (MRE), a critical evaluation metric which measures the relative difference between the estimated FOR and its ground truth, the proposed method outperforms the closest baseline by 5%. Moreover, on the façade images we generated, the MRE of our method was improve by 1% and 2% compared to state-of-the-art segmentation methods. These results demonstrate the effectiveness of our framework in accurately estimating FORs and highlight its potential for improving seismic risk assessment in rural areas.

1. Introduction

As one of humanity’s most destructive natural adversaries, earthquakes claim roughly 10,000 lives annually and inflict billions of dollars in economic losses [1,2,3]. Among the structures most at risk are masonry buildings, the oldest form of construction, which are still widespread today. In China, for example, they account for 90% of rural housing [4]. These traditional dwellings, typically self-built without rigorous seismic design, rely on load-bearing brick walls, a design that renders them highly vulnerable to earthquake shaking, even in moderate events [5]. A key factor in this vulnerability lies in the façade openings, specifically the doors and windows, whose size and position significantly influence damage patterns and failure modes [6,7]. Façade Opening Rate (FOR), defined as the ratio of opening area to wall area of a façade, emerges as a critical parameter shaping seismic response [8,9]. Research indicates that within a 10% to 40% opening rate range, the stiffness degradation of unreinforced masonry walls correlates roughly proportionally with this ratio [5,10,11]. Therefore, accurately estimating the FOR of buildings is significant for assessing seismic risks and guiding the design of retrofitting strategies, particularly in economically underdeveloped regions where masonry structures are widely used for housing construction.
Compared to costly on-site manual measurements, using images obtained by unmanned aerial vehicles (UAVs) offers a more efficient approach for regional FOR assessment. However, despite the ability of modern UAVs to capture high-resolution images that reveal intricate surface textures and structural features [12], aerial photographs often exhibit significant perspective distortion due to the nature of central projection imaging [13]. This distortion leads to substantial errors in estimating the areas of openings and walls. While reprojecting the images based on known imaging angles can partially mitigate these distortions [14], corrections are often limited to compensating for pitch-related deformations, as façades are oriented in diverse directions. In contrast, constructing 3D real-scene models from UAV photogrammetry provides a promising solution to this problem, as these models offer a highly reliable data foundation for precise measurements [15,16]. However, manually measuring openings and façades in 3D models remains a time-consuming task, underscoring the need for a tailored framework for FOR assessment based on 3D real-scene models.
On the other hand, achieving high-precision extraction of doors and windows from 3D real-scene models poses challenges. Although existing deep learning-based methods for extracting doors and windows from imagery demonstrate strong performance [17,18,19,20], they are often difficult to adopt to 3D real-scene data generated by UAV photogrammetry. One primary reason is the difference in imaging perspectives: UAV images are typically captured from an overhead or oblique angle, whereas most deep learning models are trained on street-level imagery [21,22], resulting in a significant bias. Additionally, the demand for FOR estimation, which serves seismic risk assessment, is concentrated in rural areas, whereas street-level datasets [23,24,25] predominantly cover urban regions. This mismatch in geographical distribution and building types further complicates the application of mainstream deep learning models and their pretrained weights for FOR estimation. However, building a specialized dataset specifically for masonry buildings from scratch would be highly resource-intensive. Therefore, minimizing the gap between existing street-level image datasets and the task of extracting doors and windows from 3D real-scene models, while maximizing the utility of open-source datasets for FOR estimation, necessitates further research to address these challenges effectively.
To address the above challenges, we propose a new framework for estimating FORs using real-scene 3D models derived from UAV photogrammetry. This framework enables high-precision FOR estimation, requiring only annotated roof outlines to extract individual buildings from real-scene 3D models. On this basis, our approach consists of the following steps: first, we utilize the known edges of the roof outline to sample and generate an orthogonally projected front-view image for each building façade from the 3D model. This image allows for undistorted area measurements of the façade. Second, we employ a convolutional neural network (CNN) architecture [26] to automatically extract opening areas (windows and doors) from the front-view façade image. Additionally, we apply a vanishing point correction method [27] to reduce distortion in open-source street-view samples, aligning their style with the front-view images. This step further improves the accuracy of opening area extraction by leveraging street-view-labelled samples. Finally, the FOR is estimated by extracting the façade wall area from the individual building model through simple spatial analysis.
Experimental results in two rural areas, located in Nanjing and Ezhou, China, demonstrate that our method achieves high-precision FOR estimation from real-scene 3D models. The mean relative errors (MREs) for the two study areas are 12% and 11%, respectively, outperforming traditional methods that do not account for image distortion correction in door and window extraction, in which the closest baseline achieves MREs of 17% and 16%. Our contributions are as follows:
-
We propose a practical workflow for estimating FORs using real-scene 3D models derived from UAV photogrammetry, effectively avoiding the projection distortions inherent in image-based FOR estimation.
-
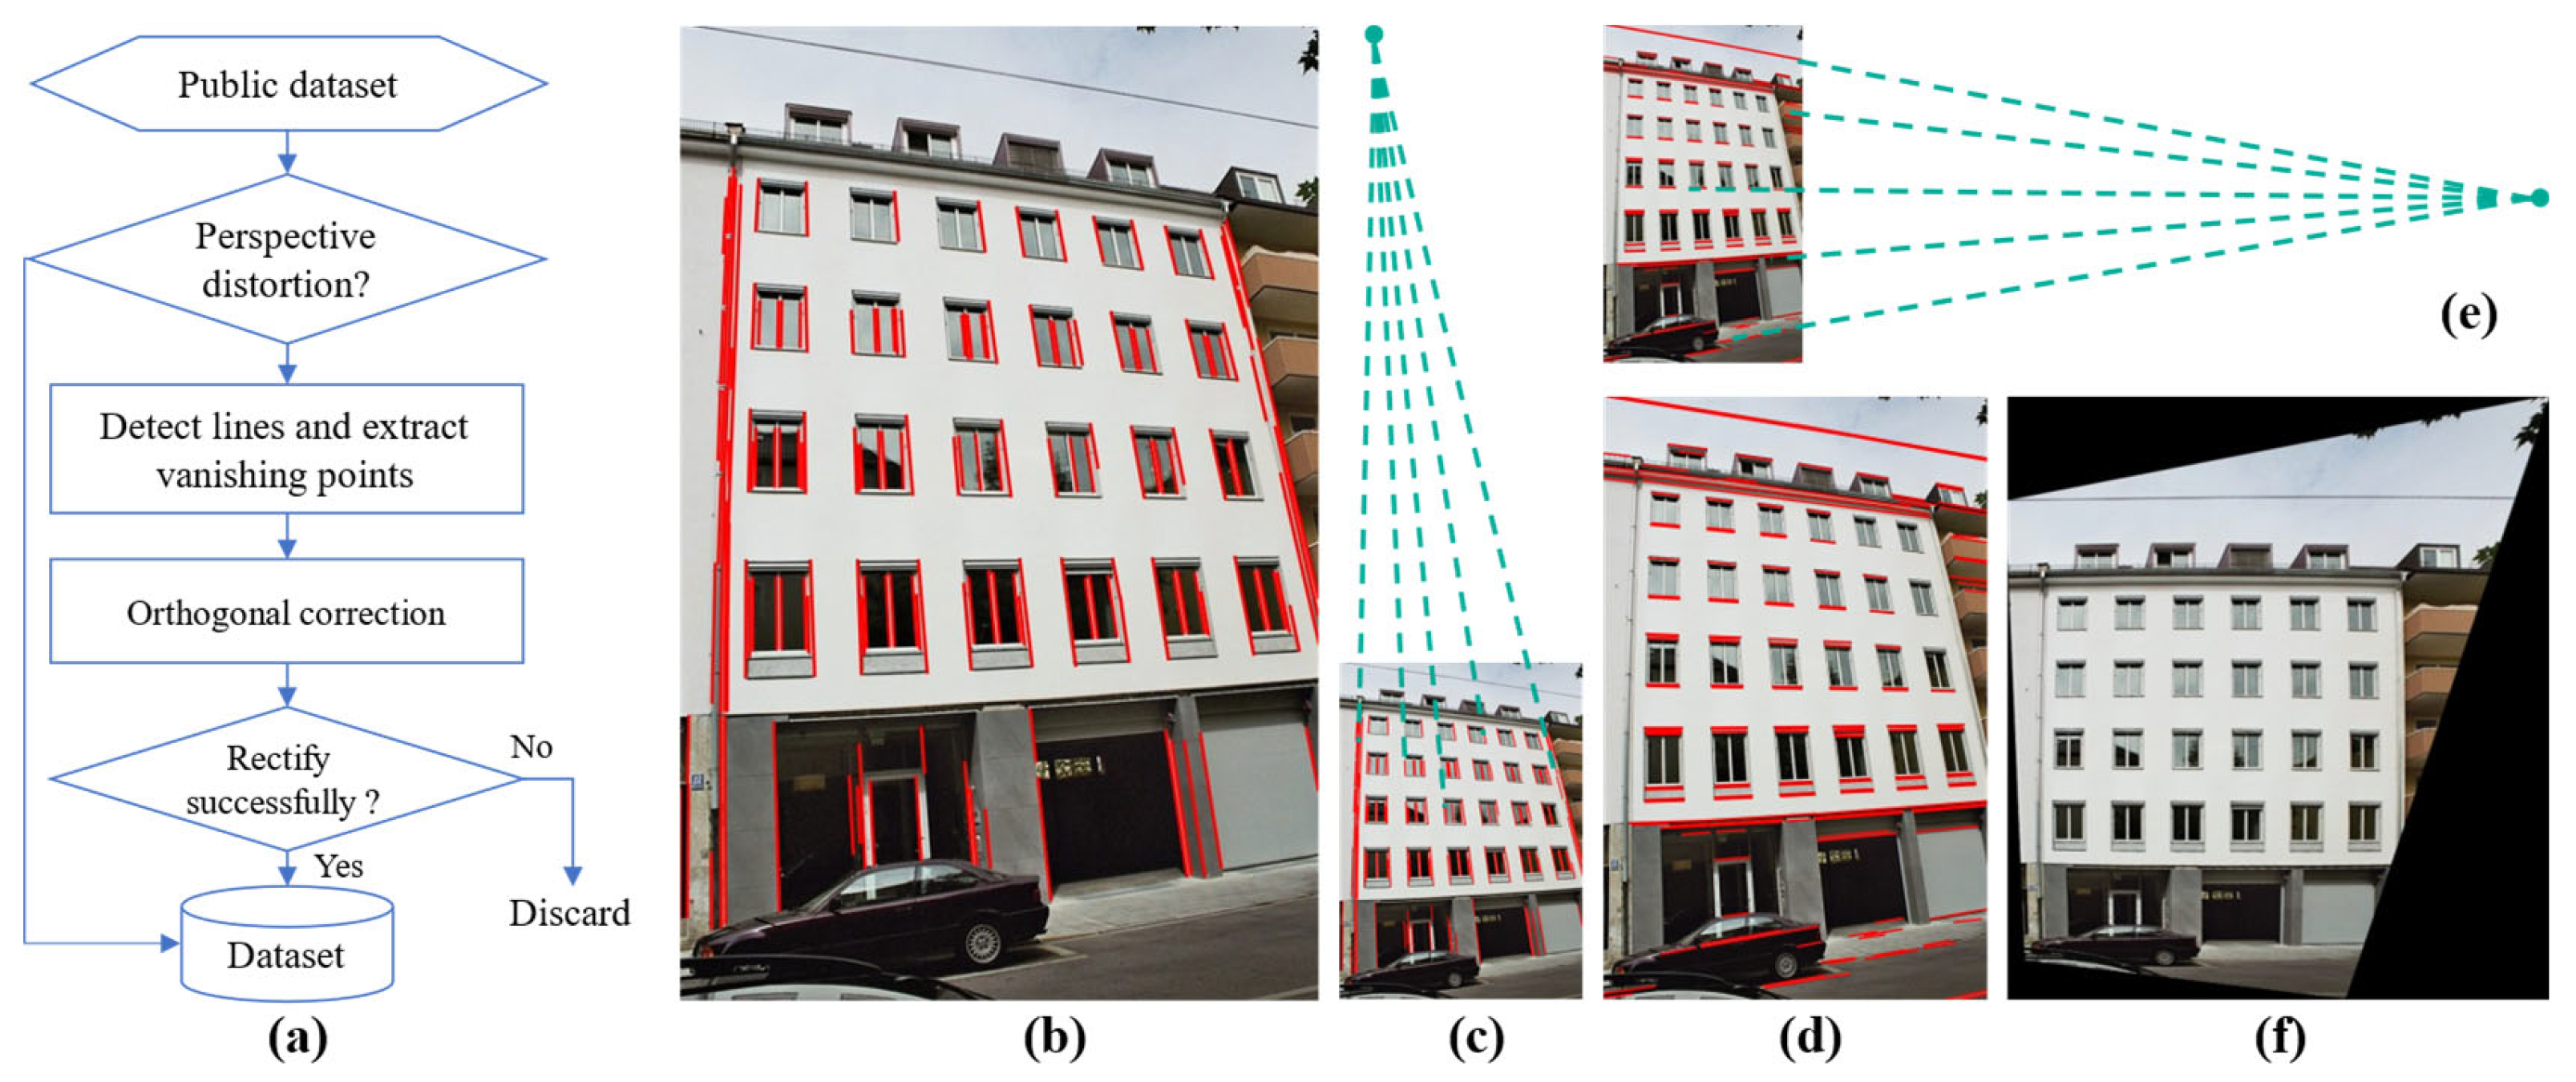
By leveraging vanishing point correction to align the style of open-source street-view images with front-view images, we enhance the pre-training effectiveness of street-view image samples for extracting opening areas from rural building façades.
-
We introduce an attention module within a CNN learning framework to enhance the extraction of doors and windows from façade images, improving façade opening detection accuracy.

2. Related Work

2.1. Façade Safety Risk Assessment

Façade safety risk assessment has been widely applied across various fields, including construction engineering, urban management, and disaster prevention [12]. Accurate risk modelling requires detailed knowledge of building structural characteristics, including material composition, structural integrity, and connection stability, among other factors [28]. Traditional assessments relied on on-site investigations conducted by trained personnel using specialized instruments [29]. While highly accurate, this approach was time-consuming, labor-intensive, and impractical for large-scale applications. To address these limitations, some scholars have integrated satellite remote sensing data with field surveys to enhance the efficiency and scalability of façade safety evaluations, particularly for rural buildings. Li et al. [30] developed seismic vulnerability matrices by fitting beta probability density functions, integrating historical earthquake records, loss evaluation compilations, field investigations, and remote sensing interpretations. Additionally, An et al. [31] proposed a three-stage recognition method, blending geometric building features extracted from Google Earth imagery with field survey data to classify building types and assess seismic risk. However, satellite remote sensing falls short of capturing fine-grained structural details, such as façade openings or material specifics. In addition, these statistical-based evaluation methods are particularly limited in rural regions with active neotectonics but limited recent earthquake records to guide seismic vulnerability models [30].
Recently, the use of high-resolution data sources, such as street view imagery, laser scanning, and UAV photography, has emerged as a promising approach for improving the precision and efficiency of façade safety risk assessments [32]. Google Street View façade images were utilized to classify building categories for seismic risk assessment [3]. Street view data provide an accessible, low-cost means of capturing façade details, but they are limited in their ability to capture fine-grained structural information and suffer from a lack of absolute geometric accuracy, making them less reliable for precise measurements. Compared to street view imagery, laser scanning offers highly accurate 3D geometric data, making it well-suited for detailed building analysis. Mobile LiDAR point clouds were employed to extract façade openings to assess the impact of flooding [33]. However, laser scanning comes with high equipment costs, operational complexity, and time-consuming data processing, limiting its practicality for large-scale applications. UAV photography provides high-resolution oblique images with rich geometric and texture details, offering a flexible and cost-effective solution [34], which achieves a superior balance of cost, flexibility, and data quality. As a result, UAV photography emerges as the most practical and effective choice for earthquake safety [35,36] and rural building assessment [37,38], particularly in large-scale or remote regions where other methods may be less feasible [39,40]. Among various factors influencing façade safety, FOR has emerged as a key research focus due to its significant impact on structural stability [41], fire safety [42], and energy efficiency [43]. However, research on FOR estimation based on UAV photography remains scarce, indicating a gap that warrants further exploration.

2.2. Façade Opening Extraction

Façade opening extraction is a crucial step in estimating FOR, directly influencing the accuracy of FOR estimation. Various approaches have been developed for extracting façade openings, which can be roughly grouped into procedural grammar-based techniques and machine learning-based methods. Early studies integrated procedural grammars with architectural priors to delineate façade openings. For example, Müller et al. [44] combined shape grammar procedural modelling with image analysis to achieve a meaningful hierarchical façade subdivision. Similarly, Reznik and Mayer [45] employed Implicit Shape Models to detect and outline windows, enhancing precision by using plane sweeping to identify rows or columns of openings. To ensure global optimality, Cohen et al. [46] utilized dynamic programming to segment façade objects, proposing a parsing method that adheres to common architectural constraints. While these techniques perform well within specific architectural contexts, their reliance on prior knowledge limits their adaptability [17,47]. Such rule-based approaches are often ill-suited to the diverse and irregular building features found in rural areas, where architectural characteristics can vary greatly.
Deep learning offers a powerful approach for façade openings extraction, capable of automatically inferring doors and windows from contextual cues in annotated data. Liu et al. [48] introduced DeepFacade, a method leveraging fully convolutional networks (FCNs) to segment façades, enhanced by a symmetry loss term that optimizes results for the symmetrical arrangement of windows. Ma et al. [18] proposed a pyramid atrous large kernel (ALK) network, which captures long-range dependencies among building elements using ALK modules across multiscale feature maps, effectively aggregating nonlocal contexts by exploiting the regular structure of façades. Similarly, Li et al. [20] developed a heatmap fusion technique inspired by pose estimation, robustly detecting windows by predicting key points in a bottom-up approach and grouping them based on pairwise relationships. While deep learning shows impressive capabilities of façade openings segmentation, it strongly relies on annotated samples. Current deep learning-based façade opening detection methods primarily use street view façade images, which lack strict geometric accuracy. The inherent geometric distortions in these images introduce uncertainty in FOR estimation. Moreover, there is a significant shortage of front-view façade sample data, which are crucial for accurately estimating FOR.

3. Materials and Methods
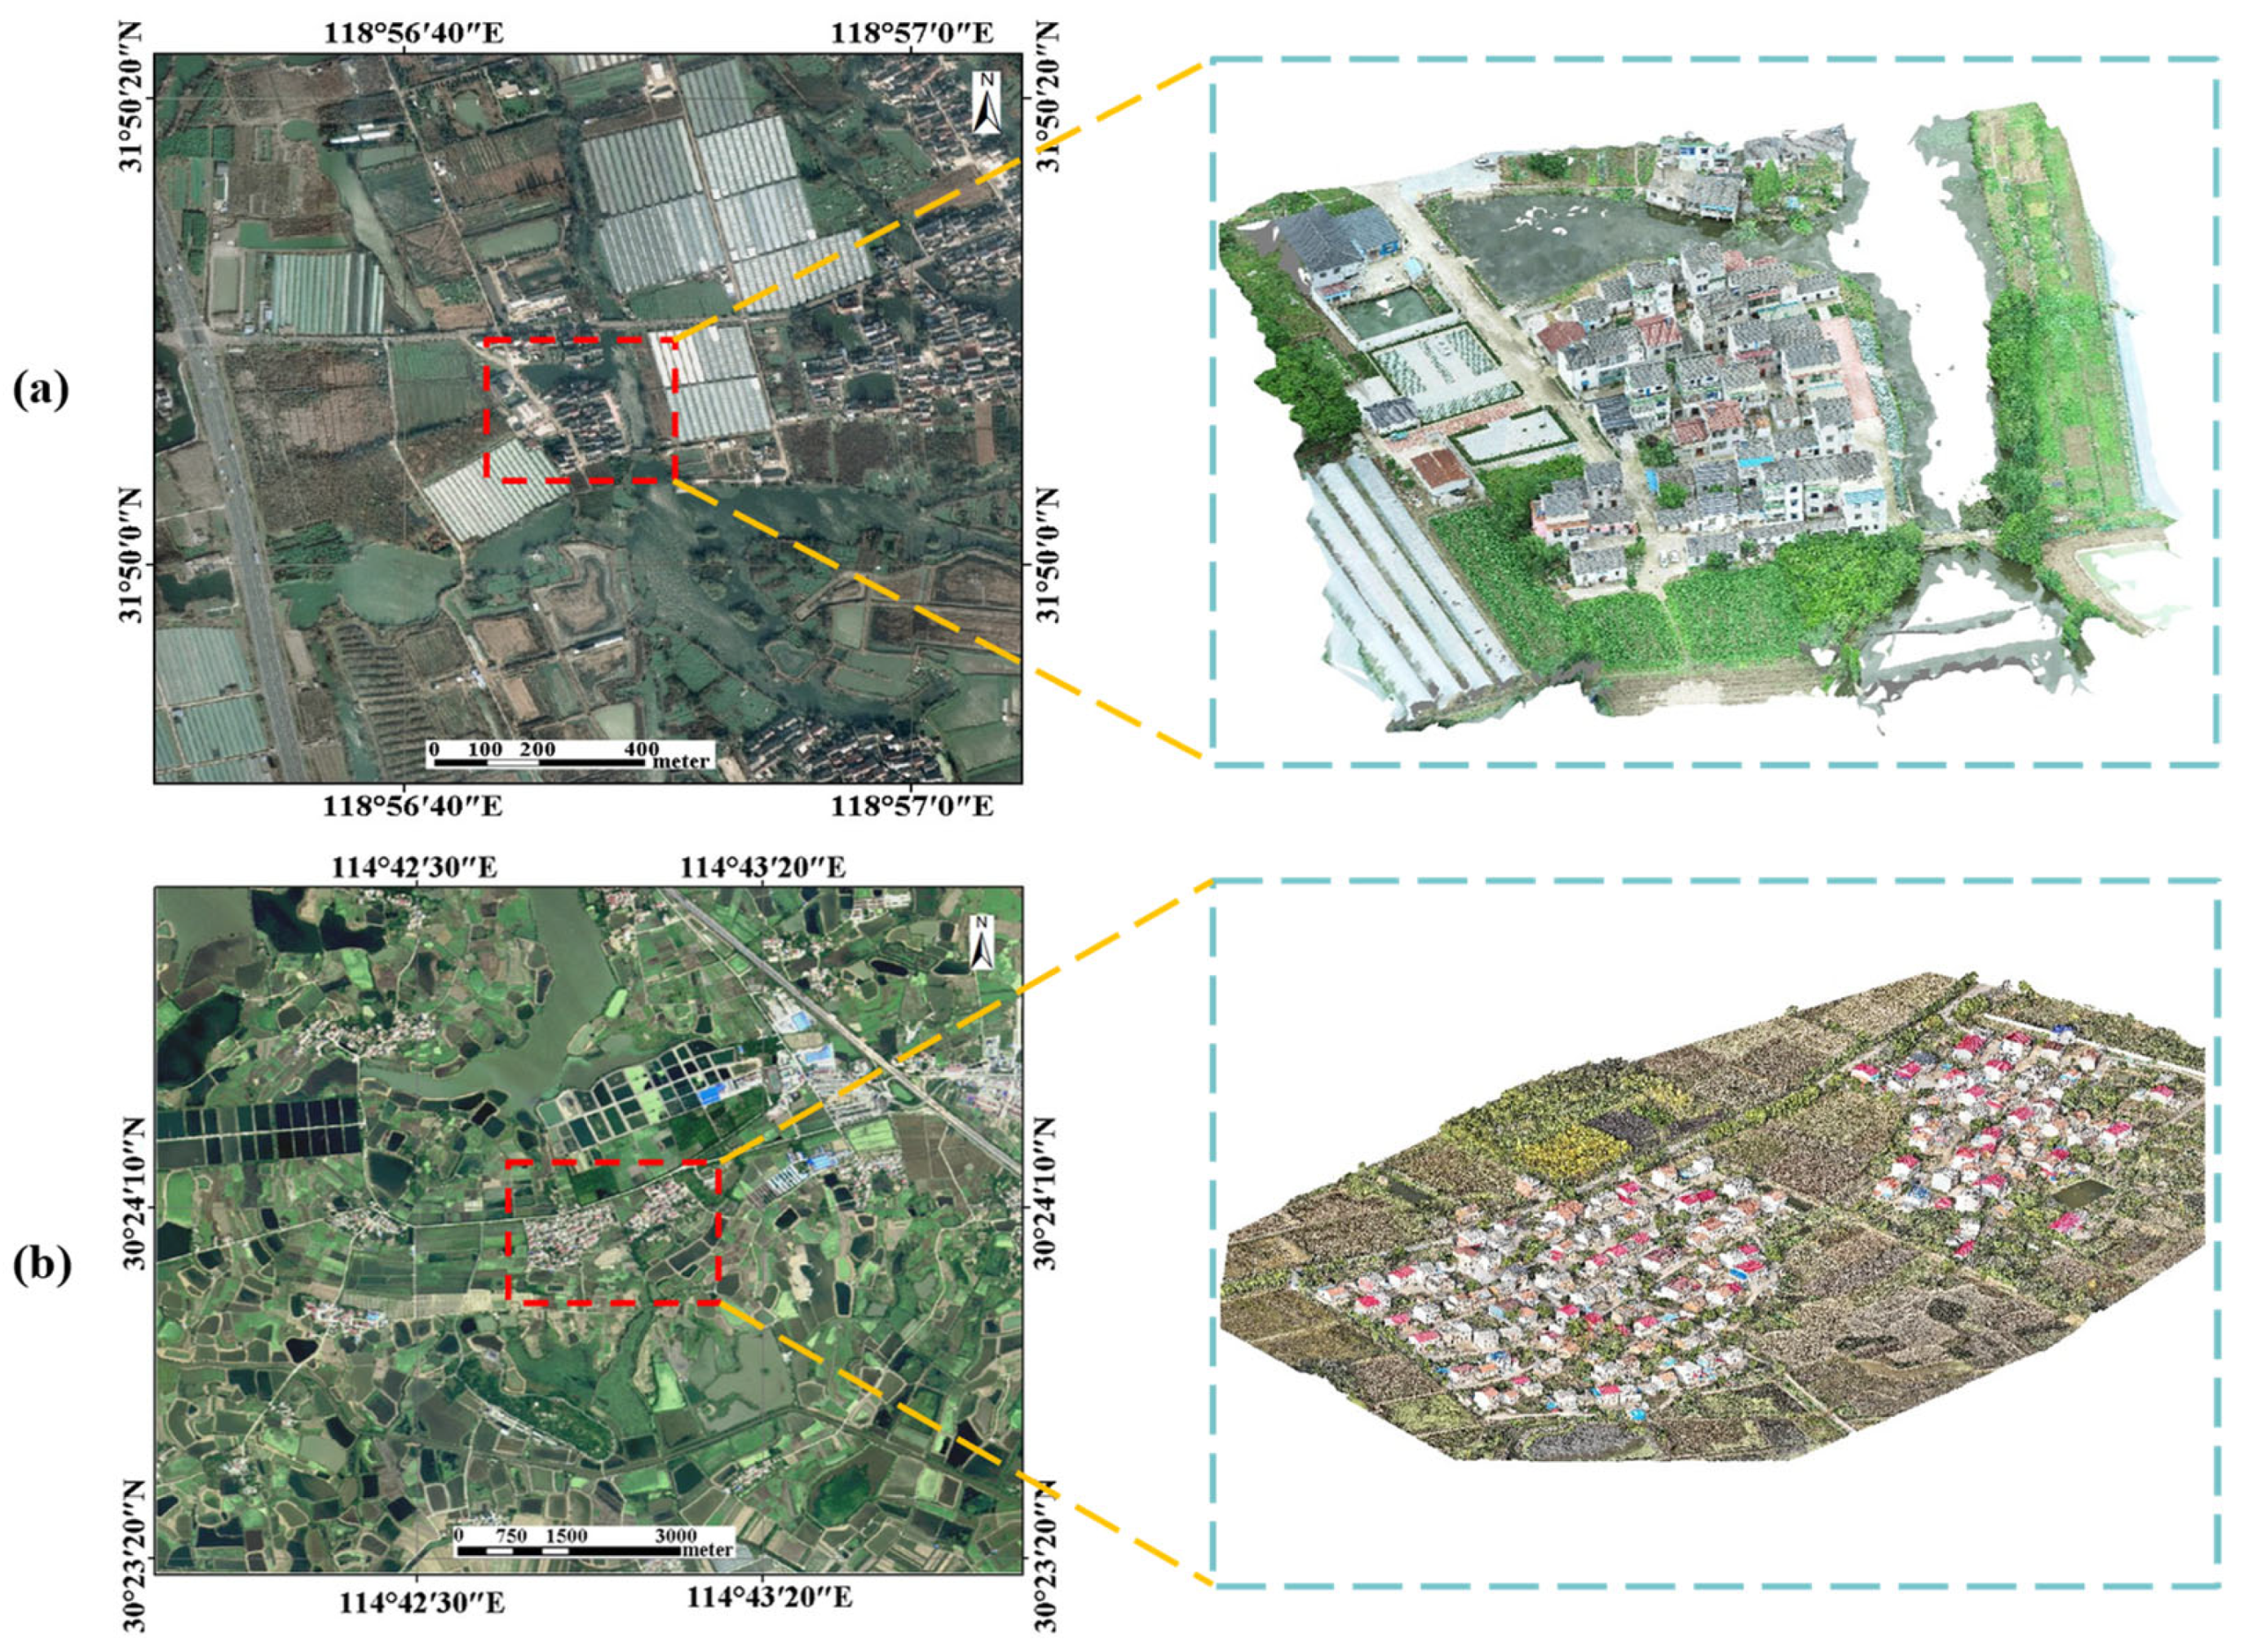
3.1. Datasets

The performance of the proposed framework for estimating FOR was evaluated in rural areas of Nanjing and Ezhou, as depicted in Figure 1. The Nanjing study area, a village under Nanjing City’s jurisdiction in Jiangsu Province, China, lies in the eastern part of the country, while the Ezhou study area, a village under Ezhou City in Hubei Province, is situated in central China. Seismic activity in these regions is less pronounced than in western China, with no significant earthquakes recorded in modern times, rendering historical data-based seismic vulnerability analysis impractical. Nonetheless, Nanjing sits on the southern edge of the North China earthquake zone, near the Tan-Lu fault, making it susceptible to moderate-to-strong earthquakes. Similarly, Ezhou lies within the seismic zone of the middle Yangtze River reaches, where weak activity belies the presence of faults that could trigger moderate-to-strong events. Both regions are densely populated and primarily composed of masonry structures with load-bearing walls forming the main structural support. Consequently, an earthquake in these regions could result in substantial loss of life and property.
In this experiment, a DJI Mavic 3E RTK UAV was deployed to capture images across the Nanjing and Ezhou study areas, acquiring 1224 and 2604 photos, respectively. Flight parameters were standardized for consistency: an altitude of 60 m, a forward overlap of 80%, and a side overlap of 50%. With an image resolution of approximately 2 cm, multi-angle photography captured building side textures while minimizing occlusions. Following data collection, the high-resolution images were processed to generate real-scene 3D models. Building roof outlines were semi-automatically extracted via manual interaction with the corresponding orthophotos. For analysis, we measured 100 buildings in Nanjing and 180 in Ezhou, encompassing 400 and 720 façades, respectively, with a total of 1876 windows and 311 doors.
Additionally, to evaluate the effectiveness of our façade generation method, we measured comprehensive building structure information in both study areas using a total station. We then calculated the actual FOR for each building to provide a ground truth for comparison.

3.2. Methods

The proposed framework in this study for estimating FOR from a UAV-derived 3D model is shown in Figure 2. It consists of four steps: (1) generating rural building façades from the 3D model generated by UAV photogrammetry; (2) constructing a pretraining dataset using publicly available datasets, enhanced by a vanishing point image correction technique to address perspective distortions; (3) training a modified CNN model using the pretraining dataset, then fine tuning it with annotated rural façade data and segmenting façade openings from façade images using the trained model; (4) segmenting walls through simple spatial analysis on a depth image corresponding to the façade image and calculating FOR for each building façade.

3.2.1. Front-View Façade Image Generation

UAV close-range photogrammetry can generate high-precision 3D reconstruction through advanced pipelines. These pipelines produce detailed 3D models that capture both the geometric structure of photographed buildings and rich façade textures, aiding in building parsing tasks. Typically represented as textured triangular meshes, these models offer continuous 3D surfaces ideal for visualization but pose challenges for direct processing and analysis. Extracting FORs from a building’s façade directly within such a 3D format is particularly difficult due to the complexity of mesh-based data. To address this, we propose a method that transforms 3D models into 2D orthoimages and back to 3D, generating orthogonal images for each building façade at a specified resolution, thereby simplifying subsequent analysis.
To extract the façade of each building, we first determine its location and dimensions using its roof outlines. The process begins by projecting the 3D model onto a horizontal plane at a specified resolution, generating a 2D true digital orthogonal model (DOM). From this, the roof outlines of the building are identified through manual, semi-automatic, or fully automatic methods. Next, we segment the 3D model into individual buildings based on the geographic bounds of each roof outline’s bounding rectangle. To preserve structural integrity during segmentation, particularly to account for wall protrusions that might otherwise be excluded, the bounding rectangle is extended outward by a suitable margin.
Once individual buildings are isolated, we leverage their roof outlines to determine the orientation of each façade based on the edges of the roof outline polygon. Since walls are typically perpendicular to the ground, we focus exclusively on their horizontal orientation. To achieve this, we order the roof outline polygon’s vertices in a counterclockwise direction and extract the start and end points of each edge, denoted as  x i s , y i s  and  x i e , y i e , respectively. Using Equation (1), we then compute the outward-facing orientation of the façade corresponding to each edge:
n = y i e y i s ,   x i s x i e ,   0 T
Using this orientation, we construct a rotation matrix to transform the model into a local coordinate system, denoted as  o x y z , with specific properties: the  x -axis lies in the horizontal plane, the  y -axis points vertically upward, and the  z -axis aligns with the orientation of the façade. Mathematically, the  x -axis is defined as the intersection of the horizontal plane and the vertical plane containing the façade. Applying the right-hand rule, we derive the corresponding axis orientations accordingly:
z e = n n x e = z e × z e y e = z e × x e M = x e , y e , z e
where  n  represents the orientation of the façade, and  z e = 0 ,   0 , 1 T  is the basis vector of the  z -axis in the world coordinate system. In the local system, the basis vectors are  x e , y e , z e , corresponding to the  x y , and  z  axes, respectively. The rotation matrix  M  aligns the model from the coordinate axes of the world coordinate system to the coordinate axes of the local coordinate system  o x y z . The notation     denotes the vector norm, and  ×  represents the vector cross product.
Next, we calculate the bounding box of the building model using its vertex coordinates to determine the starting point  X s ,   Y s ,   Z s . This facilitates the transformation of any point within the building from coordinates  X ,   Y ,   Z  in the world coordinate system to coordinates  X , Y ,   Z  in the local coordinate system  o x y z . The transformation relationship is expressed as follows:
X Y Z = M X Y Z X s Y s Z s
Finally, the building model is transformed into the local coordination system. At this point, the building facade is facing upwards, and a 2D texture image and a corresponding depth image of the façade can be generated through simple orthogonal projection and rasterization. These images are then cropped based on the footprint’s edge lengths to ensure they accurately encompass the intended façade range.
This method simplifies subsequent processing by transforming complex three-dimensional surfaces into easily manageable 2D images, fully leveraging the advancements in UAV photogrammetry technology. Additionally, it eliminates the need for time-consuming and costly field investigations while circumventing the challenges of extended manual interactions and façade fragmentation issues inherent in processing original oblique images.

3.2.2. Alignment Between Street-View and Front-View Façade Images

Data annotation is a critical yet time-consuming and labor-intensive step in deep learning pipelines. While some publicly available datasets offer door and window annotations for training, many are designed for street-view image segmentation and exhibit significant perspective distortion, limiting their utility for accurate prediction on orthogonal façades. To address this issue, we perform automatic rectification of the images into an orthogonal view using a homography matrix, which encodes the projective transformation between two perspectives of a planar surface. Our aim is to eliminate perspective distortion, restoring the spatial parallelism and verticality of building façades. Considering the predominant horizontal and vertical orientations in building façades, we utilize a vanishing point detection method to estimate these directions and subsequently perform image rectification based on the identified perspective geometry [27].
Preprocessing begins by selecting images with perspective distortion for correction, while undistorted samples are retained. Next, a line detection algorithm [49] extracts lines from the distorted images, filtering out those shorter than a specified length threshold to enhance robustness. These lines are then classified into vertical and horizontal dominant directions based on their angles relative to the horizontal axis. Subsequently, the RANSAC algorithm [50] discards unreliable lines and computes the horizontal and vertical vanishing points  v h  and  v v , respectively. The detailed workflow is illustrated in Figure 3.
After obtaining the two vanishing points, the perspective transformation matrix is derived, as presented in Equation (4) [14]:
l = l a l b l c T = v h × v v H = 1 0 0 0 1 0 l a l b l c v v = H v v R = c o s θ s i n θ 0 s i n θ c o s θ 0 0 0 1 H = H R
Here,  l  denotes the vanishing line, computed as the cross product of the horizontal and vertical vanishing points  v h  and  v v  in homogeneous coordinates. The components of  l , denoted as  l a l b , and  l c , are used to construct a homography matrix  H , which is then applied to transform the vertical vanishing point  v v , resulting in a new vector  v v . The  θ  is the angle between the homogeneous vector  v v  and the canonical vertical direction  0 , 1 , 0 . Finally, the complete transformation matrix is defined as  H , which incorporates both the initial homography and a subsequent rotation.
The mask ground truth for each image is corrected using the same homography transformation  H , and the bounding box ground truth is recalculated by deriving the bounding rectangle for each door and window segmentation instance. This process markedly enhances accuracy by eliminating skewed angles in building façades, aligning the context of door and window annotations more closely with the bounding box representations. Although these images originate from urban rather than rural buildings, extensive research demonstrates that pretraining models on analogous images can boost their expressive power [51], reducing the demand for additional rural-specific data annotation.

3.2.3. Improved Deep Learning Network for Façade Opening Extraction

The task of extracting openings from rural building façades can be formally framed as an object detection problem. However, the application of standard deep learning detection pipelines may fail to incorporate prior knowledge about architectural façades, such as the typical uniformity in window sizes, their alignment in horizontal or vertical grid patterns, or the common placement of doors near the ground, often positioned at the horizontal midline of the façade. Leveraging this prior knowledge, as supported by previous studies [23,47], can enhance detection accuracy. Accordingly, we developed a tailored deep learning network that incorporates these façade-specific characteristics to identify building openings, as depicted in Figure 4.
The network, as illustrated in Figure 4, adopts a classic two-stage object detection framework. Initially, a backbone extracts features from the input image, feeding them into the Region Proposal Network (RPN) [52], which generates rough opening proposals as the first stage. Subsequently, the ROI Pooling module [52] extracts refined features from the backbone based on these proposal boxes. To implicitly encode door and window size and position priors, we generate bounding box relationship features using the proposal coordinates and dimensions  x ,   y ,   w ,   h . These features, combined with the ROI-extracted features, are then processed by a multi-head self-attention module [53]. Multiple attention layers enhance the output, which is used for final classification and precise bounding box regression. Notably, detection occurs across multi-scale feature maps, though Figure 4 simplifies this by depicting only the final detection head.
For the  m t h  and  n t h  proposals, the bounding box relationship feature is generated as  ( log x m x n w m , log y m y n h m , log w n w m , log h n h m ) , which is a modified version of the widely used bounding box regression target. The embedding approach builds upon the standard absolute position encoding [54] and is individually applied to each component of the relationship feature:
P E x 2 i = sin x / 10 , 000 2 i / d model P E x 2 i + 1 = cos x / 10 , 000 2 i / d model
where  x  represents the input features, specifically, each component of the bounding box relationship feature, while  d model  denotes the dimension of each attention head.
Each component of the bounding box relationship feature is embedded using Equation (5). This approach leverages attention mechanisms to implicitly learn distribution relationships and size connections among opening instances, thereby improving opening recognition. Moreover, it introduces only minimal additional computation. The training loss remains based on standard object detection loss functions [52]:
L = L c l s + λ L b b o x
Furthermore, we employ transfer learning (TL) to enhance network performance. Specifically, we treat training samples collected from urban areas as the source domain, using them to improve the predictive objective function for our target task in the rural domain. To accomplish this, we transfer the parameters, specifically the weights, from all stages of the pretrained model to initialize the fine-tuning process, ensuring that the model benefits from previously learned representations.

3.2.4. Wall Area Extraction and FOR Estimation

After determining the area of façade openings, calculating the wall area is equally critical. Relying solely on façade texture image is prone to inaccuracies due to variations in wall appearance and lighting. To overcome this, we integrate the texture and depth images generated in Section 3.2.1., leveraging their complementary strengths. The depth map, unaffected by lighting conditions, employs region-growing techniques, while the texture image uses simple spatial analysis. By combining these results, we obtain a robust final estimate of the wall area. The FOR is then calculated as the ratio of the opening areas (doors and windows) to the wall area within the image.

4. Results

4.1. Baselines and Evaluation Metrics

Since the primary goal of this study is to validate the feasibility and accuracy of estimating the FOR using real-scene 3D models, we use two other representative FOR estimation methods based on UAV images as baselines for comparison.
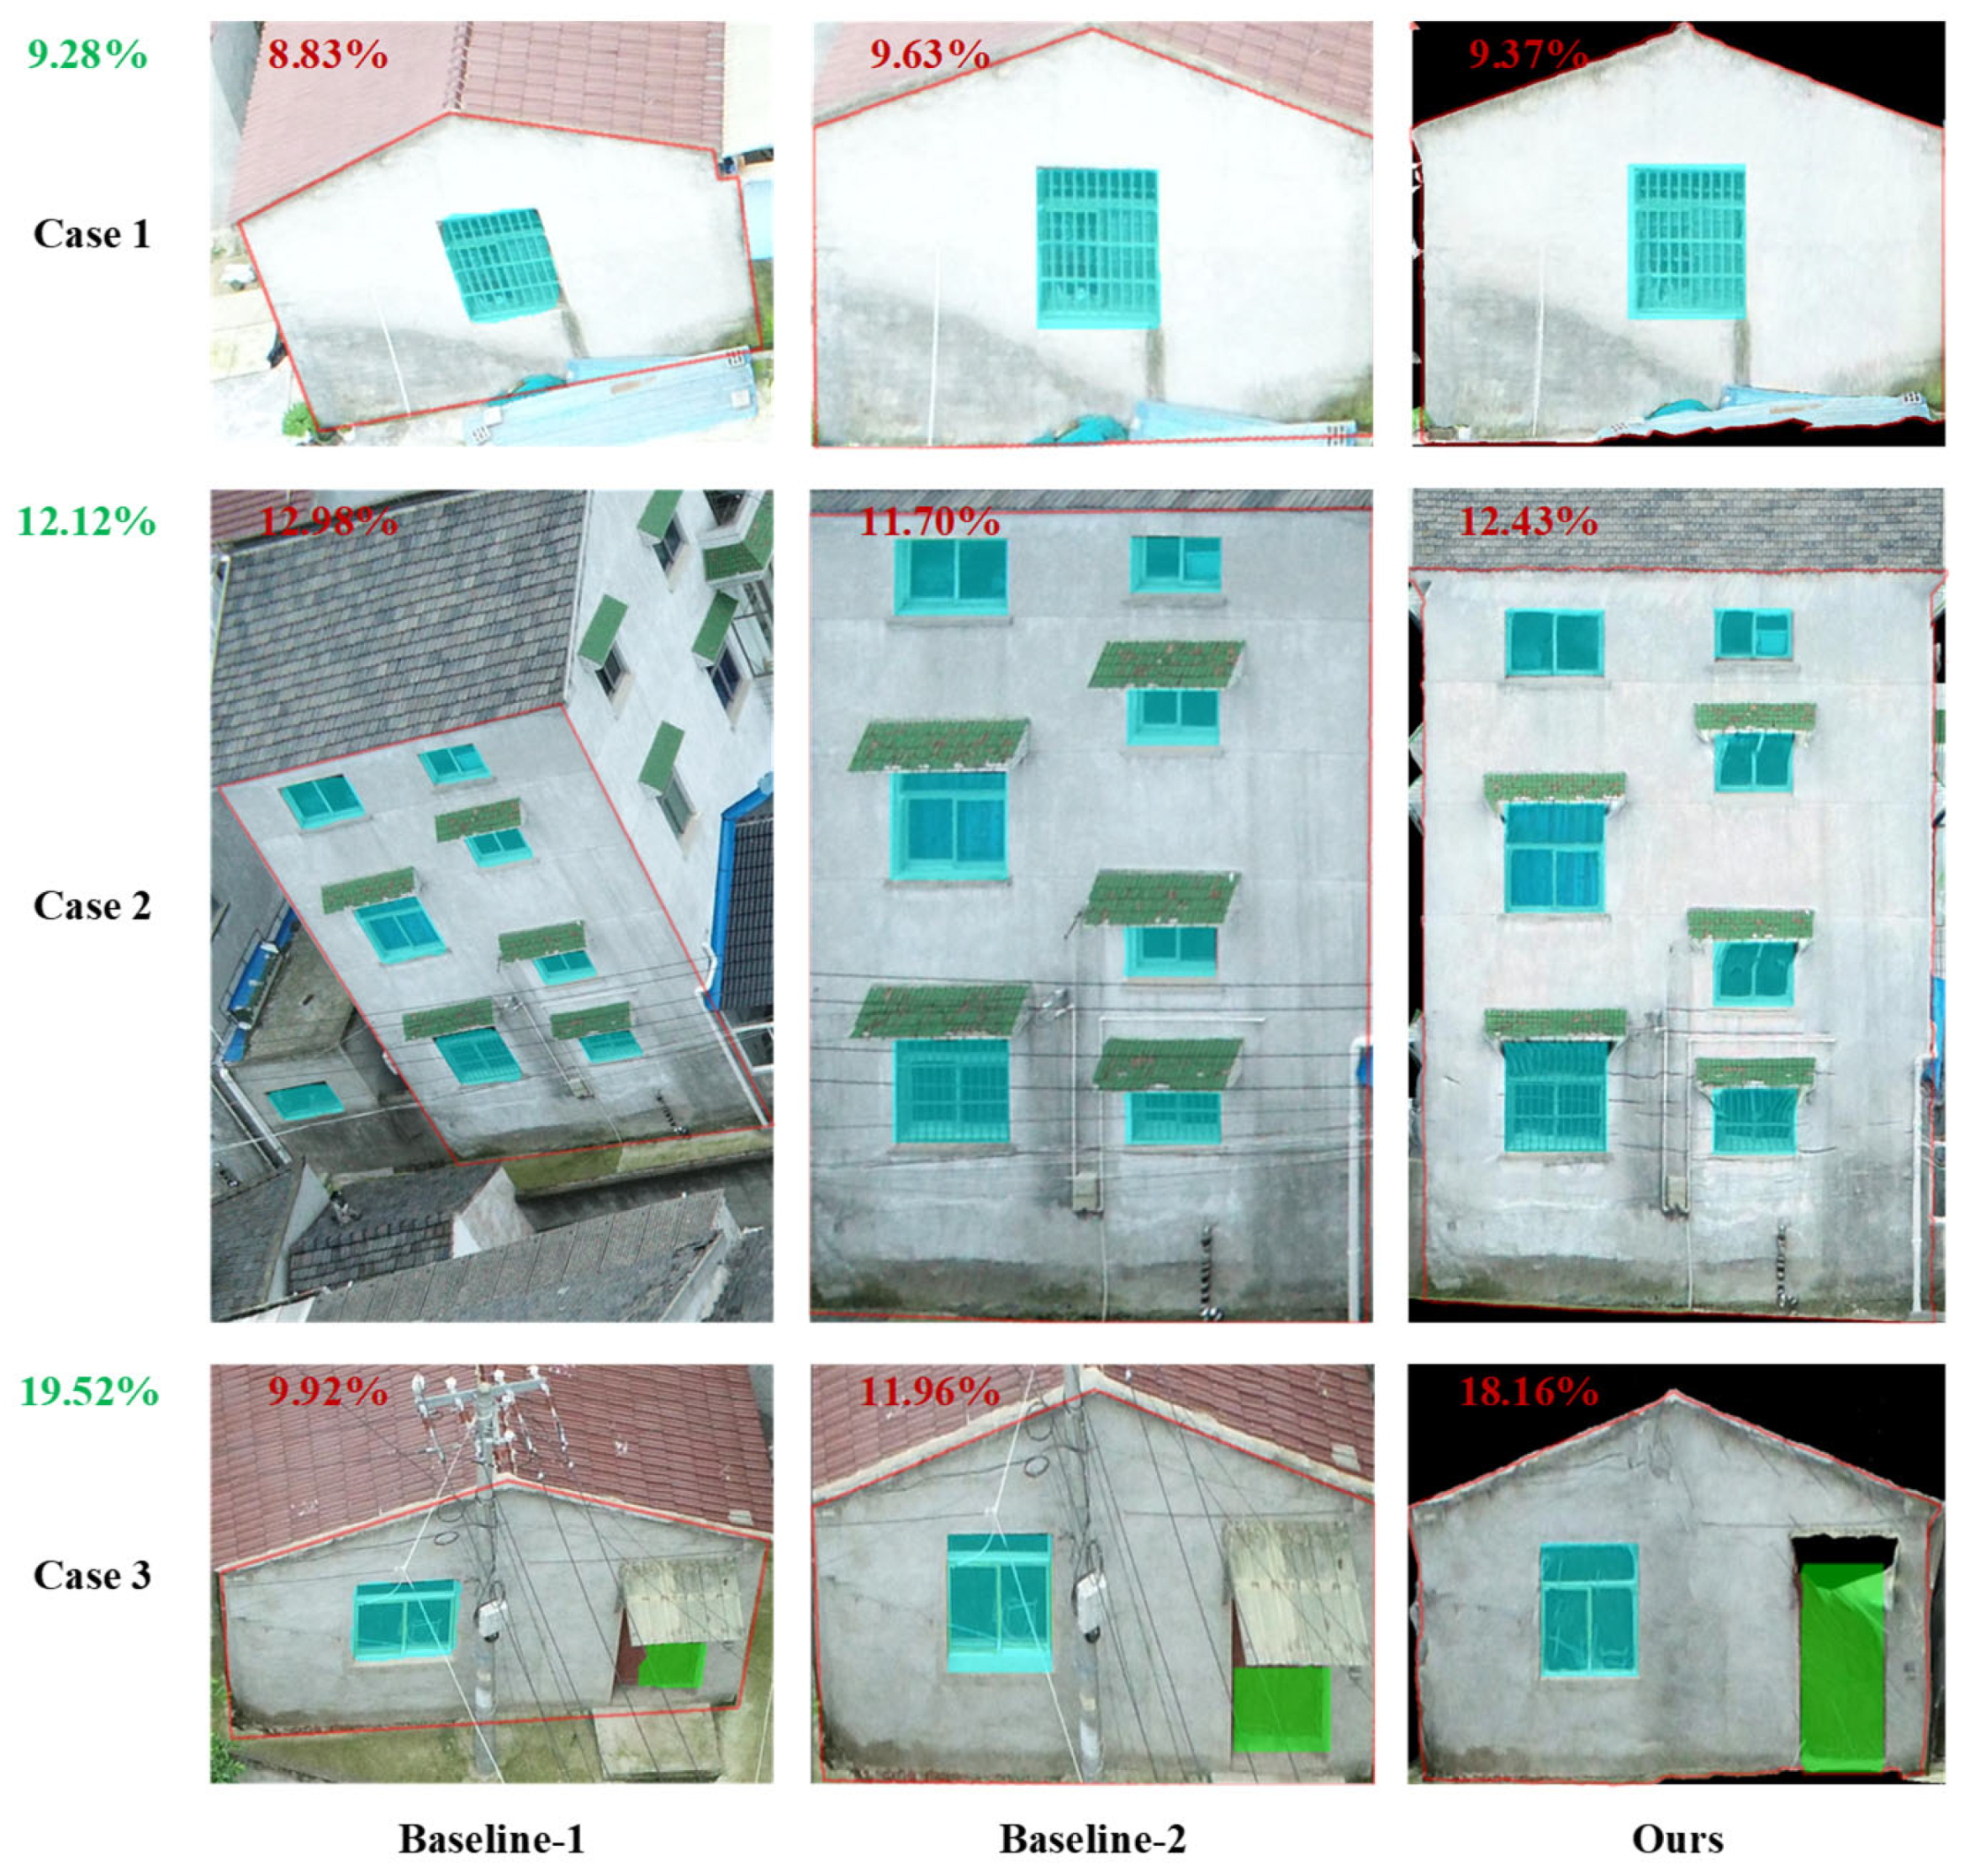
  • Baseline 1: Raw Image Extraction.
This baseline can be understood as the direct application of existing street-view image-based door and window extraction methods [21,22,55,56] to FOR estimation. It involves extracting doors and windows directly from raw, uncorrected UAV images to estimate the FOR. To ensure a fair comparison with our method, which relies on the building’s roof outline as input, the true façade outlines are projected onto the raw images. The image that provides the most complete and frontal view of the façade is selected for analysis.
  • Baseline 2: Homography Correction.
This baseline improves upon Baseline 1 by addressing the distortions present in raw images. Specifically, it utilizes the 3D ground truth coordinates of the façade’s corner points to perform homography transformation, which projects the raw image into the object space. This corrected image is then used for door and window extraction and FOR estimation. Due to factors such as eaves occlusion, the corrected image may fail to capture the complete outlines of doors and windows.
While both baselines share algorithmic similarities with our approach outlined in Section 3.2.3., their input data differ fundamentally. The baselines utilize conventional inputs, such as oblique images with inherent perspective distortion or manually corrected versions. In contrast, our method leverages façade images derived from real-scene 3D models, effectively eliminating both perspective distortion and the necessity for manual correction. Notably, for Baseline 1, we enhanced the opening extraction network with a segmentation branch to predict masks for each opening, ensuring a fair comparison. Given that our method incorporates lens distortion correction during the 3D reconstruction process, radial symmetric distortion is also removed for Baseline 1 and Baseline 2 using standard photogrammetric procedures. This ensures consistency across methods and mitigates the potential negative effects of distortion on the results.
To assess the practical usability of our method, we compare the estimated FORs with the actual FOR. In this study, we calculate the FOR by directly identifying the pixels corresponding to doors, windows, and walls and then computing their ratio. To quantify the accuracy of these estimates across different methods, we use the mean absolute error (MAE) and mean relative error (MRE) to measure the deviation between the estimated FORs and the ground truth.
MAE = 1 n i = 1 n r ^ i r i MRE = 1 n i = 1 n r ^ i r i r i
where  r ^ i  is the estimated FOR of each building façade, and  r i  is the FOR ground truth of the building facade.
Additionally, classifying pixels in the image is a fundamental step in estimating FORs, and its effectiveness can be evaluated using segmentation accuracy metrics. These metrics include Pixel Accuracy (PA), Intersection over Union (IoU), Precision (PRE), Recall (REL), and F1 Score. In this study, we employ PRE, REL, and IoU to assess the model’s overall segmentation performance. PRE measures the accuracy of each predicted class, reflecting the proportion of correctly identified pixels within that class. REL evaluates the completeness of each class, indicating how well all relevant pixels are captured. IoU quantifies the overlap between predicted and ground truth regions for each class following semantic segmentation. The formulas for PRE, REL, and IoU are presented below:
PRE = p i i j = 0 k p j i REC = p i i j = 0 k p i j IOU = p i i j = 0 k p j i   +   j = 0 k p i j p i i
here,  k  represents the number of classes,  p i i  represents the number of pixels correctly identified as class  i p j i  represents the predicted value for class  i , and  p i j  represents the actual value for class  i .

4.2. Implementation Details

During façade generation, individual buildings are segmented by expanding their roof outline by 0.5 m. In the pretraining data collection phase, a length threshold of 30 pixels is set for line segments. For automatic opening extraction, we implement our model using the Detectron2 framework [57], training it on a single A6000 GPU. We adopt Faster R-CNN [52] with a ResNet-50 [58] backbone, pretrained on ImageNet [59], as the baseline model, incorporating two attention modules while retaining default settings for other parameters. The model is trained using synchronized stochastic gradient descent (SGD) with a minibatch size of two images, an initial learning rate of 0.005, a weight decay of 0.0001, and a momentum of 0.9. For the absolute position encoding, the head dimension  d model  is set to 64. Additionally, the weight coefficient λ in the training loss function is set to 1.
The pretraining datasets are sourced from publicly available datasets, including CMP [24], ECP [23], Graz50 [25], ParisArtDeco [60], eRTIMs [61], LabelMeFacade [62], and Ruemonge [63]. These images are subjected to orthogonal correction using the method outlined in Section 3.2.2. to remove perspective distortion, followed by visual inspection for quality assurance. This process results in a curated set of 3000 images containing 5896 doors and 24,582 windows. The datasets exhibit substantial design diversity and span a wide range of qualities and resolutions.
Pretraining spans 36 epochs on multi-scale images (ranging from 1333 × 480 to 1333 × 960), with random horizontal flipping applied. Façade images generated from real-scene 3D models, along with street-view-like oblique images, are split into training and validation sets at a 4:1 ratio based on façade IDs. In the fine-tuning phase, we train for 24 epochs. Other settings are the same as in the pre training phase. During the inference, non-maximum suppression (NMS) with a threshold of  σ  = 0.5 is applied for post-processing.

4.3. Overall Results

4.3.1. FOR Estimation Evaluation

To evaluate the effectiveness of our generated façades, we compare them against two baselines: cropped original oblique images and manually rectified images. Figure 5 displays the residuals between the ground truth FOR and the estimated FOR using the proposed method and two baseline methods. In general, the points representing the proposed method are closer to the zero line compared to those of the two baseline methods, indicating higher accuracy in the estimated FOR. Most points representing the Baseline 1 method exhibit a noticeable negative deviation from the zero line, indicating an underestimation of FOR. A possible reason for this underestimation is the distortion in the original oblique image, which may lead to a reduction in the apparent size of doors and windows. For the Baseline 2 method, this underestimation is mitigated by applying the vanishing points image correction method to the oblique images.
As shown in Table 1, the proposed method achieves the highest accuracy in estimating FOR on the Nanjing case dataset, with an MAE of 0.02 and an MRE of 12%, achieving an MRE improvement of 22% and 5% compared to the Baseline 1 and Baseline 2 methods, respectively. Furthermore, the proposed method demonstrates similar accuracy and improvement on the Ezhou dataset, demonstrating its precision and robustness.

4.3.2. Façade Opening Extraction Evaluation

Table 2 presents the accuracy metrics for façade opening segmentation using the proposed method alongside two baseline approaches. Overall, except for the PRE of doors, the proposed method achieves higher accuracy metrics than both baseline algorithms, with a greater improvement over Baseline 1 compared to Baseline 2. This is because orthogonal correction in Baseline 2 mitigates distortion, leading to improved precision. However, information loss due to large viewing angle disparities persists, resulting in gaps in recall and IoU compared to our generated façade images, particularly in the door category. Among the three metrics, the proposed method shows the most significant improvement in IoU, with a greater enhancement for doors than for windows. This is attributable to the fact that distortion substantially impairs accuracy, and doors, being located farther from the camera than windows, experience a more pronounced reduction in IoU due to the exacerbated effects of perspective distortion.
Figure 6 shows results of façade openings extraction from different input images across three case buildings in Nanjing area.
As shown in the subfigures in the first column of Figure 6, the extraction of doors and windows from original oblique images is affected by perspective distortion and occlusion. In the second column, perspective distortion is mitigated in the result from the corrected oblique images, but occlusion remains an issue due to the observation angle. Both perspective distortion and occlusion contribute to increased uncertainty in FOR estimation. Compared to the first and second columns, the subfigures in the third column show that façade openings extracted from the generated front-view façade images delivers the best performance, leveraging both texture and geometric data from real-scene 3D models. Multi-view synthesis during 3D reconstruction [64] further mitigates occlusion issues inherent in single images, underscoring the effectiveness and practicality of our approach in generating building façade images from real-scene 3D models.

5. Discussion

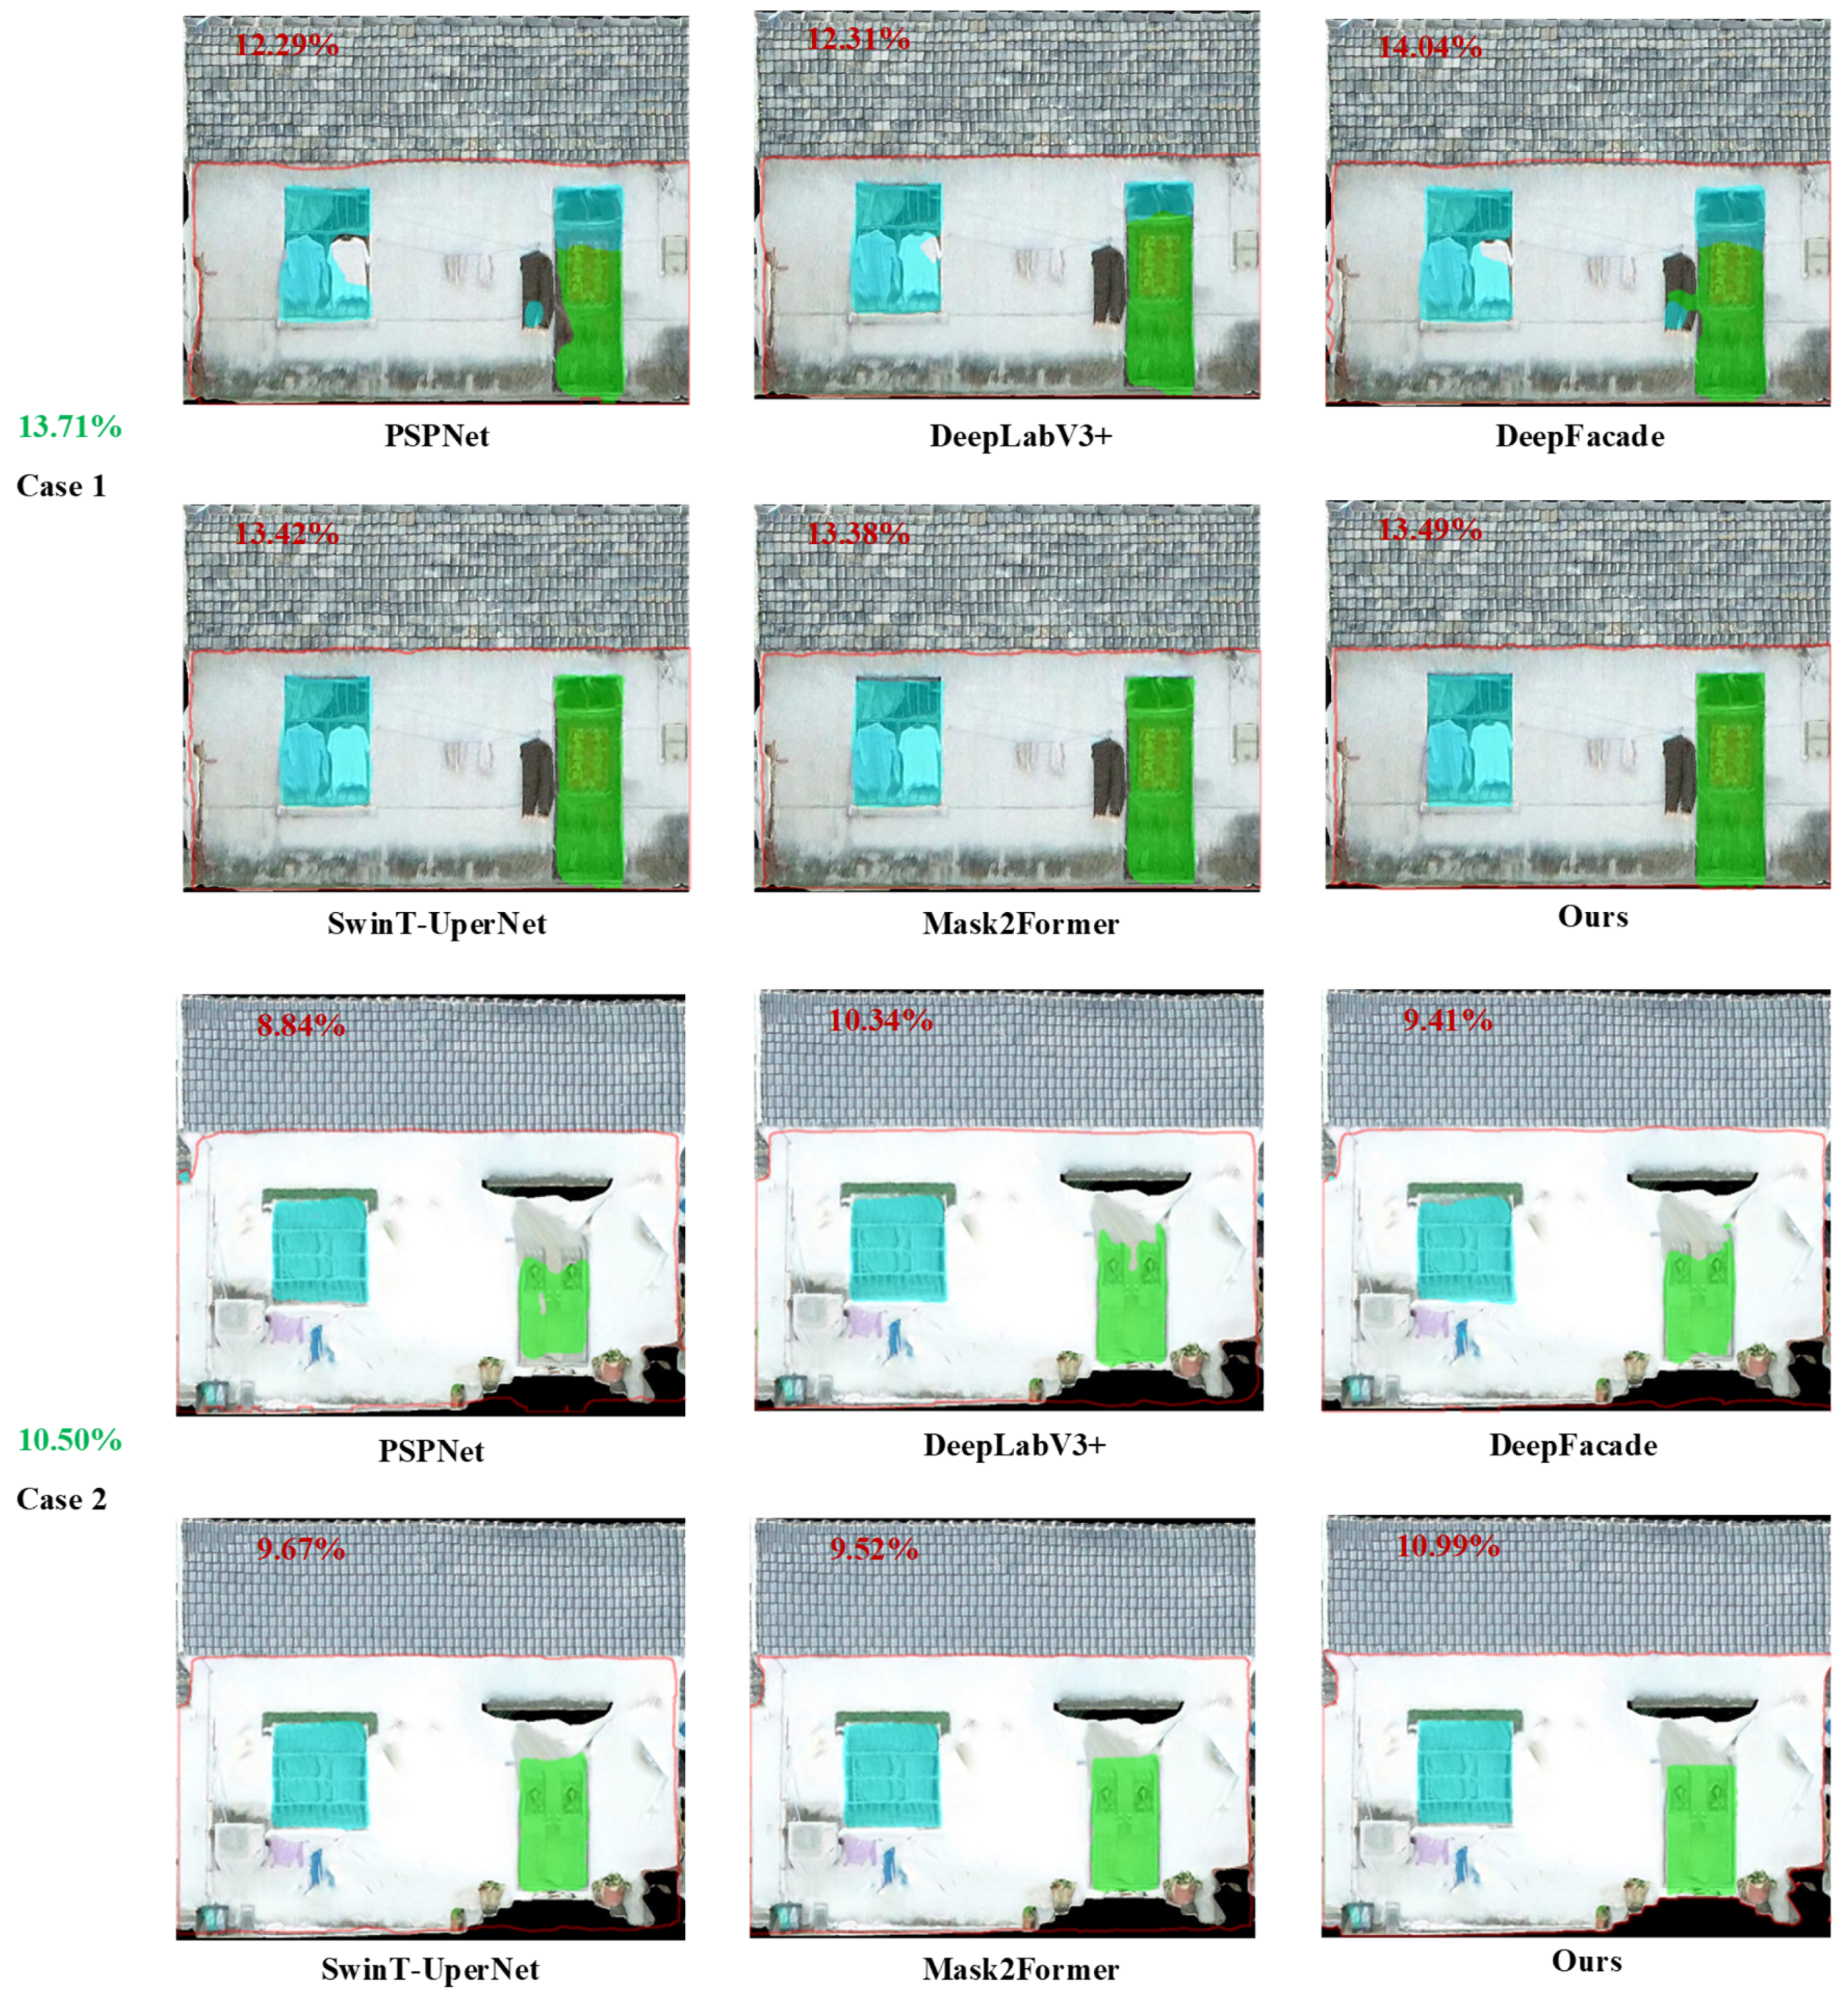
5.1. Comparison with Other Deep Learning Networks

Five state-of-the-art models were used for façade segmentation and compared with our method: PSPNet [65], DeepLabV3+ [66], DeepFacade [48], SwinT-UperNet [67], and Mask2Former [68]. The first two are advanced semantic segmentation approaches known for their excellent performance in general tasks, while DeepFacade is an advanced façade parsing method that has demonstrated superior results across multiple public datasets. SwinT-UperNet and Mask2Former integrate recent advancements in transformer-based methods, representing state-of-the-art approaches in semantic segmentation. All methods were implemented using their default settings, with the generated façade images serving as the input.
As shown in Table 3, our method outperforms the comparison methods on most indicators, particularly achieving higher IoU scores for doors and windows. Since IoU is a comprehensive performance metric, these results clearly highlight the superiority of our approach. Additionally, our method recorded the lowest MAE and MRE values. The MRE of our method showed an improvement of 1% and 2% compared to state-of-the-art segmentation methods, further demonstrating its high practicality.
Among the methods of comparison, PSPNet and DeepLabV3+ are advanced deep learning-based semantic segmentation approaches. Table 3 shows that they effectively segment windows and walls, validating their robustness. However, PSPNet achieves high precision for doors but suffers from low recall, suggesting that class imbalance hinders its performance on minority categories like doors. DeepFacade, tailored for façade parsing, underperforms due to weaker artificial priors in rural buildings and its reliance on early FCN networks, resulting in suboptimal outcomes. DeepLabV3+ yields results close to our method but remains slightly inferior, with its calculated MAE and MRE for the FOR also higher than those achieved by our method. SwinT-UperNet and Mask2Former also exhibit strong performance, particularly in the more challenging door category, and perform competitively against our approach. Nonetheless, our method consistently outperforms all others across various metrics. This can be attributed to the integration of prior architectural knowledge regarding building facades, which facilitates the generation of results that more precisely correspond to the regular geometries of doors and windows.
Figure 7 presents segmentation results for doors, windows, and walls from the Nanjing and Ezhou areas.
In the visualizations, red contours outline wall areas, cyan indicates windows, and green marks doors. In Case 1, clothes draped over a window obscure its context, causing PSPNet to misclassify window pixels as the wall category and DeepFacade to label wall pixels as openings. Both methods also struggle with class imbalance, frequently confusing doors with windows due to their similar appearances, highlighting persistent shortcomings despite the strengths of segmentation-based approaches. In contrast, our method uses bounding boxes to delineate doors and windows, yielding more uniform segmentation results. By targeting objects rather than pixels, it reduces the effects of class imbalance. DeepLabV3+, SwinT-UperNet, and Mask2Former produce more accurate results overall, successfully identifying the majority of door and window regions. However, DeepLabV3+ still suffers from misclassification issues. While SwinT-UperNet and Mask2Former produce results comparable to ours, their outputs show noticeable inaccuracies around object boundaries. In contrast, our method maintains sharper and more precise delineations, primarily due to the incorporation of prior knowledge regarding the regular geometric shapes of doors and windows, whereas their approaches are designed for more general semantic segmentation tasks. Case 2 reinforces these findings: segmentation-based methods tend to over-smooth edges and corners of doors and windows, whereas our approach maintains robust, regular, and complete opening instances. Additionally, our wall extraction method effectively captures façade wall regions, and the precise extraction of both openings and walls enables our approach to achieve the most accurate FOR estimation.
Figure 8 presents a heatmap illustrating the residual distribution between FORs estimated by various methods and those ground truths obtained from on-site manual surveys. The horizontal axis indicates the magnitude of the residuals, while different colors denote the percentage of FORs falling within each residual range relative to the total count.
The residual distribution of FORs estimated by our proposed method is tightly clustered between −0.02 and 0.02, outperforming comparative approaches. In contrast, PSPNet and DeepFacade exhibit less favorable distributions, with residuals primarily ranging from −0.06 to 0.03 and spreading across additional intervals. This dispersion reflects their limited ability to capture the structured nature of façades, leading to inaccurate FOR estimates. DeepLabV3+ produces results closer to ours, but its residuals are more widely distributed, likely due to a slight influence from class imbalance. The FOR residuals computed by SwinT-UperNet and Mask2Former are close to those of our method, but their distributions are less concentrated, suggesting reduced consistency. While these methods may perform well in other contexts, they struggle to accurately delineate façade openings. These findings underscore the superior robustness of our approach in estimating façade FORs.

5.2. Effectiveness of the Pretraining with Style-Adapted Publicly Available Datasets

To evaluate the impact of pretraining data, we compared three scenarios: no pretraining, pretraining with original images, and pretraining with corrected images. Table 4 summarizes the results, which reveal distinct performance differences across these approaches. Batch image tests across each category showed varying degrees of improvement, with the most significant enhancement observed in the door category, where IoU scores increased by 26%. In contrast, the window category exhibited only a slight improvement, likely due to its already high baseline IoU scores. Moreover, irrespective of whether the publicly available datasets underwent orthogonal correction, the pretraining scheme consistently improved all indicators, especially for the door category. This may be attributed to the fact that the study area contains fewer doors than windows, enabling the network to learn more effective features from the pretraining process. Additionally, using pretrained data that have undergone orthogonal correction further enhances segmentation accuracy for both doors and windows. Since door and window targets are determined based on their outer bounding boxes, the corrected training samples align more closely with these bounding boxes and object borders, allowing the network to learn more precise features.

5.3. Applicability

Besides accuracy, the practical feasibility of the proposed method is a critical factor for its deployment in real-world scenarios. Under typical weather and flight conditions, UAV-based image acquisition for a medium-sized rural village (approximately 1000 residents) can be accomplished within one hour. The subsequent data processing pipeline, which includes 3D reconstruction and ortho-façade generation, can be completed within three hours on a standard high-performance workstation (e.g., 32 GB RAM, NVIDIA RTX 3090 GPU). This enables the rapid transformation of raw UAV imagery into high-quality façade data suitable for analysis. Roof delineation, an essential step for identifying building footprints, can be efficiently performed using established semi-automatic photogrammetric tools that can be performed entirely indoors, further contributing to the efficiency and practicality of the workflow. The annotation of training samples and the fine-tuning of the model on the target dataset can also be completed within six hours, making the entire pipeline both time-efficient and operationally scalable. The overall workflow is not only significantly more efficient than traditional manual surveys but also greatly reduces the workload for personnel. The FOR estimation itself is computationally lightweight and takes negligible time.

5.4. Limitations

Despite its strengths, the proposed method has several limitations that warrant further consideration. Firstly, the framework relies on real-scene 3D model data, meaning that low-resolution UAV images or poor-quality 3D reconstructions can adversely affect the accuracy of FOR estimation. Reconstruction errors such as local geometric distortions and texture mismatches may occur due to factors like insufficient image overlaps, low image resolution, occlusions, or challenging lighting conditions. These imperfections can degrade the quality of the ortho-projected façade images, potentially leading to inaccurate or incomplete extraction of façade openings. Although the method remains applicable in these cases, the reliability of the FOR estimation may be substantially compromised. Secondly, the method is primarily tailored to rural masonry buildings, which typically feature simple topological relationships, uniform building materials, and minimal internal complexity. These characteristics make such buildings easier to analyze and process. In contrast, more complex urban areas include irregular building shapes and glass curtain wall structures, making accurate FOR estimation challenging. Lastly, while the proposed method exhibits promising generalization potential, it is not yet capable of true zero-shot transfer. Fine-tuning with a limited set of annotated samples from the target region remains necessary to achieve optimal performance. This requirement may introduce additional labor and resource demands during deployment.

6. Conclusions

The objective of this study is to develop a cost-effective and efficient workflow for estimating the FOR of rural buildings, a crucial parameter for conducting detailed assessments of building safety in the event of an earthquake. Leveraging UAV technology for its inherent cost advantages in data collection, our method provides accurate and comprehensive FOR data that local governments and agencies can use to promptly adjust their earthquake mitigation strategies.
Our approach is based on information from real-scene 3D models to precisely estimate the FOR of rural buildings. To overcome the limitations of existing solutions, specifically their insufficient accuracy and low automation, we propose a novel facade generation method that efficiently extracts building facades from real-scene 3D models. Additionally, to address the challenge of limited training data, we introduce a pretraining strategy using publicly available datasets alongside an effective opening extraction technique.
Quantitative evaluations on two real-world rural datasets demonstrate that our method compares favorably with other classic and state-of-the-art approaches, confirming its practicality and reliability. Moreover, while primarily designed for estimating FORs, our workflow is also adaptable to other applications requiring detailed facade information, such as estimating wall-to-window ratios and analyzing building structures.
Although our evaluation was conducted on two representative rural regions in China, the proposed framework is designed with broader applicability in mind. It can be adapted to other rural areas with similar structural characteristics, provided that UAV photogrammetric data of sufficient quality are available. While the framework demonstrates strong potential for wider application, fine-tuning with region-specific annotated samples is essential to achieve optimal performance. We anticipate that future advancements in computer vision, particularly in areas such as unsupervised pretraining and foundational vision models, will further mitigate the dependence on manually labeled datasets.
Future improvements will focus on two key areas: (1) automating the extraction of building contours from remote sensing data to replace the current semi-automatic building roof outlines determination and (2) exploring novel techniques to alleviate the dependency on annotated samples and improve the model’s adaptability across different regions.

Author Contributions

Conceptualization: P.T. and T.K.; Data curation: Z.N. and K.X.; Formal analysis: Z.N., K.X. and Y.L.; Funding acquisition: T.K.; Investigation: Z.N. and K.X.; Methodology: Z.N., P.T. and T.K.; Project administration: P.T. and T.K.; Resources: P.T. and T.K.; Software: Z.N.; Supervision: P.T. and T.K.; Validation: Z.N., K.X. and Y.L.; Visualization: Z.N., K.X. and Y.L.; Writing—original draft: Z.N., K.X. and Y.L.; Writing—review and editing: P.T. and T.K. All authors have read and agreed to the published version of the manuscript.

Funding

This research was funded by the National Key Research and Development Program of China, grant number 2018YFD1100405.

Data Availability Statement

Data are contained within the article.

Conflicts of Interest

The authors declare no conflicts of interest.

References

  1. Elnashai, A.S.; Di Sarno, L. Fundamentals of Earthquake Engineering: From Source to Fragility; John Wiley & Sons: Hoboken, NJ, USA, 2015. [Google Scholar]
  2. Das, T.; Barua, U.; Ansary, M.A. Factors affecting vulnerability of ready-made garment factory buildings in Bangladesh: An assessment under vertical and earthquake loads. Int. J. Disaster Risk Sci. 2018, 9, 207–223. [Google Scholar] [CrossRef]
  3. Aravena Pelizari, P.; Geiß, C.; Aguirre, P.; Santa María, H.; Merino Peña, Y.; Taubenböck, H. Automated building characterization for seismic risk assessment using street-level imagery and deep learning. ISPRS J. Photogramm. Remote Sens. 2021, 180, 370–386. [Google Scholar] [CrossRef]
  4. Li, M.; Zhu, E.; Wang, B.; Zhu, C.; Liu, L.; Yang, W. Study on the seismic performance of rural houses masonry walls with different geometries of open-hole area reduction. Structures 2022, 41, 525–540. [Google Scholar] [CrossRef]
  5. Liu, Z.; Crewe, A. Effects of size and position of openings on in-plane capacity of unreinforced masonry walls. Bull. Earthq. Eng. 2020, 18, 4783–4812. [Google Scholar] [CrossRef]
  6. Shariq, M.; Abbas, H.; Irtaza, H.; Qamaruddin, M. Influence of openings on seismic performance of masonry building walls. Build. Environ. 2008, 43, 1232–1240. [Google Scholar] [CrossRef]
  7. Kayırga, O.M.; Altun, F. Investigation of earthquake behavior of unreinforced masonry buildings having different opening sizes: Experimental studies and numerical simulation. J. Build. Eng. 2021, 40, 102666. [Google Scholar] [CrossRef]
  8. Tekeli, H.; Aydin, A. An experimental study on the seismic behavior of infilled RC frames with opening. Sci. Iran. 2017, 24, 2271–2282. [Google Scholar] [CrossRef]
  9. Nila, N.D.; Sivan, P.P.; Ramya, K.M. Study on Effect of Openings in Seismic Behavior of Masonry Structures. Int. Res. J. Eng. Technol. 2018, 5, 4712–4717. [Google Scholar]
  10. Wang, J.; Wang, F.; Shen, Q.; Yu, B. Seismic response evaluation and design of CTSTT shear walls with openings. J. Constr. Steel Res. 2019, 153, 550–566. [Google Scholar] [CrossRef]
  11. Tripathy, D.; Singhal, V. Experimental and analytical investigation of opening effects on the in-plane capacity of unreinforced masonry wall. Eng. Struct. 2024, 311, 118161. [Google Scholar] [CrossRef]
  12. Zhang, L.; Wang, G.; Sun, W. Automatic extraction of building geometries based on centroid clustering and contour analysis on oblique images taken by unmanned aerial vehicles. Int. J. Geogr. Inf. Sci. 2022, 36, 453–475. [Google Scholar] [CrossRef]
  13. Fond, A.; Berger, M.-O.; Simon, G. Model-image registration of a building’s facade based on dense semantic segmentation. Comput. Vis. Image Underst. 2021, 206, 103185. [Google Scholar] [CrossRef]
  14. Hartley, R.; Zisserman, A. Multiple View Geometry in Computer Vision, 2nd ed.; 4th Print; Cambridge University Press: Cambridge, UK, 2006. [Google Scholar]
  15. Elkhrachy, I. Accuracy assessment of low-cost unmanned aerial vehicle (UAV) photogrammetry. Alex. Eng. J. 2021, 60, 5579–5590. [Google Scholar] [CrossRef]
  16. Barrile, V.; Bilotta, G.; Nunnari, A. 3D modeling with photogrammetry by UAVs and model quality verification. ISPRS Ann. Photogramm. Remote Sens. Spat. Inf. Sci. 2017, 4, 129–134. [Google Scholar] [CrossRef]
  17. Liu, H.; Zhang, J.; Zhu, J.; Hoi, S.C.H. DeepFacade: A Deep Learning Approach to Facade Parsing. In Proceedings of the Twenty-Sixth International Joint Conference on Artificial Intelligence, Melbourne, Australia, 19–25 August 2017; pp. 2301–2307. [Google Scholar]
  18. Ma, W.; Ma, W.; Xu, S.; Zha, H. Pyramid ALKNet for Semantic Parsing of Building Facade Image. IEEE Geosci. Remote Sens. Lett. 2021, 18, 1009–1013. [Google Scholar] [CrossRef]
  19. Zhuo, X.; Tian, J.; Fraundorfer, F. Cross Field-Based Segmentation and Learning-Based Vectorization for Rectangular Windows. IEEE J. Sel. Top. Appl. Earth Obs. Remote Sens. 2023, 16, 431–448. [Google Scholar] [CrossRef]
  20. Li, C.-K.; Zhang, H.-X.; Liu, J.-X.; Zhang, Y.-Q.; Zou, S.-C.; Fang, Y.-T. Window Detection in Facades Using Heatmap Fusion. J. Comput. Sci. Technol. 2020, 35, 900–912. [Google Scholar] [CrossRef]
  21. Femiani, J.; Para, W.R.; Mitra, N.; Wonka, P. Facade segmentation in the wild. arXiv 2018, arXiv:180508634. [Google Scholar]
  22. Ma, W.; Ma, W. Deep Window Detection in Street Scenes. KSII Trans. Internet Inf. Syst. 2020, 14, 855–870. [Google Scholar] [CrossRef]
  23. Teboul, O.; Simon, L.; Koutsourakis, P.; Paragios, N. Segmentation of building facades using procedural shape priors. In Proceedings of the 2010 IEEE Computer Society Conference on Computer Vision and Pattern Recognition, San Francisco, CA, USA, 13–18 June 2010; pp. 3105–3112. [Google Scholar]
  24. Tyleček, R.; Šára, R. Spatial Pattern Templates for Recognition of Objects with Regular Structure. In Proceedings of the Pattern Recognition: 35th German Conference, GCPR 2013, Saarbrücken, Germany, 3–6 September 2013; Springer: Berlin/Heidelberg, Germany, 2013; pp. 364–374. [Google Scholar]
  25. Riemenschneider, H.; Krispel, U.; Thaller, W.; Donoser, M.; Havemann, S.; Fellner, D.; Bischof, H. Irregular lattices for complex shape grammar facade parsing. In Proceedings of the 2012 IEEE Conference on Computer Vision and Pattern Recognition, Providence, RI, USA, 16–21 June 2012; pp. 1640–1647. [Google Scholar]
  26. LeCun, Y.; Bottou, L.; Bengio, Y.; Haffner, P. Gradient-based learning applied to document recognition. Proc. IEEE 1998, 86, 2278–2324. [Google Scholar] [CrossRef]
  27. Chaudhury, K.; DiVerdi, S.; Ioffe, S. Auto-rectification of user photos. In Proceedings of the 2014 IEEE International Conference on Image Processing (ICIP), Paris, France, 27–30 October 2014; pp. 3479–3483. [Google Scholar]
  28. Ruggiero, G.; Marmo, R.; Nicolella, M. A Methodological Approach for Assessing the Safety of Historic Buildings’ Façades. Sustainability 2021, 13, 2812. [Google Scholar] [CrossRef]
  29. Kechidi, S.; Castro, J.M.; Monteiro, R.; Marques, M.; Yelles, K.; Bourahla, N.; Hamdache, M. Development of exposure datasets for earthquake damage and risk modelling: The case study of northern Algeria. Bull. Earthq. Eng. 2021, 19, 5253–5283. [Google Scholar] [CrossRef]
  30. Li, X.; Li, Z.; Yang, J.; Li, H.; Liu, Y.; Fu, B.; Yang, F. Seismic vulnerability comparison between rural Weinan and other rural areas in Western China. Int. J. Disaster Risk Reduct. 2020, 48, 101576. [Google Scholar] [CrossRef]
  31. An, J.; Nie, G.; Hu, B. Area-Wide estimation of seismic building structural types in rural areas by using decision tree and local knowledge in combination. Int. J. Disaster Risk Reduct. 2021, 60, 102320. [Google Scholar] [CrossRef]
  32. Zhang, L.; Wang, G.; Sun, W. Automatic identification of building structure types using unmanned aerial vehicle oblique images and deep learning considering facade prior knowledge. Int. J. Digit. Earth 2023, 16, 3348–3367. [Google Scholar] [CrossRef]
  33. Haghighatgou, N.; Daniel, S.; Badard, T. A method for automatic identification of openings in buildings facades based on mobile LiDAR point clouds for assessing impacts of floodings. Int. J. Appl. Earth Obs. Geoinf. 2022, 108, 102757. [Google Scholar] [CrossRef]
  34. Remondino, F.; Barazzetti, L.; Nex, F.; Scaioni, M.; Sarazzi, D. UAV Photogrammetry for Mapping and 3D Modeling: Current Status and Future Perspectives. In The International Archives of the Photogrammetry Remote Sensing and Spatial Information Sciences, Proceedings of the International Conference on Unmanned Aerial Vehicle in Geomatics (UAV-g), Zurich, Switzerland, 14–16 September 2011; International Society of Photogrammetry and Remote Sensing (ISPRS): Hannover, Germany, 2011; pp. 25–31. [Google Scholar]
  35. Yoon, S.; Spencer Jr, B.F.; Lee, S.; Jung, H.-J.; Kim, I.-H. A novel approach to assess the seismic performance of deteriorated bridge structures by employing UAV-based damage detection. Struct. Control Health Monit. 2022, 29, e2964. [Google Scholar] [CrossRef]
  36. Meduri, G.M.; Barrile, V. Bridge Seismic Evaluation Through Processing Techniques and UAV Photogrammetric Investigation. In Proceedings of the Networks, Markets & People, Proceedings of the International Symposium: New Metropolitan Perspectives, Reggio Calabria, Italy, 22–24 May 2024; Springer Nature: Cham, Switzerland, 2024; pp. 176–185. [Google Scholar]
  37. Zhou, J.; Liu, Y.; Nie, G.; Cheng, H.; Yang, X.; Chen, X.; Gross, L. Building extraction and floor area estimation at the village level in rural China via a comprehensive method integrating UAV photogrammetry and the novel EDSANet. Remote Sens. 2022, 14, 5175. [Google Scholar] [CrossRef]
  38. Wang, Y.; Li, S.; Teng, F.; Lin, Y.; Wang, M.; Cai, H. Improved mask R-CNN for rural building roof type recognition from uav high-resolution images: A case study in hunan province, China. Remote Sens. 2022, 14, 265. [Google Scholar] [CrossRef]
  39. Liu, Y.; Lin, Y.; Yeoh, J.K.; Chua, D.K.; Wong, L.W.; Ang, M.H.; Lee, W.; Chew, M.Y. Framework for automated UAV-based inspection of external building façades. Autom. Cities Des. Constr. Oper. Future Impact 2021, 173–194. [Google Scholar]
  40. He, T.; Chen, K.; Jazizadeh, F.; Reichard, G. Unmanned aerial vehicle-based as-built surveys of buildings. Autom. Constr. 2024, 161, 105323. [Google Scholar] [CrossRef]
  41. Marsland, L.; Nguyen, K.; Zhang, Y.; Huang, Y.; Abu-Zidan, Y.; Gunawardena, T.; Mendis, P. Improving aerodynamic performance of tall buildings using façade openings at service floors. J. Wind Eng. Ind. Aerodyn. 2022, 225, 104997. [Google Scholar] [CrossRef]
  42. Nguyen, K.T.; Weerasinghe, P.; Mendis, P.; Ngo, T. Performance of modern building façades in fire: A comprehensive review. Electron. J. Struct. Eng. 2016, 16, 69–87. [Google Scholar] [CrossRef]
  43. Sun, Q.; Song, J.; Yu, Y.; Ai, H.; Zhao, L. A Study of the Impacts of Different Opening Arrangements of Double-Skin Façades on the Indoor Temperatures of a Selected Building. Buildings 2024, 14, 3893. [Google Scholar] [CrossRef]
  44. Müller, P.; Zeng, G.; Wonka, P.; Van Gool, L. Image-based procedural modeling of facades. ACM Trans. Graph. 2007, 26, 85. [Google Scholar] [CrossRef]
  45. Reznik, S.; Mayer, H. Implicit shape models, self-diagnosis, and model selection for 3D façade interpretation. Photogramm. Fernerkund. Geoinf. 2008, 3, 187–196. [Google Scholar]
  46. Cohen, A.; Schwing, A.G.; Pollefeys, M. Efficient structured parsing of facades using dynamic programming. In Proceedings of the IEEE Conference on Computer Vision and Pattern Recognition, Columbus, OH, USA, 23–28 June 2014; pp. 3206–3213. [Google Scholar]
  47. Sun, Y.; Malihi, S.; Li, H.; Maboudi, M. DeepWindows: Windows Instance Segmentation through an Improved Mask R-CNN Using Spatial Attention and Relation Modules. ISPRS Int. J. Geo-Inf. 2022, 11, 162. [Google Scholar] [CrossRef]
  48. Liu, H.; Xu, Y.; Zhang, J.; Zhu, J.; Li, Y.; Hoi, S.C.H. DeepFacade: A Deep Learning Approach to Facade Parsing With Symmetric Loss. IEEE Trans. Multimed. 2020, 22, 3153–3165. [Google Scholar] [CrossRef]
  49. Von Gioi, R.G.; Jakubowicz, J.; Morel, J.-M.; Randall, G. LSD: A line segment detector. Image Process. Line 2012, 2, 35–55. [Google Scholar] [CrossRef]
  50. Fischler, M.A.; Bolles, R.C. Random sample consensus: A paradigm for model fitting with applications to image analysis and automated cartography. Commun. ACM 1981, 24, 381–395. [Google Scholar] [CrossRef]
  51. Zoph, B.; Ghiasi, G.; Lin, T.-Y.; Cui, Y.; Liu, H.; Cubuk, E.D.; Le, Q. Rethinking pre-training and self-training. Adv. Neural Inf. Process. Syst. 2020, 33, 3833–3845. [Google Scholar]
  52. Hu, H.; Gu, J.; Zhang, Z.; Dai, J.; Wei, Y. Relation networks for object detection. In Proceedings of the IEEE Conference on Computer Vision and Pattern Recognition, Salt Lake City, UT, USA, 18–23 June 2018; pp. 3588–3597. [Google Scholar]
  53. Vaswani, A. Attention is all you need. Adv. Neural Inf. Process. Syst. 2017, 30, 5998–6008. [Google Scholar]
  54. Ren, S.; He, K.; Girshick, R.; Sun, J. Faster r-cnn: Towards real-time object detection with region proposal networks. Adv. Neural Inf. Process. Syst. 2015, 28, 91–99. [Google Scholar] [CrossRef] [PubMed]
  55. Dai, M.; Ward, W.O.C.; Meyers, G.; Densley Tingley, D.; Mayfield, M. Residential building facade segmentation in the urban environment. Build. Environ. 2021, 199, 107921. [Google Scholar] [CrossRef]
  56. Fathalla, R.; Vogiatzis, G. A deep learning pipeline for semantic facade segmentation. In Proceedings of the British Machine Vision Conference 2017, London, UK, 19–22 September 2017; p. 120. [Google Scholar]
  57. Wu, Y.; Kirillov, A.; Massa, F.; Lo, W.-Y.; Girshick, R. Detectron2 2019. Available online: https://github.com/facebookresearch/detectron2 (accessed on 14 June 2022).
  58. He, K.; Zhang, X.; Ren, S.; Sun, J. Deep residual learning for image recognition. In Proceedings of the IEEE Conference on Computer Vision and Pattern Recognition, Las Vegas, NV, USA, 27–30 June 2016; pp. 770–778. [Google Scholar]
  59. Krizhevsky, A.; Sutskever, I.; Hinton, G.E. Imagenet classification with deep convolutional neural networks. Adv. Neural Inf. Process. Syst. 2012, 25, 84–90. [Google Scholar] [CrossRef]
  60. Gadde, R.; Marlet, R.; Paragios, N. Learning grammars for architecture-specific facade parsing. Int. J. Comput. Vis. 2016, 117, 290–316. [Google Scholar] [CrossRef]
  61. Korc, F.; Förstner, W. eTRIMS Image Database for Interpreting Images of Man-Made Scenes; Technical Report TR-IGG-P-2009-01; University of Bonn: Bonn, Germany, 2009. [Google Scholar]
  62. Fröhlich, B.; Rodner, E.; Denzler, J. A Fast Approach for Pixelwise Labeling of Facade Images. In Proceedings of the International Conference on Pattern Recognition (ICPR 2010), Istanbul, Turkey, 23–26 August 2010. [Google Scholar]
  63. Riemenschneider, H.; Bódis-Szomorú, A.; Weissenberg, J.; Van Gool, L. Learning Where to Classify in Multi-View Semantic Segmentation. In Computer Vision—ECCV 2014, Proceedings of the ECCV 2014: 13th European Conference; Proceedings Part V 13, Zurich, Switzerland, 6–12 September 2014; Springer: Cham, Switzerland, 2014; pp. 516–532. [Google Scholar]
  64. Kolev, K.; Klodt, M.; Brox, T.; Cremers, D. Continuous Global Optimization in Multiview 3D Reconstruction. Int. J. Comput. Vis. 2009, 84, 80–96. [Google Scholar] [CrossRef]
  65. Zhao, H.; Shi, J.; Qi, X.; Wang, X.; Jia, J. Pyramid scene parsing network. In Proceedings of the IEEE Conference on Computer Vision and Pattern Recognition, Honolulu, HI, USA, 21–26 July 2017; pp. 2881–2890. [Google Scholar]
  66. Chen, L.-C.; Zhu, Y.; Papandreou, G.; Schroff, F.; Adam, H. Encoder-decoder with atrous separable convolution for semantic image segmentation. In Proceedings of the European Conference on Computer Vision (ECCV), Munich, Germany, 8–14 September 2018; pp. 801–818. [Google Scholar]
  67. Xiao, T.; Liu, Y.; Zhou, B.; Jiang, Y.; Sun, J. Unified perceptual parsing for scene understanding. In Proceedings of the European Conference on Computer Vision (ECCV), Munich, Germany, 8–14 September 2018; pp. 418–434. [Google Scholar]
  68. Cheng, B.; Misra, I.; Schwing, A.G.; Kirillov, A.; Girdhar, R. Masked-attention mask transformer for universal image segmentation. In Proceedings of the IEEE/CVF Conference on Computer Vision and Pattern Recognition, New Orleans, LA, USA, 19–24 June 2022; pp. 1290–1299. [Google Scholar]
Figure 1. Overview of the study areas. (a) The Nanjing study area, situated in a rural region of Nanjing, Jiangsu Province, China. (b) The Ezhou study area, located in a rural area of Ezhou, Hubei Province, China.
Remotesensing 17 01596 g001
Figure 2. The workflow for estimating FORs of rural buildings using high-resolution 3D models derived from UAV photogrammetry.
Remotesensing 17 01596 g002
Figure 3. Workflow for pretraining samples collection using vanishing points correction technique to enhance publicly available façade datasets. (a) Orthogonal correction process based on vanishing points. (b) Vertical lines clustered by the algorithm. (c) Vanishing point computed along the vertical direction. (d) Horizontal lines clustered by the algorithm. (e) Vanishing point computed along the horizontal direction. (f) Final corrected image.
Remotesensing 17 01596 g003
Figure 4. Structure of deep convolution network with façade prior knowledge attention module for opening extraction. (a) Overall network architecture. (b) Structure of the attention module.
Remotesensing 17 01596 g004
Figure 5. Residuals between the ground truth FOR and the estimated FOR obtained using the proposed method and two baseline methods. (a) Nanjing; (b) Ezhou. The Y-axis represents the residuals between the estimated FOR and the ground truth FOR obtained from on-site measurements, while the X-axis denotes the façade ID, corresponding to the index of each façade image.
Remotesensing 17 01596 g005
Figure 6. Visualization results of façade openings extraction from different input images across three case buildings in Nanjing area.
Remotesensing 17 01596 g006
Figure 7. Visualization of façade segmentation results using various methods in the Nanjing and Ezhou areas. Case 1 represents the Naning area, while Case 2 corresponds to the Ezhou area.
Remotesensing 17 01596 g007
Figure 8. Residual error distribution of estimated FORs across methods. The x-axis of each subplot represents the residual value, with color indicating frequency. Subplot (a) shows the residual error distribution for the Nanjing area, and subplot (b) shows the Ezhou area.
Remotesensing 17 01596 g008
Table 1. Accuracy evaluation for FOR estimation using the proposed method and baseline methods.
InputNanjingEzhou
MAEMREMAEMRE
Baseline-10.06234%0.05835%
Baseline-20.02917%0.03216%
Ours0.02012%0.01911%
Table 2. Accuracy evaluation for façade opening segmentations using our proposed method alongside two baseline approaches. The best values for the different metrics are highlighted in bold.
Study AreaInputWindowDoor
PRERECIOUPRERECIOU
NanjingBaseline-10.880.860.770.700.160.15
Baseline-20.840.930.790.920.390.38
Ours0.950.930.890.860.710.64
EzhouBaseline-10.780.840.680.720.150.16
Baseline-20.910.890.820.890.380.36
Ours0.940.920.880.850.710.63
Table 3. Quantitative evaluation results of façade element extraction and FOR estimation, comparing our method with five state-of-the-art models. The best values for the different metrics are highlighted in bold.
Study AreaMethodWindowDoorWallFOR
PRERECIOUPRERECIOUPRERECIOUMAEMRE
NanjingPSPNet0.940.920.870.880.530.490.970.960.930.03314%
DeepLabV3+0.950.910.870.840.700.620.940.950.920.02113%
DeepFacade0.920.930.860.850.590.540.970.960.940.03114%
SwinT-UperNet0.930.930.870.880.640.620.970.960.930.02313%
Mask2Former0.950.920.880.860.690.630.960.960.920.02113%
Ours0.950.930.890.860.710.640.980.960.940.02012%
EzhouPSPNet0.920.940.870.860.580.510.950.950.920.03213%
DeepLabV3+0.950.920.870.850.690.610.960.960.920.02213%
DeepFacade0.930.920.860.870.680.600.960.970.930.02914%
SwinT-UperNet0.950.930.870.850.700.620.970.970.940.02213%
Mask2Former0.940.920.870.860.680.610.970.950.920.02413%
Ours0.940.920.880.850.710.630.960.960.930.01911%
Table 4. Quantitative evaluation results of façade element extraction and FOR estimation across different training settings. The best values for the different metrics are highlighted in bold.
Study AreaMethodWindowDoorWallFOR
PRERECIOUPRERECIOUPRERECIOUMAEMRE
Nanjingw/o P0.930.840.800.640.640.470.980.960.940.03922%
P0.920.910.850.830.670.590.980.960.940.03214%
P + R0.950.930.890.860.710.640.980.960.940.02012%
Ezhouw/o P0.910.830.780.670.650.490.940.940.900.04123%
P0.940.890.840.840.660.590.940.940.900.02813%
P + R0.940.920.870.850.710.630.940.940.900.01911%
“w/o P” denotes no pretraining, “P” denotes pretraining with original pretraining images, and “P + R” denotes pretraining with corrected pretraining images.
Disclaimer/Publisher’s Note: The statements, opinions and data contained in all publications are solely those of the individual author(s) and contributor(s) and not of MDPI and/or the editor(s). MDPI and/or the editor(s) disclaim responsibility for any injury to people or property resulting from any ideas, methods, instructions or products referred to in the content.

