Technical Note

A Study on an Anti-Multiple Periodic Frequency Modulation (PFM) Interference Algorithm in Single-Antenna Low-Earth-Orbit Signal-of-Opportunity Positioning Systems

1
School of Electronics and Information Engineering, Beihang University, Beijing 100191, China
2
Beijing Satellite Navigation Center, Beijing 100191, China
3
Beijing Institute of Technology, Beijing 100191, China
4
China Academy of Space and Technology, Beijing 100191, China
5
College of Electronic Science and Engineering, National University of Defense Technology, Changsha 410073, China
6
Hunan University of Information Technology, School of Electronic Science and Engineering, Changsha 410073, China
*
Author to whom correspondence should be addressed.
Remote Sens. 2025, 17(9), 1571; https://doi.org/10.3390/rs17091571
Submission received: 22 December 2024 / Revised: 27 March 2025 / Accepted: 24 April 2025 / Published: 28 April 2025
(This article belongs to the Special Issue Low Earth Orbit Enhanced GNSS: Opportunities and Challenges)

Abstract

:
Signal-of-Opportunity (SOP) positioning based on Low-Earth-Orbit (LEO) constellations has gradually become a research hotspot. Due to their large quantity, wide spectral coverage, and strong signal power, LEO satellite SOP positioning exhibits robust anti-jamming capabilities. However, no in-depth studies have been conducted on their anti-jamming performance, particularly regarding the most common type of interference faced by ground receivers—Periodic Frequency Modulation (PFM) interference. Due to the significant differences in signal characteristics between LEO satellite downlink signals and those of Global Navigation Satellite Systems (GNSSs) based on Medium-Earth-Orbit (MEO) or Geostationary-Earth-Orbit (GEO) satellites, traditional interference suppression techniques cannot be directly applied. This paper proposes a Signal Adaptive Iterative Optimization Resampling (SAIOR) algorithm, which leverages the periodicity of PFM jamming signals and the characteristics of LEO constellation signals. The algorithm enhances the concentration of jamming energy by appropriately resampling the data, thereby reducing the overlap between LEO satellite signals and interference. This approach effectively minimizes the damage to the desired signal during anti-jamming processing. Simulation and experimental results demonstrate that, compared to traditional algorithms, this method can effectively eliminates single/multiple-component PFM interference, improve the interference suppression performance under the conditions of narrow bandwidth and high signal power, and holds a high application value in LEO satellite SOP positioning.

1. Introduction

With the development of Global Navigation Satellite Systems (GNSSs), these systems are becoming a critical infrastructure for national informatization construction, capable of providing Positioning, Navigation, and Timing (PNT) services for a wide range of applications [1,2,3,4,5]. However, as GNSS applications increase, its inherent limitations have gradually surfaced. These include weak received signal power, limited frequency diversity, high construction and maintenance costs, and susceptibility to malicious interference, particularly in times of conflict or crisis, which can render services unavailable [6,7]. Addressing these GNSS deficiencies, especially ensuring reliable and high-precision PNT services in environments where GNSSs are unavailable, has become a key focus for future development [8,9,10].
Currently, nations worldwide are actively developing resilient PNT systems to ensure that military equipment can achieve accurate positioning even when GNSS performance is degraded or denied. Notably, the U.S. Department of Defense’s 2020 PNT Technology Development Roadmap highlights the use of Signal of Opportunity (SOP) to achieve absolute positioning, thereby complementing GPS functionality and enhancing its availability and robustness. SOP positioning is a technique that utilizes perceivable non-navigation signals—such as acoustic, optical, electromagnetic, and mechanical information—for positioning purposes. Given the abundance of various radio signals in space, the current research primarily focuses on radio-based SOP. SOP typically include both ground-based and space-based radio signals. Ground-based SOP have limited coverage capabilities, making global seamless coverage in regions like deserts, oceans, and polar areas challenging. Space-based SOP mainly refer to signals transmitted by non-navigation/non-cooperative satellites. With the significant development and deployment of Low-Earth-Orbit (LEO) satellites in recent years, SOP positioning using LEO satellites have gradually become a primary focus in navigation and positioning applications [11,12]. Unlike traditional GNSS-based positioning, SOP positioning using LEO satellites leverages downlink signals, such as those from communication satellites, as radiation sources to achieve ground terminal positioning [13,14,15]. Meanwhile, with the rapid development of emerging satellite constellations represented by Starlink and OneWeb, the massive number of LEO satellites provides abundant radiation sources for space-based SOP positioning. In this context, exploring SOP positioning based on LEO constellations has become a research hotspot. Numerous studies have documented various cases of positioning using LEO satellites by different research teams, with achieved positioning accuracy generally reaching the tens of meters level [16,17,18,19,20,21,22,23,24].
However, current research on anti-jamming technologies for LEO satellites SOP positioning remains limited, particularly for Periodic Frequency Modulation (PFM) interference, such as Periodic Linear Frequency Modulation (PLFM) and Periodic Sinusoidal Frequency Modulation (PSFM) signals. To date, there has been little in-depth investigation into these interference types both domestically and internationally. However, PFM interference is one of the most common types of interference faced by LEO satellites SOP positioning receivers. This type of interference, typically generated by malicious jammers, radar systems, or civilian radio stations, is characterized by low average power, high peak power, and wide bandwidth. It is widely distributed across the frequency bands of LEO satellites SOP signals [25,26,27].
Previous research on suppressing PFM interference has primarily focused on GNSSs and similar systems. The general approach involves leveraging differences between GNSS signals and interference in the time–frequency domain, spatial domain, or spatiotemporal domain to propose corresponding interference suppression methods [28,29]. Among these, spatial–temporal joint processing using the spatial resolution of antenna arrays at the receiver end can effectively suppress various types of interference. However, considering the high hardware cost and complexity of the terminal, this method has limited applicability. In contrast, single antennas are widely used due to their smaller size, lower cost, and reduced power consumption compared to antenna arrays. Therefore, the development of detection and suppression methods for PFM interference suitable for single-antenna receivers remains a research hotspot. Currently, the most effective approach involves transforming the received signal into the time–frequency domain for interference detection. Based on the characteristics of energy distribution in the time–frequency domain after transformation, typical time–frequency analysis methods include the Short-Time Fourier Transform (STFT) [30], Wavelet Packet Transform (WPT) [31,32], and Fractional Fourier Transform (FrFT) [33]. However, the STFT cannot effectively accumulate signal energy and suffers from insufficient resolution due to its fixed window width. Discrete WPT tends to cause spectrum aliasing and amplitude distortion. Additionally, the non-orthogonality of discrete FrFT can distort the desired signal, and its effectiveness is primarily limited to linear frequency modulation (LFM) interference. Most importantly, while these methods have some capacity to suppress frequency-modulated (FM) interference, the significant overlap between the interference and the desired signal in the time–frequency or FrFT domain inevitably leads to substantial damage to the desired signal when interference is removed. This issue is further exacerbated by advancements in electronic technology in recent years, where modern small-scale jammers can produce interference containing multiple FM components, increasing the degree of damage to the desired signal during interference suppression.
Such interference suppression processes may result in signal quality loss that is tolerable when dealing with GNSS signals that typically have downlink bandwidths of several tens of MHz. However, for LEO satellite signals, which generally have much narrower downlink bandwidths (e.g., 500 kHz for the Iridium system and only 25 kHz for the Orbcomm system), the damage to signal quality caused by interference suppression can significantly impact the subsequent positioning accuracy. Therefore, directly applying traditional time–frequency-based interference suppression methods to LEO satellite PFM interference scenarios yields suboptimal results. This paper proposes a Signal Adaptive Iterative Optimization Resampling (SAIOR) algorithm, leveraging the characteristics of PFM interference signals and LEO satellite signals. This algorithm concentrates the energy of PFM interference, which is originally dispersed over a wide bandwidth, into a few frequency points in the newly sampled data through appropriate secondary sampling. This enhances the aggregation of interference, effectively reducing the overlap between the LEO satellite signal and interference, thereby minimizing the damage to the desired signal during the anti-jamming process. Simulations and experiments validate the performance improvements of the algorithm. The results demonstrate that this method effectively eliminates single/multi-component PFM interference while causing minimal damage to SOP signals, making it suitable for high-precision positioning receivers.

2. LEO Satellite Signal and PFM Interference Signal Model

In an interference environment, the signal model at the input of the LEO satellite downlink receiver can be expressed as:
x ( t ) = i N s i ( t ) + m M j m ( t ) + n ( t )
where s i t represents the received signal from the i-th LEO satellite (i = 1, 2, 3,…, N); N is the number of visible LEO satellites during the reception period; j m ( t ) represents the m-th component of the interference signal affecting the receiver (m = 1, 2, 3,…, M); M is the number of interferences received; and n(t) represents the zero-mean stationary additive white Gaussian noise (AWGN).
When considering the received signal from a single LEO satellite, the signal from the i-th satellite can be expressed as:
s i t = A D t cos ω 0 t + Φ ( t )
where A is the signal amplitude, D(t) is the data code level transmitted by the satellite, ω 0 is the signal transmission frequency, and Φ ( t ) is the transmission phase.
j m ( t ) is the PFM interference, whose instantaneous frequency f t changes periodically with time, expressed as:
f t = f 0 m + Δ f m sin ( 2 π t T m )
where f 0 m is the carrier frequency of the PFM interference signal, Δ f m is the modulation amplitude of its frequency, T m is the modulation period (MP), sin ( 2 π t T m ) is the periodic modulation function, and the instantaneous frequency of the interference oscillates periodically within the range of [ f 0 m Δ f m , f 0 m + Δ f m ) .
Then, the phase function Φ t can be expressed by Equation (3) as:
Φ t = 2 π 0 t f ( τ ) d τ            = 2 π 0 t ( f 0 m + Δ f m sin ( 2 π t T m ) ) d τ           = 2 π f 0 m t + Δ f m T m 2 cos ( 2 π t T m )
So, the PFM interference signal j m ( t ) can be expressed as:
j m t = A m exp 2 π f 0 m t + Δ f m T m 2 cos ( 2 π t T m ) + θ m
where A m is the carrier amplitude of the PFM interference signal, and θ m represents the initial carrier phase of the PFM interference, which is a random variable uniformly distributed within the range of [ π , + π ) . 2 π f 0 m t is the linear phase term of the interference, which determines the central frequency of the signal; and Δ f m T m 2 cos ( 2 π t T m ) is the nonlinear phase term, representing the periodic variation in the frequency with time, with a period of T m .

3. The Signal Adaptive Iterative Optimization Resampling (SAIOR) Algorithm

In this section, the SAIOR algorithm is proposed based on the characteristics of PFM interference signals and LEO constellation signals. This algorithm eliminates the influence of LEO satellite signals in the input signal and utilizes optimized sampling to concentrate the PFM interference energy, which is originally dispersed over a wide bandwidth, into a few frequency points in the newly sampled data. This effectively reduces the damage to the desired signal during the anti-jamming process and overcomes the challenges that traditional PFM interference suppression algorithms fail to address under the condition of receiving LEO satellite signals with a single antenna.

3.1. Optimization Resampling

For the PFM interference j m ( t ) , let n be any positive integer; then, from Equation (5), we can obtain:
j m t + n T m = A m exp 2 π f 0 m t + n T m + Δ f m T m 2 cos ( 2 π T m t + n T m ) + θ m = A m exp 2 π f 0 m t + 2 π f 0 m n T m + Δ f m T m 2 cos ( 2 π T m t ) + θ m = A m exp 2 π f 0 m t + Δ f m T m 2 cos ( 2 π T m t ) + θ m exp ( 2 π f 0 m n T m ) = j m t exp ( 2 π f 0 m n T m )
From the above equation, it can be seen that, when a single-component PFM signal is resampled with an interval of n T m , the consecutive resampled data points differ only by a scaling factor.
Next, we analyze different interference scenarios separately:
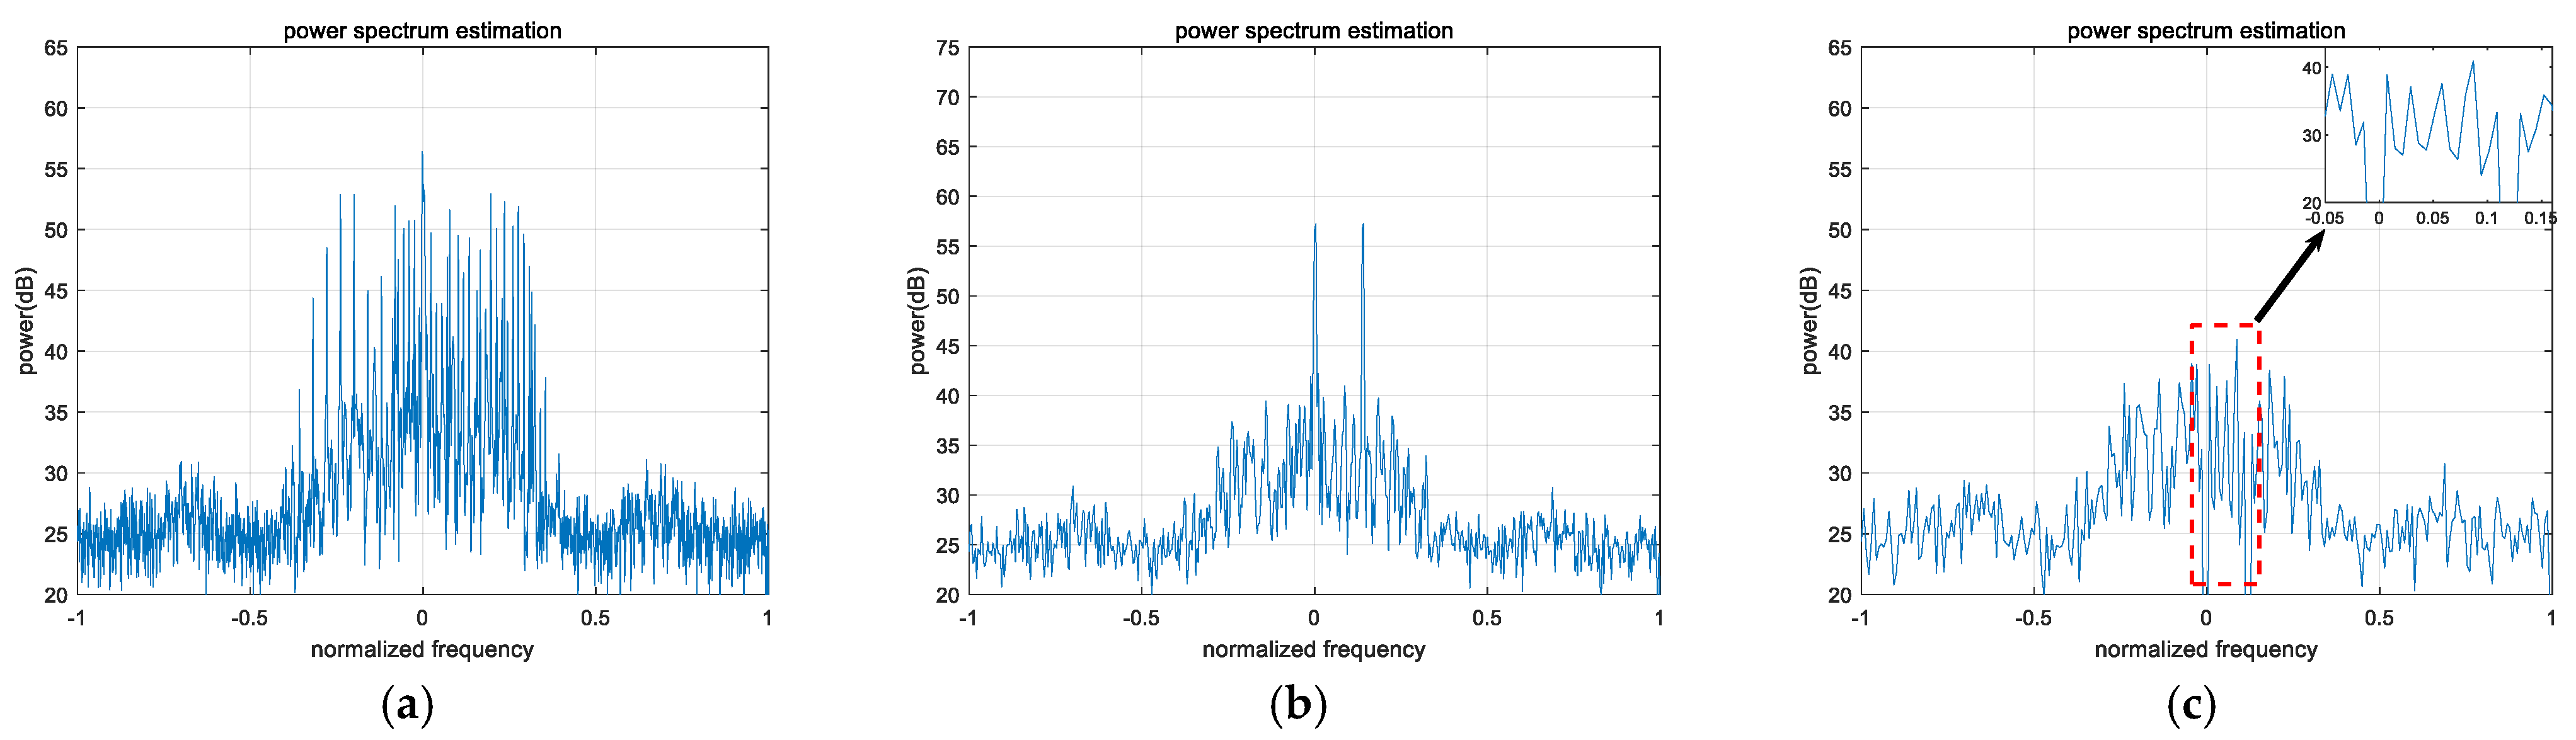
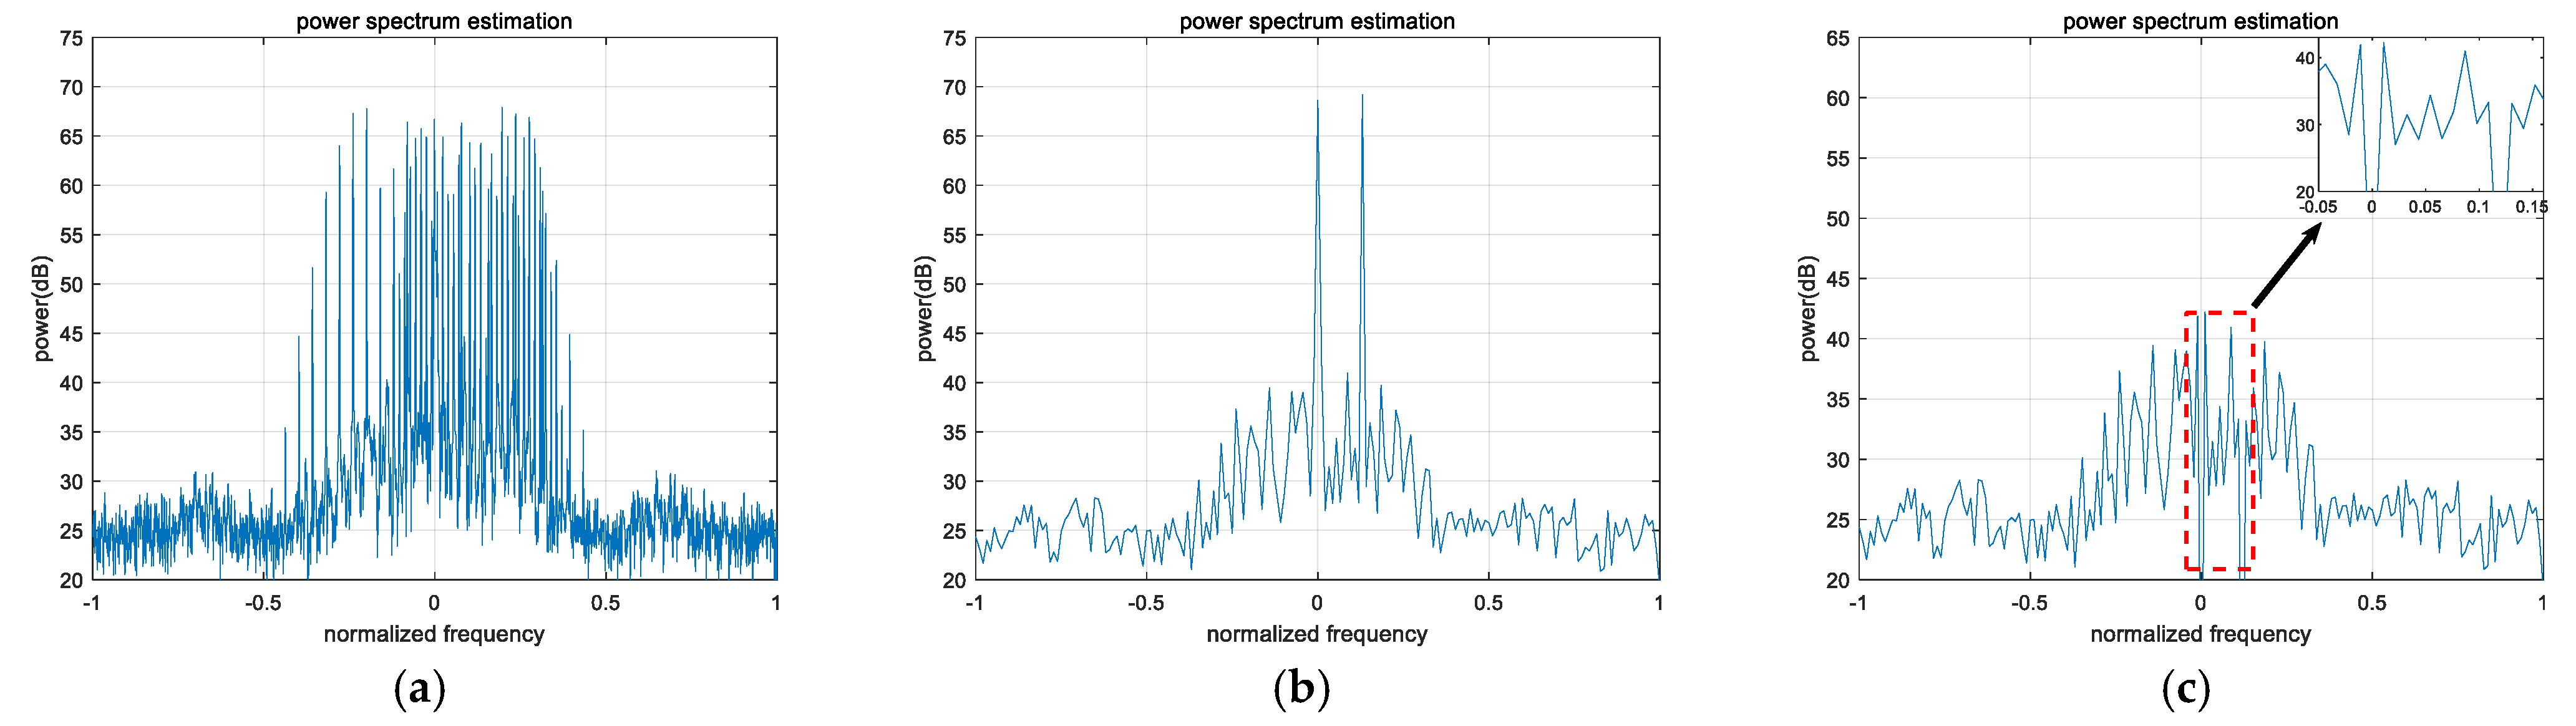
When the interference scenario is a single-component PFM signal, it can be seen from Equation (6) that, after optimization resampling with an interval of n T m , the interference signal is concentrated at a single frequency point in the resampled data. This means that optimization resampling can transform the PFM interference into a single-frequency interference, while the energy distribution of the LEO satellite signal i N s i t and noise n ( t ) is essentially unaffected.
When the interference scenario is multi-component PFM signals with the same interference carrier frequency, let the starting point be j m ( θ m ) , and the periods of the m PFM interference signals be denoted as T 1 , T 2 , , T m . Then, they must have a least common multiple T M , that is:
T M = n 1 T 1 = n 2 T 2 = n m T m
where n 1 , n 2 , , n m are positive integers. When performing optimization resampling with an interval of n T M (where n is a positive integer) on the m PFM interference signals, then:
m = 1 M j m = m = 1 M A m exp ( 2 π  f 0 m M n T M + θ m )     = exp ( 2 π  f 0 m M n T M ) m = 1 M A m exp ( θ m )
Equation (8) shows that, by performing optimization resampling with an interval of n T M , multiple-component PFM interference signals with the same carrier frequency can still be transformed into single-frequency interference.
When the interference scenario involves multiple-component PFM signals with inconsistent carrier frequencies, similarly, let the periods of k PFM interference signals be denoted as T 1 , T 2 , , T k , and their least common multiple as T K . Let the carrier frequencies of the PFM interference signals be denoted as f 01 , f 02 , , f 0 k . By performing optimization resampling with an interval of n T K (where n is a positive integer) on the k PFM interference signals, the results from Equations (6) and (8) can be obtained:
k = 1 K j k = k = 1 K A k exp ( 2 π f 0 k K n T k + θ m )
Equation (9) indicates that, through optimization resampling with an interval of n T K , multiple-component PFM interference signals with different carrier frequencies can still be concentrated into several single-frequency interferences in the newly sampled data, and the specific number of single-frequency points is determined by the carrier frequencies of the PFM interference.
In summary, for PFM signals, the carrier frequency f 0 m and modulation period T m are the most critical parameters affecting optimization resampling performance. When subjected to PFM interference, regardless of whether the interference pattern is single/multiple components or whether the carrier frequencies of interferences are consistent, appropriate optimization resampling can transform the interference into one or several single-frequency interferences. Meanwhile, the energy distribution of LEO satellite signals and noise is essentially unaffected.

3.2. Signal Adaptive Iterative Cancellation

Due to the high signal-to-noise ratio (SNR) of LEO satellite signals upon reception (generally 15–30 dB), these signals can severely affect the estimation of PFM interference parameters such as carrier frequency and modulation period. Therefore, before estimating the parameters of PFM interference, it is necessary to eliminate the high-power LEO satellite signals and isolate the PFM interference to facilitate subsequent parameter estimation. The SAIOR algorithm draws inspiration from the SCCI algorithm proposed in [34], adaptively and iteratively approximating the power spectrum of the LEO satellite signals to remove the influence of their power from the input signal.
Through analysis, the power spectrum of the input signal (signal and noise) in the LEO satellite signal reception scenario follows a chi-squared distribution, thereby enabling the derivation of the primary expression between the input signal power spectrum and signal power spectral density, which establishes an approximation model:
Y e ( f ) = a G s ( f ) + b
where Y e ( f ) represents the estimated power spectrum of the input signal, and G s ( f ) represents the power spectrum of the signal.
Let the error between the input signal power spectrum P ( f ) and the model estimation Y e ( f ) be:
e ( a , b ) = f = 1 N ( a G s ( f ) + b P ( f ) )
where N is the number of FFT points; the mean square error (MSE) is expressed by:
e ( a , b ) 2 = f = 1 N ( a G s ( f ) + b P ( f ) ) 2 = a 2 f = 1 N G s 2 ( f ) + N b 2 + 2 a b f = 1 N G s ( f ) + f = 1 N P 2 ( f ) 2 a f = 1 N G s ( f ) P ( f ) 2 b f = 1 N P ( f )
Using the gradient descent method, with the minimization of the MSE between P ( f ) and the model estimate Y e ( f ) as the criterion, multiple rounds of adaptive iteration are performed. This process eliminates the portions of the interference spectrum that exceed the true value of the signal power spectrum, ultimately achieving the goal of making the final iterative estimate of the signal power spectrum identical to the true value. The estimated values of parameters a and b in Equation (10) are then obtained, and the mean power spectrum estimate Y e ( f ) of the input signal is derived. Next, the mean power spectrum Y e ( f ) obtained from the estimation model is subtracted from the input signal power spectrum P ( f ) . This can be considered as removing the power spectrum values of the LEO satellite signals from the input signal, leaving approximately only noise and PFM interference signals. At this point, the next step of estimating the interference signal parameters can proceed.

3.3. Estimation of Modulation Period (MP)

After the previous step of signal adaptive iterative elimination, the input signal approximately retains only noise and PFM interference signals, expressed as:
x ( t ) m M j m ( t ) + n ( t )
Since the interference and noise components in the received signal are statistically uncorrelated, their cross-correlation function theoretically approaches zero and can be neglected. Therefore, the period of periodic components in the received signal is estimated through autocorrelation processing below.
From Equation (13), the autocorrelation function of x ( t ) can be expressed as:
R x ( τ ) = m = 1 M R j m ( τ ) + R n ( τ ) = R j ( τ ) + R n ( τ )
where R j m ( τ ) and R n ( τ ) are the autocorrelation functions of j m ( t ) and n ( t ) , respectively. Thus,
R j ( τ ) = m = 1 M R j m ( τ ) = m = 1 M A m 2 2 exp ( 2 π f 0 m τ ) lim T 1 T T T exp Δ f m T m 2 cos ( 2 π T m t ) Δ f m T m 2 cos 2 π T m ( t τ ) d t
From Equation (15), it can be observed that:
R j ( τ ) m = 1 M A m 2 2
Δ f m T m 2 cos ( 2 π t T m ) is a periodic function with T m as its modulation period; so, Equation (14) holds true if and only if t = n T m . That is, R j ( τ ) reaches a maximum at n T m . Therefore, by detecting the peaks of R x ( τ ) , the estimated value of the PFM interference modulation period T m can be obtained.

3.4. Constructing Anti-Jamming Weights

After estimating the modulation period of the PFM signal in the previous step, the next goal is to identify the interference signal and remove it from the original input signal, completing the anti-jamming operation. Compared to the impact of the high received power of the LEO satellite signal on interference identification, interference spectral line judgment in the noise and PFM interference obtained after signal adaptive iterative elimination is clearly more accurate. Therefore, after autocorrelation, the further optimization sampling of the mixed signal of noise and interference with the removed LEO satellite signal, based on the acquired modulation period T m , can yield a set of resampled data of PFM interference and noise signals. The position of the interference spectral line in the power spectrum is determined by the interference judgment threshold, and the interference set I j is constructed, along with the construction of anti-jamming weights:
W f = = 0 , k I j = 1 , e l s e
Perform weighted processing on the resampled data obtained from the original input signal after optimization sampling with modulation period T m :
Y ( f ) = W f X ( f )
Apply Inverse Fast Fourier Transform (IFFT) to the weighted spectrum to obtain the time-domain signal after interference suppression.
y ( t ) = F 1 Y ( f )
At this point, the SAIOR algorithm framework can be summarized as shown in Figure 1, where the changes in the signal power spectrum at key stages of the algorithm framework are illustrated in Figure 2.
As shown in Figure 1 and Figure 2, the SAIOR algorithm involves four key aspects: (1) From ① to ② in Figure 2: An adaptive signal-approximation model is iteratively constructed to estimate the power spectrum of the LEO satellite signal, thereby eliminating its high-power components from the input signal. This isolates the PFM interference, facilitating subsequent estimation of its carrier frequency, modulation period, and other parameters. (2) From ② to ③ in Figure 2: Leveraging the periodicity of PFM interference, an optimized resampling process is performed to determine the modulation period T m . After removing the LEO satellite signal through adaptive iteration, the remaining mixture of interference and noise is subsampled, generating a resampled dataset where the PFM interference is converted into one or several single-frequency components. An interference detection threshold is then applied to locate the spectral lines of interference in the power spectrum, constructing the anti-jamming weighting coefficients. (3) ④ in Figure 2: The original input signal is similarly resampled at modulation period T m , producing a dataset containing the LEO satellite signal, PFM interference, and noise. In this case, the PFM interference is again transformed into single-frequency components, while the energy distribution of the LEO satellite signal and noise remains largely unaffected. (4) From ④ to ⑤ in Figure 2: The resampled data derived from the original input signal undergo anti-jamming weighting, completing the suppression process. Finally, an IFFT is applied to the weighted spectrum to recover the interference-mitigated time-domain signal.
The specific steps of the algorithm are shown in Algorithm 1:
Algorithm1. SAIOR Algorithm-Specific Steps
Step 1: Perform FFT on the original received signal x ( n ) to obtain the signal power spectrum X ( f ) ;
Step 2: Initiate signal adaptive iterative cancellation on the original received signal. Using the gradient descent method, obtain the estimates of parameters a and b by minimizing Equation (12) e ( a , b ) 2 = f = 1 N ( a G s ( f ) + b X ( f ) ) 2 , and substitute them into Equation (10) to obtain the estimated power spectrum Y e ( f ) of the LEO satellite signal. Then, subtract the estimated LEO satellite signal power spectrum Y e ( f ) from the input signal power spectrum X ( f ) to obtain the power spectrum X ^ ( f ) = X ( f ) Y e ( f ) of the PFM interference and noise signal. Perform IFFT on X ^ ( f ) to obtain the interference and noise signal x ^ ( n ) ;
Step 3: Perform autocorrelation processing on x ^ ( n ) . According to Equation (15), the modulation period T m of the PFM interference can be obtained by detecting the peak value of R x ( τ ) ;
Step 4: Perform secondary sampling on x ^ ( n ) based on the modulation period T m to obtain a set of resampled data. Determine the positions of interference spectral lines in the power spectrum using the interference detection threshold, construct the interference set I j , and establish the anti-jamming weights W f ;
Step 5: Subsample the original received signal x ( n ) at modulation period T m , perform FFT on the resampled data, and obtain the power spectrum X ˜ ( f ) ;
Step 6: Apply anti-jamming weighting W f to X ˜ ( f ) , Y ( f ) = W f X ˜ ( f ) , then transform the weighted spectrum via IFFT to recover the suppressed time-domain signal, y ( t ) = F 1 Y ( f ) .

4. Simulation and Test Verification

To validate the effectiveness of the proposed algorithm, relevant simulations and experiments were conducted. Without loss of generality, the Iridium satellite system in LEO constellation was selected for both simulations and experiments as the signal radiation source. Among them, the Iridium system is a polar-orbiting satellite constellation with an orbital altitude of 780 km, uniformly distributed across 6 near-north–south orbital planes. Each plane contains 12 satellites (including one spare), with an orbital inclination of 86.4° and an orbital period of 100.13 min, enabling global coverage [35,36]. The user link employs FDMA/TDMA/SDMA/TDD multiple access methods. The 48 spot beams of each satellite are divided into groups of 12 adjacent beams, using spatial division multiple access (SDMA) for frequency reuse over the total available bandwidth. Within each beam, the frequency band is divided into multiple TDMA channels using FDMA. In each TDMA channel, time division multiplexing (TDD) is adopted for the uplink and downlink of the same user, that is, the uplink and downlink are located in different time slots of the same frame of the same TDMA carrier. The total bandwidth allocated to Iridium is 1616.0 MHz–1626.5 MHz, of which 1616.0 MHz–1626.0 MHz is a duplex channel used as a traffic channel, and 1626.0 MHz–1626.5 MHz is a downlink simplex channel with a downlink bandwidth of 500 kHz, used as a signaling channel. The received SNR of Iridium signals is generally in the range of 15–30 dB due to their low orbital altitude [37].

4.1. Simulated Test

For the simulation experiments, the signal used a down-converted Iridium intermediate frequency (IF) simulated signal with a center frequency of 270,833 Hz. The jamming signal was modeled as Gaussian band-limited noise with a mean of 0 and a variance of 1.

4.1.1. Signal Power Spectrum Simulation Before and After Anti-Jamming

Firstly, analyze the changes in the power spectrum before and after PFM interference suppression to verify the algorithm’s effectiveness in terms of interference mitigation. Considering the analysis in Section 3.1, the single-component PFM interference scenario can be regarded as a special case of multi-component PFM interference with consistent carrier frequencies. Therefore, two interference scenarios are designed. The parameter settings for these scenarios are shown in Table 1, where Scenario 1 and Scenario 2 correspond to two-component PFM interference with consistent and inconsistent carrier frequencies, respectively.
In the two scenarios, two sets of comparative experiments were conducted: one with strong interference signal with a Jamming-to-Signal Ratio (JSR) of 25 dB and the other with weak interference signal with a JSR of 15 dB. The changes in the signal power spectrum before and after interference suppression were compared, with the results shown in Figure 3, Figure 4, Figure 5 and Figure 6. Among them, (a) in Figure 3, Figure 4, Figure 5 and Figure 6 represents the power spectrum diagram of the received signal before interference suppression (containing Iridium signal, PFM interference, and noise); (b) shows the resampled data obtained by optimizing the sampling of the original received signal after estimating the modulation period of the PFM interference signal; and (c) displays the power spectrum diagram of the Iridium signal and noise after activating the SAIOR algorithm and applying frequency-domain filtering to the interference signal, where the red dashed box highlights specific details of the frequency-domain-filtered interference signal, and the small inset in the upper right corner provides a magnified view of the details within the red dashed box.
In Figure 3, Figure 4, Figure 5 and Figure 6, a comparison between (a) and (b) shows that the SAIOR algorithm effectively converts the dispersed PFM interference over a wide bandwidth into one or several single-frequency interferences in the newly sampled data through appropriate secondary sampling, enhancing the aggregation of interference. Meanwhile, the energy distribution of LEO satellite signals and noise remains largely unaffected, effectively reducing the overlap between LEO satellite signals and interference, thereby minimizing the damage to the desired signal during interference suppression. A comparison between (a) and (c) demonstrates that, in a dual-component PFM interference scenario for LEO satellite signals, regardless of whether the carrier frequencies of the interference components are consistent, the SAIOR algorithm can completely suppress the interference spectral lines in the resampled data, effectively eliminating both single-component and multi-component PFM interference.

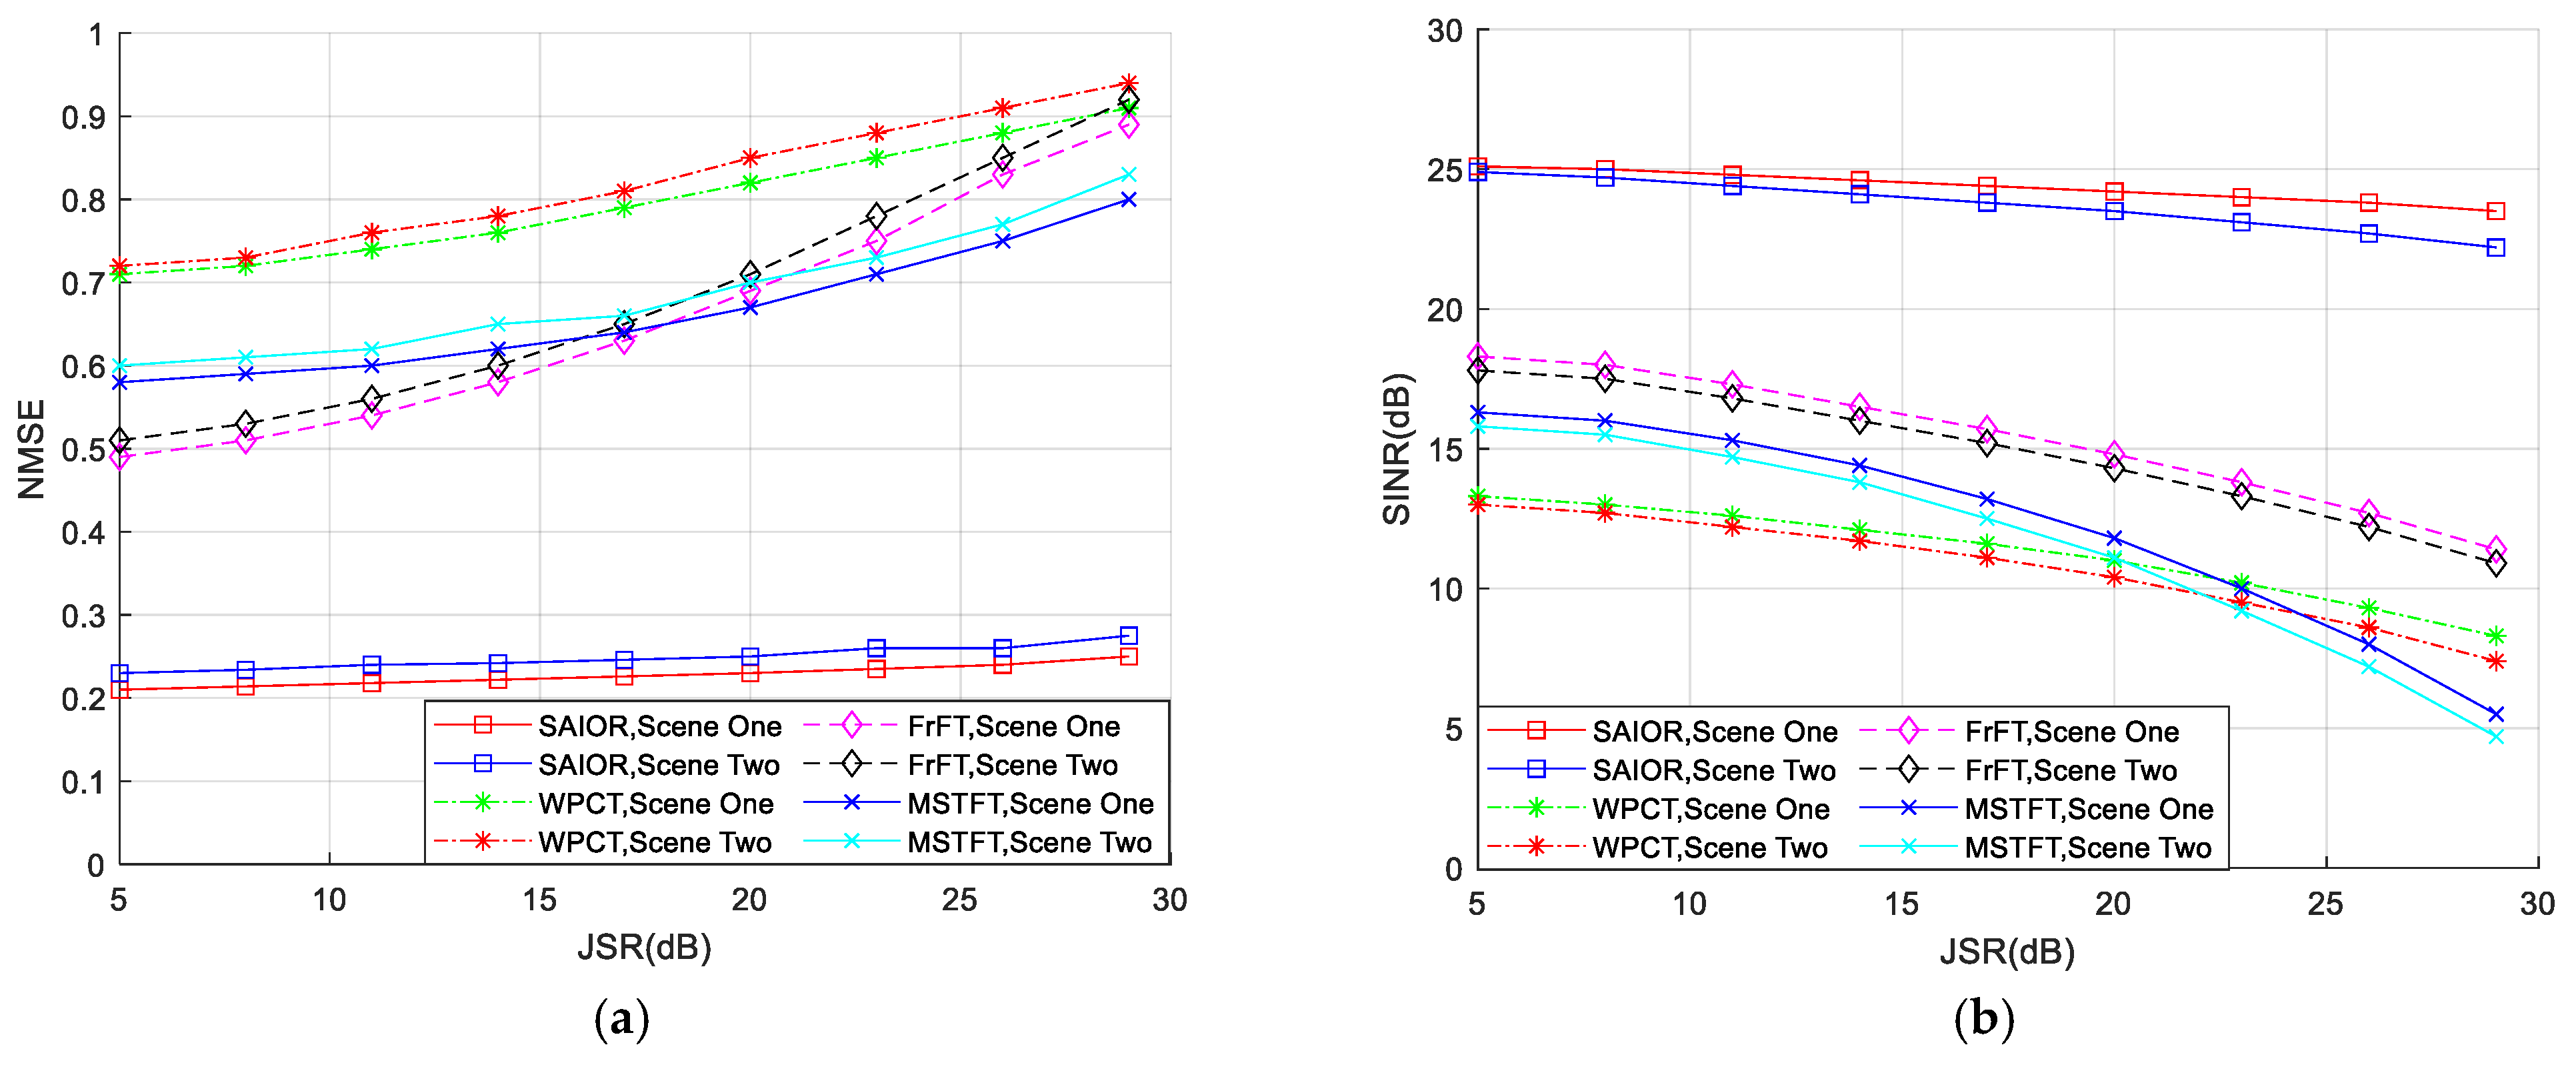
4.1.2. Anti-Jamming Performance Verification

To verify the performance of the proposed algorithm, comparative tests were conducted under different interference scenarios to evaluate the anti-jamming capabilities. Two interference scenarios were designed with the parameters shown in Table 1. The compared algorithms included: Multi-Scale Short-Time Fourier Transform (MSTFT) [30], Adaptive Wavelet Packet Coefficient Threshold (WPCT) [31], and Time-Domain Joint Fractional Fourier Transform (FrFT) [33]. For MSTFT, three scales were adopted with a pole contraction factor of 0.85 for the 2nd-order IIR notch filter. For WPCT, the “Dmey” mother wavelet function was used with 5 decomposition layers, and soft thresholding was applied for interference detection and cancellation. For FrFT, 2000 scanning points were set to search for the optimal order of interference signals, with parameter estimation performed once per data batch.
Figure 7a,b present the normalized mean square error (NMSE) of processed Iridium signals and output signal-to-interference-plus-noise ratio (SINR), respectively, obtained through 50 Monte Carlo experiments under different interference scenarios when the input JSR varies from 5 to 30 dB.
Figure 7 shows that the anti-jamming performance of the SAIOR algorithm is generally better than those of the other compared algorithms, and its output SINR and NMSE degrade slowly with the increase in the input JSR, which ensures the successful acquisition of Iridium signals. The performance of SAIOR is superior because it eliminates high-power Iridium signals before optimized sampling to extract PFM interference, removing the impact of Iridium signals on interference detection. The performance degradation with the increase in the interference energy is not significant because the optimized sampling method effectively concentrates interference components into a few frequency points with high aggregation, reducing overlap between desired signals and interference without dispersion as interference energy increases. Notably, SAIOR performs better in Scenario 1 than Scenario 2 because multi-component PFM interference signals with the same carrier frequency are transformed into single-frequency interference after optimized sampling, while those with different carrier frequencies are concentrated into several single-frequency interferences in the new sampled data. The number of single-frequency points depends on the carrier frequency of PFM interference, meaning that, under the same conditions, the overlap between Iridium signals and interference signals in Scenario 2 is greater than in Scenario 1. When interference is removed, Iridium signals overlapping with interference are damaged, with more severe overlap causing greater signal loss. This is consistent with the SINR and NMSE trends of MSTFT, WPCT, and FrFT.
The anti-jamming performance of MSTFT, WPCT, and FrFT is generally worse because, in LEO satellite anti-jamming scenarios, high-power LEO satellite signals always severely affect and cause misjudgment in interference detection and suppression. The direct application of traditional time–frequency analysis-based interference suppression methods yields poor results. Their performance degrades rapidly with the increase in the input JSR because the overlap between the desired signals and interference signals in the TF or FrFT domain increases with the number or energy of interference signals, damaging desired signals overlapping with interference during suppression, with a more severe overlap causing a greater signal loss. Specifically, when using MSTFT and WPCT for interference suppression, the limited time–frequency resolution of these methods causes a greater energy dispersion of interference in the time–frequency domain as the interference energy increases, affecting desired signals more significantly. Although the FrFT algorithm improves the energy aggregation of PFM interference to some extent, digital FrFT suffers from spectral leakage; so, its interference suppression performance also degrades with the increase in the interference energy.

4.1.3. Simulation of Interference Detection Performance for Anti-Jamming Algorithm

The next step involves verifying the interference detection performance of the proposed algorithm. For this purpose, the Interference Detection Ratio (IDR), denoted as I D R = N d / N j , was defined to evaluate the interference detection performance, where N d represents the number of interference spectral lines detected and determined by the algorithm in the resampled data after secondary sampling when SAIOR is activated in the simulation setup, and N j represents the total number of interference spectral lines of the set interference signals in the resampled data. Three experiments were designed to compare the interference detection performance under different conditions, with the specific simulation parameters shown in the Table 2.
Figure 8 shows the interference spectral line detection rate under different JSR values. The horizontal axis represents the JSR, and the vertical axis represents the interference spectral line detection rate.
Figure 8 demonstrates the following: (1) For the SAIOR algorithm, as the PFM interference modulation period increases, the probability of interference detection decreases. This is because, as the modulation period increases, the amount of resampled data obtained after optimization resampling decreases, and the errors introduced by interference parameter estimation have a greater impact on interference detection. (2) In different scenarios, the interference detection rate of the SAIOR algorithm is always higher than 96%, indicating the algorithm’s excellent performance in suppressing PFM interference.

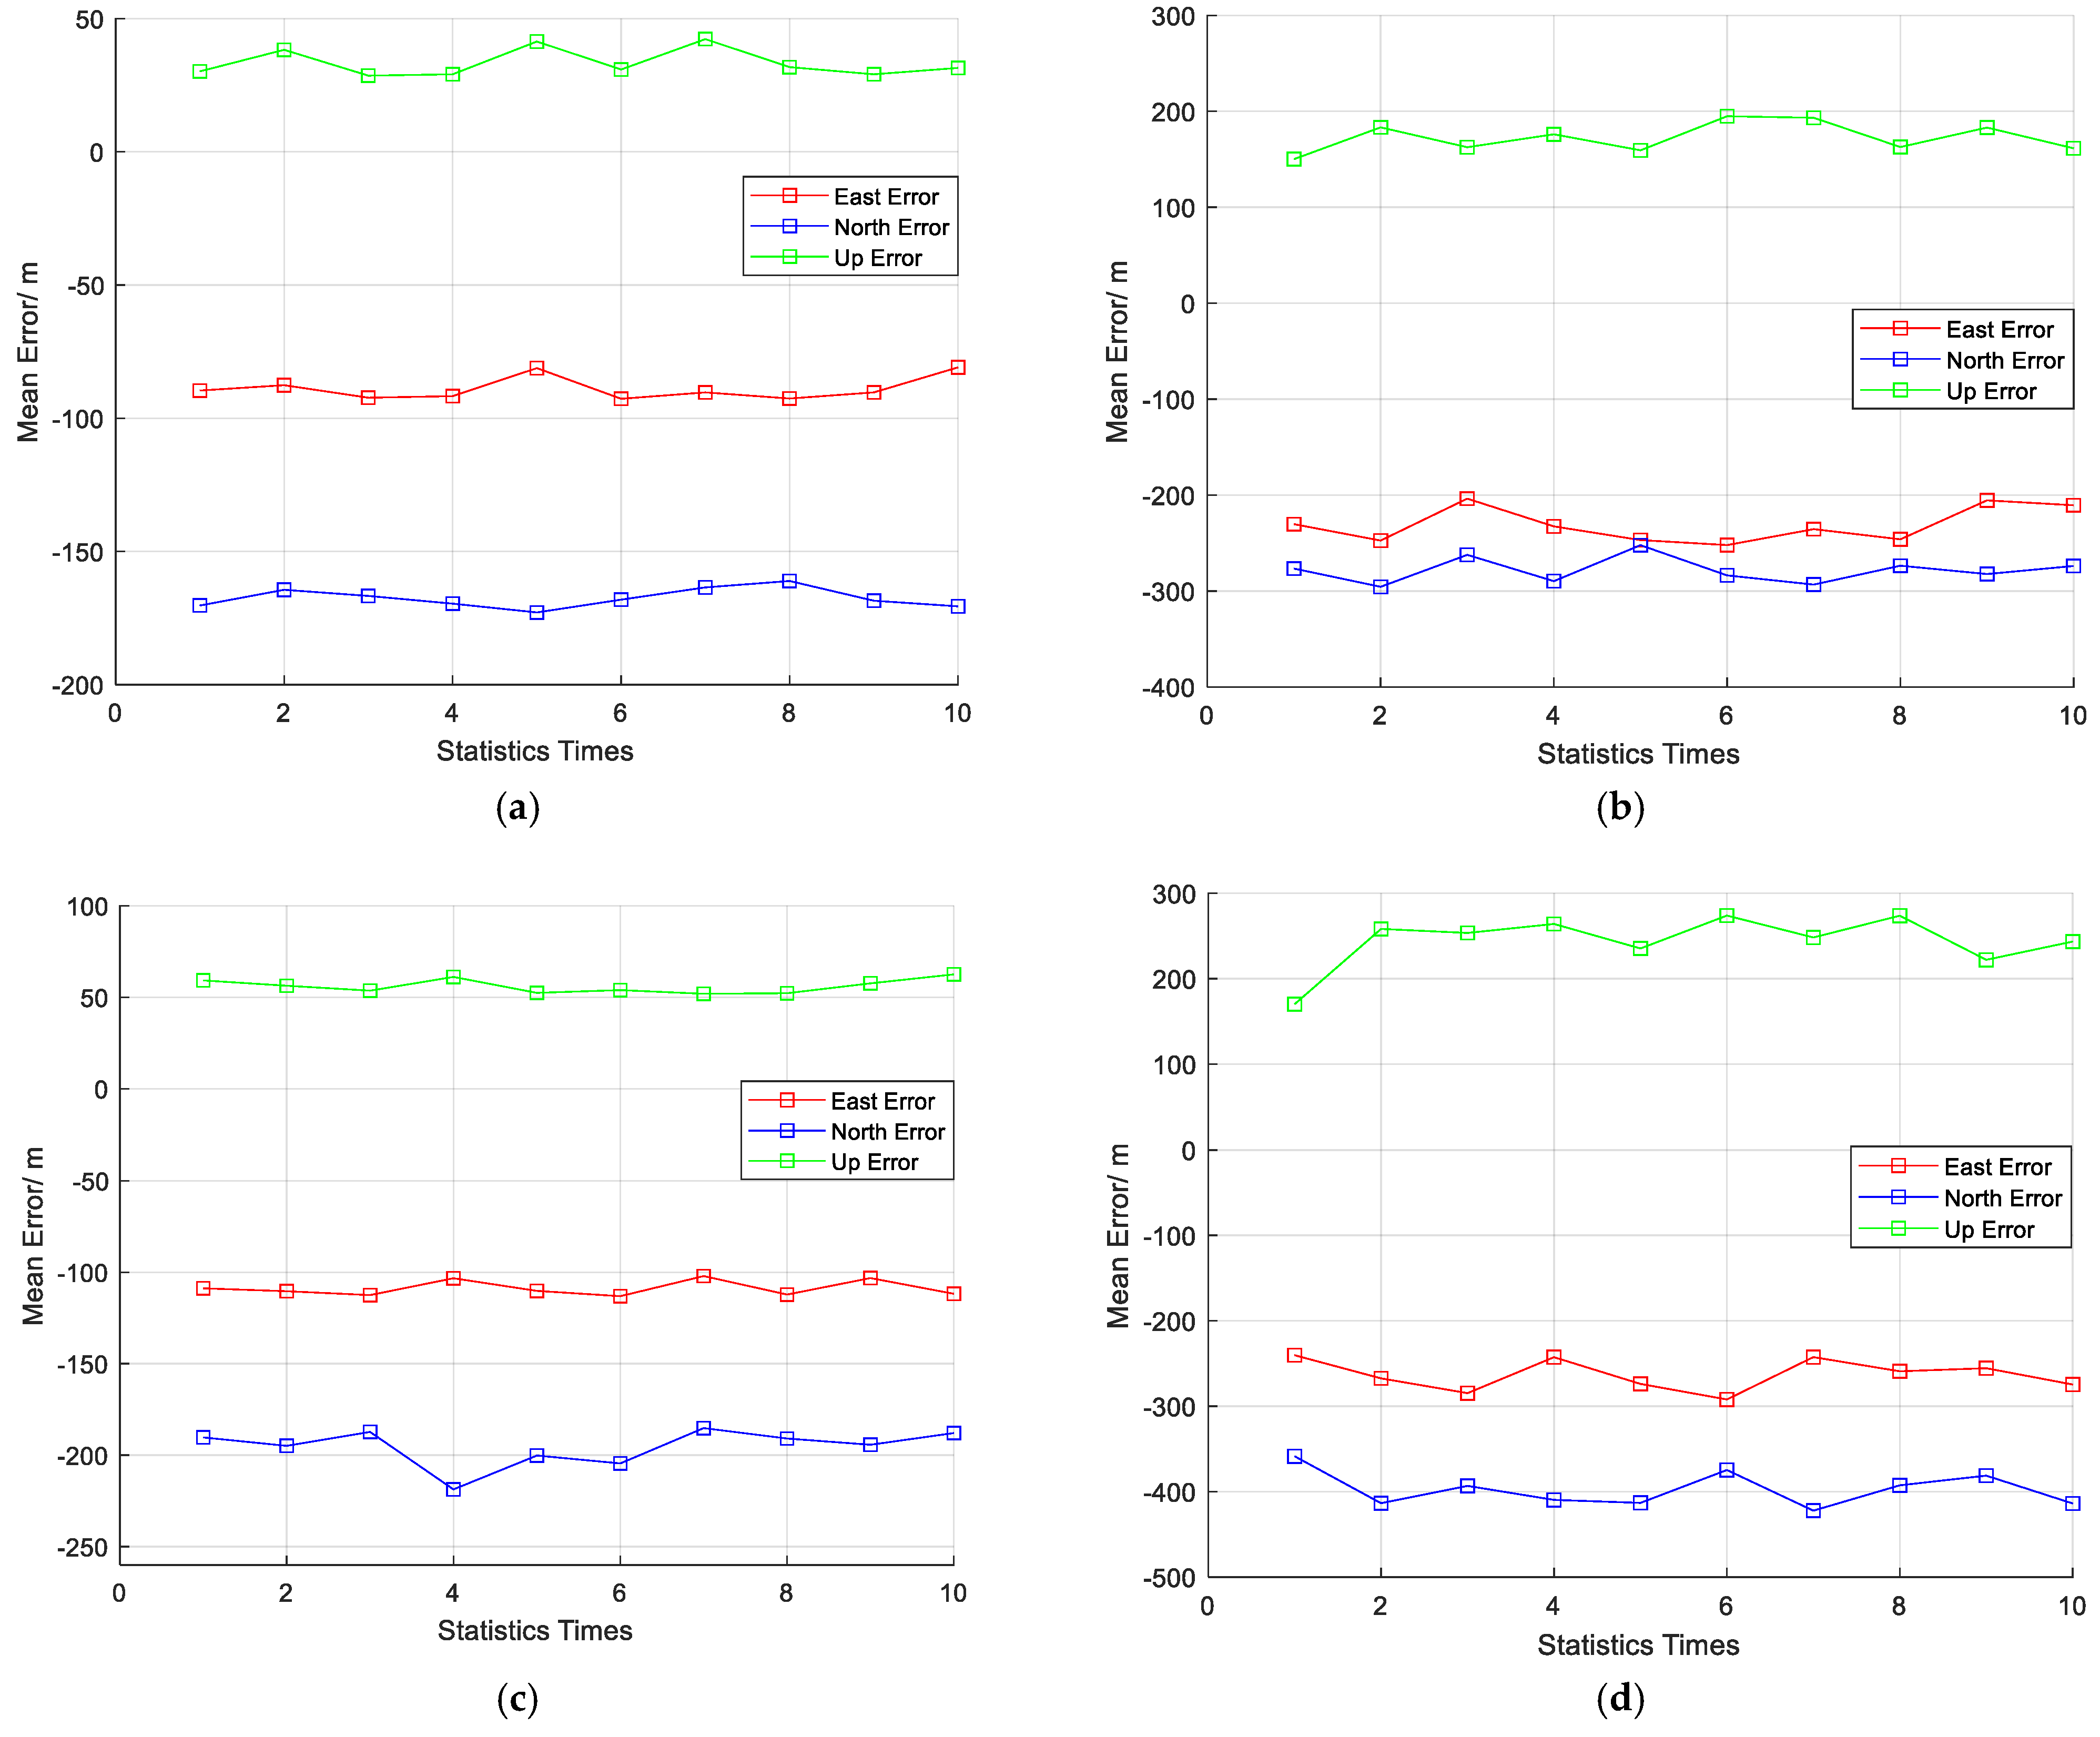
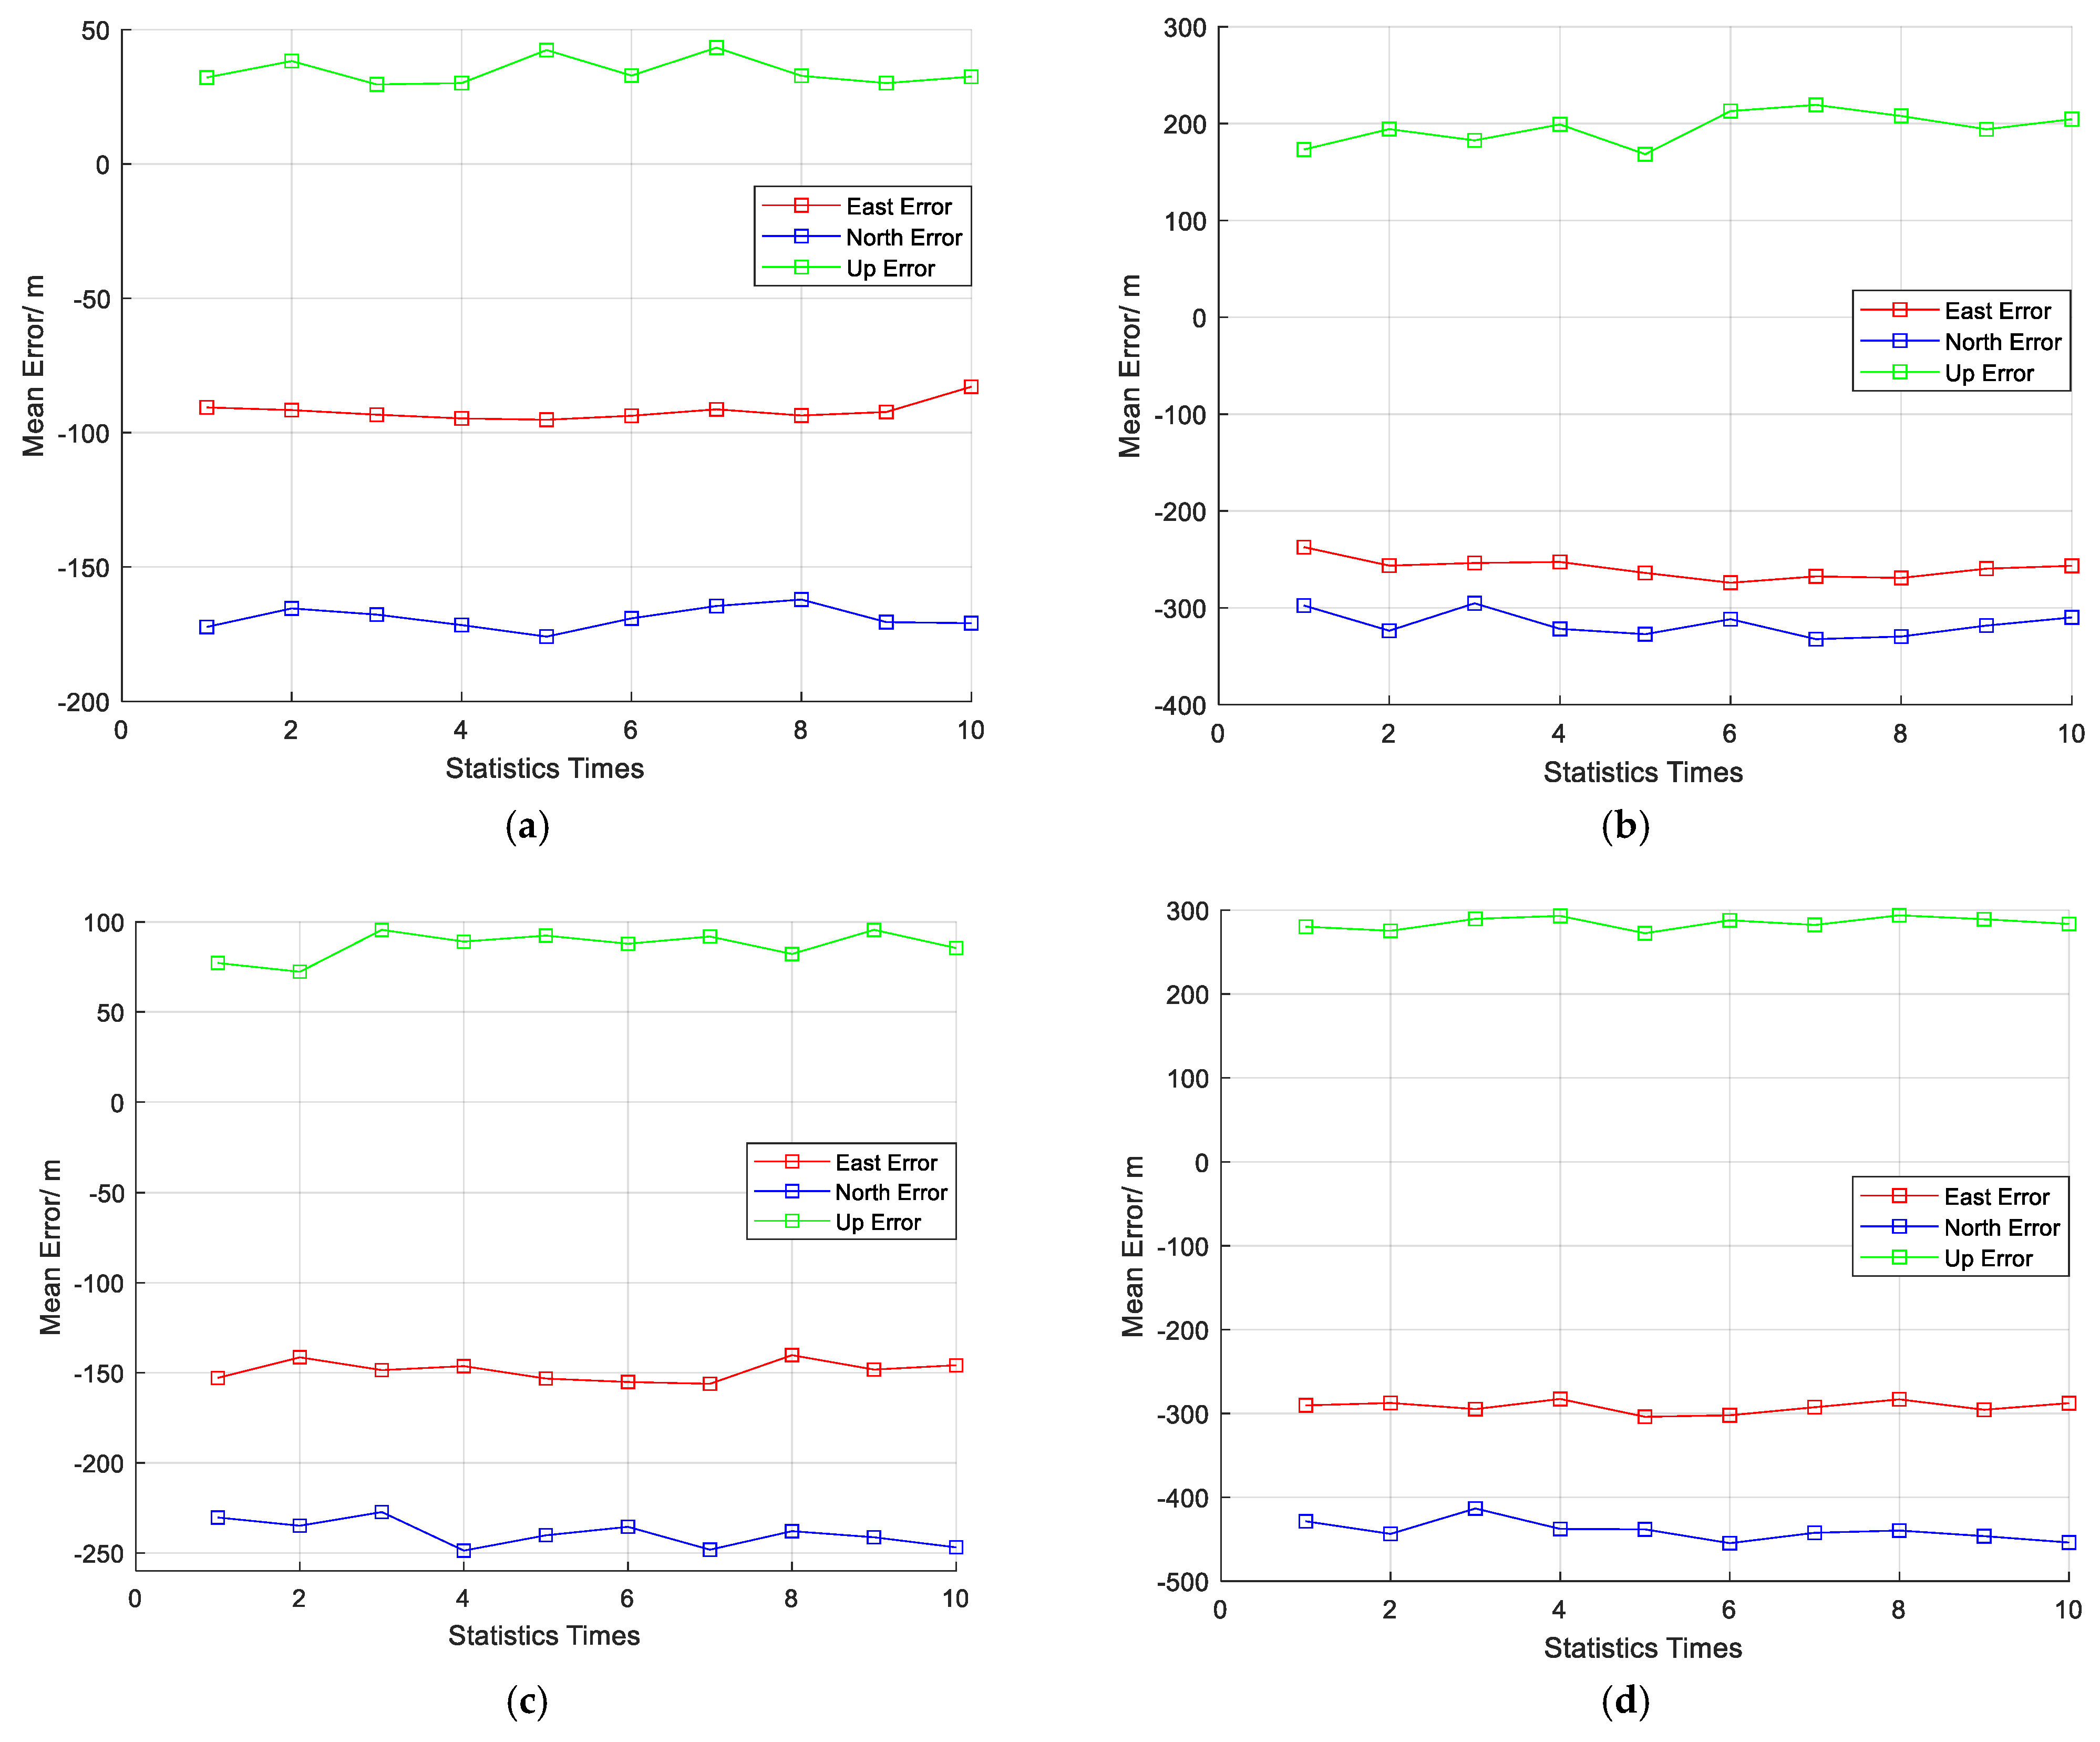
4.2. Actual Experimental Verification

In the above simulation experiments, the SAIOR algorithm’s interference suppression performance was validated. To further assess the effectiveness of the algorithm, a hardware platform was set up on the rooftop of the New Main Building at Beihang University to conduct actual signal anti-jamming experiments. This system uses a dedicated Iridium satellite antenna to capture its signals. Gaussian interference is generated by a signal source and combined with the Iridium signal using a combiner. The combined signal was then frequency-shifted to intermediate frequency (IF) through a down-converter. A sampling rate of 25 MHz was used to collect the signal, which was subsequently processed by the signal reception and processing platform to apply the anti-jamming algorithm and evaluate performance. During the test period, a total of four Iridium satellites were visible. The constellation map corresponding to the visible epoch of the Iridium satellites is shown in Figure 9.
Similarly, two interference scenarios were designed by configuring the signal source, with the interference scenario parameters set as shown in Table 3. The SAIOR algorithm was applied for interference suppression under different interference intensities (with JSR of 15 dB and 25 dB, respectively). The positioning results after interference suppression were then compared with those obtained without applying the interference suppression algorithm and under no interference conditions. The positioning method adopted instantaneous Doppler positioning approach.
The positioning results are statistically analyzed in the East–North–Up (ENU) coordinate system, comparing the positioning errors in the East–West, North–South, and Upward directions with the reference point coordinates. During the result analysis, the average of 50 positioning results was considered as one trial, and a total of 10 trials were conducted. The obtained results are shown in Figure 10, Figure 11 and Figure 12.
The positioning results indicate that, compared to the positioning results under interference-free conditions, the positioning accuracy after interference suppression in interference scenarios shows a certain degree of decline. However, it still successfully retrieves Doppler information and achieves effective positioning. In contrast to interference scenarios where the interference suppression algorithm is not applied, activating the SAIOR algorithm significantly improves the positioning accuracy. The experimental results further validate the effectiveness of the SAIOR algorithm and its interference suppression performance in LEO satellite PFM interference scenarios.

5. Discussion

Both the simulation and experimental results demonstrate that, compared to traditional algorithms, the SAIOR algorithm effectively eliminates single/multi-component PFM interference by leveraging the periodicity of PFM interference signals and the characteristics of LEO constellation signals. It significantly improves interference suppression performance under conditions such as narrow bandwidth and high power, demonstrating a notable enhancement in countering PFM interference for LEO satellite positioning scenarios, which highlights the algorithm’s value. The following aspects warrant further discussion:
(1)
Applicability: This paper proposes a multiple PFM interference suppression algorithm in LEO satellites SOP positioning for single-antenna receivers that requires no prior knowledge. By exploiting the periodicity of PFM interference signals and LEO constellation signal characteristics, the algorithm eliminates the influence of LEO satellite signals in the input signal and concentrates the PFM interference energy—originally spread over a wide bandwidth—into a few frequency bins in the resampled data through optimized sampling. This effectively mitigates single/multi-component PFM interference while minimizing damage to the desired signal during suppression, overcoming the limitations of traditional PFM interference suppression methods under single-antenna LEO signal reception conditions. Thus, the algorithm is suitable for single-antenna-based LEO satellites SOP positioning.
(2)
Limitations: Since optimized sampling was employed, a larger amount of sampled data were required to obtain sufficient resampled data for interference detection and suppression, mitigating the impact of spectral leakage during frequency-domain blanking. The algorithm demands high volumes of original sampled data and future improvements could focus on reducing this requirement.
(3)
Potential Enhancements: Another improvement approach involves establishing a background interference-type database, integrating artificial intelligence for automatic detection and identification, reconstructing interference signals in the background, and then canceling them from the received signal to suppress interference. This could effectively address complex interference forms or multiple interference sources, potentially achieving zero loss to the desired signal under ideal conditions.

6. Conclusions

This paper proposes a SAIOR algorithm based on the narrow downlink bandwidth, high received SNR characteristics of LEO constellation signals, and the periodicity of PFM interference signals. The algorithm concentrates the PFM interference energy originally dispersed over a wide bandwidth into a few frequency bins in the resampled data through appropriate secondary sampling, thereby enhancing interference aggregation. This effectively reduces the overlap between LEO satellite signals and interference, consequently minimizing damage to desired signals during interference suppression. Considering the effects of PFM interference parameters such as bandwidth, carrier frequency, modulation period, and intensity, the algorithm was tested using Iridium signals from the LEO system through anti-jamming simulations and real data experiments. The results demonstrate that, compared to traditional algorithms, this method effectively eliminates single/multi-component PFM interference, improving interference suppression performance under conditions of narrow bandwidth and high power. It significantly enhances anti-PFM interference performance in LEO satellite anti-jamming scenarios.

Author Contributions

Conceptualization, L.Y.; methodology, L.Y.; validation, L.Y.; formal analysis, L.Y.; investigation, L.Y.; resources, H.Q., D.X. and H.S.; data curation, Y.Z., C.M. and X.F.; writing—original draft preparation, L.Y.; writing—review and editing, L.Y., H.Q., H.X., D.X., D.H., B.G., H.S., Y.Z., H.Z., N.X., Z.L., C.M. and X.F.; project administration, H.Q., B.G., H.Z. and Z.L.; funding acquisition, D.H., H.S., J.S. and F.C.; visualization, J.S. and F.C.; supervision, B.G., H.Z. and Z.L. All authors have read and agreed to the published version of the manuscript.

Funding

This research received no external funding.

Data Availability Statement

The data are inconvenient to be directly disclosed. The data presented in this study are available upon request from the corresponding author.

Acknowledgments

We would like to thank the editor and the anonymous reviewers for their useful feedback that improved this paper.

Conflicts of Interest

The authors declare no conflicts of interest. The company had no role in the design of the study; in the collection, analyses, or interpretation of data; in the writing of the manuscript; and in the decision to publish the results.

References

  1. Wu, M.; Wang, K.; Wang, J.; Xie, W.; Liu, J.; Chen, B.; Ge, Y.; El-Mowafy, A.; Yang, X. Impact of Latency and Continuity of GNSS Products on Filter-Based Real-Time LEO Satellite Clock Determination. Remote Sens. 2024, 16, 4315. [Google Scholar] [CrossRef]
  2. Gao, W.; Chen, L.; Lv, F.; Zhan, X.; Chen, L.; Liu, Y.; Dai, Y.; Jin, Y. Initial Design for Next-Generation BeiDou Integrity Subsystem: Space–Ground Integrated Integrity Monitoring. Remote Sens. 2024, 16, 4333. [Google Scholar] [CrossRef]
  3. Wang, Y.; Yue, D.; Wang, H.; Ma, H.; Liu, Z.; Yue, C. Comprehensive Analysis of BDS/GNSS Differential Code Bias and Compatibility Performance. Remote Sens. 2024, 16, 4217. [Google Scholar] [CrossRef]
  4. Xiang, Y.; Qin, M.; Chen, Y.; Xing, Y.; Bian, Y. Co-Seismic and Post-Seismic Slip Properties Associated with the 2024 M 7.5 Noto Peninsula, Japan Earthquake Determined by GNSS Observations. Remote Sens. 2024, 16, 4057. [Google Scholar] [CrossRef]
  5. Wei, H.; Xiao, G.; Zhou, P.; Li, P.; Xiao, Z.; Zhang, B. Combining Galileo HAS and Beidou PPP-B2b with Helmert Coordinate Transformation Method. GPS Solut. 2025, 29, 35. [Google Scholar] [CrossRef]
  6. Zhang, K.; Li, X.; Chen, L.; Liu, Z.; Xie, Y. Impact Analysis of Orthogonal Circular-Polarized Interference on GNSS Spatial Anti-Jamming Array. Remote Sens. 2024, 16, 4506. [Google Scholar] [CrossRef]
  7. Zhou, P.; Xiao, G.; Du, L. Initial performance assessment of Galileo High Accuracy Service with software-defined receiver. GPS Solut. 2024, 28, 2. [Google Scholar] [CrossRef]
  8. Li, X.; Lu, Z.; Yuan, M.; Liu, W.; Wang, F.; Yu, Y.; Liu, P. Tradeoff of Code Estimation Error Rate and Terminal Gain in SCER Attack. IEEE Trans. Instrum. Meas. 2024, 73, 8504512. [Google Scholar] [CrossRef]
  9. Dominik, M.; Alexander, R. Automated Method for SLAM Evaluation in GNSS-Denied Areas. Remote Sens. 2023, 15, 5141. [Google Scholar] [CrossRef]
  10. Xu, H.; Wang, C.; Bo, Y.; Jiang, C.; Liu, Y.; Yang, S.; Lai, W. An Aerial and Ground Multi-Agent Cooperative Location Framework in GNSS-Challenged Environments. Remote Sens. 2022, 14, 5055. [Google Scholar] [CrossRef]
  11. Kassas, Z.M.; Khalife, J.; Abdallah, A.A.; Lee, C. I Am Not Afraid of the GPS Jammer: Resilient Navigation Via Signals of Opportunity in GPS-Denied Environments. IEEE Aerosp. Electron. Syst. Mag. 2022, 37, 4–19. [Google Scholar] [CrossRef]
  12. Zhang, Y.; Ho, K.C. Localization by Signals of Opportunity in the Absence of Transmitter Position. IEEE Trans. Signal Process. 2022, 70, 4602–4617. [Google Scholar] [CrossRef]
  13. Hu, Z.; Li, S.; Xiang, Y. Time Information Transmission Based on FM Broadcast Signal. IEEE Access 2021, 9, 16360–16364. [Google Scholar] [CrossRef]
  14. Han, K.; Yu, S.M.; Kim, S.-L.; Ko, S.-W. Exploiting User Mobility for WiFi RTT Positioning: A Geometric Approach. IEEE Internet Things J. 2021, 8, 14589–14606. [Google Scholar] [CrossRef]
  15. Neinavaie, M.; Khalife, J.; Kassas, Z. Acquisition, Doppler tracking, and positioning with Starlink LEO satellites: First results. IEEE Trans. Aerosp. Electron. Syst. 2021, 58, 2606–2610. [Google Scholar] [CrossRef]
  16. Farhangian, F.; Landry, J. Multi-constellation software-defined receiver for Doppler positioning with LEO satellites. Sensors 2020, 20, 5866. [Google Scholar] [CrossRef]
  17. Duran, M.A.C.; D’Amico, A.A.; Dardari, D.; Rydström, M.; Sottile, F.; Ström, E.G.; Taponecco, L. Chapter 3—Terrestrial Network-Based Positioning and Navigation. In Satellite and Terrestrial Radio Positioning Techniques; Dardari, D., Falletti, E., Luise, M., Eds.; Academic Press: Oxford, UK, 2012; pp. 75–153. [Google Scholar]
  18. Khalife, J.; Kassas, Z. Performance-driven design of carrier phase differential navigation frameworks with megaconstellation LEO satellites. IEEE Trans. Aerosp. Electron. Syst. 2023, 59, 2947–2966. [Google Scholar] [CrossRef]
  19. Morales, J.; Khalife, J.; Kassas, Z.M. Simultaneous Tracking of Orbcomm LEO Satellites and Inertial Navigation System Aiding Using Doppler Measurements. In Proceedings of the 2019 IEEE 89th Vehicular Technology Conference (VTC2019-Spring), Kuala Lumpur, Malaysia, 28 April–1 May 2019; pp. 1–6. [Google Scholar]
  20. Khairallah, N.; Kassas, Z.M. Ephemeris Closed-Loop Tracking of LEO Satellites with Pseudorange and Doppler Measurements. In Proceedings of the 34th International Technical Meeting of the Satellite Division of The Institute of Navigation (ION GNSS+ 2021), St. Louis, MO, USA, 20–24 September 2021; pp. 2544–2555. [Google Scholar]
  21. Morales-Ferre, R.; Lohan, E.S.; Falco, G.; Falletti, E. GDOP-based analysis of suitability of LEO constellations for future satellite-based positioning. In Proceedings of the 2020 IEEE International Conference on Wireless for Space and Extreme Environments (WiSEE), Vicenza, Italy, 12–14 October 2020; pp. 147–152. [Google Scholar]
  22. Leng, M.; Razul, S.G.; See, C.M.S.; Tay, W.P.; Cheng, C.; Quitin, F. Joint Navigation and Synchronization Using SOOP in GPS-Denied Environments: Algorithm and Empirical Study. In Proceedings of the 2015 Sensor Signal Processing for Defence (SSPD), Edinburgh, UK, 9–10 September 2015; IEEE: New York, NY, USA, 2015; pp. 1–5. [Google Scholar]
  23. Parkinson, B.W.; Spliker, J.J. Global Positioning System: Theory and Application; American Insitute of Aeronautics and Astronautics Inc.: Cambridge, MA, USA, 1996. [Google Scholar]
  24. Farhangian, F.; Landry, R. High-order pseudorange rate measurement model for multi-constellation LEO/INS integration: Case of Iridium-NEXT, Orbcomm, and Globalstar. Proc. Inst. Mech. Eng. Part G J. Aerosp. Eng. 2023, 237, 925–939. [Google Scholar] [CrossRef]
  25. Mitch, R.H.; Dougherty, R.C.; Psiaki, M.L.; Powell, S.P.; O’Hanlon, B.W.; Bhatti, J.A.; Humphreys, T.E. Signal characteristics of civil GPS Jammers. In Proceedings of the 24th ION GNSS, Portland, OR, USA, 20–23 September 2011; pp. 1907–1919. [Google Scholar]
  26. Mitch, R.; Psiaki, M.; Ertan, T. Chirp-style GNSS jamming signal tracking and geolocation. Navigat. J. Inst. Navigat. 2016, 63, 15–35. [Google Scholar] [CrossRef]
  27. Dovis, F. GNSS Interference Threats and Countermeasures; Artech House: Norwood, MA, USA, 2015. [Google Scholar]
  28. Ioannides, R.; Pany, T.; Gibbons, G. Known vulnerabilities of global navigation satellite systems, status, and potential mitigation techniques. Proc. IEEE 2016, 104, 1174–1194. [Google Scholar] [CrossRef]
  29. Gao, G.; Sgammini, M.; Lu, M.; Kubo, N. Protecting GNSS receivers from jamming and interference. Proc. IEEE 2016, 104, 1327–1338. [Google Scholar] [CrossRef]
  30. Rezaei, M.; Mosavi, M.; Abedi, M. New GPS anti-jamming system based on multiple short-time Fourier transform. IET Radar Sonar Navigat. 2016, 10, 807–815. [Google Scholar] [CrossRef]
  31. Mosavi, M.; Pashaian, M.; Rezaei, M.; Mohammadi, K. Jamming mitigation in global positioning system receivers using wavelet packet coefficients thresholding. IET Signal Process. 2015, 9, 457–464. [Google Scholar] [CrossRef]
  32. Sun, K.; Jin, T.; Yang, D. An improved time-frequency analysis method in interference detection for GNSS receivers. Sensors 2015, 15, 9404–9426. [Google Scholar] [CrossRef]
  33. Huang, K.; Tao, R.; Wu, K.; Wang, Y. Study on interference suppression based on joint fractional Fourier domain and time domain. Sci. China Technol. Sci. 2011, 54, 2674–2686. [Google Scholar] [CrossRef]
  34. Yao, L.; Qin, H.; Gu, B.; Shi, G.; Sha, H.; Wang, M.; Xian, D.; Chen, F.; Lu, Z. A Study on Anti-Jamming Algorithms in Low-Earth-Orbit Satellite Signal-of-Opportunity Positioning Systems for Unmanned Aerial Vehicles. Drones 2024, 8, 164. [Google Scholar] [CrossRef]
  35. Braun, T.M. Satellite Communications Payload and System; John Wiley & Sons: Hoboken, NJ, USA, 2012; pp. 552–559. [Google Scholar]
  36. Iridium Burst Detector and Demodulator. GNU Radio Iridium Out of Tree Module. 2019. Available online: https://github.com/muccc/gr-iridium (accessed on 4 July 2023).
  37. Iridium NEXT Engineering Statement. FCC File Number 1031348. Available online: https://fcc.report/IBFS/SAT-MOD-20131227-00148/1031348.pdf (accessed on 2 April 2024).
Figure 1. The SAIOR algorithm framework.
Remotesensing 17 01571 g001
Figure 2. Signal power spectrum variation in the algorithm.
Remotesensing 17 01571 g002
Figure 3. Change in power spectrum before and after anti-jamming under weak interference for scenario 1 (JSR 15 dB). (a) Before anti-jamming. (b) The resampled data obtained by optimizing the sampling of the original received signal. (c) After anti-jamming.
Remotesensing 17 01571 g003
Figure 4. Change in power spectrum before and after anti-jamming under weak interference for scenario 2 (JSR 15 dB). (a) Before anti-jamming. (b) The resampled data obtained by optimizing the sampling of the original received signal. (c) After anti-jamming.
Remotesensing 17 01571 g004
Figure 5. Change in power spectrum before and after anti-jamming under strong interference for scenario 1 (JSR 25 dB). (a) Before anti-jamming. (b) The resampled data obtained by optimizing the sampling of the original received signal. (c) After anti-jamming.
Remotesensing 17 01571 g005
Figure 6. Change in power spectrum before and after anti-jamming under strong interference for scenario 2 (JSR 25 dB). (a) Before anti-jamming. (b) The resampled data obtained by optimizing the sampling of the original received signal. (c) After anti-jamming.
Remotesensing 17 01571 g006
Figure 7. Anti-jamming performance verification of each algorithm under jamming scenarios. (a) NMSE of desired signal after interference suppression. (b) Output SINR after interference suppression.
Remotesensing 17 01571 g007
Figure 8. Interference detection ratio (IDR). (a) Scene one. (b) Scene two. (c) Scene three.
Remotesensing 17 01571 g008
Figure 9. Constellation map during the satellite visibility period.
Remotesensing 17 01571 g009
Figure 10. Positioning result without interference.
Remotesensing 17 01571 g010
Figure 11. Comparison of positioning results of scene one. (a) Positioning result after anti-jamming (JSR is 15 dB). (b) Positioning result without anti-jamming algorithm (JSR is 15 dB). (c) Positioning result after anti-jamming (JSR is 25 dB). (d) Positioning result without anti-jamming algorithm (JSR is 25 dB).
Remotesensing 17 01571 g011
Figure 12. Comparison of positioning results of scene two. (a) Positioning result after anti-jamming (JSR is 15 dB). (b) Positioning result without anti-jamming algorithm (JSR is 15 dB). (c) Positioning result after anti-jamming (JSR is 25 dB). (d) Positioning result without anti-jamming algorithm (JSR is 25 dB).
Remotesensing 17 01571 g012
Table 1. Experiment parameter setting of signal power spectrum simulation.
Interference ScenarioCarrier Frequency (MHz)Modulation Period (μs)Bandwidth (kHZ)
Dual-Component PFM Interference Scenario 1270360; 420400; 250
Dual-Component PFM Interference Scenario 2270; 280360; 420400; 250
Table 2. Experiment parameter setting of the interference detection performance.
ParametersScene OneScene TwoScene Three
Offset between the PFM Interference Carrier Frequency and the Signal Center Frequency0 kHz100 kHz200 kHz
Modulation Period360 μs, 720 μs, 1080 μs
JSR5 dB–30 dB, the step is 2 dB
Table 3. Experiment parameter setting.
Interference ScenarioCarrier Frequency (MHz)Modulation Period (μs)Bandwidth (kHZ)
Dual-Component PFM Interference Scenario 11626.25360; 420400; 250
Dual-Component PFM Interference Scenario 21626.25; 1626.26360; 420400; 250
Disclaimer/Publisher’s Note: The statements, opinions and data contained in all publications are solely those of the individual author(s) and contributor(s) and not of MDPI and/or the editor(s). MDPI and/or the editor(s) disclaim responsibility for any injury to people or property resulting from any ideas, methods, instructions or products referred to in the content.

