Article

LiDAR-Based Road Cracking Detection: Machine Learning Comparison, Intensity Normalization, and Open-Source WebGIS for Infrastructure Maintenance

1
DICEAA, Department of Civil, Environmental Engineering and Architecture, University of L’Aquila, Via Gronchi 18, 67100 L’Aquila, Italy
2
Lyles School of Civil Engineering, Purdue University, West Lafayette, IN 47907, USA
*
Author to whom correspondence should be addressed.
Remote Sens. 2025, 17(9), 1543; https://doi.org/10.3390/rs17091543
Submission received: 10 March 2025 / Revised: 17 April 2025 / Accepted: 22 April 2025 / Published: 26 April 2025

Abstract

:
This study introduces an innovative and scalable approach for automated road surface assessment by integrating Mobile Mapping System (MMS)-based LiDAR data analysis with an open-source WebGIS platform. In a U.S.-based case study, over 20 datasets were collected along Interstate I-65 in West Lafayette, Indiana, using the Purdue Wheel-based Mobile Mapping System—Ultra High Accuracy (PWMMS-UHA), following Indiana Department of Transportation (INDOT) guidelines. Preprocessing included noise removal, resolution reduction to 2 cm, and ground/non-ground separation using the Cloth Simulation Filter (CSF), resulting in Bare Earth (BE), Digital Terrain Model (DTM), and Above Ground (AG) point clouds. The optimized BE layer, enriched with intensity and color information, enabled crack detection through Density-Based Spatial Clustering of Applications with Noise (DBSCAN) and Random Forest (RF) classification, with and without intensity normalization. DBSCAN parameter tuning was guided by silhouette scores, while model performance was evaluated using precision, recall, F1-score, and the Jaccard Index, benchmarked against reference data. Results demonstrate that RF consistently outperformed DBSCAN, particularly under intensity normalization, achieving Jaccard Index values of 94% for longitudinal and 88% for transverse cracks. A key contribution of this work is the integration of geospatial analytics into an interactive, open-source WebGIS environment—developed using Blender, QGIS, and Lizmap—to support predictive maintenance planning. Moreover, intervention thresholds were defined based on crack surface area, aligned with the Pavement Condition Index (PCI) and FHWA standards, offering a data-driven framework for infrastructure monitoring. This study emphasizes the practical advantages of comparing clustering and machine learning techniques on 3D LiDAR point clouds, both with and without intensity normalization, and proposes a replicable, computationally efficient alternative to deep learning methods, which often require extensive training datasets and high computational resources.

1. Introduction

The integrity of road infrastructure is a cornerstone of transportation safety and efficiency. However, road corridors face a myriad of challenges, from the occlusion of signage due to overgrown vegetation to the structural degradation of bridges and pavements [1,2]. Among these challenges, the formation and progression of road surface cracks remain one of the most pressing issues for transportation networks worldwide. Cracks not only compromise driving conditions but also accelerate the deterioration of the road structure, leading to costly repairs and potential safety hazards if not addressed in a timely manner [3]. In recent years, road maintenance authorities globally have recognized the importance of early detection and intervention to mitigate these risks. Many European countries have adopted advanced technologies to monitor road conditions, striving to balance accuracy, efficiency, and cost-effectiveness [4,5,6]. Similarly, in the United States, state transportation agencies like the Indiana Department of Transportation (INDOT) are tasked with managing extensive road networks under significant stress from heavy traffic. For instance, Interstate I-65, connecting Lafayette to Indianapolis, is a critical corridor that endures continuous wear and tear from freight and commuter vehicles [7]. This degradation is exacerbated by environmental factors, particularly the freeze–thaw cycle [8]. Water infiltrates cracks in the pavement, freezes, expands, and further damages the asphalt, a phenomenon magnified by fluctuating winter temperatures typical of Indiana [3]. The intensification of these cycles, linked to climate change, underscores the urgency of proactive maintenance strategies to mitigate long-term infrastructure damage [9].
To address these challenges, recent advancements in Mobile Mapping Systems (MMSs) have revolutionized the collection and analysis of road surface data, particularly for crack detection using LiDAR technology [10]. Wheel-based MMS platforms, equipped with LiDAR and imaging sensors, enable the high-precision capture of 3D point clouds along road corridors at normal driving speeds [11]. This approach facilitates the identification of surface anomalies, including road cracks, through automated data processing techniques [12]. These systems are mounted on vehicles, allowing them to efficiently traverse extensive road networks while maintaining consistent data quality [13]. By leveraging automated processing techniques on LiDAR-based MMS data, the detection of surface anomalies, including cracks, significantly reduces the labor and time required for traditional manual inspections, providing a scalable and cost-effective solution for road condition monitoring [14,15]. Indeed, early detection of cracks is critical to preventing long-term damage and ensuring safer driving conditions. Several studies have explored crack detection using image-based and LiDAR data processing techniques, demonstrating the effectiveness of automated approaches in road surface assessment [16].
In addition to LiDAR-based approaches, image-based crack detection methods, such as those leveraging convolutional neural networks (CNNs) and traditional computer vision techniques, have also been widely explored [17]. These methods rely on high-resolution imagery to identify and classify cracks based on their visual features [18]. While image-based approaches offer advantages in texture analysis and are often computationally less intensive, they may be more sensitive to lighting conditions and surface obstructions [19]. Several studies have demonstrated the effectiveness of combining image-based and LiDAR-based methodologies to enhance crack detection accuracy and robustness [17]. Given the variety of approaches available for crack detection, including image-based and LiDAR-based techniques, selecting an effective methodology requires balancing accuracy, interpretability, and computational efficiency [20]. While deep learning models applied to image-based crack detection have shown promising results, they often require extensive labeled datasets and high computational power [21]. In this context, clustering and machine learning-based approaches, such as Density-Based Spatial Clustering of Applications with Noise (DBSCAN) and Random Forest (RF), provide practical and scalable alternatives for processing road surface data [22,23].
The use of methods such as DBSCAN and RF offers a practical and efficient framework for identifying and classifying road surface cracks [24]. These methods were selected due to their simplicity, computational efficiency, and robustness in handling real-world data [25]. While deep learning approaches have gained significant attention in recent years, DBSCAN and Random Forest offer interpretable and scalable solutions, particularly in scenarios with computational constraints or limited training data. Moreover, DBSCAN is particularly effective in identifying noise and outliers, while Random Forest provides reliable performance with partially labeled datasets [26,27,28].
DBSCAN, a clustering approach, is designed to detect groups of data points with irregular shapes, which can be particularly useful for identifying road surface cracks. Its ability to handle noisy data and operate without the need to predefine the number of clusters provides an opportunity to analyze the variability inherent in geospatial datasets [29]. Similarly, Random Forest, a machine learning classifier, offers an effective approach for managing complex, high-dimensional datasets, enabling a detailed assessment of relevant features [30]. This study introduces a novel comparative framework using DBSCAN and Random Forest, applied both with and without intensity normalization, to assess their performance on LiDAR-based MMS point clouds for detecting road surface cracks. This comparative evaluation offers valuable insights into their individual capabilities for processing geospatial data and their effectiveness in point cloud-based crack detection—an aspect that has been less explored in the literature.
This research applies the DBSCAN and Random Forest framework to analyze a critical segment of Interstate I-65 using MMS data. MMS technology, renowned for its high-resolution and rapid data acquisition, serves as the foundation for identifying and classifying longitudinal and transverse cracks. By employing metrics such as true positive rate, false positive rate, precision, recall, and F1-score, the study provides a comprehensive assessment of the performance of these techniques, consistent with previous research on crack detection using machine learning approaches [31,32].
By focusing on the I-65 case study, this research not only demonstrates the efficacy of the proposed approach in a real-world scenario but also offers a new, interpretable, and resource-efficient alternative to deep learning methods. The methodology enables automated crack detection using point clouds without relying on large labeled datasets or high-performance computing. Moreover, the integration with an open-source WebGIS tool makes this pipeline practical and ready for adoption by public infrastructure authorities, representing a significant step forward in data-driven road maintenance. Additionally, the integration of open-source WebGIS enhances accessibility by providing an interactive platform for visualizing and communicating the automated detection of road surface cracks. This facilitates efficient monitoring, management, and decision-making by enabling stakeholders to assess pavement conditions remotely. WebGIS solutions have been successfully implemented in various domains, including regional infrastructure management and cultural heritage documentation. For instance, open-source WebGIS platforms have been developed in one Italian region for public works management, supporting the digitalization of administrative processes and improving infrastructure oversight [33]. By leveraging geospatial information science, this study contributes to more sustainable and data-driven infrastructure maintenance practices, demonstrating the broad applicability of open-source WebGIS in transportation and beyond.
The paper is structured as follows: in Section 2, materials and methods are described, including a brief description of the test sites; Section 3 contains the obtained results after the processing, followed by the discussion of the results in Section 4; then, the conclusions are reported in Section 5.

2. Materials and Methods

In this study, a total of 27 datasets were collected along a highway using a wheel-based MMS developed by the Digital Photogrammetry Research Group (DPRG) at Purdue University. Detailed information regarding the system’s configuration and specifications is provided in the following section. Detailed information regarding the system’s configuration and specifications is provided in the Data Acquisition Systems section, while the Study Areas section describes the surveyed locations. The proposed methodology follows a multi-step approach designed to identify and analyze pavement cracks from point cloud data. The workflow integrates data acquisition, preprocessing, feature extraction, classification, and validation, leveraging a combination of geomatic and machine learning techniques.

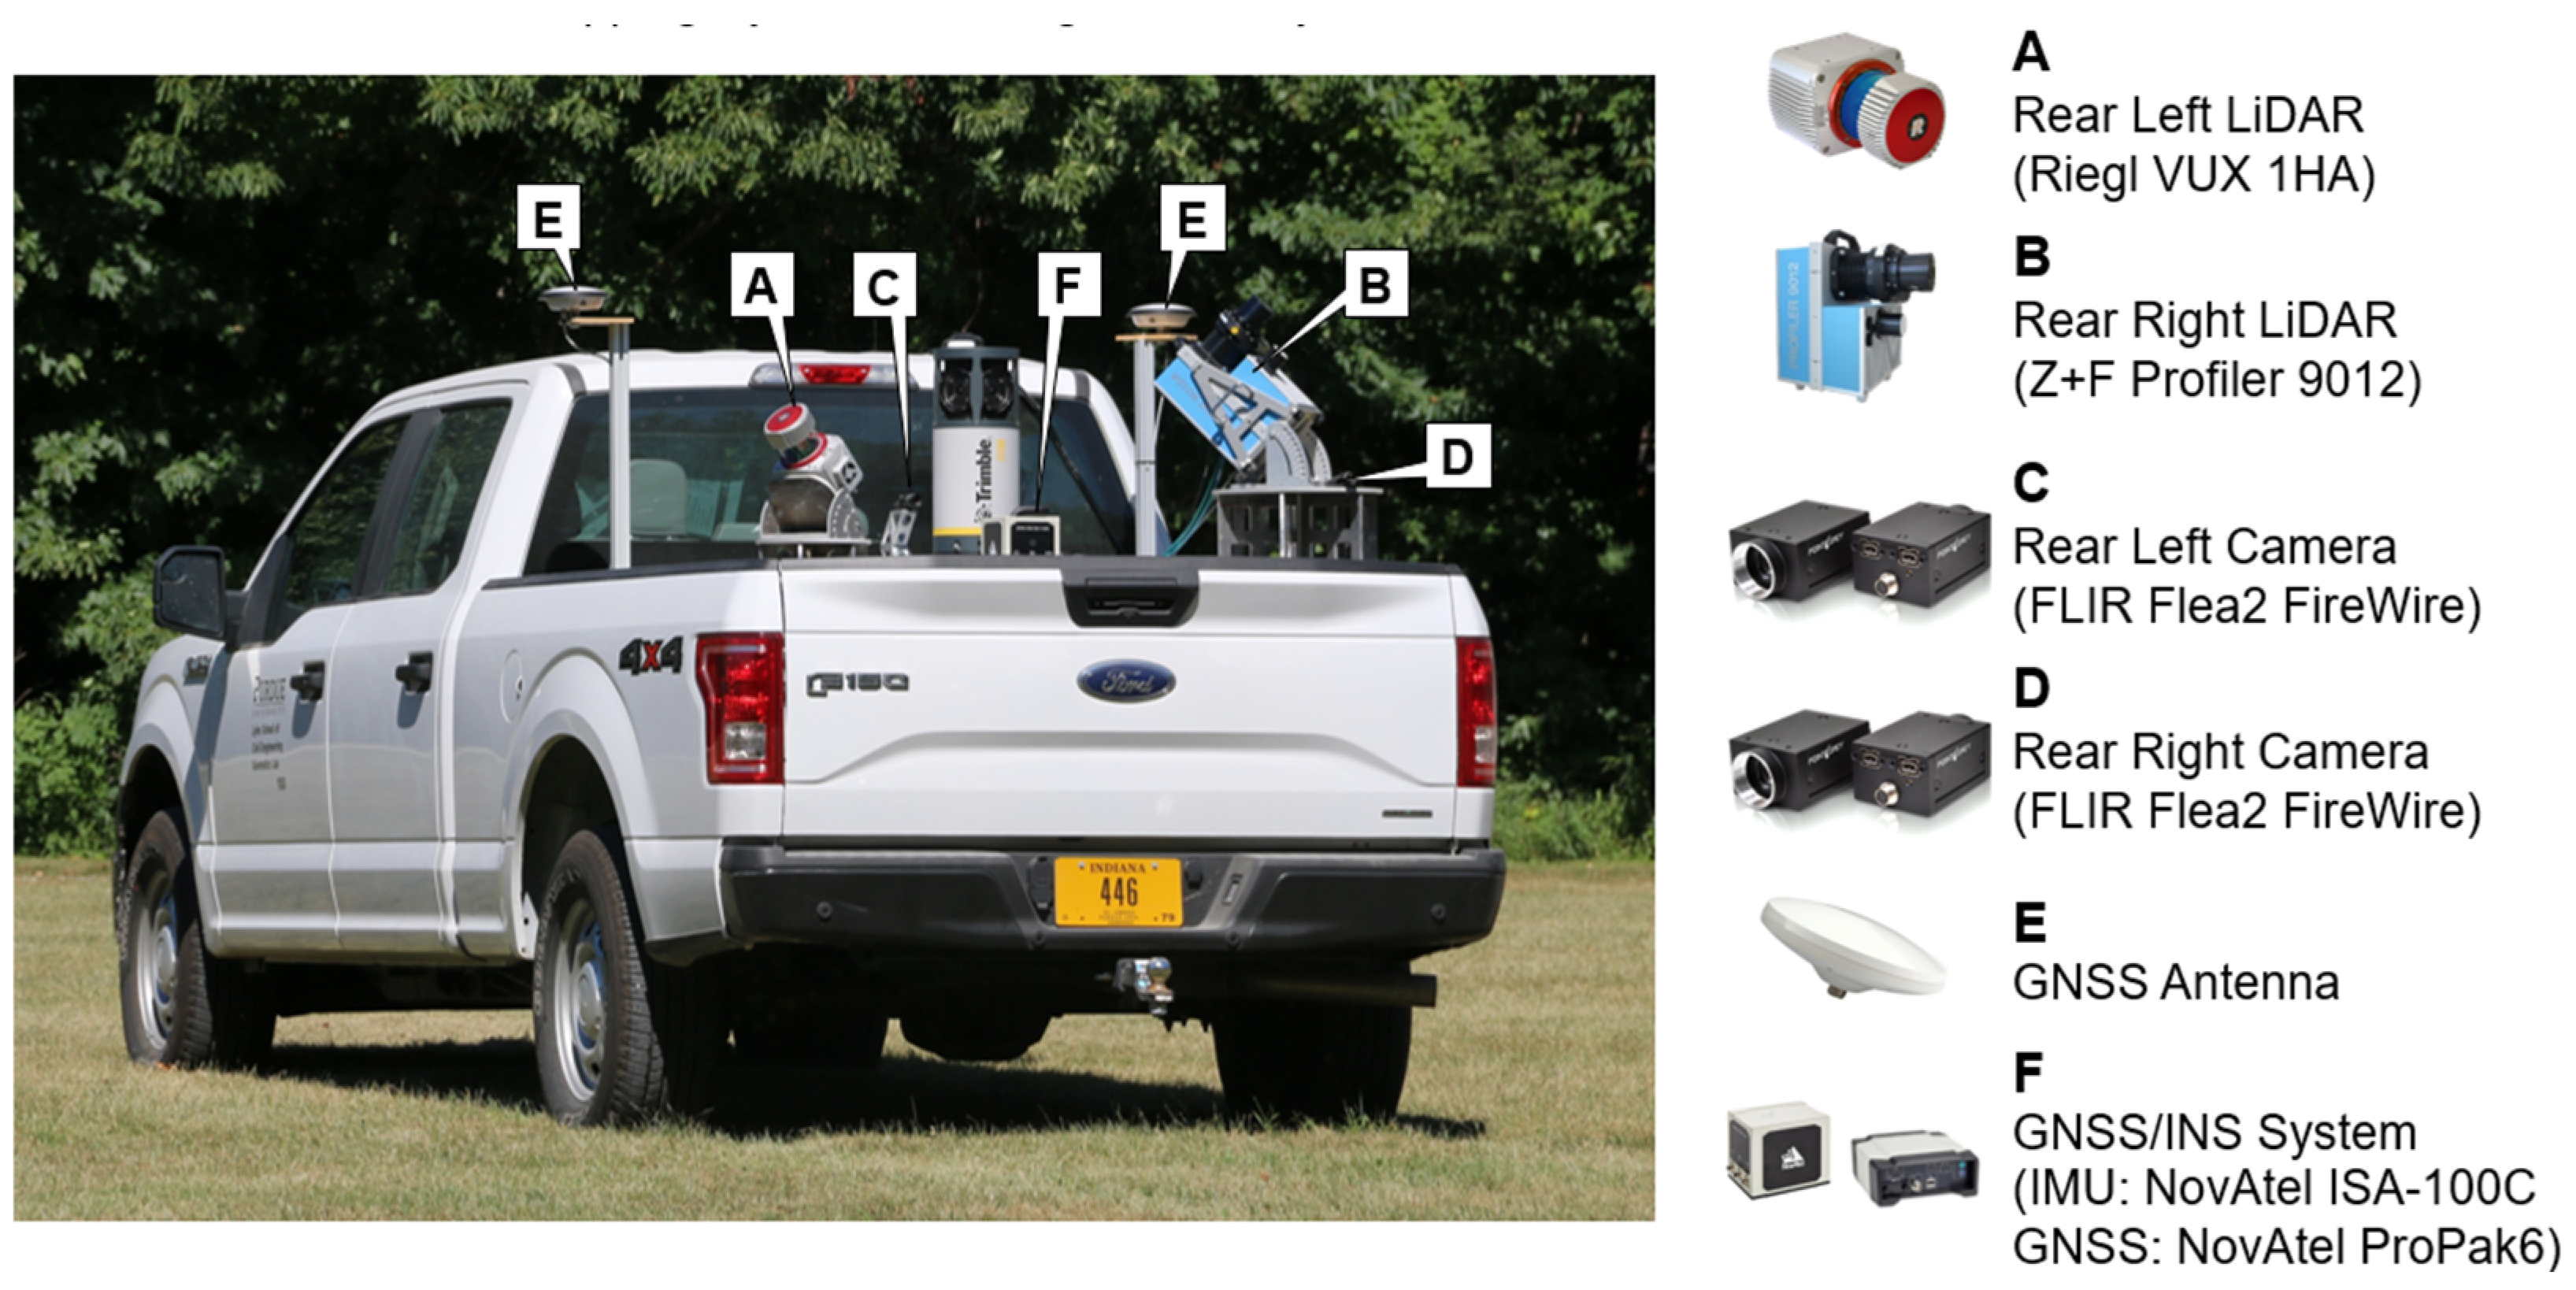
2.1. Data Acquisition Systems

The LiDAR datasets were acquired using the Purdue Wheel-based Mobile Mapping System—Ultra High Accuracy (PWMMS-UHA), a non-commercial platform specifically designed and integrated by the DPRG research group. As illustrated in Figure 1, this system incorporates a precise sensor configuration that ensures the acquisition of high-resolution LiDAR data, which is crucial for detailed road surface analysis and crack detection. The PWMMS-UHA is equipped with two high-accuracy LiDAR units—Riegl VUX-1HA and Z + F Profiler 9012—along with two FLIR Flea2 FireWire cameras and a NovAtel ProPak6 GNSS receiver. This receiver is integrated with an ISA-100C near-navigation-grade Inertial Measurement Unit (IMU), and together they form a GNSS/INS system. The Inertial Navigation System (INS) operates by fusing data from the GNSS and IMU components, allowing for continuous and accurate estimation of the platform’s position and orientation throughout the survey. The system offers exceptional measurement precision, with a range accuracy of ±5 mm for the VUX-1HA and ±3 mm for the Profiler 9012. The integrated GNSS/IMU system achieves a positional accuracy of ±1–2 cm, while the attitude accuracy reaches ±0.003° for roll and pitch and ±0.004° [34,35,36].
The choice of a vehicle-mounted MMS over UAV-based photogrammetry or handheld SLAM solutions is motivated by several factors, including operational efficiency, continuous data acquisition over long linear infrastructures, and reduced dependency on GNSS signal stability in complex environments. Previous studies have highlighted the advantages of mobile mapping for road surface inspection, particularly in terms of accuracy and data completeness, making it a preferred approach for large-scale infrastructure monitoring [37,38].

2.2. Study Areas

This study evaluates the classification performance and adaptability of crack detection methodologies using a dataset acquired from two LiDAR sensors along State Highway I-65 in West Lafayette, Indiana, U.S.A. The study area extends over 50 miles of highway and includes 27 regions of interest (ROIs) strategically selected near bridges to encompass a diverse range of surface conditions. These locations were chosen to account for critical structural and environmental factors such as proximity to bridges, variations in road surface materials, and traffic-induced wear, ensuring a comprehensive assessment of crack detection performance. The LiDAR datasets were collected on 23 February 2021 under predefined acquisition settings to ensure consistency and accuracy. The survey was conducted with stable vehicle positioning, controlled sensor calibration, and optimal scanning parameters to minimize external interferences. The use of dual LiDAR sensors enables high-resolution point cloud acquisition, ensuring detailed and reliable representation of road surface anomalies. Figure 2 provides a subset of the visual inspection of the 27 studied segments, with each segment color-coded based on intensity thresholding to highlight surface feature variations and facilitate crack identification. Figure 3 presents an overview of the study site, displaying the data collection route and bridge locations along the highway with an aerial perspective derived from Google Earth imagery. The inset offers a zoomed-in visualization of a representative road surface segment, further contextualizing the dataset.

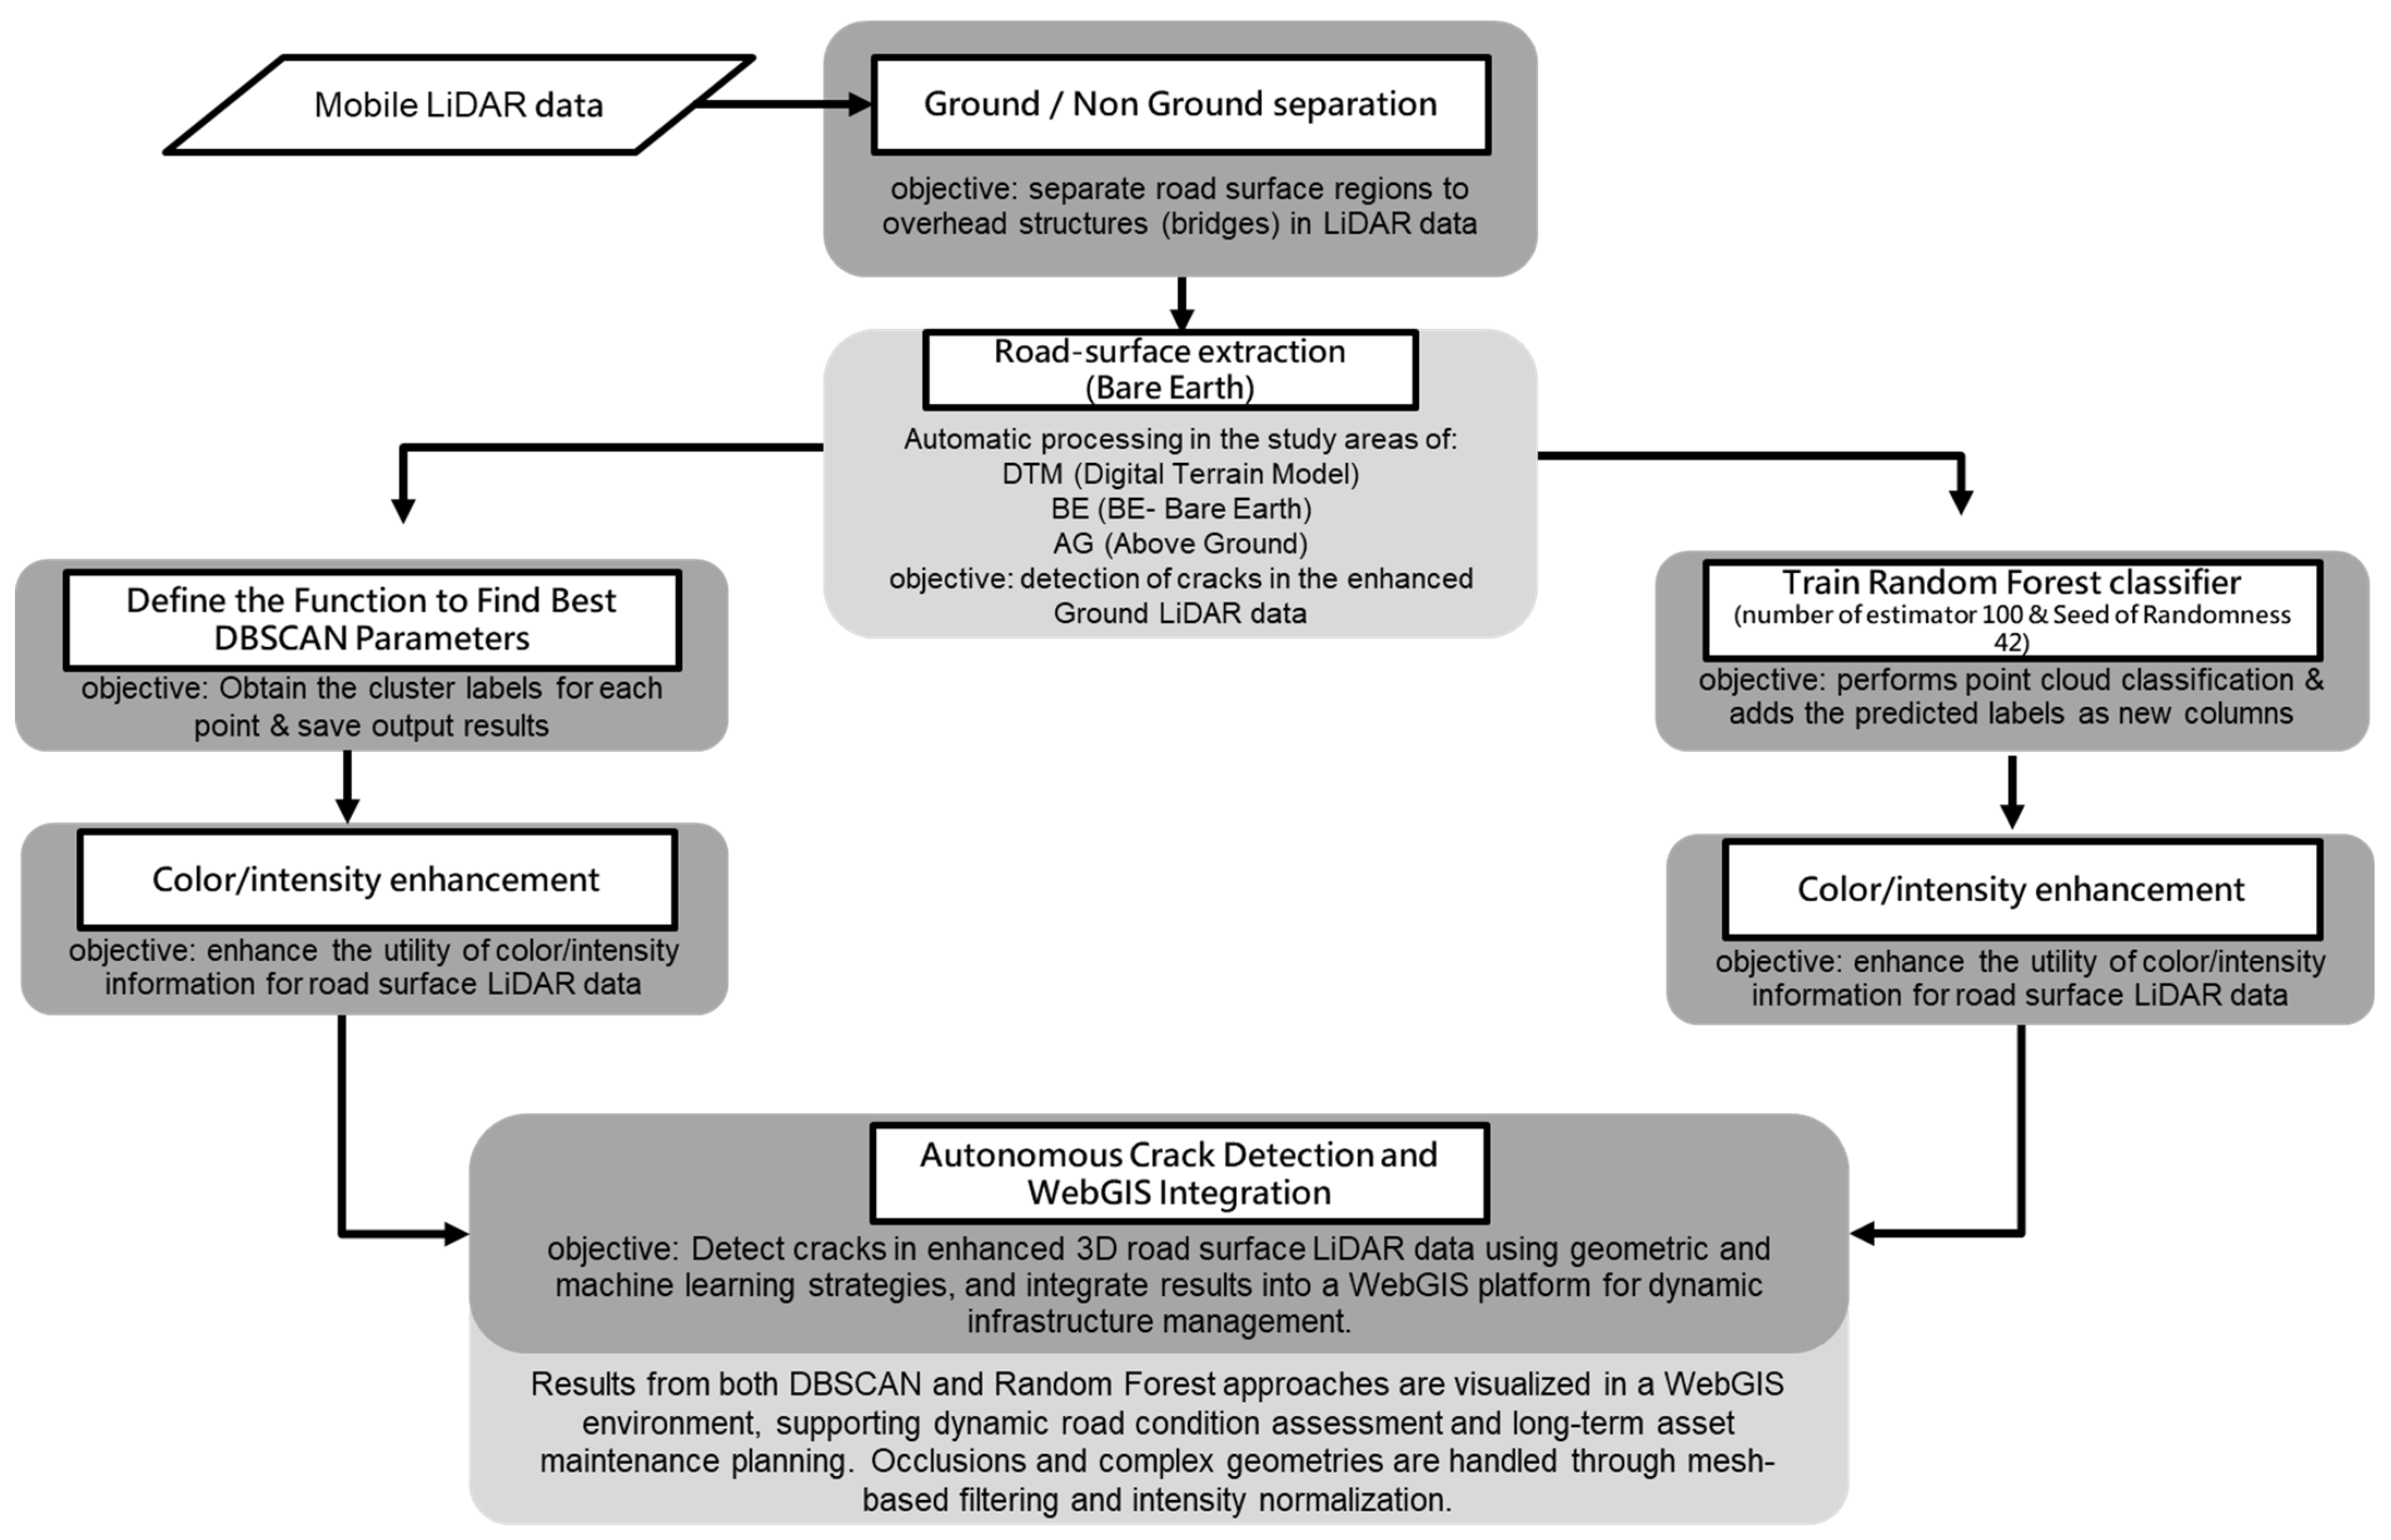
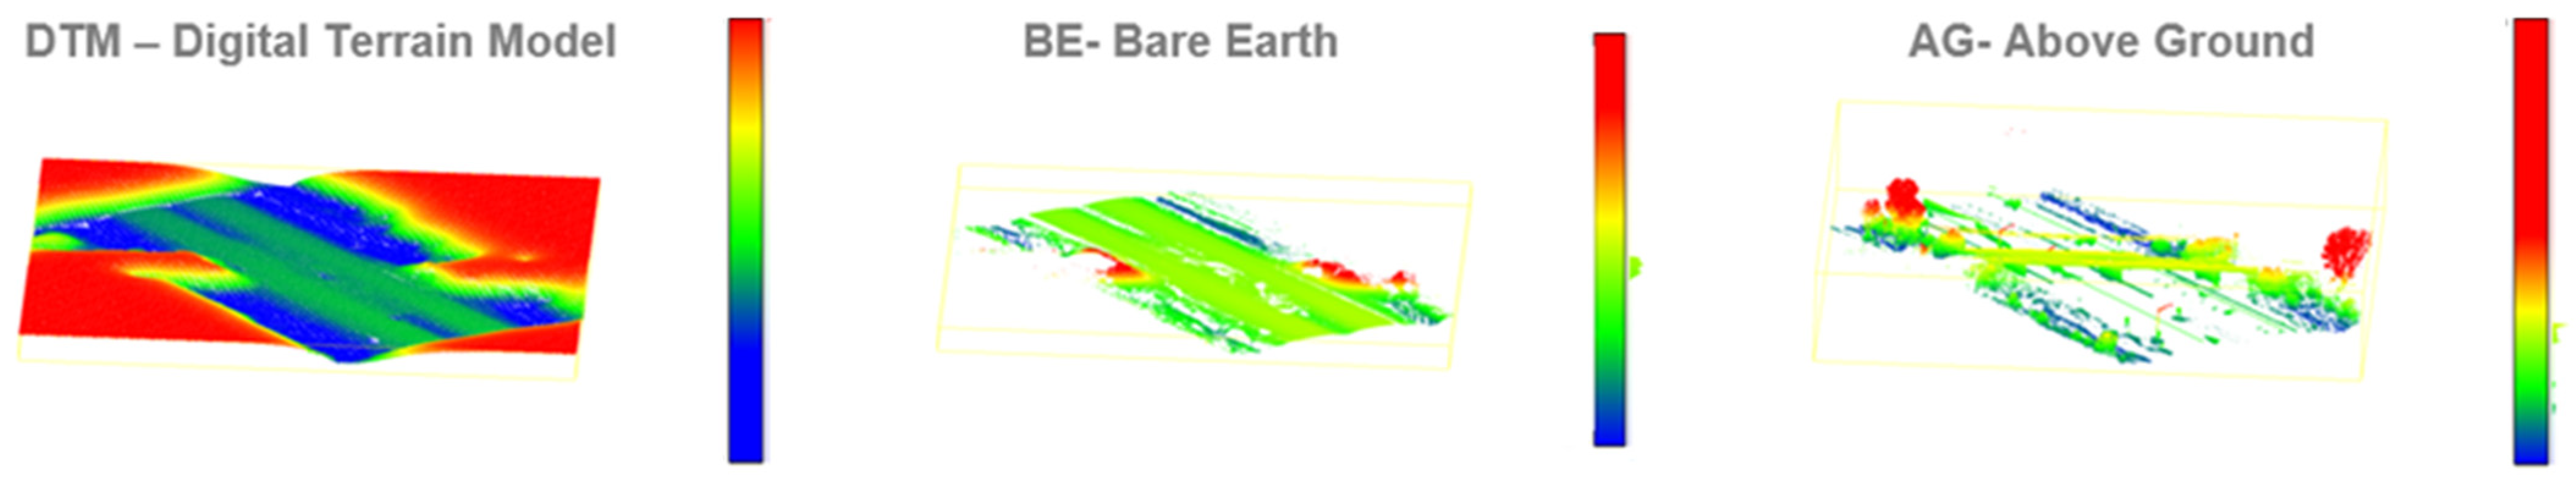
2.3. Proposed Methodology

This section details the methodology for detecting and classifying road surface cracks through a comparative analysis of clustering-based and machine-learning-based classification algorithms. The process commenced with the preprocessing of MMS LiDAR data. Preprocessing steps included noise removal and distance-based downsampling to achieve a consistent point cloud resolution of 5 cm. These steps ensured uniform data quality and computational efficiency, creating a robust foundation for subsequent analyses. Figure 4 presents the general workflow adopted in this study, encompassing all stages from the acquisition of mobile LiDAR data to the final step of autonomous crack detection. The workflow incorporates essential intermediate processes such as road surface extraction and Digital Terrain Model (DTM) generation, where the DTM, derived using adaptive cloth simulation, provides an estimate of the underlying ground surface. This terrain model is subsequently used to classify points into Bare Earth (BE) and Above Ground (AG), and point cloud classification. This systematic representation offers a clear and comprehensive overview of the methodology, emphasizing its structured and multi-step nature.
Following the preprocessing stage, the Cloth Simulation Filtering (CSF) method, initially proposed by [39], was applied iteratively to extract the DTM and separate BE points from AG points. CSF operates by inverting the point cloud and simulating a virtual cloth that deforms under gravitational forces until it conforms to the terrain surface. The method is widely regarded as reliable and adaptable for ground classification in LiDAR datasets.
To further enhance the precision of the terrain extraction, an adaptive extension of CSF, as proposed by [40], was incorporated into the workflow. This adaptive variant adjusts the rigidity of the simulated cloth dynamically based on local point density, ensuring robust performance even in regions with sparse BE points. The iterative application of this method—comprising steps such as outlier removal, point cloud inversion, and repeated simulations until convergence—effectively distinguished road surfaces from overlying structures, making it an invaluable tool for infrastructure monitoring.
The methodology’s effectiveness was validated across multiple regions of interest (ROIs). Figure 5 illustrates a representative tile, clearly demonstrating the separation of DTM, BE, and AG points. These results highlight the robustness and scalability of the proposed workflow, reinforcing its applicability for large-scale road surface crack detection and analysis.
Following the preprocessing stage, candidate crack points were identified from the entire point cloud of each segment using an intensity thresholding approach. This analysis was conducted with and without normalized intensity to evaluate its impact on crack detection accuracy. Intensity normalization (IN) is a critical preprocessing technique designed to reduce variations in LiDAR intensity caused by scanning range, incidence angle, and surface reflectivity, thereby enhancing data consistency and reliability [41]. Traditionally, IN has been extensively applied for lane signal detection, as demonstrated by [42]. This study extends its application to the detection of pavement cracks, emphasizing the differences in identifying possible structural anomalies.
The normalization process is grounded on the principle that intensity values should remain independent of external factors such as sensor-to-target distance and beam incidence angle. Raw intensity values are inherently affected by range, reflectivity, and surface orientation, which can introduce inconsistencies in the analysis. Intensity normalization addresses these dependencies, providing a standardized dataset suitable for robust pavement anomaly detection. For multi-beam LiDAR systems, the process typically includes intra-sensor correction to mitigate range dependencies and inter-sensor normalization to ensure consistency across beams.
In this research, an intensity correction step was first applied to mitigate range and incidence angle dependencies, followed by intensity normalization to ensure consistency across different LiDAR beams. This process was implemented using a MATLAB-based framework (MATLABR2020a). The LiDAR point cloud was segmented into manageable tiles to facilitate the processing of large datasets. A polynomial function was applied to correct range-dependent intensity variations within localized segments of 50–100 m, ensuring consistency within each beam. Additionally, an intensity correction step was applied to account for variations due to the incident angle. Following this, inter-sensor normalization was performed using a look-up table (LUT) approach to harmonize intensity values across multiple beams. The LUT was constructed based on a calibration process between multiple LiDAR beams, where each beam’s intensity data were mapped to a reference beam’s values. This normalization ensures that intensity values are harmonized across beams, regardless of differences in sensor properties. The LUT was applied to each LiDAR point in the cloud, adjusting the intensity values according to the specific sensor it was captured with. The processed data were then exported in LAS format for advanced analysis of pavement anomalies, including longitudinal and transverse cracks. Previous studies demonstrated that intensity normalization significantly enhances lane marking detection by improving data uniformity [43]. Building on these findings, this research evaluates the role of intensity correction and normalization in identifying pavement cracks, emphasizing their contribution to ensuring data consistency across different LiDAR systems. While these methods have proven effective lane marking extraction, their application to pavement anomaly detection remains an area of ongoing investigation.
To enhance the crack identification process, the DBSCAN approach was employed, both with and without normalized intensity. DBSCAN was utilized to cluster candidate crack points, facilitating the differentiation between actual cracks and noise, which is crucial for ensuring accurate pavement assessment. Its density-based clustering method allows for the identification of meaningful crack patterns from scattered outliers, improving the reliability of crack detection results.
DBSCAN is widely recognized in spatial data analysis for its ability to detect clusters of arbitrary shapes and manage noise without requiring a predefined number of clusters [44]. These attributes make it particularly advantageous for analyzing road infrastructure datasets, which often exhibit variable density and irregular geometries [45]. Unlike traditional clustering methods, DBSCAN does not rely on assumptions about the number of clusters, making it more adaptable to complex data structures. Furthermore, its ability to identify noise points is especially beneficial for mobile mapping and pavement assessment applications, as it minimizes false detections and enhances crack delineation.
Previous studies have demonstrated DBSCAN’s effectiveness in detecting pavement anomalies and clustering crack points. For instance, successfully applied DBSCAN to Mobile Laser Scanning (MLS) point cloud data for segmenting pavement cracks, leveraging intensity thresholding to pre-identify candidate points before clustering them for further analysis [46]. Similarly, in this study, DBSCAN was employed as a refinement step to cluster crack regions. The algorithm used a neighborhood distance threshold (ε) and a minimum number of neighboring points (minPts) as clustering parameters. To eliminate spurious detections, clusters with a spread below a user-defined threshold (tMin_Length) were removed.
Given the dependency of DBSCAN’s performance on dataset characteristics, particularly point density variations, an iterative parameter tuning process was implemented. A random subset of the dataset was used to optimize DBSCAN parameters (ε and minPts) by maximizing the silhouette score, ensuring robust clustering performance. These optimized parameters were then applied to the entire dataset to maintain consistency across different road segments. The workflow for applying DBSCAN in this study involved several key steps, from preprocessing to clustering and result evaluation. For performance evaluation, a reference dataset was generated through manual visual inspection of the LiDAR point clouds using CloudCompare. The annotation process was carried out by experienced researchers from the team, who manually labeled both longitudinal and transverse cracks across all 27 road segments. These expert-labeled annotations served as the ground truth to validate the results of the clustering and classification algorithms.
Quantitative assessments were conducted using precision, recall, and F1-score metrics to comprehensively evaluate DBSCAN’s effectiveness in crack detection.
In addition to the clustering approaches, an RF classification method was implemented. RF is an ensemble machine learning algorithm widely applied in classification and regression tasks. Introduced by [47], RF constructs multiple decision trees during training using a bagging strategy, where random subsets of data and features are sampled for each tree.
For classification tasks, the final prediction is determined by a majority vote, while for regression tasks, it is based on the mean prediction from individual trees. This enables RF to model complex relationships in high-dimensional datasets, making it well suited for non-linear data and the handling of multiple variables. RF is particularly effective with noisy, non-homogeneous data and can generate accurate predictions even with imperfect datasets [48]. These characteristics make it suitable for processing geomatic datasets, such as point clouds from MMS, where high-dimensional and noisy measurements are common [49]. RF has been successfully applied to crack detection workflows, differentiating between various crack types, such as longitudinal and transverse cracks, as well as intact road surfaces. It has demonstrated effectiveness in handling dense point cloud data from MMS, where it efficiently processes large datasets.
However, RF is sensitive to the quality of input data, particularly the accuracy of the reference data. It may encounter difficulties in detecting certain crack types, such as transverse cracks, due to point cloud profile line spacing [47]. Additionally, RF requires careful tuning of parameters, such as the number of trees (N) and the number of features to consider for splitting at each node (m). In this study, the number of estimators was set to 100, as recommended in similar applications, to stabilize the model while keeping training time manageable [50]. A random seed of 42 was also used to ensure reproducibility.
The RF model was applied to classify risks associated with road surface cracks using point cloud data. The RF models were trained on datasets with and without normalized intensity, and the results were compared against a reference dataset. Again, as DBSCAN, the algorithm’s performance was evaluated using metrics such as true positives, recall, and precision to assess its effectiveness in classifying road surface points.
A comparative analysis was conducted to evaluate the performance of DBSCAN and RF in crack detection and classification, considering both cases with and without intensity normalization. The reference data were generated through manual annotation of the point cloud. Initially, a qualitative assessment was performed through visual inspection of the results for two LiDAR datasets acquired in different regions of interest (ROIs) using PWMMS-UHA. Subsequently, a quantitative evaluation was performed by computing performance metrics based on true positives (TP), false positives (FP), and false negatives (FN). Specifically, precision, recall, F1-score, and Jaccard Index [51,52,53]—defined in Equations (1)–(4)—were used to assess the accuracy of crack detection. Overall Accuracy was also considered to evaluate the general classification performance, as shown in Equation (5).
Precision = T P T P + F P
Recall = T P T P + F N
F 1 - Score = 2 × P r e c i s i o n × R e c a l l P r e c i o s o n + R e c a l l
Jaccard   Index = T P T P + F P + F N
Overall   Accuracy = T P N u m b e r   o f   p o i n t s   × 100
Precision represents the proportion of correctly detected cracks among all detected cracks, while recall measures the proportion of correctly identified crack points relative to the total number of annotated crack points. The F1-score, a harmonic mean of precision and recall, provides an overall assessment of classification performance. The Jaccard Index quantifies the similarity between predicted and reference point-wise classifications of cracks. These metrics [51,52,53] are widely used in the literature to evaluate crack detection models. In this study, these metrics were computed for both longitudinal and transverse cracks to comprehensively assess the performance of the detection approaches. A comparative analysis was conducted to evaluate the performance of DBSCAN and RF in crack detection and classification in different conditions, including the presence or absence of intensity normalization.
The results, presented in the following section, demonstrate the effectiveness of DBSCAN and RF under various scenarios. The comparative approach between DBSCAN and RF, combined with the use of intensity normalization, introduces a novel perspective in the field of road surface crack detection, which traditionally relies on either unsupervised or supervised techniques in isolation. The methodology proposed in this research integrates preprocessing, clustering, and machine learning techniques, providing a structured framework for automated crack detection and classification on road surfaces. This hybrid framework—along with the adaptation of intensity normalization techniques originally designed for lane markings—is applied here for the first time to the segmentation and classification of both longitudinal and transverse cracks in mobile LiDAR point clouds. Furthermore, the iterative optimization of DBSCAN parameters based on silhouette scores and the integration of intensity normalization within RF training pipelines offer a reproducible and scalable methodology that has not yet been addressed much in the existing literature.
To ensure the practical applicability of the crack detection results, a 3D WebGIS platform was developed as an integral component of the proposed methodology. This system enhances the visualization and management of road pavement conditions by integrating geospatial analysis with decision-support functionalities. WebGIS has been widely recognized for its ability to integrate, analyze, and disseminate geospatial data for infrastructure monitoring and maintenance planning. In this study, the WebGIS serves as a bridge between automated crack detection and actionable maintenance prioritization, offering a structured and interactive environment for road asset management. The WebGIS serves as a bridge between automated crack detection and actionable maintenance prioritization, offering a structured and interactive environment for road asset management. The WebGIS was entirely built using open-source tools, including Blender, QGIS, and Lizmap, ensuring accessibility, adaptability, and reproducibility. Its architecture was designed to allow users to analyze georeferenced crack data, prioritize maintenance interventions, and align results with national and international road maintenance guidelines. Although several WebGIS solutions exist, the integration of a fully open-source 3D WebGIS platform within a LiDAR-based crack detection pipeline remains relatively unexplored, suggesting valuable opportunities for real-world infrastructure management. The system was developed on a structured geodatabase implemented within QGIS. Among the available formats, the GeoPackage standard was selected due to its compact, platform-independent, and self-contained nature, which facilitates efficient storage, management, and transfer of geospatial data [54]. GeoPackage, an Open Geospatial Consortium (OGC) standard based on SQLite, provides a scalable and portable solution for GIS applications, ensuring interoperability across different platforms [55]. The geodatabase was designed to manage multiple layers of spatial information, including crack detection results (classified by severity and type), road network data, pavement condition parameters (e.g., intensity and deterioration rates), and maintenance priority levels derived from crack severity and distribution. QGIS was chosen for its compatibility with open-source geospatial publishing tools and its widespread adoption within the GIS community [56]. Its flexibility and extensibility allow infrastructure managers to efficiently update and modify the system as needed, ensuring long-term usability and adaptability [57]. The WebGIS platform was implemented and published using Lizmap, an open-source tool that enables the seamless integration of QGIS projects into web-based GIS applications [58]. This approach facilitates the effective dissemination of spatial data while maintaining the full analytical and visualization capabilities of the original QGIS project. To ensure consistency between desktop and web-based GIS environments, the WebGIS publication process followed a structured workflow, as shown in Figure 6.
First, the spatial data layers—including crack detection results, road network information, and maintenance priority levels—were processed and styled within QGIS using the Lizmap plugin. The WebGIS system was designed to offer an interactive and highly customizable environment for infrastructure management. Users can dynamically explore georeferenced crack detection data, filter by severity, and compare different intervention scenarios based on predefined or user-defined thresholds. Next, the configured QGIS project was deployed on a dedicated web server running QGIS Server and Lizmap Web Client. This deployment preserved the graphical representation and interactive capabilities of the desktop environment, enabling a seamless transition to web-based visualization. The WebGIS platform allows end users to interact with georeferenced crack detection data through a standard web browser. Users can apply custom filters, explore spatial patterns, and prioritize maintenance interventions based on crack severity and distribution. Additionally, the WebGIS platform follows open data standards, ensuring seamless integration with other GIS applications and national road maintenance databases. This integration provides decision-makers with an intuitive and data-driven approach to road infrastructure management, bridging the gap between automated analysis and practical maintenance applications.

3. Results

This section presents the experimental results, focusing on a comparative analysis of the DBSCAN and RF methods for crack detection in LiDAR point cloud data. The study evaluates their performance both with and without intensity normalization, aiming to highlight the advantages and limitations of each approach. A qualitative assessment was first conducted by visually comparing segmentation results from both methods to a reference dataset across multiple ROIs.
This was followed by a quantitative evaluation using key performance metrics, including precision, recall, F1-score, Overall Accuracy, and the Jaccard Index, as previously mentioned, leading to the final measurement of crack surface areas. Particular emphasis was placed on the accurate identification and classification of transverse and longitudinal cracks, which are the primary focus of this study.

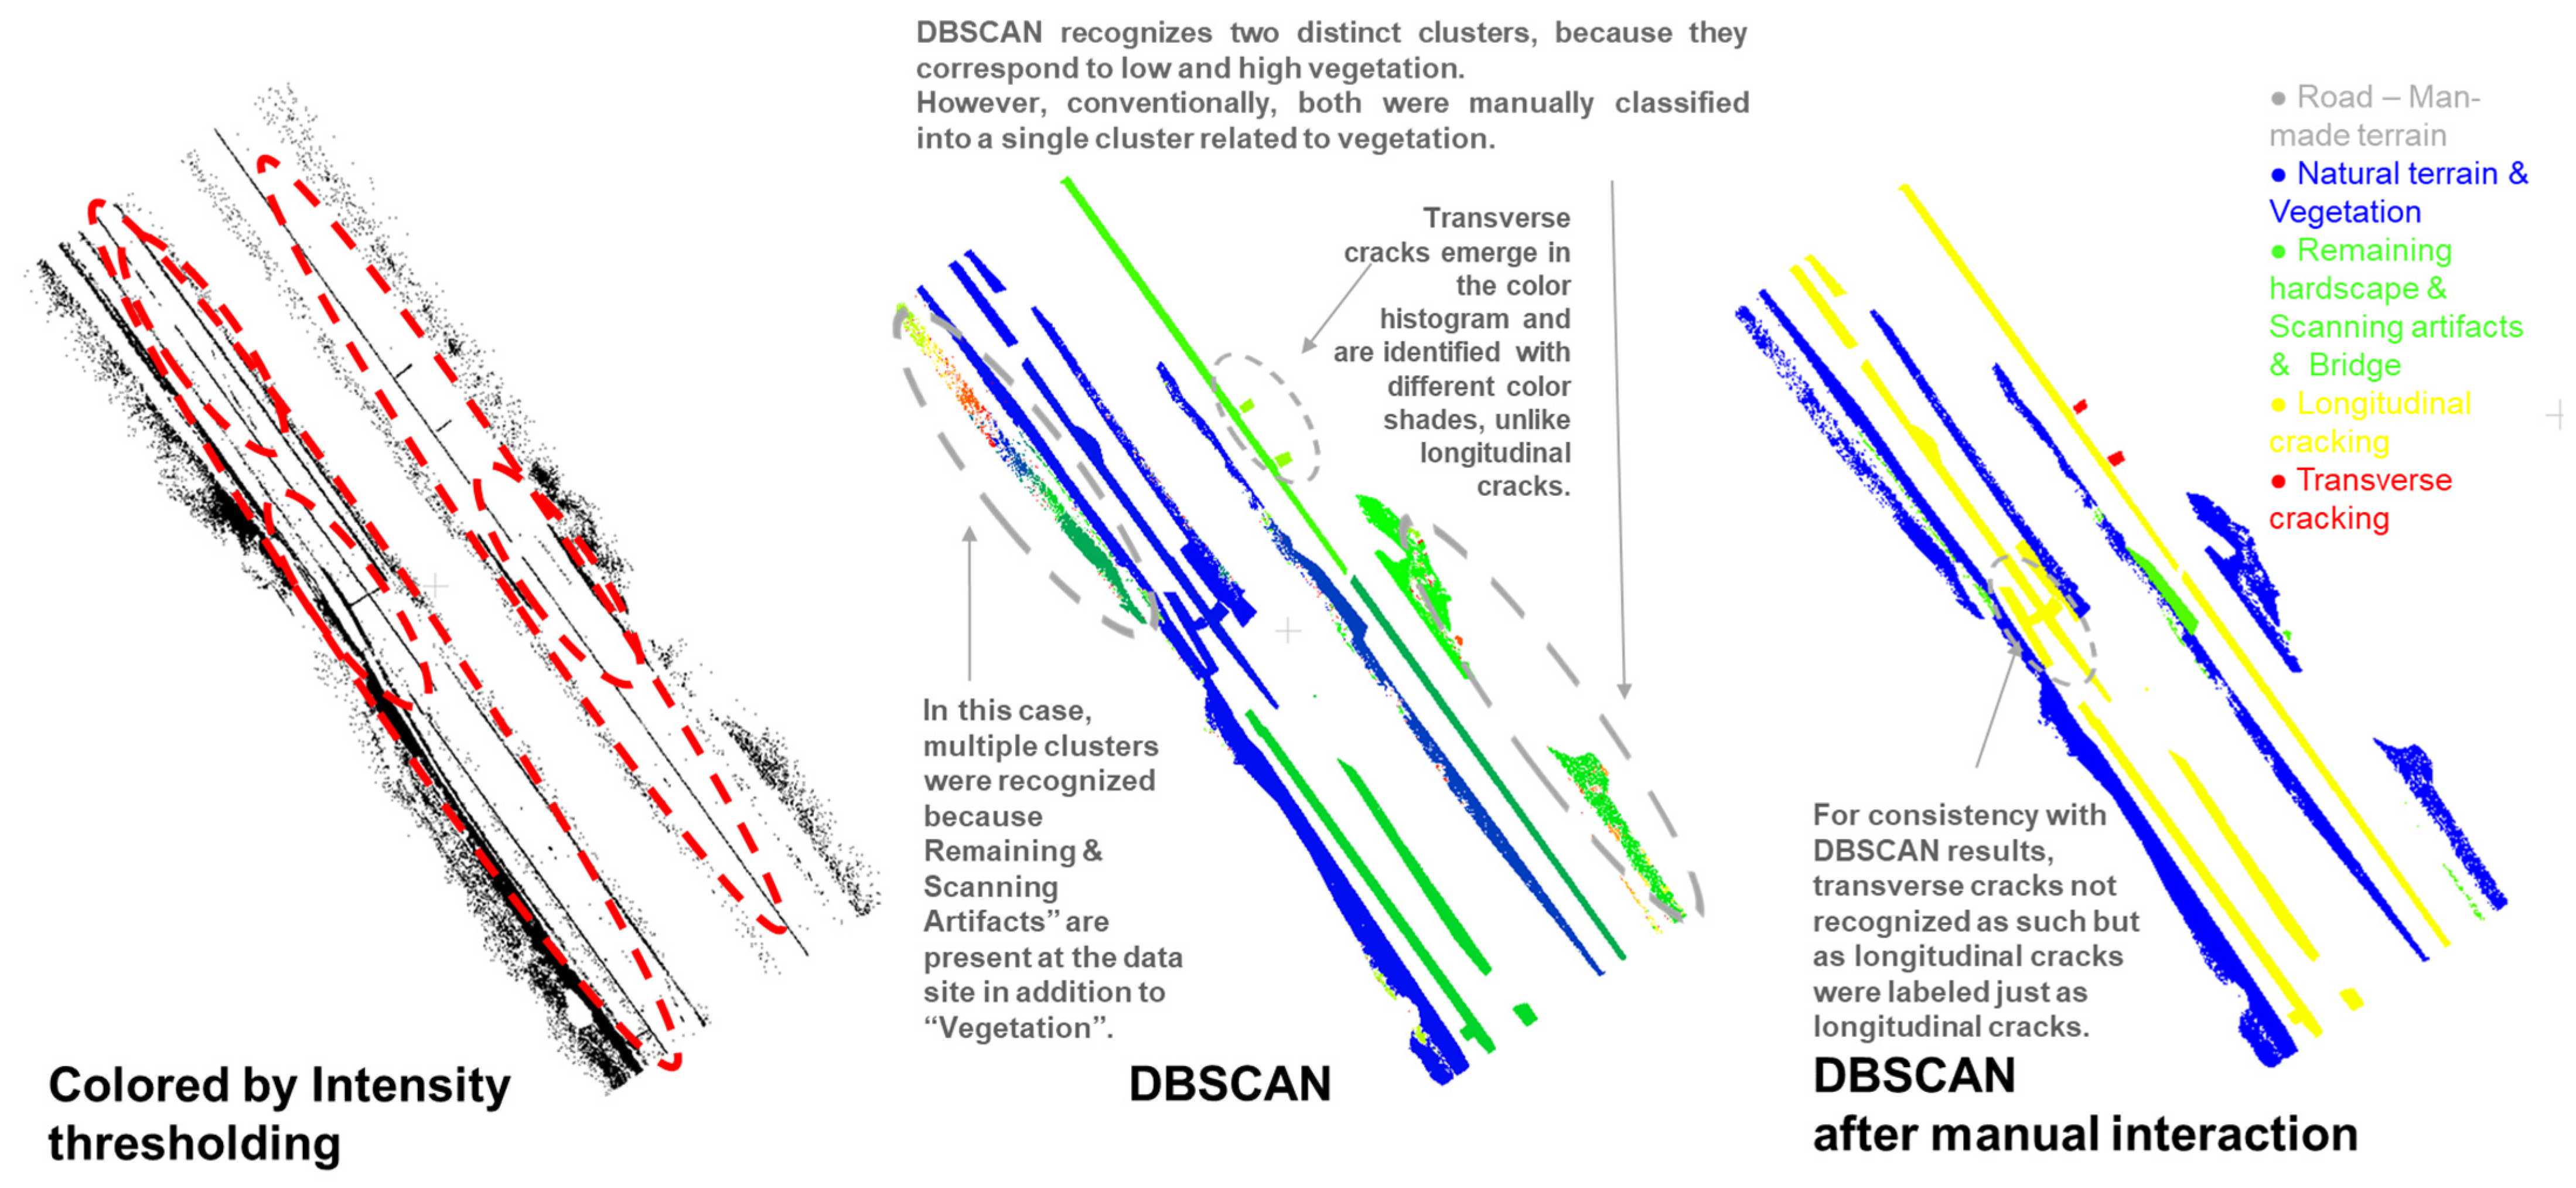
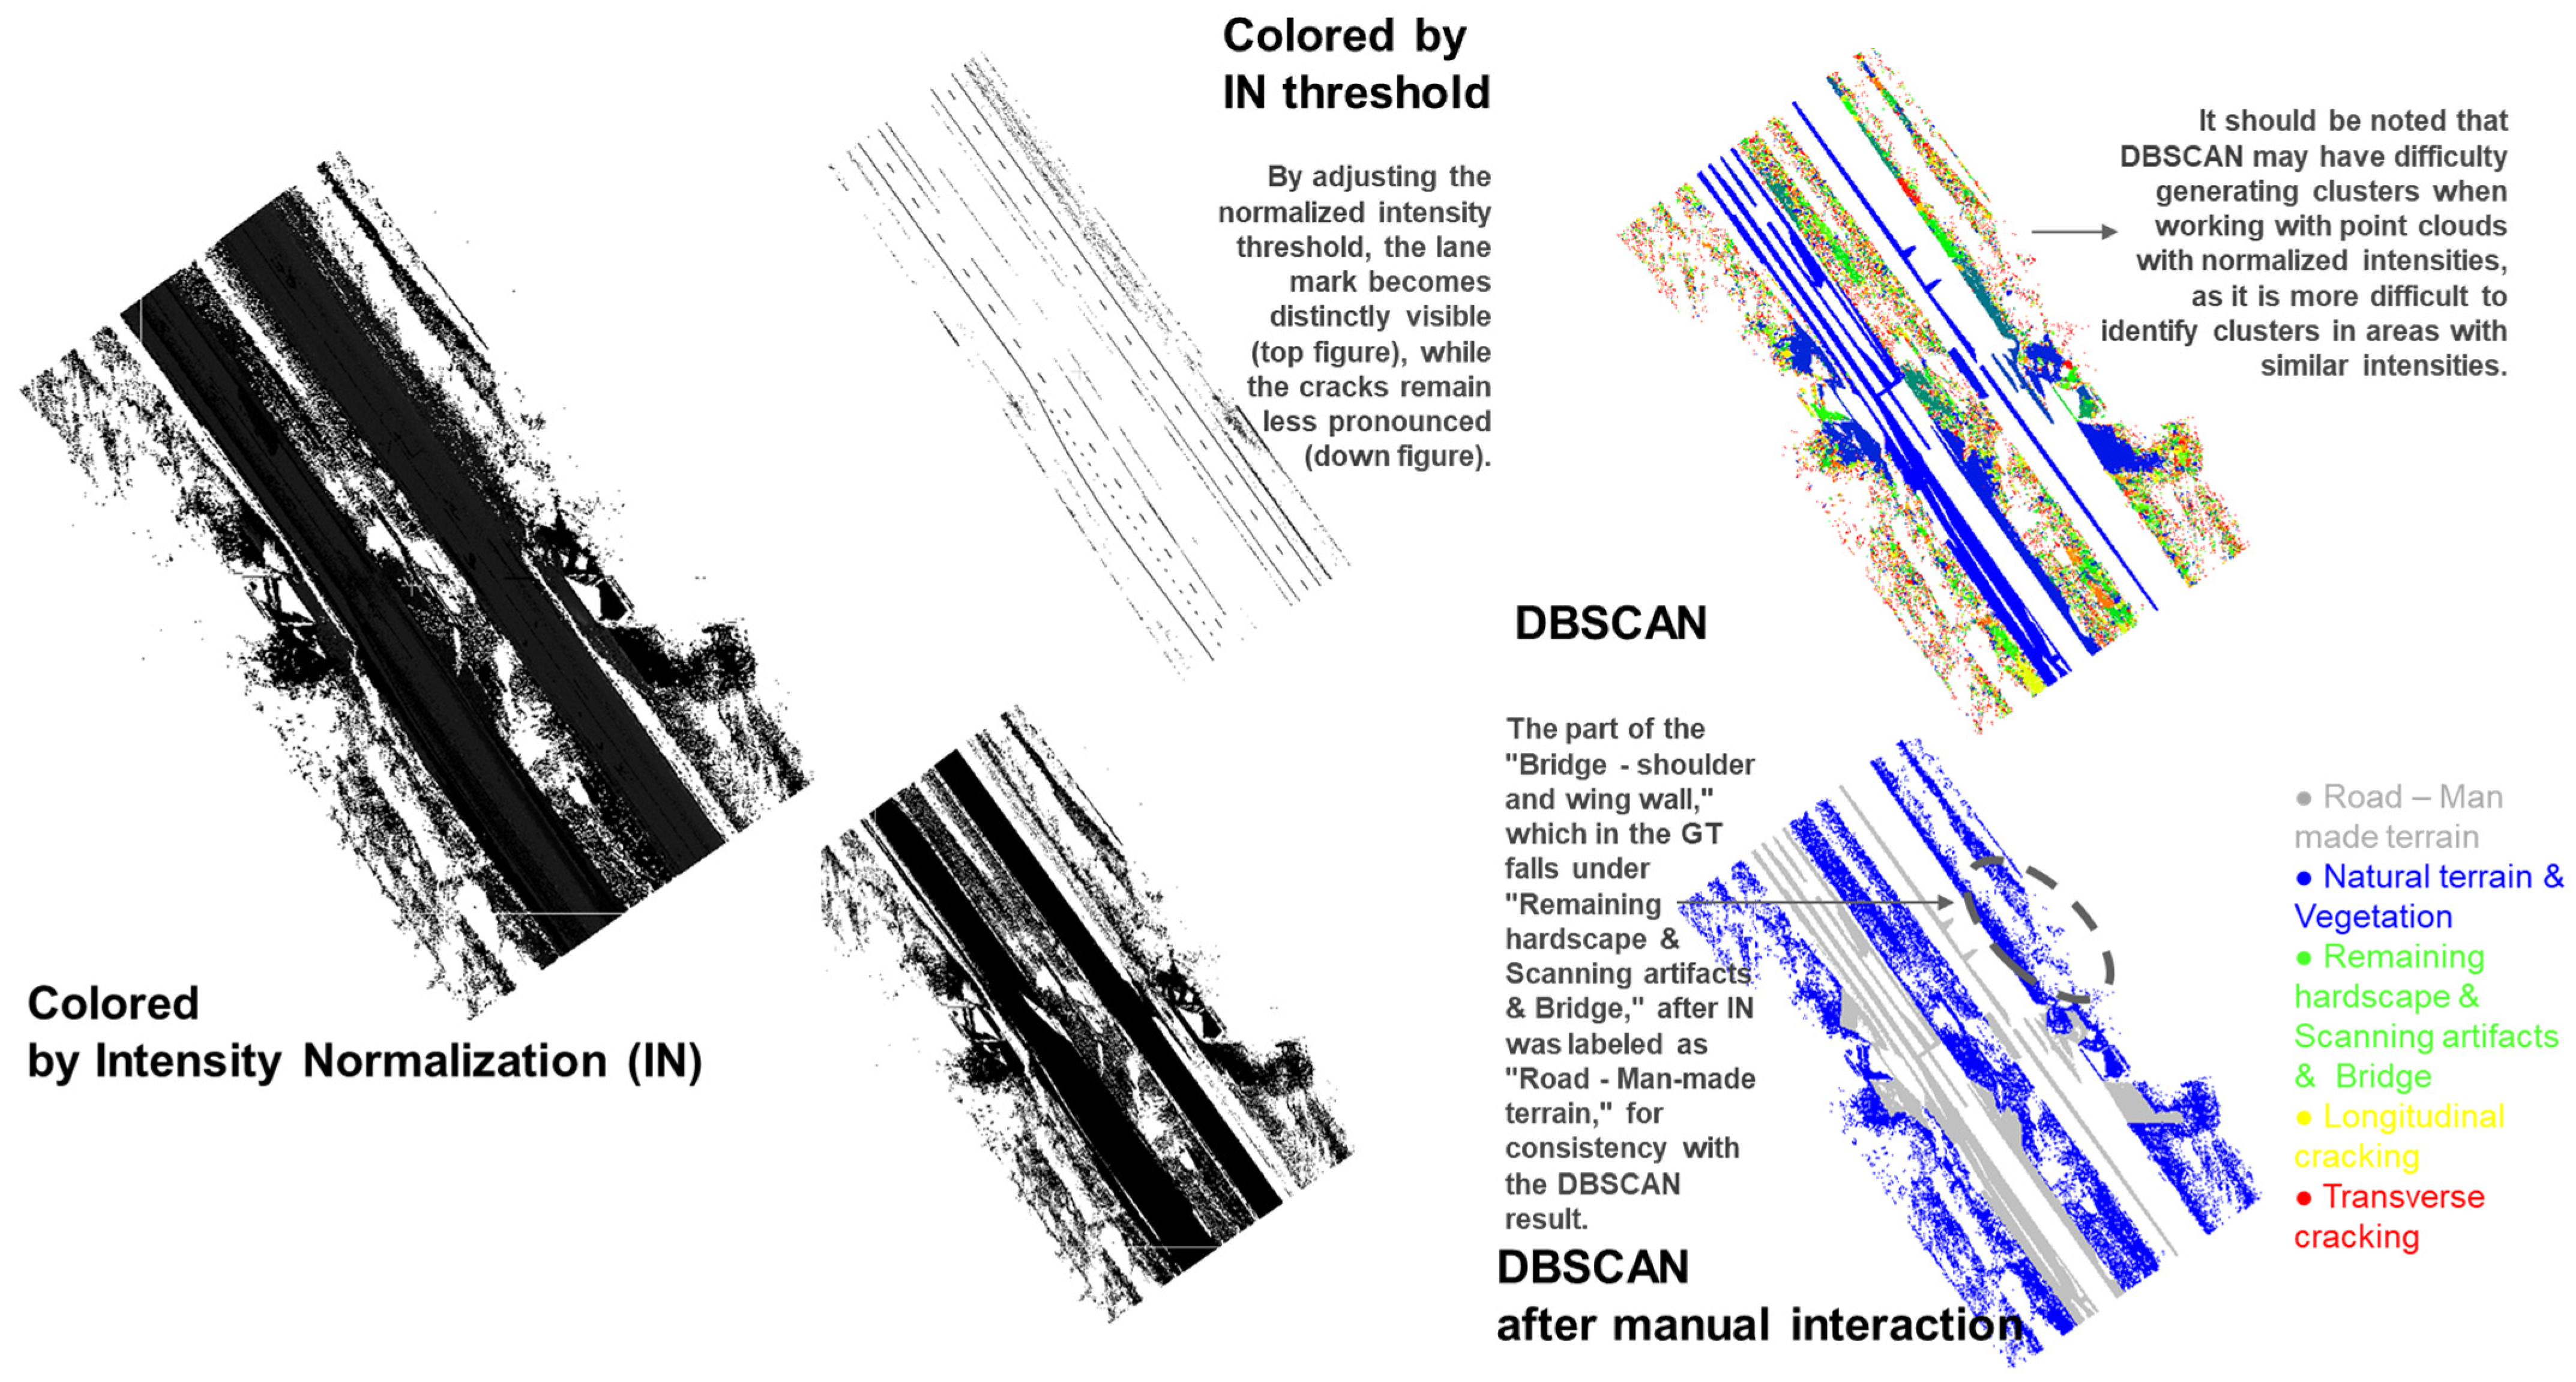
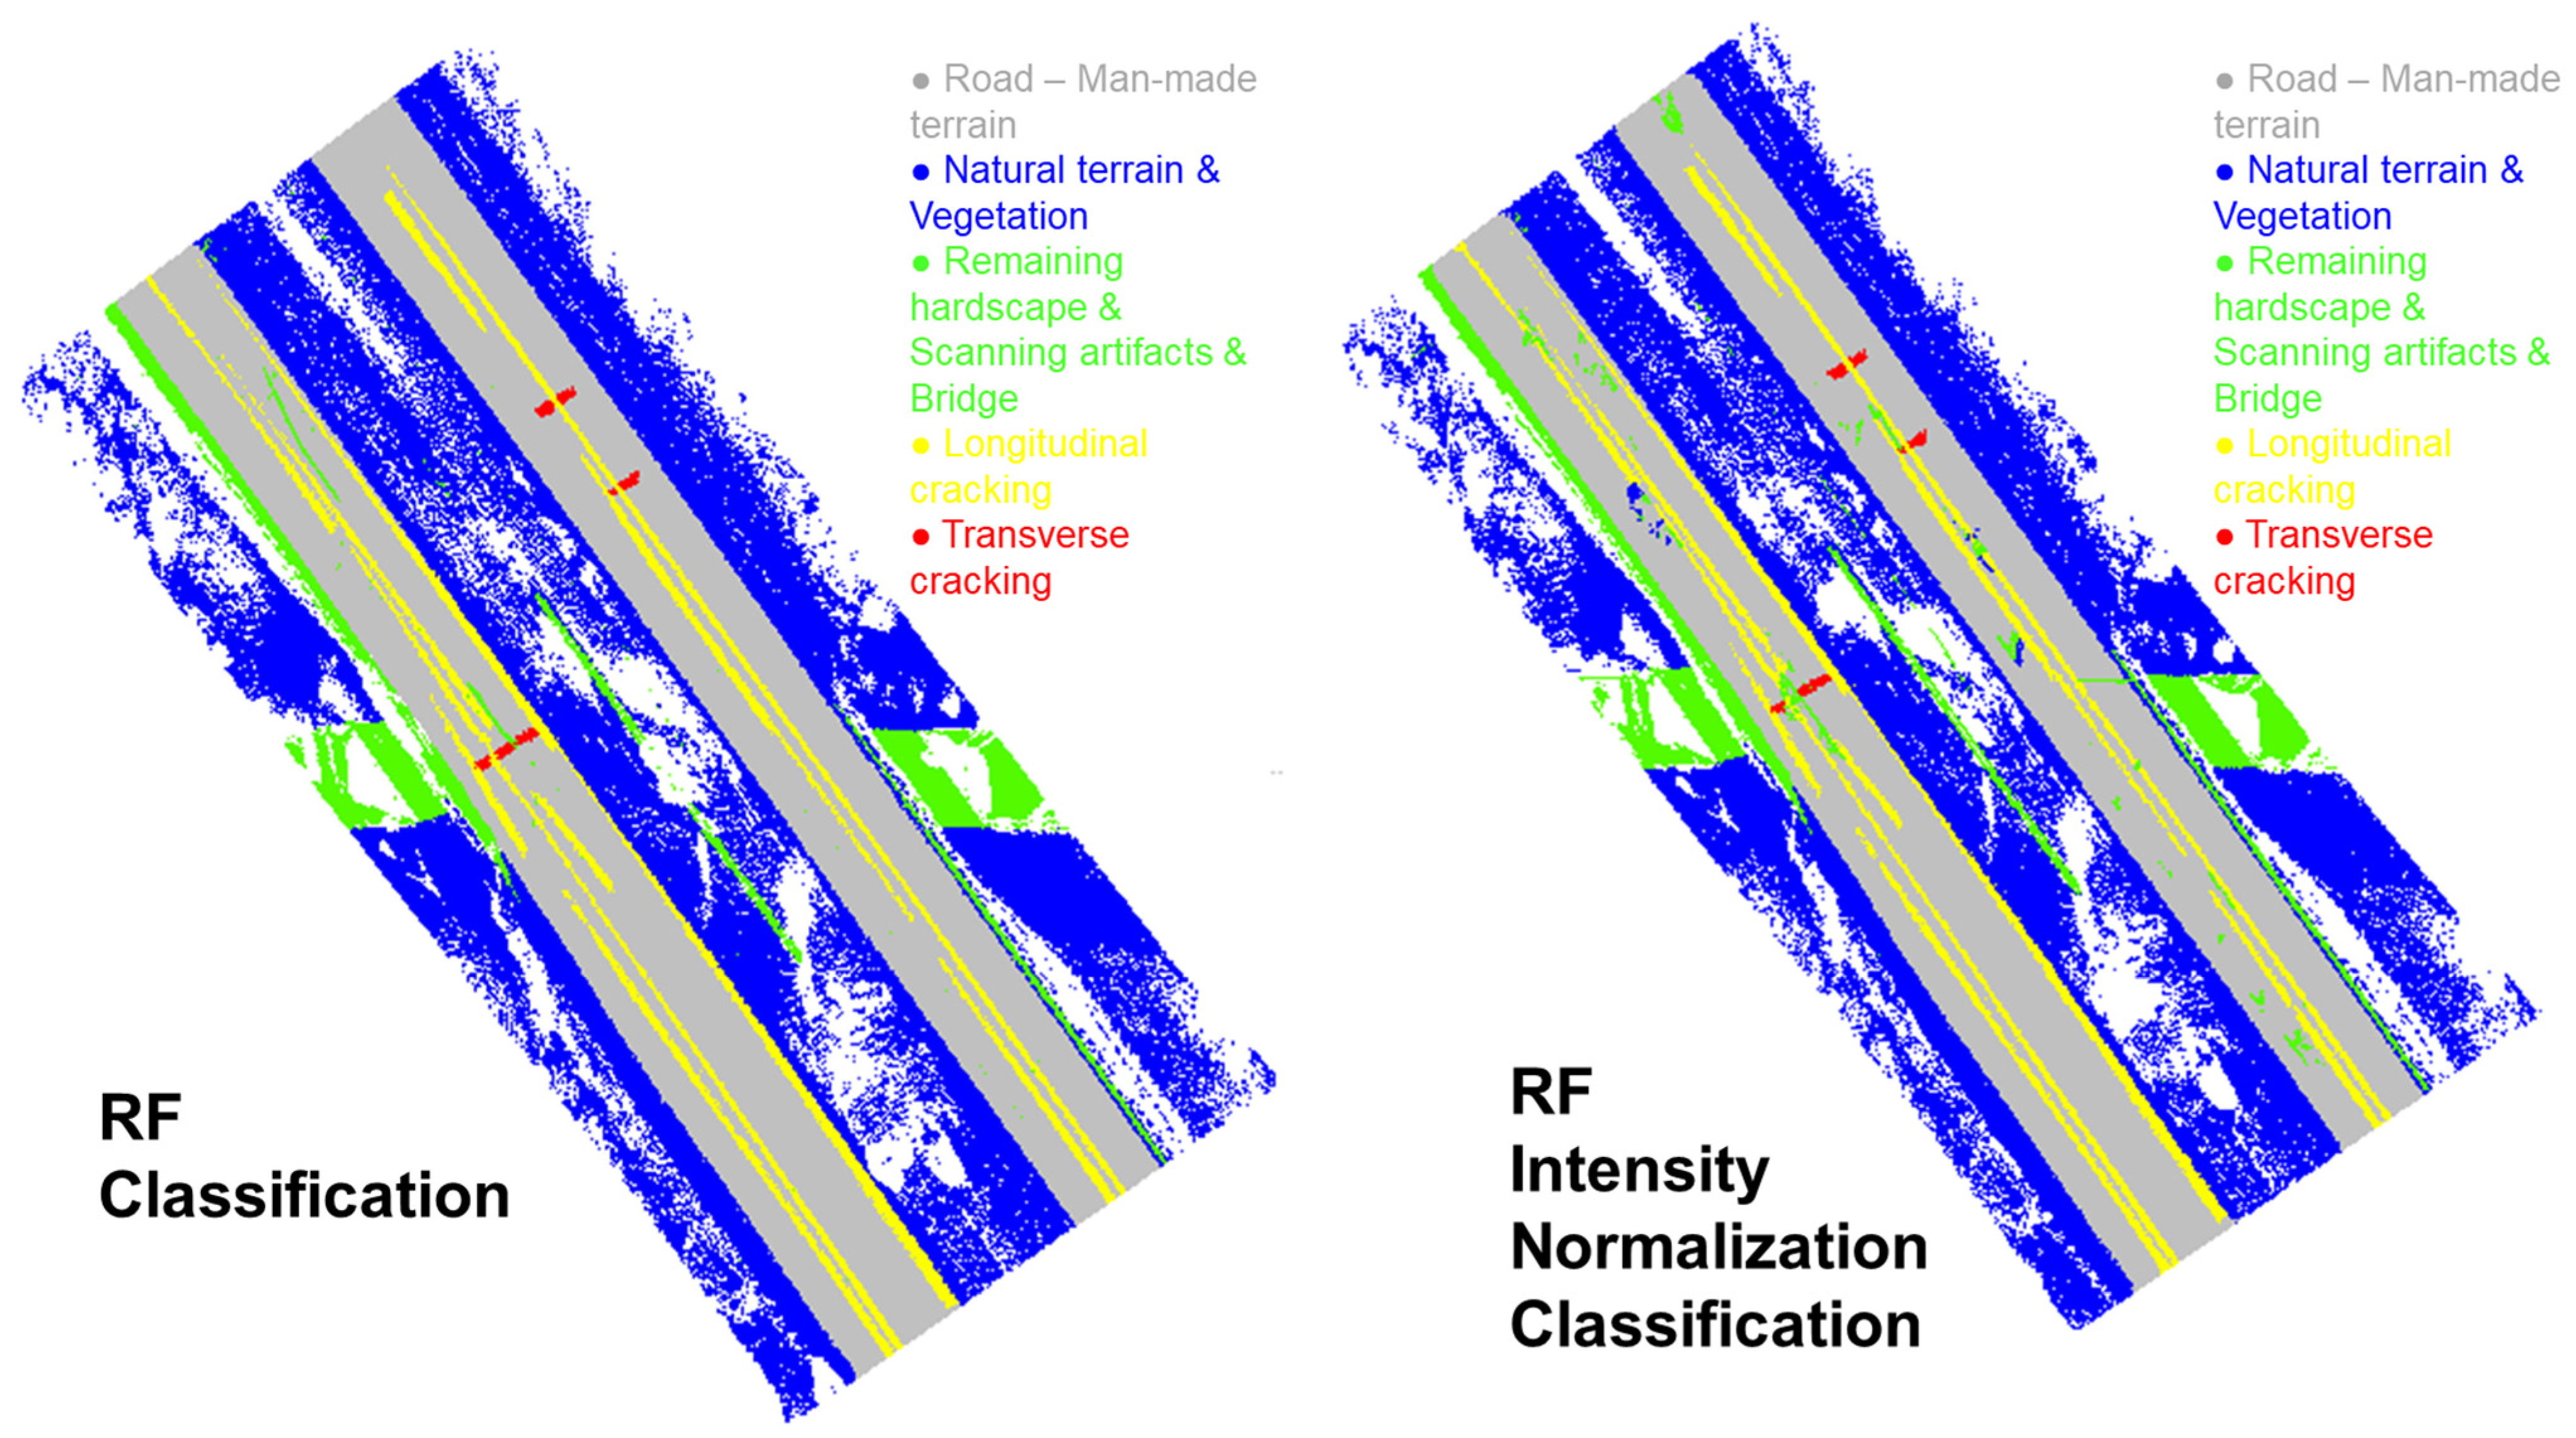
3.1. Comparative Analysis of DBSCAN and Random Forest with and Without Intensity Normalization

As previously mentioned, a comparative analysis was conducted to evaluate the performance of DBSCAN and RF algorithms in detecting road surface cracks using LiDAR data, both with and without intensity normalization. The analysis considered all processing tiles, providing detailed results and visual outputs for each road surface extract. For clarity, a representative road surface example is reported. This approach enhances transparency and ensures a comprehensive understanding of the methodology and findings. First, DBSCAN was applied to the dataset without intensity normalization. The analysis was performed across all tiles, which were manually classified into the following categories:
-
Man Made Terrain and Road: Primarily consisting of the road surface itself;
-
Natural Terrain and Vegetation: Areas covered by natural elements such as grass, soil, and trees;
-
Remaining Hardscape, Scanning Artifacts, and Bridge Components: Additional hard surfaces, including sidewalks, curbs, bridge structures, and scanning-related artifacts;
-
Longitudinal Cracking: Cracks running parallel to the road’s direction;
-
Transverse Cracking: Cracks oriented perpendicular to the road’s direction.
Since DBSCAN is an unsupervised clustering method, manual intervention was necessary to assign meaningful labels to the identified clusters, ensuring alignment with the reference data. For example, in the road segment, referred to as tile to avoid redundancy —an area near Bridge 17 (Figure 7)—DBSCAN initially detected two distinct clusters corresponding to low and high vegetation. However, following manual classification, these were consolidated into a single “Natural terrain and Vegetation” category in accordance with the established labeling conventions. Additionally, transverse cracks in tiles were more distinguishable in the color histogram due to their varying shades, whereas longitudinal cracks appeared less distinct. In this case, DBSCAN initially generated multiple clusters due to the presence of both “Remaining Hardscape, Scanning Artifacts, and Bridge Components” and “Vegetation”. After manual refinement, transverse cracks that had been misclassified as longitudinal cracks were correctly re-labeled, ensuring consistency with DBSCAN’s automated outputs.
The analysis of results for this tile, as detailed in Table 1, provides key insights into the performance of the DBSCAN algorithm when applied without intensity normalization. Overall, the algorithm achieved an accuracy of 68%, indicating moderate reliability in detecting the targeted features within this segment.
Regarding specific categories, DBSCAN exhibited a moderate capability in identifying longitudinal cracks. The algorithm maintained a balance between precision and recall, though the recall was slightly lower, leading to an F1-score that reflects a reasonable trade-off between correctly identified cracks and missed detections. However, the relatively high proportion of false positives and false negatives suggests the need for further refinement in distinguishing these features accurately. For transverse cracks, DBSCAN demonstrated higher precision, correctly classifying most detected instances as true positives. However, recall was notably lower, indicating that a significant number of transverse cracks were not detected. This resulted in a lower F1-score, underscoring the difficulty in achieving comprehensive detection for this crack type, particularly when balancing precision and recall. These findings highlight DBSCAN’s limitations when applied without intensity normalization, especially for transverse cracks. The results suggest that manual refinement or complementary methods may be necessary to improve consistency and accuracy in detecting both longitudinal and transverse cracks. When DBSCAN was applied with intensity normalization, the goal was to enhance feature identification by leveraging normalized intensity values. The analysis was conducted across all tiles, using the same classification scheme as in the non-normalized approach: Road, Natural Terrain, and Vegetation, Remaining Hardscape and Scanning Artifacts, Longitudinal Cracking, and Transverse Cracking.
Taking Figure 8 as an illustrative example, intensity normalization significantly influenced clustering behavior. By adjusting the normalized intensity threshold, distinct features such as lane markings became more visible (center and top of Figure 8), while cracks appeared less pronounced (center and bottom of Figure 8). Although this enhancement improved visibility for certain features, DBSCAN struggled with clustering point clouds based on normalized intensities. The similarity in intensity values across adjacent regions often hindered the definition of clear cluster boundaries, necessitating manual refinement.
For instance, originally labeled in the reference data as Remaining Hardscape, Scanning Artifacts, and Bridge Components were reclassified as Man Made Terrain and Road in the final results. This adjustment ensured consistency with DBSCAN’s clustering tendencies, aligning the labeled outputs with the algorithm’s grouping behavior.
The analysis of results for this tile, as detailed in Table 2, highlights the improved performance of the DBSCAN algorithm when applied with intensity normalization. The results indicate an increase in Overall Accuracy from 68% (without intensity normalization) to 75%, demonstrating enhanced reliability in identifying the targeted features within this segment.
Analyzing the specific categories in the table above, it is evident that DBSCAN struggled to identify both longitudinal and transverse cracks when applied with intensity normalization. The algorithm failed to detect any true positives for longitudinal cracks, resulting in precision, recall, and F1-score values of zero. A similar outcome was observed for transverse cracks, where no true positives were identified, and all evaluation metrics remained at zero. These results suggest that intensity normalization altered the distribution of true positive detections, leading to an increase in classifications within the “Man Made Terrain and Road” and “Natural Terrain and Vegetation” categories. This shift indicates that normalized intensity values may have caused the algorithm to prioritize these features over cracks.
The complete absence of true positives for both crack types highlights DBSCAN’s difficulty in distinguishing fine-scale surface features under intensity-normalized conditions. While normalization can enhance the identification of larger structural elements, such as road surfaces or vegetation, it appears to compromise the algorithm’s ability to detect subtle details like cracks. These findings underscore the limitations of DBSCAN in intensity-normalized datasets, suggesting the need for alternative clustering techniques, additional preprocessing, or manual refinement to improve crack detection.
Despite the attempted improvements, the overall effectiveness of DBSCAN in generating meaningful clusters remained limited. This limitation is likely due to the algorithm’s challenges in distinguishing clusters in regions with similar intensity values. To address this issue, machine learning classification using the RF algorithm was explored. This approach aligns with the study’s objective of evaluating automatic and semi-automatic recognition methods to enhance point cloud comparison.
A comparative analysis was conducted between two point clouds: one derived from the reference data and the other generated using the RF algorithm, both with and without intensity normalization. The classification performance was assessed using various metrics, as presented in Figure 9 and Table 3 and Table 4. The results indicate that the RF model achieved an Overall Accuracy of 94% without intensity normalization. When normalization was applied, accuracy slightly decreased to 93%, suggesting that while intensity normalization can improve certain aspects of the dataset, its overall impact on classification accuracy remains minimal.

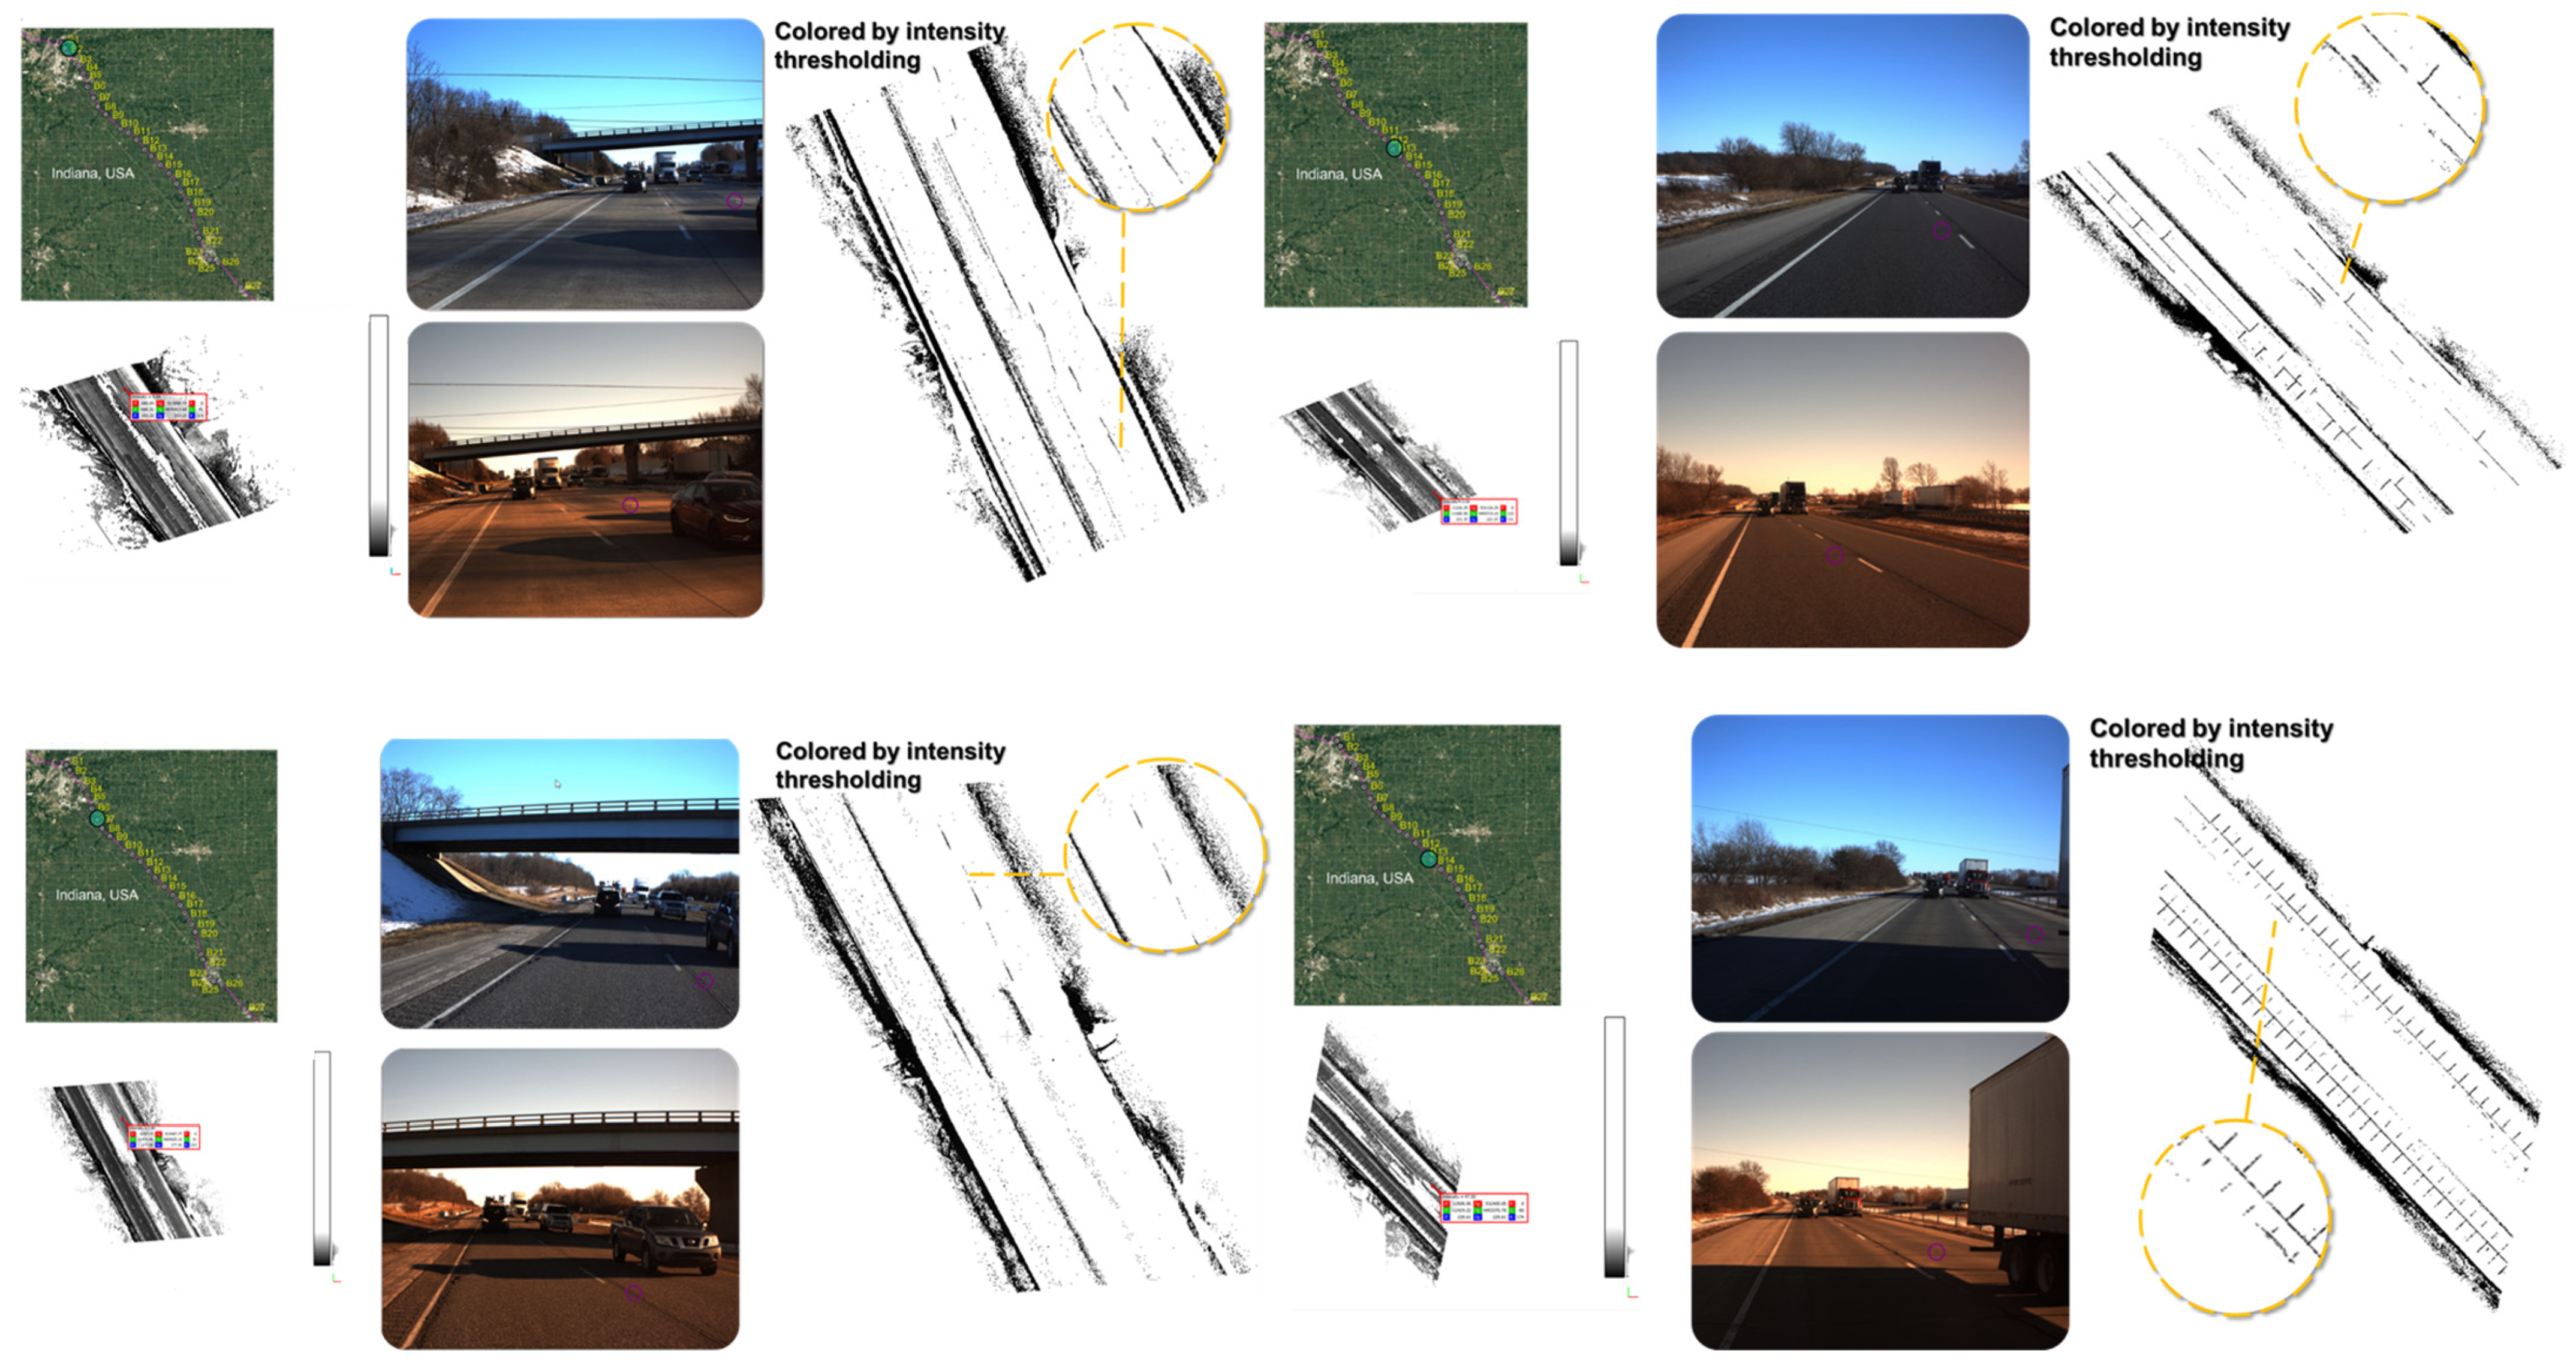
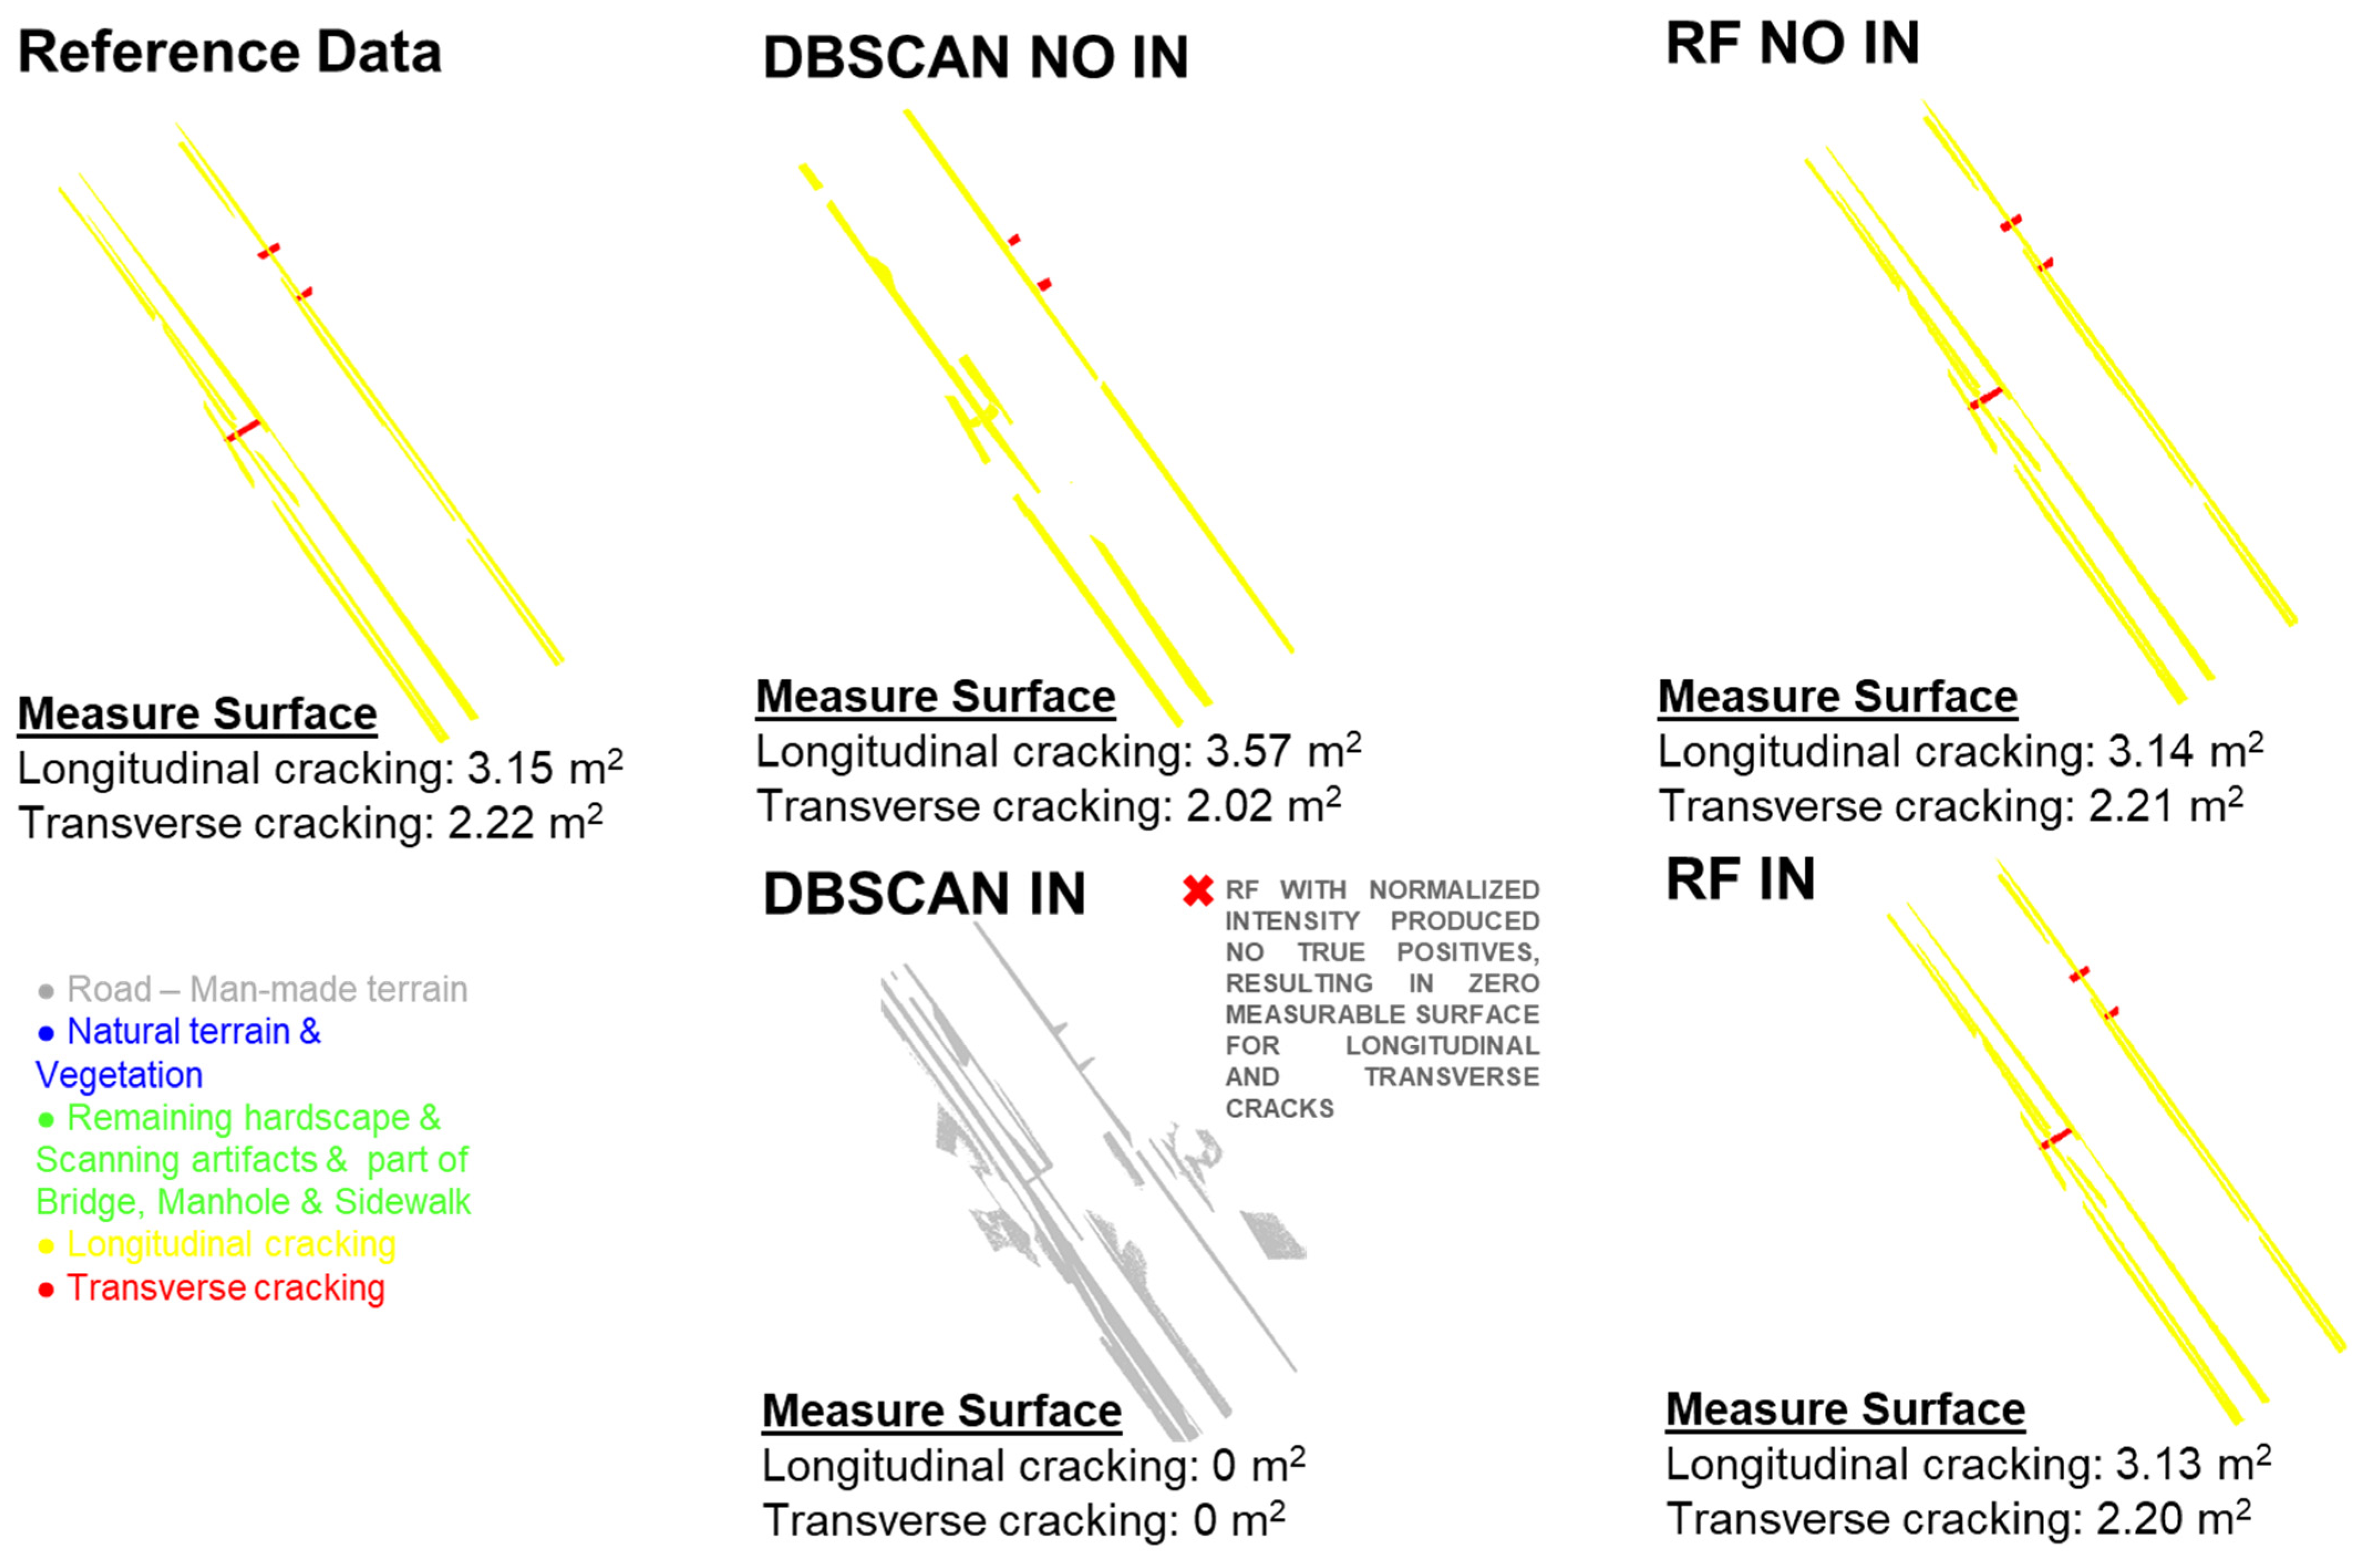
3.2. Crack Detection Analysis in LiDAR Point Cloud Data

This subsection provides a comparative evaluation of DBSCAN and Random Forest (RF) for the detection of road surface cracks in LiDAR point cloud datasets. The analysis investigates the effect of intensity normalization and considers both longitudinal and transverse cracks, using several performance metrics to assess the models’ effectiveness. The Jaccard Index was selected as the primary metric to quantify the similarity between detected cracks and reference data. Additionally, crack surface areas were estimated using the Poisson surface reconstruction algorithm, available as a plugin in CloudCompare. This algorithm reconstructs a continuous surface from an unstructured point cloud by solving a Poisson equation, which fits an implicit function to the data based on normal vectors. The resulting mesh approximates the geometry of the cracks and allows for accurate surface area calculations. This method is particularly suitable for analyzing irregular and incomplete surfaces, such as road cracks, as it handles noise and missing data robustly. By generating meshes of the segmented crack regions, it was possible to quantitatively compare the area of the detected cracks between different detection approaches. As summarized in Table 5, the results indicate significant variations in detection performance between DBSCAN and RF under different conditions, emphasizing the role of intensity normalization in crack identification.
When applied without intensity normalization, DBSCAN achieved a Jaccard Index of 43% for longitudinal cracks and 30% for transverse cracks. These results indicate that while DBSCAN can identify some crack-related clusters, its overall effectiveness is limited, particularly for transverse cracks. However, with intensity normalization, the Jaccard Index dropped to 0% for both crack types, suggesting a complete failure in cluster generation. This decline may be attributed to DBSCAN’s difficulty in handling intensity-normalized point clouds, where uniform intensity values across clusters hinder its ability to distinguish crack features. In contrast, RF demonstrated significantly higher performance. Without intensity normalization, the Jaccard Index reached 94% for longitudinal cracks and 88% for transverse cracks, indicating a high level of accuracy in crack classification. With intensity normalization, the performance remained strong, with only a slight decrease to 93% and 88%, respectively. These findings highlight RF’s robustness in crack detection and its clear advantage over DBSCAN, particularly when working with intensity-normalized datasets. Beyond the Jaccard Index analysis, the crack surface area was measured using the Poisson algorithm, which has been shown to provide optimal results for complex surfaces in CloudCompare. This metric offers a quantitative estimate of the affected surface area, aiding in road condition assessment. As illustrated in Figure 10, intervention thresholds were established based on the crack surface area, following the Pavement Condition Index (PCI) and Federal Highway Administration (FHWA) guidelines [59,60]:
-
Minor cracks: 0.5–2 m2 of cracks per 100 m of road;
-
Obvious cracks: 2–10 m2 per 100 m;
-
Severely damaged roads: More than 10 m2 per 100 m.
These classifications provide a structured approach for evaluating road deterioration and prioritizing maintenance interventions. In this study, the surface area of cracks was calculated using the mesh generated from the Poisson surface reconstruction algorithm in CloudCompare. This mesh allowed for an accurate estimation of the crack extent in square meters (m2). While crack length is commonly used in manual inspections, surface area provides a more comprehensive measure in 3D point cloud data, especially when cracks vary in width and shape. The use of area-based thresholds is consistent with the PCI and FHWA guidelines, which include surface damage classifications expressed in terms of affected area per unit length of road (e.g., m2 per 100 m). This approach enables a more robust and spatially explicit evaluation of road conditions in LiDAR-based analysis.
These findings further confirm that RF consistently outperforms DBSCAN, providing more accurate surface area estimates for both longitudinal and transverse cracks. Notably, DBSCAN’s performance declines significantly when intensity normalization is applied, particularly due to its inability to accurately detect cracks in the normalized dataset. This underscores the critical importance of selecting appropriate algorithms and preprocessing techniques to optimize crack detection in point cloud data.

4. Discussion

This study presents a comparative analysis of DBSCAN and Random Forest for crack detection in point cloud data, considering both raw and intensity-normalized datasets. The results indicate that Random Forest consistently outperforms DBSCAN in terms of precision, recall, and F1-score, demonstrating its robustness in detecting cracks, particularly longitudinal ones. The classification model proved stable regardless of intensity normalization, reinforcing its suitability for automated infrastructure assessment. These findings align with previous research indicating that supervised learning models generally offer higher reliability for crack classification compared to clustering-based approaches, which tend to be more sensitive to noise and parameter selection [61,62].
In contrast, DBSCAN struggled with the segmentation of crack patterns, particularly in intensity-normalized datasets, leading to a higher rate of false negatives. Moreover, the results underscore the importance of adapting machine learning pipelines based on the available data characteristics, acquisition conditions, and desired accuracy levels. In practical applications, the choice between DBSCAN and Random Forest should consider not only performance metrics but also operational constraints such as computational efficiency, ease of implementation, and required user expertise. These findings highlight the necessity of selecting methodologies tailored to the characteristics of point cloud data and the specific challenges of crack detection. The experimental results show that longitudinal cracks were detected with higher accuracy than transverse cracks, which tend to be more fragmented and irregular. This observation is based on visual assessment during the segmentation process, where transverse cracks appeared more fragmented and discontinuous compared to the more linear and coherent longitudinal cracks. This confirms findings from previous studies [63,64], which highlight the challenge of detecting short, discontinuous cracks. This suggests that future research should explore hybrid approaches combining unsupervised clustering and supervised learning techniques, as the integration of both methods may enhance crack detection by leveraging the strengths of each: unsupervised clustering for identifying patterns in complex data and supervised learning for improving classification accuracy across different crack types. Additionally, integrating geometric and intensity-based descriptors with learning-based models could further refine the classification process.
Another key observation is the impact of intensity normalization. While it improves feature distinction in some cases, it does not consistently enhance detection performance across both methodologies. This suggests that intensity normalization should not be applied uniformly but rather as part of an adaptive preprocessing pipeline, potentially leveraging domain-specific knowledge about pavement materials and lighting conditions. Future research should explore adaptive intensity normalization techniques that dynamically adjust based on pavement conditions and data acquisition parameters. Finally, the proposed methodology is agnostic to the type of MMS used for data collection, making it broadly applicable across different sensor configurations and data acquisition platforms. This flexibility enhances its usability for real-world road infrastructure monitoring applications.

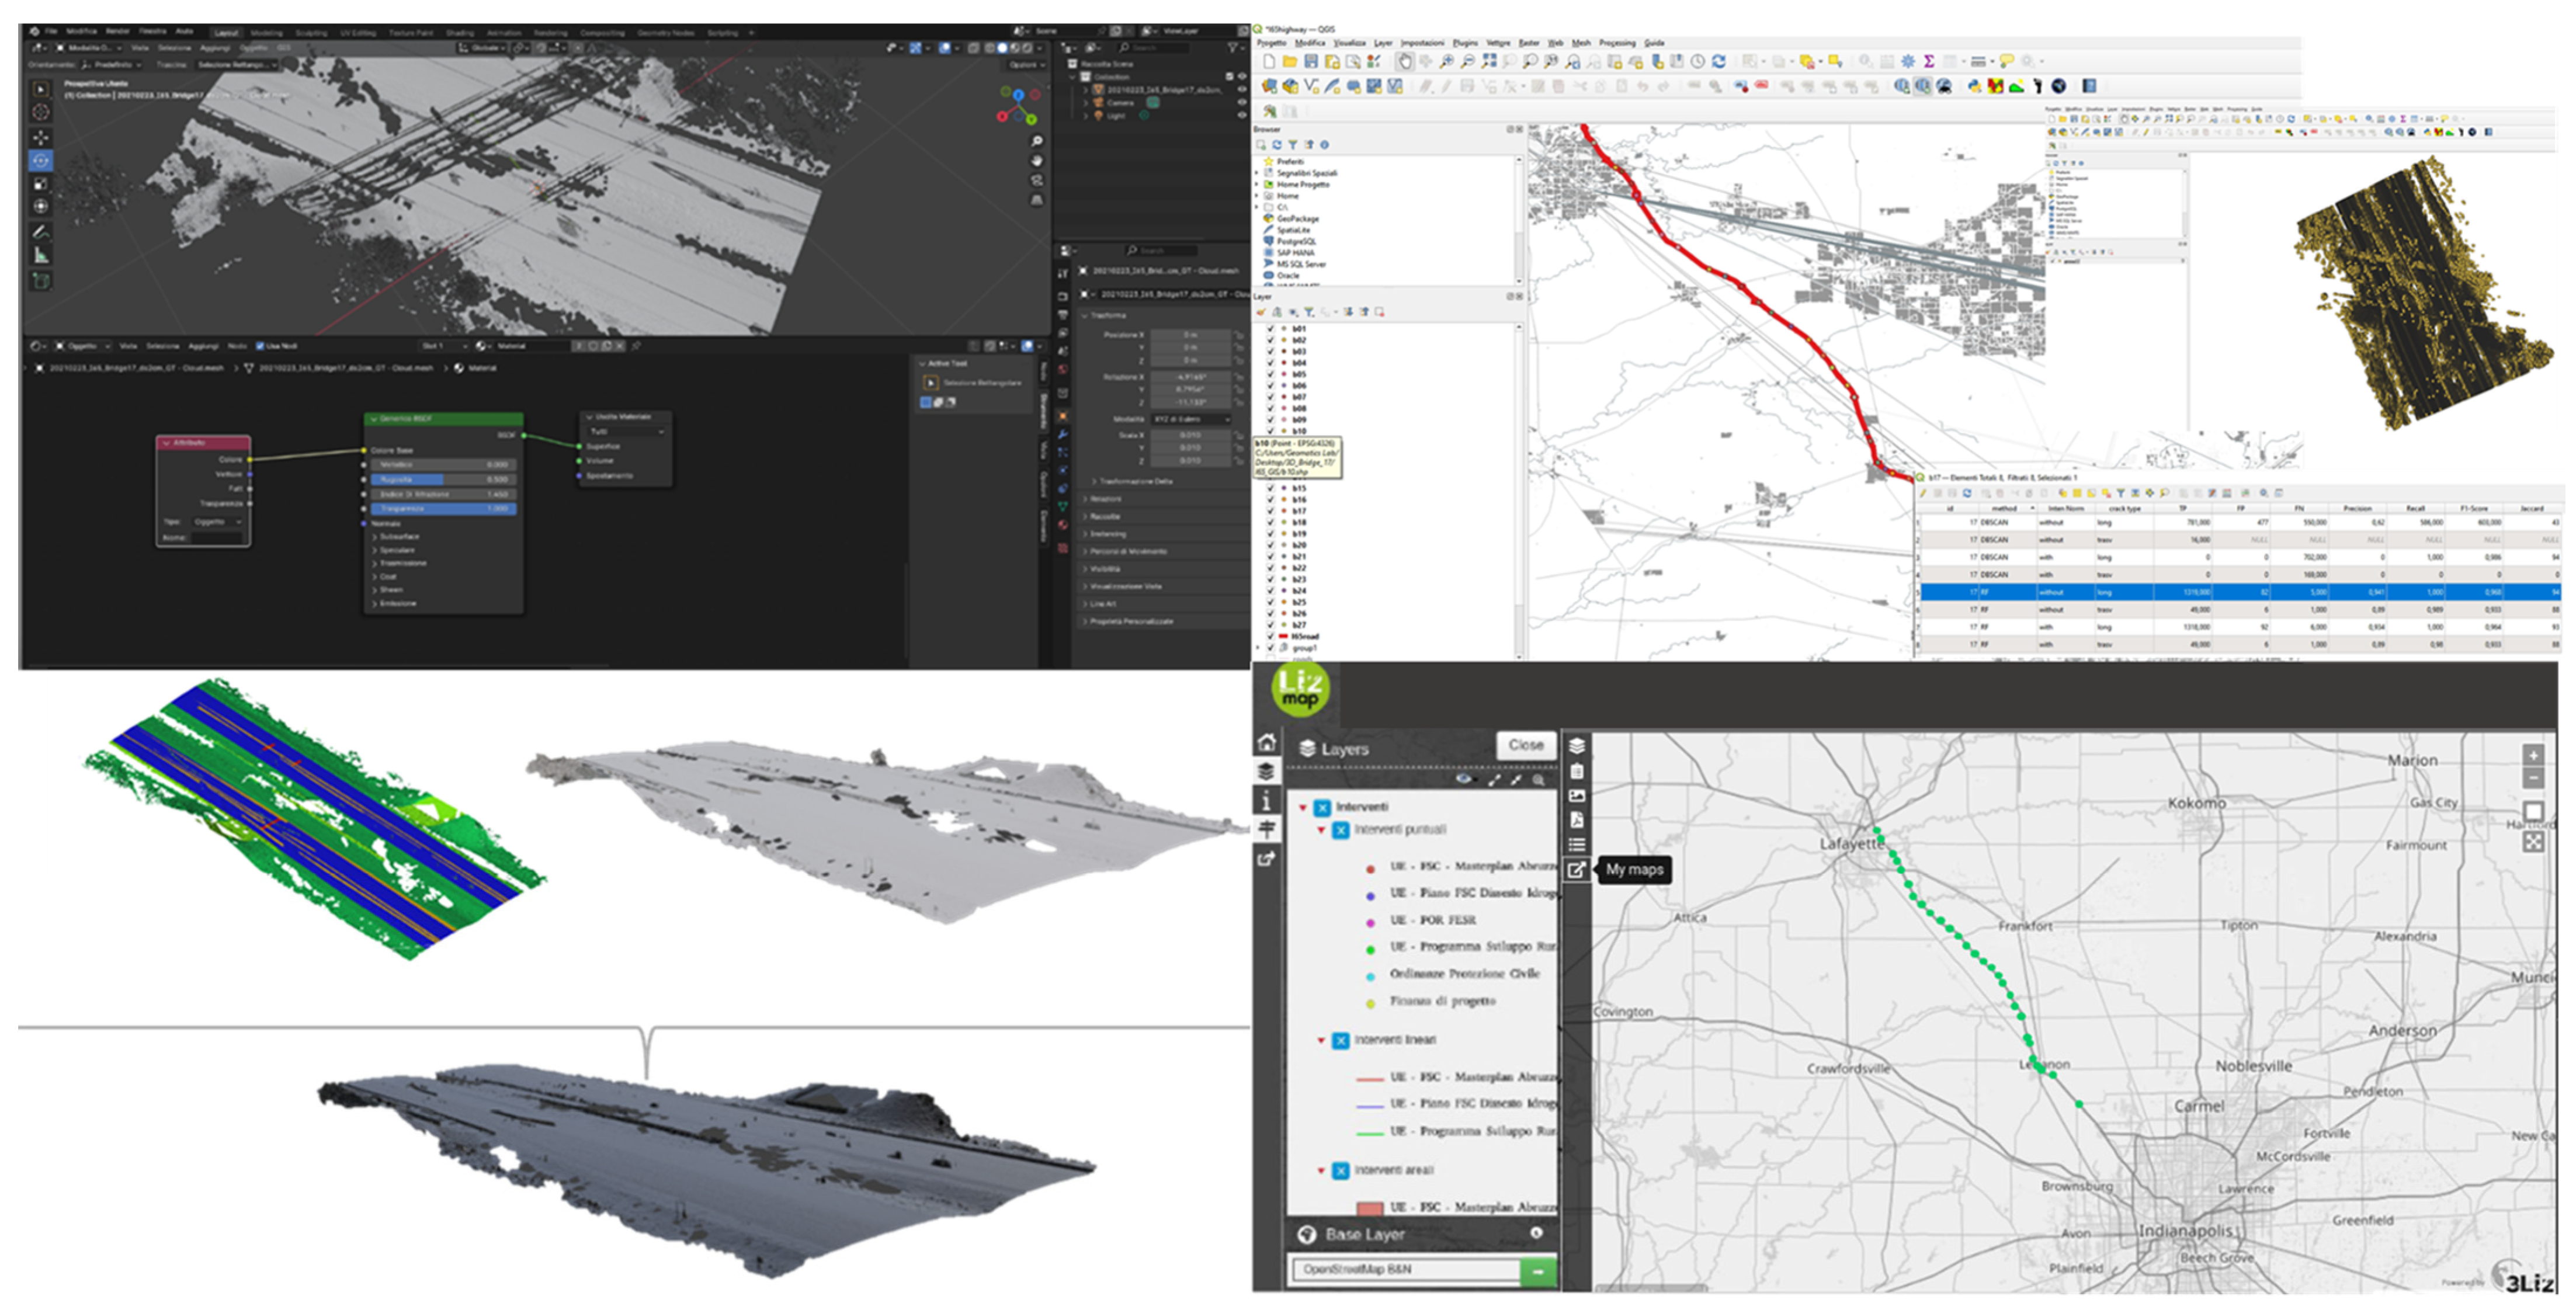
4.1. Open-Source 3D WebGIS for Crack Visualization and Management

Beyond algorithmic performance, integrating crack detection results into a 3D WebGIS platform provides a practical and replicable solution for infrastructure monitoring. As described in the methodology, the WebGIS framework was developed to visualize and manage the detected cracks, ensuring a structured approach to infrastructure assessment. The proposed WebGIS is built entirely using open-source tools such as QGIS, Lizmap, and Blender, ensuring accessibility and adaptability across different regions. This approach enhances the usability and operational impact of the classification outputs, transforming them into actionable insights. The system enables the following:
-
Visualization of georeferenced crack detection results overlaid on road network data;
-
Prioritization of maintenance interventions based on severity and spatial distribution of cracks;
-
Integration with national and international road maintenance guidelines, such as INDOT (Indiana Department of Transportation), to support data-driven decision-making;
-
User-friendly filtering and querying of spatial data, enabling targeted analysis by crack type, location, or risk level;
-
Scalability for global applications, such as road pavement monitoring, is a critical issue worldwide.
By offering a replicable, open-source approach, this WebGIS framework facilitates transparency in infrastructure management and provides decision-makers with a tool for long-term asset maintenance planning. This digital infrastructure not only enhances visualization but also serves as a decision-support tool, enabling dynamic updates based on newly acquired data. The ability to incorporate 3D models and spatial analysis layers enhances data accessibility and allows for dynamic monitoring of road conditions over time. This directly supports the reproducibility and applicability of the methodology in real-world contexts. Figure 11 illustrates the WebGIS interface and an example of crack visualization. Following the workflow outlined in the methodology.
The importance of pavement maintenance and infrastructure monitoring extends beyond the United States, making the proposed system relevant for international applications. Countries with varying environmental conditions, traffic loads, and road materials can adopt and customize the WebGIS framework to meet their specific needs. By advancing automated crack detection methodologies and promoting open-source solutions, this research contributes to the development of more efficient, transparent, and globally adaptable infrastructure monitoring systems.

5. Conclusions

This study has demonstrated the effectiveness of integrating point cloud data and machine learning techniques for crack detection in road infrastructure. By leveraging clustering and classification methods, particularly DBSCAN and Random Forest, the analysis has highlighted the significant impact of intensity correction followed by normalization on detection accuracy. The findings underscore the potential of machine learning-based approaches to enhance automation and efficiency in crack detection, offering a reliable alternative to traditional manual inspections. Specifically, the proposed approach proved effective in detecting both longitudinal and transversal cracking patterns. The Random Forest classifier with normalized intensity achieved the best performance, with a Jaccard Index of 93% for longitudinal cracks and 88% for transversal ones. In contrast, DBSCAN performed less accurately, particularly when intensity normalization was not applied. Based on the dataset’s point spacing of approximately 1 cm, the methodology was able to detect cracks as narrow as 1–2 cm and as short as 5–10 cm in length. These results confirm the method’s capability to identify even fine-scale surface defects in dense mobile mapping point clouds.
The implementation of the proposed methodology at a larger scale holds significant potential for improving road maintenance and infrastructure monitoring. The integration of these methods into a WebGIS platform not only enhances real-time visualization and decision-making but also facilitates effective communication of results to stakeholders. The use of open-source tools such as Blender, QGIS, and Lizmap enhances accessibility, allowing stakeholders to assess road conditions, prioritize interventions, and optimize maintenance strategies. Given the adaptability of this approach, it can be applied globally, providing a scalable and replicable solution for infrastructure management. Moreover, the proposed methodology is agnostic to the type of MMS used for data collection, ensuring its applicability across different sensor platforms and acquisition settings.
The ability of supervised models to leverage labeled training data enables them to make more accurate and generalized predictions, making them a reliable choice for analyzing complex features such as cracks in point cloud data. While this study has provided valuable insights into crack detection, there remain significant opportunities to advance the field. Future research could explore the integration of advanced machine learning and deep learning models, such as CNNs or graph neural networks (GNNs), which are well suited for handling high-dimensional data and may enhance the detection of complex crack patterns, particularly transverse cracks. Combining clustering and classification techniques, such as employing DBSCAN for noise reduction followed by Random Forest for classification, could also be a promising avenue.
Incorporating additional features, including surface roughness, curvature, and color beyond intensity, may improve accuracy by allowing algorithms to better differentiate cracks from other surface irregularities. Expanding validation efforts to include diverse datasets with varying road conditions, materials, and environmental factors would help ensure the generalizability of findings and address challenges related to dataset variability. Additionally, further studies could explore whether the proposed methodology is truly agnostic to the type of MMS used for data collection, ensuring its applicability across different sensor platforms and acquisition settings. Developing real-time crack detection systems integrated into mobile mapping platforms or drones could significantly enhance the efficiency of infrastructure monitoring and maintenance.
Moreover, optimizing intervention thresholds based on metrics like crack severity and density while integrating guidelines such as the Pavement Condition Index (PCI) could refine maintenance prioritization strategies. Automated or semi-automated methods for generating reference data would reduce reliance on manual annotation, saving time and improving consistency. Lastly, investigating the impact of environmental factors, such as lighting, weather, and wear over time, on detection performance could contribute to the development of more robust algorithms. Addressing these areas will not only build on the findings of this study but also enhance the accuracy, efficiency, and practical applicability of crack detection methods, ultimately improving infrastructure monitoring and maintenance practices.

Author Contributions

Conceptualization, N.P., D.D. and A.H.; methodology, N.P., D.D. and A.H.; validation, N.P., D.D. and A.H.; formal analysis, N.P., D.D. and A.H.; investigation, N.P., D.D. and A.H.; resources, N.P., D.D. and A.H.; data curation, N.P., D.D. and A.H.; writing–original draft preparation, N.P., D.D. and A.H.; writing–review and editing, N.P., D.D. and A.H.; visualization, N.P., D.D. and A.H.; supervision, N.P., D.D. and A.H. All authors have read and agreed to the published version of the manuscript.

Funding

This research received no external funding.

Data Availability Statement

No new data were created or analyzed in this study. Data sharing is not applicable to this article.

Acknowledgments

The authors would like to acknowledge the efforts of the Digital Photogrammetry Research Group (DPRG) members in data collection. The contents of this paper reflect the views of the authors, who are responsible for the facts and the accuracy of the data presented herein. These views do not necessarily represent the official policies of the sponsoring organizations and do not constitute a standard, specification, or regulation.

Conflicts of Interest

The authors declare no conflicts of interest.

Abbreviations

The following abbreviations are used in this manuscript:
AGAbove Ground
BEBare Earth
CCCloudCompare
CNNConvolutional neural network
CSCloth simulation
CSFCloth Simulation Filtering
DBSCANDensity-Based Spatial Clustering of Applications with Noise
DTMDigital Terrain Model
FNFalse negative
FP False positive
GNSSGlobal Navigation Satellite System
GNNGraph neural network
IMUInertial Measurement Unit
INIntensity normalization
INDOTIndiana Department of Transportation
INSInertial Navigation System
LiDARLight Detection and Ranging
LUTLook-up table
MMSMobile Mapping System
MLSMobile Laser Scanning
NDTNon-Destructive Testing
OAOverall Accuracy
RFRandom Forest
ROIRegion of Interest
TPTrue positive
WebGISWeb Geographic Information Systems

References

  1. Pascucci, N.; Shin, S.-Y.; Hodaei, M.; Dominici, D.; Habib, A. Comparative analysis of morphological (MCSS) and learning-based (SPG) strategies for detecting signage occlusions along transportation corridors. Int. Arch. Photogramm. Remote Sens. Spat. Inf. Sci. 2023, 48, 1651–1658. [Google Scholar] [CrossRef]
  2. Alicandro, M.; Dominici, D.; Pascucci, N.; Quaresima, R.; Zollini, S. Enhanced algorithms to extract decay forms of concrete infrastructures from UAV photogrammetric data. Int. Arch. Photogramm. Remote Sens. Spat. Inf. Sci. 2023, 48, 9–15. [Google Scholar] [CrossRef]
  3. Alsheyab, M.A.; Khasawneh, M.A.; Abualia, A.; Sawalha, A. A critical review of fatigue cracking in asphalt concrete pavement: A challenge to pavement durability. Innov. Infrastruct. Solut. 2024, 9, 386. [Google Scholar] [CrossRef]
  4. Ministry of Infrastructure and Transport—MIT. Linee Guida per la Classificazione e Gestione del Rischio, la Valutazione Della Sicurezza ed il Monitoraggio dei Ponti Esistenti. 2020. Available online: https://www.mit.gov.it/sites/default/files/media/notizia/2020-05/1_Testo_Linee_Guida_ponti.pdf (accessed on 21 April 2025).
  5. Cantisani, G.; Borrelli, C.C.; Del Serrone, G.; Peluso, P. Optimizing Road Safety Inspections on Rural Roads. Infrastructures 2023, 8, 30. [Google Scholar] [CrossRef]
  6. European Commission. EU Road Safety Policy Framework 2021–2030-Next Steps Towards “Vision Zero”. 2019. Available online: https://www.europarl.europa.eu/doceo/document/A-9-2021-0211_EN.html#_section2 (accessed on 28 December 2024).
  7. Sinha, K.C.; McCullouch, B.G.; Bullock, D.M.; Konduri, S.; Fricker, J.D.; Labi, S. An Evaluation of the Hyperfix Project for the Reconstruction of I-65/I-70 in Downtown Indianapolis; Final Report No. FHWA/IN/JTRP-2004/2; School of Civil Engineering, Purdue University: West Lafayette, IN, USA, 2003. [Google Scholar]
  8. Luo, S.; Bai, T.; Guo, M.; Wei, Y.; Ma, W. Impact of Freeze–Thaw Cycles on the Long-Term Performance of Concrete Pavement and Related Improvement Measures: A Review. Materials 2022, 15, 4568. [Google Scholar] [CrossRef]
  9. Leal Filho, W.; Abeldaño Zuñiga, R.A.; Sierra, J.; Dinis, M.A.P.; Corazza, L.; Nagy, G.J.; Aina, Y.A. An assessment of priorities in handling climate change impacts on infrastructures. Sci. Rep. 2024, 14, 14147. [Google Scholar] [CrossRef]
  10. Javanmardi, M.; Javanmardi, E.; Gu, Y.; Kamijo, S. Towards High-Definition 3D Urban Mapping: Road Feature-Based Registration of Mobile Mapping Systems and Aerial Imagery. Remote Sens. 2017, 9, 975. [Google Scholar] [CrossRef]
  11. Lin, Y.-C.; Manish, R.; Bullock, D.; Habib, A. Comparative Analysis of Different Mobile LiDAR Mapping Systems for Ditch Line Characterization. Remote Sens. 2021, 13, 2485. [Google Scholar] [CrossRef]
  12. Ravi, R.; Bullock, D.; Habib, A. Pavement Distress and Debris Detection using a Mobile Mapping System with 2D Profiler LiDAR. Transp. Res. Rec. 2021, 2675, 428–438. [Google Scholar] [CrossRef]
  13. Wong, K.; Gu, Y.; Kamijo, S. Mapping for autonomous driving: Opportunities and challenges. IEEE Intell. Transp. Syst. Mag. 2021, 13, 91–106. [Google Scholar] [CrossRef]
  14. Zhou, Y.; Guo, X.; Hou, F.; Wu, J. Review of Intelligent Road Defects Detection Technology. Sustainability 2022, 14, 6306. [Google Scholar] [CrossRef]
  15. Elhashash, M.; Albanwan, H.; Qin, R. A Review of Mobile Mapping Systems: From Sensors to Applications. Sensors 2022, 22, 4262. [Google Scholar] [CrossRef]
  16. Zhong, M.; Sui, L.; Wang, Z.; Hu, D. Pavement Crack Detection from Mobile Laser Scanning Point Clouds Using a Time Grid. Sensors 2020, 20, 4198. [Google Scholar] [CrossRef]
  17. Yan, Y.; Mao, Z.; Wu, J.; Padir, T.; Hajjar, J.F. Towards automated detection and quantification of concrete cracks using integrated images and lidar data from unmanned aerial vehicles. Struct. Control Health Monit. 2021, 28, e2757. [Google Scholar] [CrossRef]
  18. Munawar, H.S.; Hammad, A.W.A.; Haddad, A.; Soares, C.A.P.; Waller, S.T. Image-Based Crack Detection Methods: A Review. Infrastructures 2021, 6, 115. [Google Scholar] [CrossRef]
  19. Yu, J.; Jiang, J.; Fichera, S.; Paoletti, P.; Layzell, L.; Mehta, D.; Luo, S. Road Surface Defect Detection—From Image-Based to Non-Image-Based: A Survey. IEEE Trans. Intell. Transp. Syst. 2024, 25, 10581–10603. [Google Scholar] [CrossRef]
  20. Yuan, Q.; Shi, Y.; Li, M. A Review of Computer Vision-Based Crack Detection Methods in Civil Infrastructure: Progress and Challenges. Remote Sens. 2024, 16, 2910. [Google Scholar] [CrossRef]
  21. Deng, J.; Singh, A.; Zhou, Y.; Lu YLee, V.C.S. Review on computer vision-based crack detection and quantification methodologies for civil structures. Constr. Build. Mater. 2022, 356, 129238. [Google Scholar] [CrossRef]
  22. Gallwey, J.; Eyre MCoggan, J. A machine learning approach for the detection of supporting rock bolts from laser scan data in an underground mine. Tunn. Undergr. Space Technol. 2021, 107, 103656. [Google Scholar] [CrossRef]
  23. Xin, H.; Ye, Y.; Na, X.; Hu, H.; Wang, G.; Wu, C.; Hu, S. Sustainable Road Pothole Detection: A Crowdsourcing Based Multi-Sensors Fusion Approach. Sustainability 2023, 15, 6610. [Google Scholar] [CrossRef]
  24. Singh, N.A.; Kishore, K.; Deo, R.N.; Lu, Y.; Kodikara, J. Automated Segmentation Framework for Asphalt Layer Thickness from GPR Data Using a Cascaded k-Means—DBSCAN Algorithm. J. Environ. Eng. Geophys. 2022, 27, 179–189. [Google Scholar] [CrossRef]
  25. Wang, H.; Barone, G.; Smith, A. Current and future role of data fusion and machine learning in infrastructure health monitoring. Struct. Infrastruct. Eng. 2023, 20, 1853–1882. [Google Scholar] [CrossRef]
  26. Sheridan, K.; Puranik, T.G.; Mangortey, E.; Pinon-Fischer, O.J.; Kirby, M.; Mavris, D.N. An application of dbscan clustering for flight anomaly detection during the approach phase. In Proceedings of the AIAA Scitech 2020 Forum, Orlando, FL, USA, 6–10 January 2020; p. 1851. [Google Scholar] [CrossRef]
  27. Paul, A.; Mukherjee, D.P.; Das, P.; Gangopadhyay, A.; Chintha, A.R.; Kundu, S. Improved Random Forest for Classification. IEEE Trans. Image Process 2018, 27, 4012–4024. [Google Scholar] [CrossRef]
  28. Genuer, R.; Poggi, J.M. Random Forests. In Random Forests with R. Use R! Springer: Cham, Switzerland, 2020. [Google Scholar] [CrossRef]
  29. del Río-Barral, P.; Soilán, M.; González-Collazo, S.M.; Arias, P. Pavement Crack Detection and Clustering via Region-Growing Algorithm from 3D MLS Point Clouds. Remote Sens. 2022, 14, 5866. [Google Scholar] [CrossRef]
  30. Wang, Q.; Nguyen, T.T.; Huang, J.Z.; Nguyen, T.T. An efficient random forests algorithm for high dimensional data classification. Adv. Data Anal. Classif. 2018, 12, 953–972. [Google Scholar] [CrossRef]
  31. Belloni, V.; Sjölander, A.; Ravanelli, R.; Crespi, M.; Nascetti, A. Tack project: Tunnel and bridge automatic crack monitoring using deep learning and photogrammetry. Int. Arch. Photogramm. Remote Sens. Spat. Inf. Sci. 2020, 43, 741–745. [Google Scholar] [CrossRef]
  32. Pascucci, N.; Alicandro, M.; Zollini, S.; Dominici, D. Improving Infrastructure Monitoring: UAV-Based Photogrammetry for Crack Pattern Inspection. In Proceedings of the Future Technologies Conference (FTC) 2024, Volume 1; FTC 2024. Lecture Notes in Networks and Systems. Arai, K., Ed.; Springer: Cham, Switzerland, 2024; Volume 1154. [Google Scholar] [CrossRef]
  33. Alicandro, M.; Zollini, S.; Oxoli, D.; Pascucci, N.; Dominici, D.; Brescia, D. Design and implementation of an open-source web-GIS to manage the public works of Abruzzo Region: An example towards the digitalization of the management process of public administrations. Int. Arch. Photogramm. Remote Sens. Spat. Inf. Sci. 2022, 48, 21–26. [Google Scholar] [CrossRef]
  34. Riegl, VUX-1HA Datasheet. Available online: http://www.riegl.com/uploads/tx_pxpriegldownloads/DataSheet_VUX-1HA__2015-10-06.pdf (accessed on 14 December 2024).
  35. Z+F, Profiler 9012. Available online: https://www.zofre.de/en/laser-scanners/2d-laser-scanner/z-fprofilerr-9012 (accessed on 14 December 2024).
  36. Novatel, IMU-ISA-100C. Available online: https://docs.novatel.com/OEM7/Content/Technical_Specs_IMU/ISA_100C_Performance.htm (accessed on 14 December 2024).
  37. Ravi, R.; Bullock, D.; Habib, A. Highway and airport runway pavement inspection using mobile LiDAR. Int. Arch. Photogramm. Remote Sens. Spat. Inf. Sci. 2020, 43, 349–354. [Google Scholar] [CrossRef]
  38. Previtali, M.; Brumana, R.; Banfi, F. Existing infrastructure cost effective informative modelling with multisource sensed data: TLS, MMS and photogrammetry. Appl. Geomat. 2022, 14 (Suppl. S1), 21–40. [Google Scholar] [CrossRef]
  39. Zhang, W.; Qi, J.; Wan, P.; Wang, H.; Xie, D.; Wang, X.; Yan, G. An Easy-to-Use Airborne LiDAR Data Filtering Method Based on Cloth Simulation. Remote Sens. 2016, 8, 501. [Google Scholar] [CrossRef]
  40. Lin, Y.C.; Habib, A. Quality control and crop characterization framework for multi-temporal UAV LiDAR data over mechanized agricultural fields. Remote Sens. Environ. 2021, 256, 112299. [Google Scholar] [CrossRef]
  41. Parajuli, A.; Celenk, M.; Riley, H. Robust Lane Detection in Shadows and Low Illumination Conditions using Local Gradient Features. Open J. Appl. Sci. 2013, 3, 68–74. [Google Scholar] [CrossRef]
  42. Cheng, Y.-T.; Patel, A.; Wen, C.; Bullock, D.; Habib, A. Intensity Thresholding and Deep Learning Based Lane Marking Extraction and Lane Width Estimation from Mobile Light Detection and Ranging (LiDAR) Point Clouds. Remote Sens. 2020, 12, 1379. [Google Scholar] [CrossRef]
  43. Cheng, Y.-T.; Lin, Y.-C.; Habib, A. Generalized LiDAR Intensity Normalization and Its Positive Impact on Geometric and Learning-Based Lane Marking Detection. Remote Sens. 2022, 14, 4393. [Google Scholar] [CrossRef]
  44. Ester, M.; Kriegel, H.P.; Sander, J.; Xu, X. A Densitybased Algorithm for Discovering Clusters in Large Spatial Databases with Noise; KDD: Tokyo, Japan, 1996; Volume 96, pp. 226–231. [Google Scholar]
  45. Civera, M.; Sibille, L.; Fragonara, L.Z.; Ceravolo, R. A DBSCAN-Based Automated Operational Modal Analysis Algorithm for Bridge Monitoring. Measurement 2023, 208, 112451. [Google Scholar] [CrossRef]
  46. del Río-Barral, P.; Grandío, J.; Riveiro, B.; Arias, P. Identification of relevant point cloud geometric features for the detection of pavement cracks using MLS data. Int. Arch. Photogramm. Remote Sens. Spat. Inf. Sci. 2023, 48, 107–112. [Google Scholar] [CrossRef]
  47. Breiman, L. Random forests. Mach. Learn. 2001, 45, 5–32. [Google Scholar] [CrossRef]
  48. Ghose, M.K.; Pradhan RGhose, S.S. Decision tree classification of remotely sensed satellite data using spectral separability matrix. Int. J. Adv. Comput. Sci. Appl. 2010, 1. [Google Scholar] [CrossRef]
  49. Shokirov, S.; Schaefer, M.; Levick, S.R.; Jucker, T.; Borevitz, J.; Abdurahmanov, I.; Youngentob, K. Multi-platform LiDAR approach for detecting coarse woody debris in a landscape with varied ground cover. Int. J. Remote Sens. 2021, 42, 93249350. [Google Scholar] [CrossRef]
  50. Belgiu, M.; Drăguţ, L. Random forest in remote sensing: A review of applications and future directions. ISPRS J. Photogramm. Remote Sens. 2016, 114, 24–31. [Google Scholar] [CrossRef]
  51. Goutte, C.; Gaussier, E. A Probabilistic Interpretation of Precision, Recall and F-Score, with Implication for Evaluation. In Advances in Information Retrieval; ECIR 2005 Lecture Notes in Computer Science; Losada, D.E., Fernández-Luna, J.M., Eds.; Springer: Berlin/Heidelberg, Germany, 2005; Volume 3408. [Google Scholar] [CrossRef]
  52. Jaccard, P. Étude comparative de la distribution florale dans une portion des Alpes et des Jura. Bull. Société Vaudoise Des. Sci. Nat. 1901, 37, 547–579. [Google Scholar]
  53. Jaccard, P. The Distribution of the Flora of the Alpine Zone. New Phytol. 1912, 11, 37–50. [Google Scholar] [CrossRef]
  54. Coetzee, S.; Ivánová, I.; Mitasova, H.; Brovelli, M.A. Open Geospatial Software and Data: A Review of the Current State and A Perspective into the Future. ISPRS Int. J. Geo-Inf. 2020, 9, 90. [Google Scholar] [CrossRef]
  55. Open Geospatial Consortium. Available online: https://www.opengeospatial.org/standards (accessed on 21 February 2025).
  56. Rosas-Chavoya, M.; Gallardo-Salazar, J.L.; López-Serrano, P.M.; Alcántara-Concepción, P.C.; León-Miranda, A.K. QGIS a constantly growing free and open-source geospatial software contributing to scientific development. Cuad. De Investig. Geográfica 2022, 48, 197–213. Available online: https://publicaciones.unirioja.es/ojs/index.php/cig/article/view/5143 (accessed on 24 February 2025). [CrossRef]
  57. Fatmawati, T.; Syaifudin, Y.W.; Rahmadani, A.; Rosandy, M.; Kyaw HH, S. Optimizing Irrigation Infrastructure Management with Web-Based Technologies and OpenStreetMap. Integr. J. Front. Technol. Eng. 2024, 3, 54–68. [Google Scholar]
  58. Piccoli, F.; Locatelli, S.G.; Schettini, R.; Napoletano, P. An Open-Source Platform for GIS Data Management and Analytics. Sensors 2023, 23, 3788. [Google Scholar] [CrossRef]
  59. Ong, G.; Nantung, T.E.; Sinha, K.C. Indiana Pavement Preservation Program; Publication FHWA/IN/JTRP-2010/14; Joint Transportation Research Program, Indiana Department of Transportation and Purdue University: West Lafayette, IN, USA, 2010. [Google Scholar] [CrossRef]
  60. Indiana LTAP. Indiana Local Road and Bridge Conditions. Indiana Local Technical Assistance Program (LTAP) Publications. Paper 111; 2016. Available online: https://docs.lib.purdue.edu/inltappubs/111 (accessed on 21 April 2025).
  61. Eltouny, K.; Gomaa, M.; Liang, X. Unsupervised Learning Methods for Data-Driven Vibration-Based Structural Health Monitoring: A Review. Sensors 2023, 23, 3290. [Google Scholar] [CrossRef]
  62. Ju, S.; Li, D.; Jia, J. Machine-learning-based methods for crack classification using acoustic emission technique. Mech. Syst. Signal Process. 2022, 178, 109253. [Google Scholar] [CrossRef]
  63. Yao, Y.; Tung, S.-T.E.; Glisic, B. Crack detection and characterization techniques—An overview. Struct. Control Health Monit. 2014, 21, 1387–1413. [Google Scholar] [CrossRef]
  64. Khlifati, O.; Baba, K.; Tayeh, B.A. Survey of automated crack detection methods for asphalt and concrete structures. Innov. Infrastruct. Solut. 2024, 9, 438. [Google Scholar] [CrossRef]
Figure 1. MMS LiDAR systems used in the study: the PWMMS-UHA.
Remotesensing 17 01543 g001
Figure 2. Visual inspection of a subset of the 27 studied segments along State Highway I-65, with each segment color-coded based on intensity thresholding. The image highlights the variation in surface features across the dataset, allowing for a comprehensive overview of the road surface conditions, including the detection of cracks.
Remotesensing 17 01543 g002
Figure 3. Study site showing the data collection route and bridge locations along State Highway I-65, with an aerial view adopted from Google Earth imagery. The inset provides a detailed zoom of a road surface segment.
Remotesensing 17 01543 g003
Figure 4. Proposed framework for comparative analysis of clustering and machine learning-based classification for detecting cracks in road surface.
Remotesensing 17 01543 g004
Figure 5. Example of a tile illustrating the effectiveness of the proposed method in isolating the DTM, BE, and AG points.
Remotesensing 17 01543 g005
Figure 6. Overview of the WebGIS system architecture, from project setup to web visualization, based on Lizmap.
Remotesensing 17 01543 g006
Figure 7. Visualization of a road segment near Bridge 17: (Left) color-coded by intensity thresholds, (Center) DBSCAN clustering results, (Right) DBSCAN clusters with manual labeling for classification and validation.
Remotesensing 17 01543 g007
Figure 8. (Left) Road segment near Bridge 17 with intensity-based coloring, (Center) normalized intensity values highlighting lane markings vs. cracks, (Right) DBSCAN results with and without manual labeling.
Remotesensing 17 01543 g008
Figure 9. Comparison of road surface classification using RF: (Left) without intensity normalization, (Right) with intensity normalization.
Remotesensing 17 01543 g009
Figure 10. Quantitative estimation of crack surface area calculated using the Poisson surface reconstruction algorithm in CloudCompare. Crack surface measurements have been rounded to two decimal places to enhance clarity and readability.
Remotesensing 17 01543 g010
Figure 11. Overview of workflows and outputs: (Left) 3D model in Blender, (Top Right) physical model in QGIS, (Bottom Right) WebGIS interface (Lizmap) displaying intervention prioritization along the Lafayette–Indianapolis highway.
Remotesensing 17 01543 g011
Table 1. Validation results from the comparison between the DBSCAN point cloud without intensity normalization and the reference data.
TPFPFNPrecisionRecallF1-Score
Man made Terrain and Road002652NaN0.000NaN
Natural Terrain and Vegetation114089938470.5590.2280.324
Remaining Hardscape and Scanning Artifacts581353240.3000.1510.0201
Longitudinal Cracking7814775500.6200.5860.603
Transversal Cracking164330.8000.3260.463
Overall Accuracy68%
Table 2. Validation results from the comparison between the DBSCAN point cloud with intensity normalization and the reference data.
TPFPFNPrecisionRecallF1-Score
Man made Terrain and Road859230017960.2710.3230.295
Natural Terrain and Vegetation3315346616350.4880.6690.565
Remaining Hardscape and Scanning Artifacts00398NaN0.000NaN
Longitudinal Cracking001332NaN0.000NaN
Transversal Cracking0049NaN0.000NaN
Overall Accuracy75%
Table 3. Validations obtained by comparing the two point clouds from RF without normalized intensity and the reference data.
TPFPFNPrecisionRecallF1-Score
Man made Terrain and Road1920914180.9950.7200.836
Natural Terrain and Vegetation45906003760.8840.9240.903
Remaining Hardscape and Scanning Artifacts352480330.4230.9140.578
Longitudinal Cracking13198250.9410.9960.968
Transversal Cracking49610.8900.9890.933
Overall Accuracy94%
Table 4. Validations obtained by comparing the two point clouds from RF with normalized intensity and the reference data.
TPFPFNPrecisionRecallF1-Score
Man made Terrain and Road1866257980.9860.7000.819
Natural Terrain and Vegetation44837044830.8640.9020.883
Remaining Hardscape and Scanning Artifacts349563360.3820.9060.538
Longitudinal Cracking13189260.9340.9950.964
Transversal Cracking49610.8900.9800.933
Overall Accuracy93%
Table 5. Metrics obtained by comparing the two point clouds from DBSCAN with and without normalized intensity, RF with and without normalized intensity, and reference data only for crack-related classes.
Type of CrackingTPFPFNJaccard Index
DBSCAN No IN Longitudinal78147755043%
Transversal1643330%
DBSCAN IN Longitudinal007020%
Transversal001690%
RF No IN Longitudinal131982594%
Transversal496188%
RF IN Longitudinal131892693%
Transversal496188%
Disclaimer/Publisher’s Note: The statements, opinions and data contained in all publications are solely those of the individual author(s) and contributor(s) and not of MDPI and/or the editor(s). MDPI and/or the editor(s) disclaim responsibility for any injury to people or property resulting from any ideas, methods, instructions or products referred to in the content.

