Article

Rule-Based Multi-Task Deep Learning for Highly Efficient Rice Lodging Segmentation

by
Ming-Der Yang
1,2,3 and
Hsin-Hung Tseng
1,2,3,*
1
Department of Civil Engineering, National Chung Hsing University, Taichung 40227, Taiwan
2
Smart Sustainable New Agriculture Research Center (SMARTer), National Chung Hsing University, Taichung 40227, Taiwan
3
Innovation and Development Center of Sustainable Agriculture, National Chung Hsing University, Taichung 40227, Taiwan
*
Author to whom correspondence should be addressed.
Remote Sens. 2025, 17(9), 1505; https://doi.org/10.3390/rs17091505
Submission received: 14 February 2025 / Revised: 9 April 2025 / Accepted: 21 April 2025 / Published: 24 April 2025
(This article belongs to the Special Issue International Symposium on Remote Sensing (ISRS2024))

Abstract

:
This study proposes rule-based multi-task deep learning for highly efficient rice lodging identification by introducing prior knowledge to improve the efficiency of disaster investigation using unmanned aerial vehicle (UAV) images. Multi-task learning combines rule-based loss functions and learns the best loss function to train a model conforming to prior knowledge. Rule-based and multi-task learning optimizes the integration of rule-based and deep learning networks and dynamically adjusts the loss function model. Lastly, edge computing is deployed on the edge computing host to improve model efficiency for instant inference. This study inferred fifty-one 4096 × 4096 tagged UAV images taken in 2019 and calculated the confusion matrix and accuracy indices. The recall rate of the modified model in the normal rice category was increased by 13.7%. The affecting factor may be caused by changes in spatial resolution and differences in spectral values in different periods, which can be solved by adding part of the 2019 image transfer training to adjust the learning characteristics. The prior knowledge of a deep learning network can be deployed on edge computing devices to collect high-resolution images by regional routes planning within inferred disaster-damaged farmlands, providing efficient disaster survey tools with high detection accuracy.

1. Introduction

A stable food supply is the basis for social development. An efficient and accurate farmland assessment can benefit food production and maintain stable social operations. According to statistics released by the Food and Agriculture Organization of the United Nations, rice (Oryza sativa L.) provides 20% of the world’s food energy supply [1] and is the staple food of more than 50% of the world’s population [2] among various food crops.
Rice lodging, which refers to the bending or collapsing of rice stems due to external forces [3], such as wind, rain, or poor agronomic conditions, presents significant challenges to yield estimation, harvesting efficiency, and overall crop quality [3,4,5]. From an agricultural perspective, enhancing rice lodging resistance is the fundamental strategy to maintain resiliency during natural disasters [6,7,8]. However, extreme weather disasters are inevitable. Early and accurate monitoring of lodging is crucial for timely intervention and damage assessment. Many countries have implemented compensation measures for agricultural losses caused by natural disasters, typically measured through traditional field-based inspections, including gauge-assisted visual assessments conducted by government-appointed surveyors [9,10,11]. Furthermore, these methods are labor intensive, time consuming, and often subjective, particularly in regions like Taiwan with highly fragmented farmland. According to the natural disaster relief measures of the Ministry of Agriculture, Taiwan, township offices in each region must conduct a preliminary disaster assessment within three days after a disaster occurs and complete a disaster investigation within a week. A sample review must be conducted within two weeks after the township office reports to the county and city government. Rice paddy with a lodging ratio of over 20% can receive corresponding subsidies based on the damage ratio.
Rice paddies in Taiwan are scattered and small. Once a disaster occurs, many paddies will be affected. Landowners of farmland must report to the local government individually. The local government will be burdened with both the acceptance and on-site disaster investigation, which can take up to 30 days. On this day, farmers can only wait for government surveyors to schedule on-site surveys. Exploration is mainly based on visual inspection, and the judgment results can easily lead to disputes. Introducing objective and fair disaster investigation processes and results is necessary to help the government and farmers have more efficient disaster investigation tools.
Satellite image remote sensing detection technology is feasible for investigating rice lodging in large areas [12]. However, satellite images are often limited by spatial and temporal resolution and spectral characteristics [13]. In addition, cloud pollution limits the availability of optical satellite images because thick clouds completely block the target image range, making it impossible to obtain target image features, and it is difficult to ensure that images from other periods have similar characteristics within the disaster range. In recent years, using drones to obtain crop lodging images instantly has become a reliable disaster survey and telemetry tool due to the capability of flying under cloudy conditions [14,15].
Unmanned aerial vehicles (UAVs) are tools with high mobility and easy deployment used to obtain regional high-resolution images at low cost and provide target feature details [16,17,18,19]. Combined with image spectral analysis technology, the digital surface model (DSM) strengthens disaster damage characteristics and local area image disaster inspection technology based on data analysis [20]. A lodging evaluation index based on the elevation model automatically reflects the severity of corn lodging and post-harvest yield [21]. Combining thermal infrared and UAV visible images reduces rice lodging identification errors [13]. The above research results show that drone image analysis technology can provide a more efficient and low-cost solution for assessing food crop damage. While these methods can be used for small-scale data analysis, UAV large-area disaster surveys pose more significant technical challenges. For example, DSM-assisted rice lodging identification takes advantage of high image resolution for precise results, but the downside is higher storage occupation and exponential growth of computation time if the area grows larger. Due to the vast amount of data with high complexity and variation, it is a tremendous challenge to analyze large-scale, high-resolution images [22]. Large-area drone disaster surveys require introducing and optimizing more efficient analysis technology [23].
In recent years, deep learning for pattern analysis on drone images has achieved significant application results in the agricultural domain [24,25,26]. When combining different DL models for a more robust rice yield prediction [27], integrating depth sensors for DL model input source to enhance the environmental sensing capability [28], and utilizing the deep learning architecture for rice grain identification [29], results have shown that the dice coefficients of both RGB and multispectral data sets reached over 0.92 [30], and rice yield estimation based on CNN-extracted features surpassed the method utilizing regression models based on vegetation indices [31] by adopting semantic segmentation networks, including FCN-AlexNet and SegNet, providing a more robust identification result than the maximum approximation method and being approximately 10 times faster [32]. Deep learning methods have been demonstrated to identify regional disasters in crop images efficiently. However, in many pixel-based image segmentation models, the classification result of each pixel does not correspond to the laws of the physical world. Still, it is determined by the highest probability category in the training category.
The rule-based concept establishes expert systems based on knowledge in certain domains and summarizes the phenomena of the real world into interpretable rules. Rules are relatively easy to create and understand because they provide descriptions of reality characteristics, problem solutions, and action commands [33,34], such as localization of fires based on the features of different color spaces [35], image landslide detection based on vegetation indices, illumination, texture, and DEM [36], automated land-cover classification based on the airborne LiDAR-acquired data and a generated 3D model [37], car parking status detection on aerial images based on rule-based fuzzy logic [38], pig lesion scoring with veterinary medicine knowledge and experiments [39], and defect feature extraction [40]. In summary, the rule-based expert system or model inspired by the rule-based concept facilitates identification focusing on the interested target area in landscape analysis that excludes irrelevant areas, which can improve the performance of large-scale aerial image analysis.
Conversely, some image analysis problems utilize not only one branch of output as a result but two or more; such object detection problems utilize at least two tasks, localization and classification, to identify a specific object at a certain location in the image. The multi-task learning (MTL) strategy defines two or more learning targets (outputs) that share some related representations that have been proven to have a more robust generalization [41]. MTL has been adopted in several different applications, such as natural language processing for multi-language translation [42], visual image object detection with classification and localization [43,44], improving multi-view face detection with MTL by recognizing facial landmarks [45], utilizing CNNs for road extraction on satellite image with road lane and center line segmentation tasks [46], COVID-19 pneumonia detection on compute tomography with infection type classification, lesion segmentation, and image reconstruction [47], and melanoma lesion identification on dermoscopic images with a combination of classification, detection, and segmentation tasks [48]. Moreover, combining multi-task learning and big data with deep learning technology has become a key to moving towards precision agriculture. MTL strategies applied in the agriculture domain include leaf disease identification [49], grain quality trait prediction with grain protein, moisture, and type prediction tasks [50], and MTL for fruit type and freshness classification [51].
Given the above research results, compared with the past single-task deep learning model, the MTL model has the advantage of adding other conditions for simultaneous training to achieve multi-stage or multi-variable analysis goals.
Therefore, based on the above introduction and summary of related research, the expected goals of this study are as follows:
1. The design of a rule-based multi-task loss function grounded in real-world physical principles. This study developed a novel loss function that integrates domain knowledge into the training process. By explicitly separating the classification of rice paddies and lodging status into two learning objectives, the model is encouraged to conform to physical constraints (e.g., lodging only occurs in rice paddies). This design enhances model interpretability and reduces false positives in non-agricultural regions.
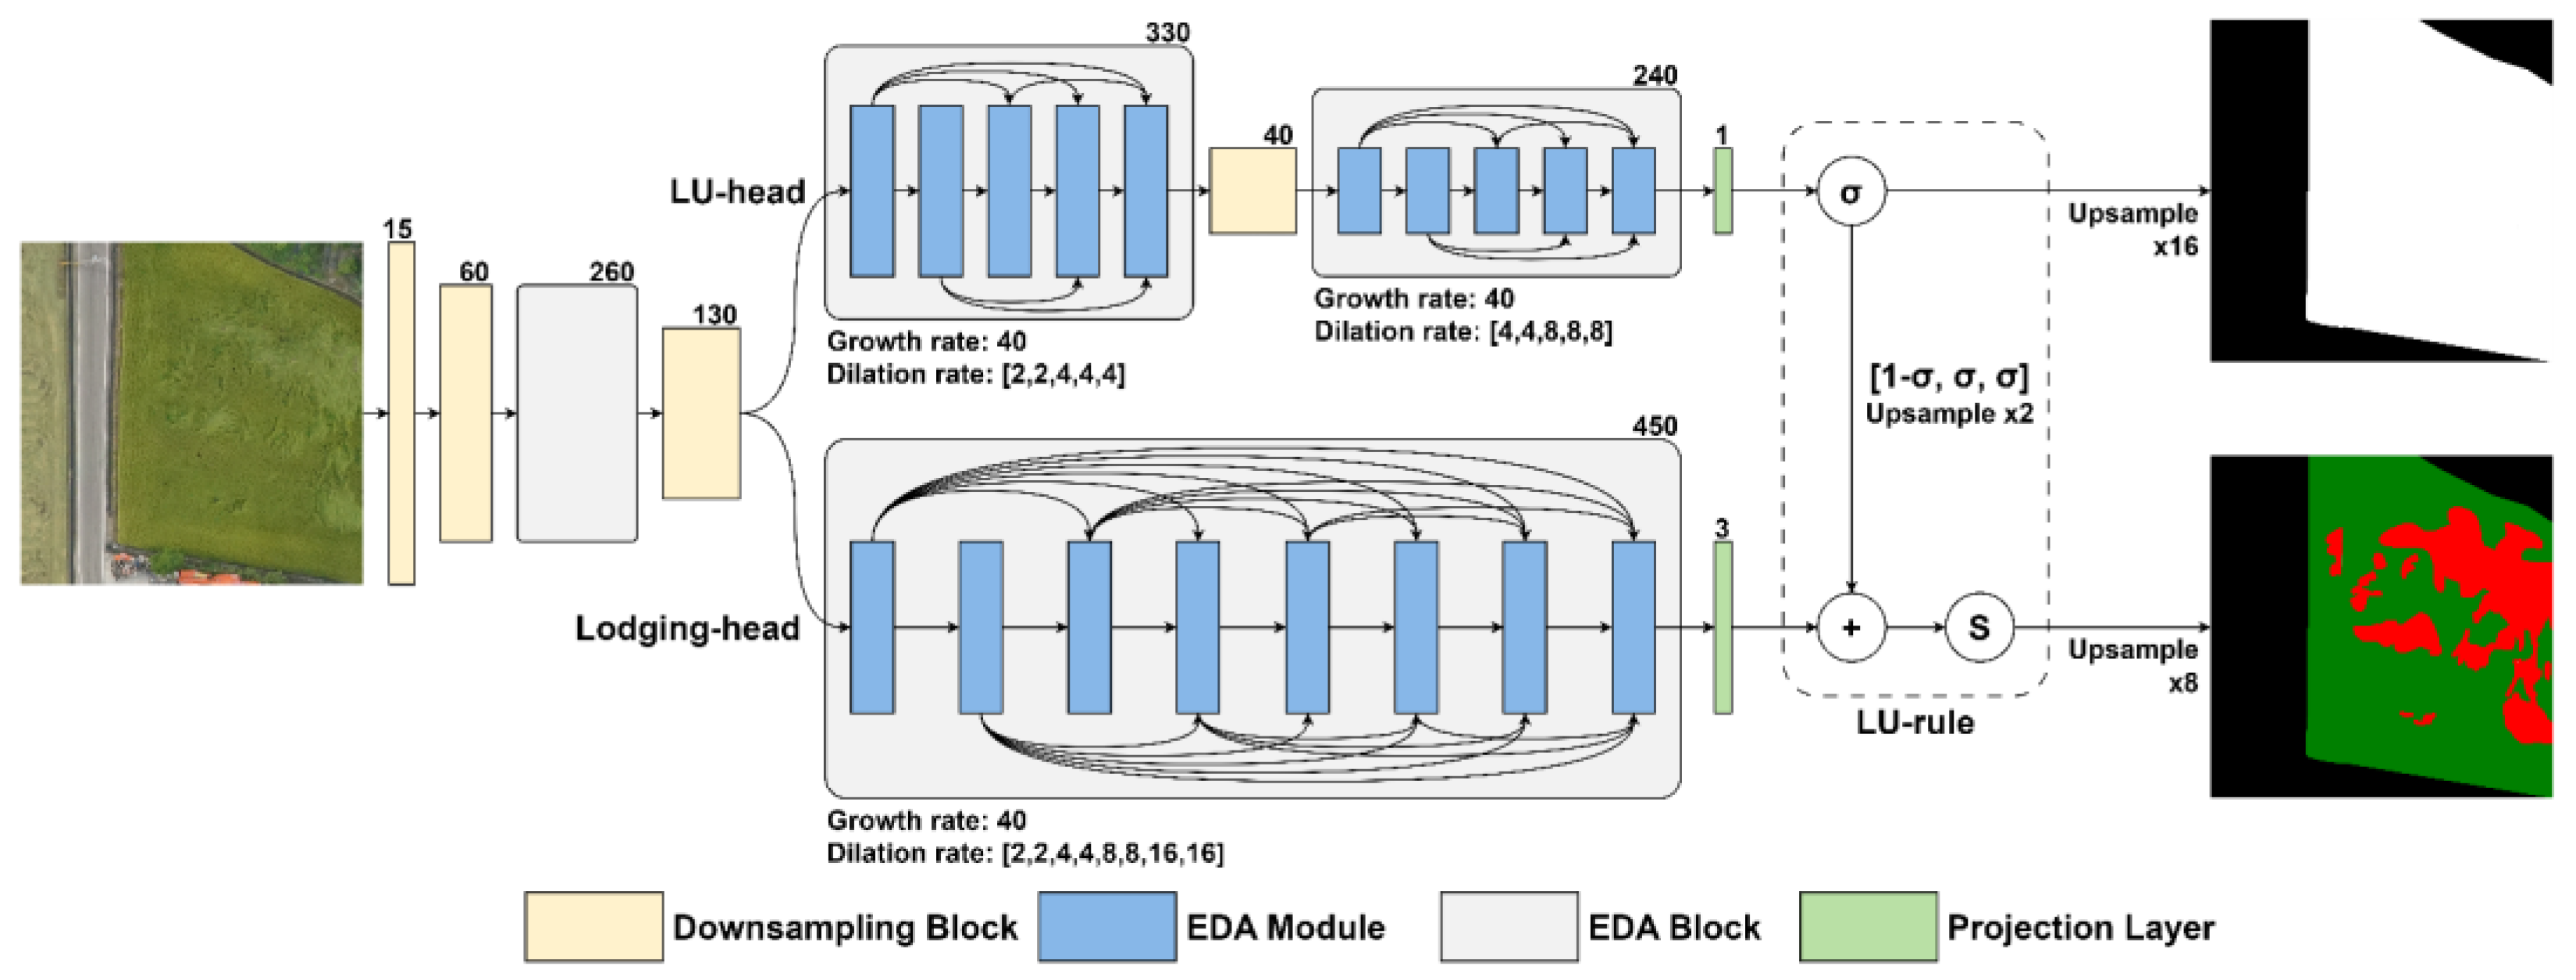
2. The development of a modified EDANet-based semantic segmentation model with a multi-branch architecture. Building upon the lightweight EDANet structure, this study proposed a two-headed architecture—an LU-head for land-use classification and a lodging-head for lodging status—to allow simultaneous learning of coarse and fine-grained features. This architecture enables more accurate localization of rice fields and more robust identification of lodging patterns, even in visually ambiguous conditions.
3. Demonstration of performance gains through extensive evaluation and transfer learning: The proposed model was trained and evaluated on multi-year UAV datasets with varying environmental conditions. The study demonstrated significant improvements in classification accuracy compared to a baseline model, particularly in recall for both normal rice and lodging rice classes. Additionally, the model’s generalizability was verified through transfer learning and histogram matching to adapt to new data distributions.

2. Materials and Methods

The study aims to optimize the deep learning algorithm based on prior knowledge of the physical world and apply it to efficient rice lodging identification, as shown in Figure 1. This study intends to develop a rule-based multi-task loss function through aerial image pre-processing, data annotation combined with prior knowledge, and combination with convolutional neural networks (CNNs) to modify the feature forward structure. Through the mentioned steps, this study optimizes the loss function in the model to establish a high-efficiency disaster image identification model. This chapter details the research design, methods, steps, and execution.

2.1. Study Site and Dataset

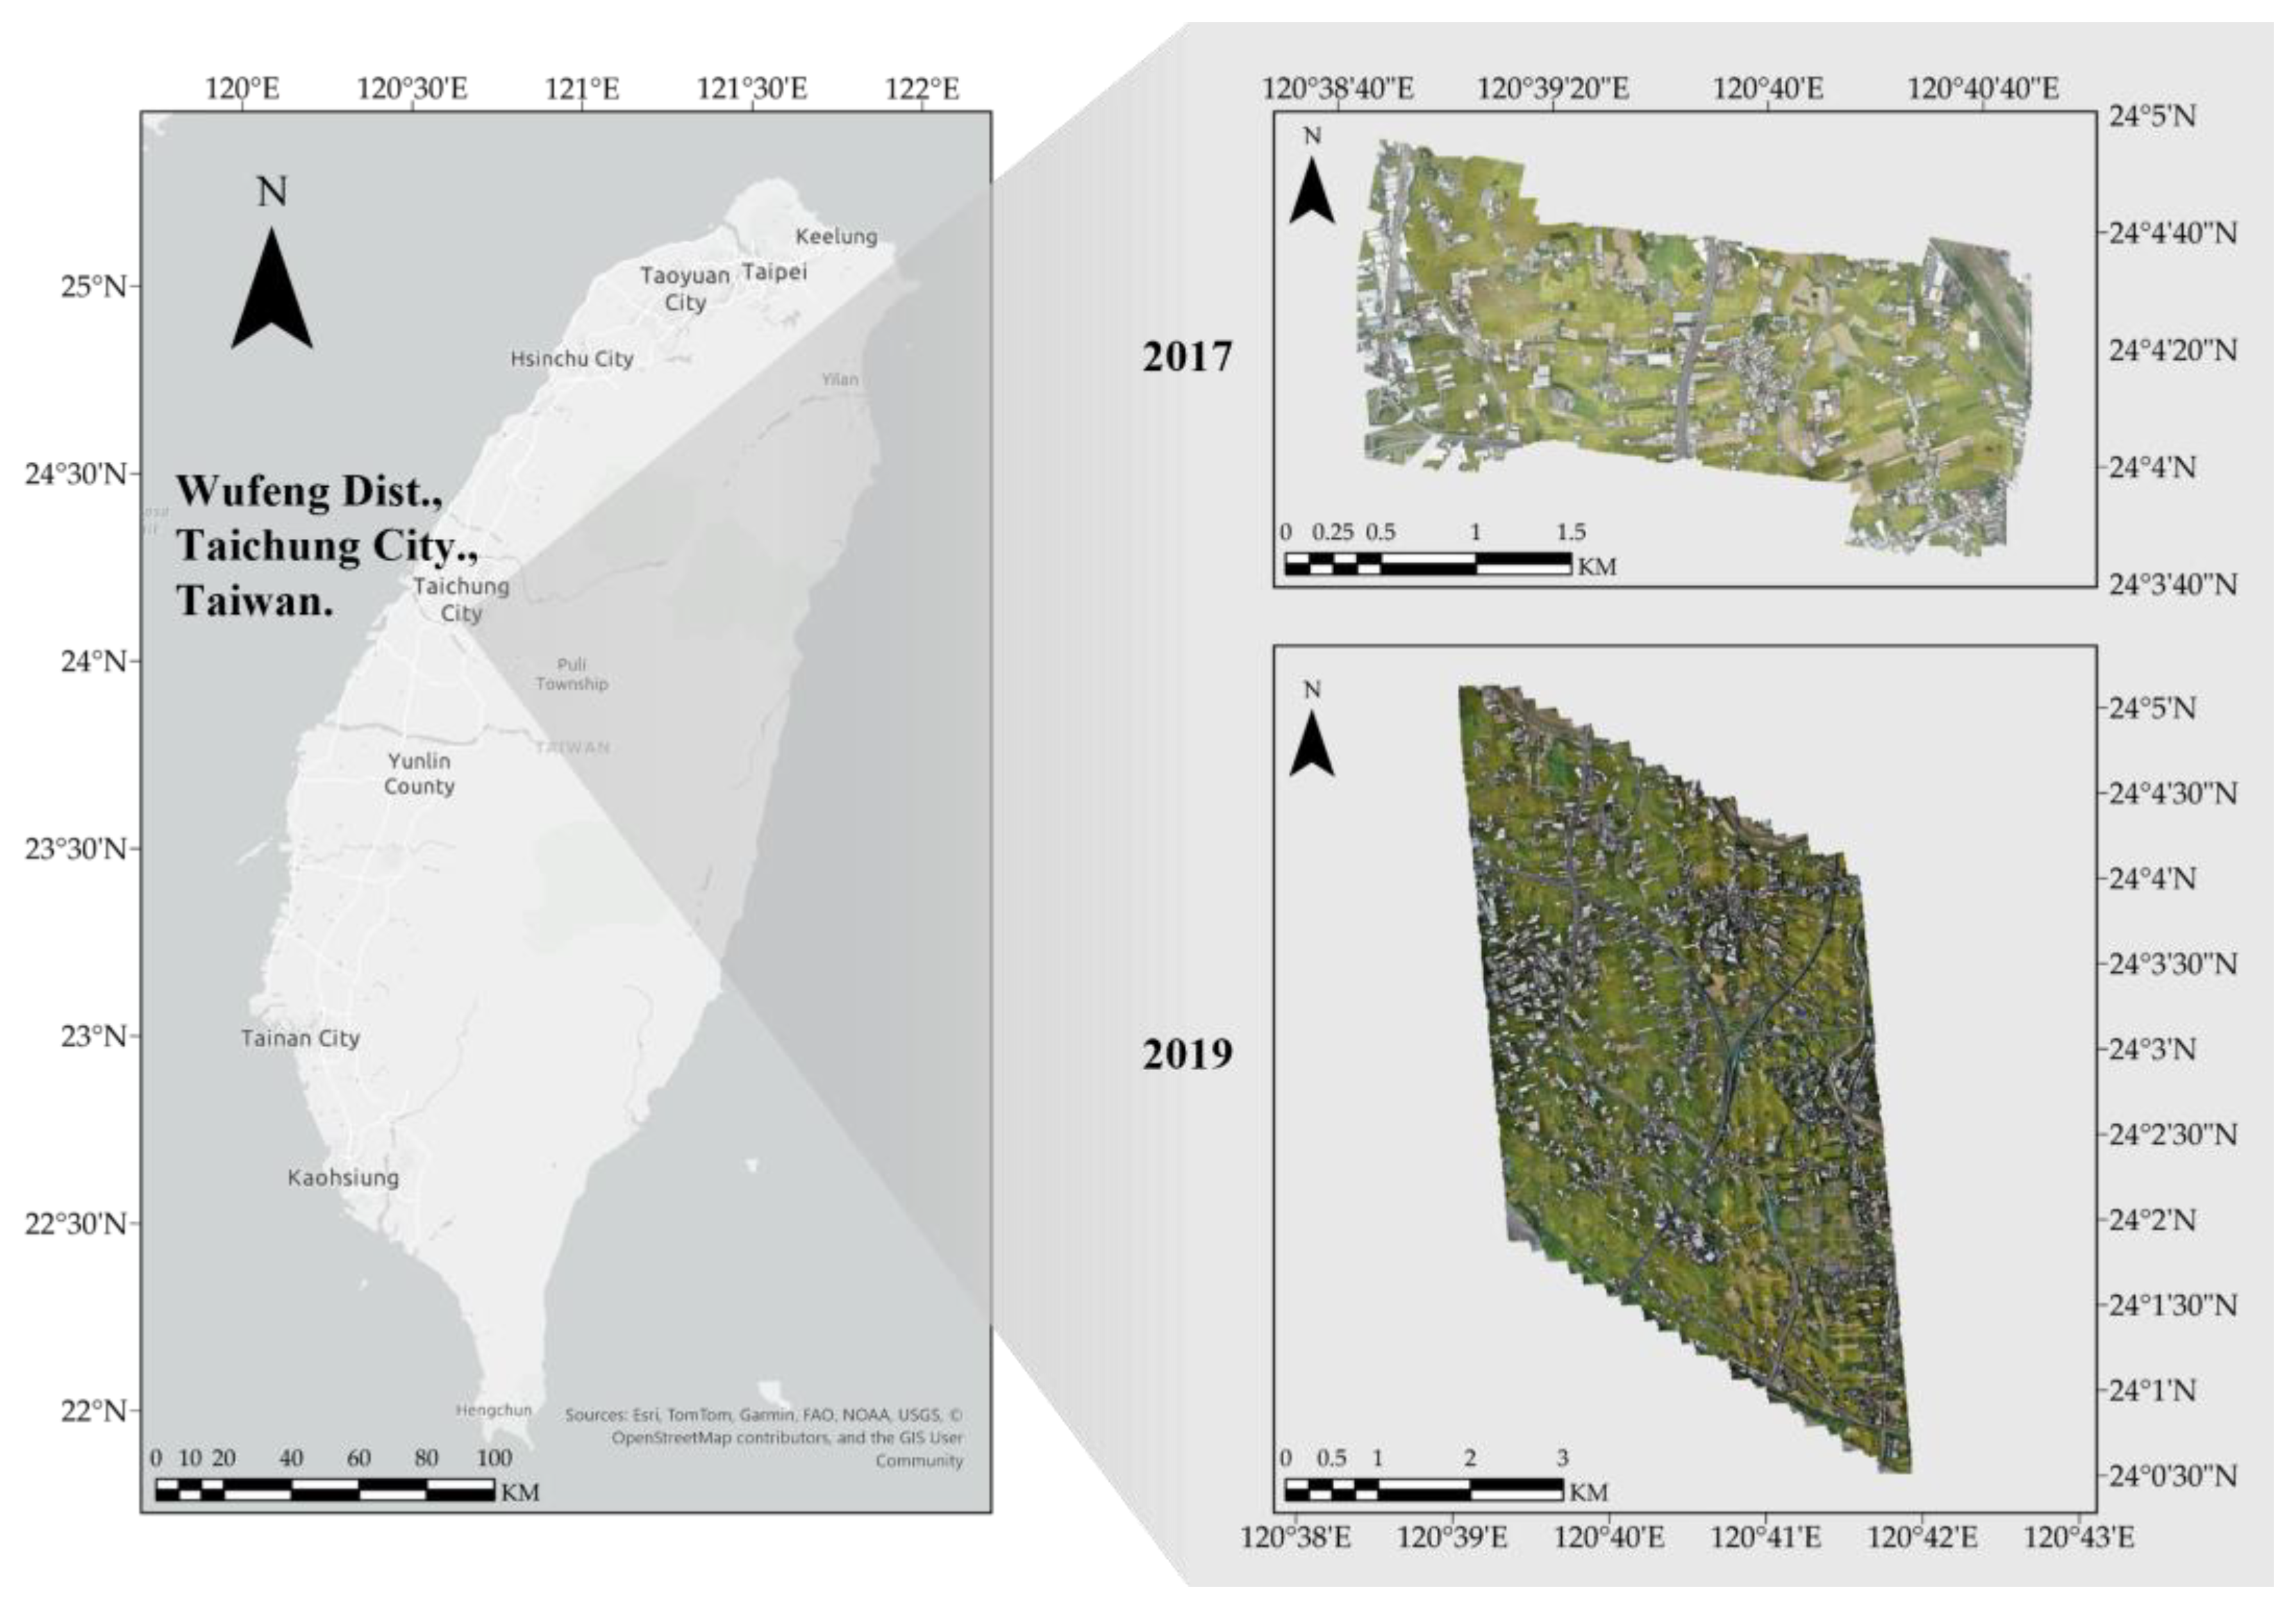
The study area (Figure 2) is located in Wufeng District, Taichung City. Western Wufeng has sufficient water resources, resulting in double-cropping rice fields. The annual precipitation ranges from 1400 to 1665 mm, and the yearly average temperature is approximately 22.5 degrees Celsius. The cultivar Tainung No. 71 (TNG71) is cultivated on-site with the assistance of the Taiwan Agricultural Research Institute, Ministry of Agriculture and has the largest TNG71 cultivating area in the country. In 2019, the annual cumulative precipitation at the Taichung weather station was 734 mm higher than the climatic average, and the precipitation variability was 141%, the highest among all weather stations. Therefore, the continuous rain caused severe lodging results. This study collects aerial images using Sony (Tokyo, Japan) cameras covering 430 ha in 2017 for model training and an area of 2300 hectares in 2019 for testing, of which the spatial resolution was around five centimeters. The mission details and sensors are shown in Table 1 and Table 2. The images collected in this study were pre-processed to create orthophotos and crop them into tiles for the subsequent computations.
The agricultural experts from the College of Agriculture and Natural Resources, NCHU, helped annotate the data on the orthomosaic image processed from the raw images. The annotated classes are background (black), normal rice (green), road (gray), ridge (brown), and lodging rice (red), and the representative colors are shown in Table 3. In the rule-based multi-task identification scenario, the LU-head is a binary classifier with the categories background (black) and rice paddy (white). The lodging-head is a categorical classifier with background (black), normal rice (green), and lodging rice (red) classes.

2.2. Semantic Segmentation Model

This study mainly focuses on land cover and uses classification on aerial telemetry images. The conventional method is achieving detailed object classification and area calculation through pixel classification. Therefore, this study adopts the semantic segmentation architecture of the deep learning model to achieve pixel classification results and chooses EDANet [52], which was adopted in our previous study [23], as the base model for modification. The following sections introduce the base and modified EDANet adopted in this study.
According to the original paper on EDANet (Figure 3), the architecture provides an efficient, lightweight, and high-precision semantic segmentation architecture for real-time high-resolution (1080P) video inference on resource-tight edge computing systems. The basic unit, the EDA Module, comprises two pairs of stacked asymmetric convolution layers with 3 × 1 and 1 × 3 kernels, and the second pair has dilation options. The designed module decreases one-third of the training parameters compared to the conventional design. The main structure, EDA Block, comprises a series of EDA Modules that forward the output feature to the next module and all the following modules in the block. Each EDA Module generates 40 output features, and output features are concatenated to the end of input features, forming an information stack. The model starts from two downsampling blocks that extract features and downsample with a stride of two, resulting in 1/4 of the scale and 60 output features. The first EDA Block comprises five EDA modules, resulting in 260 output features. A downsampling block follows behind, reducing features and scaling to half the input size, resulting in 130 output features and 1/8 scale. The second EDA Block comprises eight EDA modules, resulting in 450 output features. Then, the model connects to a 1 × 1 convolution layer where output features are set as the output class number for pixel classification. In the final, the features are up-sampled 8× matches the same size as the input.

2.3. Rule-Based Learning

CNNs can learn complex features automatically, but they are often considered “black boxes”, making it difficult to understand their decisions and prone to adversarial attacks [53,54]. To alleviate this issue, some research has developed the ensemble model [55], combining rule-based decision output with deep learning model output, which prevents the result from violating physical reasoning. Another approach connects the neural network with rules to transform the deep learning output and constrain the result for an overall score [56].
This study defines a rule-based classifier to make the learned characteristics more consistent with the physical world cognitions, thereby improving the model interpretability. In Figure 3, taking the deep learning network of EDANet as an example, the input image is used to infer the pixel classes through the Downsampling Block, EDA Module, and EDA Block. The rules of the physical world are introduced through the designed loss function, and the total loss serves as an essential basis for weight optimization. In Figure 4, LU-head is the branch of land use (rice paddy) classification, and lodging-head is the branch of rice lodging classification. Ltotal is the total loss function; Llu is the loss function of rice paddy binary classification; Llodging is the loss function of rice lodging categorical classification; and the final output is the lodging-head with the sum of LU-head, which provides inference-head and improves the physical cognition and identification efficiency of the model. This project conducts in-depth research and optimization of the model based on this architecture.

2.3.1. Land-Use Branch (LU-Head)

Considering that the feature scale of the landscape is larger than the lodging rice, an additional fourth downsampling module was added, followed by an EDA module to extract higher-order features. Then, the saliency map of the ground object classification is obtained through point-wise convolution and sigmoid (σ) activation function. The end of this branch connects to a 16× upsampling for classification and loss function calculation, and another 2× upsampling is connected to pass the information to the lodging classification branch. Three duplicated saliency maps are stacked to satisfy the lodging-head channel before the add operation, and the value of the first saliency map is inverted to represent the weighting of the background features.

2.3.2. Lodging Branch (Lodging-Head)

The lodging branch inherits the unmodified structure of the original EDANet architecture. After the second EDA Block, the classification saliency map is obtained through point-wise convolution and added to the saliency map passed from the land-use branch to weigh each category. This structure is the knowledge transfer based on physical meaning. Finally, the probability of the pixel in each category is calculated through the softmax (S) activation function and used for loss computation.

2.4. Multi-Task Learning

Multi-task learning consists of establishing multiple learning targets to fit different goals and defining corresponding loss functions according to the specific learning targets to calculate errors and update the model with partially shared weights [41]. For example, in most object detection architectures, the model simultaneously classifies objects and localizes their position [57,58,59,60]. For this purpose, two tasks, localization and classification, are established. Therefore, different loss functions are defined for the specific tasks. In this study, the two branches, LU-head and lodging-head, learn different feature scales and content and are designed to identify the lodging area over a rice paddy. The separated branches add scalability to the model for adding more tasks as the hot-plug module in the future [61]. Thus, defining loss functions for multiple learning targets to compute the classification error is necessary. Section 2.3 depicted the modified neural network architecture proposed in this study in which the two branches predict and output in different shapes.
In the machine learning model, defining loss functions is necessary to compute the differences between the truth and prediction. The most used loss function for classification tasks is cross-entropy (CE) loss, which computes the difference between the truth and prediction via probability output [62]. The LU-head predicts the rice paddy area, a binary classification problem, therefore adopting binary cross-entropy loss. The lodging-head classifies the image into the background, normal rice, and lodging rice, which have three categories. A categorical cross-entropy loss should be adopted. However, the dataset has a class imbalance condition where the ratio of background, normal rice, and lodging rice categories is approximately 7:2:1. To tackle the class imbalance problem, the lodging-head adopts Focal Loss, a modified cross-entropy loss with an extra weighting and power factor that down weights the easy samples [63]. The total loss combines the weighted summation of the two separate loss functions as a multi-task learning loss.

2.4.1. Binary Cross Entropy (BCE) Loss

Binary cross-entropy loss is a function used to calculate binary classification loss. The equation is as follows, where n is the total number of samples, yi is the true value of the i-th sample, and pi is the predicted value of the i-th sample:
L B C E = 1 n i = 1 n y i · log p i + 1 y i · log 1 p i

2.4.2. Categorical Cross Entropy (CCE) Loss

Categorical cross-entropy loss is a function used to calculate multi-category classification loss. The equation is as follows, where n is the total number of samples, c is the total number of categories, yij is the true value of the i-th sample of the j-th category, and pij is the i-th sample of the j-th category predictive value like:
L C C E = 1 n i = 1 n j = 1 c y i j · log p i j

2.4.3. Categorical Focal Loss

Categorical focal loss is a function to calculate the multi-category classification loss feature, where n is the total number of samples, and c is the total category number.
F L C a t e g o r i c a l = 1 n i = 1 n j = 1 c α j · 1 p i j γ · y i j · log p i j

2.4.4. Total Loss

The multi-task learning total loss function defined in this project is as follows:
L t o t a l x ; θ = i = 1 T λ i L i x ; θ
Among them, T is the number of tasks, and Li is the loss function that represents the parameter θ of the training image x (including the land use annotation and the rice lodging annotation) that is minimized in the corresponding model. For each loss function, Li, according to the importance of the task to the overall model, is weighted with λi and summed up to the total loss function Ltotal. The weighting λi utilizes additional hyperparameters, which can be determined through the Grid-Search method. In this study, since there are only two tasks and lodging classification takes precedence over land use classification, default weighting is set.

2.5. Evaluation Metrics

The study evaluates the model performance of each classification category through the common metrics, precision, recall, and Fβ-score [64]. As shown in Table 4, TPc represents the sample of this category is correctly classified, FPc represents the sample from other categories misclassified into category c, TNc represents the sample of other categories correctly classified into the same category, and FNc represents the sample of category c misclassified into different categories. Fβ represents the harmony between precision and recall, with a weighting coefficient β. When the weighting coefficient β equals 1, it is called the F1-score.
For a single class c, the precision is the ratio of true positives (TPc) to all positives (TPc + FPc). Recall is expressed as the sensitivity to the truth and is the ratio of true positives (TPc) to the sum of true positives (TPc) and false negatives (FNc). However, most of the above indices only consider the classification performance for ground truth, so the study adopts the Fβ-score to evaluate the balance between precision and recall. The F1-score with the weighting coefficient β of 1 is equally considerable between precision and recall. The model classification performance is more robust when the F1-score is closer to 1.

3. Results and Discussions

3.1. Training and Evaluation on the 2017 Dataset

This study adopts EDANet as the base model and modifies it into a multi-task model with a rule-based multi-task architecture (hereinafter referred to as the RBMTL model). The base and RBMTL models’ hyperparameter settings are the same for controlling the variables of learning results. Table 5 shows the training hyperparameters and learning optimizer of the two models.
This study adopts the gradual warmup learning rate strategy [65], which is used in the early training stage to help the model generalize and remain stable even using a large batch size with a large learning rate. Liu et al. also proved that the warmup strategy helps stabilize the training progress with better convergence, especially using an adaptive learning rate [66]. The strategy mitigates the effect of hyperparameter tuning of choosing different batch sizes and learning rates. The warmup learning curve is an exponential function, and its equation is as follows, where S is the number of steps in the complete training phase:
l r w a r m u p S = l r i n i t + l r t a r g e t l r i n i t · S S e · E w α , 0 S S e · E w
The primary learning curve is a polynomial curve, and its equation is as follows:
l r p o l y S = l r e n d + l r t a r g e t l r e n d · 1 S S e · E w S e · E t E w β ,   S e · E w < S S e · E t
After 50 learning epochs, the two trained models infer the test dataset for performance evaluation. Table 6 and Table 7 show the accuracy indices of the two models through the test data, respectively. According to the results, although there is no significant difference in the recall rate of normal rice identification, the RBMTL model has an increase in precision of 6%, the recall rate of the lodging class has increased by 12.6%, and the precision rate also improves by approximately 3%. The evaluation result shows the performance improvement and the feasibility of the rule-based multi-task architecture proposed by the study.
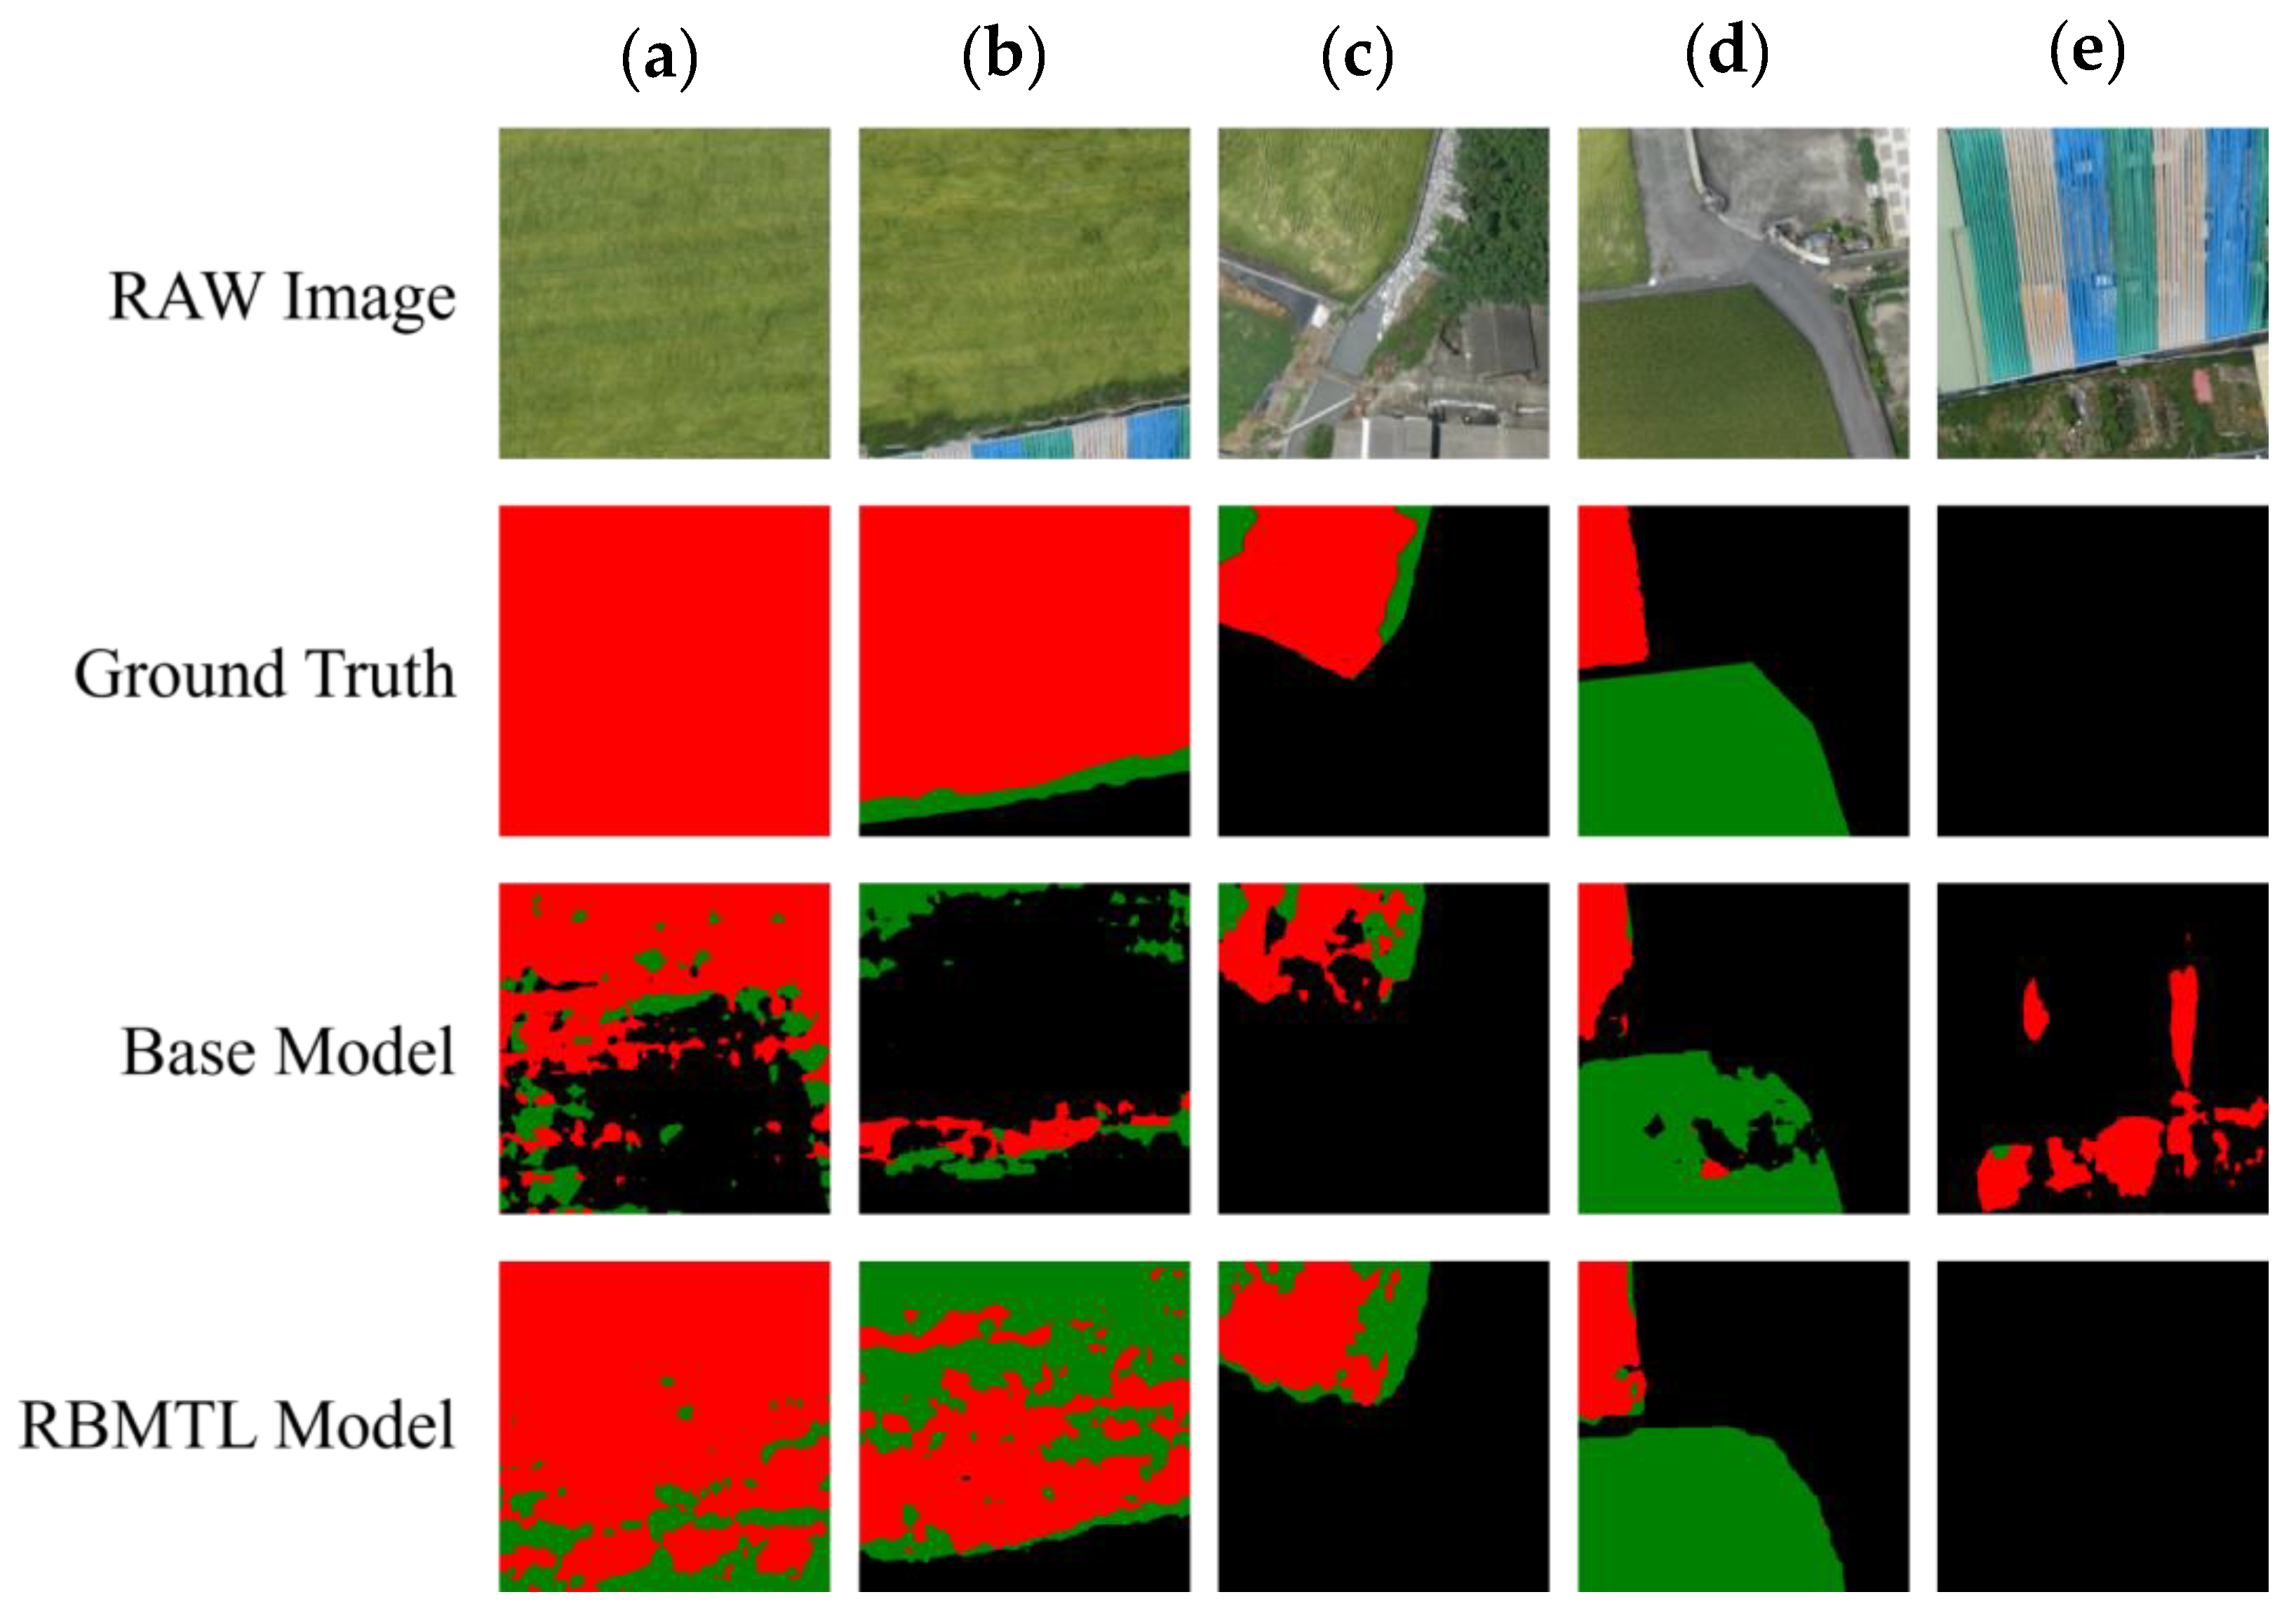
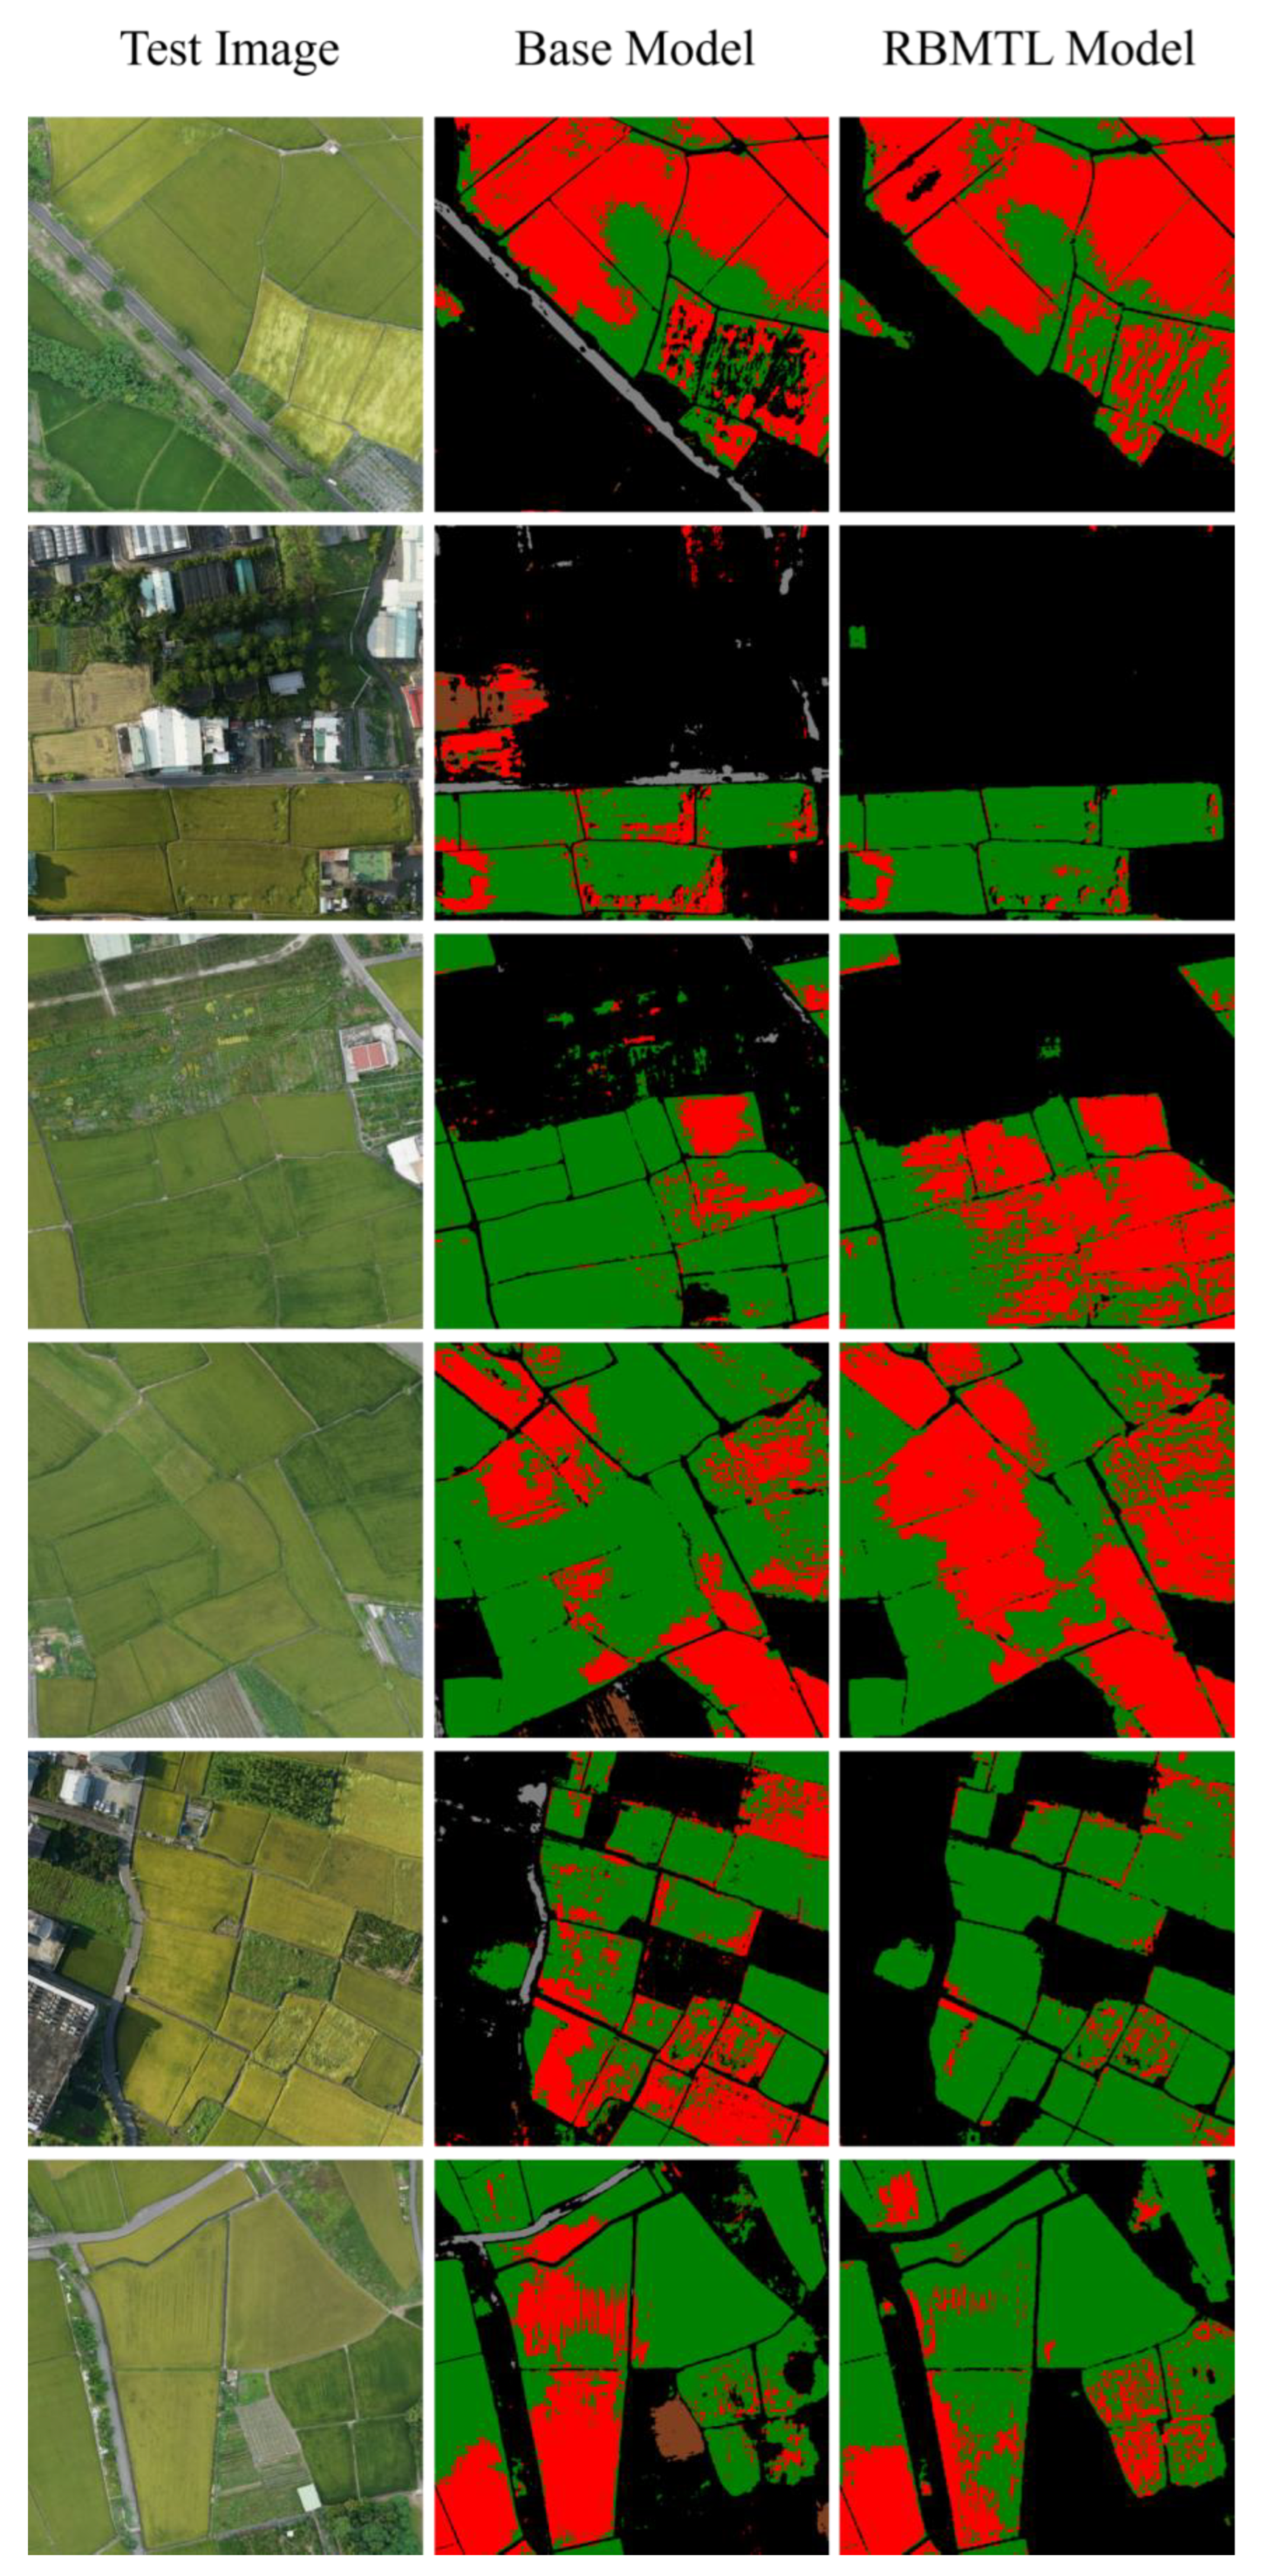
Figure 5 shows the segmentation results of the 2017 test image set, which uses the model developed in this study. The top row is the test image sample, the second is the image annotation ground truth, the third is the original EDANet model inference results, and the last is the inference results of the RBMTL model. To compare the difference in the results of normal rice and lodging rice between the two models, the road and ridge classes were merged into the background class in the ground truth and original model inference results visualization.
The comparison clearly shows the identification differences between the base and RBMTL models. The samples in Figure 5a–c are images covering most of the lodging-rice class. When the rice paddy texture is less obvious, it is easier to classify them as non-paddy fields. The RBMTL model first classifies rice paddies and then classifies lodging status. Therefore, although there are errors in the classification of normal and lodging classes in the lodging-head, they are still classified as rice paddy areas. Figure 5d shows that the base model also has issues classifying uniform texture normal-rice paddy, while the RBMTL model has no issue. Figure 5e is a non-rice-paddy sample. The base model classification is interfered with by the artificial objects’ spectral information, causing rice’s fragmentary lodging in the background class. This result goes against the common sense that lodging exists in rice paddy. The improved framework proposed in this study can accurately classify the paddy area to eliminate the lodging class that does not belong to the paddy field. Therefore, it can effectively control the misclassification of non-paddy fields. By learning the LU-head that specifically classifies rice fields, the lodging-head in the rice fields is given higher characteristic signals to enhance the accuracy of lodging classification.

3.2. Evaluation of the 2019 Dataset

To evaluate the model’s generalizability, this study used 2300 hectares of large-area images taken in 2019 as a test set. This image set is preliminary annotated with 51 4096 × 4096 large image tiles for transfer learning and testing. Transfer learning uses 15 large tiles and subdivides them into 512 × 512 small tiles as the input size of the training process, resulting in a total of 960 small image tiles for training. In addition, 36 large image tiles were used as test targets to evaluate the model’s generalizability to 2019 images. Moreover, due to differences in illumination and shadow conditions for images acquired in 2019, the histogram matching [67] process was performed before transfer learning to ensure that color and lighting are similar. Histogram matching extracts the overlapped image-acquiring areas in 2019 and 2017 and calculates the cumulative distribution function (CDF) of all the pixel values. Then, the process maps the CDF calculated from the blue, green, and red bands of the 2019 image to the CDF calculated from the blue, green, and red bands of the 2017 image.
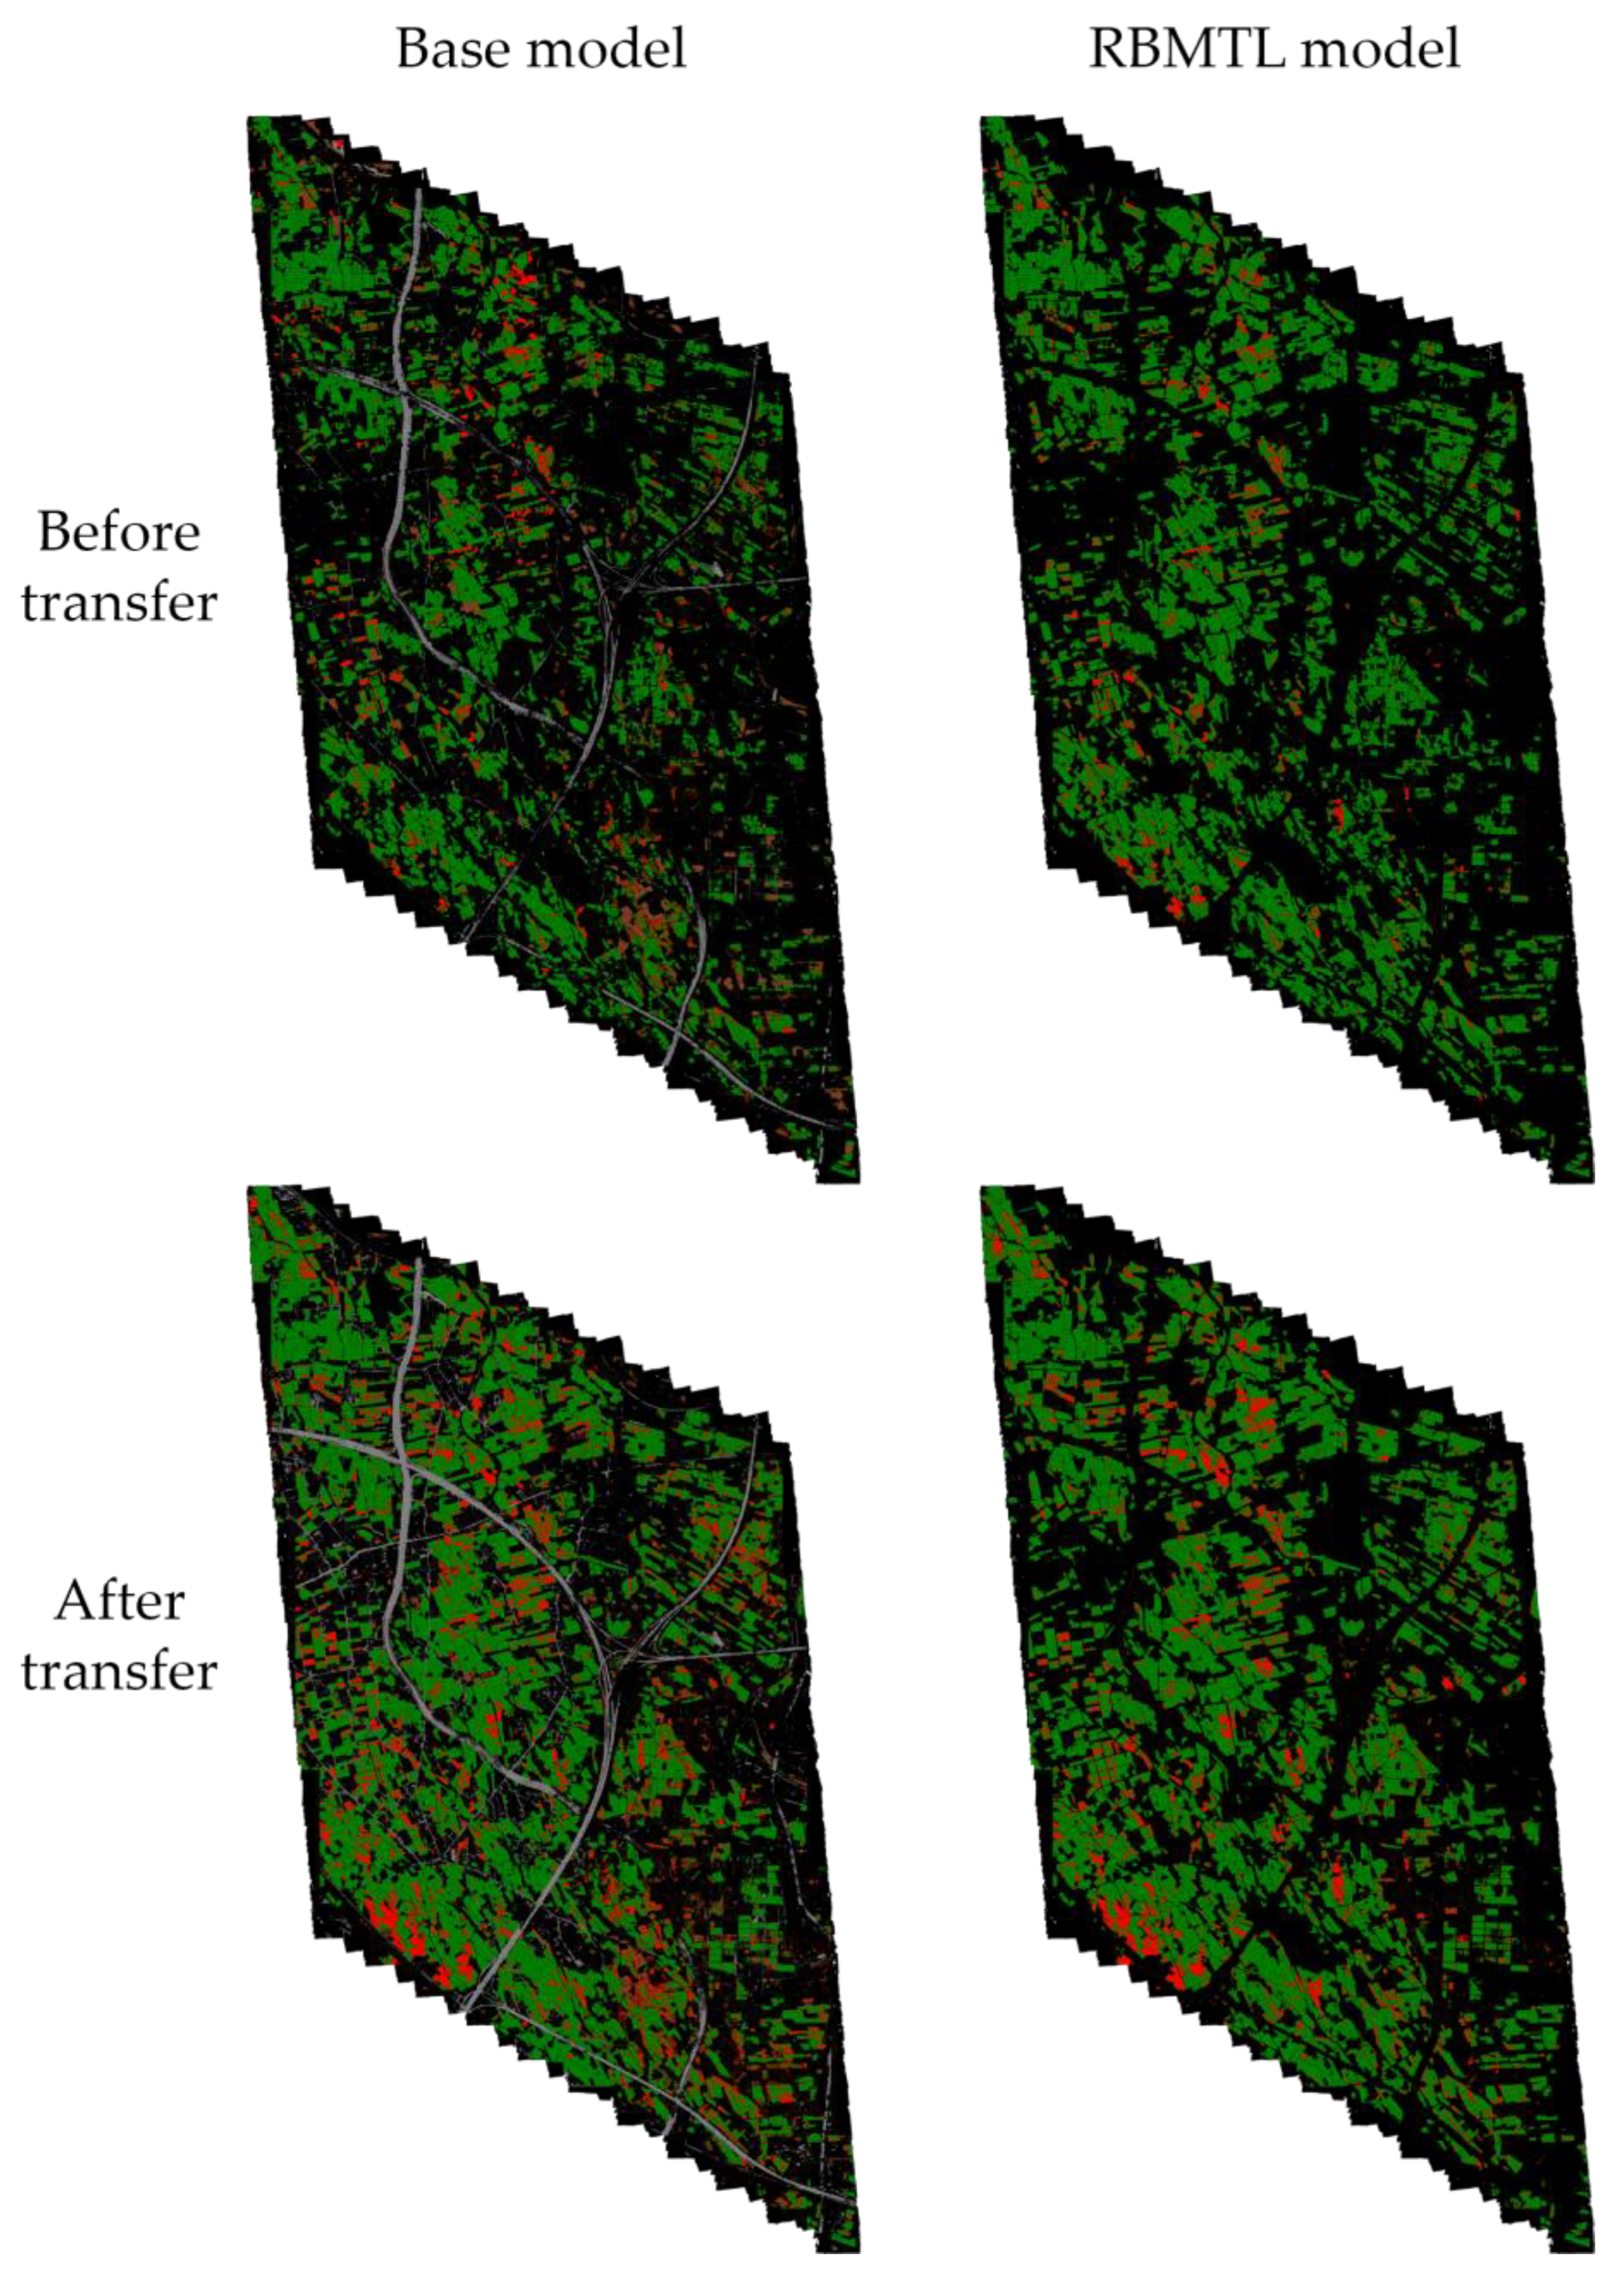
The evaluation also adopts the confusion matrix and the indices in Table 4. Table 8 and Table 9 are the evaluation indices of the 2019 testing results of the base and RBMTL models, respectively. From the table comparison results, the recall rate of the RBMTL model in normal rice classification has the most notable improvement. Compared with the base model before and after using transfer learning and histogram matching, the recall rate increases were 13.7%, 2.47%, and 4.77%, respectively. As for the lodging rice class, although the direct classification of the 2019 images using the non-transferred model is less effective, after transfer learning with a small batch of images, the recall rate can increase by 20% to nearly 60%. In addition, performing histogram matching first and then transfer learning can also improve classification accuracy. Figure 6 shows the inference results of the base and RBMTL model using the non-transferred and histogram-matched transferred model in the 2019 large-scale image, respectively.
Although the recall rate of lodging rice identification has slightly increased through histogram matching and transfer learning, there is still space for improvement. Therefore, the following section inspects the large image tiles with high identification error rates, analyzes them, and discusses the causes and methods for improvement. Figure 7 is a set of large tile images with a high classification error rate, which shows that rice paddy with smooth texture is easy to determine as lodging rice. The base model tends to identify yellowish rice paddy as lodging. In addition, the image-acquiring duration in 2019 was longer, which caused the solar elevation angle to be lower in some areas. As a result, objects with larger elevation differences form shadows and obscure parts of rice paddies or lodging areas, resulting in a lower recognition rate.
The ablation experiment in this section tests the classification performance via adopting histogram matching. The test result shows that slight variations in hue are still sensitive to the models because the brightness of the lodging area is higher and the saturation is lower, which means that normal rice with similar spectra can be easily misclassified as lodging. The problem of paddy fields with a smooth texture is easily classified as lodging. It is speculated that the spacing between rows planted in some rice paddy is narrow, causing the model to misclassify. The sum of the above two factors results in lower accuracy. The preliminary estimation of a low recall rate is that the ground truth annotating and classification of lodging areas are more leniently determined, and the classification results are one by one down to the pixel level. Therefore, the recall rate calculation will be lower than the actual value.

4. Conclusions

This study proposes a combination of rule-based learning with multi-task learning for efficient rice lodging identification and introduces prior knowledge to improve disaster identification efficiency. This study is based on several internationally published lodging identification technologies in the past and establishes an efficient procedure of drone-based disaster survey technology consisting of five parts. The image pre-processing part includes standard pre-processing procedures and image feature enhancement. Experts semi-automatically assist with the image annotation part and establish prior knowledge based on physical laws. The proposed method in this study achieved promising results due to the integration of rule-based learning and multi-task learning (RBMTL) within a lightweight semantic segmentation framework. The backbone is EDANet, chosen for its efficiency in real-time high-resolution image segmentation. We extended EDANet into an RBMTL architecture by adding two distinct branches, an LU-head and a lodging-head, which perform binary classification of rice paddy vs. background and multi-class classification for normal rice, lodging rice, and background, respectively. These branches share part of the network but specialize in tasks of different spatial and semantic scales, which enhances both generalization and precision.
One of the most challenging issues in lodging detection is avoiding the misclassification of non-rice regions or smooth-texture paddies as lodging rice, especially when using pixel-based segmentation. The proposed model addresses this by first incorporating prior knowledge as rule-based constraints into the loss function, guiding the model to produce physically meaningful outputs, and second by using multi-task supervision, ensuring that lodging detection is conditioned on accurate rice paddy localization. This hierarchical reasoning mirrors how humans interpret lodging—it must occur within a rice paddy. This approach significantly reduces false positives in non-paddy areas.
The RBMTL model showed the most notable improvement in the recall rate for normal rice classification. RBMTL was compared with a base model before and after using transfer learning and histogram matching, with recall increases of 13.7%, 2.47%, and 4.77%, respectively. Regarding lodging rice identification, although the direct classification of the 2019 images through the non-transferred model was less effective, after transfer learning with a small batch of images, the recall rate could increase by 20% to nearly 60%. In addition, performing histogram matching first and then transfer learning can also improve classification accuracy.
Compared to prior deep learning methods that treat segmentation as a flat pixel-wise classification problem, the proposed method first introduces a hierarchical, explainable architecture that explicitly enforces real-world constraints, followed by a multi-loss training strategy combining binary cross-entropy (BCE) for the LU-head and categorical focal loss for the lodging-head, which also tackles class imbalance effectively. The study results can be deployed on edge computing devices in the future to collect high-resolution images for regional route planning to infer disaster damages and provide efficient disaster investigation tools. In future work, domain-adaptation AI could be applied to reduce the difference between multi-date UAV images and to enhance model performance [68].

Author Contributions

Conceptualization, M.-D.Y. and H.-H.T.; methodology, M.-D.Y. and H.-H.T.; software, H.-H.T.; validation, M.-D.Y. and H.-H.T.; formal analysis, M.-D.Y. and H.-H.T.; investigation, H.-H.T.; resources, M.-D.Y.; writing—original draft preparation, H.-H.T.; writing—review and editing, M.-D.Y.; supervision, M.-D.Y.; project administration, M.-D.Y.; funding acquisition, M.-D.Y. All authors have read and agreed to the published version of the manuscript.

Funding

This work was funded in part by the National Science and Technology Council, Taiwan, under grant numbers 113-2121-M-005-002 and 113-2634-F-005-002.

Data Availability Statement

The data presented in this study are available on request from the corresponding author due to participant privacy and data security restrictions. Access will be granted following a review of the request and a signed data use agreement.

Conflicts of Interest

The authors declare no conflicts of interest.

References

  1. Crops and Livestock Products. FAOSTAT. Available online: https://www.fao.org/faostat/en/#data/QCL (accessed on 20 February 2024).
  2. Juliano, B.O. Rice in Human Nutrition; FAO food and nutrition series; Published with the cooperation of the International Rice Research Institute; Food and Agriculture Organization of the United Nations: Rome, Italy, 1993; ISBN 978-92-5-103149-0. [Google Scholar]
  3. Ishimaru, K.; Togawa, E.; Ookawa, T.; Kashiwagi, T.; Madoka, Y.; Hirotsu, N. New Target for Rice Lodging Resistance and Its Effect in a Typhoon. Planta 2008, 227, 601–609. [Google Scholar] [CrossRef] [PubMed]
  4. Vignola, R.; Harvey, C.A.; Bautista-Solis, P.; Avelino, J.; Rapidel, B.; Donatti, C.; Martinez, R. Ecosystem-based adaptation for smallholder farmers: Definitions, opportunities and constraints. Agric. Ecosyst. Environ. 2015, 211, 126–132. [Google Scholar] [CrossRef]
  5. Shimono, H.; Okada, M.; Yamakawa, Y.; Nakamura, H.; Kobayashi, K.; Hasegawa, T. Lodging in rice can be alleviated by atmospheric CO2 enrichment. Agric. Ecosyst. Environ. 2007, 118, 223–230. [Google Scholar] [CrossRef]
  6. Liu, Q.; Ma, J.; Zhao, Q.; Zhou, X. Physical Traits Related to Rice Lodging Resistance under Different Simplified-Cultivation Methods. Agron. J. 2018, 110, 127–132. [Google Scholar] [CrossRef]
  7. Corbin, J.L.; Orlowski, J.M.; Harrell, D.L.; Golden, B.R.; Falconer, L.; Krutz, L.J.; Gore, J.; Cox, M.S.; Walker, T.W. Nitrogen Strategy and Seeding Rate Affect Rice Lodging, Yield, and Economic Returns in the Midsouthern United States. Agron. J. 2016, 108, 1938–1943. [Google Scholar] [CrossRef]
  8. Zhang, W.; Wu, L.; Wu, X.; Ding, Y.; Li, G.; Li, J.; Weng, F.; Liu, Z.; Tang, S.; Ding, C.; et al. Lodging Resistance of Japonica Rice (Oryza sativa L.): Morphological and Anatomical Traits Due to Top-Dressing Nitrogen Application Rates. Rice 2016, 9, 31. [Google Scholar] [CrossRef]
  9. Setter, T.L.; Laureles, E.V.; Mazaredo, A.M. Lodging Reduces Yield of Rice by Self-Shading and Reductions in Canopy Photosynthesis. Field Crops Res. 1997, 49, 95–106. [Google Scholar] [CrossRef]
  10. Chang, H.H.; Zilberman, D. On the political economy of allocation of agricultural disaster relief payments: Application to Taiwan. Eur. Rev. Agric. Econ. 2014, 41, 657–680. [Google Scholar] [CrossRef]
  11. Yang, Y.; Liang, C.; Hu, L.; Luo, X.; He, J.; Wang, P.; Huang, P.; Gao, R.; Li, J. A Proposal for Lodging Judgment of Rice Based on Binocular Camera. Agronomy 2023, 13, 2852. [Google Scholar] [CrossRef]
  12. Jia, Y.; Su, Z.; Shen, W.; Yuan, J.; Xu, Z. UAV remote sensing image mosaic and its application in agriculture. Int. J. Smart Home 2016, 10, 159–170. [Google Scholar] [CrossRef]
  13. Liu, T.; Li, R.; Zhong, X.; Jiang, M.; Jin, X.; Zhou, P.; Liu, S.; Sun, C.; Guo, W. Estimates of rice lodging using indices derived from UAV visible and thermal infrared images. Agric. For. Meteorol. 2018, 252, 144–154. [Google Scholar] [CrossRef]
  14. Nelson, A.; Setiyono, T.; Rala, A.B.; Quicho, E.D.; Raviz, J.V.; Abonete, P.J.; Maunahan, A.A.; Garcia, C.A.; Bhatti, H.Z.M.; Villano, L.S.; et al. Towards an Operational SAR-Based Rice Monitoring System in Asia: Examples from 13 Demonstration Sites across Asia in the RIICE Project. Remote Sens. 2014, 6, 10773–10812. [Google Scholar] [CrossRef]
  15. Wu, D.-H.; Chen, C.-T.; Yang, M.-D.; Wu, Y.-C.; Lin, C.-Y.; Lai, M.-H.; Yang, C.-Y. Controlling the Lodging Risk of Rice Based on a Plant Height Dynamic Model. Bot. Stud. 2022, 63, 25. [Google Scholar] [CrossRef] [PubMed]
  16. Yang, C.-Y.; Yang, M.-D.; Tseng, W.-C.; Hsu, Y.-C.; Li, G.-S.; Lai, M.-H.; Wu, D.-H.; Lu, H.-Y. Assessment of Rice Developmental Stage Using Time Series UAV Imagery for Variable Irrigation Management. Sensors 2020, 20, 5354. [Google Scholar] [CrossRef]
  17. Yang, M.-D.; Tseng, H.-H.; Hsu, Y.-C.; Yang, C.-Y.; Lai, M.-H.; Wu, D.-H. A UAV Open Dataset of Rice Paddies for Deep Learning Practice. Remote Sens. 2021, 13, 1358. [Google Scholar] [CrossRef]
  18. Tseng, H.-H.; Yang, M.-D.; Saminathan, R.; Hsu, Y.-C.; Yang, C.-Y.; Wu, D.-H. Rice Seedling Detection in UAV Images Using Transfer Learning and Machine Learning. Remote Sens. 2022, 14, 2837. [Google Scholar] [CrossRef]
  19. Lockhart, K.; Sandino, J.; Amarasingam, N.; Hann, R.; Bollard, B.; Gonzalez, F. Unmanned Aerial Vehicles for Real-Time Vegetation Monitoring in Antarctica: A Review. Remote Sens. 2025, 17, 304. [Google Scholar] [CrossRef]
  20. Yang, M.-D.; Huang, K.-S.; Kuo, Y.-H.; Tsai, H.P.; Lin, L.-M. Spatial and Spectral Hybrid Image Classification for Rice Lodging Assessment through UAV Imagery. Remote Sens. 2017, 9, 583. [Google Scholar] [CrossRef]
  21. Chu, T.; Starek, M.J.; Brewer, M.J.; Masiane, T.; Murray, S.C. UAS Imaging for Automated Crop Lodging Detection: A Case Study over an Experimental Maize Field. In Proceedings of the Autonomous Air and Ground Sensing Systems for Agricultural Optimization and Phenotyping II, Anaheim, CA, USA, 10–11 April 2017; SPIE: Bellingham, WA, USA, 2017; Volume 10218, pp. 88–94. [Google Scholar]
  22. Yu, H.; Wang, J.; Bai, Y.; Yang, W.; Xia, G.-S. Analysis of Large-Scale UAV Images Using a Multi-Scale Hierarchical Representation. Geo-Spat. Inf. Sci. 2018, 21, 33–44. [Google Scholar] [CrossRef]
  23. Yang, M.-D.; Boubin, J.G.; Tsai, H.P.; Tseng, H.-H.; Hsu, Y.-C.; Stewart, C.C. Adaptive Autonomous UAV Scouting for Rice Lodging Assessment Using Edge Computing with Deep Learning EDANet. Comput. Electron. Agric. 2020, 179, 105817. [Google Scholar] [CrossRef]
  24. Kamilaris, A.; Prenafeta-Boldú, F.X. Deep learning in agriculture: A survey. Comput. Electron. Agric. 2018, 147, 70–90. [Google Scholar] [CrossRef]
  25. Lee, C.-J.; Yang, M.-D.; Tseng, H.-H.; Hsu, Y.-C.; Sung, Y.; Chen, W.-L. Single-Plant Broccoli Growth Monitoring Using Deep Learning with UAV Imagery. Comput. Electron. Agric. 2023, 207, 107739. [Google Scholar] [CrossRef]
  26. Zheng, Z.; Yuan, J.; Yao, W.; Yao, H.; Liu, Q.; Guo, L. Crop Classification from Drone Imagery Based on Lightweight Semantic Segmentation Methods. Remote Sens. 2024, 16, 4099. [Google Scholar] [CrossRef]
  27. Chu, Z.; Yu, J. An End-to-End Model for Rice Yield Prediction Using Deep Learning Fusion. Comput. Electron. Agric. 2020, 174, 105471. [Google Scholar] [CrossRef]
  28. Wang, D.; Li, W.; Liu, X.; Li, N.; Zhang, C. UAV Environmental Perception and Autonomous Obstacle Avoidance: A Deep Learning and Depth Camera Combined Solution. Comput. Electron. Agric. 2020, 175, 105523. [Google Scholar] [CrossRef]
  29. Yang, M.-D.; Hsu, Y.-C.; Tseng, W.-C.; Tseng, H.-H.; Lai, M.-H. Precision Assessment of Rice Grain Moisture Content Using UAV Multispectral Imagery and Machine Learning. Comput. Electron. Agric. 2025, 230, 109813. [Google Scholar] [CrossRef]
  30. Zhao, X.; Yuan, Y.; Song, M.; Ding, Y.; Lin, F.; Liang, D.; Zhang, D. Use of Unmanned Aerial Vehicle Imagery and Deep Learning UNet to Extract Rice Lodging. Sensors 2019, 19, 3859. [Google Scholar] [CrossRef]
  31. Yang, Q.; Shi, L.; Han, J.; Zha, Y.; Zhu, P. Deep Convolutional Neural Networks for Rice Grain Yield Estimation at the Ripening Stage Using UAV-Based Remotely Sensed Images. Field Crops Res. 2019, 235, 142–153. [Google Scholar] [CrossRef]
  32. Yang, M.D.; Tseng, H.H.; Hsu, Y.C.; Tsai, H.P. Semantic segmentation using deep learning with vegetation indices for rice lodging identification in multi-date UAV visible images. Remote Sens. 2020, 12, 633. [Google Scholar] [CrossRef]
  33. Negnevitsky, M. Artificial Intelligence: A Guide to Intelligent Systems, 2nd ed.; Addison-Wesley: Harlow, UK; New York, NY, USA, 2005; ISBN 978-0-321-20466-0. [Google Scholar]
  34. Abraham, A. Rule-Based Expert Systems. In Handbook of Measuring System Design; John Wiley & Sons, Ltd.: Chichester, UK, 2005; ISBN 978-0-471-49739-4. [Google Scholar]
  35. de Sousa, J.V.R.; Gamboa, P.V. Aerial Forest Fire Detection and Monitoring Using a Small UAV. KnE Eng. 2020, 5, 242–256. [Google Scholar] [CrossRef]
  36. Blaschke, T.; Feizizadeh, B.; Hölbling, D. Object-Based Image Analysis and Digital Terrain Analysis for Locating Landslides in the Urmia Lake Basin, Iran. IEEE J. Sel. Top. Appl. Earth Obs. Remote Sens. 2014, 7, 4806–4817. [Google Scholar] [CrossRef]
  37. Bui, N.Q.; Le, D.H.; Duong, A.Q.; Nguyen, Q.L. Rule-Based Classification of Airborne Laser Scanner Data for Automatic Extraction of 3D Objects in the Urban Area. Inż. Miner. 2021, 2, 103–114. [Google Scholar] [CrossRef]
  38. Knöttner, J.; Rosenbaum, D.; Kurz, F.; Reinartz, P.; Brunn, A. RULE-BASED MAPPING OF PARKED VEHICLES USING AERIAL IMAGE SEQUENCES. ISPRS Ann. Photogramm. Remote Sens. Spat. Inf. Sci. 2019, IV-2-W7, 95–101. [Google Scholar] [CrossRef]
  39. Trachtman, A.R.; Bergamini, L.; Palazzi, A.; Porrello, A.; Capobianco Dondona, A.; Del Negro, E.; Paolini, A.; Vignola, G.; Calderara, S.; Marruchella, G. Scoring Pleurisy in Slaughtered Pigs Using Convolutional Neural Networks. Vet. Res. 2020, 51, 51. [Google Scholar] [CrossRef]
  40. Yang, M.D.; Su, T.C.; Pan, N.F.; Liu, P. Feature Extraction of Sewer Pipe Defects Using Wavelet Transform and Co-occurrence Matrix. Int. J. Wavelets Multiresolut. Inf. Process. 2011, 2, 211–225. [Google Scholar] [CrossRef]
  41. Caruana, R. Multi-task Learning. Mach. Learn. 1997, 28, 41–75. [Google Scholar] [CrossRef]
  42. Luong, M.-T.; Le, Q.V.; Sutskever, I.; Vinyals, O.; Kaiser, L. Multi-Task Sequence to Sequence Learning. arXiv 2015, arXiv:1511.06114. [Google Scholar]
  43. Girshick, R. Fast R-CNN. In Proceedings of the 2015 IEEE International Conference on Computer Vision (ICCV), Santiago, Chile, 7–13 December 2015; pp. 1440–1448. [Google Scholar]
  44. Ren, S.; He, K.; Girshick, R.; Sun, J. Faster R-CNN: Towards Real-Time Object Detection with Region Proposal Networks. In Advances in Neural Information Processing Systems; Curran Associates, Inc.: Montréal, QC, Canada, 7–12 December 2015; Volume 28. [Google Scholar]
  45. Zhang, C.; Zhang, Z. Improving Multiview Face Detection with Multi-Task Deep Convolutional Neural Networks. In Proceedings of the IEEE Winter Conference on Applications of Computer Vision, Steamboat Springs, CO, USA, 24–26 March 2014; pp. 1036–1041. [Google Scholar]
  46. Lu, X.; Zhong, Y.; Zheng, Z.; Liu, Y.; Zhao, J.; Ma, A.; Yang, J. Multi-Scale and Multi-Task Deep Learning Framework for Automatic Road Extraction. IEEE Trans. Geosci. Remote Sens. 2019, 57, 9362–9377. [Google Scholar] [CrossRef]
  47. Amyar, A.; Modzelewski, R.; Li, H.; Ruan, S. Multi-Task Deep Learning Based CT Imaging Analysis for COVID-19 Pneumonia: Classification and Segmentation. Comput. Biol. Med. 2020, 126, 104037. [Google Scholar] [CrossRef]
  48. Song, L.; Lin, J.; Wang, Z.J.; Wang, H. An end-to-end multi-task deep learning framework for skin lesion analysis. IEEE J. Biomed. Health Inform. 2020, 24, 2912–2921. [Google Scholar] [CrossRef]
  49. Jiang, Z.; Dong, Z.; Jiang, W.; Yang, Y. Recognition of Rice Leaf Diseases and Wheat Leaf Diseases Based on Multi-Task Deep Transfer Learning. Comput. Electron. Agric. 2021, 186, 106184. [Google Scholar] [CrossRef]
  50. Assadzadeh, S.; Walker, C.; McDonald, L.; Maharjan, P.; Panozzo, J. Multi-Task Deep Learning of near Infrared Spectra for Improved Grain Quality Trait Predictions. J. Near Infrared Spectrosc. 2020, 28, 275–286. [Google Scholar] [CrossRef]
  51. Kang, J.; Gwak, J. Ensemble of multi-task deep convolutional neural networks using transfer learning for fruit freshness classification. Multimed. Tools Appl. 2022, 81, 22355–22377. [Google Scholar] [CrossRef]
  52. Lo, S.Y.; Hang, H.M.; Chan, S.W.; Lin, J.J. Efficient dense modules of asymmetric convolution for real-time semantic segmentation. In Proceedings of the 1st ACM International Conference on Multimedia in Asia, Beijing, China, 15–19 December 2019. [Google Scholar]
  53. Goodfellow, I.J.; Shlens, J.; Szegedy, C. Explaining and Harnessing Adversarial Examples. arXiv 2015, arXiv:1412.6572. [Google Scholar] [CrossRef]
  54. Bai, X.; Wang, X.; Liu, X.; Liu, Q.; Song, J.; Sebe, N.; Kim, B. Explainable Deep Learning for Efficient and Robust Pattern Recognition: A Survey of Recent Developments. Pattern Recognit. 2021, 120, 108102. [Google Scholar] [CrossRef]
  55. Zhu, Z.; Wang, H.; Zhao, T.; Guo, Y.; Xu, Z.; Liu, Z.; Liu, S.; Lan, X.; Sun, X.; Feng, M. Classification of Cardiac Abnormalities from ECG Signals Using SE-ResNet. In Proceedings of the 2020 Computing in Cardiology, Rimini, Italy, 13–16 September 2020; pp. 1–4. [Google Scholar] [CrossRef]
  56. Zisad, S.N.; Chowdhury, E.; Hossain, M.S.; Islam, R.U.; Andersson, K. An Integrated Deep Learning and Belief Rule-Based Expert System for Visual Sentiment Analysis under Uncertainty. Algorithms 2021, 14, 213. [Google Scholar] [CrossRef]
  57. Liu, W.; Anguelov, D.; Erhan, D.; Szegedy, C.; Reed, S.; Fu, C.-Y.; Berg, A.C. SSD: Single Shot MultiBox Detector. In Computer Vision—ECCV 2016; Leibe, B., Matas, J., Sebe, N., Welling, M., Eds.; Springer International Publishing: Cham, Switzerland, 2016; pp. 21–37. [Google Scholar] [CrossRef]
  58. Li, X.; Zhao, L.; Wei, L.; Yang, M.-H.; Wu, F.; Zhuang, Y.; Ling, H.; Wang, J. DeepSaliency: Multi-Task Deep Neural Network Model for Salient Object Detection. IEEE Trans. Image Process. 2016, 25, 3919–3930. [Google Scholar] [CrossRef]
  59. Tan, M.; Pang, R.; Le, Q.V. EfficientDet: Scalable and Efficient Object Detection. In Proceedings of the 2020 IEEE/CVF Conference on Computer Vision and Pattern Recognition (CVPR), Seattle, WA, USA, 14–19 June 2020; pp. 10778–10787. [Google Scholar] [CrossRef]
  60. Wang, C.-Y.; Bochkovskiy, A.; Liao, H.-Y.M. YOLOv7: Trainable Bag-of-Freebies Sets New State-of-the-Art for Real-Time Object Detectors. In Proceedings of the 2023 IEEE/CVF Conference on Computer Vision and Pattern Recognition (CVPR), Vancouver, BC, Canada, 17–24 June 2023; pp. 7464–7475. [Google Scholar] [CrossRef]
  61. Chen, S.; Zhang, Y.; Yang, Q. Multi-Task Learning in Natural Language Processing: An Overview. ACM Comput. Surv. 2024, 56, 295:1–295:32. [Google Scholar] [CrossRef]
  62. Mitchell, T.M. Machine Learning; McGraw-Hill: New York, NY, USA, 1997; ISBN 978-0-07-115467-3. [Google Scholar]
  63. Lin, T.-Y.; Goyal, P.; Girshick, R.; He, K.; Dollár, P. Focal Loss for Dense Object Detection. IEEE Trans. Pattern Anal. Mach. Intell. 2020, 42, 318–327. [Google Scholar] [CrossRef]
  64. Powers, D.M.W. Evaluation: From precision, recall and F-measure to ROC, informedness, markedness and correlation. arXiv 2020, arXiv:2010.16061. [Google Scholar] [CrossRef]
  65. Goyal, P.; Dollár, P.; Girshick, R.; Noordhuis, P.; Wesolowski, L.; Kyrola, A.; Tulloch, A.; Jia, Y.; He, K. Accurate, Large Minibatch SGD: Training ImageNet in 1 Hour. arXiv 2018, arXiv:1706.02677. [Google Scholar] [CrossRef]
  66. Liu, L.; Jiang, H.; He, P.; Chen, W.; Liu, X.; Gao, J.; Han, J. On the Variance of the Adaptive Learning Rate and Beyond. arXiv 2021, arXiv:1908.03265. [Google Scholar] [CrossRef]
  67. Pitas, I. Digital Image Processing Algorithms and Applications, 1st ed.; John Wiley & Sons, Inc.: Hoboken, NJ, USA, 2000; ISBN 978-0-471-37739-9. [Google Scholar]
  68. Yang, M.-D.; Hsu, Y.-C.; Liu, T.-T.; Huang, H.-H. Enhancing Grain Moisture Prediction in Multiple Crop Seasons Using Domain Adaptation AI. Comput. Electron. Agric. 2025, 231, 110058. [Google Scholar] [CrossRef]
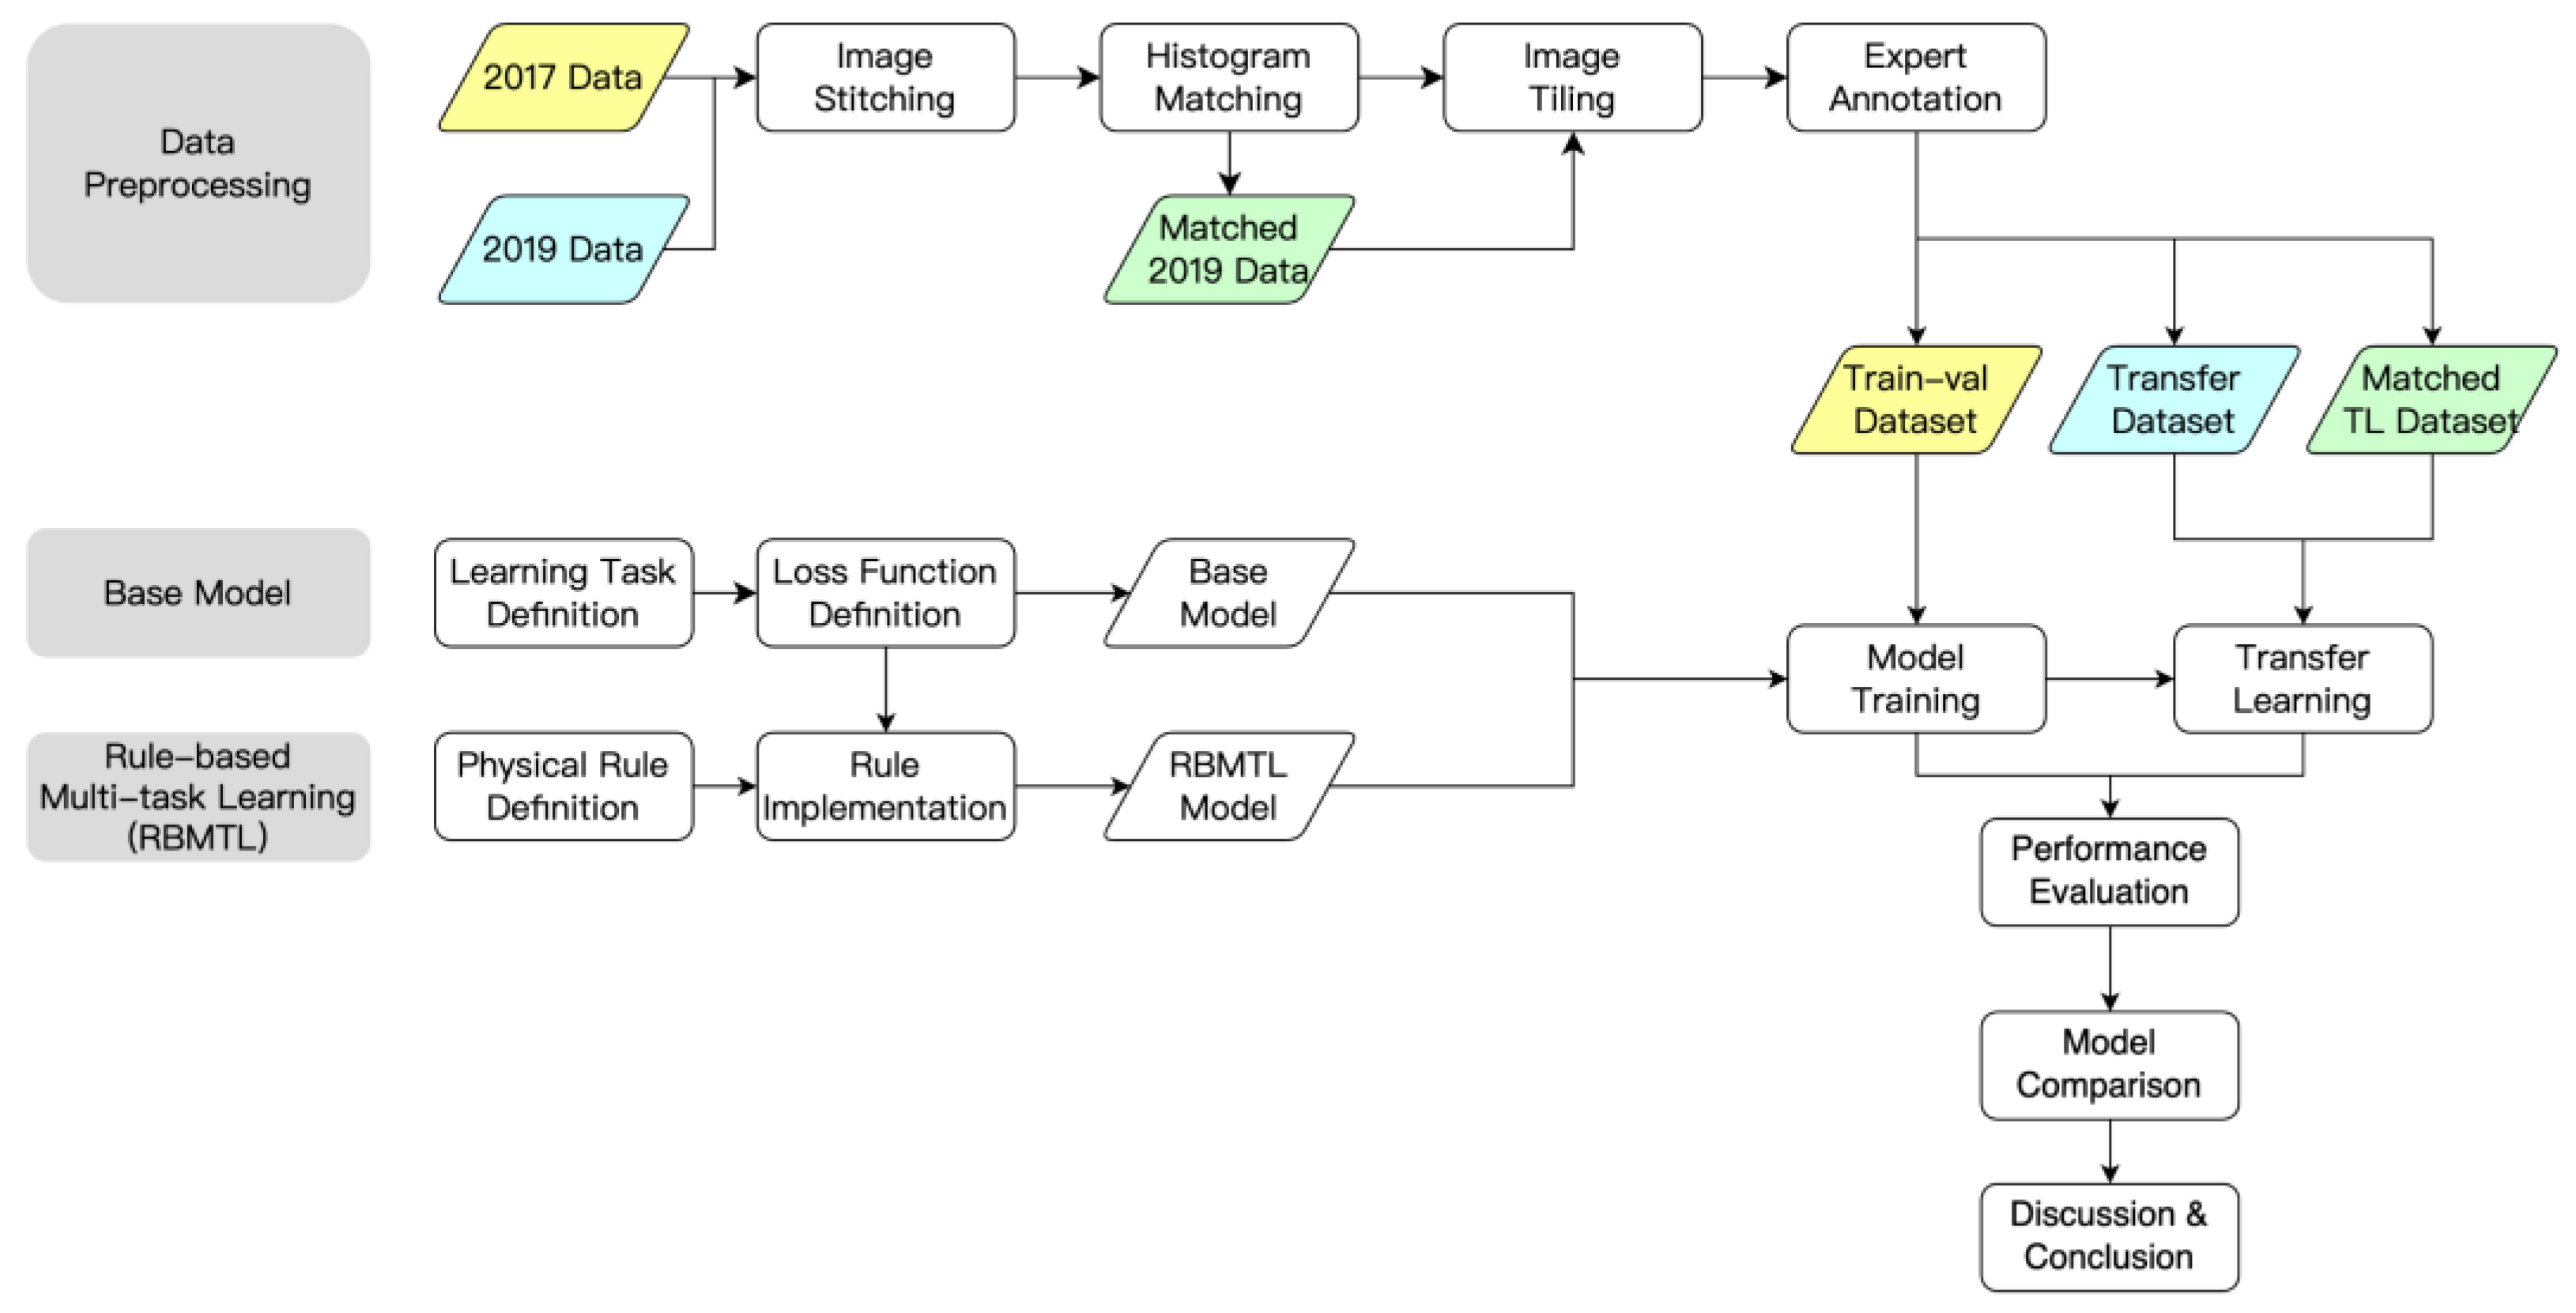
Figure 1. Architecture of the study.
Remotesensing 17 01505 g001
Figure 2. Study area.
Remotesensing 17 01505 g002
Figure 3. Original EDANet architecture.
Remotesensing 17 01505 g003
Figure 4. Proposed rule-based multi-task EDANet.
Remotesensing 17 01505 g004
Figure 5. Visualization of test results. (a) all lodging rice conditions; (b) majorly lodging rice with partial normal rice and background; (c) background with partial lodging rice surrounded by normal rice; (d) two rice paddies with full lodging and normal rice, respectively; (e) background with artificial buildings.
Remotesensing 17 01505 g005
Figure 6. Comparison of 2019 inference results.
Remotesensing 17 01505 g006
Figure 7. 2019 test image examples for error discussions.
Remotesensing 17 01505 g007
Table 1. Mission of data acquisition.
Acquisition Date8 June 201731 May 2019
Camera modelSony QX100 Sony α7RII
Orthomosaic size (width × height) (pixel)46,343 × 25,658103,258 × 179,684
Flight height (meter)230215
Covering area (ha)4302300
Spatial Resolution (cm/pixel)5.34.7
Tile size (width × height) (pixel)480 × 480480 × 4801440 × 14404096 × 4096
Valid tile numbers208269472666
Dataset typetrainvaltesttest
Table 2. Specifications of the cameras.
Camera ModelSony QX100Sony α7RII
Pixel size (micrometer)2.44.5
Focal length (mm)10.420.0
Image resolution (width × height) (pixel)5472 × 36487952 × 5304
Dynamic range (bits)8
Spatial resolution (200 m above ground) (cm/pixel)4.644.53
Sensor size (mm)13.2 × 8.836.0 × 24.0
Field of view (vertical, horizontal) (degrees)64.8, 45.983.9, 61.9
Table 3. Class name and color.
Class nameBackgroundNormal riceRoadRidgeLodging rice
HEX code#000000#008000#808080#804020#FF0000
Color
Table 4. Performance evaluation indices.
IndicesFormula
Precision p r e c i s i o n c = T P c T P c + F P c
Recall r e c a l l c = T P c T P c + F N c  
F β -score F β = 1 + β 2 × P r e c i s i o n × R e c a l l β 2 P r e c i s i o n + R e c a l l
F 1 -score F 1 = 2 × P r e c i s i o n × R e c a l l P r e c i s i o n + R e c a l l
Table 5. Training hyperparameters.
HyperparameterValue
Training epochs Et50
Batch size32
Epoch steps Se65
OptimizerSGD
Scheduled learning curvewarmup + polynomial
Warmup epochs Ew5
Warmup learning rate lrinit0.0001
Target learning rate lrtgt0.4
Warmup curve exponent α1.0
End learning rate lrend0.0001
Learning curve exponent β0.8
Table 6. Evaluation results of the base model.
ClassPrecision (%)Recall (%)F1-Score (%)
Background93.1695.9194.52
Normal rice83.9988.2086.04
Road91.2071.0179.85
Ridge87.8582.9785.34
Lodging rice76.9573.4275.14
Table 7. Evaluation results of the RBMTL model.
Multi-Task BranchClassPrecision (%)Recall (%)F1-Score (%)
LU-headrice paddy98.3099.0298.66
background99.2498.6998.97
Lodging-headbackground99.6098.6799.13
normal rice90.0688.2289.13
lodging rice80.1086.0182.95
Table 8. Base model 2019 test set evaluation.
Model
Variation
ClassPrecision (%)Recall (%)F1-Score (%)
Basebackground71.5394.9281.58
normal rice94.4367.3678.63
road81.3432.5946.54
ridge17.2244.2323.79
lodging rice56.8934.0842.62
Base
+ transfer
background89.3893.3685.20
normal rice91.9788.9790.45
road75.7962.9368.76
ridge22.6721.1221.87
lodging rice48.8154.6751.57
Base
+ hist
+ transfer
background88.1194.2491.07
normal rice92.6687.5190.01
road75.5752.9062.23
ridge18.1821.6119.75
lodging rice46.5858.1851.74
Table 9. RBMTL model 2019 test set evaluation.
Model
variation
ClassPrecision (%)Recall (%)F1-Score (%)
RBMTLbackground89.7598.7794.05
normal rice92.1081.7786.83
lodging rice71.6436.7848.61
RBMTL
+ transfer
background98.1297.2197.66
normal rice91.1791.4491.30
lodging rice50.8355.7853.19
RBMTL
+ hist
+ transfer
background98.2697.1097.68
normal rice91.2192.2891.74
lodging rice54.3857.9556.11
Disclaimer/Publisher’s Note: The statements, opinions and data contained in all publications are solely those of the individual author(s) and contributor(s) and not of MDPI and/or the editor(s). MDPI and/or the editor(s) disclaim responsibility for any injury to people or property resulting from any ideas, methods, instructions or products referred to in the content.