
Jitter Error Correction for the HaiYang-3A Satellite Based on Multi-Source Attitude Fusion


Abstract
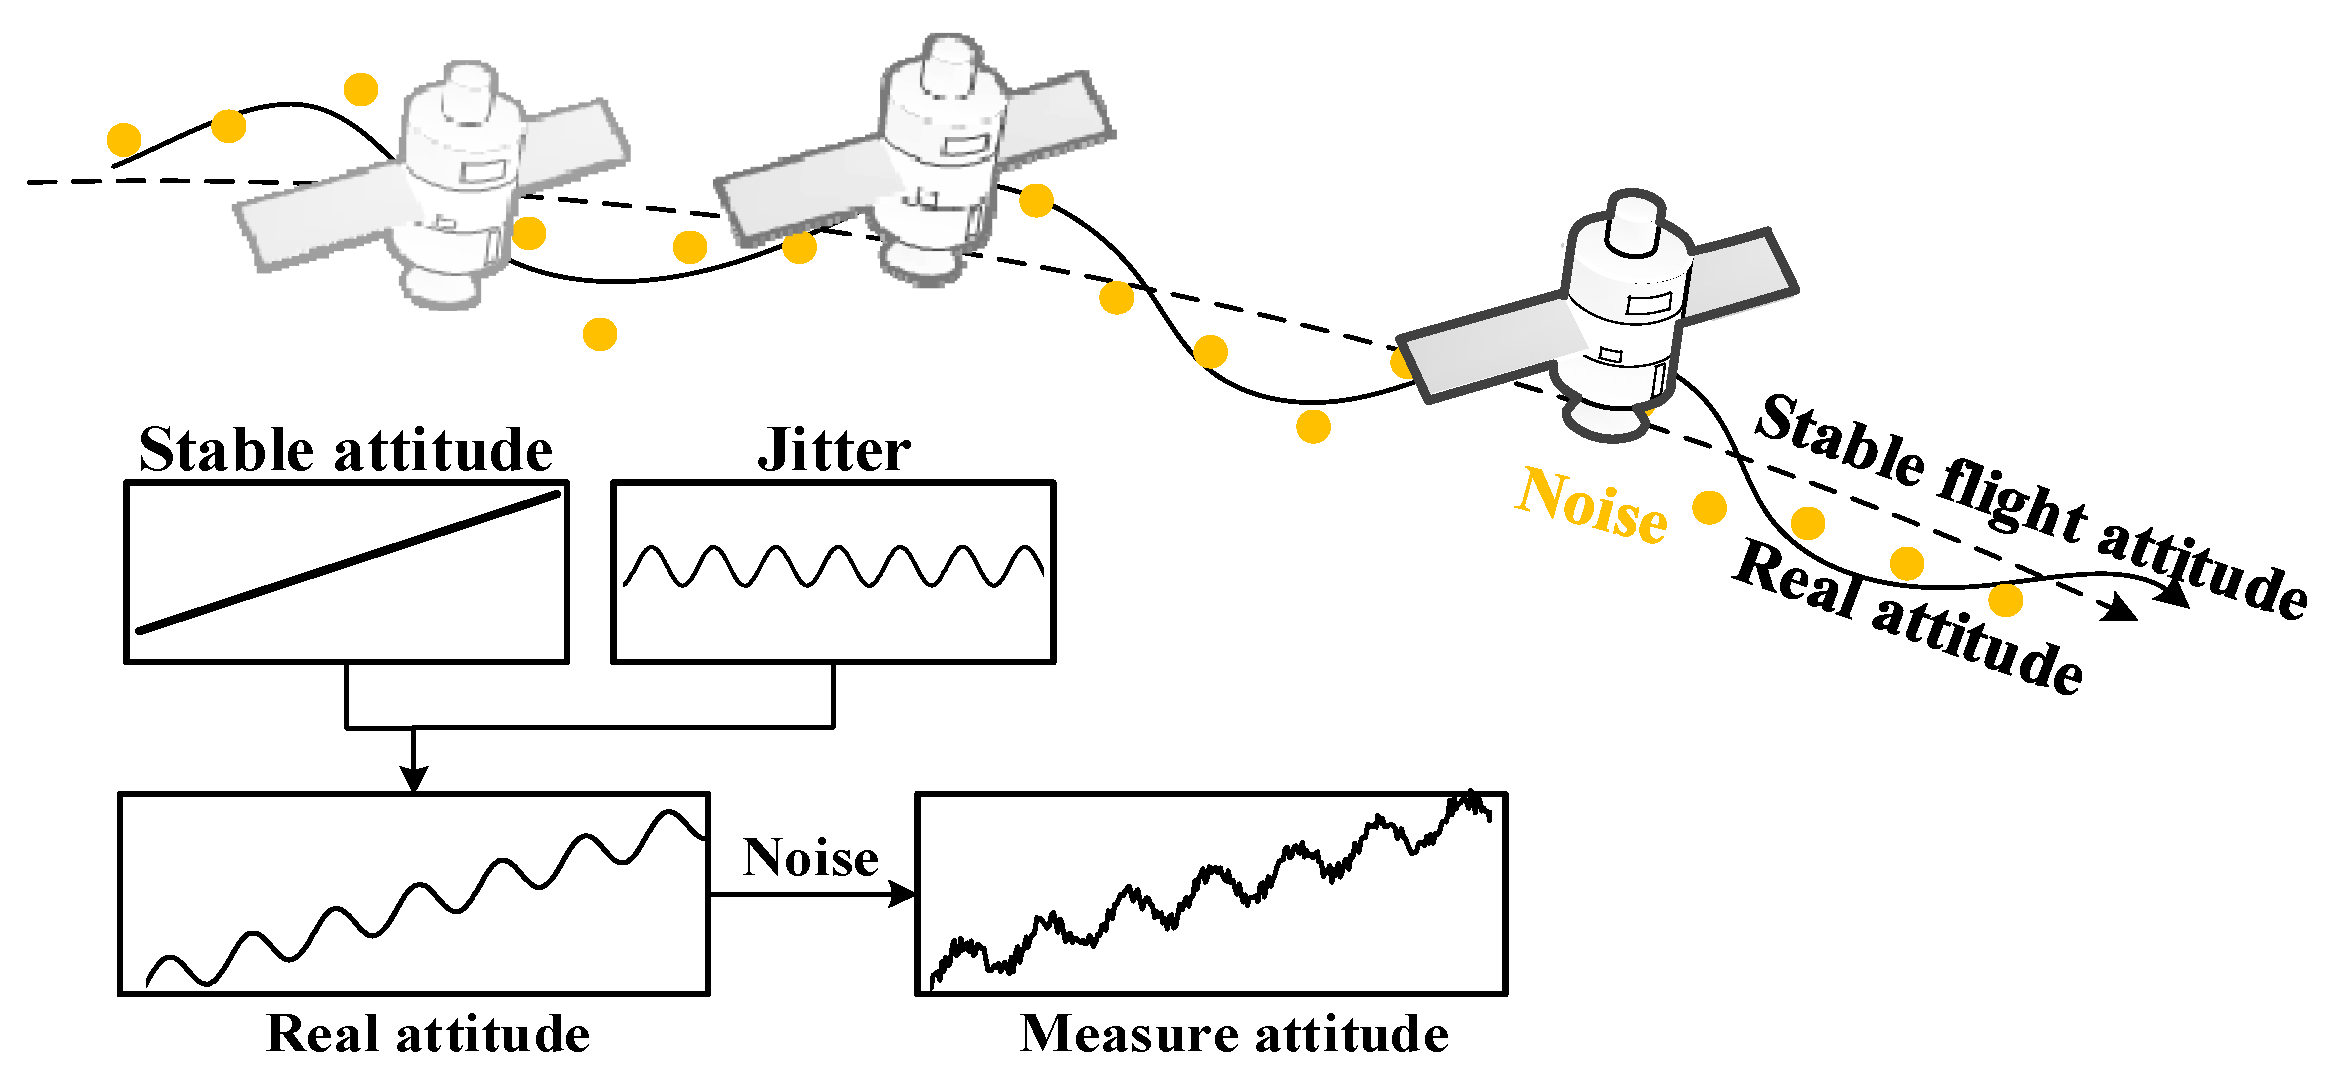
1. Introduction
- (1)
- Based on the characteristics of measurement noise and the mechanism of error influence, a multi-directional dynamic filtering strategy is proposed to obtain the satellite attitude parameter including jitter error directly without image matching.
- (2)
- The stable attitude exaction and jitter separation method based on Fourier transform and sliding filtering is proposed to reconstruct the stable attitude and fluctuating attitude for jitter correction. Moreover, the optimal sliding fitting window is adaptively calculated to obtain the stable attitude for both short-strip and long-strip optical images.
2. Methodology
2.1. Multi-Source Attitude Data Fusion
2.1.1. Data Fusion of Star Sensor and Gyroscope
2.1.2. Multi-Directional Filtering with Jitter Error
2.2. Satellite Jitter Error Extraction
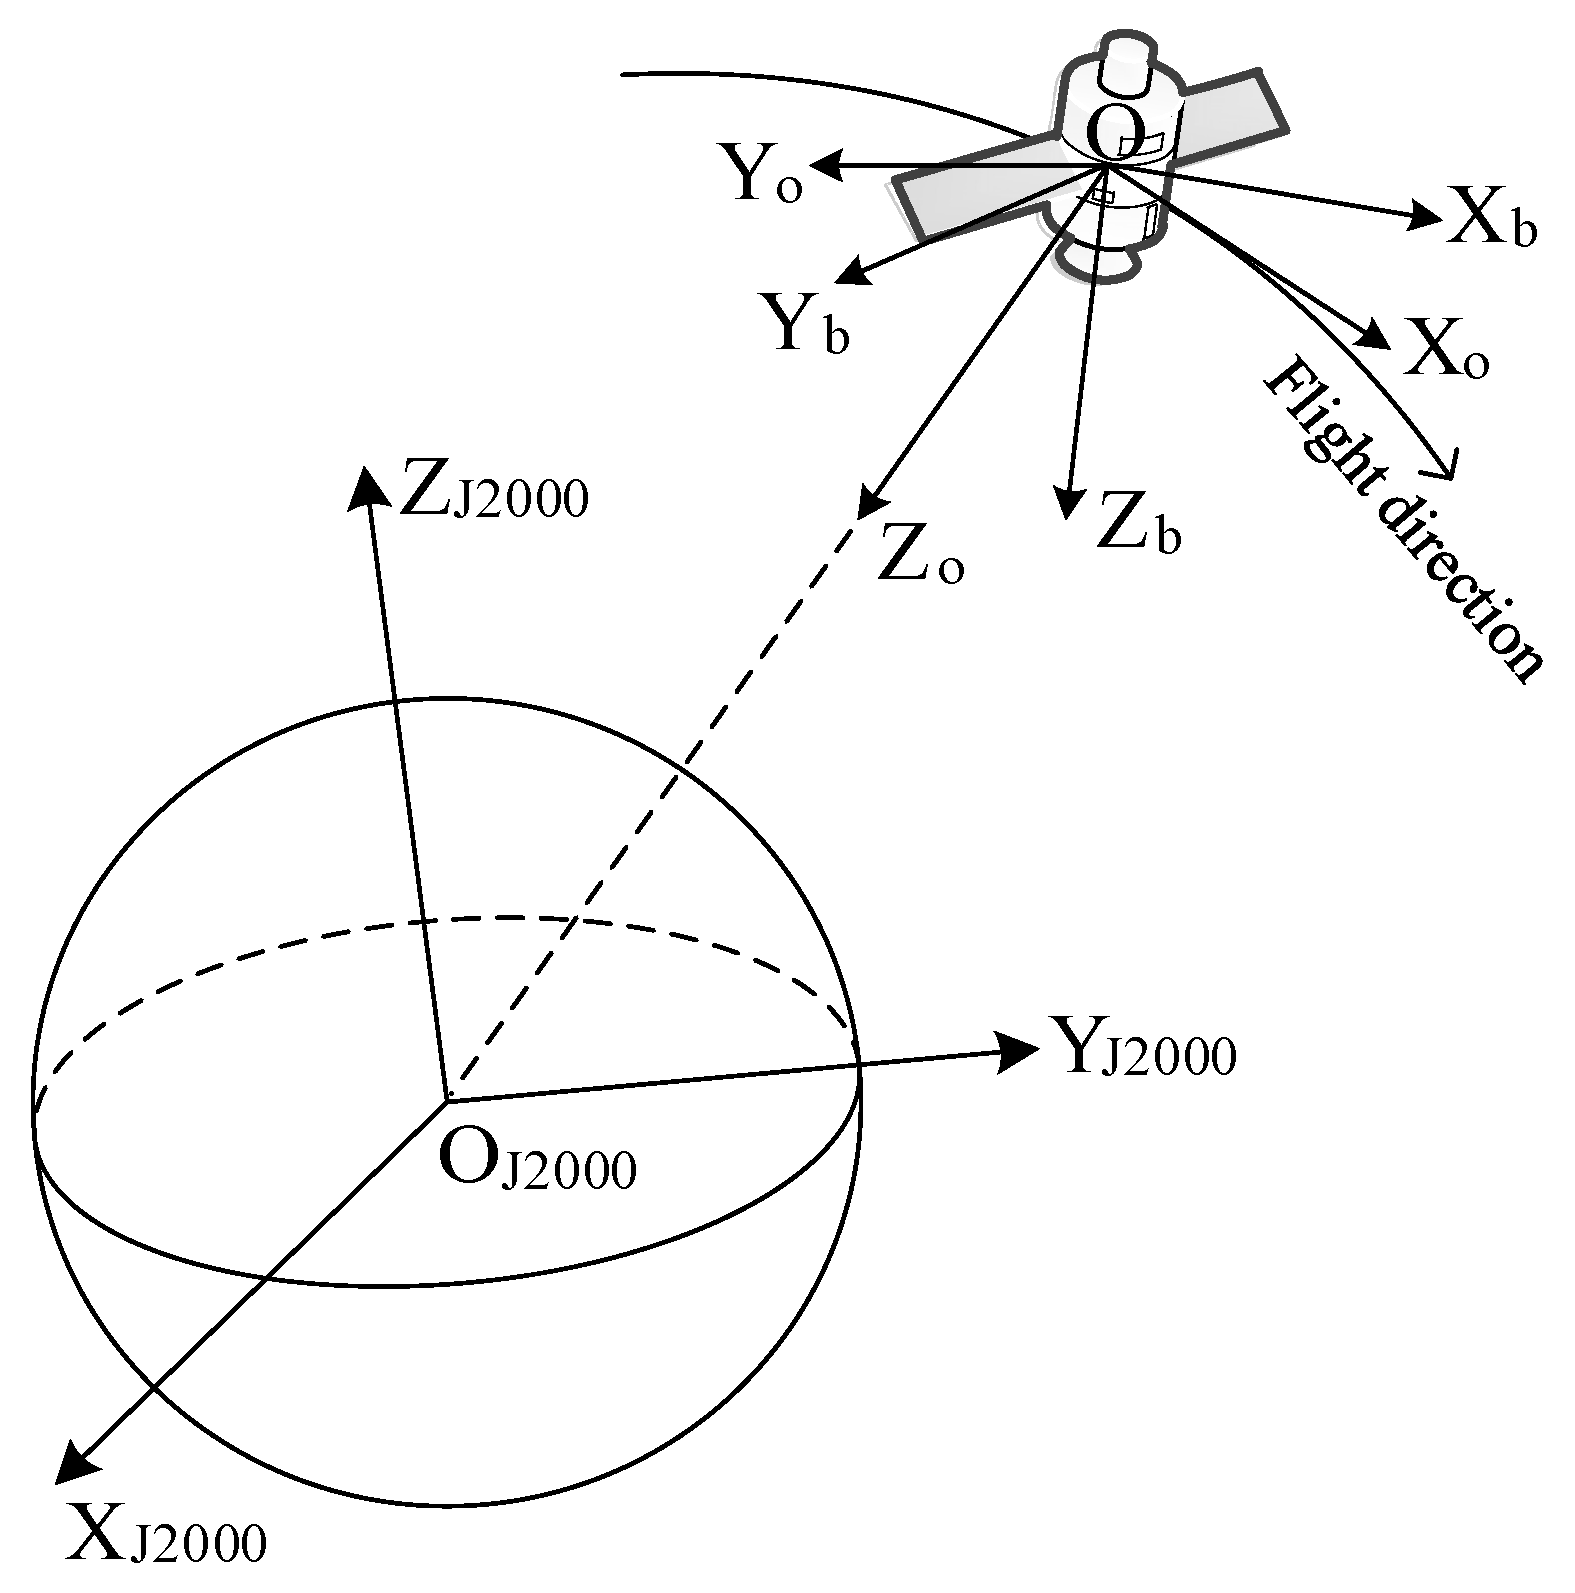
2.2.1. Attitude Transformation
2.2.2. Jitter Error Extraction
2.3. Satellite Jitter Error Modeling and Correction
2.3.1. Jitter Error Modeling with Spectrum Analysis
2.3.2. Jitter Error Correction Based on Stable Resampling
3. Experimental Results
3.1. Experimental Data
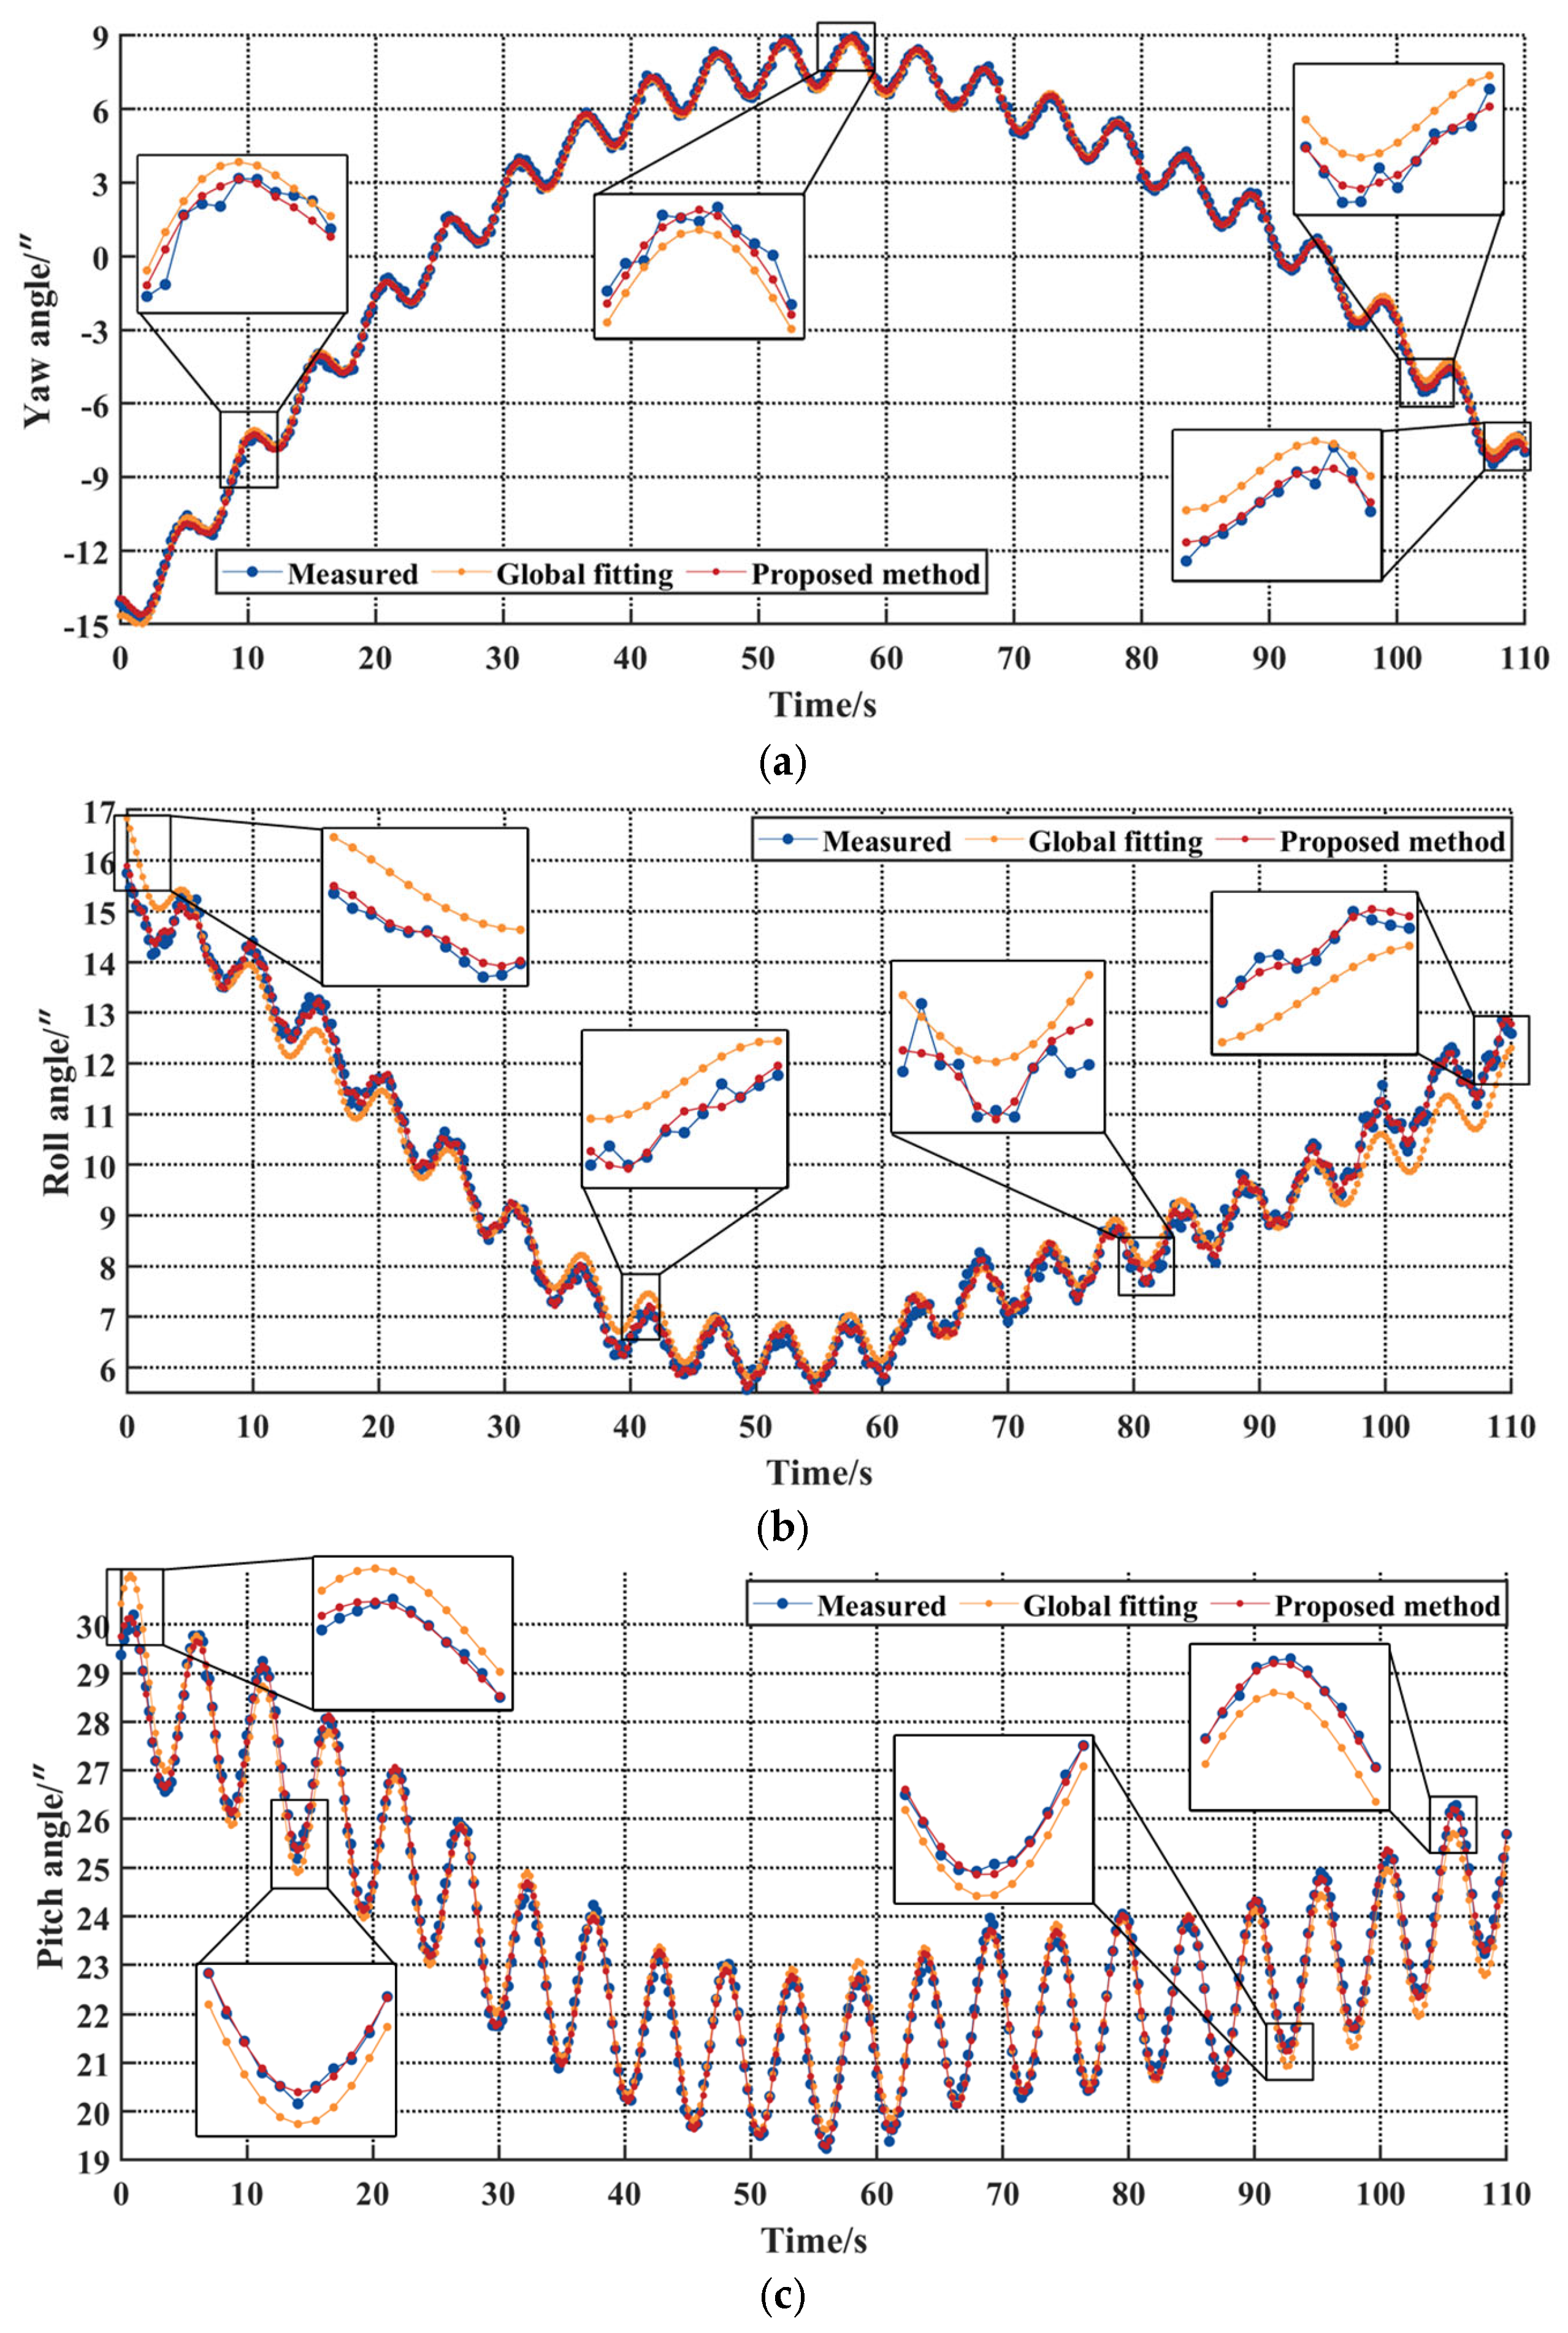
3.2. Accuracy Analysis of Jitter Error Model
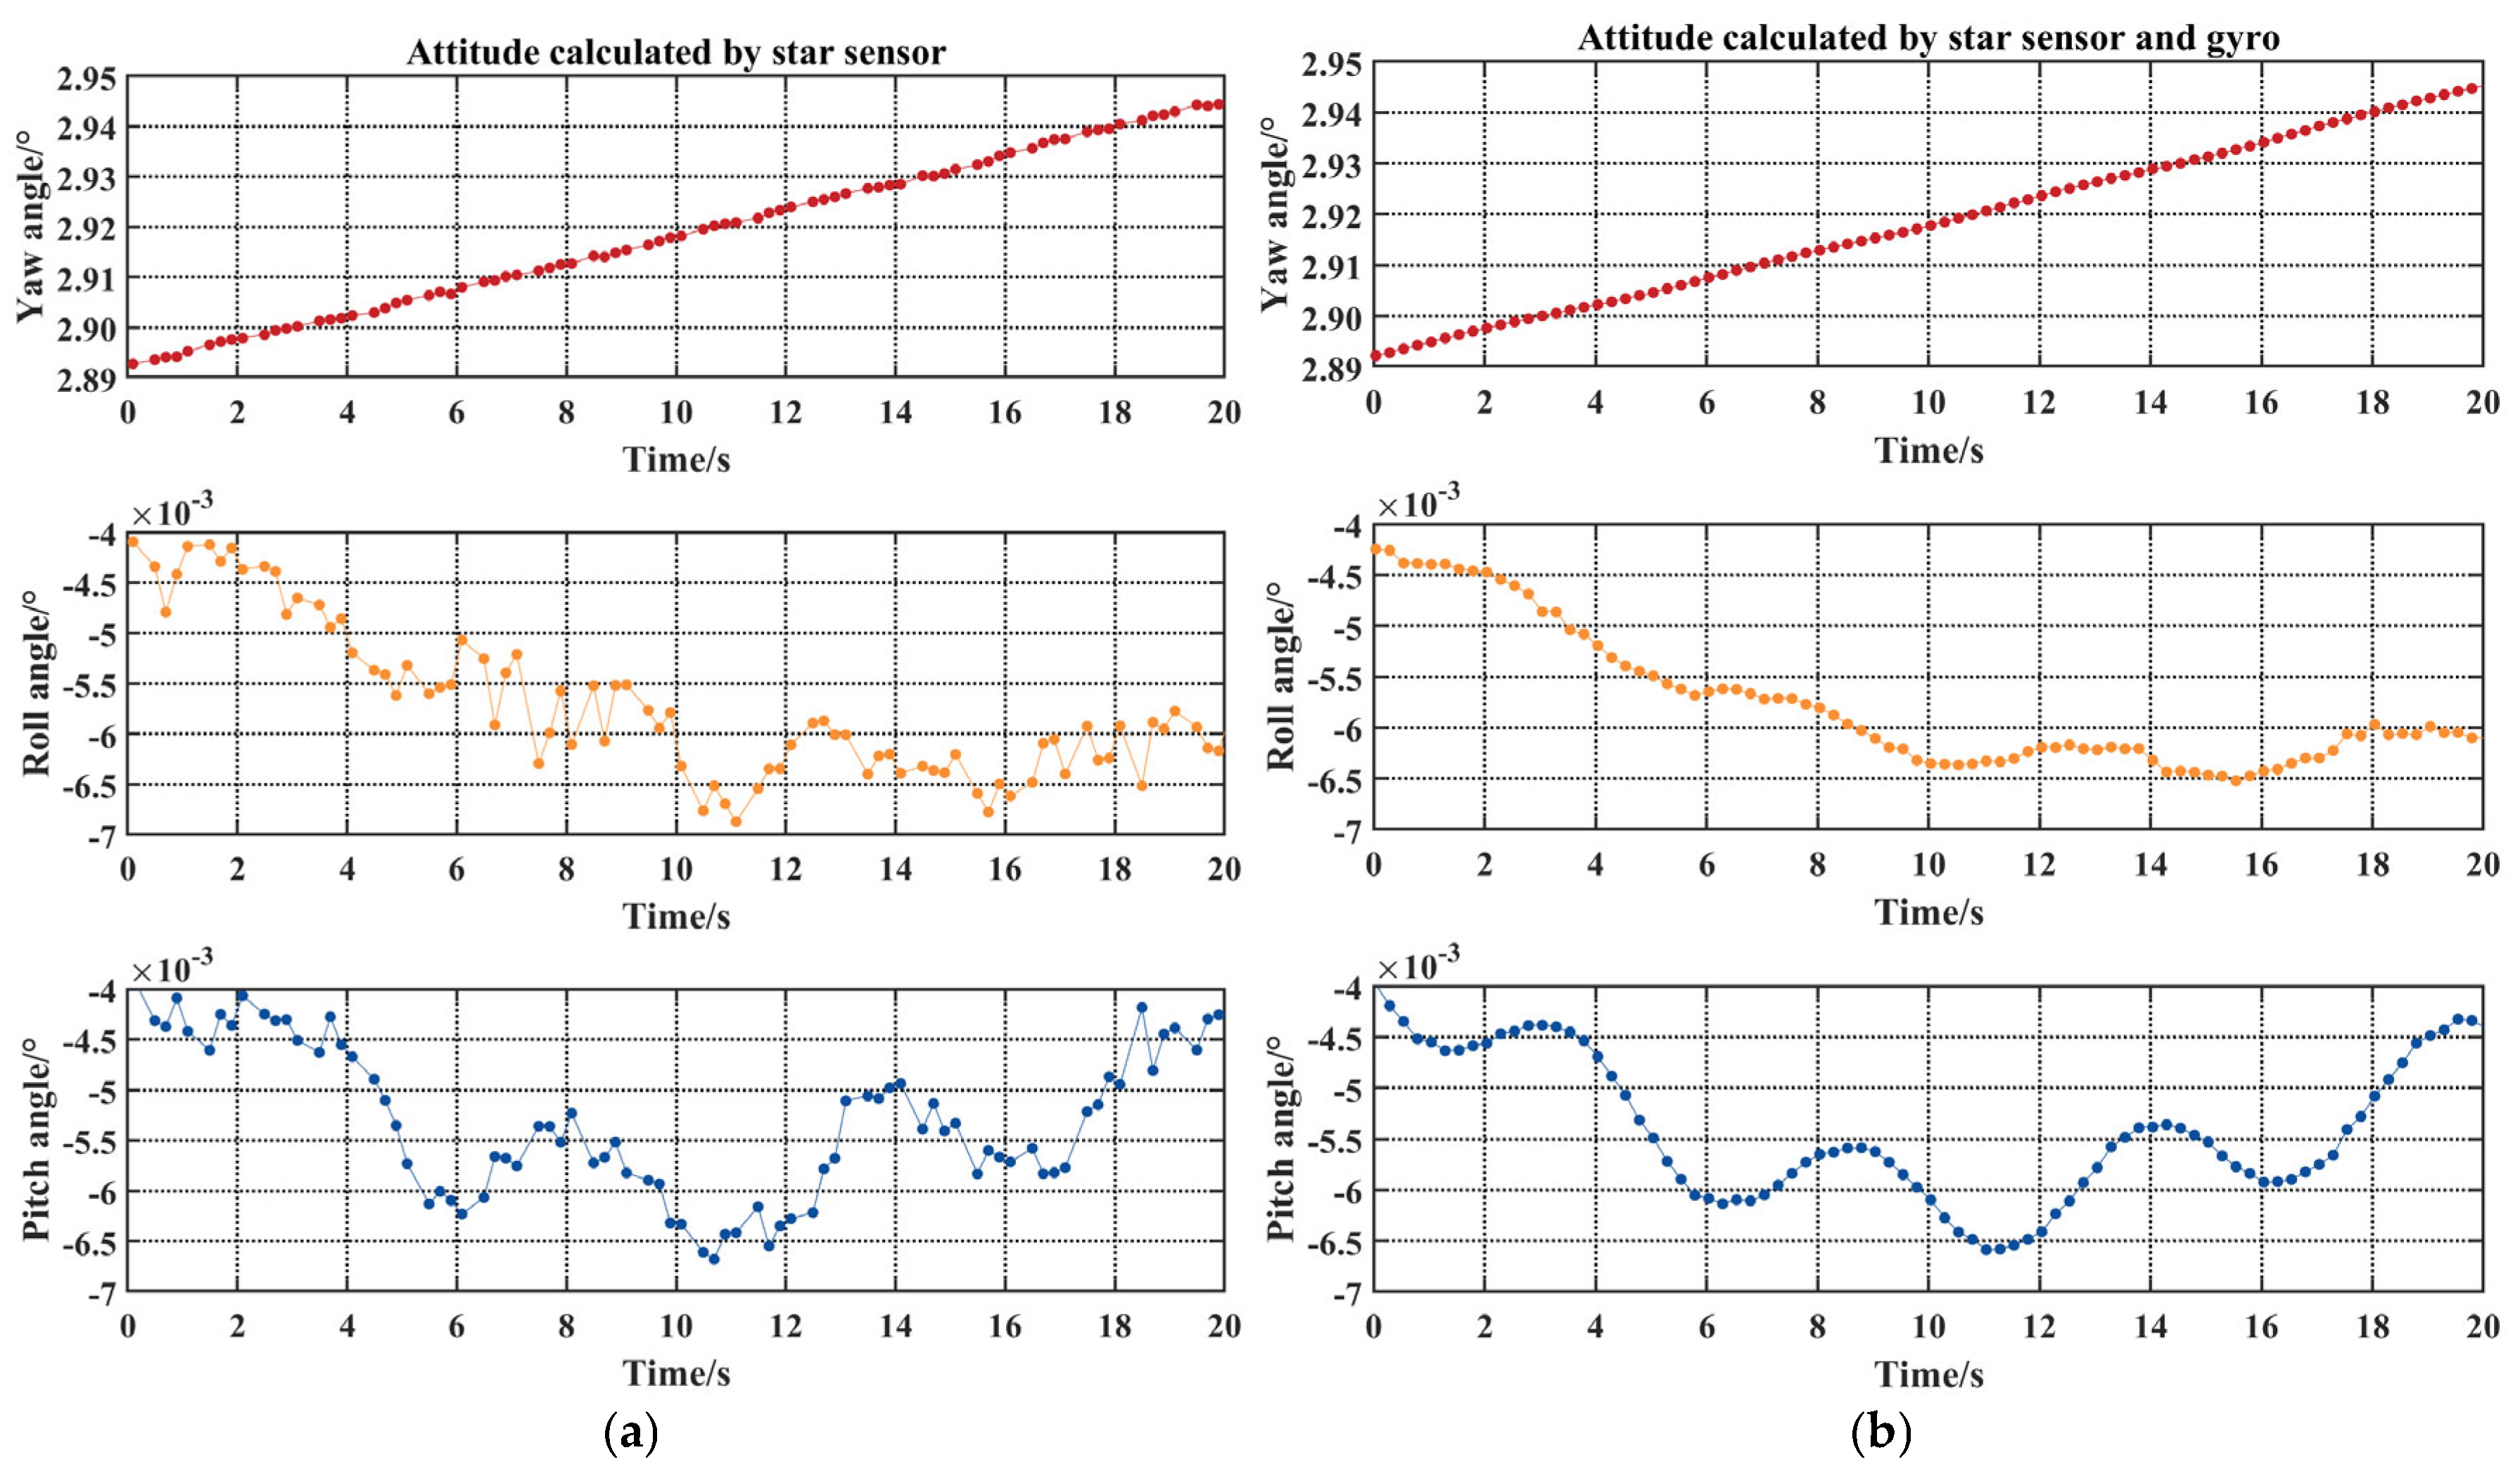
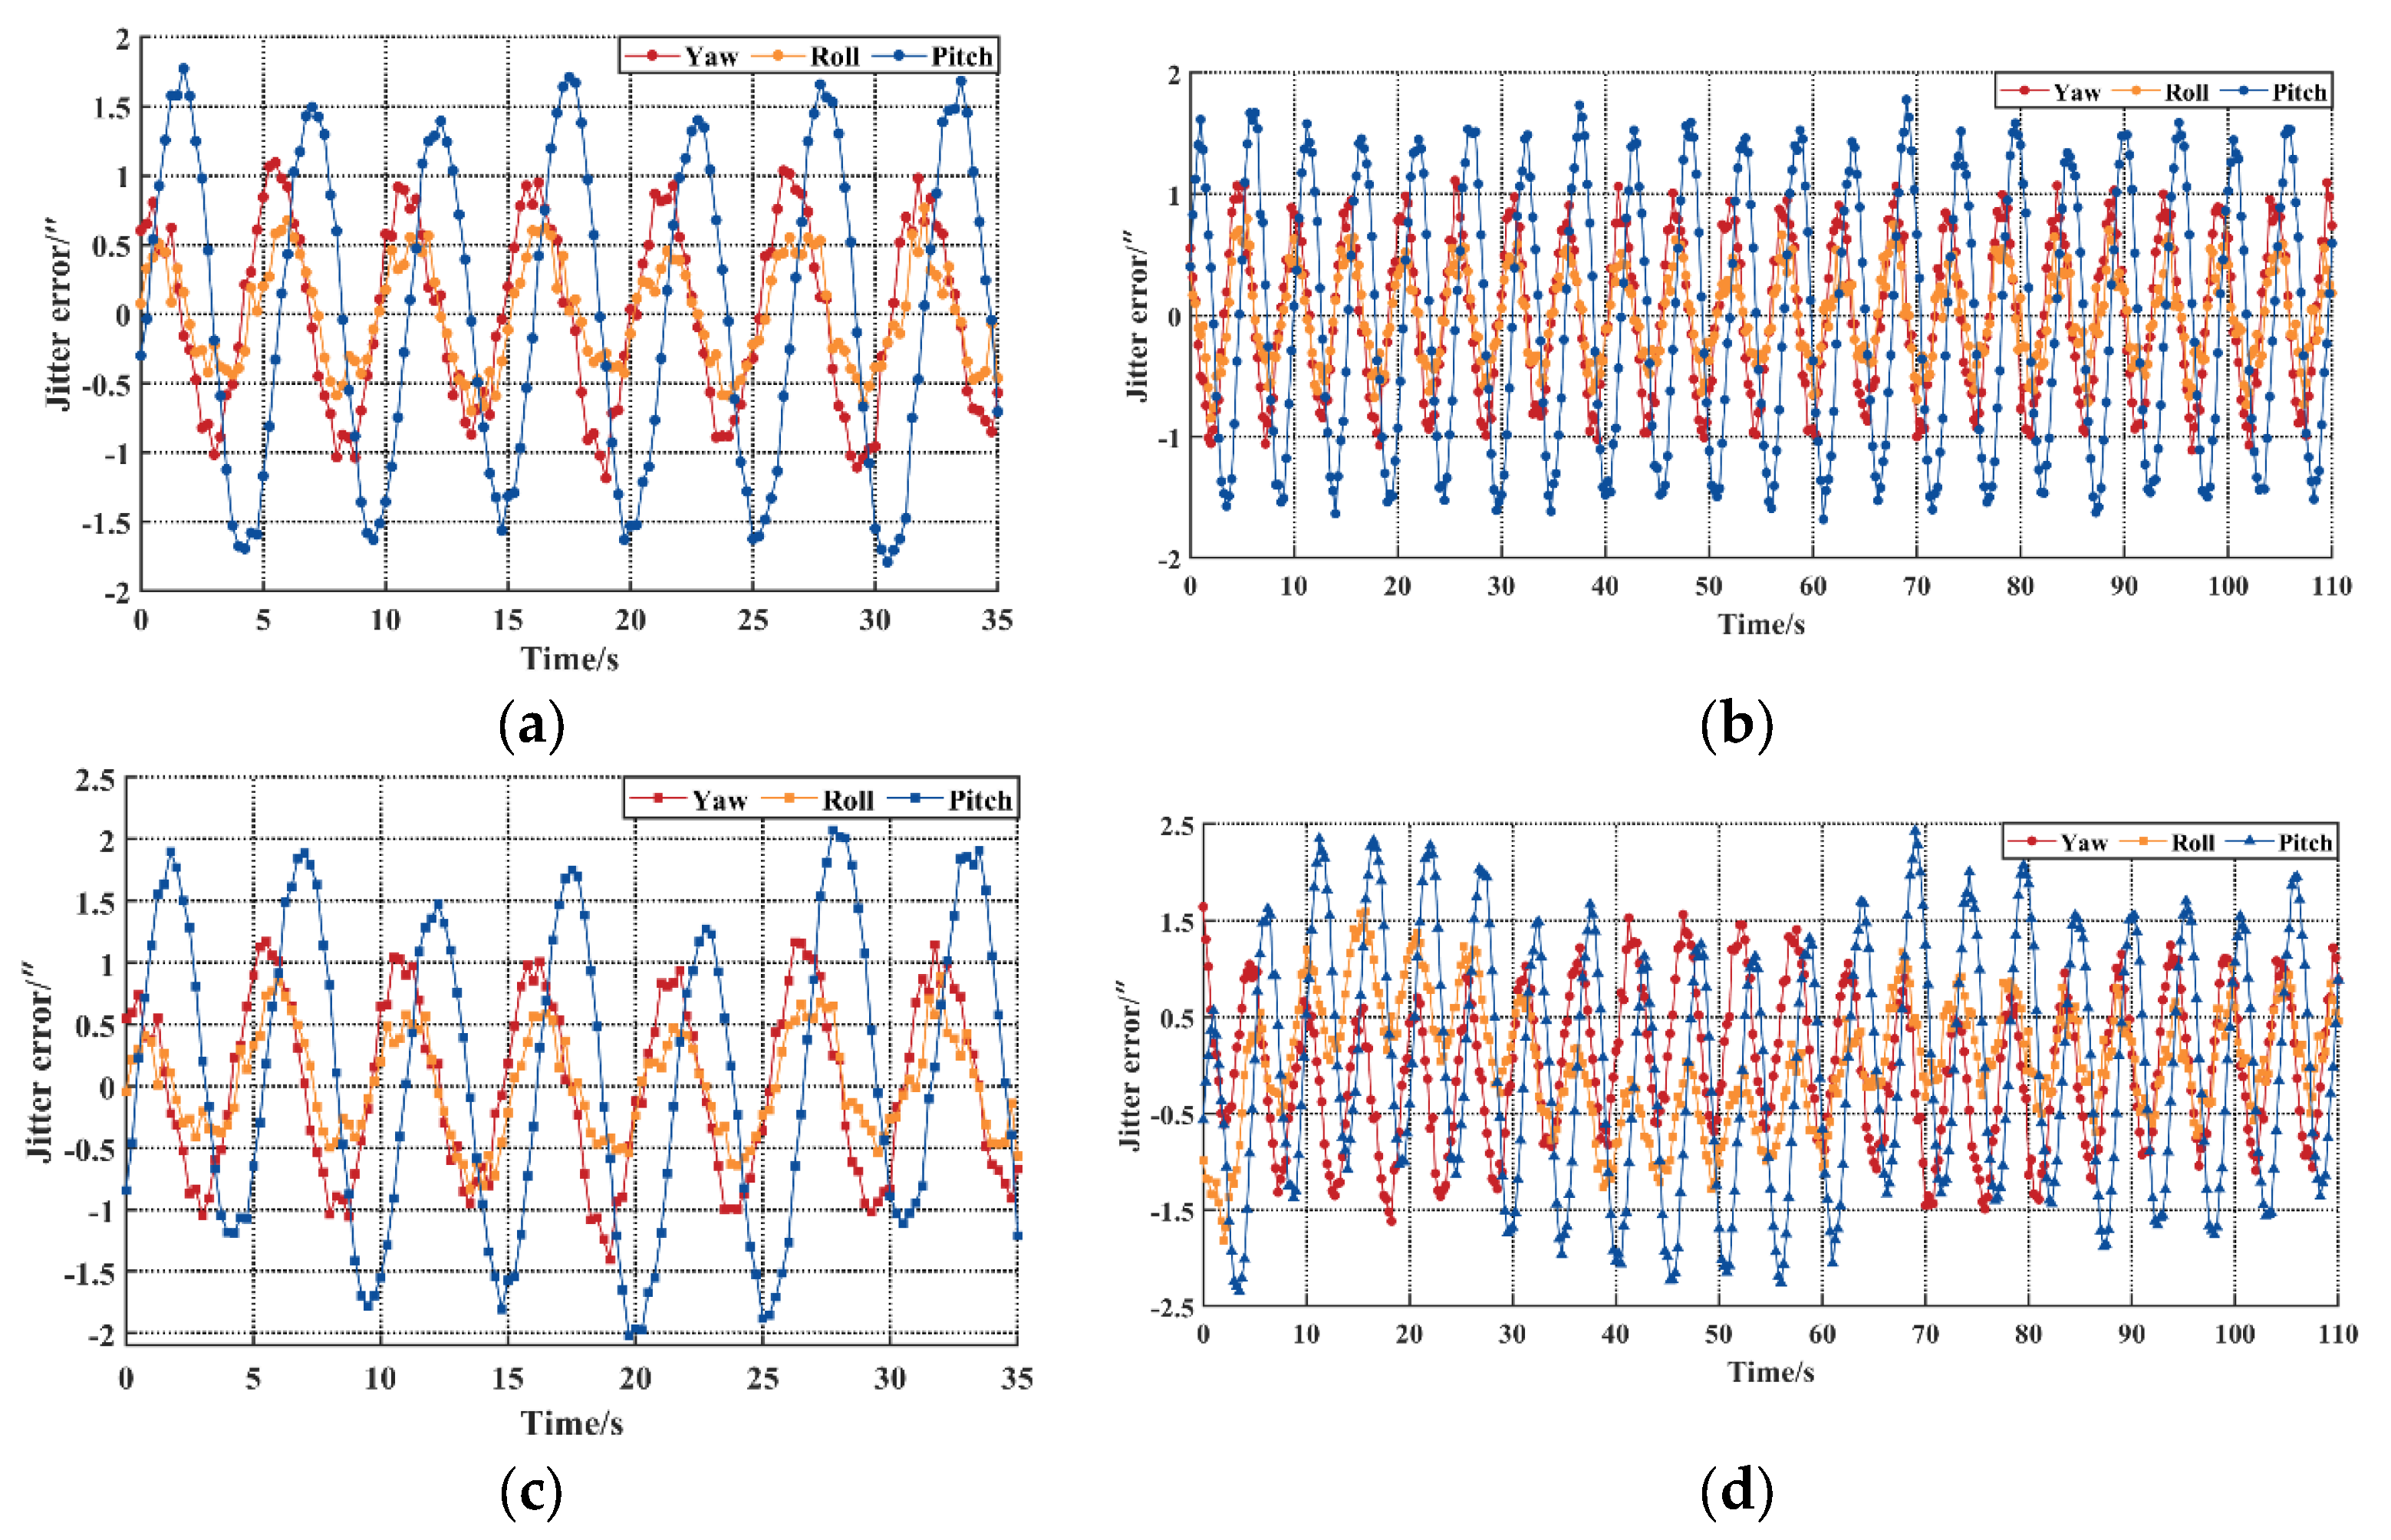
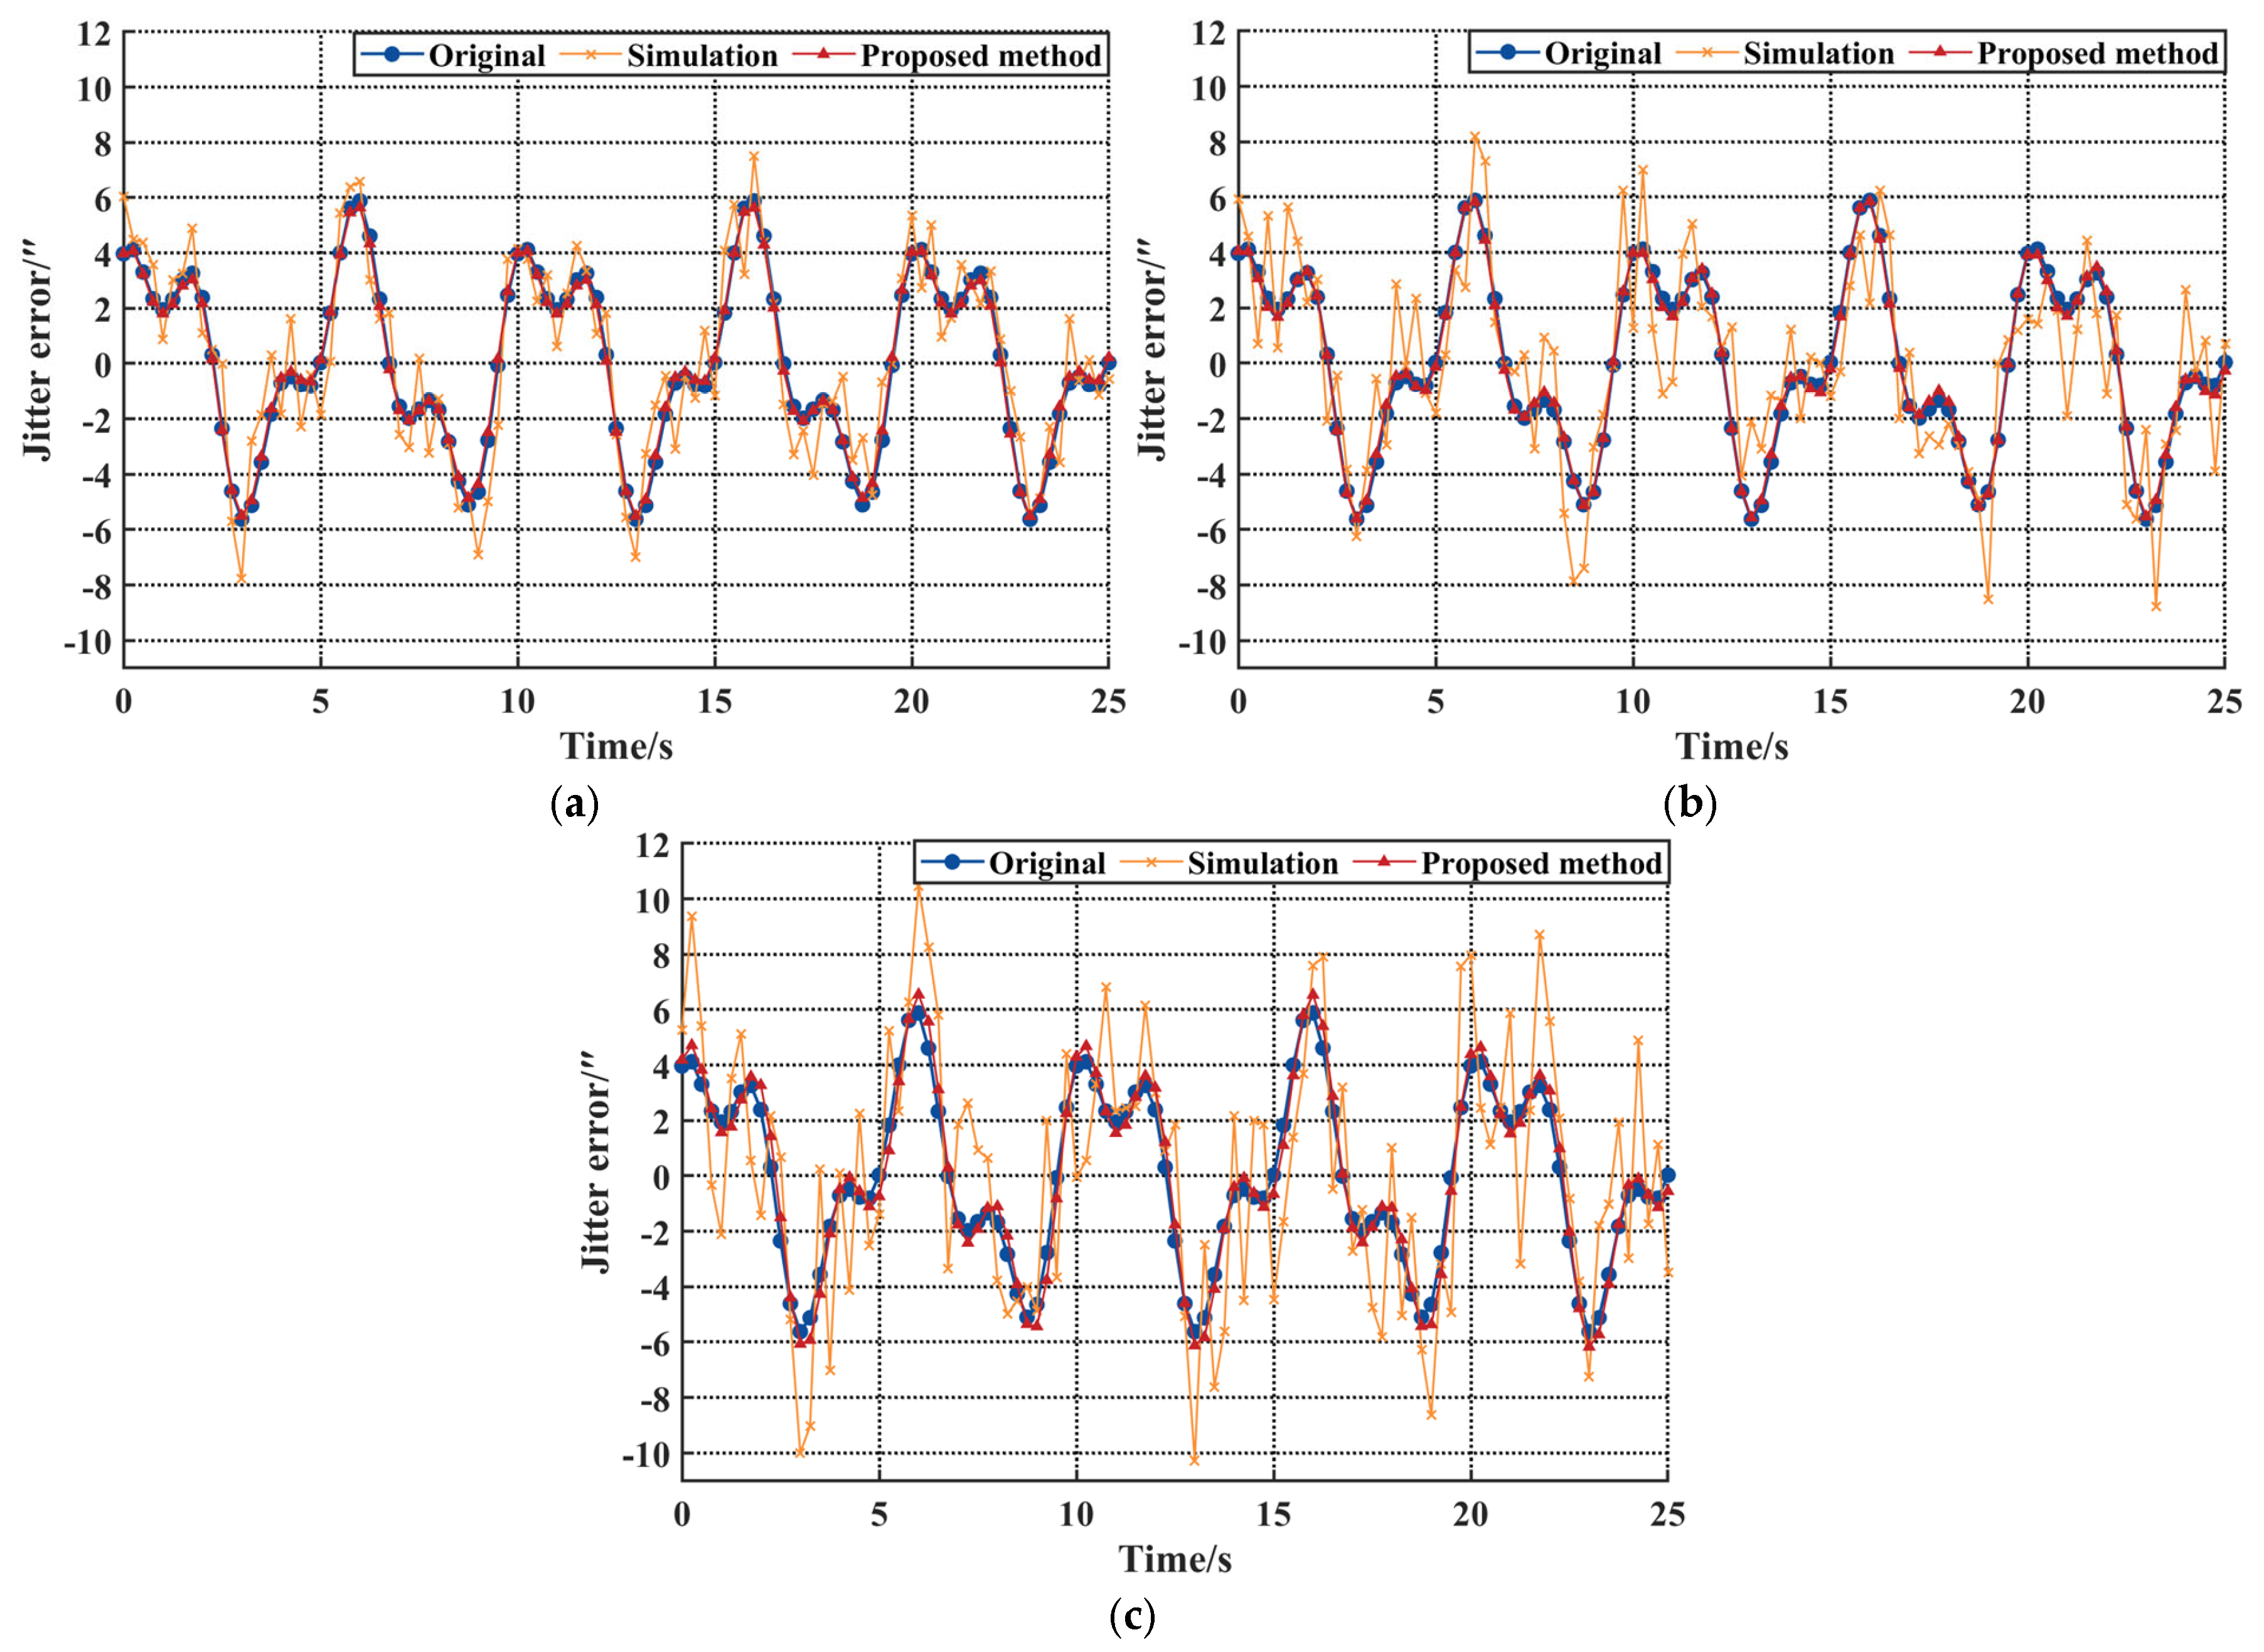
3.2.1. Jitter Error Fusion Analysis
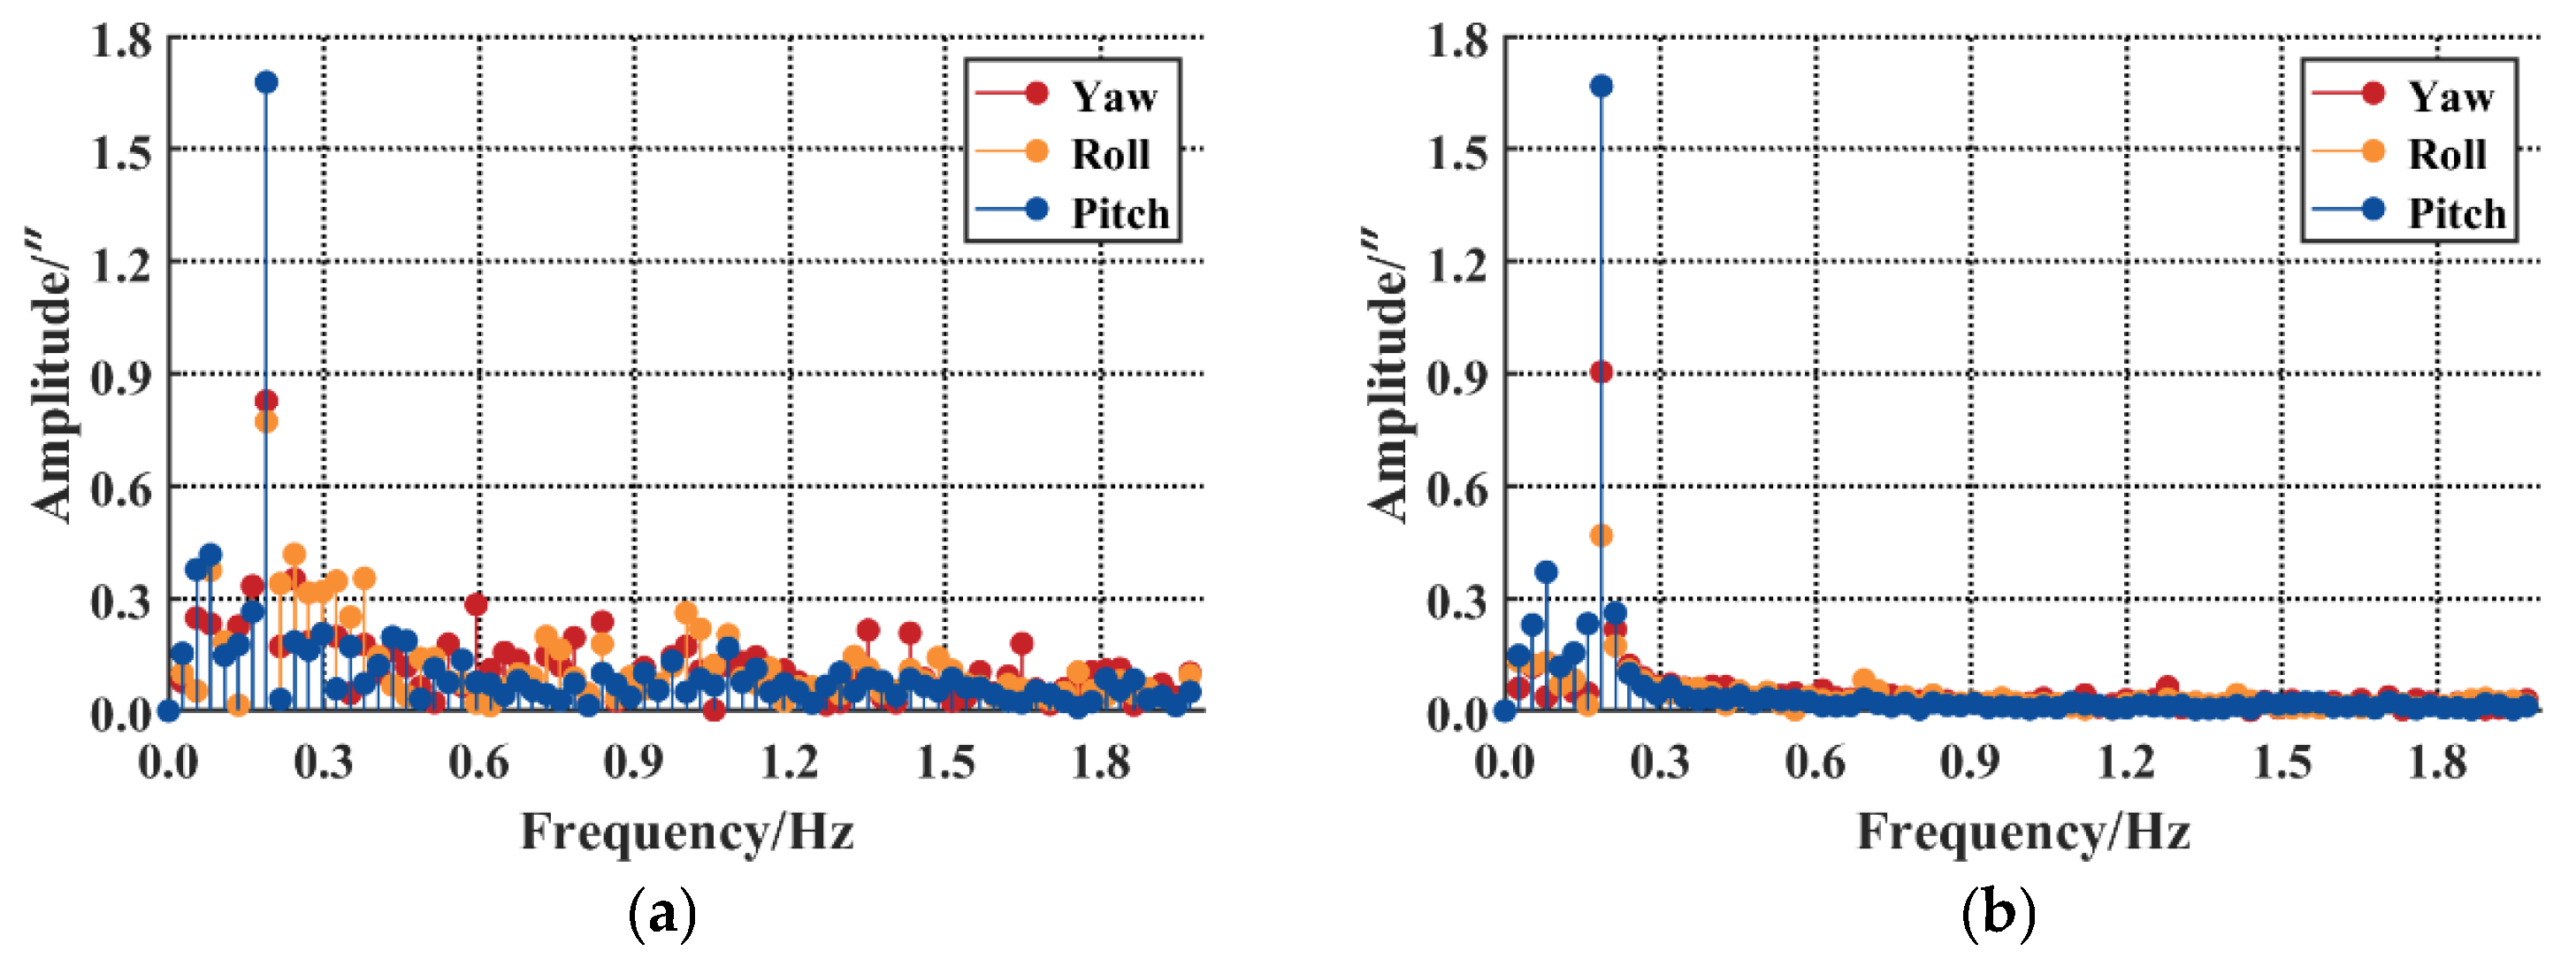
3.2.2. Jitter Error Extraction Analysis
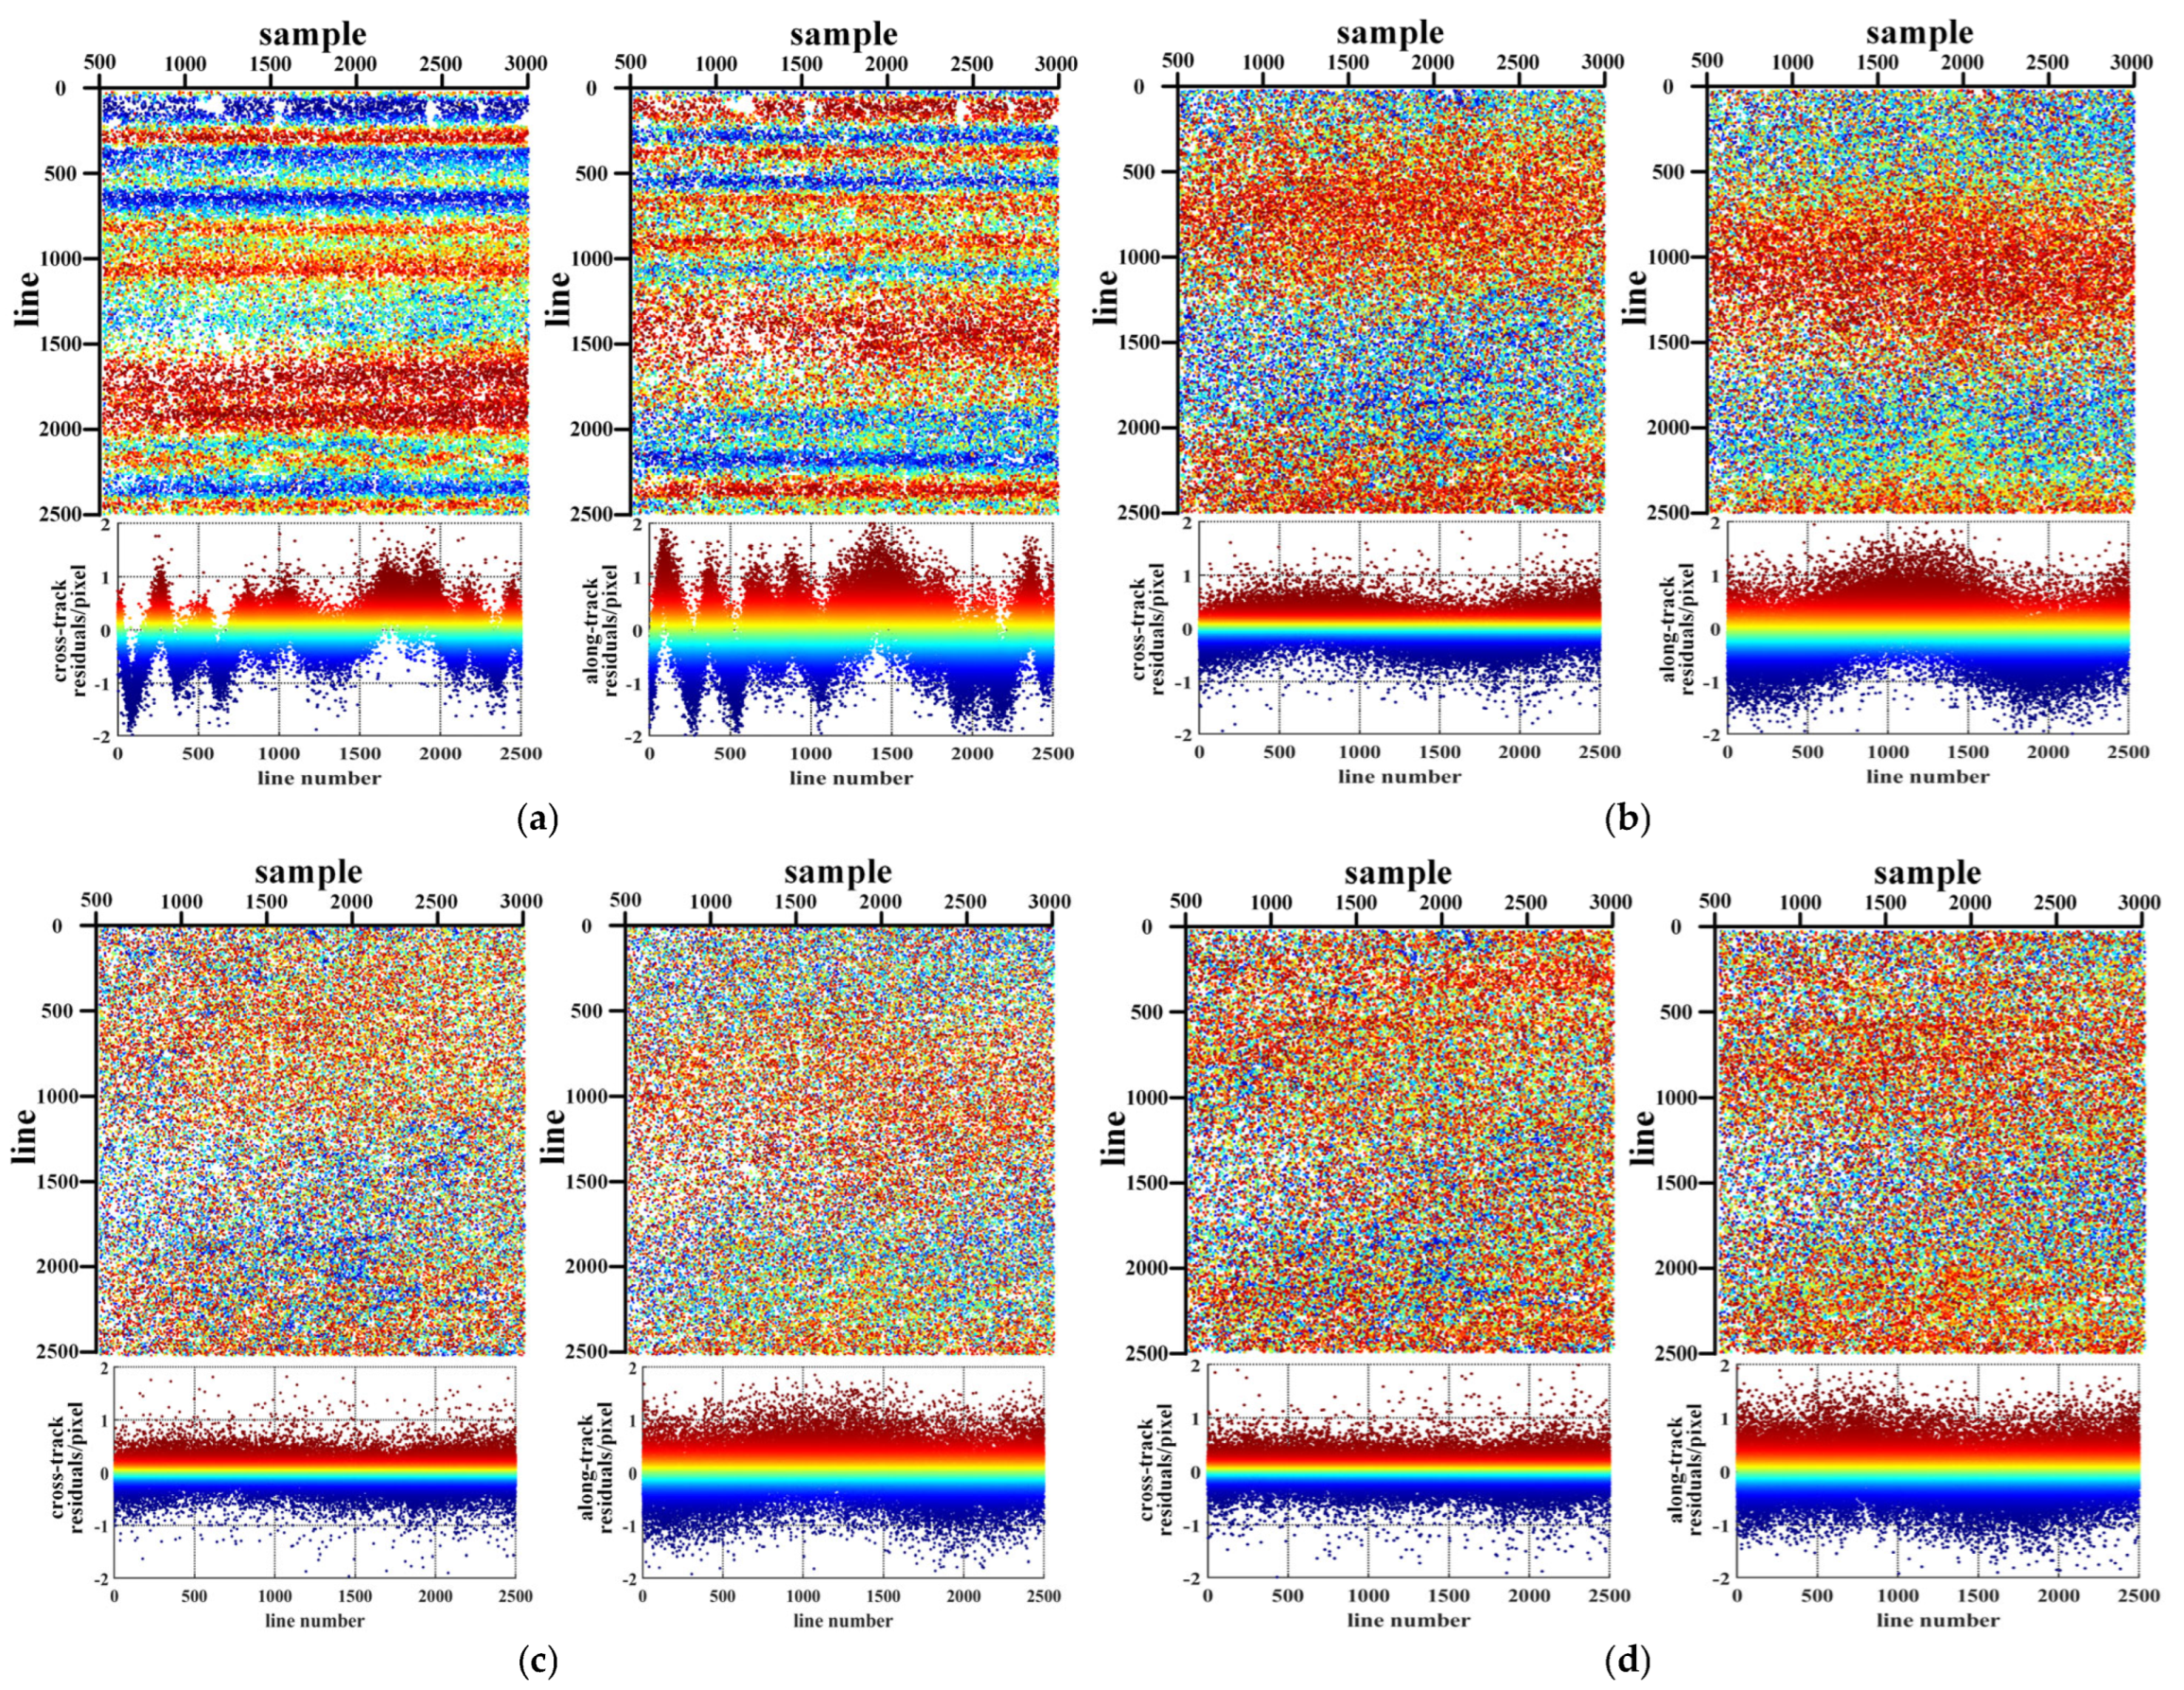
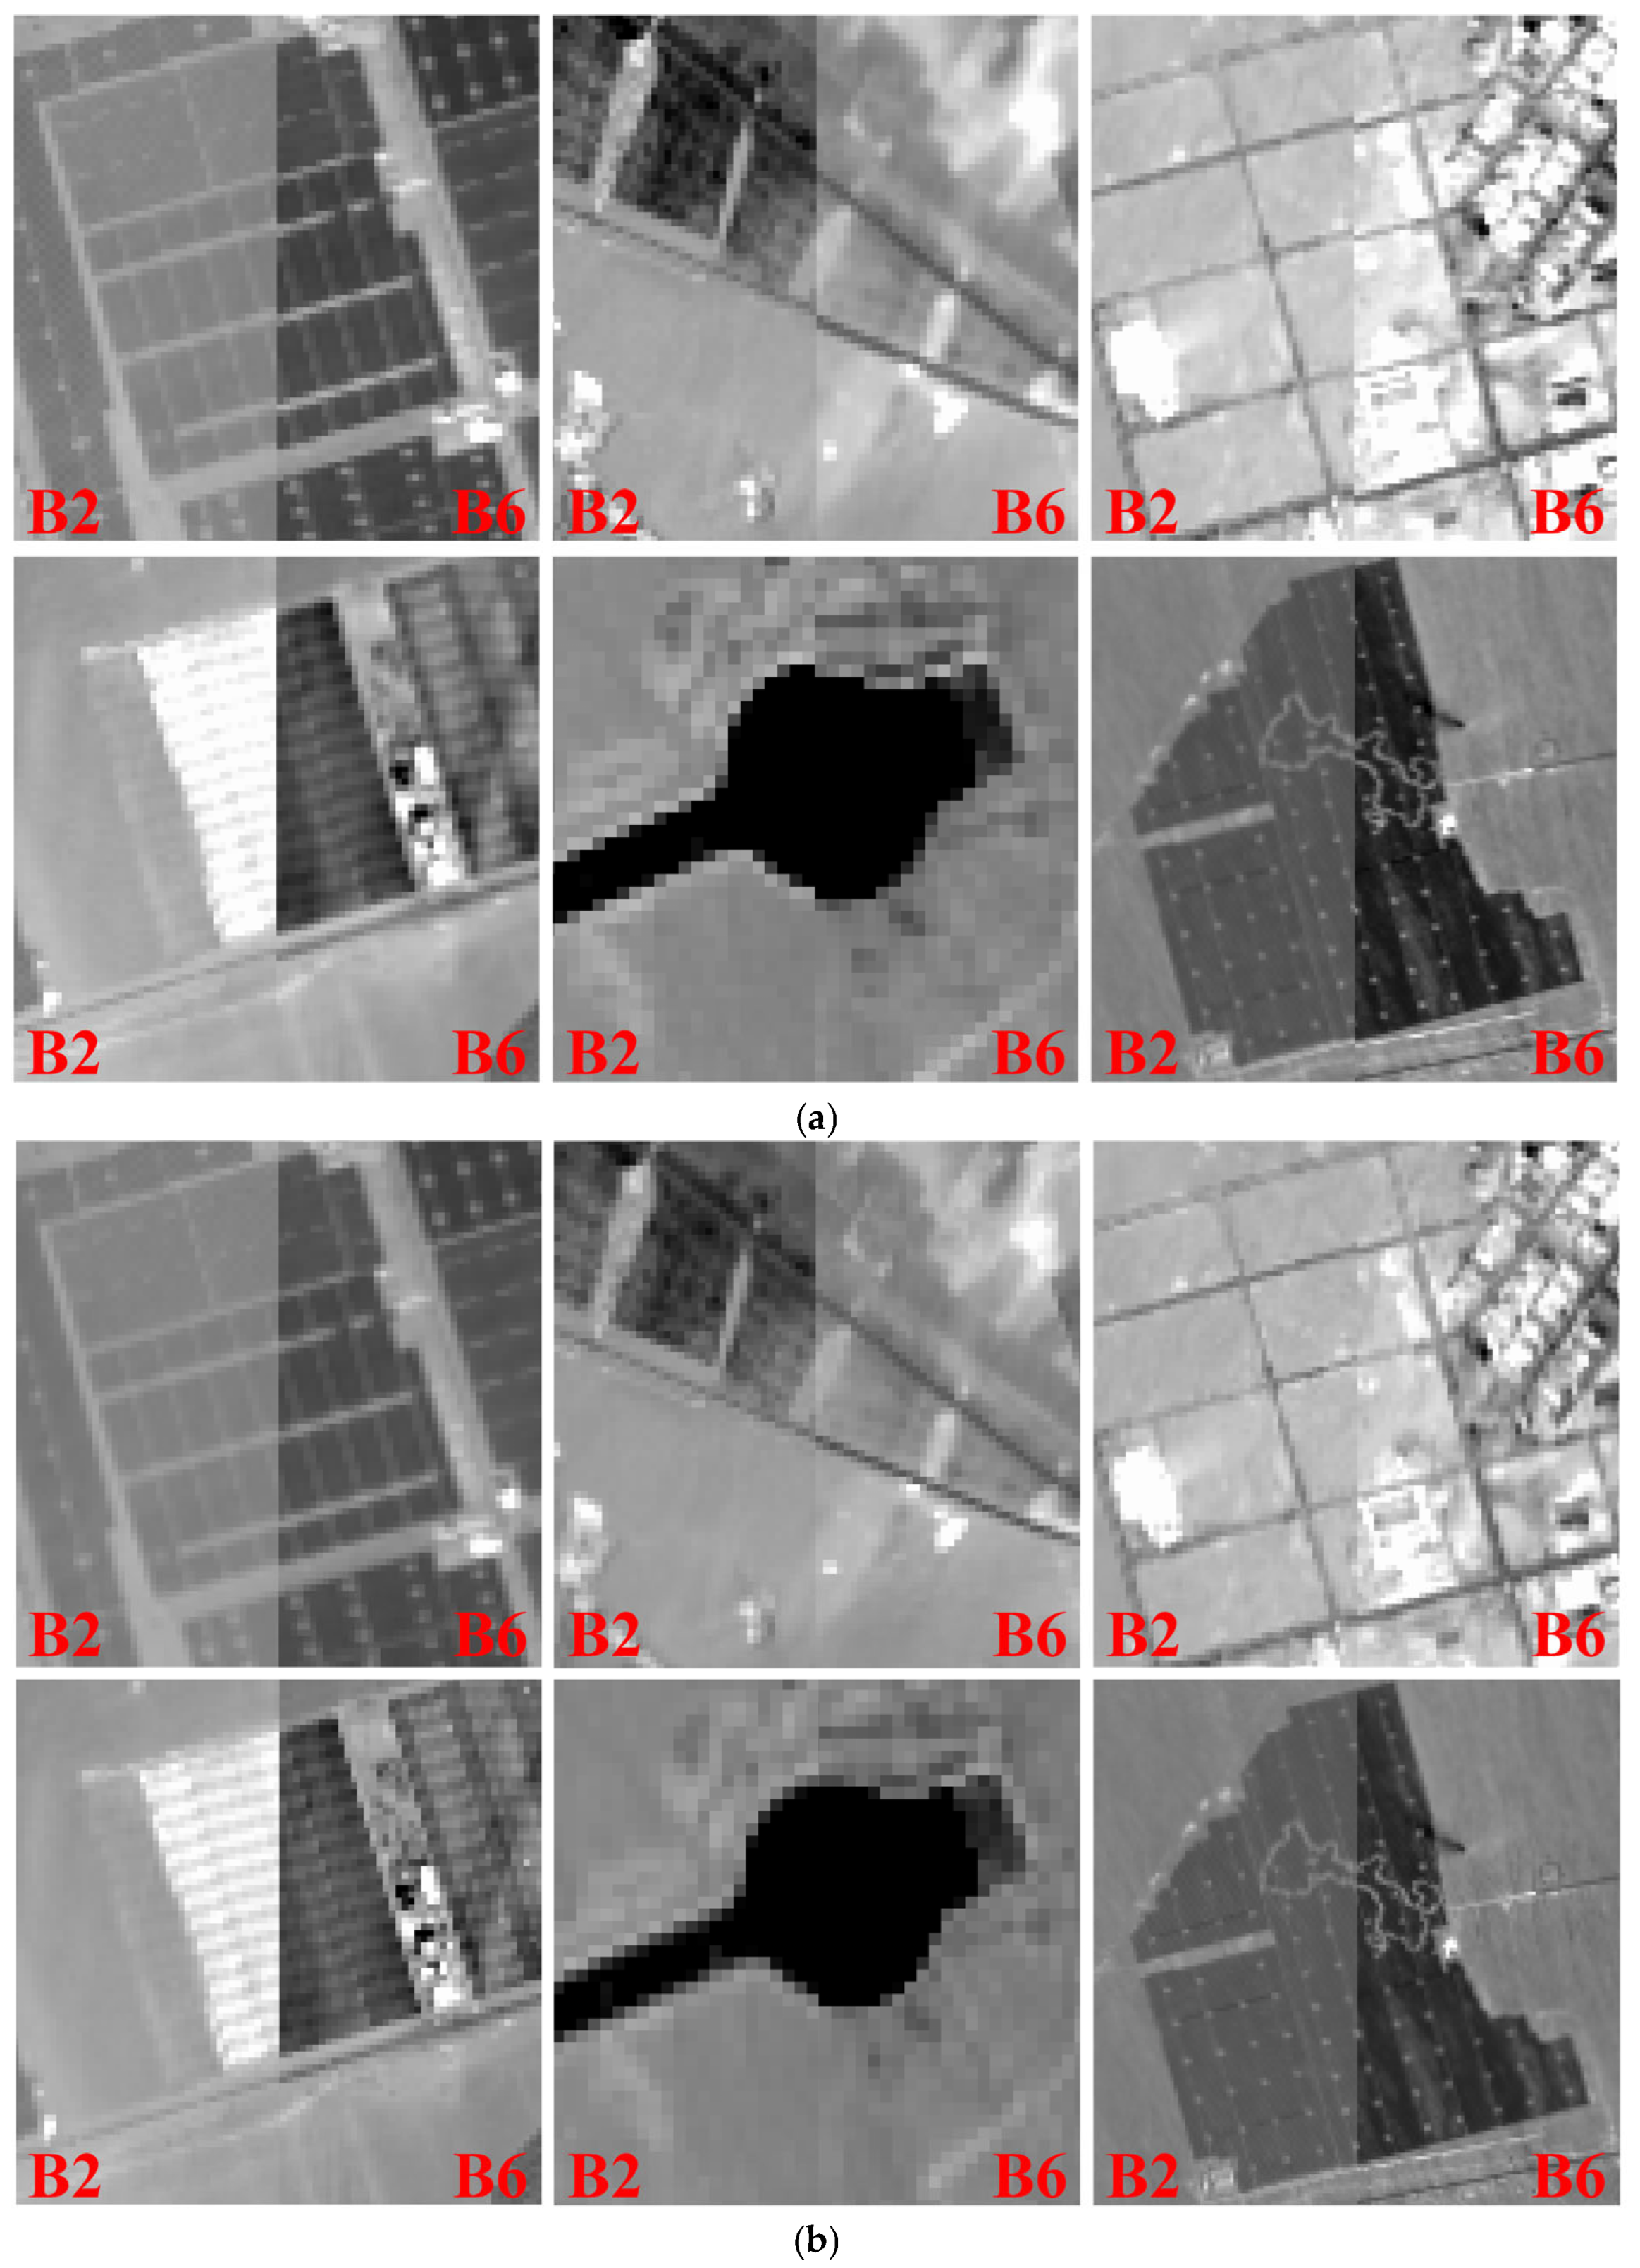
3.3. Registration Accuracy Analysis
4. Discussion
4.1. Measurement Noise
4.2. Time Complexity
| Algorithm 1 Precision attitude calculation |
| Input: , |
| Output: precision attitude angle |
| while do |
| (time update) |
| (measurement update) |
| (optimal estimation) |
| end while |
| while do |
| (time update) |
| (measurement update) |
| (optimal estimation) |
| end while |
| while do |
| (time update) |
| (measurement update) |
| (optimal estimation) |
| (attitude Transformation) |
| end while |
| return |
| Algorithm 2 Jitter error extraction and modeling |
| Input: |
| Output: precision attitude angle of scanning line |
| for (the number of attitude data) do |
| (stable attitude modeling) |
| (jitter error extraction) |
| end for |
| for (the number of scanning line) do |
| (stable attitude) |
| (jitter error) |
| end for |
| return |
5. Conclusions
Author Contributions
Funding
Data Availability Statement
Acknowledgments
Conflicts of Interest
References
- Li, N.; Guan, L.; Gao, H. Sun Glint Correction Based on BRDF Model for Improving the HY-1C/COCTS Clear-Sky Coverage. IEEE Geosci. Remote Sens. Lett. 2023, 20, 1–5. [Google Scholar] [CrossRef]
- Mao, Z.; Chen, P.; Tao, B.; Ding, J.; Liu, J.; Chen, J.; Hao, Z.; Zhu, Q.; Huang, H. A Radiometric Calibration Scheme for COCTS/HY-1C Based on Image Simulation from the Standard Remote-Sensing Reflectance. IEEE Trans. Geosci. Remote Sens. 2022, 60, 1–9. [Google Scholar] [CrossRef]
- Cao, J.; Zhou, N.; Shang, H.; Ye, Z.; Zhang, Z. Internal Geometric Quality Improvement of Optical Remote Sensing Satellite Images with Image Reorientation. Remote Sens. 2022, 14, 1. [Google Scholar] [CrossRef]
- Li, S.; Chen, S.; Ma, C.; Peng, H.; Wang, J.; Hu, L.; Song, Q. Construction of a Radiometric Degradation Model for Ocean Color Sensors of HY1C/D. IEEE Trans. Geosci. Remote Sens. 2024, 62, 1–13. [Google Scholar] [CrossRef]
- Song, J.; Zhang, Z.; Iwasaki, A.; Wang, J.; Sun, J.; Sun, Y. An Augmented H∞ Filter for Satellite Jitter Estimation Based on ASTER/SWIR and Blurred Star Images. IEEE Trans. Aerosp. Electron. Syst. 2021, 57, 2637–2646. [Google Scholar] [CrossRef]
- Perrier, R.; Arnaud, E.; Sturm, P.; Ortner, M. Satellite Image Registration for Attitude Estimation with a Constrained Polynomial Model. In Proceedings of the 17th IEEE International Conference on Image Processing, Hong Kong, China, 26–29 September 2010. [Google Scholar]
- Perrier, R.; Arnaud, E.; Sturm, P.; Ortner, M. Estimation of an Observation Satellite’s Attitude Using Multimodal Pushbroom Cameras. IEEE Trans. Pattern Anal. Mach. Intell. 2015, 37, 987–1000. [Google Scholar] [CrossRef]
- Zhu, Y.; Wang, M.; Pan, J. Detection of ZY-3 Satellite Platform Jitter Using Multi-Spectral Imagery. Acta Geod. Cartogr. Sin. 2015, 44, 399–406. [Google Scholar]
- Zhang, Z.; Xu, G.; Song, J. Observation Satellite Attitude Estimation Using Sensor Measurement and Image Registration Fusion. Proc. Inst. Mech. Eng. G J. Aerosp. Eng. 2018, 232, 1390–1402. [Google Scholar] [CrossRef]
- Wang, P.; An, W.; Deng, X.; Yang, J.; Sheng, W. A Jitter Compensation Method for Spaceborne Line-Array Imagery Using Compressive Sampling. Remote Sens. Lett. 2015, 6, 558–567. [Google Scholar] [CrossRef]
- Jiang, J.; Huang, J.; Zhang, G. An Accelerated Motion Blurred Star Restoration Based on Single Image. IEEE Sens. J. 2017, 17, 1306–1315. [Google Scholar] [CrossRef]
- Teshima, Y.; Iwasaki, A. Correction of Attitude Fluctuation of Terra Spacecraft Using ASTER/SWIR Imagery with Parallax Observation. IEEE Trans. Geosci. Remote Sens. 2008, 46, 222–227. [Google Scholar] [CrossRef]
- Ayoub, F.; Leprince, S.; Binet, R.; Lewis, K.W.; Aharonson, O.; Avouac, J.P. Influence of Camera Distortions on Satellite Image Registration and Change Detection Applications. In Proceedings of the 2008 IEEE International Geoscience and Remote Sensing Symposium, Boston, MA, USA, 7–11 July 2008. [Google Scholar]
- Kirk, R.; Howington, K.E.; Rosiek, M. Ultrahigh Resolution Topographic Mapping of Mars With Mro Hirise Stereo Images: Meter-scale Slopes of Candidate Phoenix Landing Sites. J. Geophys. Res. Planets 2008, 113, E3. [Google Scholar] [CrossRef]
- Takaku, J.; Tadono, T. High Resolution DSM Generation from ALOS Prism-processing Status and Influence of Attitude Fluctuation. In Proceedings of the 2010 IEEE International Geoscience and Remote Sensing Symposium, Honolulu, HI, USA, 25–30 July 2010. [Google Scholar]
- Amberg, V.; Dechoz, C.; Bernard, L.; Greslou, D.; de Lussy, F.; Lebegue, L. In-Flight Attitude Perturbations Estimation: Application to PLEIADES-HR Satellites. In Proceedings of the SPIE Optical Engineering + Applications, San Diego, CA, USA, 25–29 August 2013. [Google Scholar]
- Tong, X.; Li, L.; Liu, S.; Xu, Y.; Ye, Z.; Jin, Y.; Wang, F.; Xie, H. Detection and Estimation of ZY-3 Three-Line Array Image Distortions Caused by Attitude Oscillation. ISPRS J. Photogramm. Remote Sens. 2015, 101, 291–309. [Google Scholar] [CrossRef]
- Sun, T.; Long, H.; Liu, B.; Li, Y. Application of Attitude Jitter Detection Based on Short-Time Asynchronous Images and Compensation Methods for Chinese Mapping Satellite-1. Opt. Express 2015, 23, 1395. [Google Scholar] [CrossRef]
- Wang, M.; Zhu, Y.; Pan, J.; Yang, B.; Zhu, Q. Satellite Jitter Detection and Compensation Using Multispectral Imagery. Remote Sens. Lett. 2016, 7, 513–522. [Google Scholar] [CrossRef]
- Pan, J.; Che, C.; Zhu, Y.; Wang, M. Satellite Jitter Estimation and Validation Using Parallax Images. Sensors 2017, 17, 83. [Google Scholar] [CrossRef]
- Zhu, Y.; Wang, M.; Cheng, Y.; He, L.; Xue, L. An Improved Jitter Detection Method Based on Parallax Observation of Multispectral Sensors for Gaofen-1 02/03/04 Satellites. Remote Sens. 2018, 11, 16. [Google Scholar] [CrossRef]
- Zhu, Y.; Wang, M.; Cheng, Y.F.; Xue, L.; Zhu, Q. Jitter Detection for Gaofen-1 02/03/04 Satellites During the Early In-Flight Period. In Proceedings of the International Conference on Communications, Signal Processing, and Systems, Singapore, 16–18 November 2018; pp. 244–253. [Google Scholar] [CrossRef]
- Liu, S.; Lin, F.; Tong, X.; Zhang, H.; Lin, H.; Xie, H.; Ye, Z.; Zheng, S. Dynamic PSF-Based Jitter Compensation and Quality Improvement for Push-Broom Optical Images Considering Terrain Relief and the TDI Effect. Appl. Opt. 2022, 61, 16. [Google Scholar] [CrossRef]
- Zhu, Y.; Yang, T.; Wang, M.; Pan, J.; Ye, G.; Hong, H.; Wang, L. Rigorous Parallax Observation Model-Based Remote Sensing Panchromatic and Multispectral Images Jitter Distortion Correction for Time Delay Integration Cameras. IEEE Trans. Geosci. Remote Sens. 2024, 62, 1–19. [Google Scholar] [CrossRef]
- Zhang, Z.; Iwasaki, A.; Xu, G. Attitude Jitter Compensation for Remote Sensing Images Using Convolutional Neural Network. IEEE Geosci. Remote Sens. Lett. 2019, 16, 1358–1362. [Google Scholar] [CrossRef]
- Wang, Z.; Zhang, Z.; Dong, L.; Xu, G. Jitter Detection and Image Restoration Based on Generative Adversarial Networks in Satellite Images. Sensors 2021, 21, 14. [Google Scholar] [CrossRef] [PubMed]
- Nguyen, M.; de Vieilleville, F.; Weiss, P. DeepVibes: Correcting Microvibrations in Satellite Imaging with Pushbroom Cameras. IEEE Trans. Geosci. Remote Sens. 2024, 62, 1–9. [Google Scholar] [CrossRef]
- Shajkofci, A.; Liebling, M. Spatially-Variant CNN-Based Point Spread Function Estimation for Blind Deconvolution and Depth Estimation in Optical Microscopy. IEEE Trans. Image Process. 2020, 29, 5848–5861. [Google Scholar] [CrossRef]
- Debarnot, V.; Weiss, P. Deep-Blur: Blind Identification and Deblurring with Convolutional Neural Networks. Biol. Imaging. 2024, 4, e13. [Google Scholar] [CrossRef]
- Caery, J.; Stuber, G.L. Nonlinear Multiuser Parameter Estimation and Tracking in CDMA Systems. IEEE Trans. Commun. 2000, 48, 2053–2063. [Google Scholar] [CrossRef]
- Iwata, T.; Kawahara, T.; Muranaka, N. High-Bandwidth Pointing Determination for the Advanced Land Observing Satellite (ALOS). In Proceedings of the 24th International Symposium on Space Technology and Science, Miyazaki, Japan, 30 May–6 June 2004. [Google Scholar]
- Julier, S.J.; Uhlmann, J.K. Reduced Sigma Point Filters for the Propagation of Means and Covariances Through Nonlinear Transformations. In Proceedings of the 2002 American Control Conference, New York, NY, USA, 8–10 May 2002; IEEE: New York, NY, USA, 2002. [Google Scholar]
- Wan, E.A.; Van Der Merwe, R. The Unscented Kalman Filter. In Kalman Filtering and Neural Networks; Wiley: Hoboken, NJ, USA, 2001; pp. 221–280. [Google Scholar]
- Wang, Y.; Wang, M.; Dong, Z.; Zhu, Y. High-Precision Geometric Positioning for Optical Remote Sensing Satellite in Dynamic Imaging. Geospat. Inf. Sci. 2024, 1, 1–17. [Google Scholar] [CrossRef]
- Wang, M.; Fan, C.; Pan, J.; Jin, S.; Chang, X. Image Jitter Detection and Compensation Using a High-Frequency Angular Displacement Method for Yaogan-26 Remote Sensing Satellite. ISPRS J. Photogramm. Remote Sens. 2017, 130, 32–34. [Google Scholar] [CrossRef]
- Tong, X.; Ye, Z.; Xu, Y.; Tang, X.; Liu, S.; Li, L.; Xie, H.; Wang, F.; Li, T.; Hong, Z. Framework of Jitter Detection and Compensation for High Resolution Satellites. Remote Sens. 2014, 6, 3944–3964. [Google Scholar] [CrossRef]
- Cheng, Y.; Jin, S.; Wang, M.; Zhu, Y.; Dong, Z. A New Image Mosaicking Approach for the Multiple Camera System of the Optical Remote Sensing Satellite GaoFen1. Remote Sens. Lett. 2017, 8, 1042–1051. [Google Scholar] [CrossRef]
- Wang, M.; Cheng, Y.; Guo, B.; Jin, S. Parameters Determination and Sensor Correction Method Based on Virtual CMOS with Distortion for the GaoFen6 WFV Camera. ISPRS J. Photogramm. Remote Sens. 2019, 156, 51–62. [Google Scholar] [CrossRef]
- Cheng, Y.; Jin, S.; Wang, M.; Zhu, Y.; Dong, Z. Image Mosaicking Approach for a Double-Camera System in the GaoFen2 Optical Remote Sensing Satellite Based on the Big Virtual Camera. Sensors 2017, 17, 1441. [Google Scholar] [CrossRef] [PubMed]


| Type | Parameter | |
|---|---|---|
| Orbit | Orbit type | Sun-synchronous orbit |
| Altitude/km | 782.121 | |
| Inclination/° | 95.522 | |
| Cycle/min | 100.347 | |
| Attitude sensor | Star sensor frequency/Hz | 4 |
| Star sensor accuracy | 5″(3σ) | |
| Gyroscope frequency/Hz | 4 | |
| OCTS | Resolution/m | 500 |
| Swath width/km | 3000 | |
| Number of bands | 18 | |
| Wavelength/um | 0.35~12.50 | |
| Rotating mirror period/s | 5.24 | |
| CZI | Resolution/m | 5(PAN) 20(MSS) |
| Swath width/km | 60 | |
| Number of bands | 9 | |
| Wavelength/um | 0.40~1.04 | |
| MRSI | Resolution/m | 100/200 |
| Swath width/km | 950 | |
| Number of bands | 19 | |
| Wavelength/um | 0.375~0.92 | |
| Image No | Date | Location |
|---|---|---|
| Scene 1 | 2024-06-17T11:10:50 | 41.695715°N 115.619758°E |
| Scene 2 | 2024-06-23T12:51:50 | 40.743887°N 95.129781°E |
| Scene 3 | 2024-06-24T10:38:50 | 38.964805°N 121.287683°E |
| Scene 4 | 2024-06-24T17:22:50 | 30.373059°N 24.153392°E |
| Scene 5 | 2024-07-02T12:52:50 | 39.973096°N 94.410795°E |
| Scene 6 | 2024-07-02T23:00:10 | 24.872577°N 65.260534°W |
| Type | Angle | MIN | MAX | RMS |
|---|---|---|---|---|
| Star sensor | Yaw | −2.649″ | 2.266″ | 1.018″ |
| Roll | −2.567″/9.734 m | 2.793″/10.591 m | 1.064″/4.035 m | |
| Pitch | −2.800″/10.617 m | 3.082″/11.686 m | 1.377″/5.221 m | |
| Star sensor and gyroscope | Yaw | −1.423″ | 1.212″ | 0.706″ |
| Roll | −0.997″/3.780 m | 0.976″/3.701 m | 0.440″/1.668 m | |
| Pitch | −2.394″/9.078 m | 2.011″/7.625 m | 1.264″/4.793 m |
| Type | Angle | MIN | MAX | RMS |
|---|---|---|---|---|
| Overall fitting of stable attitude | Yaw | −0.514″ | 0.540″ | 0.178″ |
| Roll | −1.165″/4.417 m | 1.114″/4.224 m | 0.385″/1.460 m | |
| Pitch | −1.068″/4.050 m | 0.673″/2.552 m | 0.309″/1.172 m | |
| Proposed method | Yaw | −0.344″ | 0.363″ | 0.114″ |
| Roll | −0.378″/1.433 m | 0.372″/1.411 m | 0.122″/0.463 m | |
| Pitch | −0.503″/1.907 m | 0.507″/1.922 m | 0.128″/0.485 m |
| Image No | Registration Error/Pixel | ||||
|---|---|---|---|---|---|
| Star Sensor | Stable Attitude | Conventional Method | Proposed Method | ||
| Scene 1 | dx | 0.681 | 0.382 | 0.504 | 0.400 |
| dy | 0.585 | 0.433 | 0.464 | 0.356 | |
| Scene 2 | dx | 0.313 | 0.245 | 0.322 | 0.222 |
| dy | 1.112 | 0.801 | 0.564 | 0.321 | |
| Scene 3 | dx | 0.515 | 0.437 | 0.431 | 0.341 |
| dy | 0.523 | 0.491 | 0.446 | 0.384 | |
| Scene 4 | dx | 0.676 | 0.324 | 0.416 | 0.326 |
| dy | 0.366 | 0.431 | 0.408 | 0.297 | |
| Scene 5 | dx | 0.856 | 0.256 | 0.359 | 0.251 |
| dy | 1.058 | 0.847 | 0.429 | 0.413 | |
| Scene 6 | dx | 0.528 | 0.210 | 0.243 | 0.192 |
| dy | 0.666 | 0.406 | 0.406 | 0.330 | |
| Mean | dx | 0.595 | 0.309 | 0.379 | 0.289 |
| dy | 0.718 | 0.568 | 0.453 | 0.350 | |
| Noise/″ | Jitter 1 | Jitter 2 | ||||
|---|---|---|---|---|---|---|
| A/″ | F/Hz | P/rad | A/″ | F/Hz | P/rad | |
| 0.000 | 4.000 | 0.200 | 30.000 | −2.000 | 0.500 | −80.000 |
| 0.288 | 4.026 | 0.200 | 29.907 | −2.006 | 0.500 | −77.564 |
| 0.578 | 3.932 | 0.200 | 28.363 | −2.052 | 0.500 | −80.104 |
| 0.864 | 3.962 | 0.200 | 31.445 | −1.926 | 0.500 | −82.893 |
| 1.154 | 3.861 | 0.201 | 22.253 | −2.013 | 0.500 | −76.430 |
| 1.444 | 3.850 | 0.200 | 32.233 | −1.957 | 0.500 | −79.675 |
| 1.737 | 4.137 | 0.200 | 31.833 | −1.893 | 0.501 | −83.324 |
| 2.019 | 4.084 | 0.200 | 26.939 | −1.904 | 0.500 | −90.839 |
| 2.295 | 3.843 | 0.200 | 30.992 | −2.129 | 0.500 | −77.252 |
| 2.602 | 4.346 | 0.200 | 29.748 | −1.710 | 0.499 | −73.116 |
| 2.890 | 3.759 | 0.201 | 30.981 | −2.232 | 0.499 | −65.003 |
| 3.179 | 4.086 | 0.200 | 24.630 | −2.500 | 0.501 | −96.219 |
| Noise/″ | MIN/″ | MAX/″ | MEAN/″ | RMS/″ |
|---|---|---|---|---|
| 0.000 | −1.006 × 10⁻¹⁰ | 1.041 × 10⁻¹⁰ | 1.269 × 10⁻¹² | 4.111 × 10⁻¹¹ |
| 0.288 | −0.104 | 0.095 | 5.561 × 10⁻⁴ | 0.037 |
| 0.578 | −0.157 | 0.177 | −6.770 × 10⁻⁵ | 0.085 |
| 0.864 | −0.459 | 0.381 | 1.788 × 10⁻⁴ | 0.133 |
| 1.154 | −0.541 | 0.572 | −4.268 × 10⁻³ | 0.231 |
| 1.444 | −0.530 | 0.491 | −2.206 × 10⁻³ | 0.223 |
| 1.737 | −0.580 | 0.596 | −9.246 × 10⁻⁴ | 0.207 |
| 2.019 | −0.555 | 0.536 | −1.894 × 10⁻³ | 0.261 |
| 2.295 | −0.515 | 0.500 | 2.058 × 10⁻³ | 0.208 |
| 2.602 | −0.677 | 0.691 | 3.209 × 10⁻³ | 0.337 |
| 2.890 | −0.982 | 1.092 | −2.447 × 10⁻³ | 0.499 |
| 3.179 | −1.114 | 0.992 | −7.945 × 10⁻³ | 0.447 |
| Image No | Number of Scanning Lines of Imaging Strip | Time/s |
|---|---|---|
| Scene 1 | 12,887 | 0.697 |
| Scene 2 | 35,625 | 2.415 |
| Scene 3 | 12,596 | 0.706 |
| Scene 4 | 36,338 | 2.205 |
| Scene 5 | 36,430 | 2.212 |
| Scene 6 | 20,697 | 1.201 |
Disclaimer/Publisher’s Note: The statements, opinions and data contained in all publications are solely those of the individual author(s) and contributor(s) and not of MDPI and/or the editor(s). MDPI and/or the editor(s) disclaim responsibility for any injury to people or property resulting from any ideas, methods, instructions or products referred to in the content. |
© 2025 by the authors. Licensee MDPI, Basel, Switzerland. This article is an open access article distributed under the terms and conditions of the Creative Commons Attribution (CC BY) license (https://creativecommons.org/licenses/by/4.0/).
Share and Cite
Wang, Y.; Zhang, R.; Xu, Y.; Zhang, X.; Dai, R.; Jin, S. Jitter Error Correction for the HaiYang-3A Satellite Based on Multi-Source Attitude Fusion. Remote Sens. 2025, 17, 1489. https://doi.org/10.3390/rs17091489
Wang Y, Zhang R, Xu Y, Zhang X, Dai R, Jin S. Jitter Error Correction for the HaiYang-3A Satellite Based on Multi-Source Attitude Fusion. Remote Sensing. 2025; 17(9):1489. https://doi.org/10.3390/rs17091489
Chicago/Turabian StyleWang, Yanli, Ronghao Zhang, Yizhang Xu, Xiangyu Zhang, Rongfan Dai, and Shuying Jin. 2025. "Jitter Error Correction for the HaiYang-3A Satellite Based on Multi-Source Attitude Fusion" Remote Sensing 17, no. 9: 1489. https://doi.org/10.3390/rs17091489
APA StyleWang, Y., Zhang, R., Xu, Y., Zhang, X., Dai, R., & Jin, S. (2025). Jitter Error Correction for the HaiYang-3A Satellite Based on Multi-Source Attitude Fusion. Remote Sensing, 17(9), 1489. https://doi.org/10.3390/rs17091489