


FFLKCDNet: First Fusion Large-Kernel Change Detection Network for High-Resolution Remote Sensing Images


Abstract
1. Introduction
- BFFM: A novel module for fusing dual-temporal change features from varying scales and dimensions;
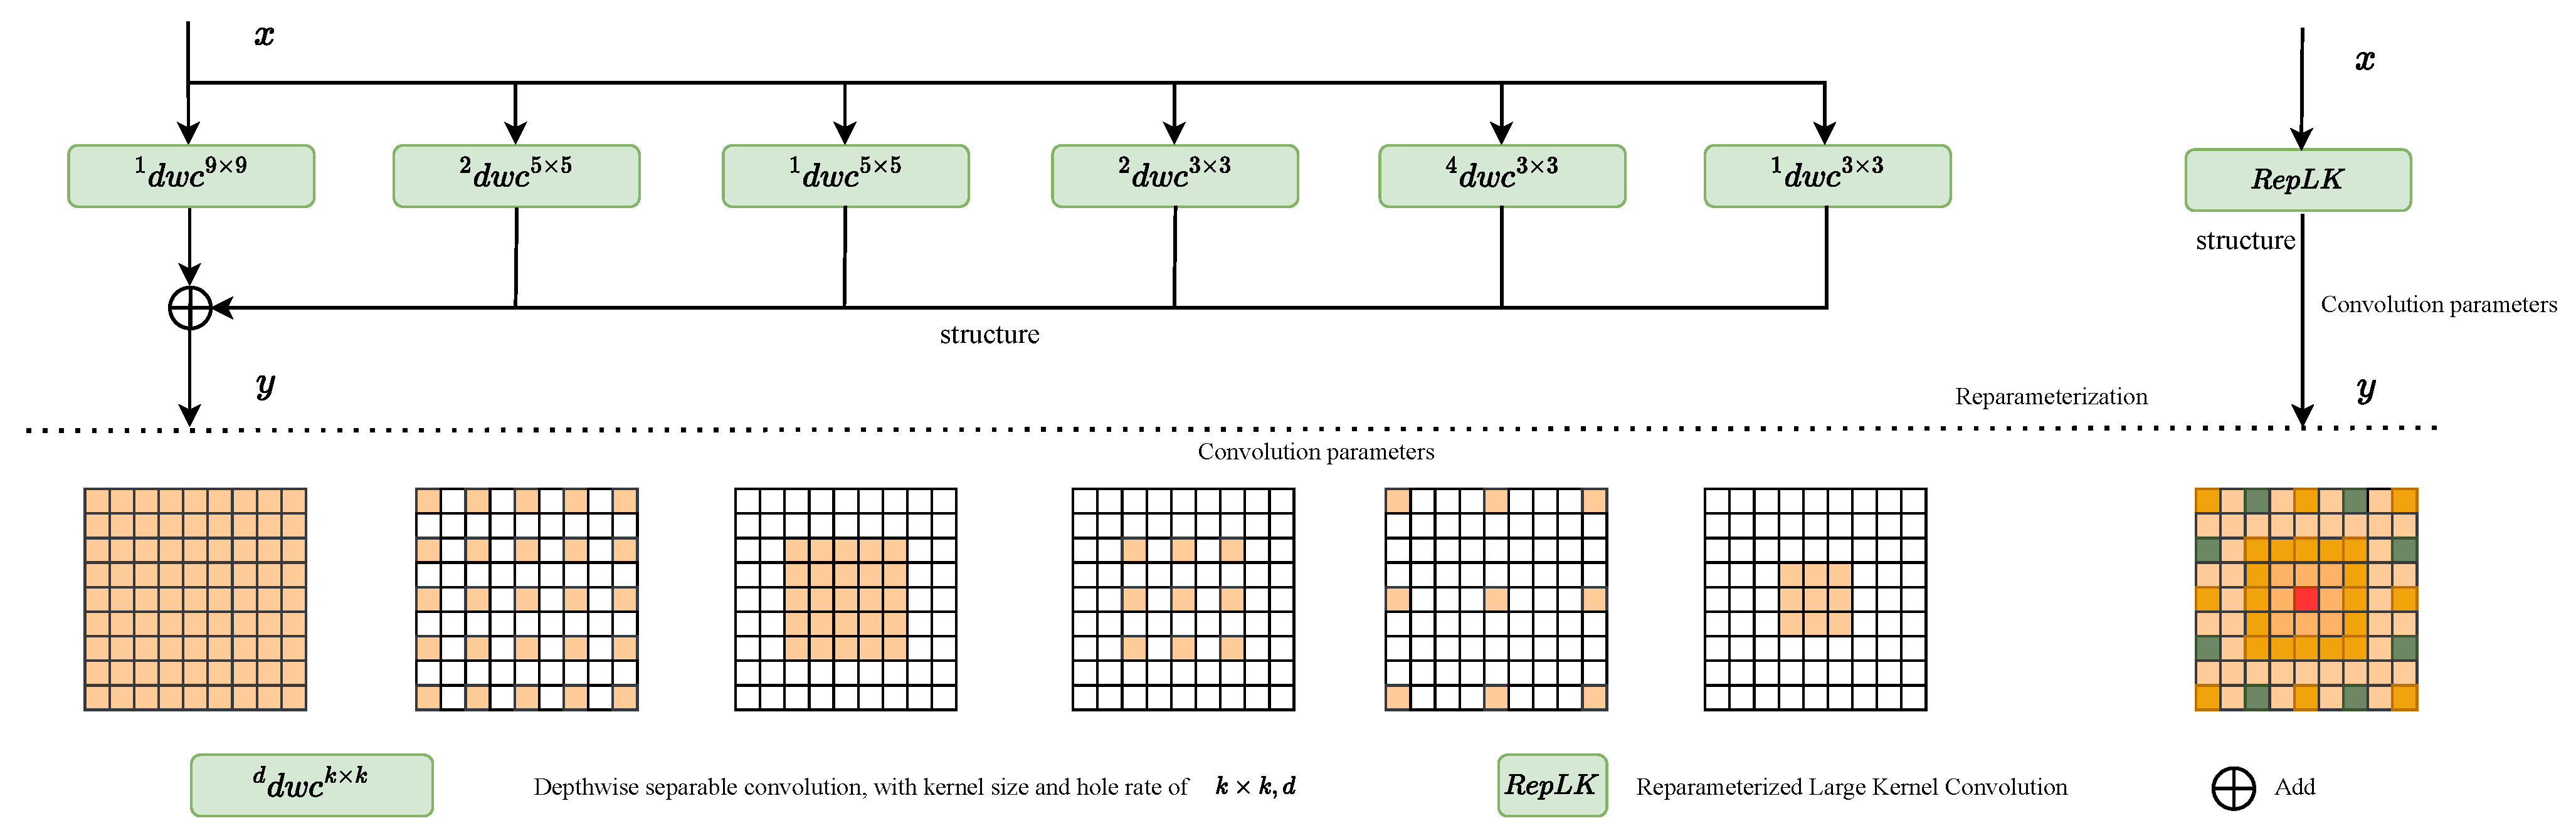
- RAResNet: An improved ResNet50, incorporating multi-attention and ReLK, which aggregates change information from remote sensing images over a large receptive field;
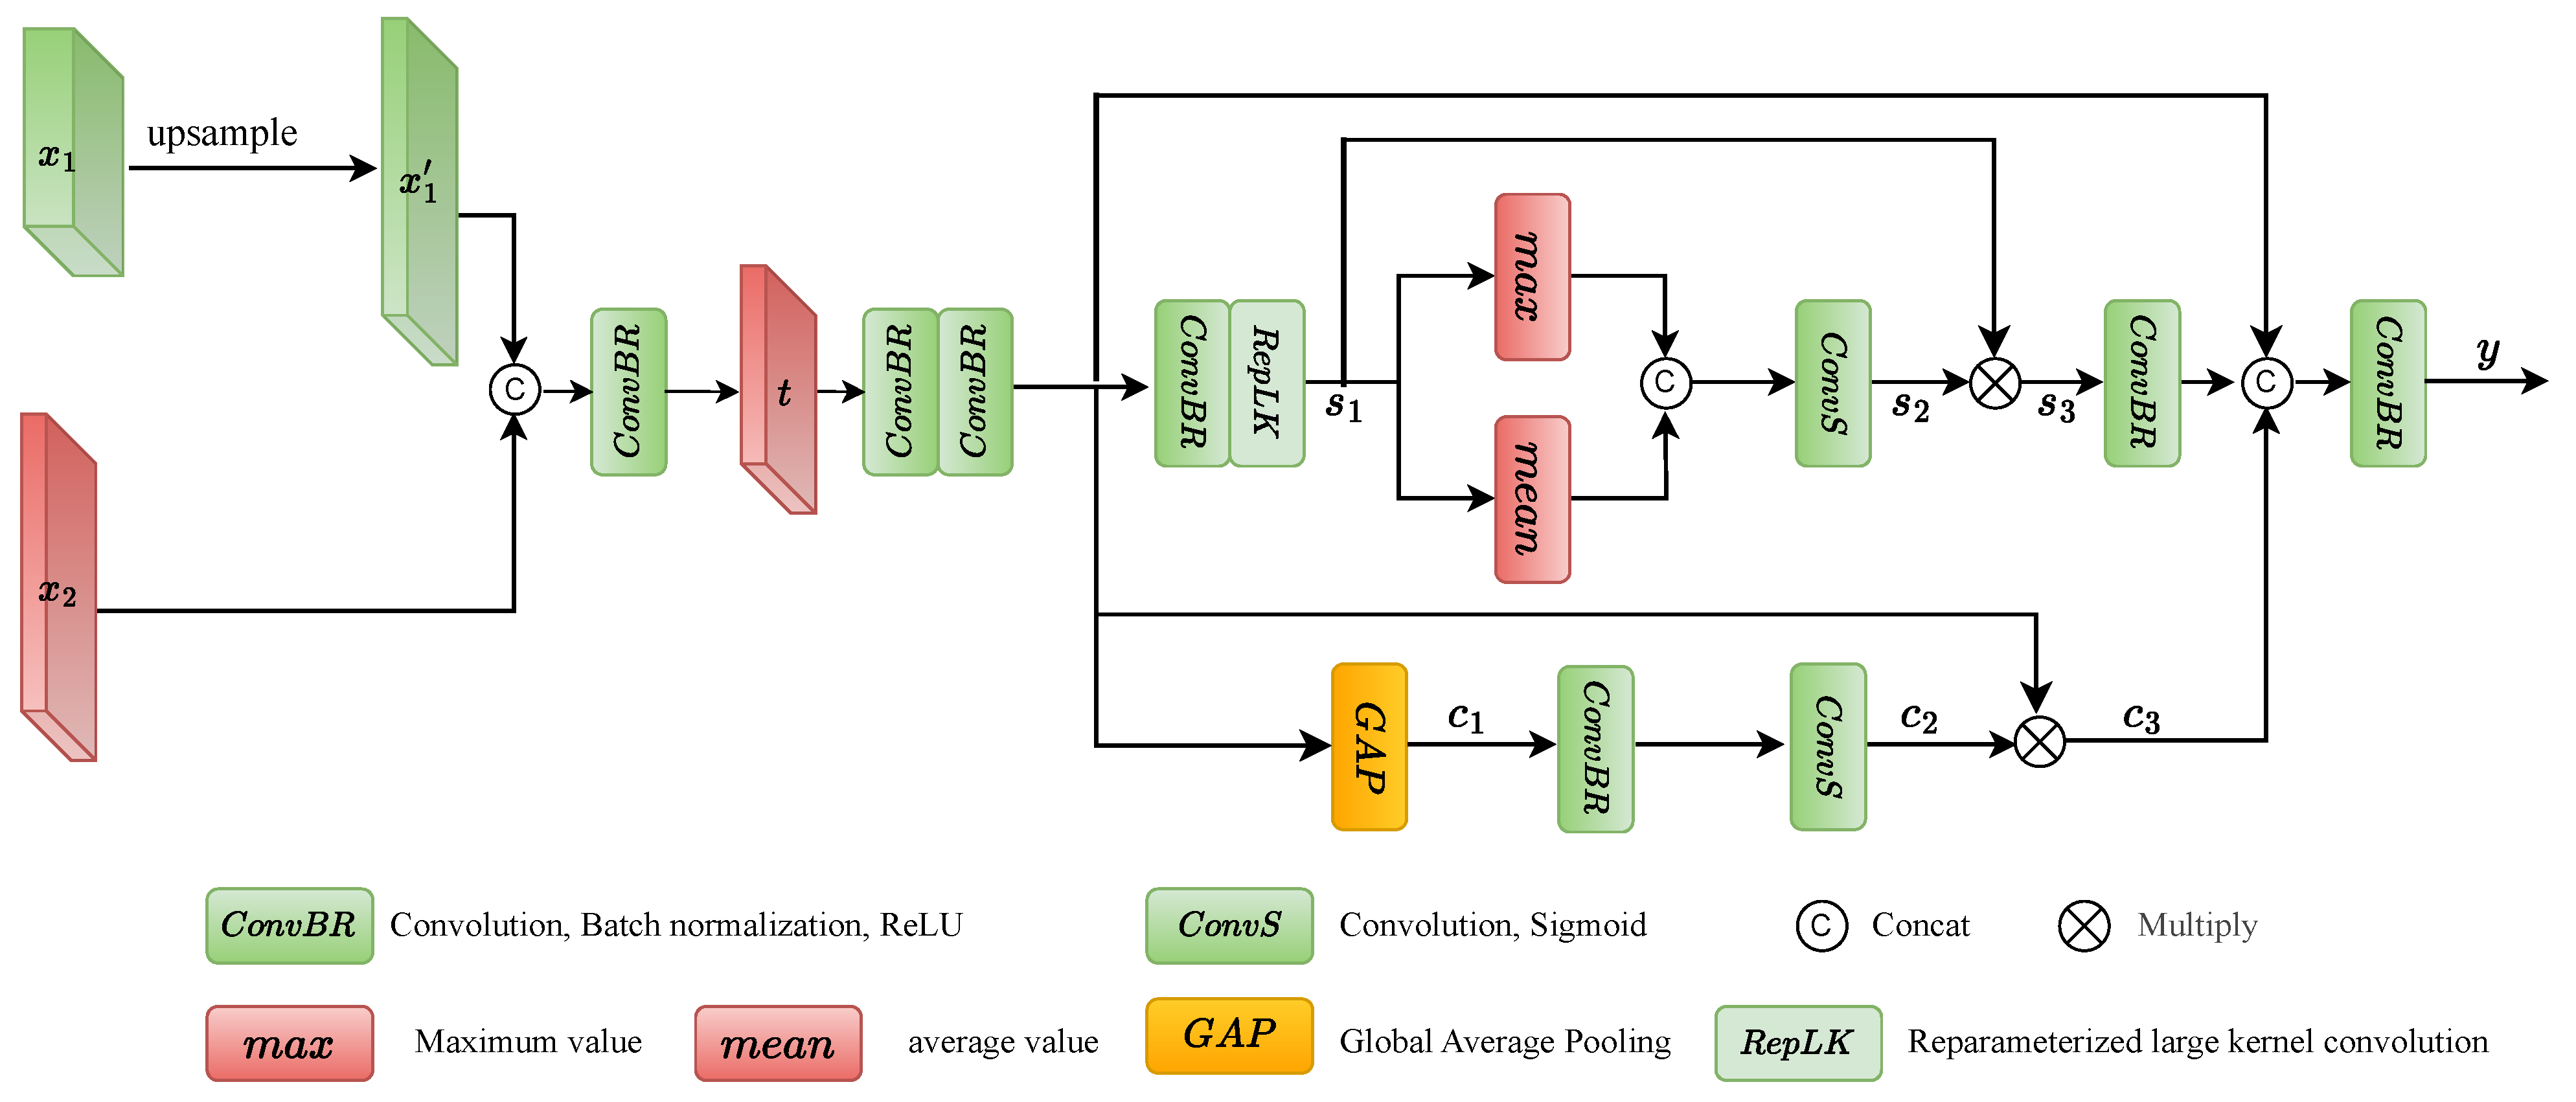
- CD-LKAFM: A cross-dimensional module in the feature recovery phase that further integrates global and local change features, effectively merging semantic and spatial information.
2. Related Work
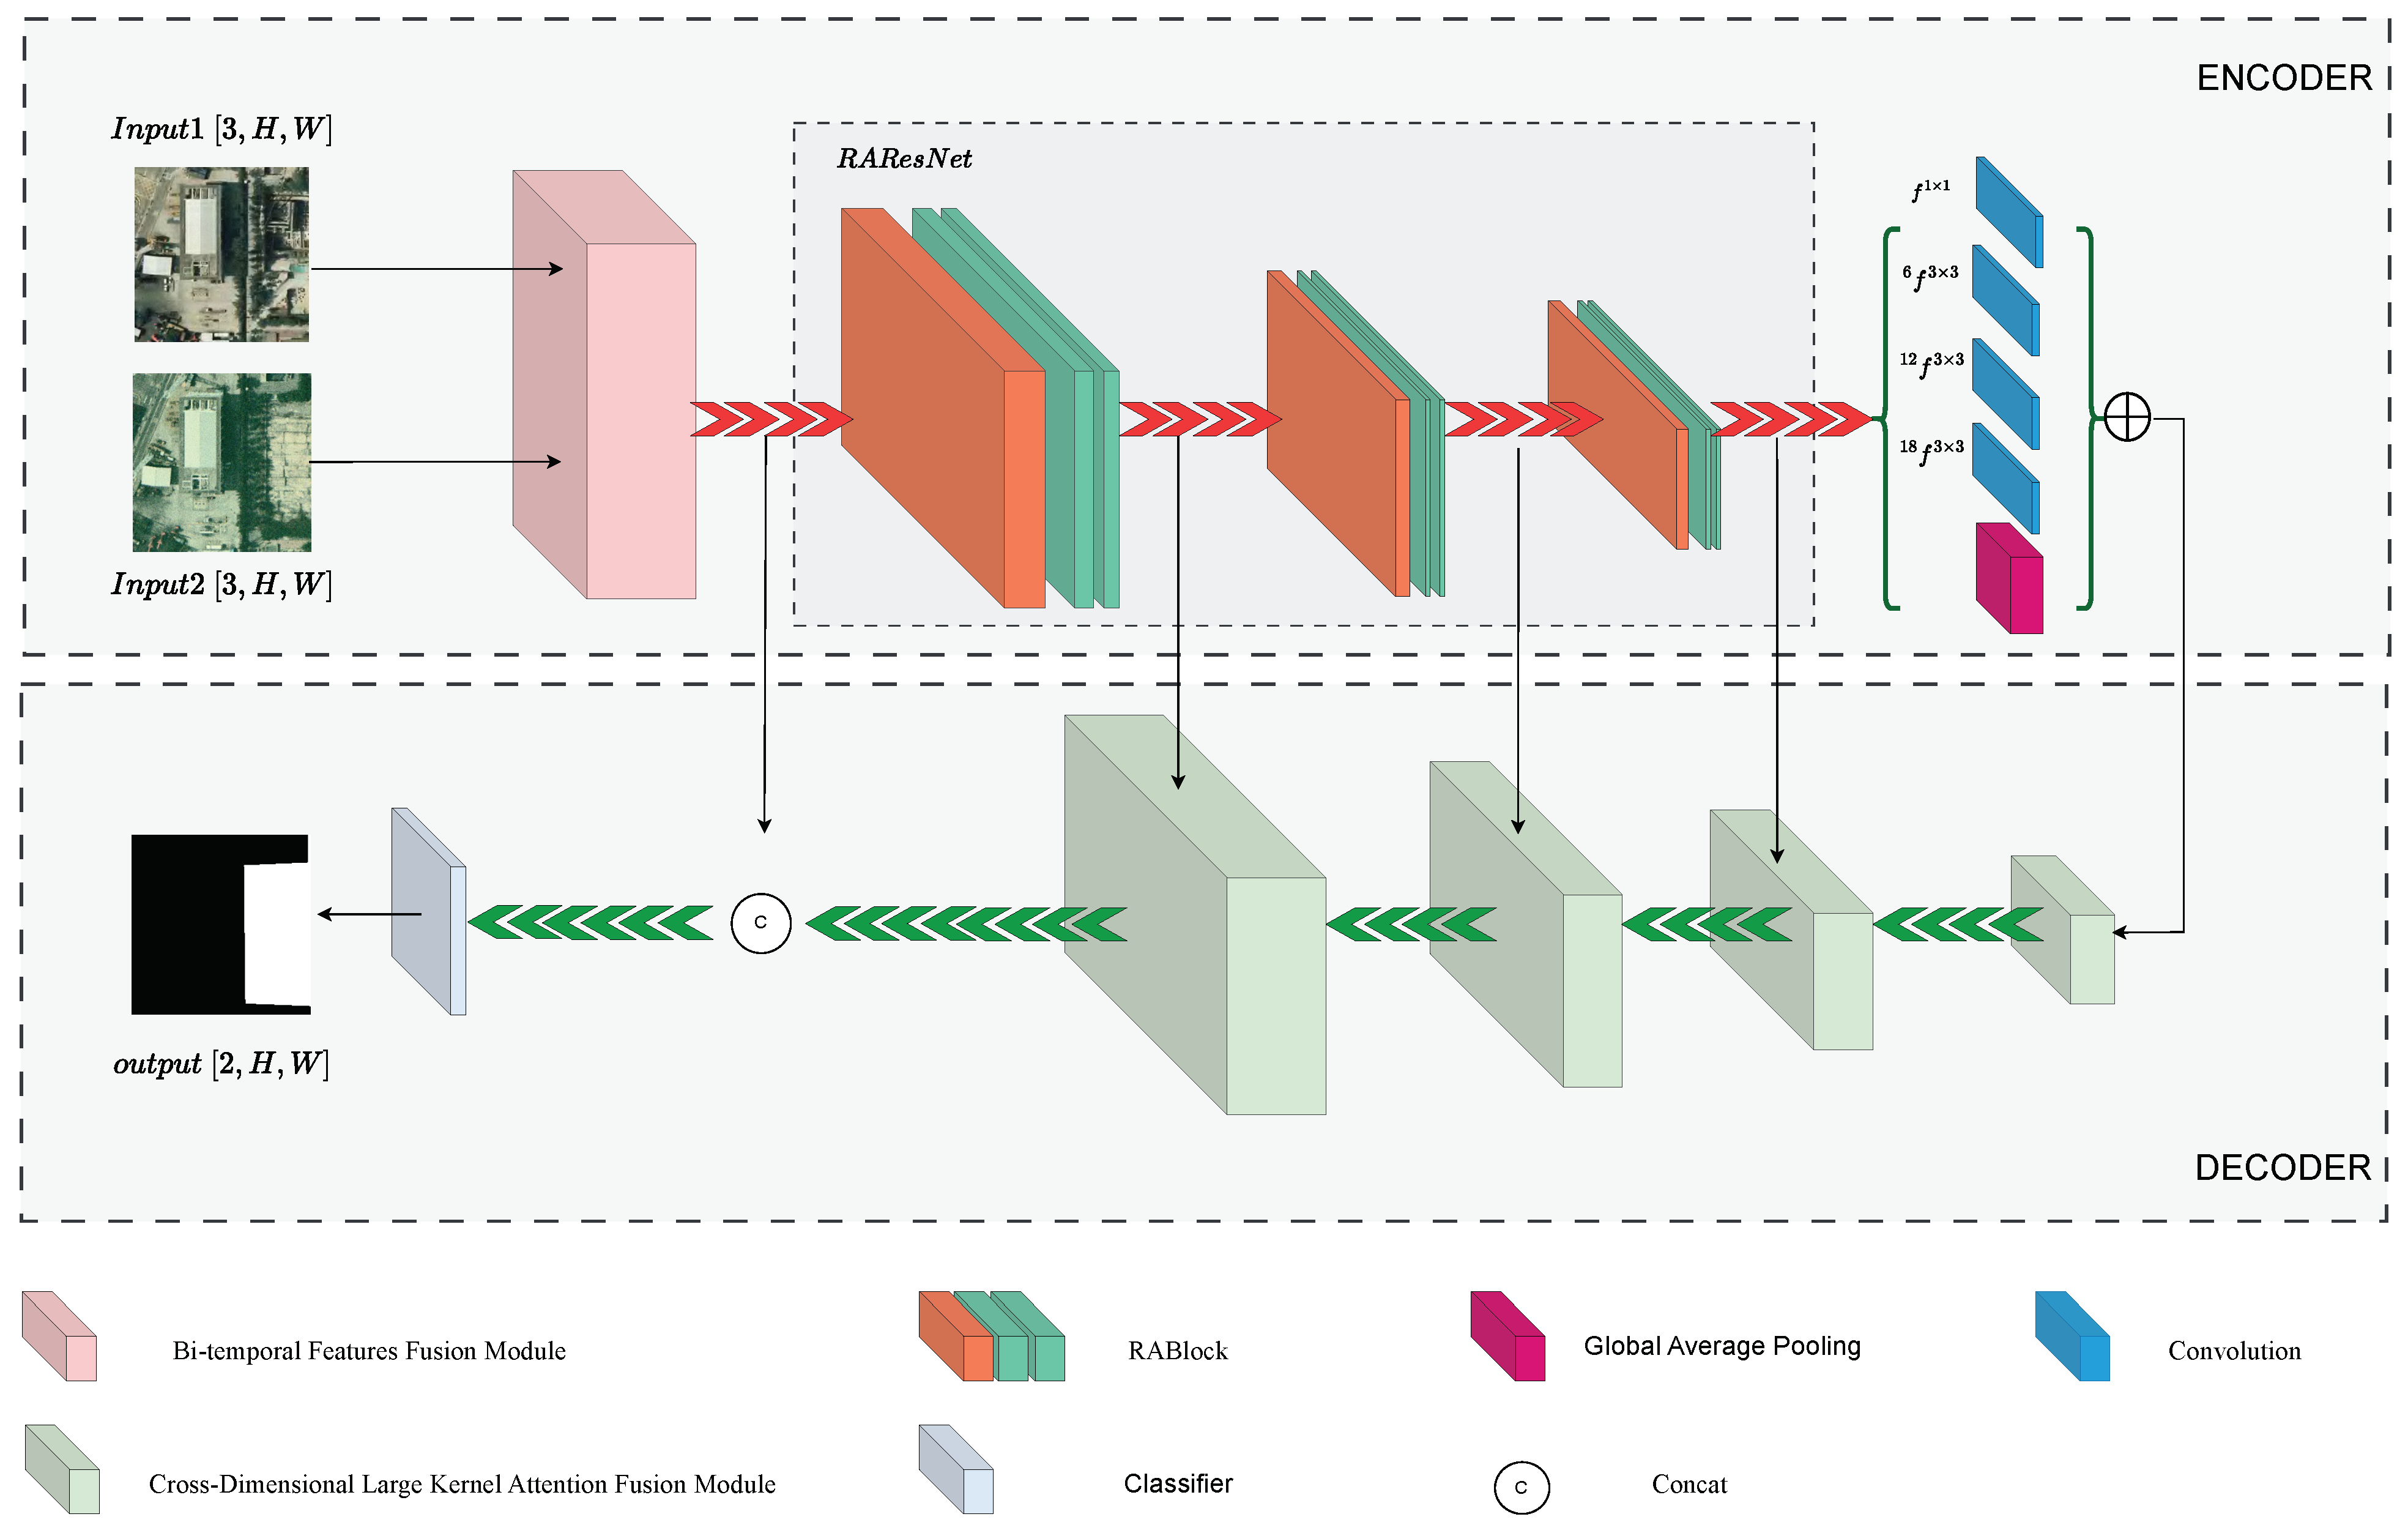
3. Model Overview
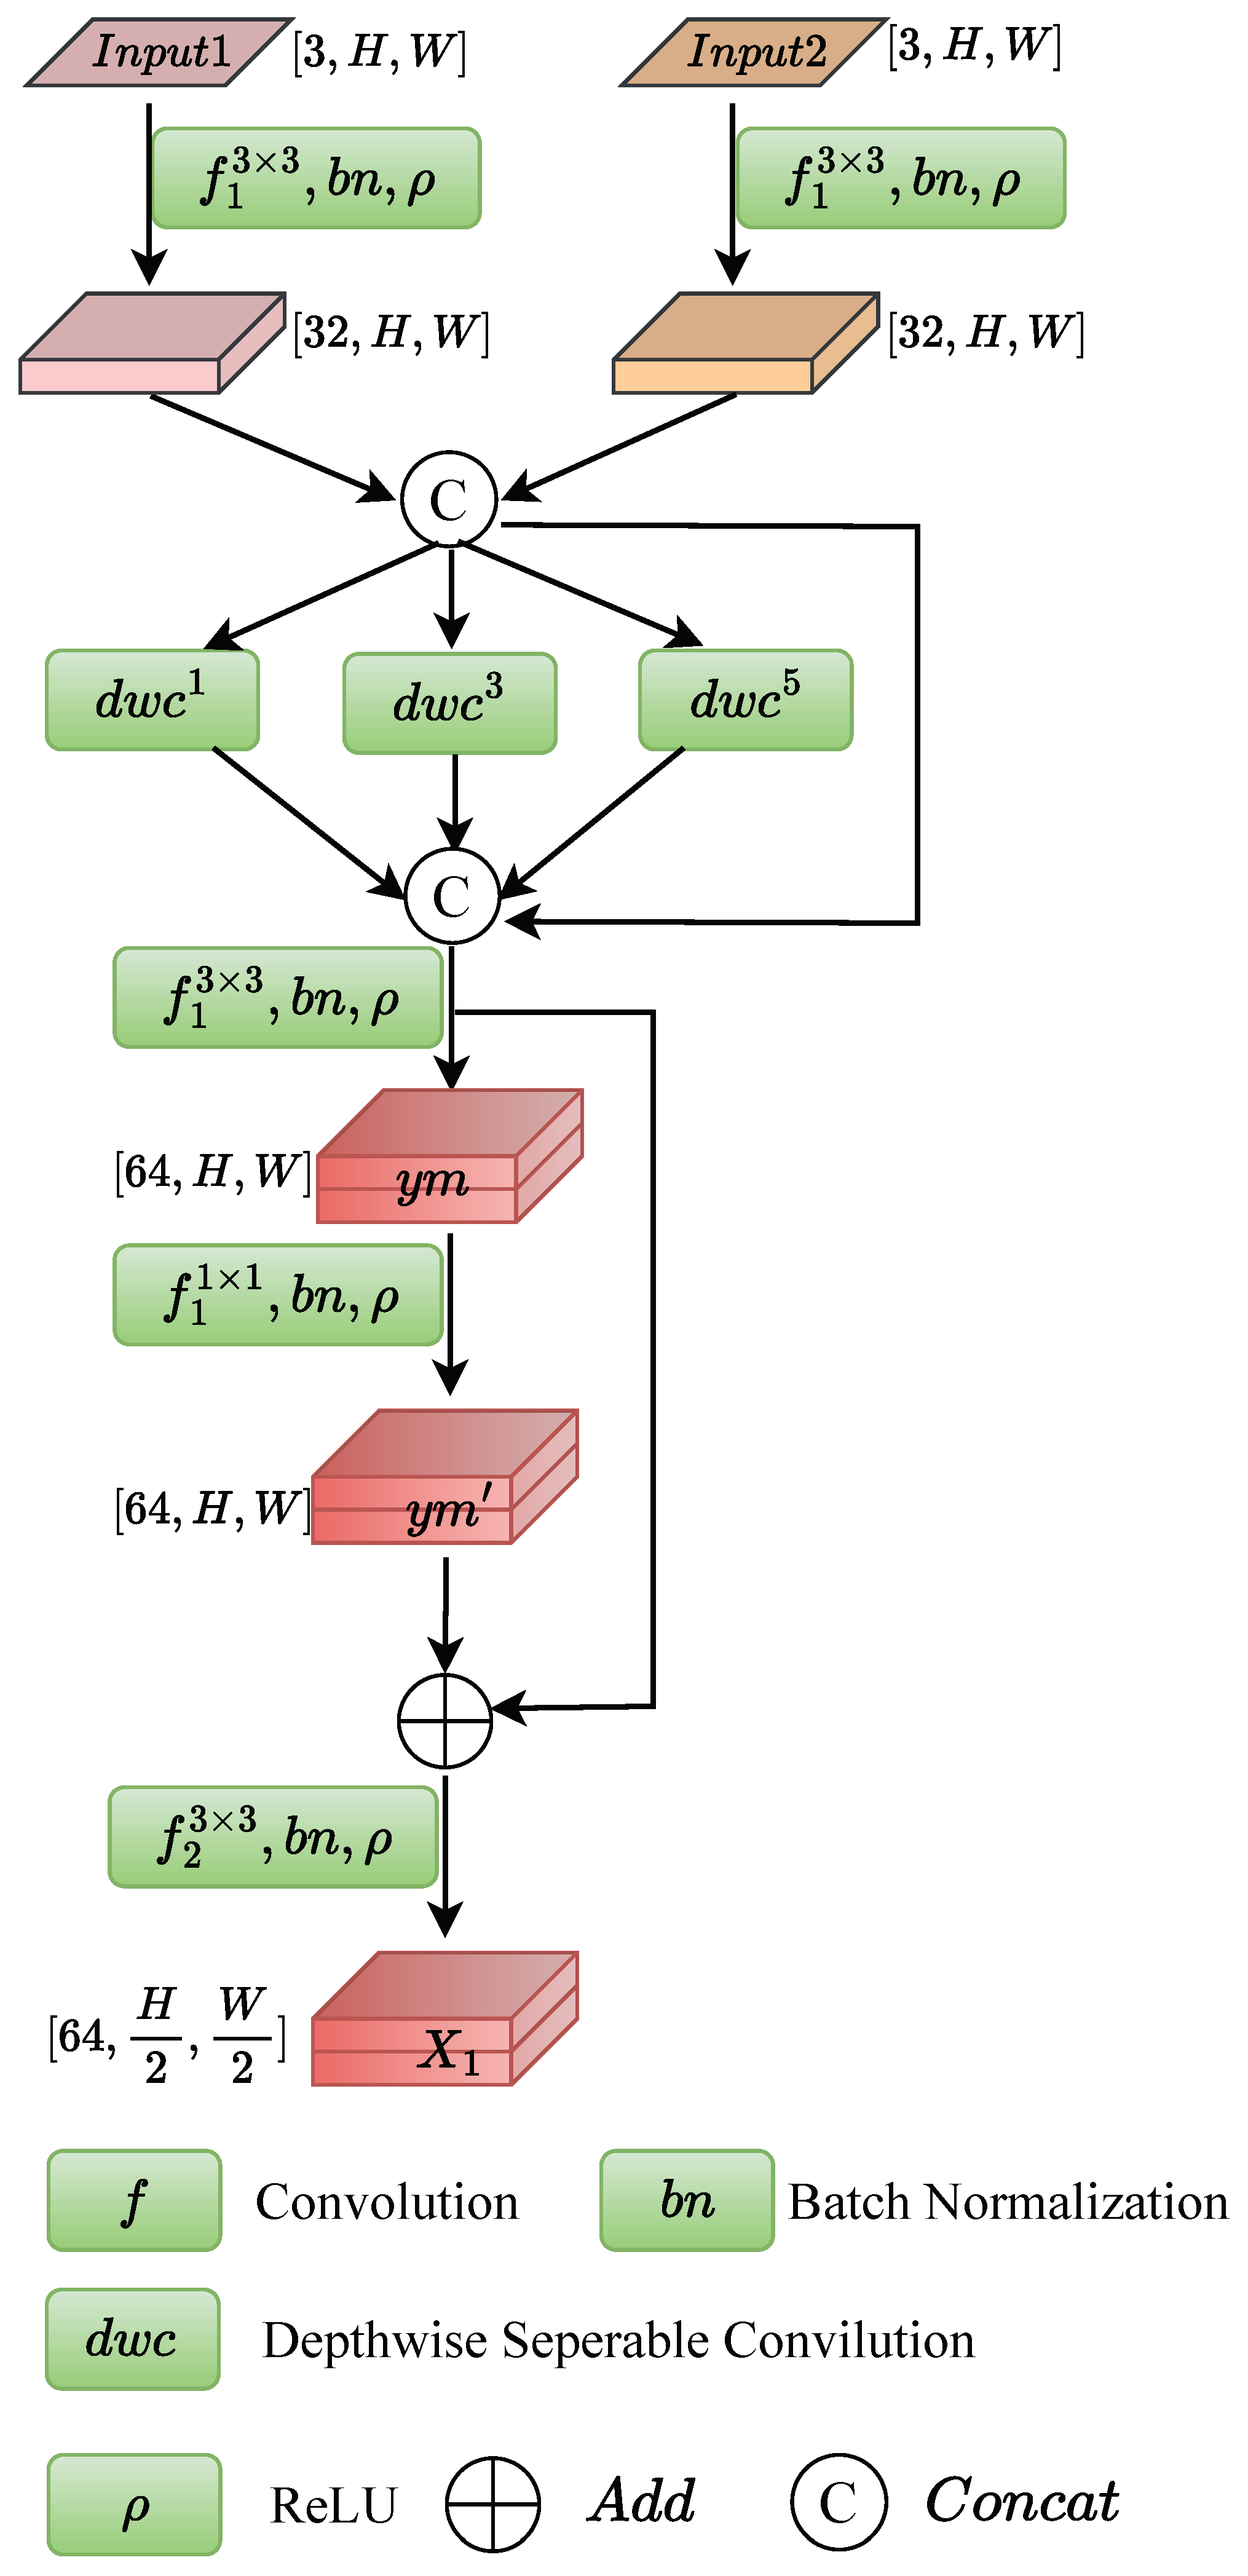
3.1. Bi-Temporal Feature Fusion Module
3.2. ReLK-Attention ResNet
3.3. Cross-Dimensional Large-Kernel Attention Fusion Module
4. Experimental Setup
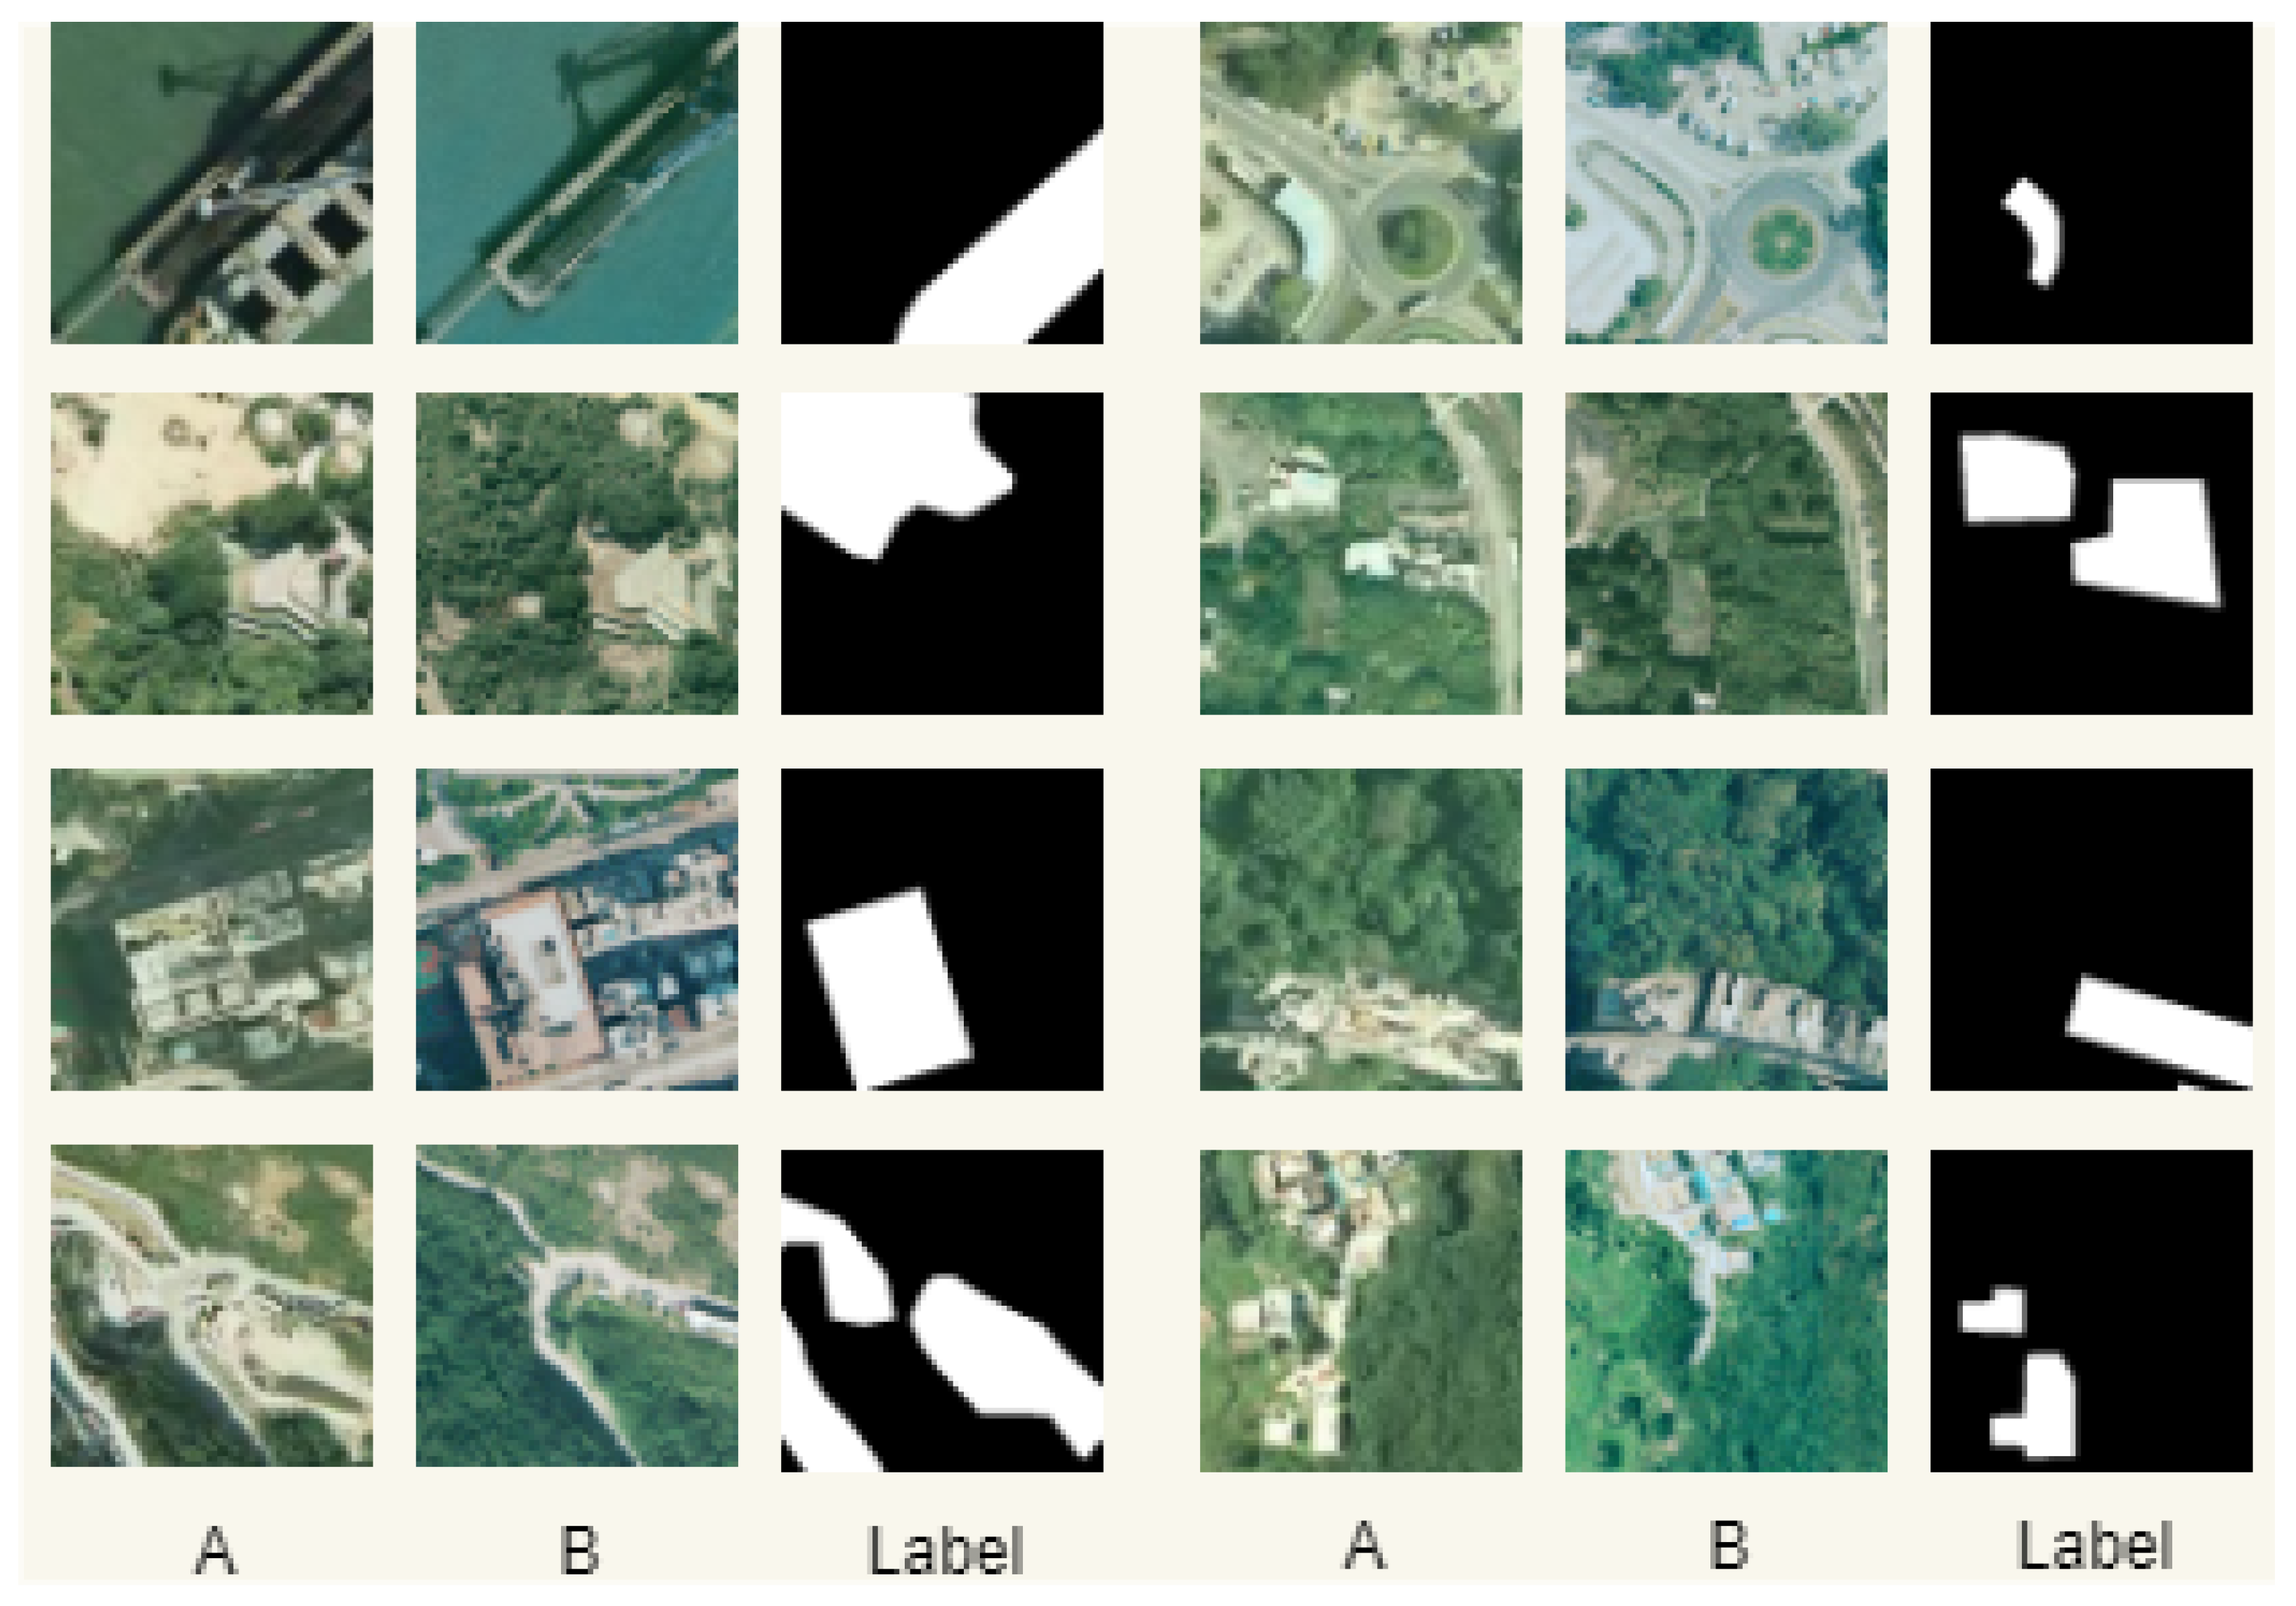
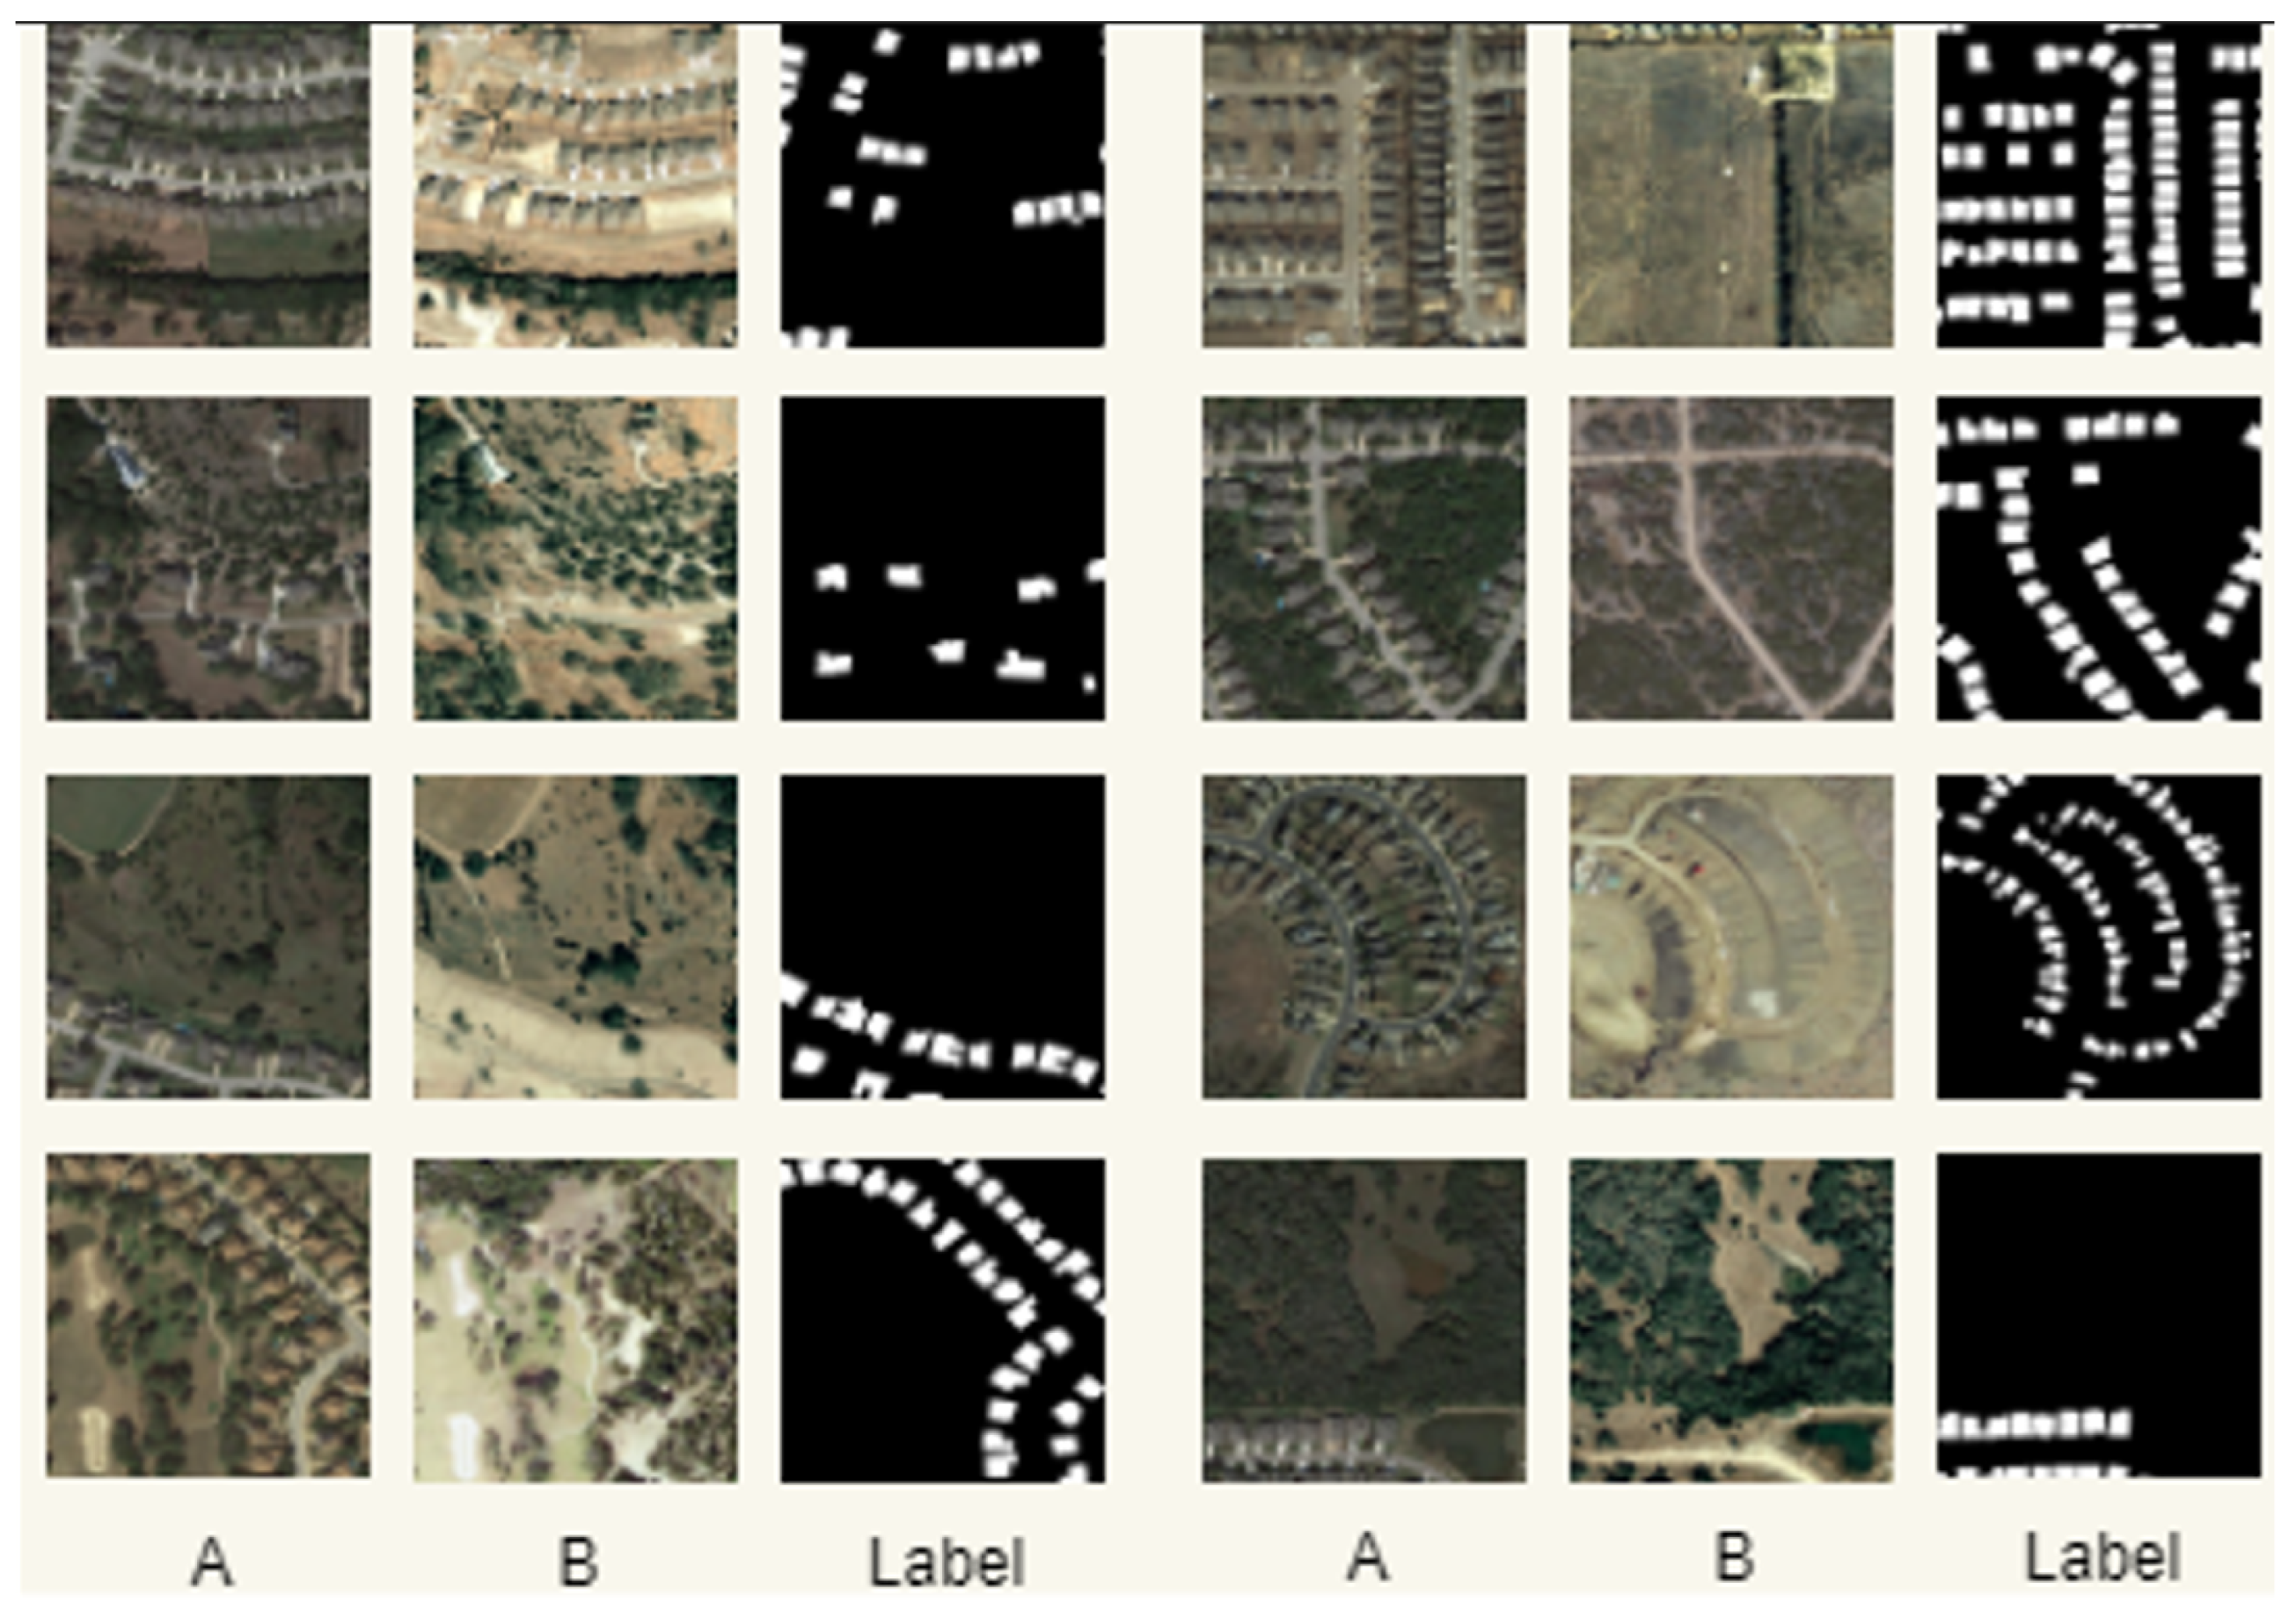
4.1. Dataset Introduction
4.2. Experimental Setting and Metrics
4.3. Ablation Experiments and Result Analysis
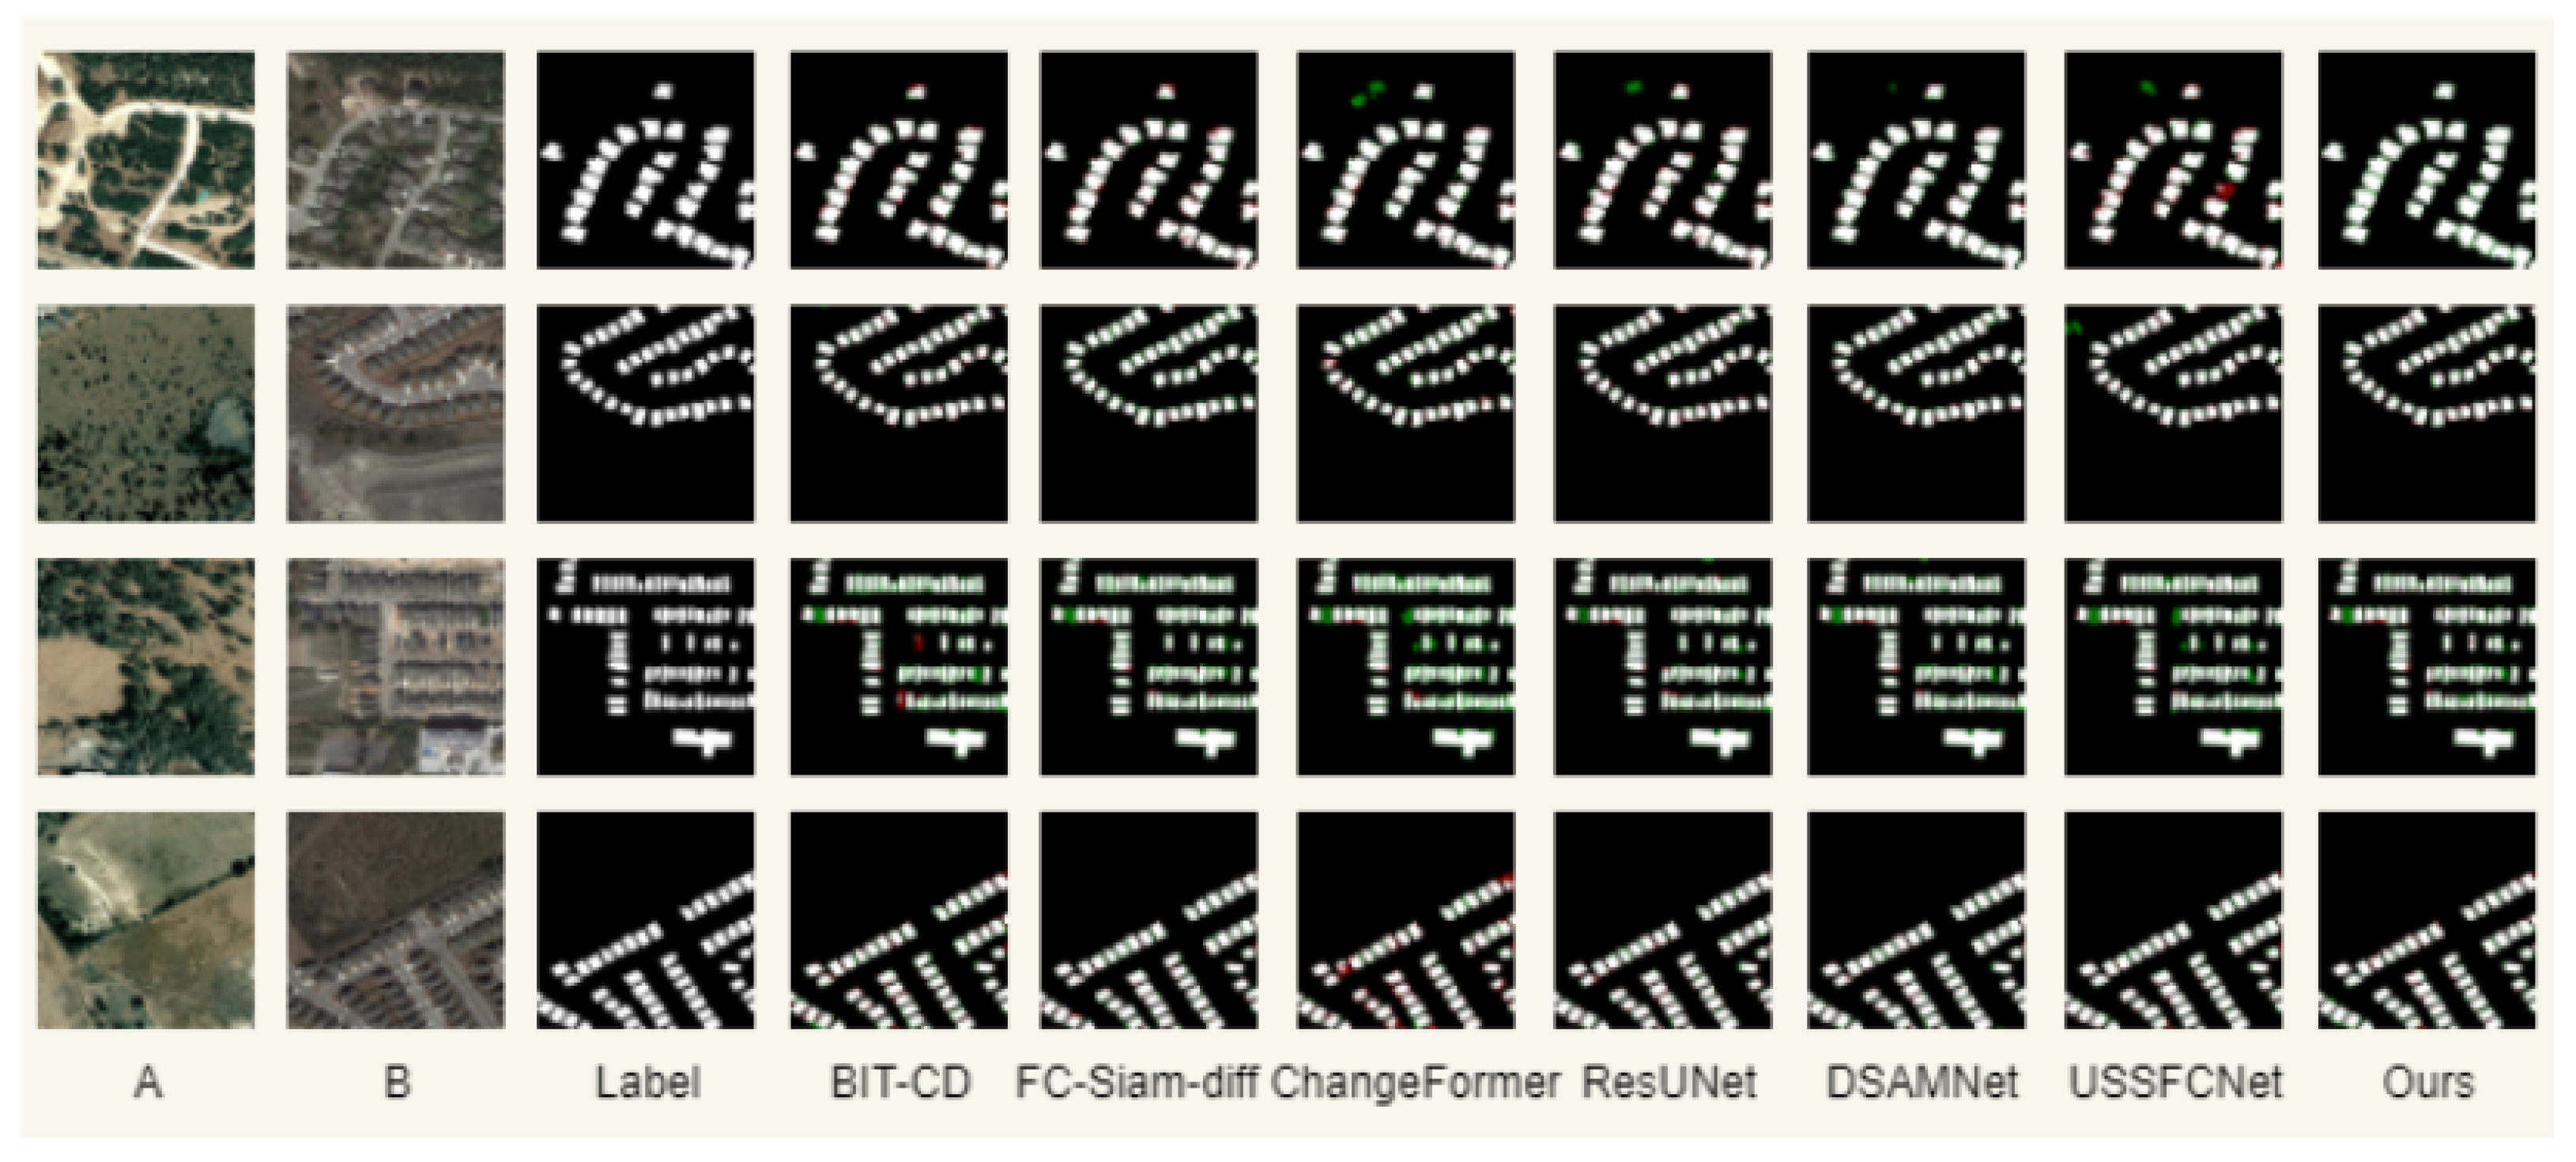
4.4. Comparative Experiment and Result Analysis
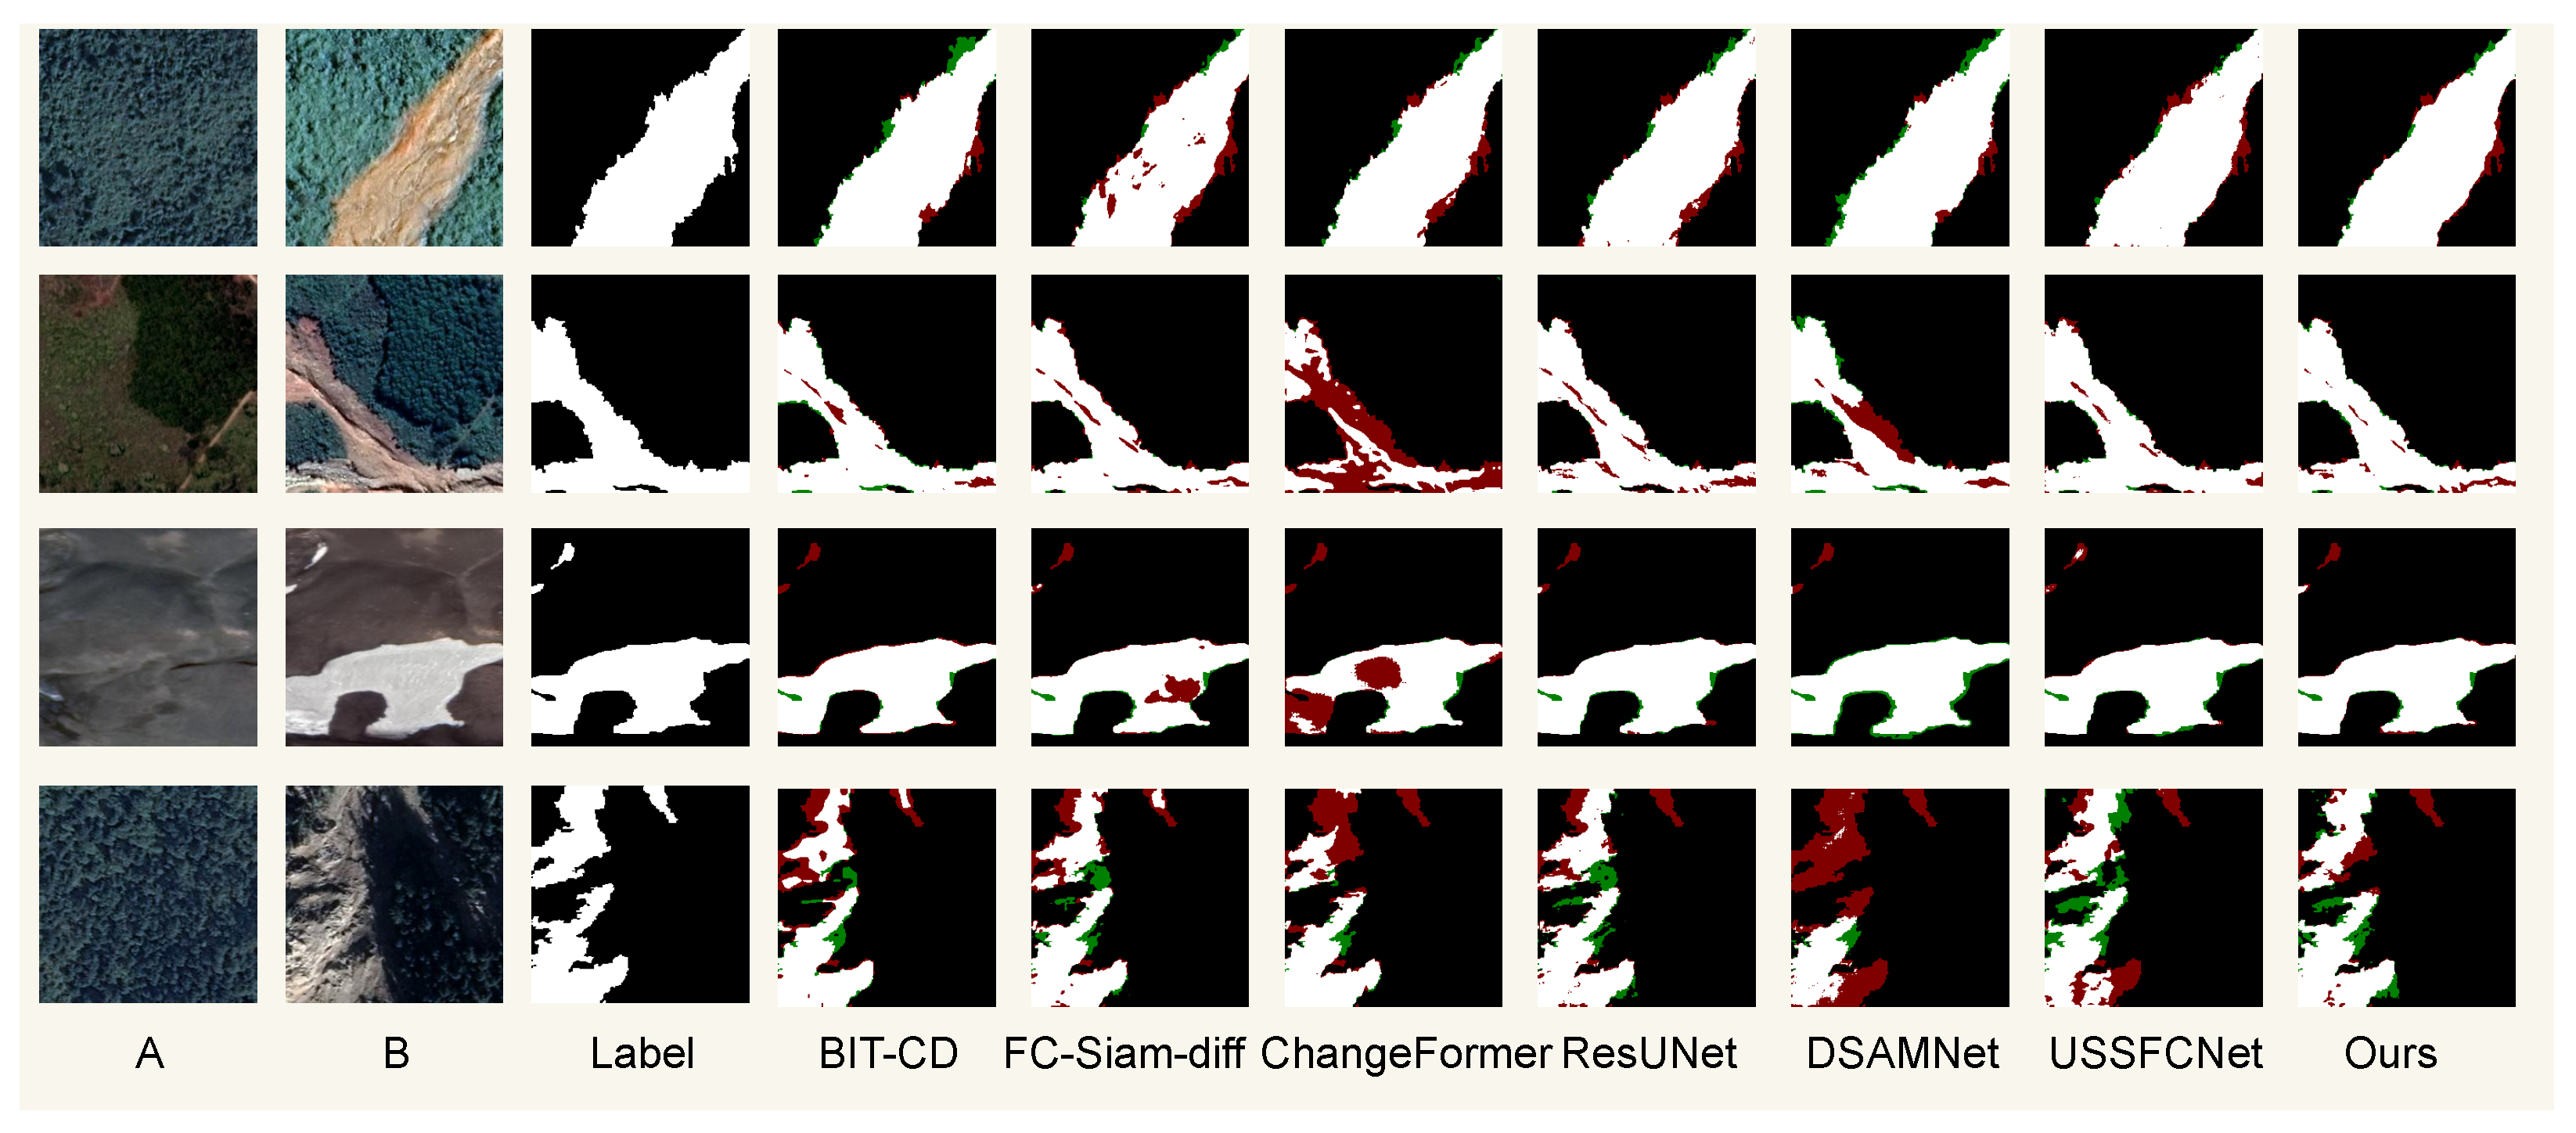
4.4.1. Comparisons on GVLM
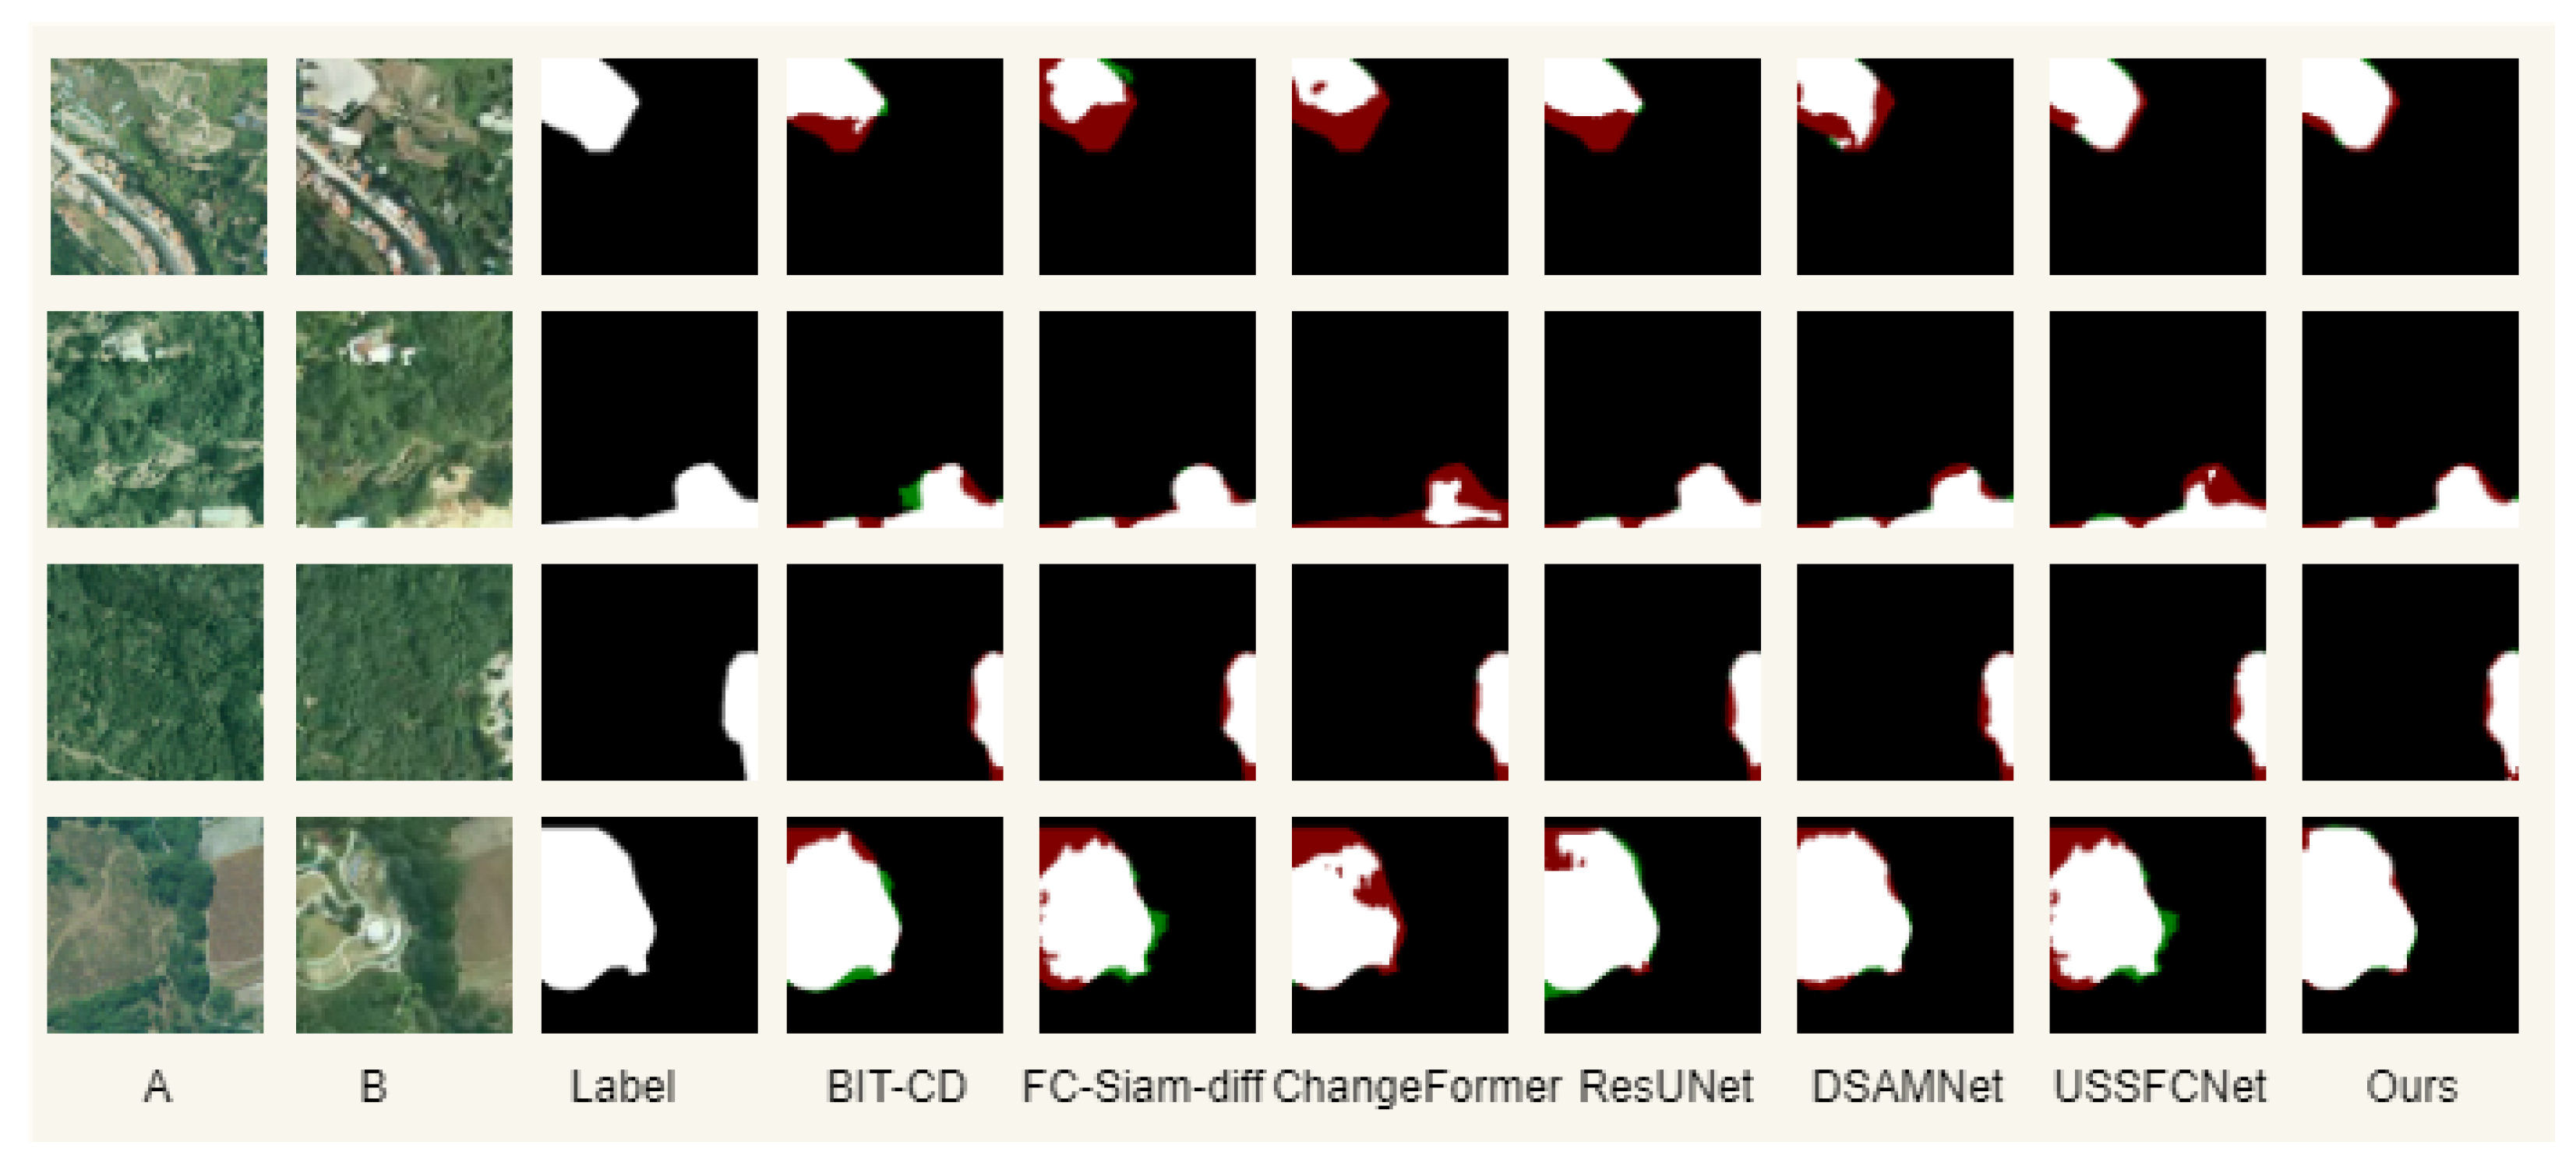
4.4.2. Comparisons on SYSU
4.4.3. Comparisons on LEVIR
5. Conclusions
Author Contributions
Funding
Data Availability Statement
Conflicts of Interest
References
- Carlotto, M.J. Detection and analysis of change in remotely sensed imagery with application to wide area surveillance. IEEE Trans. Image Process. 1997, 6, 189–202. [Google Scholar] [CrossRef]
- Treitz, P.; Rogan, J. Remote sensing for mapping and monitoring land-cover and land-use change—An introduction. Prog. Plan. 2004, 61, 269–279. [Google Scholar] [CrossRef]
- Blaschke, T.; Hay, G.J.; Kelly, M.; Lang, S.; Hofmann, P.; Addink, E.; Feitosa, R.Q.; Van der Meer, F.; Van der Werff, H.; Van Coillie, F.; et al. Geographic object-based image analysis–towards a new paradigm. ISPRS J. Photogramm. Remote Sens. 2014, 87, 180–191. [Google Scholar] [CrossRef] [PubMed]
- Hussain, M.; Chen, D.; Cheng, A.; Wei, H.; Stanley, D. Change detection from remotely sensed images: From pixel-based to object-based approaches. ISPRS J. Photogramm. Remote Sens. 2013, 80, 91–106. [Google Scholar] [CrossRef]
- Feng, Y.; Jiang, J.; Xu, H.; Zheng, J. Change detection on remote sensing images using dual-branch multilevel intertemporal network. IEEE Trans. Geosci. Remote Sens. 2023, 61, 1–15. [Google Scholar] [CrossRef]
- Lin, M.; Yang, G.; Zhang, H. Transition is a process: Pair-to-video change detection networks for very high resolution remote sensing images. IEEE Trans. Image Process. 2022, 32, 57–71. [Google Scholar] [CrossRef] [PubMed]
- Daudt, R.C.; Le Saux, B.; Boulch, A. Fully convolutional siamese networks for change detection. In Proceedings of the 2018 25th IEEE International Conference on Image Processing (ICIP), Athens, Greece, 7–10 October 2018; IEEE: Piscataway, NJ, USA, 2018; pp. 4063–4067. [Google Scholar]
- He, K.; Zhang, X.; Ren, S.; Sun, J. Deep residual learning for image recognition. In Proceedings of the IEEE Conference on Computer Vision and Pattern Recognition, Las Vegas, NV, USA, 27–30 June 2016; pp. 770–778. [Google Scholar]
- Huang, G.; Liu, Z.; Van Der Maaten, L.; Weinberger, K.Q. Densely connected convolutional networks. In Proceedings of the IEEE Conference on Computer Vision and Pattern Recognition, Honolulu, HI, USA, 21–26 July 2017; pp. 4700–4708. [Google Scholar]
- Zhu, S.; Song, Y.; Zhang, Y.; Zhang, Y. ECFNet: A Siamese network with fewer FPs and fewer FNs for change detection of remote-sensing images. IEEE Geosci. Remote Sens. Lett. 2023, 20, 1–5. [Google Scholar] [CrossRef]
- Fang, S.; Li, K.; Shao, J.; Li, Z. SNUNet-CD: A densely connected Siamese network for change detection of VHR images. IEEE Geosci. Remote Sens. Lett. 2021, 19, 1–5. [Google Scholar] [CrossRef]
- Liu, M.; Shi, Q. DSAMNet: A deeply supervised attention metric based network for change detection of high-resolution images. In Proceedings of the 2021 IEEE International Geoscience and Remote Sensing Symposium IGARSS, Brussels, Belgium, 11–16 July 2021; IEEE: Piscataway, NJ, USA, 2021; pp. 6159–6162. [Google Scholar]
- Jin, W.D.; Xu, J.; Han, Q.; Zhang, Y.; Cheng, M.M. CDNet: Complementary depth network for RGB-D salient object detection. IEEE Trans. Image Process. 2021, 30, 3376–3390. [Google Scholar] [CrossRef] [PubMed]
- Huang, J.; Yuan, X.; Lam, C.T.; Huang, G. F3Net: Feature Filtering Fusing Network for Change Detection of Remote Sensing Images. IEEE J. Sel. Top. Appl. Earth Obs. Remote Sens. 2024, 17, 10621–10635. [Google Scholar] [CrossRef]
- Han, K.; Wang, Y.; Chen, H.; Chen, X.; Guo, J.; Liu, Z.; Tang, Y.; Xiao, A.; Xu, C.; Xu, Y.; et al. A survey on vision transformer. IEEE Trans. Pattern Anal. Mach. Intell. 2022, 45, 87–110. [Google Scholar] [CrossRef] [PubMed]
- Bandara, W.G.C.; Patel, V.M. A Transformer-Based Siamese Network for Change Detection. In Proceedings of the IGARSS 2022—2022 IEEE International Geoscience and Remote Sensing Symposium, Kuala Lumpur, Malaysia, 17–22 July 2022; pp. 207–210. [Google Scholar] [CrossRef]
- Chen, H.; Qi, Z.; Shi, Z. Remote sensing image change detection with transformers. IEEE Trans. Geosci. Remote Sens. 2021, 60, 1–14. [Google Scholar] [CrossRef]
- Zhang, C.; Wang, L.; Cheng, S.; Li, Y. SwinSUNet: Pure transformer network for remote sensing image change detection. IEEE Trans. Geosci. Remote Sens. 2022, 60, 1–13. [Google Scholar] [CrossRef]
- Sun, Y.; Dai, D.; Zhang, Q.; Wang, Y.; Xu, S.; Lian, C. MSCA-Net: Multi-scale contextual attention network for skin lesion segmentation. Pattern Recognit. 2023, 139, 109524. [Google Scholar] [CrossRef]
- Feng, Y.; Xu, H.; Jiang, J.; Liu, H.; Zheng, J. ICIF-Net: Intra-scale cross-interaction and inter-scale feature fusion network for bitemporal remote sensing images change detection. IEEE Trans. Geosci. Remote Sens. 2022, 60, 1–13. [Google Scholar] [CrossRef]
- Song, L.; Xia, M.; Weng, L.; Lin, H.; Qian, M.; Chen, B. Axial cross attention meets CNN: Bibranch fusion network for change detection. IEEE J. Sel. Top. Appl. Earth Obs. Remote Sens. 2022, 16, 21–32. [Google Scholar] [CrossRef]
- Cheng, D.; Liao, R.; Fidler, S.; Urtasun, R. Darnet: Deep active ray network for building segmentation. In Proceedings of the IEEE/CVF Conference on Computer Vision and Pattern Recognition, Long Beach, CA, USA, 15–20 June 2019; pp. 7431–7439. [Google Scholar]
- Liu, Y.; Wang, K.; Li, M.; Huang, Y.; Yang, G. A Position-Temporal Awareness Transformer for Remote Sensing Change Detection. IEEE Trans. Geosci. Remote Sens. 2024, 62, 1–14. [Google Scholar] [CrossRef]
- Feng, J.; Yang, X.; Gu, Z.; Zeng, M.; Zheng, W. SMBCNet: A Transformer-Based Approach for Change Detection in Remote Sensing Images through Semantic Segmentation. Remote Sens. 2023, 15, 3566. [Google Scholar] [CrossRef]
- Yu, W.; Zhou, P.; Yan, S.; Wang, X. Inceptionnext: When inception meets convnext. In Proceedings of the IEEE/CVF Conference on Computer Vision and Pattern Recognition, Seattle, WA, USA, 16–22 June 2024; pp. 5672–5683. [Google Scholar]
- Ding, X.; Zhang, X.; Han, J.; Ding, G. Scaling up your kernels to 31x31: Revisiting large kernel design in cnns. In Proceedings of the IEEE/CVF Conference on Computer Vision and Pattern Recognition, New Orleans, LA, USA, 18–24 June 2022; pp. 11963–11975. [Google Scholar]
- Ding, X.; Zhang, Y.; Ge, Y.; Zhao, S.; Song, L.; Yue, X.; Shan, Y. UniRepLKNet: A Universal Perception Large-Kernel ConvNet for Audio Video Point Cloud Time-Series and Image Recognition. In Proceedings of the IEEE/CVF Conference on Computer Vision and Pattern Recognition, Seattle, WA, USA, 16–22 June 2024; pp. 5513–5524. [Google Scholar]
- Libiao, J.; Wenchao, Z.; Changyu, L.; Zheng, W. Semantic segmentation based on DeeplabV3+ with multiple fusions of low-level features. In Proceedings of the 2021 IEEE 5th Advanced Information Technology, Electronic and Automation Control Conference (IAEAC), Chongqing, China, 12–14 March 2021; IEEE: Piscataway, NJ, USA, 2021; pp. 1957–1963. [Google Scholar]
- Zhang, X.; Yu, W.; Pun, M.O.; Shi, W. Cross-domain landslide mapping from large-scale remote sensing images using prototype-guided domain-aware progressive representation learning. ISPRS J. Photogramm. Remote Sens. 2023, 197, 1–17. [Google Scholar] [CrossRef]
- Shi, Q.; Liu, M.; Li, S.; Liu, X.; Wang, F.; Zhang, L. A Deeply Supervised Attention Metric-Based Network and an Open Aerial Image Dataset for Remote Sensing Change Detection. IEEE Trans. Geosci. Remote Sens. 2021, 60, 1–16. [Google Scholar] [CrossRef]
- Chen, H.; Shi, Z. A Spatial-Temporal Attention-Based Method and a New Dataset for Remote Sensing Image Change Detection. Remote Sens. 2020, 12, 1662. [Google Scholar] [CrossRef]
- Cui, F.; Jiang, J. Shuffle-CDNet: A lightweight network for change detection of bitemporal remote-sensing images. Remote Sens. 2022, 14, 3548. [Google Scholar] [CrossRef]
- Diakogiannis, F.I.; Waldner, F.; Caccetta, P.; Wu, C. ResUNet-a: A deep learning framework for semantic segmentation of remotely sensed data. ISPRS J. Photogramm. Remote Sens. 2020, 162, 94–114. [Google Scholar] [CrossRef]
- Zhang, C.; Yue, P.; Tapete, D.; Jiang, L.; Shangguan, B.; Huang, L.; Liu, G. A deeply supervised image fusion network for change detection in high resolution bi-temporal remote sensing images. ISPRS J. Photogramm. Remote Sens. 2020, 166, 183–200. [Google Scholar] [CrossRef]
- Liu, Y.; Pang, C.; Zhan, Z.; Zhang, X.; Yang, X. Building change detection for remote sensing images using a dual-task constrained deep siamese convolutional network model. IEEE Geosci. Remote Sens. Lett. 2020, 18, 811–815. [Google Scholar] [CrossRef]
- Lei, T.; Geng, X.; Ning, H.; Lv, Z.; Gong, M.; Jin, Y.; Nandi, A.K. Ultralightweight spatial–spectral feature cooperation network for change detection in remote sensing images. IEEE Trans. Geosci. Remote Sens. 2023, 61, 1–14. [Google Scholar] [CrossRef]


| BFFM | RAResNet | CD-LKAF | Kappa | MIoU | MPA | F1 |
|---|---|---|---|---|---|---|
| × | ✓ | ✓ | 0.8469 | 0.8628 | 0.9764 | 0.914 |
| ✓ | × | ✓ | 0.8334 | 0.8439 | 0.9673 | 0.9067 |
| ✓ | ✓ | × | 0.8438 | 0.8574 | 0.9706 | 0.9127 |
| × | × | ✓ | 0.7942 | 0.8032 | 0.937 | 0.8964 |
| × | ✓ | × | 0.8026 | 0.8049 | 0.9393 | 0.8987 |
| ✓ | × | × | 0.7964 | 0.7855 | 0.9211 | 0.8856 |
| ✓ | ✓ | ✓ | 0.8538 | 0.8708 | 0.985 | 0.927 |
| BFFM | RAResNet | CD-LKAF | Kappa | MIoU | MPA | F1 |
|---|---|---|---|---|---|---|
| × | ✓ | ✓ | 0.6541 | 0.7129 | 0.8778 | 0.812 |
| ✓ | × | ✓ | 0.6097 | 0.6653 | 0.8545 | 0.7746 |
| ✓ | ✓ | × | 0.6439 | 0.6971 | 0.8758 | 0.7967 |
| × | × | ✓ | 0.5864 | 0.6416 | 0.8377 | 0.7532 |
| × | ✓ | × | 0.5973 | 0.6548 | 0.8464 | 0.7597 |
| ✓ | × | × | 0.5433 | 0.6299 | 0.8238 | 0.7479 |
| ✓ | ✓ | ✓ | 0.6842 | 0.738 | 0.8944 | 0.8422 |
| BFFM | RAResNet | CD-LKAF | Kappa | MIoU | MPA | F1 |
|---|---|---|---|---|---|---|
| × | ✓ | ✓ | 0.8671 | 0.8745 | 0.9769 | 0.9277 |
| ✓ | × | ✓ | 0.805 | 0.8162 | 0.9522 | 0.8869 |
| ✓ | ✓ | × | 0.8246 | 0.8411 | 0.9597 | 0.8935 |
| × | × | ✓ | 0.7758 | 0.7955 | 0.9279 | 0.8436 |
| × | ✓ | × | 0.7825 | 0.8064 | 0.9431 | 0.8546 |
| ✓ | × | × | 0.7547 | 0.7623 | 0.9173 | 0.8011 |
| ✓ | ✓ | ✓ | 0.9009 | 0.9092 | 0.9921 | 0.9505 |
| Methods | Kappa | MIoU | MPA | F1 | GFlops | Parameter (M) |
|---|---|---|---|---|---|---|
| BIT-CD [32] | 0.8133 | 0.8399 | 0.9806 | 0.9059 | 206.03 | 63.87 |
| FC-Siam-diff [7] | 0.7921 | 0.8286 | 0.9791 | 0.8989 | 97.64 | 40.19 |
| ChangeFormer [16] | 0.816 | 0.8428 | 0.9809 | 0.9087 | 202.79 | 61.03 |
| MSCANet [19] | 0.7711 | 0.8089 | 0.9739 | 0.8859 | 164.82 | 55.17 |
| DSIFNet [34] | 0.7539 | 0.7967 | 0.9692 | 0.8749 | 58.37 | 44.8 |
| DTCDSCNet [35] | 0.7801 | 0.818 | 0.9766 | 0.8897 | 182.67 | 56.36 |
| ICIFNet [20] | 0.8289 | 0.8522 | 0.9835 | 0.9094 | 138.58 | 49.87 |
| SNUNet [11] | 0.8118 | 0.8394 | 0.9815 | 0.9047 | 75.85 | 50.69 |
| ResUNet [33] | 0.8159 | 0.8439 | 0.9073 | 0.9099 | 62.29 | 49.72 |
| DSAMNet [12] | 0.7947 | 0.8261 | 0.9782 | 0.8982 | 145.32 | 52.86 |
| USSFCNet [36] | 0.8061 | 0.8351 | 0.979 | 0.9054 | 51.81 | 48.39 |
| FFLKCDNet (Ours) | 0.8538 | 0.8708 | 0.985 | 0.927 | 56.28 | 68.47 |
| Methods | Kappa | MIoU | MPA | F1 |
|---|---|---|---|---|
| BIT-CD | 0.6468 | 0.7132 | 0.8849 | 0.8238 |
| FC-Siam-diff | 0.6028 | 0.6845 | 0.8836 | 0.797 |
| ChangeFormer | 0.6177 | 0.6925 | 0.8738 | 0.8097 |
| MSCANet | 0.5962 | 0.6669 | 0.8679 | 0.7854 |
| DSIFNet | 0.6598 | 0.7219 | 0.8889 | 0.831 |
| DTCDSCNet | 0.5921 | 0.6822 | 0.8721 | 0.7962 |
| ICIFNet | 0.6651 | 0.7252 | 0.8892 | 0.8317 |
| SNUNet | 0.6391 | 0.7086 | 0.8819 | 0.8187 |
| ResUNet | 0.6521 | 0.716 | 0.8819 | 0.8274 |
| DSAMNet | 0.6779 | 0.7312 | 0.8833 | 0.8383 |
| USSFCNet | 0.6435 | 0.7089 | 0.8828 | 0.8228 |
| FFLKCDNet (Ours) | 0.6842 | 0.738 | 0.8944 | 0.8422 |
| Methods | Kappa | MIoU | MPA | F1 |
|---|---|---|---|---|
| BIT-CD | 0.8935 | 0.9033 | 0.9899 | 0.945 |
| FC-Siam-diff | 0.8772 | 0.8886 | 0.991 | 0.9388 |
| ChangeFormer | 0.8498 | 0.8673 | 0.9877 | 0.929 |
| MSCANet | 0.8024 | 0.8319 | 0.9816 | 0.901 |
| DSIFNet | 0.769 | 0.7581 | 0.9782 | 0.8287 |
| DTCDSCNet | 0.8259 | 0.8499 | 0.9842 | 0.9129 |
| ICIFNet | 0.885 | 0.8563 | 0.982 | 0.9295 |
| SNUNet | 0.8438 | 0.8628 | 0.9875 | 0.922 |
| ResUNet | 0.8959 | 0.908 | 0.9904 | 0.9517 |
| DSAMNet | 0.8501 | 0.8702 | 0.9859 | 0.9274 |
| USSFCNet | 0.8493 | 0.8688 | 0.9878 | 0.9282 |
| FFLKCDNet (Ours) | 0.9009 | 0.9092 | 0.9921 | 0.9505 |
Disclaimer/Publisher’s Note: The statements, opinions and data contained in all publications are solely those of the individual author(s) and contributor(s) and not of MDPI and/or the editor(s). MDPI and/or the editor(s) disclaim responsibility for any injury to people or property resulting from any ideas, methods, instructions or products referred to in the content. |
© 2025 by the authors. Licensee MDPI, Basel, Switzerland. This article is an open access article distributed under the terms and conditions of the Creative Commons Attribution (CC BY) license (https://creativecommons.org/licenses/by/4.0/).
Share and Cite
Chen, B.; Wang, Y.; Yang, X.; Yuan, X.; Im, S.K. FFLKCDNet: First Fusion Large-Kernel Change Detection Network for High-Resolution Remote Sensing Images. Remote Sens. 2025, 17, 824. https://doi.org/10.3390/rs17050824
Chen B, Wang Y, Yang X, Yuan X, Im SK. FFLKCDNet: First Fusion Large-Kernel Change Detection Network for High-Resolution Remote Sensing Images. Remote Sensing. 2025; 17(5):824. https://doi.org/10.3390/rs17050824
Chicago/Turabian StyleChen, Bochao, Yapeng Wang, Xu Yang, Xiaochen Yuan, and Sio Kei Im. 2025. "FFLKCDNet: First Fusion Large-Kernel Change Detection Network for High-Resolution Remote Sensing Images" Remote Sensing 17, no. 5: 824. https://doi.org/10.3390/rs17050824
APA StyleChen, B., Wang, Y., Yang, X., Yuan, X., & Im, S. K. (2025). FFLKCDNet: First Fusion Large-Kernel Change Detection Network for High-Resolution Remote Sensing Images. Remote Sensing, 17(5), 824. https://doi.org/10.3390/rs17050824