Article

U-MGA: A Multi-Module Unet Optimized with Multi-Scale Global Attention Mechanisms for Fine-Grained Segmentation of Cultivated Areas

1
University of Chinese Academy of Sciences, Beijing 100112, China
2
Aerospace Information Research Institute, Chinese Academy of Sciences, Beijing 100112, China
3
Shanghai Aerospace Control Technology Institute, Shanghai 201109, China
4
School of Earth Sciences and Engineering, Hohai University, Nanjing 211100, China
*
Author to whom correspondence should be addressed.
Remote Sens. 2025, 17(5), 760; https://doi.org/10.3390/rs17050760
Submission received: 15 January 2025 / Revised: 19 February 2025 / Accepted: 20 February 2025 / Published: 22 February 2025

Abstract

:
Arable land is fundamental to agricultural production and a crucial component of ecosystems. However, its complex texture and distribution in remote sensing images make it susceptible to interference from other land cover types, such as water bodies, roads, and buildings, complicating accurate identification. Building on previous research, this study proposes an efficient and lightweight CNN-based network, U-MGA, to address the challenges of feature similarity between arable and non-arable areas, insufficient fine-grained feature extraction, and the underutilization of multi-scale information. Specifically, a Multi-Scale Adaptive Segmentation (MSAS) is designed during the feature extraction phase to provide multi-scale and multi-feature information, supporting the model’s feature reconstruction stage. In the reconstruction phase, the introduction of the Multi-Scale Contextual Module (MCM) and Group Aggregation Bridge (GAB) significantly enhances the efficiency and accuracy of multi-scale and fine-grained feature utilization. The experiments conducted on an arable land dataset based on GF-2 imagery and a publicly available dataset show that U-MGA outperforms mainstream networks (Unet, A2FPN, Segformer, FTUnetformer, DCSwin, and TransUnet) across six evaluation metrics (Overall Accuracy (OA), Precision, Recall, F1-score, Intersection-over-Union (IoU), and Kappa coefficient). Thus, this study provides an efficient and precise solution for the arable land recognition task, which is of significant importance for agricultural resource monitoring and ecological environmental protection.

1. Introduction

Arable land is not only the foundation and guarantee of agricultural production but also the key to achieving food self-sufficiency. As an essential component of ecosystems, arable land plays a vital role in soil conservation, water retention, and biodiversity maintenance. In recent years, with the continuous advancement of urbanization and industrialization, arable land has been increasingly encroached upon by non-agricultural land uses and the cultivation of non-food crops. This encroachment not only disrupts ecological balance but also causes severe environmental damage, threatening agricultural production and ecosystem health [1,2]. Rapid and effective identification of the size of arable land not only provides critical decision-making support for government agencies in land protection but also offers effective assistance in addressing land-use conflicts [3,4].
Recent advancements in high-resolution remote sensing imagery for arable land identification can be summarized into three main stages: the initial stage focused on visual interpretation methods, the middle stage on spectral and texture-based analysis, and the later stage on object-oriented techniques.
Visual interpretation involves the interpreter directly observing or using auxiliary tools to comprehensively analyze the imaging characteristics of arable land [5], extracting land-use information in a human–machine interaction mode. This method offers high accuracy and wide applicability in terms of data types but is highly dependent on the interpreter’s expertise. For instance, Turker and Ozdarici [6], Yang et al. [7], and Tehrany et al. [8] applied visual interpretation using high-resolution remote sensing imagery (such as SPOT5, IKONOS, and QuickBird) to identify arable land in different regions. By integrating multi-source data and domain-specific knowledge, they achieved high identification accuracy, with average accuracies meeting the ideal levels required by the experiments. However, this method suffers from slow operation speed, low efficiency, and high labor costs, making it impractical for large-area, real-time image processing. For larger areas, by the time visual interpretation is completed, geographical conditions may have already changed due to seasonal variations, causing the results to no longer reflect the current state of the arable land [9,10,11].
Spectral and texture-based methods utilize high-resolution imagery to automatically extract the textural features of land cover through nonlinear functions, using these features as criteria for land classification. This approach significantly reduces the dependency on manual interpretation, becoming a research focus after visual interpretation methods [12]. For example, Zhang et al. [13], Bascoy et al. [14], and Zhu et al. [15] applied spectral-texture-based methods to extract arable land in various regions using high-resolution remote sensing imagery, describing land cover textures based on pixel values and their spatial distribution. This method is relatively objective and efficient, reducing reliance on human input. However, the method is mainly focused on spectral texture information, and its accuracy can be affected by factors such as topography, field surfaces, and built-up areas, which can lead to incomplete land cover identification. Furthermore, due to the model’s limited ability to process nonlinear data, high-precision segmentation is often unattainable for large arable land regions, meaning most research has focused on smaller areas.
Object-oriented machine learning methods, which consider multiple features such as geometry, spectrum, and texture, group similar pixel features by semantic segmentation and use these grouped basic units for image interpretation [16]. This method has become another research focus following spectral texture-based approaches. Object-oriented machine learning methods, with their strong classification performance and nonlinear fitting capabilities, are widely applied in high-precision arable land identification. Common algorithms include Support Vector Machine (SVM), K-Nearest Neighbors (KNN), and Random Forest (RF). However, it requires extensive manual design for classification tasks, including optimal feature selection and rule-based algorithm development, which heavily influences the final classification results. This design process requires specialized knowledge of the application domain, making it more difficult to apply across different research contexts. Additionally, object-oriented methods often produce fuzzy segmentation boundaries, particularly when land cover is complex, with multiple overlapping objects, and arable land has irregular shapes, leading to suboptimal classification outcomes [17,18].
Deep learning methods, which can automatically and rapidly extract deep abstract features that improve classification accuracy, simplify the image feature extraction process, and achieve higher classification precision [19], have emerged as another research hotspot in the field of arable land identification, following object-oriented machine learning methods [20]. Semantic segmentation algorithms based on deep learning can be divided into two phases: the Convolutional Neural Network (CNN) phase and the increasingly popular CNN-Transformer integrated phase [21].
Common classical CNN semantic segmentation models include U-Net [22], DeepLabV3+ [23], SegNet [24], DenseNet [25], and ResNet [26]. For example, Sun et al. [27] and Li et al. [28] used high-resolution remote sensing and SAR imagery to identify small-scale arable land regions, training and predicting with these models to obtain high-precision prediction maps under default model parameters. Although these methods improve recognition accuracy and automation to a certain extent, the prediction results still exhibit issues such as unclear boundaries and the misclassification of land features. This is because CNNs typically process the entire input data, treating each part equally [29]. However, in certain tasks, different regions of the input data have varying levels of influence on the output. In arable land imagery, the arable areas are the primary focus, while other regions constitute noise or irrelevant information. Typically, arable land occupies a small proportion of satellite imagery, leading CNN models to overemphasize background noise, thereby reducing the model’s performance in identifying arable land [30].
The attention mechanism overcomes this limitation by introducing a weighting allocation mechanism, enabling the model to selectively focus on different parts of the input data, thus mitigating the issue of equal treatment for all parts [31]. This approach has quickly gained popularity in semantic segmentation tasks. For instance, Zhang et al. [32] and Lv et al. [33] applied attention mechanisms in the backbone network for arable land recognition, obtaining prediction images with higher precision and Kappa coefficients. Due to the good performance of the attention mechanism, attention-based sequence-to-sequence learning models, such as the Transformer, have gradually matured [21].
The Transformer model, first introduced in 2017 for natural language processing tasks like machine translation [34], is entirely based on self-attention mechanisms and eliminates the convolutional layers typical of previous models. This allows it to efficiently capture long-range dependencies in sequential data. Through self-attention, the Transformer can directly calculate relationships between any two elements in a sequence, significantly enhancing its ability to handle long sequences.
In 2020, Google introduced the Vision Transformer (ViT), which applies the Transformer directly to image classification tasks [35]. ViT divides the input image into patches and treats them as sequential data, processing them through the standard Transformer architecture. ViT has demonstrated superior performance across several image classification benchmarks, proving the potential of Transformer architectures for purely visual tasks.
In recent years, ViT models have been rapidly applied to semantic segmentation tasks. To adapt ViT for semantic segmentation, structural adjustments are necessary [36], such as incorporating upsampling (or deconvolution) layers to restore spatial resolution and modifying the output layer to generate pixel-level classification predictions. By integrating Convolutional Neural Network (CNN) feature extractors or employing special decoder structures, ViT has been successfully applied to semantic segmentation tasks, such as in TransUNet [37], which has shown outstanding performance on various public semantic segmentation datasets, far surpassing conventional CNN-based architectures.
The success of Transformer models largely depends on the multi-head self-attention (MHSA) mechanism, which models global contextual information in sequences. The large number of parameters allows the model to capture fine-grained patterns and complex high-dimensional feature representations, achieving significant success in image classification and natural language processing tasks.
However, the multi-head self-attention mechanism’s high computational resource requirements, particularly when handling high-resolution remote sensing images, present challenges. The computational complexity increases with the sequence length (where the sequence is the input length). The large number of parameters demands significant storage and GPU memory. Moreover, due to the complexity of spectral and boundary texture features in arable land areas, excessive context capturing can introduce unnecessary noise, making the model less flexible when handling subtle differences and overlooking critical local features of arable land. Therefore, for the specific task of arable land identification, using a Transformer for feature extraction is not optimal. Hence, there is an urgent need for a lightweight network that effectively utilizes the spectral and texture information of arable land.
In comparison, U-Net, as a CNN-based encoder–decoder architecture, demonstrates superior performance in semantic segmentation tasks. Its symmetric U-shaped structure effectively integrates low-level detail information with high-level semantic features, providing notable advantages in small object detection and boundary region identification. Additionally, U-Net employs skip connections, which not only preserve deep feature representations but also mitigate the loss of fine details during downsampling, thereby enhancing the retention of farmland boundaries and texture information. Moreover, U-Net exhibits strong adaptability, allowing for targeted optimization based on the characteristics of the study area to improve segmentation performance for specific tasks. Therefore, this study adopts U-Net as the baseline model and introduces modifications tailored to the farmland recognition task to enhance its capability in identifying cultivated land areas.
The spectral information and boundary texture features of arable land in remote sensing imagery are influenced by various factors, such as seasonal changes, crop growth stages, and agricultural activities [38]. These factors make the spectral and texture characteristics of arable land highly dynamic and diverse. As a result, under certain environmental conditions, shrublands, grasslands, and forested areas may appear very similar to arable land in the imagery. However, there remain critical distinguishing features. In terms of spectral characteristics, arable land, particularly in the near-infrared band (NIR), exhibits a prominent vegetation spectral response peak. The spectral signature of shrub plants is similar to that of most other plants, but it primarily absorbs in the visible spectrum (400–700 nm) and shortwave infrared band 2 (1900–2500 nm) while reflecting in the near-infrared (700–1300 nm) and shortwave infrared band 1 (1300–1900 nm). The first absorption dip for shrub plants occurs around 400 nm, which is shifted 50 nm to the left compared to herbaceous plants. Grasslands and forests also show higher reflectance in the near-infrared band; however, their spectral characteristics exhibit different slope changes in the red-edge region, the transition zone between the near-infrared and shortwave infrared 1 bands, and the transition zone between shortwave infrared 1 and 2 bands compared to arable land [39,40].
Moreover, shrub areas often display complex structures and textures due to variations in plant height and density, leading to more intricate spectral reflectance patterns at the spatial scale. Grassland areas typically show more uniform color and texture; however, variations in plant growth and density cause their spectral reflectance properties to change with scale. Forest areas, due to the canopy shading effect, show spectral reflectance characteristics with shadowed and mottled patterns at the spatial scale. In contrast, arable land areas typically appear as more regular patterns in imagery, particularly when the planting schemes and crop growth stages are similar, which results in relatively uniform color and texture across different scales [41].
Finally, although the color and texture of arable land are relatively uniform, their discontinuous and fragmented distribution further complicates the identification task. This necessitates models capable of not only capturing global information of arable land areas but also precisely identifying and handling small regions and fine details, thereby achieving high-accuracy extraction and segmentation of arable land in complex scenarios.
Thus, the task of identifying arable land areas requires addressing three main challenges: the similarity between arable and non-arable land areas; insufficient extraction and utilization of multi-scale information; and inadequate extraction and utilization of fine-grained features. This study aims to address these challenges through three key improvements:
(1)
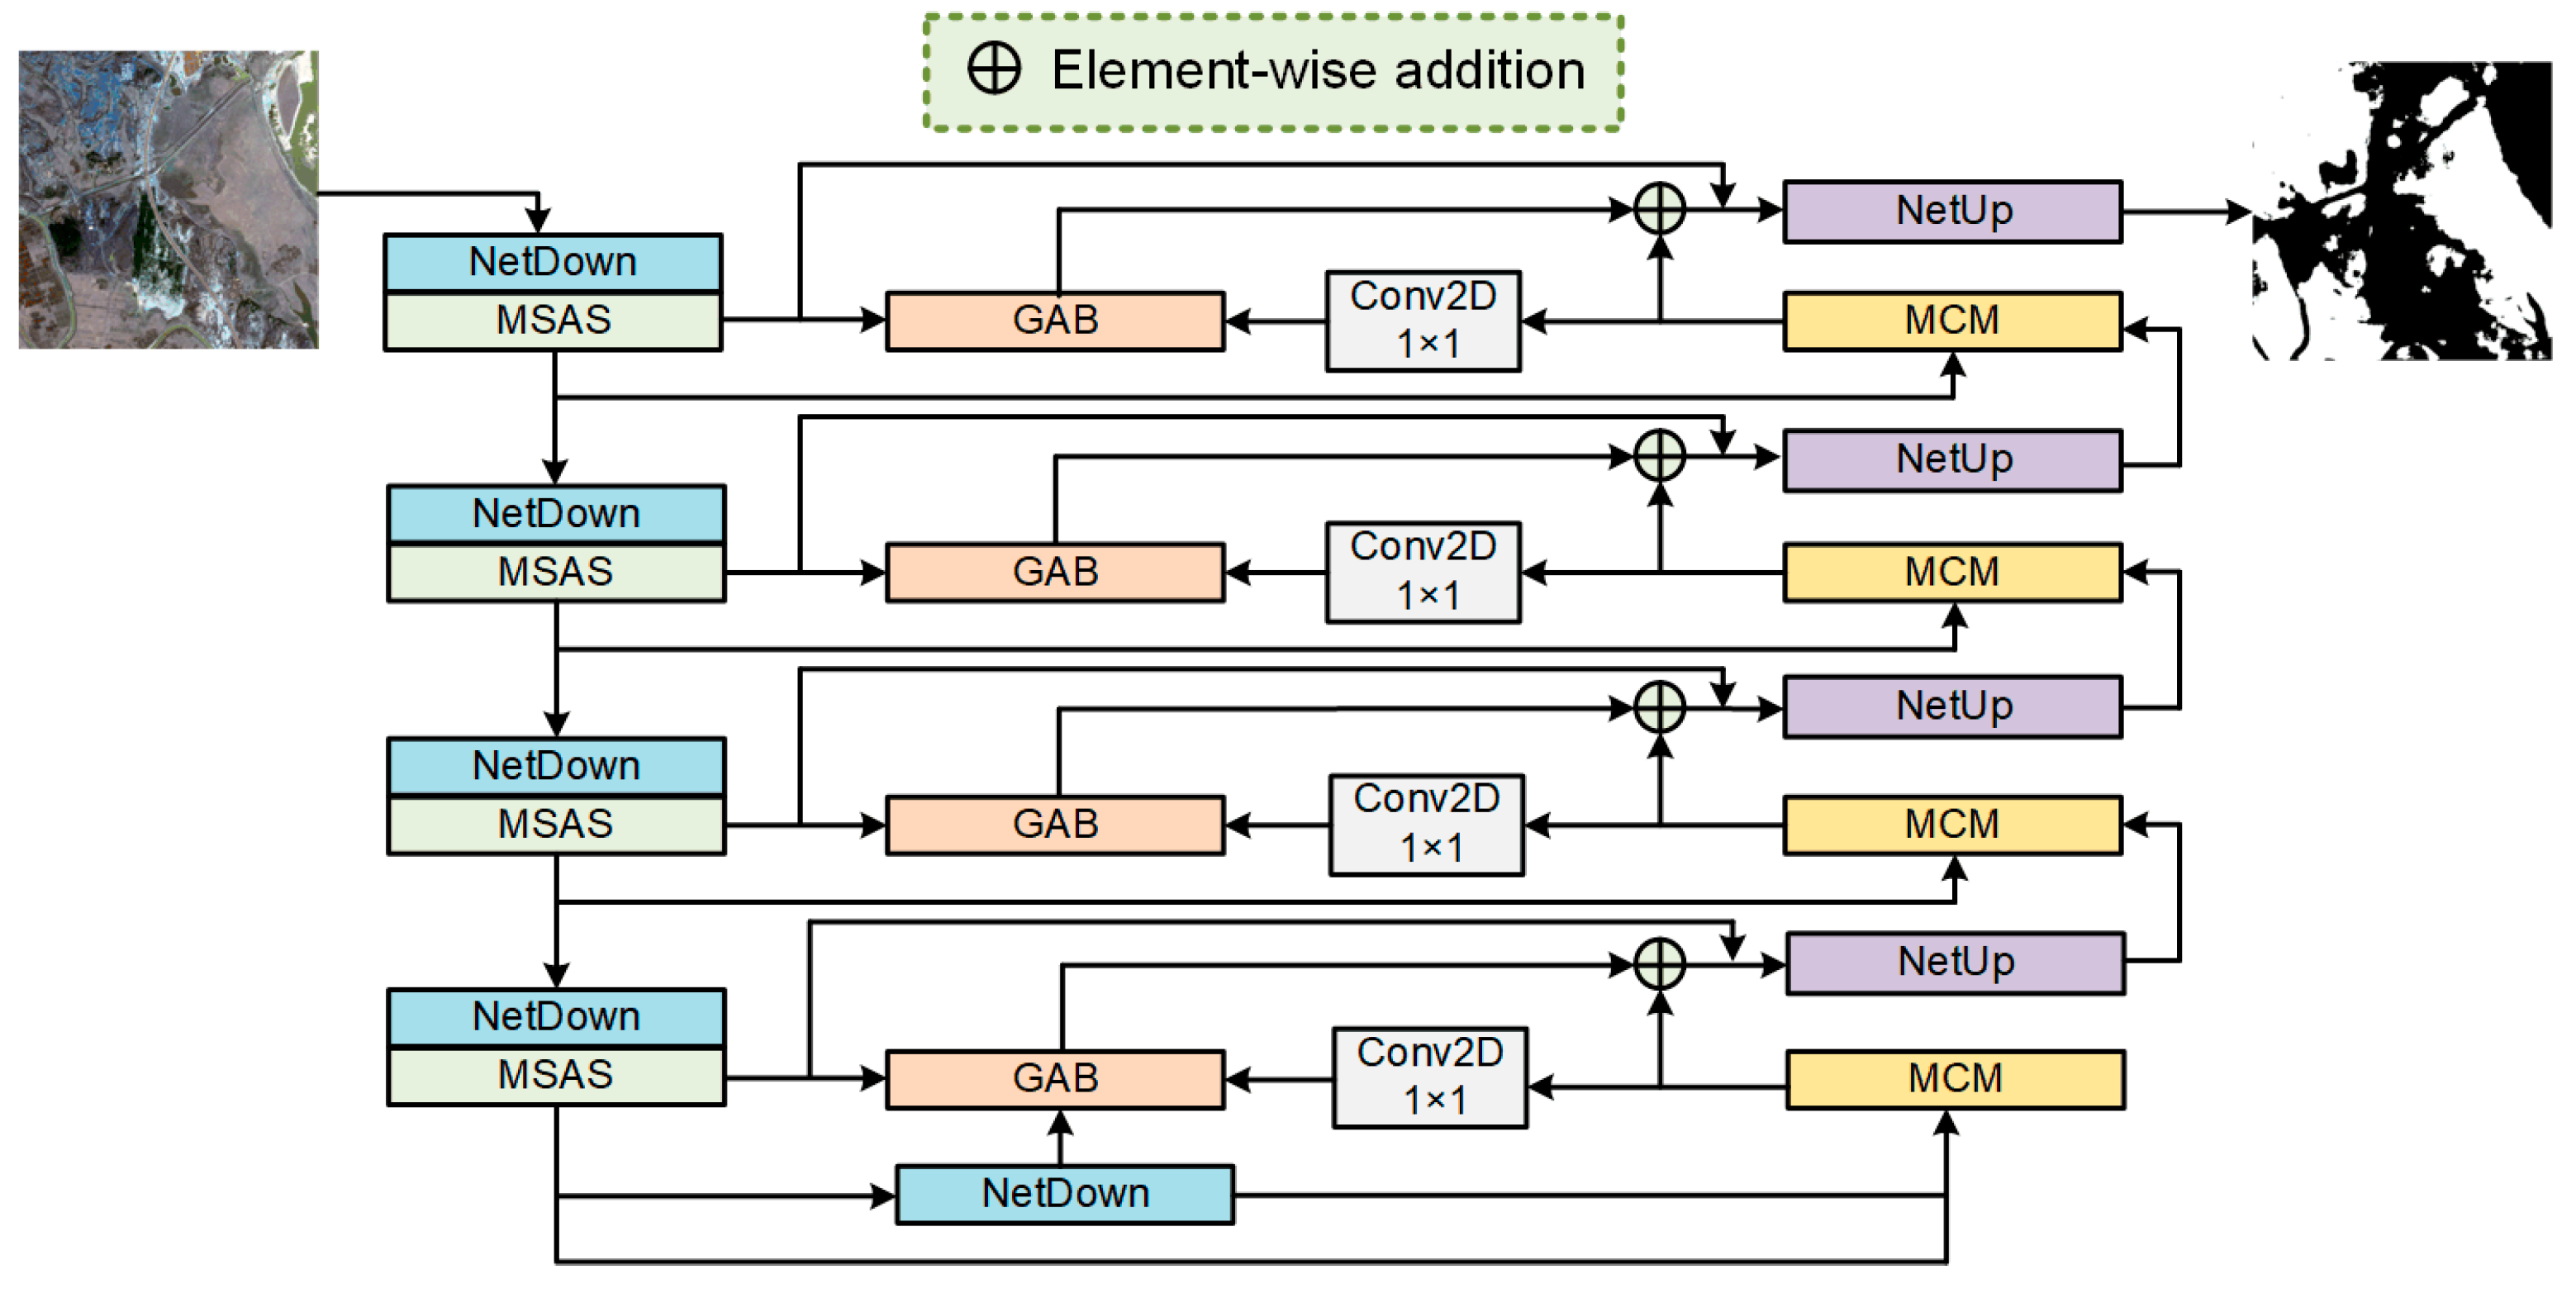
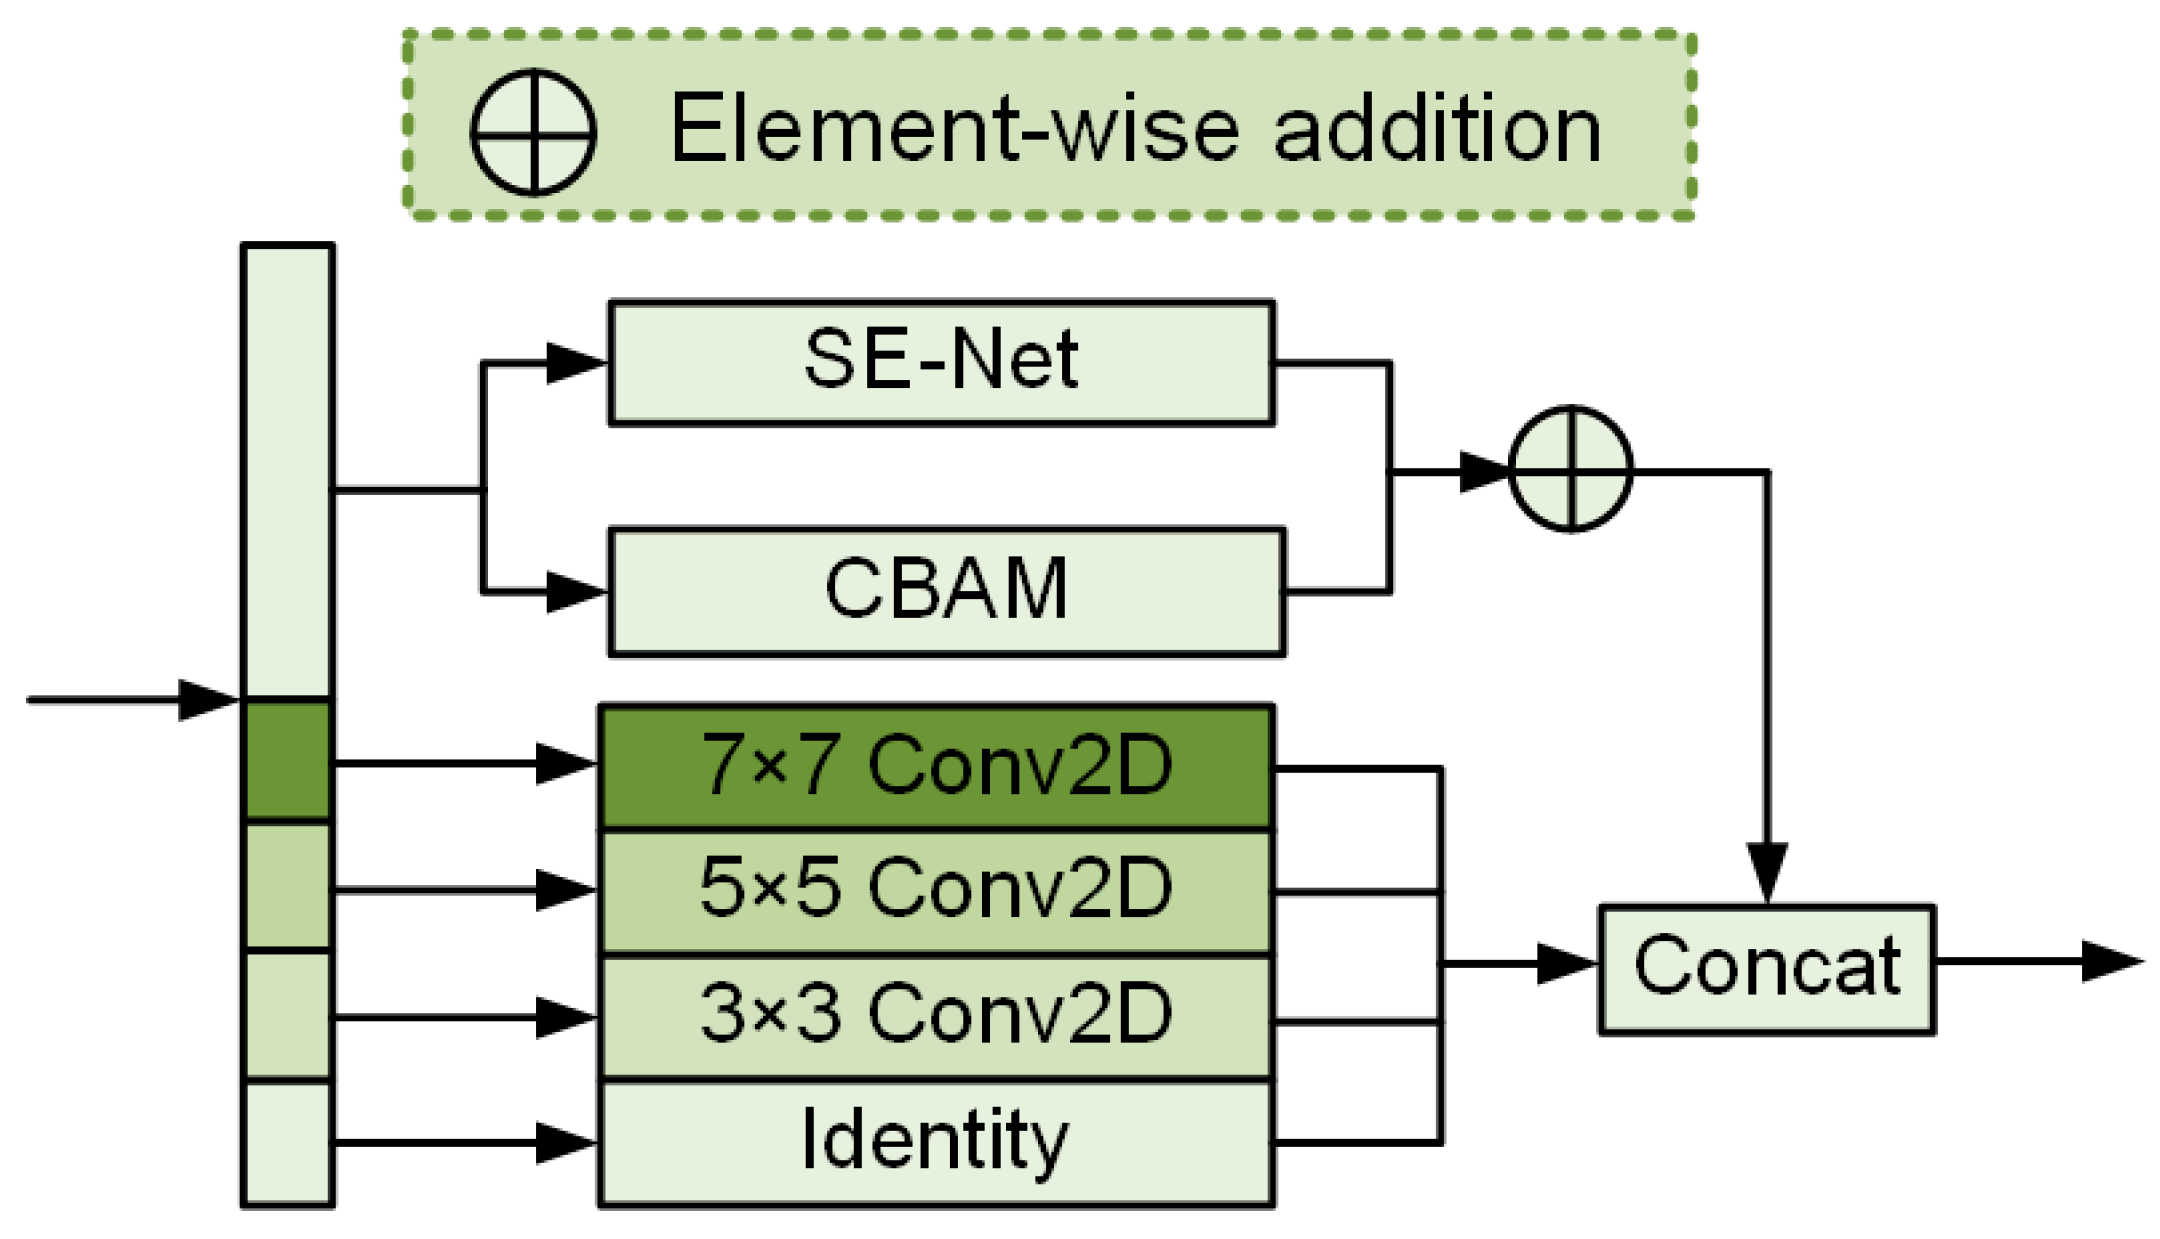
Similarity between arable and non-arable land areas, and insufficient multi-scale and fine-grained feature extraction: Convolutional Neural Networks (CNNs) are particularly effective at extracting local features, allowing them to capture detailed information in arable land imagery. However, since arable land not only includes local details but also requires global contextual information for improved segmentation accuracy, this study uses the U-Net network as the backbone model. Although U-Net performs well in feature extraction, it has certain limitations in multi-scale information fusion and texture detail extraction, particularly in handling complex boundaries and fine-grained features. To address this, the previous literature has proposed combining channel and spatial attention mechanisms, which effectively enhance network performance in complex scenarios. Inspired by these approaches, we introduce a novel attention mechanism—Multi-Scale Adaptive Segmentation (MSAS)—which integrates SEBlock (Squeeze-and-Excitation Block) [42], CBAM (Convolutional Block Attention Module) [43], and multi-scale feature fusion techniques, enhancing the model’s ability to extract multi-scale contextual and fine-grained features.
(2)
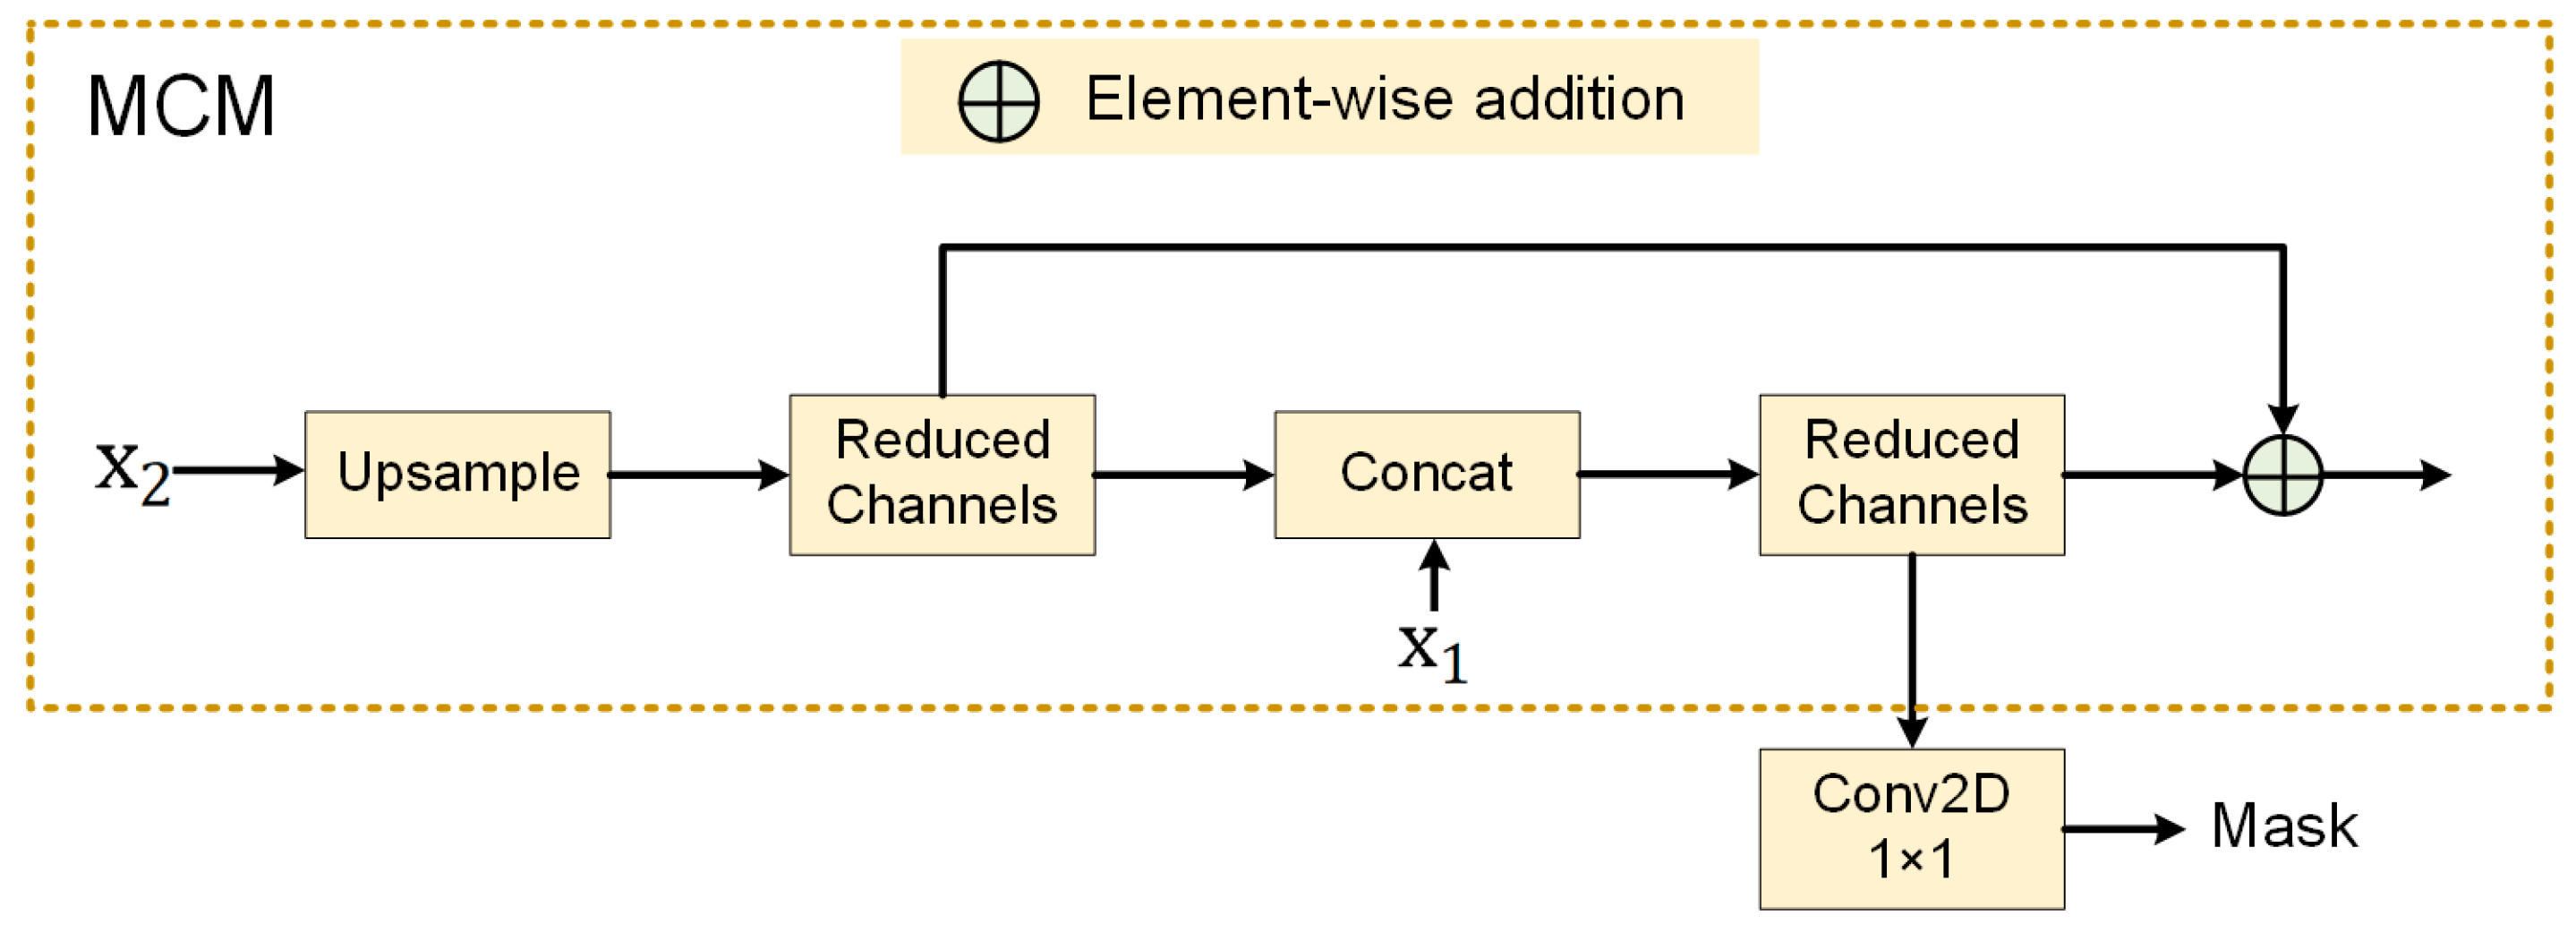
Insufficient utilization of multi-scale information: During feature extraction, the extracted feature information often exhibits multi-scale distribution, with boundary and texture features of arable land appearing at different scales (e.g., small plots and large-scale agricultural areas coexisting). Therefore, the model must fully exploit multi-scale contextual information and extract key discriminative features. Traditional encoders may not efficiently utilize this information. To effectively address this, we introduce the Multi-Scale Contextual Module (MCM) [44], which employs upsampling, channel dimensionality reduction, inter-layer concatenation, and stepwise feature refinement to improve the model’s ability to use multi-scale features and enhance its adaptability to complex boundaries and diverse regions.
(3)
Insufficient extraction and utilization of fine-grained features: In remote sensing imagery, arable land often contains small, sparse areas with highly complex boundary details and texture features, which vary under different image resolutions. Small features such as ridges and furrows in arable land are often overlooked in low-resolution imagery, while in high-resolution imagery, some fine features may be overemphasized due to noise, leading to the insufficient utilization of detailed information. Due to the complexity of these boundary and texture features, conventional decoder methods often struggle to effectively leverage these fine-grained details. Therefore, we incorporate the Group Aggregation Bridge (GAB) module [45], which combines grouped convolutions and multi-scale dilated convolutions to integrate feature information from different resolutions while capturing texture detail information across various scales, improving the model’s ability to model complex boundaries and fine details.
In summary, the main contributions of this paper are as follows:
(1)
Considering the high spectral and textural similarity between cultivated and non-cultivated areas in remote sensing imagery, we propose a novel attention mechanism module—MSAS. This module integrates SEBlock, CBAM, and multi-scale image features to not only reinforce the extraction of local features in farmland regions but also incorporate global contextual information, thereby enhancing the model’s sensitivity to farmland texture and boundary details.
(2)
To address the challenge of exploiting features from regions at different scales in farmland imagery, we introduce the MCM. Through upsampling, channel dimensionality reduction, cross-layer concatenation, and progressive feature refinement, this module enhances the model’s ability to capture farmland boundaries, plot morphology, and spatial distribution, enabling it to better accommodate the scale variations between small, scattered fields and large contiguous farmlands.
(3)
To tackle the issue of insufficient feature extraction in small and sparse farmland regions within remote sensing images, we propose the GAB module. By combining grouped convolutions with multi-scale dilated convolutions, this module effectively aggregates feature information from different resolutions, thereby improving the model’s capability to recognize small farmland targets.

2. Materials and Methods

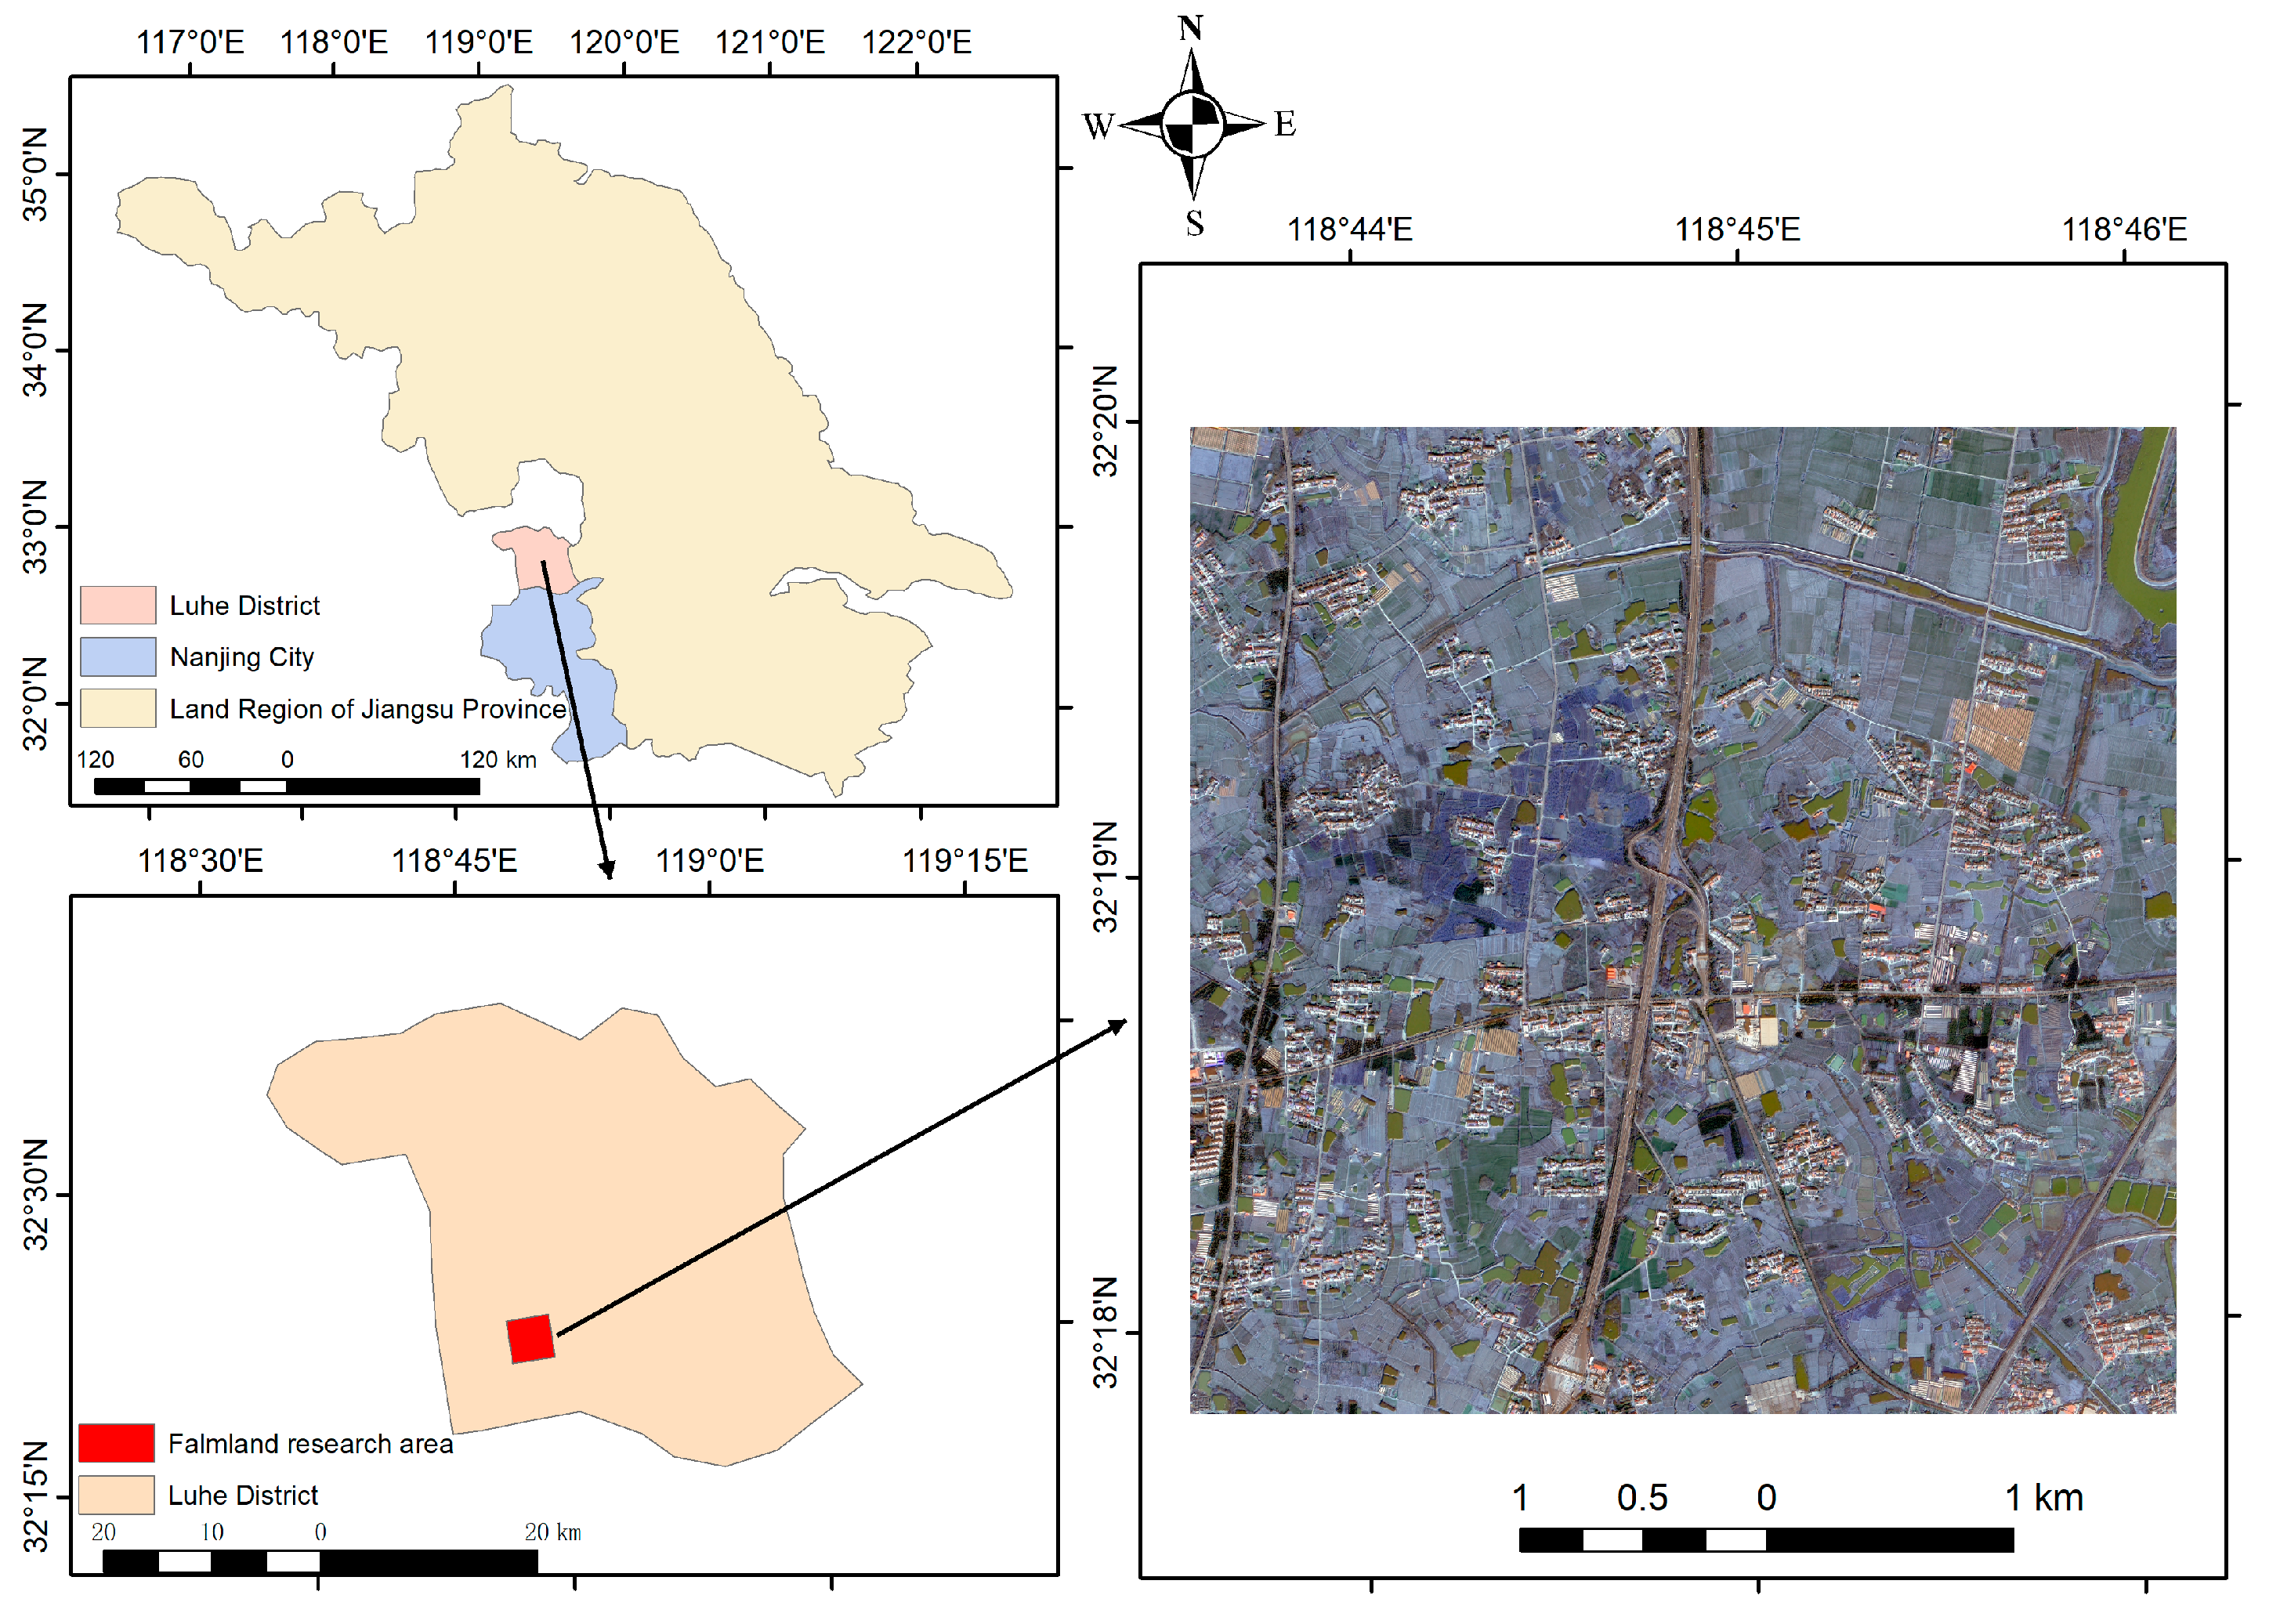
2.1. Overview of the Study Areas

The first study area is located in the Liuhe District of Nanjing, with arable land and geographic locations acquired from the GF-2 satellite, as shown in Figure 1. The arable land in Liuhe District exhibits highly fragmented characteristics, often located around natural water bodies such as rivers, lakes, and wetlands. The land patches are irregular in shape and relatively small, with some natural features having indistinct boundaries with the arable land. Regions such as forests, grasslands, and shrub areas have a high degree of similarity in color to arable land. As a result, the boundaries between arable and non-arable areas in the remote sensing imagery are often not clearly defined, increasing the complexity of arable land extraction.
The second study area uses the publicly available GID dataset, which is also based on GF-2 satellite data and consists of two parts: a large-scale classification set (GID-5) and a fine-grained land cover set (GID-15). GID-5 includes five land cover categories (buildings, farmland, forests, grasslands, and water bodies) and contains 150 scenes of 6800 × 7200 pixel images, which have been labeled at the pixel level by experts. GID-15 is further subdivided into 15 categories, including rice paddies and irrigated fields, providing more detailed land cover information. This dataset features broad geographic coverage, high-quality images, and significant seasonal and lighting variations, closely resembling real-world land cover distributions. The focus of this study is on arable land, so the selected study area is converted into a binary classification task. The images, as shown in Figure 2a, primarily cover flat plain areas, displaying large contiguous patches of arable land, with a clear band of land distributed along rivers. The arable land appears mainly in gray-brown colors, corresponding to fields post-harvest or in winter fallow, with minimal vegetation cover. The corresponding label image is shown in Figure 2b.

2.2. Data Sources

The imagery used in this study from both research areas is obtained from the GF-2 satellite, a high-resolution optical remote sensing satellite with high spatial resolution and multispectral observation capabilities. The technical specifications of the GF-2 satellite are listed in Table 1.

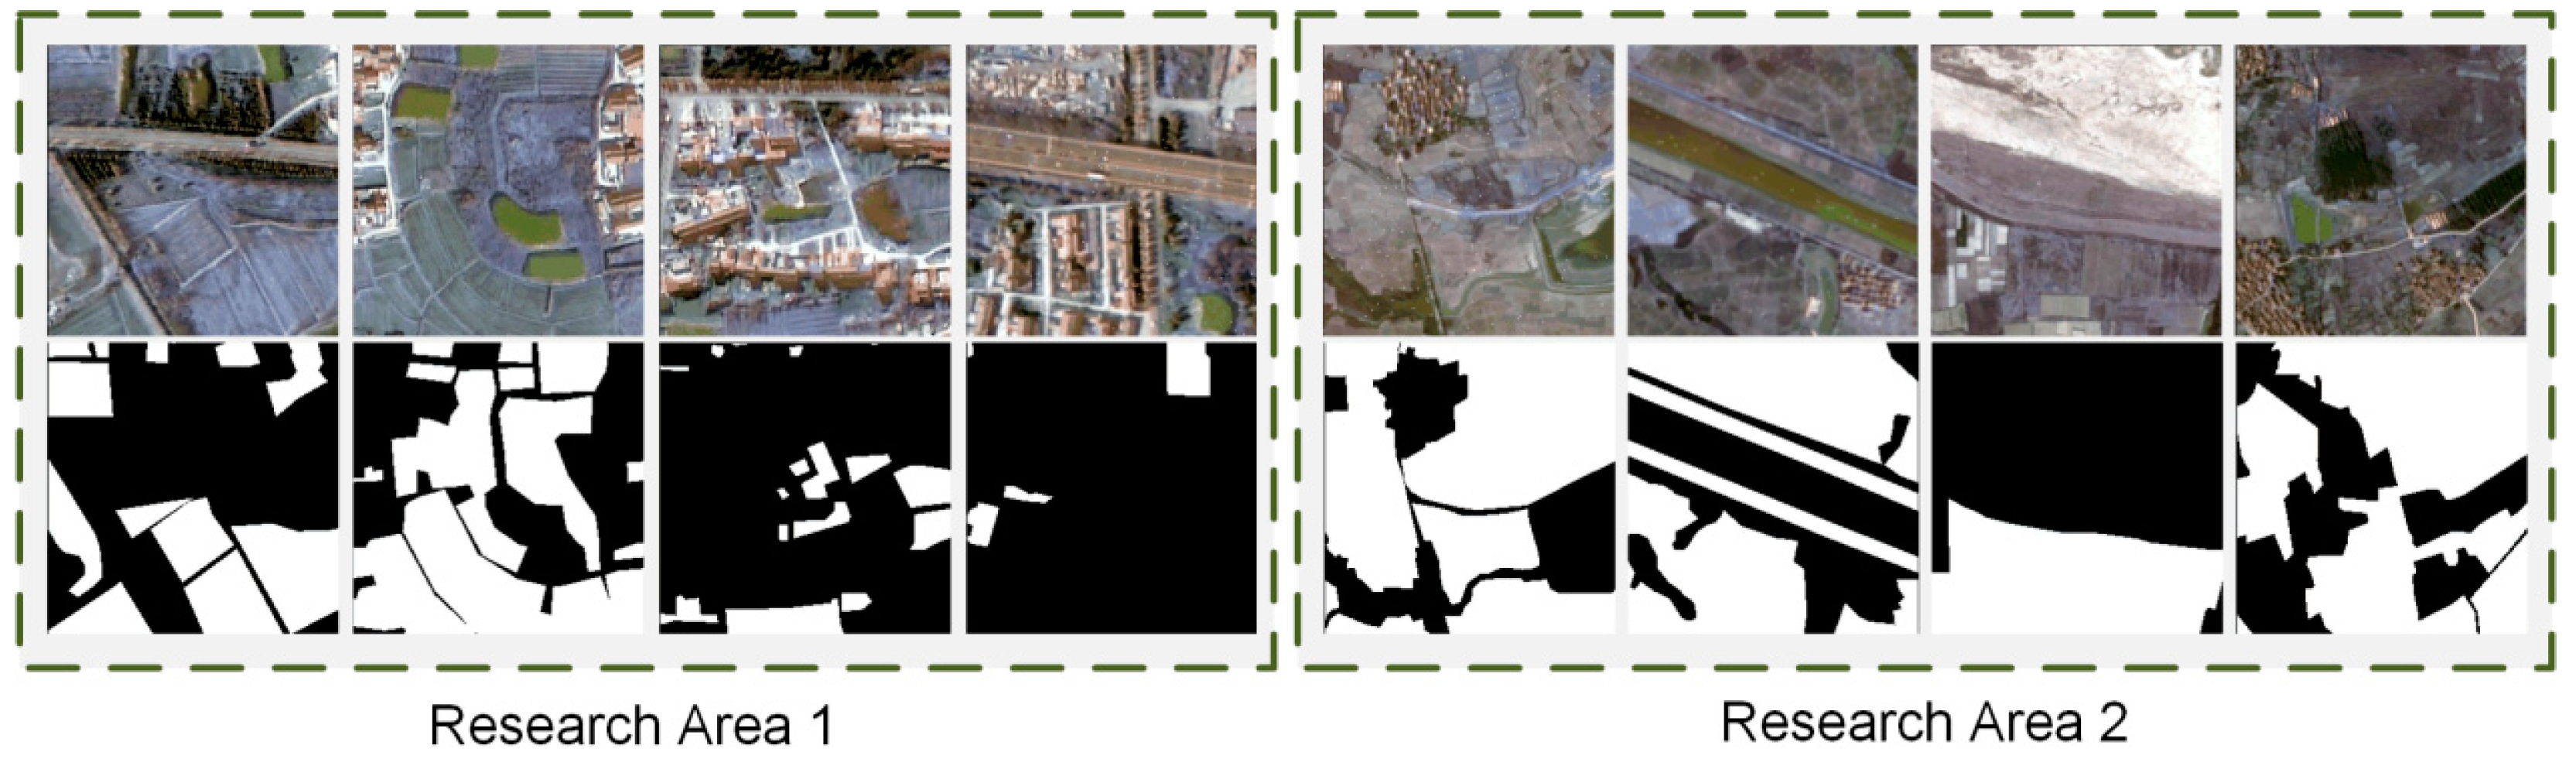
2.3. Data Preprocessing

2.3.1. Study Area 1: Liuhe District, Nanjing

For the first study area, GF-2 satellite imagery from Liuhe District in Nanjing is selected as the raw data. A series of preprocessing steps were applied, including radiometric calibration, atmospheric correction, orthorectification, and image fusion. First, the multispectral imagery was radiometrically calibrated using the calibration coefficients provided in the GF-2 metadata. Subsequently, atmospheric correction was performed on the radiometrically calibrated imagery using the FLAASH module in ENVI-5.3 software to eliminate atmospheric influences on the image data. Next, both the multispectral and panchromatic images were orthorectified using the DEM data (GMTED2010.jp2) available in ENVI along with the RPC files supplied with the GF-2 data, thereby ensuring the geometric accuracy of the imagery. Finally, the high-resolution panchromatic and multispectral imagery were fused using the Gram–Schmidt pan-sharpening (GS) method to produce an image that combines high spatial resolution with rich spectral information, achieving a final resolution of 1 m. Visual inspection of the imagery reveals that the farmland in the study area exhibits complex textures, featuring banded furrows and parcels of various crop types, abundant vegetation cover, and significant spectral variability, making it well suited for detailed remote sensing analysis, as shown in Figure 1.
Subsequently, manual visual interpretation is conducted to generate label maps for the region. Figure 3 displays the preprocessed imagery and its corresponding label map.

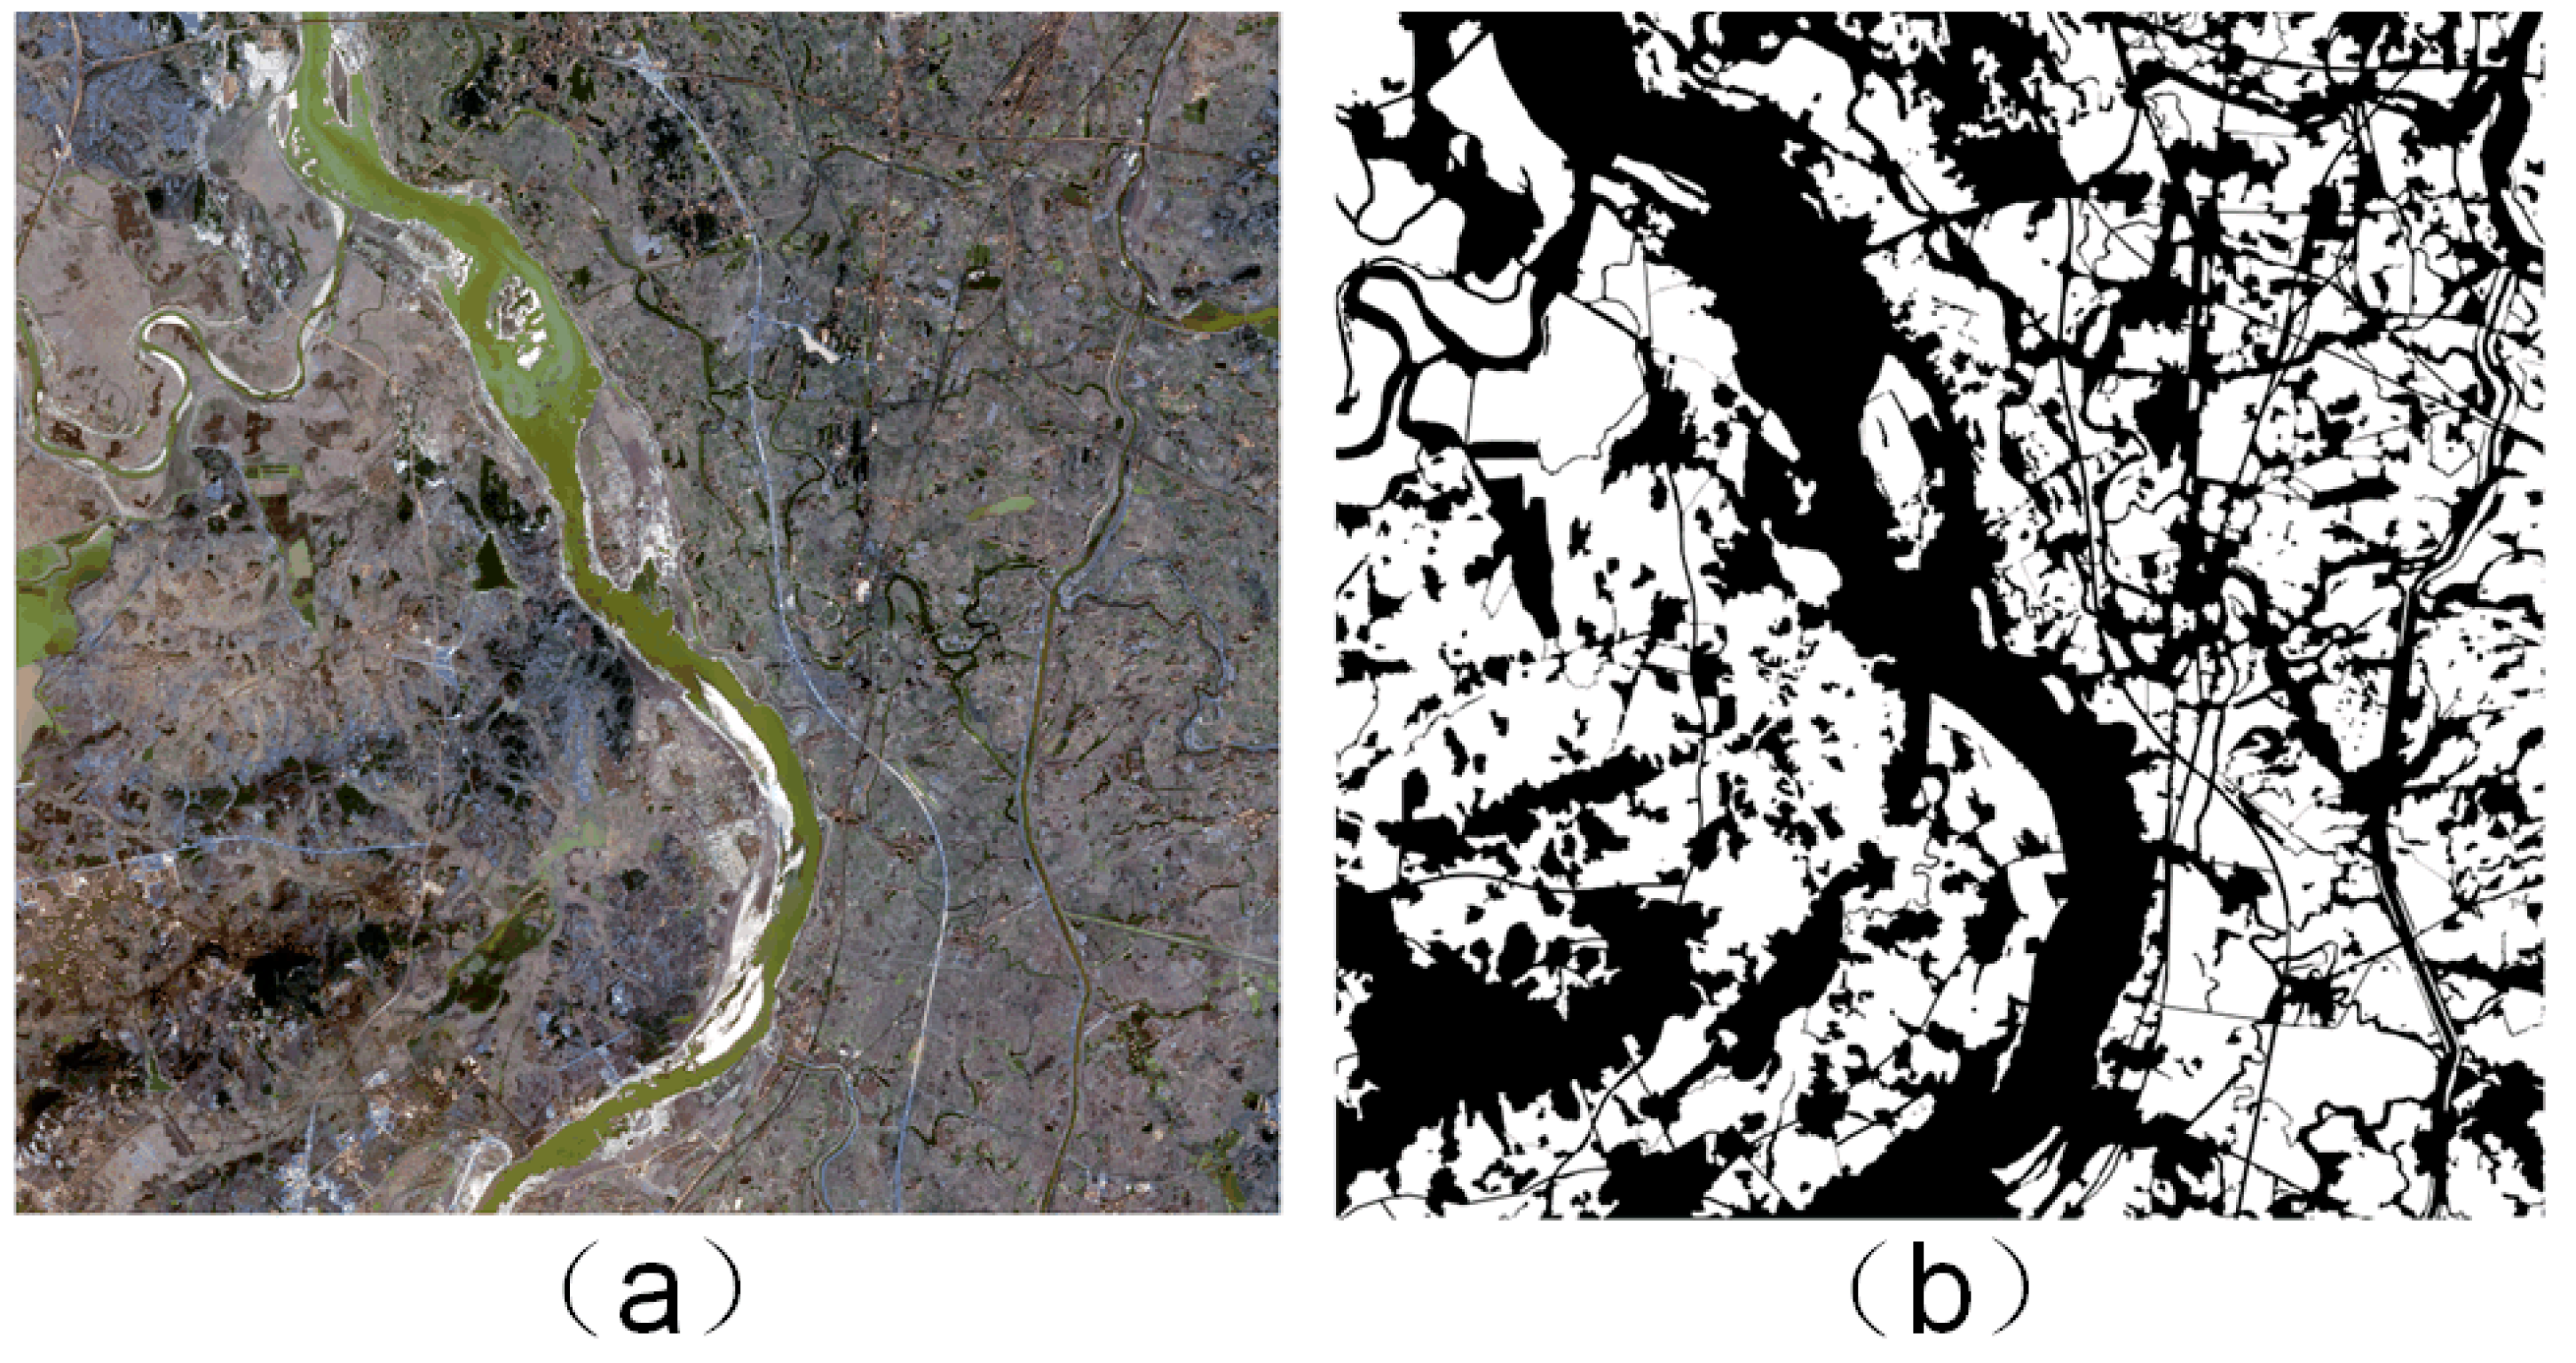
2.3.2. Study Area 2: Public Dataset

For the second study area, the publicly available GID dataset has already undergone basic preprocessing steps. Therefore, only image enhancement is required during the data preparation phase.

2.3.3. Image Enhancement

To expand the sample set and improve model robustness, image enhancement techniques are employed to augment the dataset. Initially, large images are randomly cropped into multiple 256 × 256 pixel sub-images. After all the large images are cropped, the resulting sub-images undergo a random combination of enhancement techniques, including gamma correction, rotation, blurring, noise addition, and flipping. Finally, the enhanced images are split into training and validation sets in a 9:1 ratio. The final dataset consists of 5000 enhanced image sets, with 4500 images in the training set and 500 images in the validation set. Example images after enhancement and their corresponding label maps are shown in Figure 3.

3. Methods

Inspired by the Unet network, this study designs a semantic segmentation model based on an encoder–decoder architecture, referred to as U-MGA, as shown in Figure 4. The Unet network has gained significant attention due to its classical U-shaped structure. Its core feature is the use of an encoder to progressively downsample the input image, extracting multi-level feature representations, and a decoder that gradually upsamples the features, restoring them to the original resolution. This symmetric design effectively avoids excessive loss of features while maintaining segmentation accuracy. Additionally, the skip connection mechanism in the Unet network allows for the direct transmission of high-resolution shallow features to the decoding stage, thereby preserving more boundaries and detailed information and mitigating the vanishing gradient problem. Compared to complex deep networks, Unet has fewer parameters, significantly reducing computational overhead and making it particularly suitable for land recognition tasks that require real-time processing and model lightweighting.
To better meet the demands of cropland recognition tasks and address the issues of insufficient multi-scale information modeling and limited fine-grained feature extraction capability, this study deeply optimizes the network architecture in both the feature extraction and reconstruction stages. First, in the feature extraction stage, to address the challenge of high similarity between cropland and non-cropland areas, we propose a Multi-Scale Adaptive Segmentation (MSAS) module that leverages channel and spatial attention for joint modeling, dynamically adjusting the feature weight distribution. Next, in the feature reconstruction stage, to handle the complex boundaries of cropland imagery and the multi-scale distribution of features, the Multi-Level Convolution Module (MCM) is introduced before each upsampling step. This module improves the model’s ability to capture multi-scale contextual information by fusing multi-scale features and extracting contextual information. Finally, to extract complex boundaries and texture details, particularly fine-grained information in small cropland areas, we integrate a Group Aggregation Bridging (GAB) module during the network’s skip connection process. This module combines group convolutions with multi-scale dilated convolutions to enhance the model’s ability to capture boundary and texture details.

3.1. Multi-Scale Adaptive Segmentation (MSAS)

The SE module adaptively adjusts the importance of each channel, enhancing useful channels and suppressing irrelevant or redundant information. Originally proposed by Hu et al. [42], the SE module focuses on channel attention. However, cropland imagery contains complex textures and structural information, and relying solely on channel attention may not effectively capture the critical differences between cropland and background regions. To compensate for the lack of spatial feature modeling in the SE module, we introduce the CBAM module. This module enhances the attention on local regions and boundary details through spatial attention. To further improve the network’s ability to extract features at different scales, the MSAS module also integrates a multi-scale branching structure. Various convolution kernels (3 × 3, 5 × 5, and 7 × 7) process features at different scales, improving the network’s adaptability in complex cropland areas, such as large contiguous cropland regions or small field plots, as shown in Figure 5.
In this study, the input feature map, denoted as X R B × C × H × W , is divided into five parts based on the number of channels: X 1 R B × C 2 × H × W , X 2 R B × C 8 × H × W , X 3 R B × C 8 × H × W , X 4 R B × C 8 × H × W , and X 5 R B × C 8 × H × W , where B represents the batch size, H and W are the height and width of the input feature map (in this case, 256 and 256), and C is the number of channels.
(1)
SE Module: The SE module performs global average pooling to compute global information for each channel:
y = 1 H × W i = 1 H j = 1 W X 1 [ : , : , i , j ] ,
This information is processed through two fully connected layers, which adjust the weights using an activation function:
s = σ ( F C 2 ( R e L U ( F C 1 ( y ) ) ) ) ,
The activation function used is the Sigmoid function, which compresses the output weight values to the [0, 1] range. These weights are then used in subsequent steps to apply channel-wise weighting to the input feature map:
σ ( x ) = 1 1 + e x ,
F C 1 and F C 2 represents the first and second fully connected layers, where ReLU is the activation function.
Finally, the weights are applied to the input channels:
X S E = X 1 s ,
The element-wise multiplication of each element with its corresponding weight regulates the importance of each channel.
(2)
CBAM Module (Convolutional Block Attention Module): Spatial Attention Calculation: The feature map X S E undergoes both max-pooling and average-pooling:
S = σ ( C o n v 7 × 7 ( C a t ( M a x P o o l ( X S E ) , A v g P o o l ( X S E ) ) ) ,
The results are concatenated along the channel dimension (denoted as Cat).
The input data are then weighted:
X C B A M = X S E S ,
The final output from the attention mechanism is the sum of the two weighted results:
X A t t = X S E + X C B A M ,
(3)
Multi-Scale Branch Module: Different convolution kernels process different parts of the feature map to capture features at multiple scales: X d 1 = C o n v 3 × 3 ( X 2 ) ,   X d 2 = C o n v 5 × 5 ( X 3 ) ,   X d 3 = C o n v 7 × 7 ( X 4 ) .
The results are concatenated along the channel dimension, resulting in the final output:
X o u t = C a t ( X A t t , X d 1 , X d 2 , X d 3 , X 5 ) ,

3.2. Multi-Level Convolution Module (MCM)

In the feature reconstruction phase, the UNet network uses skip connections to directly pass the encoder’s low-level features to the decoder. However, although low-level features contain rich detail information, they lack global semantic information, making it difficult to comprehensively capture boundary and regional features of cultivated land. Therefore, additional high-level semantic information is necessary to supplement and optimize the feature representation. Inspired by Zhong et al. [44], this study introduces the MCM, which integrates global semantic information from high-level features into low-level features. This compensates for the spatial perception and regional consistency deficiencies in the low-level features and enhances the model’s ability to capture boundary details of cultivated land regions. The MCM structure is shown in Figure 6.
Specifically, this study uses the MCM to receive two feature maps of different scales, x 1 (low-level features with high spatial resolution) and x 2 (high-level features containing rich global semantic information), as inputs:
Upsample: The low-resolution high-level feature map is upsampled via bilinear interpolation, aligning its spatial dimensions with the low-level feature map x 1 :
x 2 u p = U p s a m p l e ( x 2 ) , x 2 u p R B × C × 2 H × 2 W ,
Reduces Channels (RC): Depthwise separable convolution is applied to the upsampled feature map x 2 u p to enhance the representation ability of high-level features while reducing redundant information and computational complexity:
x R C 1 = G E L U ( B N ( C o n v 1 × 1 ( G E L U ( B N ( C o n v 3 × 3 ( x 2 u p ) ) ) ) ) ) ,
Concat: The low-level feature map and the processed high-level features x R C 1 are concatenated along the channel dimension to form a comprehensive feature map containing multi-scale information:
x c a t = C a t ( x 1 , x R C 1 ) ,
Further, depthwise separable convolution is applied to compress the channels and fuse semantic and spatial information:
x R C 2 = G E L U ( B N ( C o n v 1 × 1 ( G E L U ( B N ( C o n v 3 × 3 ( x c a t ) ) ) ) ) ) ,
Output: The final output is passed to the next stage:
x f o r w a r d = x R C 2 + x R C 1 ,
This output is provided as the segmentation mask to the GAB module:
M a s k = C o n v 1 × 1 ( x f o r w a r d ) ,

3.3. Group Aggregation Bridge (GAB)

In the skip connection stage of the UNet network, low-level encoder features are typically concatenated with the corresponding decoder stage features to supplement spatial detail information, enhancing segmentation accuracy. However, while this connection improves local boundary details, it lacks explicit guidance of the target region’s structure. To further improve the quality of multi-scale feature fusion and explicitly highlight the structural features of the target region, inspired by Ruan et al. [45], this study introduces the GAB module. This module fuses low-level features, high-level features, and mask information generated by the decoder to effectively supplement the detail information of the cultivated land area, enhancing the model’s segmentation capability. The GAB module structure is shown in Figure 7.
Specifically, the GAB module takes three inputs: low-level feature map x 1 , high-level feature map x 2 , and the mask information m generated by the decoder. This mask is used to guide feature fusion.
Upsample: Similar to the MCM, the low-level feature map x 2 is upsampled via bilinear interpolation, aligning it with the spatial resolution of the low-level feature map. The result is a feature map x 2 u p with consistent spatial resolution.
Feature Grouping: The feature maps x 2 u p and x 1 are divided into four subgroups along the channel dimension: ( x 2 u p 0 , x 2 u p 1 , x 2 u p 2 , x 2 u p 3 ) and ( x 1 0 , x 1 1 , x 1 2 , x 1 3 ).
Multi-Scale Dilated Convolutions: After concatenating each feature group with the mask information m , multi-scale information is extracted through convolutions with different dilation rates:
x i = G i ( C a t ( x 2 u p i , x 1 i , m ) ) ,
Here, d i l a t i o n = { 1,2 , 5,7 } represents different dilation rates, and G 0 , G 1 , G 2 , G 3 corresponds to the convolution operations with varying dilation rates. Each convolution operation is performed as follows:
x i = C o n v 3 × 3 ( L a y e r N o r m ( x 2 u p i + x 1 i + m ) ) ,
Final Output: After multi-scale convolution processing, the features x 0 , x 1 , x 2 , x 3 are concatenated along the channel dimension, resulting in the final output feature map:
x o u t G A B = C o n v 3 × 3 ( C a t ( x 0 , x 1 , x 2 , x 3 ) )

4. Results

The platform and CPU used in this study are as follows: All experiments were conducted using a 12th Gen Intel(R) Core(TM) i5-12490F, GeForce RTX 4060 Ti (16 GB), and 64 GB RAM, running on the PyTorch 1.10.2 and cuDNN 11.1.1 frameworks. The results of multiple predicted regions were averaged as the final outcome. To assess the model’s generalization capability across different areas, independent training, and validation were performed on two datasets to better evaluate inter-regional performance differences.
The ablation experiments used three commonly employed metrics: Overall Accuracy (OA), Precision, and Recall. For comparison experiments, six evaluation metrics were selected: OA, Precision, Recall, F1-score, Intersection over Union (IoU), and the Kappa coefficient.

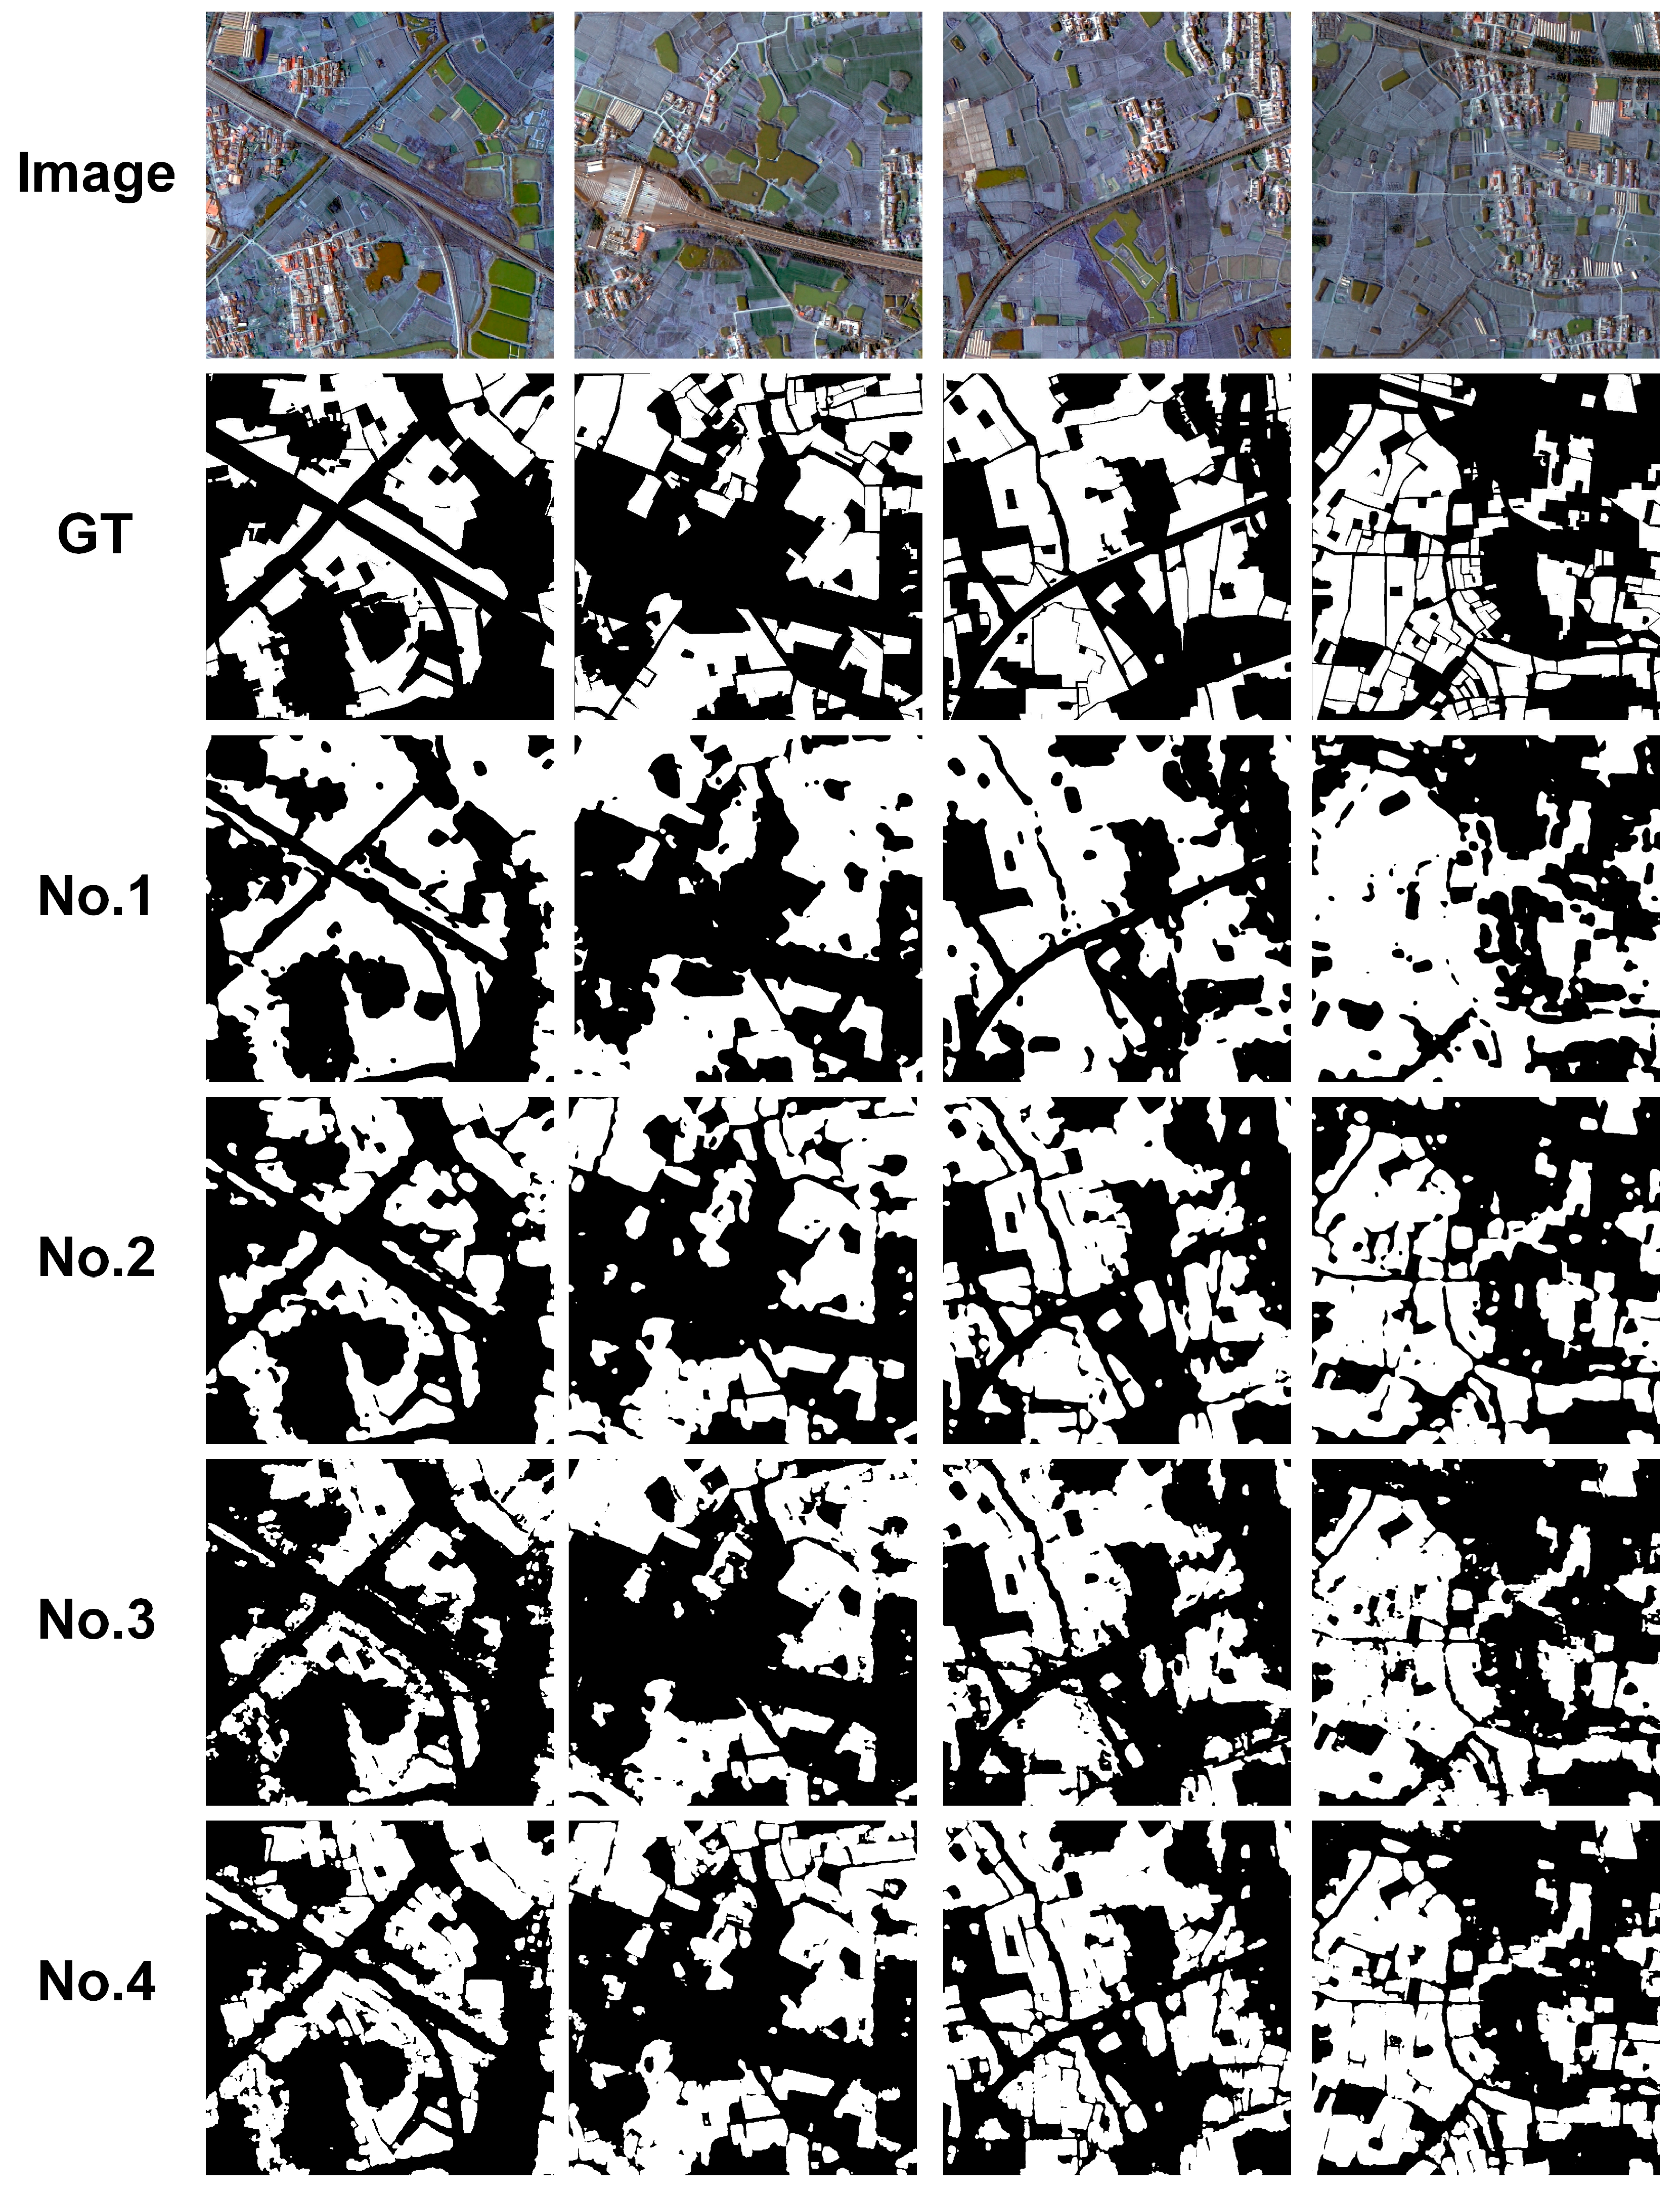
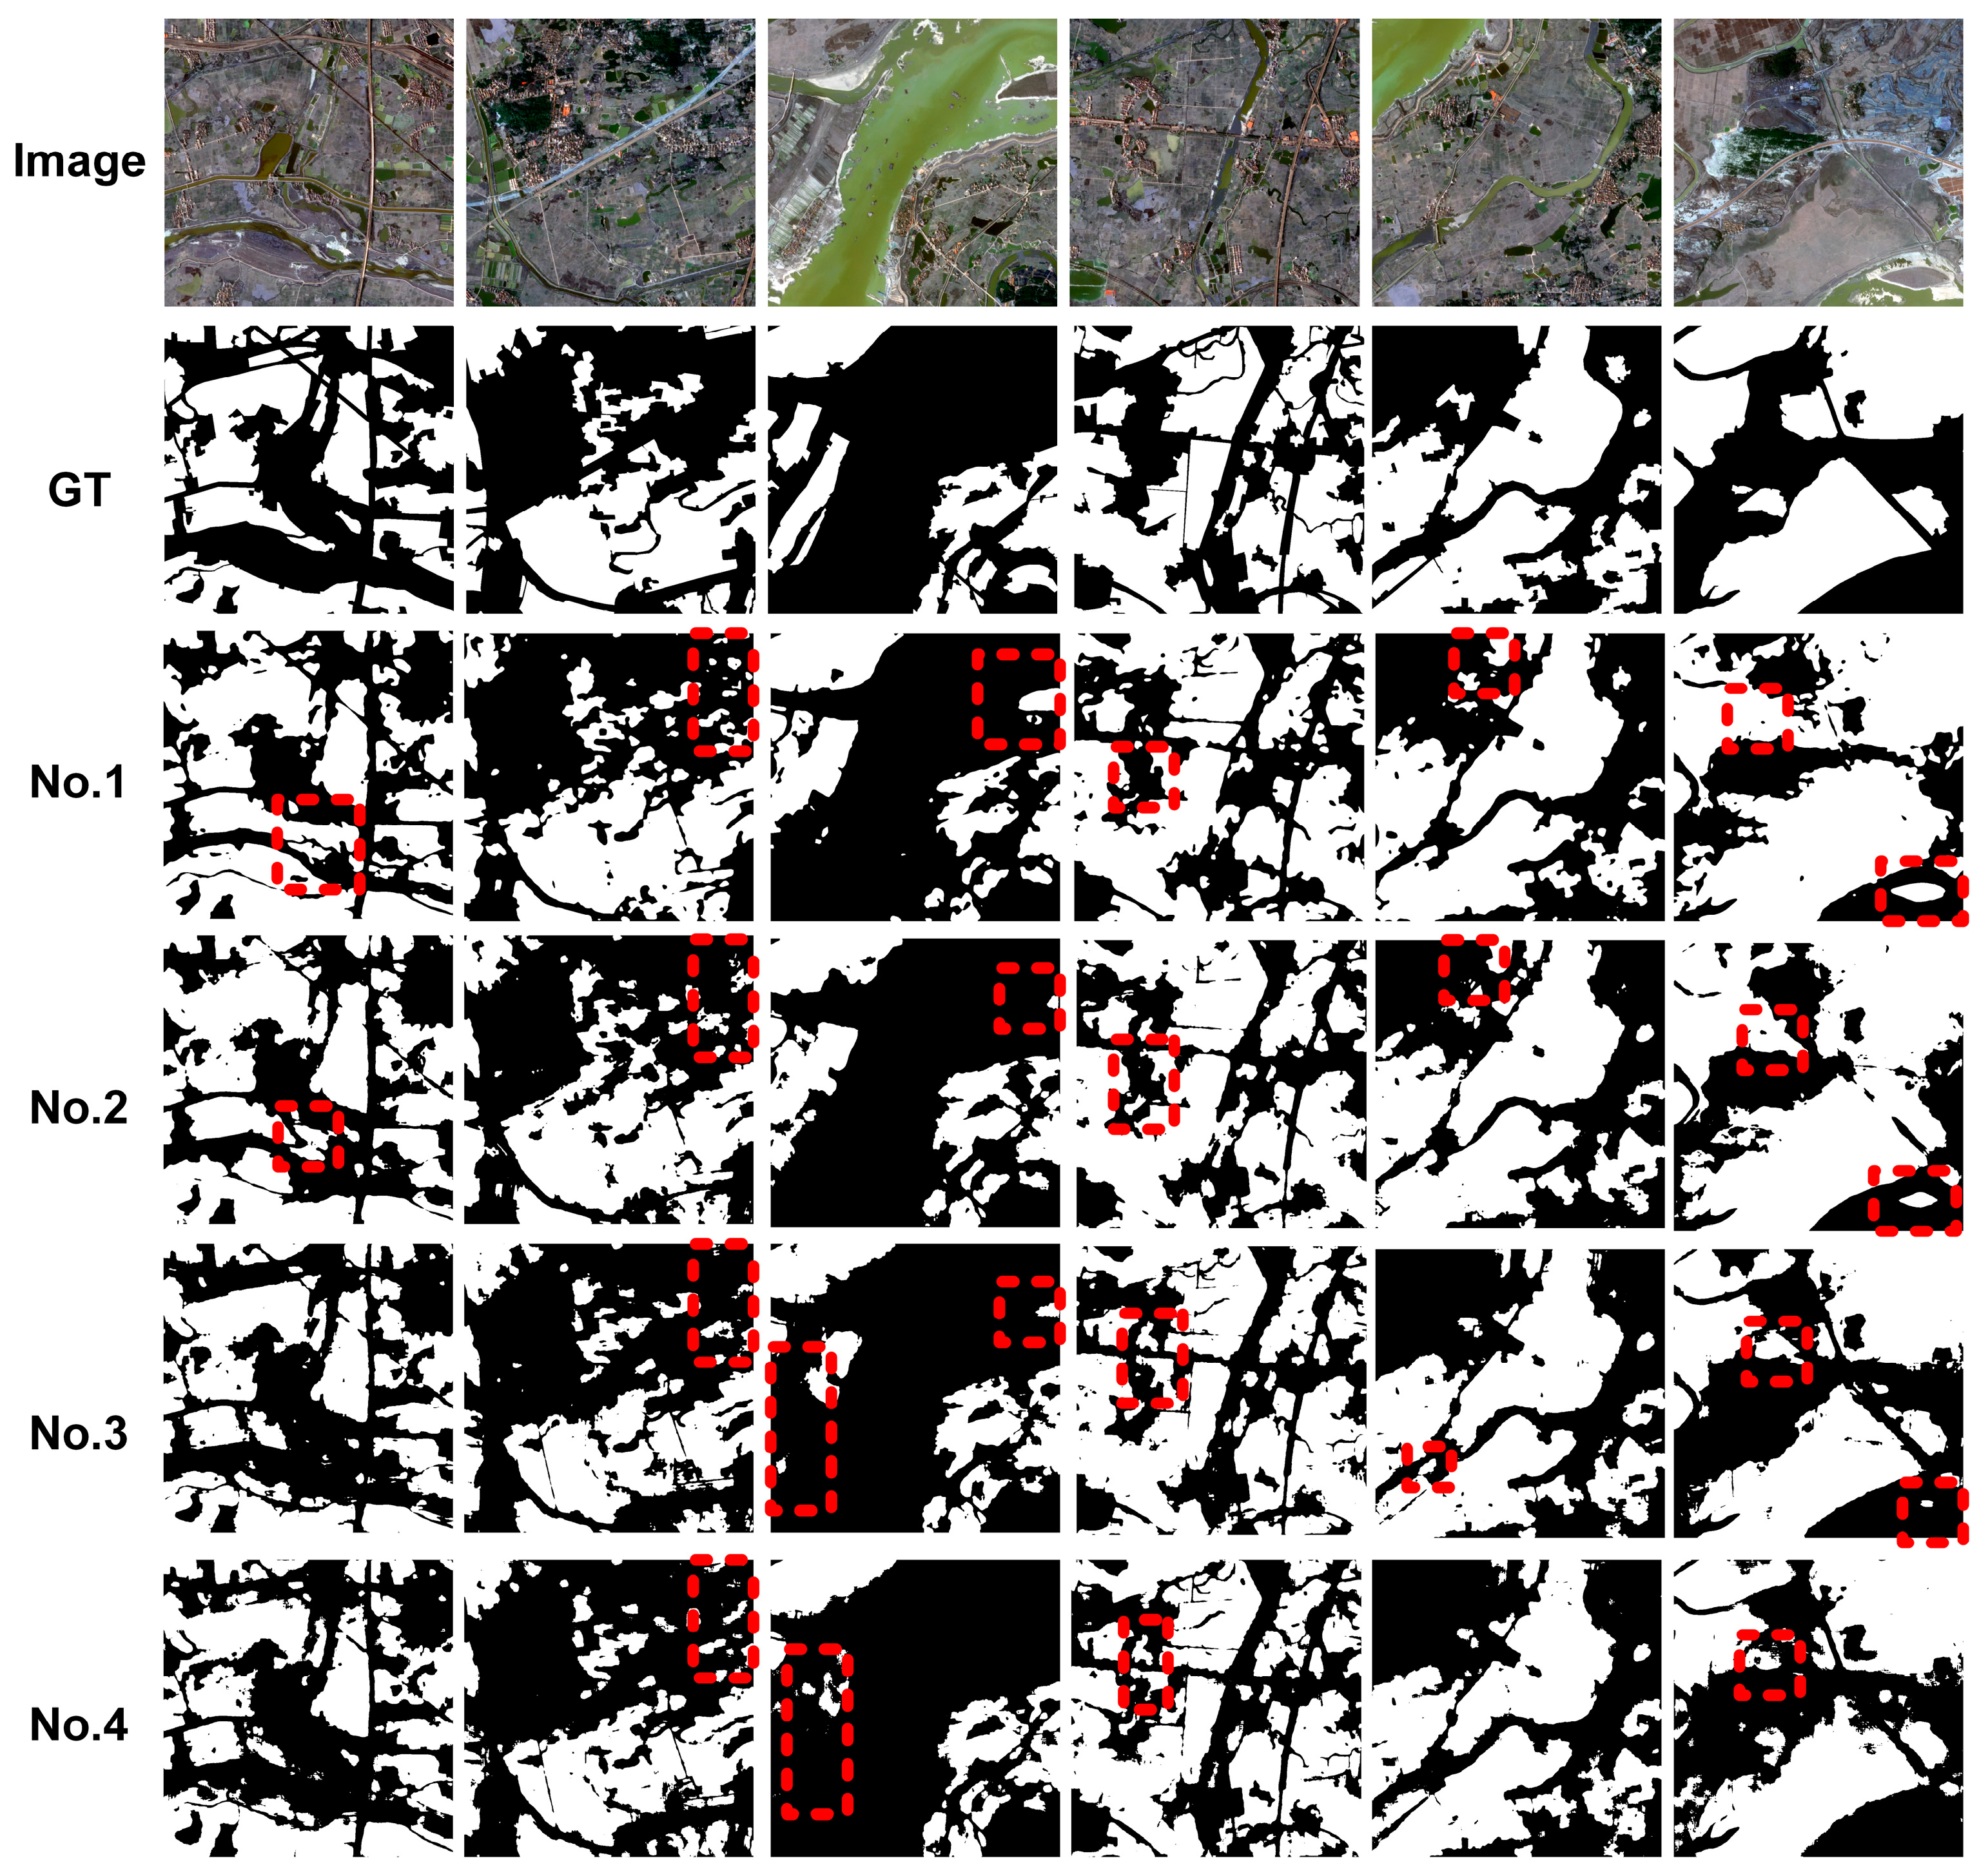
4.1. Ablation Experiments

In this study, the ablation experiments aimed to evaluate the contribution of the MCM, GAB, and MSAS modules to model performance. By progressively adding these modules under different experimental settings, four models were derived, represented as No. 1, No. 2, No. 3, and No. 4:
No. 1: Utilized only the base network without any additional modules.
No. 2: Added the MCM and GAB modules to the base network.
No. 3: Further incorporated the MSAS module into the MCM and GAB framework.
No. 4: Fully constructed the network by combining all modules (Base, MCM, GAB, MSAS).
The overall performance impact of these modules was evaluated using OA, Precision, and Recall. The study employed a variable learning rate, a batch size of 16, and 50 epochs.
In Study Area 1 (As shown in Table 2), the base network (No. 1) achieved an OA of 85.76%, Precision of 86.28%, and Recall of 86.55%. Adding the MCM (No. 2) improved the OA to 87.99%, demonstrating a significant enhancement in Overall Accuracy. Precision and Recall also increased to 87.75% and 87.88%, respectively. Adding the GAB module (No. 3) further slightly improved OA to 88.07%. Precision increased to 88.22%, but Recall decreased to 87.52%, indicating potential overfitting in some details. Finally, incorporating all modules (No. 4) achieved the highest OA of 89.95%, with Precision and Recall rising to 89.71% and 89.94%, respectively, showing better balance and precision. The MSAS module demonstrated a critical role in improving overall performance in farmland identification tasks.
From the resulting images (As shown in Figure 8), No. 1 produced regions that were relatively complete compared to the ground truth but suffered from missing details and noise points. Smaller fragmented areas were not accurately identified, especially along edges prone to misclassification. No. 2 showed clearer outlines in large regions, highlighting better extraction capabilities for primary areas. However, errors in edge regions persisted, limiting segmentation quality in finer areas. No. 3 delivered smoother results and enhanced extraction of smaller regions but exhibited over-smoothing, leading to the loss of edge details in some small regions. No. 4 achieved finer results, excelling in segmenting small structures and boundaries. However, slight over-segmentation occurred, causing some non-target regions to be misclassified.
In Study Area 2 (As shown in Table 3), the base network (No. 1) achieved an OA of 84.79%, Precision of 84.20%, and Recall of 83.58%. Adding the MCM (No. 2) improved the OA to 86.49%, with corresponding increases in Precision and Recall, demonstrating its effectiveness. Adding the GAB module (No. 3) raised the OA to 87.41%, with Precision further increasing to 87.34%, though Recall slightly decreased to 85.53%. Incorporating all modules (No. 4) significantly improved the OA to 89.30%, with Precision and Recall reaching 89.39% and 87.64%, respectively, indicating that the MSAS module greatly optimized model performance even across different datasets, achieving balanced improvements.
From the results in Study Area 2 (As shown in Figure 9), No. 1 showed substantial errors in edge details and small targets (marked with red boxes), with omission errors in some target regions. Background noise appeared as misclassified black spots. No. 2 improved the recognition of small targets but still exhibited misclassification issues in complex background regions (e.g., areas marked with red boxes). Target boundaries were overly smooth, causing deviations from the ground truth. No. 3 enhanced detail extraction, particularly for small targets (red box markers). Large regions showed better completeness, with smooth and continuous segmentation results. However, over-smoothing occurred in areas with complex textures, such as near rivers, leading to detail loss. No. 4 demonstrated superior accuracy in boundary and detail extraction, outperforming other methods in small target recognition. Large regions were more complete, and boundaries improved. However, slight over-segmentation in certain regions caused some non-target areas to be erroneously classified as targets.

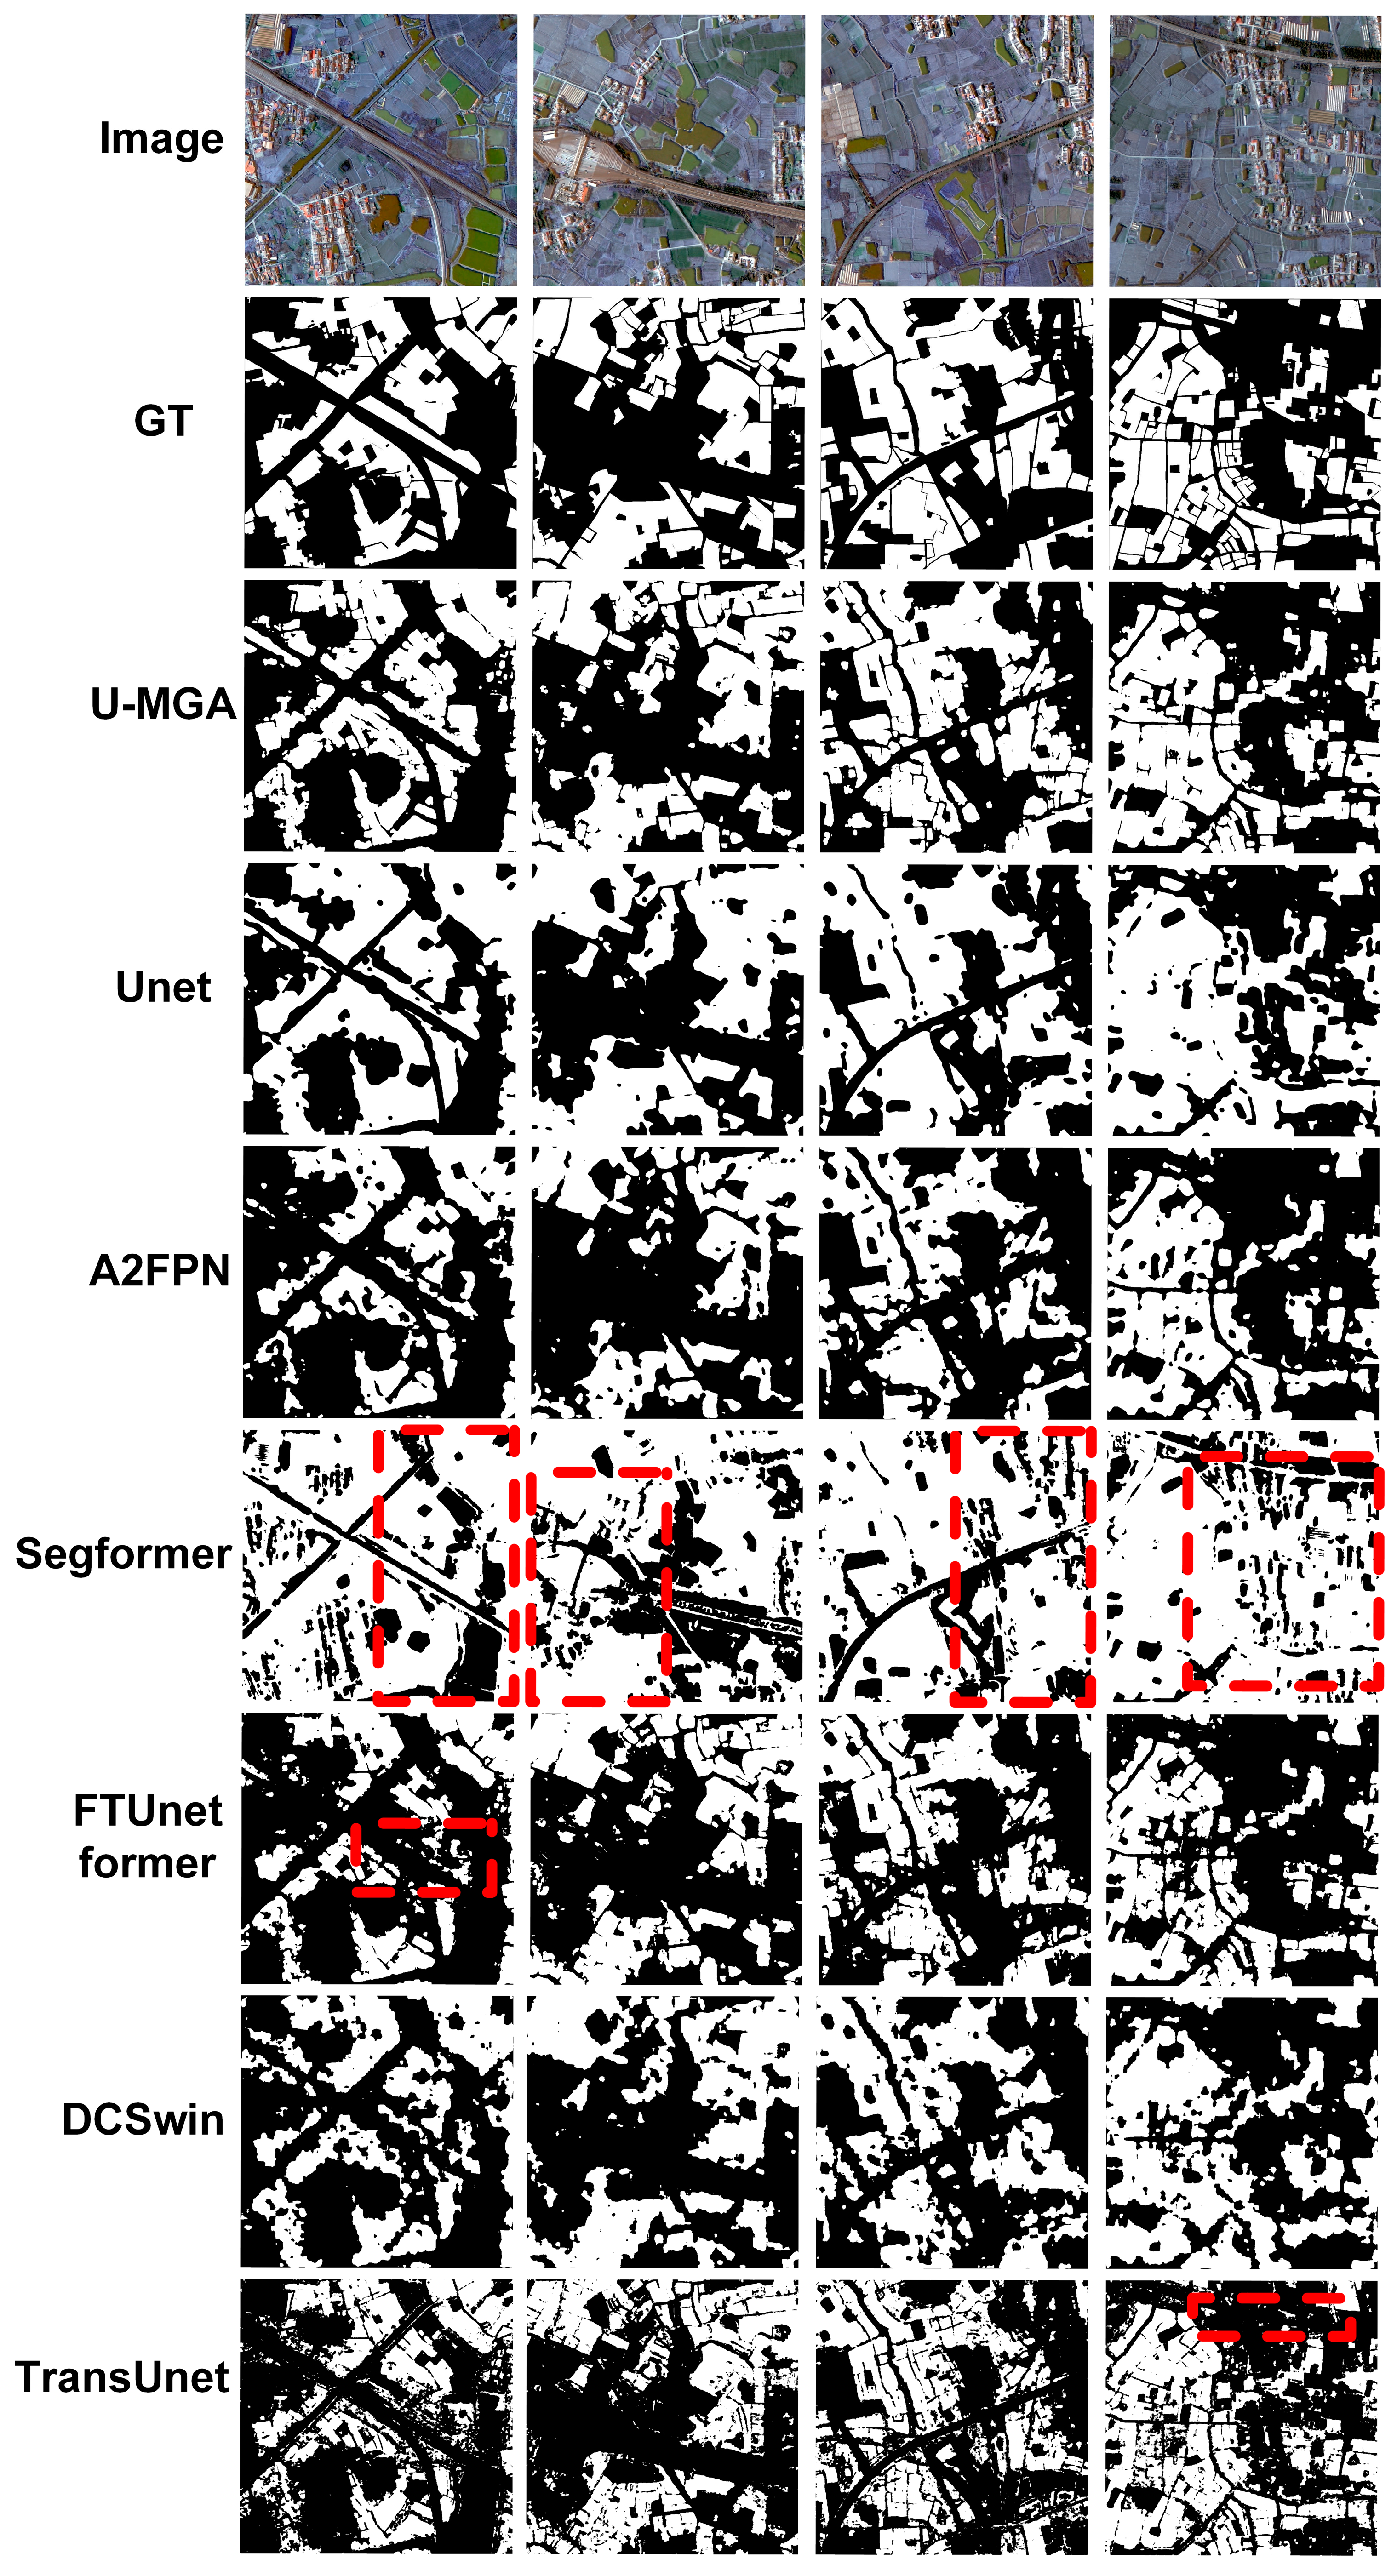
4.2. Comparative Experiments

This section discusses the complexity analysis of various models and selects several mainstream models as benchmarks, including Unet [22], A2FPN [46], Segformer [47], FTUnetformer [48], DCSwin [49], and TransUnet [50]. These models represent different technological approaches in the field of semantic segmentation. By choosing them as comparison baselines, the performance advantages of the proposed model can be validated from multiple dimensions, such as lightweight design, novelty, and complexity.
Specifically, Unet, a classic encoder–decoder structure, serves as the traditional baseline network. A2FPN, a lightweight feature pyramid network emphasizing multi-scale feature extraction, is included as a lightweight baseline. Segformer, a Transformer-based lightweight segmentation model known for its small parameter count and high performance, represents a recent research hotspot. FTUnetformer, which combines Transformer and Unet, is well suited for fine-grained segmentation in complex scenes and is categorized as a hybrid method. DCSwin, based on the Swin Transformer, excels in powerful contextual modeling but has a large parameter count. Similarly, TransUnet, a Unet variant incorporating Transformer, is considered a parameter-heavy hybrid method. The segmentation results of these models are shown in Figure 10 (for parameter settings, all models in this study were trained with variable learning rates, a batch size of 16, and 50 epochs).
From the results in Figure 10, significant differences in model performance are evident in land cover classification tasks. The U-MGA model demonstrates strong segmentation capabilities in complex terrain, roads, and building edges, effectively delineating boundaries. Moreover, it retains small parcels and linear features with higher precision, showcasing its ability to extract fine-grained features. The Unet model performs adequately overall, achieving reasonably complete segmentation results. However, under the interference of road intersections and densely populated building areas, some fine features (e.g., small parcels and edges) are missing.
The A2FPN model excels in segmenting large target areas but shares a similar drawback with Unet in handling small targets and edge regions, resulting in blurred boundaries and omission errors. Segformer exhibits notable shortcomings in handling details and complex boundaries. As highlighted in the regions marked by red dashed lines, Segformer makes significant misclassification errors, such as misclassifying large areas of building regions as cultivated land, reflecting its limited ability to extract local features. FTUnetformer performs reliably in large target area segmentation but produces coarse overall results, with weak recognition of small targets and fine details, leading to frequent misclassifications and omissions. The DCSwin model maintains the basic contours of large target areas but struggles with blurred boundaries and fails to identify small targets, resulting in low segmentation accuracy overall. TransUnet exhibits general performance in segmenting large target areas but lacks detail-processing capabilities, especially in regions rich in linear features, where segmentation results are prone to discontinuities or misclassifications.
The accuracy evaluation results in Table 4 demonstrate the comprehensive performance superiority of the proposed U-MGA model. Across all evaluation metrics, including Overall Accuracy (OA), Precision, Recall, F1-score, Intersection over Union (IoU), and Kappa coefficient, U-MGA achieves the highest scores. These results highlight the model’s outstanding performance in multiple aspects and its stability and reliability across various evaluation dimensions.
Compared with the second-best model (TransUnet), U-MGA shows significant improvements in all metrics: Overall Accuracy (OA) increases by 3.51%, Precision by 2.63%, Recall by 4.29%, F1-score by 3.84%, IoU by 6.01%, and Kappa coefficient by 7.55%. These data indicate that U-MGA can capture target region features more accurately and comprehensively, achieving a systematic breakthrough in model performance.
In addition to its superior performance, U-MGA also maintains a lightweight architecture. With a parameter count of only 13.616 M, it surpasses models like Segformer and A2FPN in performance while maintaining a relatively low parameter count compared to FTUnetformer (91.531 M), DCSwin (113.419 M), and TransUnet (387.698 M). This balance between performance and computational efficiency makes U-MGA well suited for practical applications with resource constraints.
In Study Area 2 (As shown in Figure 11), the U-MGA model again demonstrates strong boundary segmentation capabilities, particularly in extracting small parcels and complex terrain. However, due to the natural features (e.g., rivers and vegetation) and complex background information in Study Area 2, the U-MGA model shows slightly reduced boundary precision in river edge segmentation (see regions marked with red dashed lines in Figure 11). The Unet model delivers relatively complete segmentation but exhibits blurred boundaries around rivers, with lower segmentation accuracy compared to Study Area 1.
The A2FPN model continues to perform stably in segmenting large target areas, but its boundary handling for narrow structures like rivers is weak, with blurred boundaries in cultivated land regions becoming more pronounced in Study Area 2. Segformer struggles significantly in this area, with notable misclassification errors (e.g., river edges and vegetation areas misclassified as cultivated land). While FTUnetformer performs coarsely overall, it still outperforms Segformer. The DCSwin model performs poorly in Study Area 2, retaining the basic contours of large target areas but with blurred boundaries and significant detail loss. TransUnet continues to show weak segmentation of linear features, although its overall recognition of cultivated land improves slightly compared to Study Area 1.
In Study Area 2 (As shown in Table 5), the U-MGA model once again achieves the highest scores across all evaluation metrics, further verifying its comprehensive performance advantages in cultivated land recognition tasks. The superior performance of U-MGA extends its exceptional results from Study Area 1 and demonstrates greater stability and adaptability in complex environments.
Compared with the second-best model (Unet), U-MGA achieves notable improvements in Study Area 2: Overall Accuracy (OA) increases by 4.51%, Precision by 5.19%, Recall by 4.06%, F1-score by 4.66%, IoU by 7.00%, and Kappa coefficient by 9.24%. These enhancements highlight U-MGA’s ability to accurately identify target regions in complex scenarios, showcasing its robustness and stability under diverse geographical and environmental conditions.
While maintaining its leading performance, U-MGA retains a lightweight architecture, with a parameter count of 13.616M, ensuring an excellent balance between performance and computational efficiency. Despite being slightly larger than Segformer and A2FPN, its parameter count is significantly lower than FTUnetformer, DCSwin, and TransUnet. This characteristic makes U-MGA suitable for resource-sensitive practical applications.
In summary, U-MGA demonstrates exceptional feature extraction and classification capabilities in Study Area 2, excelling in segmentation tasks for complex terrain and small parcels. While minor blurring issues persist in handling natural features such as river edges, the model exhibits strong overall performance, robustness, and adaptability, further validating its potential in diverse cultivated land scenarios.

5. Conclusions

This study presents U-MGA, a lightweight deep learning network for arable land recognition. A Multi-Scale Attention Module (MSAS) is first designed to allow the model to capture multi-scale information and fine-grained features during the feature extraction phase. During the feature reconstruction phase, the MCM and GAB modules are introduced to fully exploit the extracted multi-scale and fine-grained features. Unlike conventional approaches, U-MGA effectively adapts to the characteristics of arable land and improves classification accuracy with only a minimal increase in the number of parameters. The results from two arable land datasets demonstrate that U-MGA outperforms current mainstream deep learning networks in complex arable land conditions, achieving superior recognition performance.
Nevertheless, U-MGA has some limitations. First, when processing regions with complex boundaries (e.g., rivers or farmland with highly variable borders), the model inevitably exhibits misclassification and omission. Future research will explore more refined boundary detection mechanisms to enhance segmentation accuracy in complex farmland scenarios. Second, although the computational cost of U-MGA is relatively low, its parameter count still reaches 13.616 million. Therefore, future work will focus on developing more efficient optimization strategies, such as simplifying the network architecture and incorporating lightweight modules, to improve processing efficiency and practicality.

Author Contributions

Conceptualization, Y.C., Y.X., W.Y. and Y.Z.; Methodology, Y.C., Y.X., W.Y., X.W., Y.Y. and L.T.; Software, Y.C., Y.X., Y.Z. and L.T.; Validation, Y.X.; Formal analysis, Y.C. and Y.X.; Resources, Y.C. and W.Y.; Data curation, Y.C., Y.X., W.Y., Y.Z. and X.W.; Writing—original draft, Y.C., Y.X. and L.T.; Writing—review & editing, Y.C. and Y.X.; Visualization, Y.C., Y.X., Y.Y. and L.T.; Supervision, Y.Y. and L.T.; Project administration, Y.C., W.Y., Y.Y. and L.T.; Funding acquisition, Y.C., Y.Y. and L.T. All authors have read and agreed to the published version of the manuscript.

Funding

This research received no external funding.

Data Availability Statement

The remote sensing datasets containing GF-2 images were downloaded from https://data.cresda.cn (accessed on 12 June 2024). The GID dataset was downloaded from https://x-ytong.github.io/project/GID.html (accessed on 8 November 2024).

Conflicts of Interest

The authors declare no conflict of interest.

References

  1. Chen, A.; He, H.; Wang, J.; Li, M.; Guan, Q.; Hao, J. A study on the arable land demand for food security in China. Sustainability 2019, 11, 4769. [Google Scholar] [CrossRef]
  2. Liao, Y.; Lu, X.; Liu, J.; Huang, J.; Qu, Y.; Qiao, Z.; Xie, Y.; Liao, X.; Liu, L. Integrated Assessment of the Impact of Cropland Use Transition on Food Production Towards the Sustainable Development of Social–Ecological Systems. Agronomy 2024, 14, 2851. [Google Scholar] [CrossRef]
  3. Zhao, S.; Yin, M. Change of urban and rural construction land and driving factors of arable land occupation. PLoS ONE 2023, 18, e0286248. [Google Scholar] [CrossRef]
  4. Sun, X.; Xiang, P.; Cong, K. Research on early warning and control measures for arable land resource security. Land Use Policy 2023, 128, 106601. [Google Scholar] [CrossRef]
  5. Wang, S.; Han, W.; Huang, X.; Zhang, X.; Wang, L.; Li, J. Trustworthy remote sensing interpretation: Concepts, technologies, and applications. ISPRS J. Photogramm. Remote Sens. 2024, 209, 150–172. [Google Scholar] [CrossRef]
  6. Turker, M.; Ozdarici, A. Field-based crop classification using SPOT4, SPOT5, IKONOS and QuickBird imagery for agricultural areas: A comparison study. Int. J. Remote Sens. 2011, 32, 9735–9768. [Google Scholar] [CrossRef]
  7. Yang, C.; Everitt, J.H.; Murden, D. Evaluating high resolution SPOT 5 satellite imagery for crop identification. Comput. Electron. Agric. 2011, 75, 347–354. [Google Scholar] [CrossRef]
  8. Tehrany, M.S.; Pradhan, B.; Jebuv, M.N. A comparative assessment between object and pixel-based classification approaches for land use/land cover mapping using SPOT 5 imagery. Geocarto Int. 2014, 29, 351–369. [Google Scholar] [CrossRef]
  9. Zhao, B.; Ma, N.; Yang, J.; Li, Z.; Wang, Q. Extracting features of soil and water conservation measures from remote sensing images of different resolution levels: Accuracy analysis. Bull. Soil Water Conserv. 2012, 32, 154–157. [Google Scholar]
  10. Agnoletti, M.; Cargnello, G.; Gardin, L.; Santoro, A.; Bazzoffi, P.; Sansone, L.; Pezza, L.; Belfiore, N. Traditional landscape and rural development: Comparative study in three terraced areas in northern, central and southern Italy to evaluate the efficacy of GAEC standard 4.4 of cross compliance. Ital. J. Agron. 2011, 6, e16. [Google Scholar] [CrossRef]
  11. Martínez-Casasnovas, J.A.; Ramos, M.C.; Cots-Folch, R. Influence of the EU CAP on terrain morphology and vineyard cultivation in the Priorat region of NE Spain. Land Use Policy 2010, 27, 11–21. [Google Scholar] [CrossRef]
  12. Sofia, G.; Bailly, J.-S.; Chehata, N.; Tarolli, P.; Levavasseur, F. Comparison of pleiades and LiDAR digital elevation models for terraces detection in farmlands. IEEE J. Sel. Top. Appl. Earth Obs. Remote Sens. 2016, 9, 1567–1576. [Google Scholar] [CrossRef]
  13. Zhang, C.; Pan, X.; Li, H.; Gardiner, A.; Sargent, I.; Hare, J.; Atkinson, P.M. A hybrid MLP-CNN classifier for very fine resolution remotely sensed image classification. ISPRS J. Photogramm. Remote Sens. 2018, 140, 133–144. [Google Scholar] [CrossRef]
  14. Bascoy, P.G.; Garea, A.S.; Heras, D.B.; Argüello, F.; Ordóñez, A. Texture-based analysis of hydrographical basins with multispectral imagery. In Proceedings of the Remote Sensing for Agriculture, Ecosystems, and Hydrology XXI, Strasbourg, France, 9–11 September 2019; pp. 225–234. [Google Scholar]
  15. Zhu, W.; Rezaei, E.E.; Nouri, H.; Sun, Z.; Li, J.; Yu, D.; Siebert, S. UAV flight height impacts on wheat biomass estimation via machine and deep learning. IEEE J. Sel. Top. Appl. Earth Obs. Remote Sens. 2023, 16, 7471–7485. [Google Scholar] [CrossRef]
  16. Hofmann, P.; Blaschke, T.; Strobl, J. Quantifying the robustness of fuzzy rule sets in object-based image analysis. Int. J. Remote Sens. 2011, 32, 7359–7381. [Google Scholar] [CrossRef]
  17. Diaz-Varela, R.A.; Zarco-Tejada, P.J.; Angileri, V.; Loudjani, P. Automatic identification of agricultural terraces through object-oriented analysis of very high resolution DSMs and multispectral imagery obtained from an unmanned aerial vehicle. J. Environ. Manag. 2014, 134, 117–126. [Google Scholar] [CrossRef] [PubMed]
  18. Eckert, S.; Ghebremicael, S.T.; Hurni, H.; Kohler, T. Identification and classification of structural soil conservation measures based on very high resolution stereo satellite data. J. Environ. Manag. 2017, 193, 592–606. [Google Scholar] [CrossRef] [PubMed]
  19. Han, W.; Zhang, X.; Wang, Y.; Wang, L.; Huang, X.; Li, J.; Wang, S.; Chen, W.; Li, X.; Feng, R. A survey of machine learning and deep learning in remote sensing of geological environment: Challenges, advances, and opportunities. ISPRS J. Photogramm. Remote Sens. 2023, 202, 87–113. [Google Scholar] [CrossRef]
  20. He, C.; Liu, Y.; Wang, D.; Liu, S.; Yu, L.; Ren, Y. Automatic extraction of bare soil land from high-resolution remote sensing images based on semantic segmentation with deep learning. Remote Sens. 2023, 15, 1646. [Google Scholar] [CrossRef]
  21. Voelsen, M.; Lauble, S.; Rottensteiner, F.; Heipke, C. Transformer Models for Multi-Temporal Land Cover Classification Using Remote Sensing Images. ISPRS Ann. Photogramm. Remote Sens. Spat. Inf. Sci. 2023, 10, 981–990. [Google Scholar] [CrossRef]
  22. Singh, N.J.; Nongmeikapam, K. Semantic segmentation of satellite images using deep-unet. Arab. J. Sci. Eng. 2023, 48, 1193–1205. [Google Scholar] [CrossRef]
  23. Chang, Z.; Li, H.; Chen, D.; Liu, Y.; Zou, C.; Chen, J.; Han, W.; Liu, S.; Zhang, N. Crop Type Identification Using High-Resolution Remote Sensing Images Based on an Improved DeepLabV3+ Network. Remote Sens. 2023, 15, 5088. [Google Scholar] [CrossRef]
  24. Jiang, J.; Lyu, C.; Liu, S.; He, Y.; Hao, X. RWSNet: A semantic segmentation network based on SegNet combined with random walk for remote sensing. Int. J. Remote Sens. 2020, 41, 487–505. [Google Scholar] [CrossRef]
  25. Tao, Y.; Xu, M.; Lu, Z.; Zhong, Y. DenseNet-based depth-width double reinforced deep learning neural network for high-resolution remote sensing image per-pixel classification. Remote Sens. 2018, 10, 779. [Google Scholar] [CrossRef]
  26. Wang, M.; Zhang, X.; Niu, X.; Wang, F.; Zhang, X. Scene classification of high-resolution remotely sensed image based on ResNet. J. Geovisualization Spat. Anal. 2019, 3, 16. [Google Scholar] [CrossRef]
  27. Sun, W.; Zhou, R.; Nie, C.; Wang, L.; Sun, J. Farmland segmentation from remote sensing images using deep learning methods. In Proceedings of the Remote Sensing for Agriculture, Ecosystems, and Hydrology XXII, online, 21–25 September 2020; pp. 51–57. [Google Scholar]
  28. Sun, Y.; Li, Z.-L.; Luo, J.; Wu, T.; Liu, N. Farmland parcel-based crop classification in cloudy/rainy mountains using Sentinel-1 and Sentinel-2 based deep learning. Int. J. Remote Sens. 2022, 43, 1054–1073. [Google Scholar] [CrossRef]
  29. Han, W.; Feng, R.; Wang, L.; Cheng, Y. A semi-supervised generative framework with deep learning features for high-resolution remote sensing image scene classification. ISPRS J. Photogramm. Remote Sens. 2018, 145, 23–43. [Google Scholar] [CrossRef]
  30. Hu, L.; Qin, M.; Zhang, F.; Du, Z.; Liu, R. RSCNN: A CNN-based method to enhance low-light remote-sensing images. Remote Sens. 2020, 13, 62. [Google Scholar] [CrossRef]
  31. Tian, T.; Li, L.; Chen, W.; Zhou, H. SEMSDNet: A multiscale dense network with attention for remote sensing scene classification. IEEE J. Sel. Top. Appl. Earth Obs. Remote Sens. 2021, 14, 5501–5514. [Google Scholar] [CrossRef]
  32. Zhang, Y.; Zhao, H.; Ma, G.; Xie, D.; Geng, S.; Lu, H.; Tian, W.; Lim Kam Sian, K.T.C. MAAFEU-NET: A novel land use classification model based on mixed attention module and adjustable feature enhancement layer in remote sensing images. ISPRS Int. J. Geo-Inf. 2023, 12, 206. [Google Scholar] [CrossRef]
  33. Lv, N.; Zhang, Z.; Li, C.; Deng, J.; Su, T.; Chen, C.; Zhou, Y. A hybrid-attention semantic segmentation network for remote sensing interpretation in land-use surveillance. Int. J. Mach. Learn. Cybern. 2023, 14, 395–406. [Google Scholar] [CrossRef]
  34. Popel, M.; Bojar, O. Training tips for the transformer model. arXiv 2018, arXiv:1804.00247. [Google Scholar] [CrossRef]
  35. Dosovitskiy, A. An image is worth 16x16 words: Transformers for image recognition at scale. arXiv 2020, arXiv:2010.11929. [Google Scholar]
  36. Thisanke, H.; Deshan, C.; Chamith, K.; Seneviratne, S.; Vidanaarachchi, R.; Herath, D. Semantic segmentation using Vision Transformers: A survey. Eng. Appl. Artif. Intell. 2023, 126, 106669. [Google Scholar] [CrossRef]
  37. Chen, J.; Lu, Y.; Yu, Q.; Luo, X.; Adeli, E.; Wang, Y.; Lu, L.; Yuille, A.L.; Zhou, Y. Transunet: Transformers make strong encoders for medical image segmentation. arXiv 2021, arXiv:2102.04306. [Google Scholar]
  38. Omia, E.; Bae, H.; Park, E.; Kim, M.S.; Baek, I.; Kabenge, I.; Cho, B.-K. Remote sensing in field crop monitoring: A comprehensive review of sensor systems, data analyses and recent advances. Remote Sens. 2023, 15, 354. [Google Scholar] [CrossRef]
  39. Song, C.; Chen, J.M.; Hwang, T.; Gonsamo, A.; Croft, H.; Zhang, Q.; Dannenberg, M.; Zhang, Y.; Hakkenberg, C.; Li, J. Ecological characterization of vegetation using multi-sensor remote sensing in the solar reflective spectrum. In Remote Sensing Handbook, Volume IV; CRC Press: Boca Raton, FL, USA, 2024; pp. 249–308. [Google Scholar]
  40. Zhai, Y.; Zhou, L.; Qi, H.; Gao, P.; Zhang, C. Application of visible/near-infrared spectroscopy and hyperspectral imaging with machine learning for high-throughput plant heavy metal stress phenotyping: A review. Plant Phenomics 2023, 5, 0124. [Google Scholar] [CrossRef] [PubMed]
  41. Li, L.; Mu, X.; Jiang, H.; Chianucci, F.; Hu, R.; Song, W.; Qi, J.; Liu, S.; Zhou, J.; Chen, L. Review of ground and aerial methods for vegetation cover fraction (fCover) and related quantities estimation: Definitions, advances, challenges, and future perspectives. ISPRS J. Photogramm. Remote Sens. 2023, 199, 133–156. [Google Scholar] [CrossRef]
  42. Hu, J.; Shen, L.; Sun, G. Squeeze-and-excitation networks. In Proceedings of the IEEE Conference on Computer Vision and Pattern Recognition, Salt Lake City, UT, USA, 18–23 June 2018; pp. 7132–7141. [Google Scholar]
  43. Woo, S.; Park, J.; Lee, J.-Y.; Kweon, I.S. Cbam: Convolutional block attention module. In Proceedings of the European Conference on Computer Vision (ECCV), Munich, Germany, 8–14 September 2018; pp. 3–19. [Google Scholar]
  44. Zhong, M.; Sun, J.; Ren, P.; Wang, F.; Sun, F. MAGNet: Multi-scale Awareness and Global fusion Network for RGB-D salient object detection. Knowl.-Based Syst. 2024, 299, 112126. [Google Scholar] [CrossRef]
  45. Ruan, J.; Xie, M.; Gao, J.; Liu, T.; Fu, Y. Ege-unet: An efficient group enhanced unet for skin lesion segmentation. In Proceedings of the International Conference on Medical Image Computing and Computer-Assisted Intervention, Vancouver, BC, Canada, 8–12 October 2023; pp. 481–490. [Google Scholar]
  46. Hu, M.; Li, Y.; Fang, L.; Wang, S. A2-FPN: Attention aggregation based feature pyramid network for instance segmentation. In Proceedings of the IEEE/CVF Conference on Computer Vision and Pattern Recognition, Nashville, TN, USA, 20–25 June 2021; pp. 15343–15352. [Google Scholar]
  47. Xie, E.; Wang, W.; Yu, Z.; Anandkumar, A.; Alvarez, J.M.; Luo, P. SegFormer: Simple and efficient design for semantic segmentation with transformers. Adv. Neural Inf. Process. Syst. 2021, 34, 12077–12090. [Google Scholar]
  48. Wang, L.; Li, R.; Zhang, C.; Fang, S.; Duan, C.; Meng, X.; Atkinson, P.M. UNetFormer: A UNet-like transformer for efficient semantic segmentation of remote sensing urban scene imagery. ISPRS J. Photogramm. Remote Sens. 2022, 190, 196–214. [Google Scholar] [CrossRef]
  49. Wang, L.; Li, R.; Duan, C.; Zhang, C.; Meng, X.; Fang, S. A novel transformer based semantic segmentation scheme for fine-resolution remote sensing images. IEEE Geosci. Remote Sens. Lett. 2022, 19, 6506105. [Google Scholar] [CrossRef]
  50. Chen, J.; Mei, J.; Li, X.; Lu, Y.; Yu, Q.; Wei, Q.; Luo, X.; Xie, Y.; Adeli, E.; Wang, Y. TransUNet: Rethinking the U-Net architecture design for medical image segmentation through the lens of transformers. Med. Image Anal. 2024, 97, 103280. [Google Scholar] [CrossRef] [PubMed]
Figure 1. Geographic location map of the study area.
Remotesensing 17 00760 g001
Figure 2. Original imagery and arable land label map for the GID dataset. (a) Image. (b) Ground-truth map.
Remotesensing 17 00760 g002
Figure 3. Example images after enhancement and their corresponding label maps (white indicates arable land, and black indicates other areas).
Remotesensing 17 00760 g003
Figure 4. U-MGA network architecture (white indicates arable land, and black indicates other areas).
Remotesensing 17 00760 g004
Figure 5. MSAS module structure.
Remotesensing 17 00760 g005
Figure 6. MCM structure diagram.
Remotesensing 17 00760 g006
Figure 7. GAB module structure diagram.
Remotesensing 17 00760 g007
Figure 8. Experimental results of ablation based on Study Area 1 (white indicates arable land, and black indicates other areas).
Remotesensing 17 00760 g008
Figure 9. Ablation experiment results for Study Area 2 (red dashed boxes highlight areas with noticeable misclassification or omission. White indicates arable land, and black indicates other areas).
Remotesensing 17 00760 g009
Figure 10. Comparative experiment results based on Study Area 1 (red dashed boxes highlight areas with noticeable misclassification or omission. White indicates arable land, and black indicates other areas).
Remotesensing 17 00760 g010
Figure 11. Comparative experiment results based on Study Area 2 (red dashed boxes highlight areas with noticeable misclassification or omission. White indicates arable land, and black indicates other areas).
Remotesensing 17 00760 g011
Table 1. Technical specifications of the GF-2 satellite.
LoadSpatial ResolutionSpectral RangeObservation WidthRevisit Period
PMS (panchromatic and multispectral) sensor1 m450–900 nm45 km5 days
4 m450–520 nm
520–590 nm
630–690 nm
770–890 nm
Table 2. Ablation experiments for Study Area 1. (Modules marked with “√” were added; values in red font indicate the highest metrics. The evaluation results represent the mean and standard deviation across four regions.)
BaseMCMGABMSASOAPrecisionRecall
No. 1 85.76 ± 2.2986.28 ± 1.8986.55 ± 1.91
No. 2 87.99 ± 1.7587.75 ± 1.9087.88 ± 1.85
No. 3 88.07 ± 2.0988.22 ± 2.0187.52 ± 2.71
No. 489.95 ± 1.5589.71 ± 1.7089.94 ± 1.54
Table 3. Ablation experiments for Study Area 2. (Modules marked with “√” were added; values in red font indicate the highest metrics. The evaluation results represent the mean and standard deviation across six regions.)
BaseMCMGABMSASOAPrecisionRecall
No. 1 84.79 ± 2.8684.20 ± 3.4483.58 ± 3.82
No. 2 86.49 ± 2.2786.06 ± 2.7085.45 ± 2.86
No. 3 87.41 ± 1.6487.34 ± 2.3485.53 ± 4.46
No. 489.30 ± 1.5789.39 ± 1.6087.64 ± 3.52
Table 4. Accuracy evaluation of comparative experiments in Study Area 1. (Red numbers indicate the highest values for each evaluation metric. Results are the average and standard deviation across four regions.)
OA
(%)
Precision
(%)
Recall
(%)
F1
(%)
IoU
(%)
Kappa
(%)
Parameters
(M)
U-MGA (ours)89.95 ± 1.5589.71 ± 1.7089.94 ± 1.5489.80 ± 1.6381.56 ± 2.6779.61 ± 3.2613.616
Unet85.76 ± 2.2986.28 ± 1.8986.55 ± 1.9185.70 ± 2.3075.06 ± 3.5471.65 ± 4.4112.705
A2FPN85.71 ± 1.3186.65 ± 1.3584.79 ± 1.5785.17 ± 1.4974.31 ± 2.2170.52 ± 2.9311.596
Segformer67.15 ± 2.4374.40 ± 2.4569.66 ± 1.5766.04 ± 2.3349.65 ± 2.6037.10 ± 3.403.54
FTUnetformer86.09 ± 2.3987.02 ± 2.1485.04 ± 3.0285.50 ± 2.8174.90 ± 4.1771.17 ± 5.5091.531
DCSwin84.29 ± 2.0984.28 ± 2.2283.81 ± 2.2383.93 ± 2.2472.45 ± 3.3367.90 ± 4.46113.419
TransUnet86.44 ± 2.0987.08 ± 2.0185.65 ± 2.5285.96 ± 2.3975.55 ± 3.5972.06 ± 4.71387.698
Table 5. Accuracy evaluation of comparative experiments in Study Area 2. (Red numbers indicate the highest values for each evaluation metric. Results are the average and standard deviation across six regions.)
OA
(%)
Precision
(%)
Recall
(%)
F1
(%)
IoU
(%)
Kappa
(%)
Parameters
(M)
U-MGA (ours)89.30 ± 1.5789.39 ± 1.6087.64 ± 3.5288.24 ± 2.5279.25 ± 3.7676.53 ± 4.9813.616
Unet84.79 ± 2.8684.20 ± 3.4483.58 ± 3.8283.58 ± 3.7772.25 ± 5.3367.29 ± 7.4512.705
A2FPN84.51 ± 2.9085.01 ± 2.4482.55 ± 4.1882.92 ± 3.6871.37 ± 5.1666.19 ± 7.1411.596
Segformer71.18 ± 7.1270.66 ± 7.6671.39 ± 7.3870.18 ± 8.1354.95 ± 9.3041.22 ± 15.473.54
FTUnetformer84.18 ± 2.8284.14 ± 3.9981.63 ± 6.2982.10 ± 5.4670.54 ± 6.8264.51 ± 10.7091.531
DCSwin82.99 ± 3.1482.98 ± 2.9581.02 ± 4.3381.34 ± 3.8869.14 ± 5.3662.98 ± 7.54113.419
TransUnet82.90 ± 5.6781.61 ± 6.7681.58 ± 6.8281.54 ± 6.7969.73 ± 9.0463.10 ± 13.57387.698
Disclaimer/Publisher’s Note: The statements, opinions and data contained in all publications are solely those of the individual author(s) and contributor(s) and not of MDPI and/or the editor(s). MDPI and/or the editor(s) disclaim responsibility for any injury to people or property resulting from any ideas, methods, instructions or products referred to in the content.

