Quantifying Tree Structural Change in an African Savanna by Utilizing Multi-Temporal TLS Data
Abstract
1. Introduction
- To quantify the change in tree structure by analyzing the change in (DBH, height and crown area, volume, and branch length) in the four years
- Discuss the factors driving changes in tree structure, specifically focusing on elephants and drought
2. Materials and Methods
2.1. Study Site
2.2. Terrestrial Laser Scanning and Data Pre-Processing
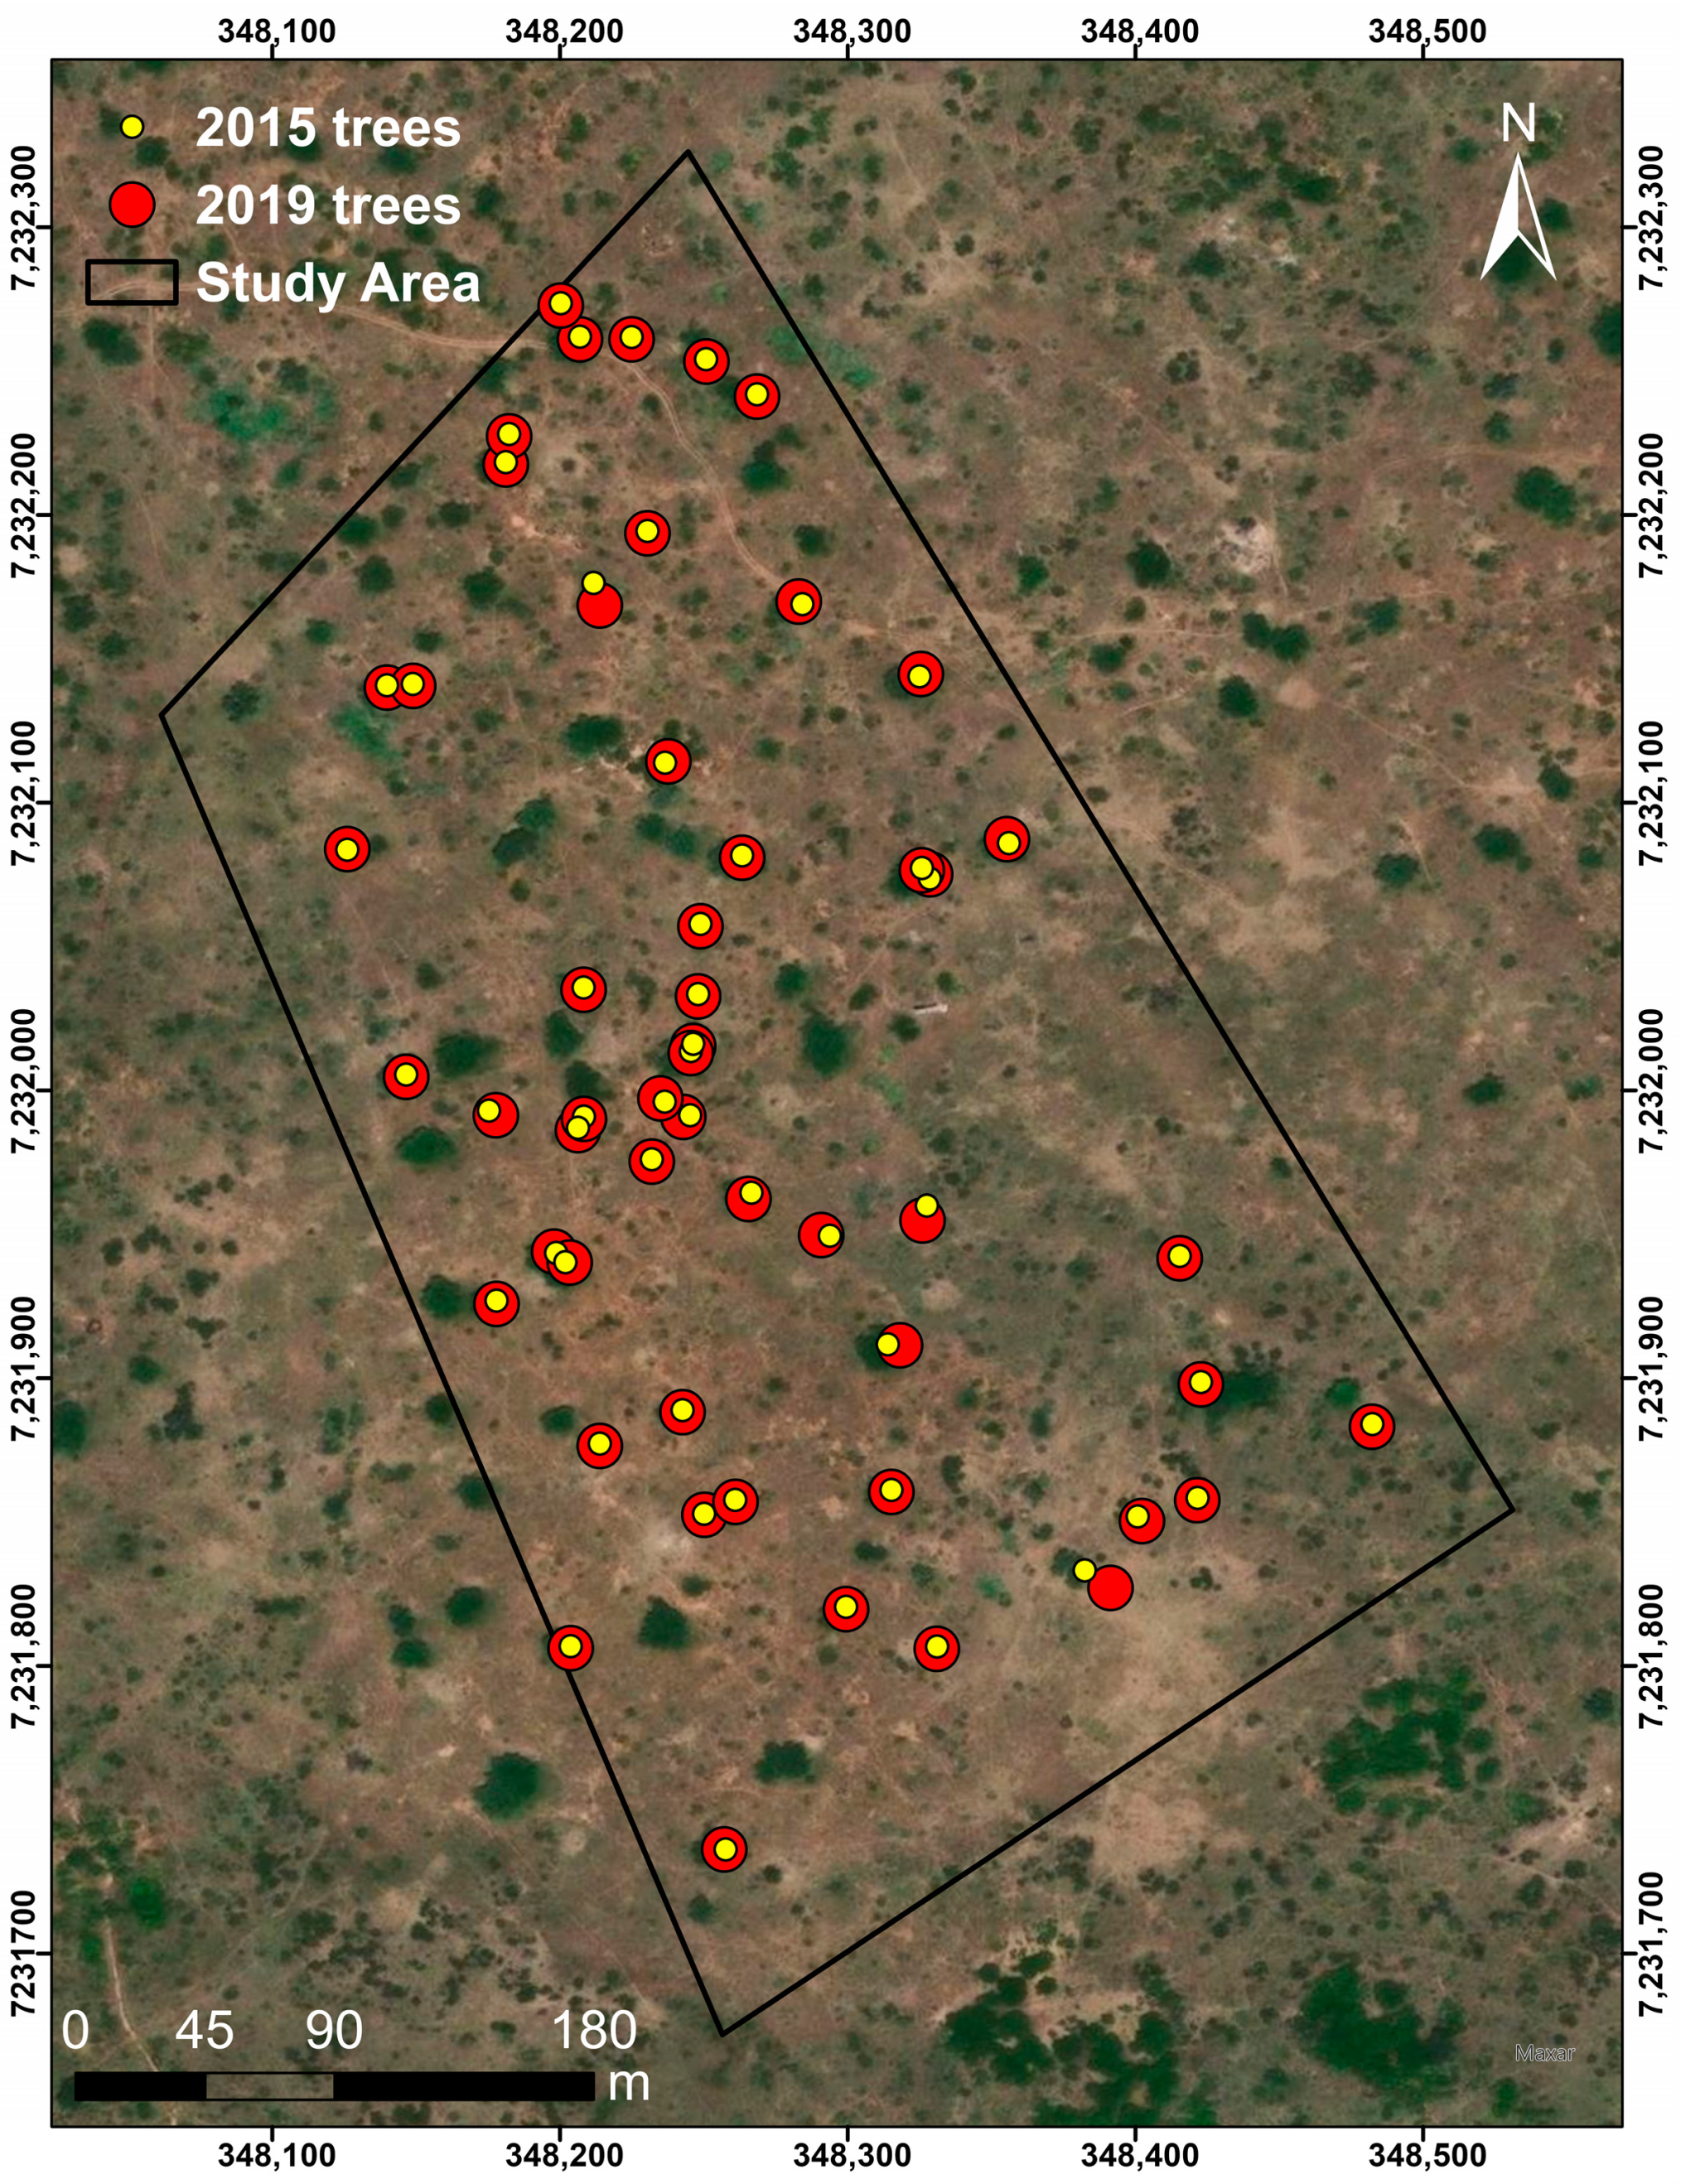
2.3. Tree-to-Tree Matching
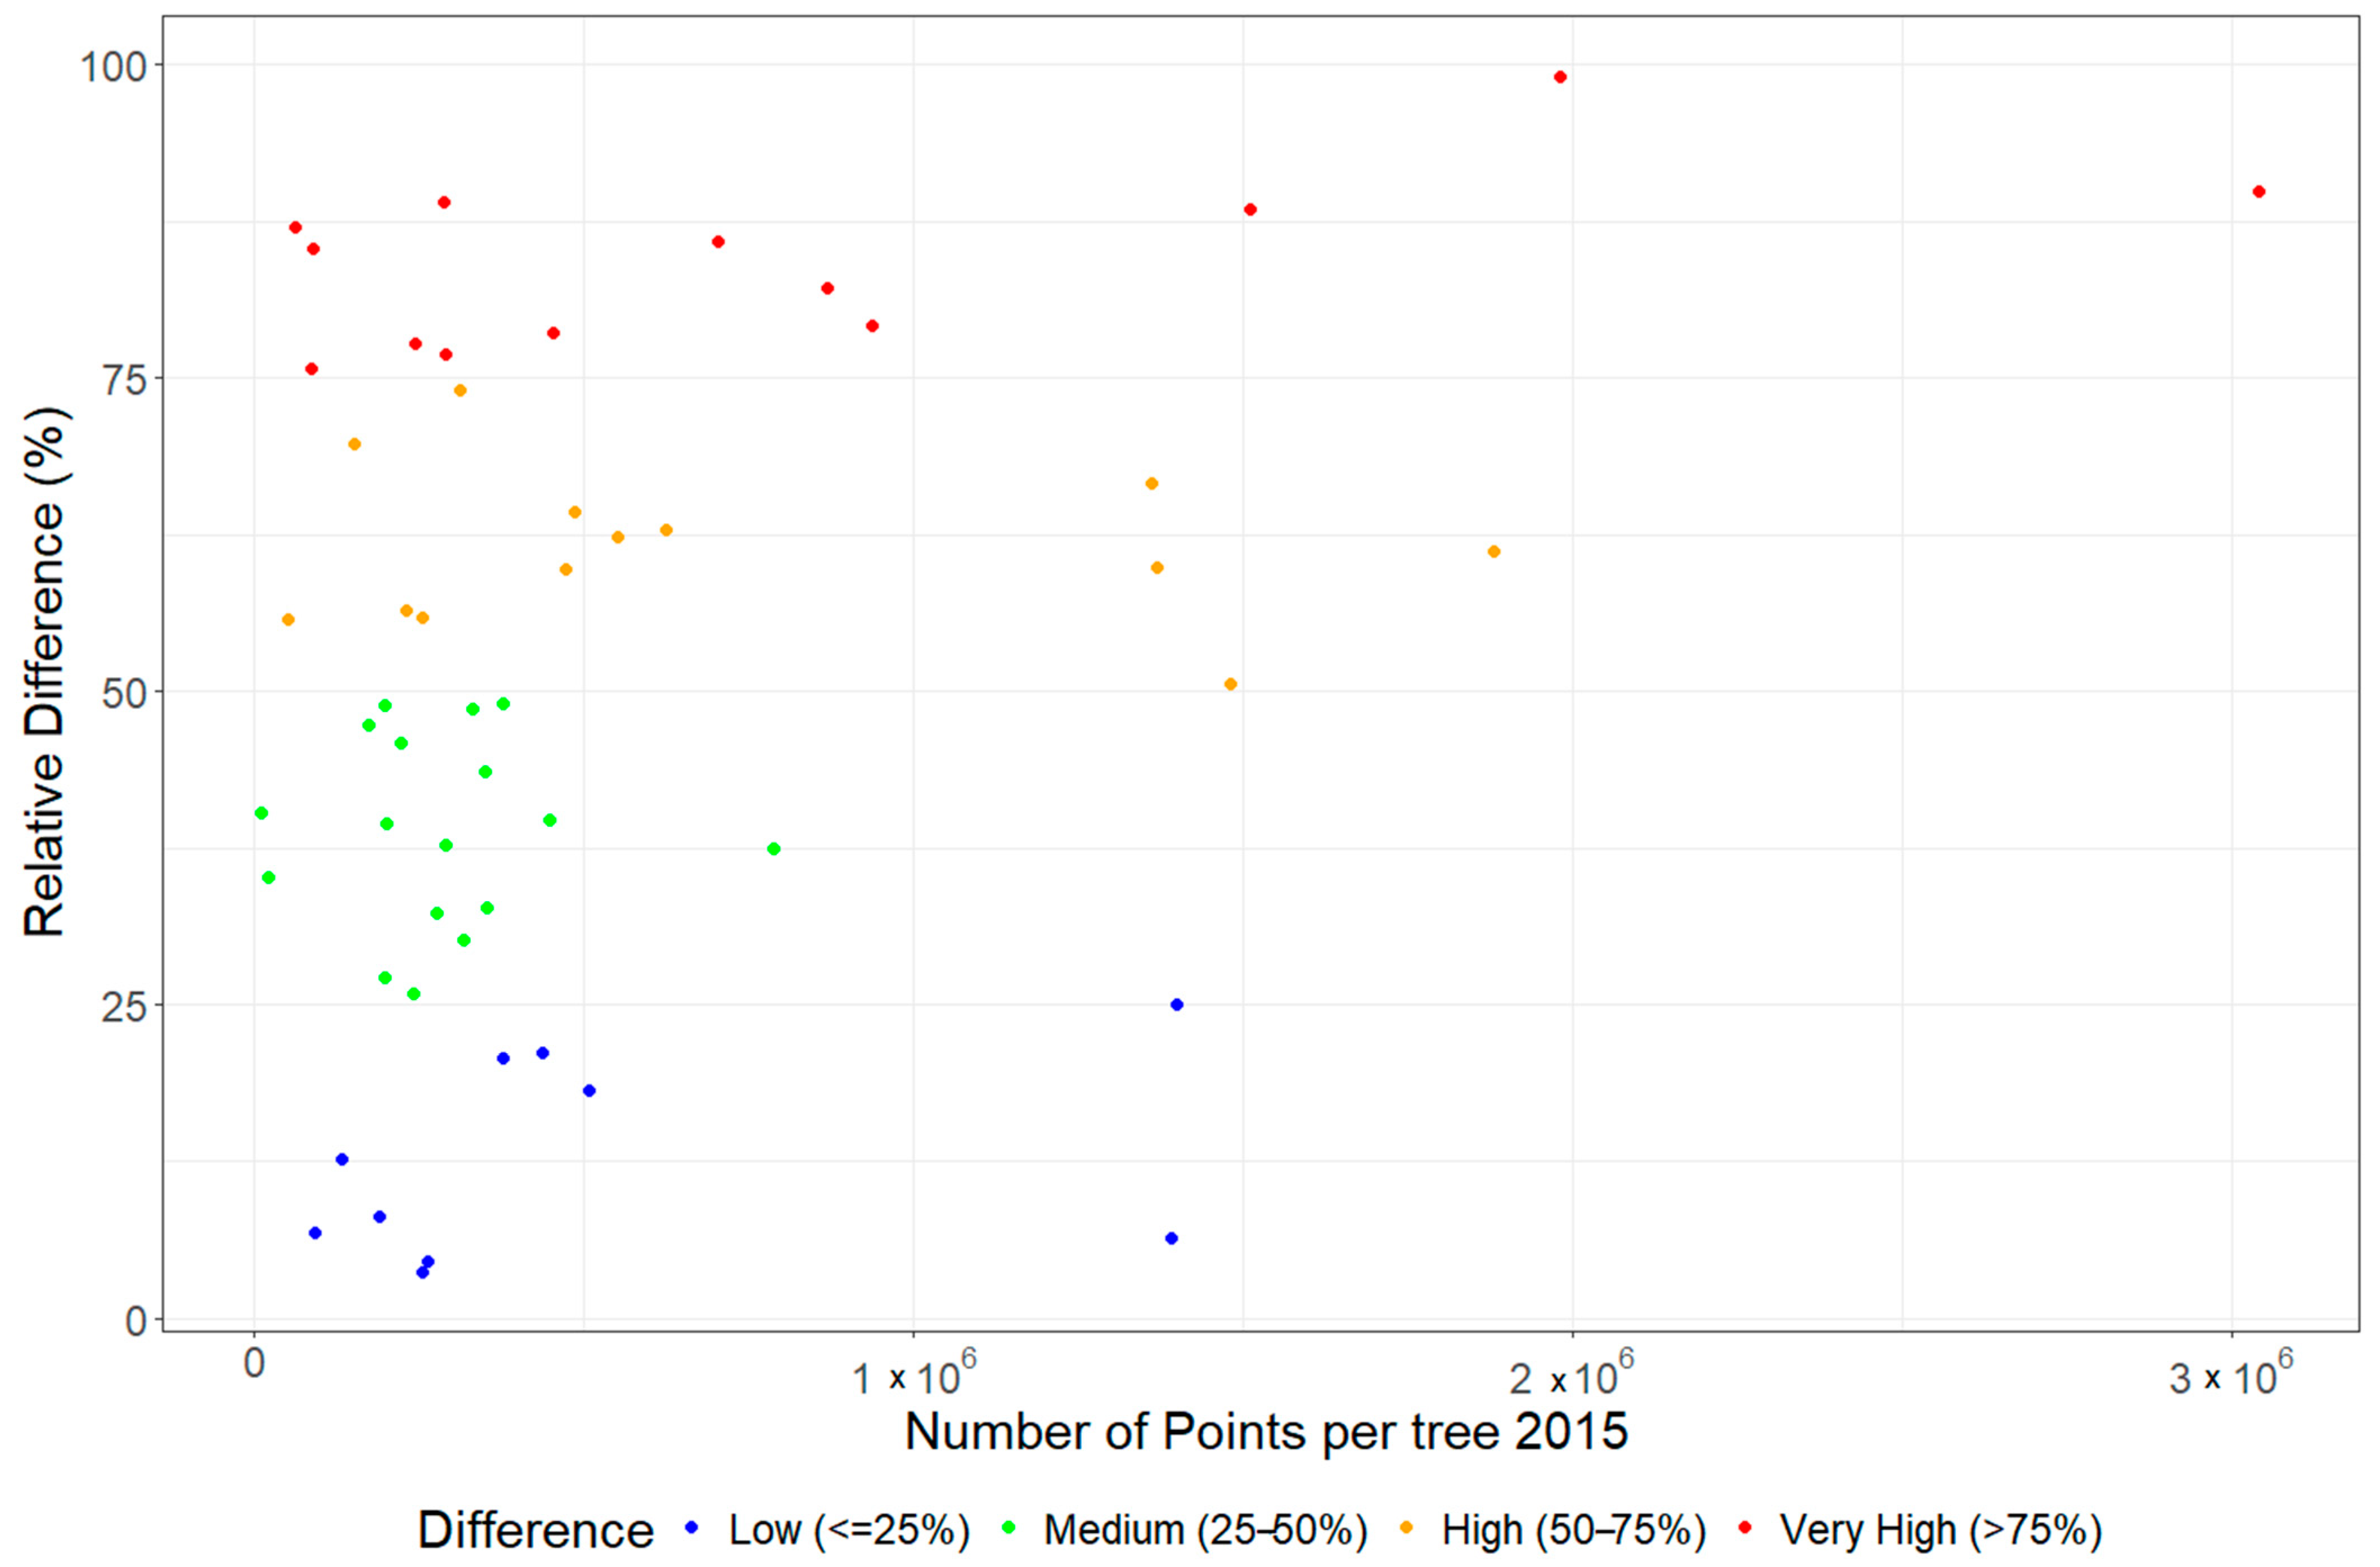
2.4. Statistical Analysis and Change Analysis
3. Results
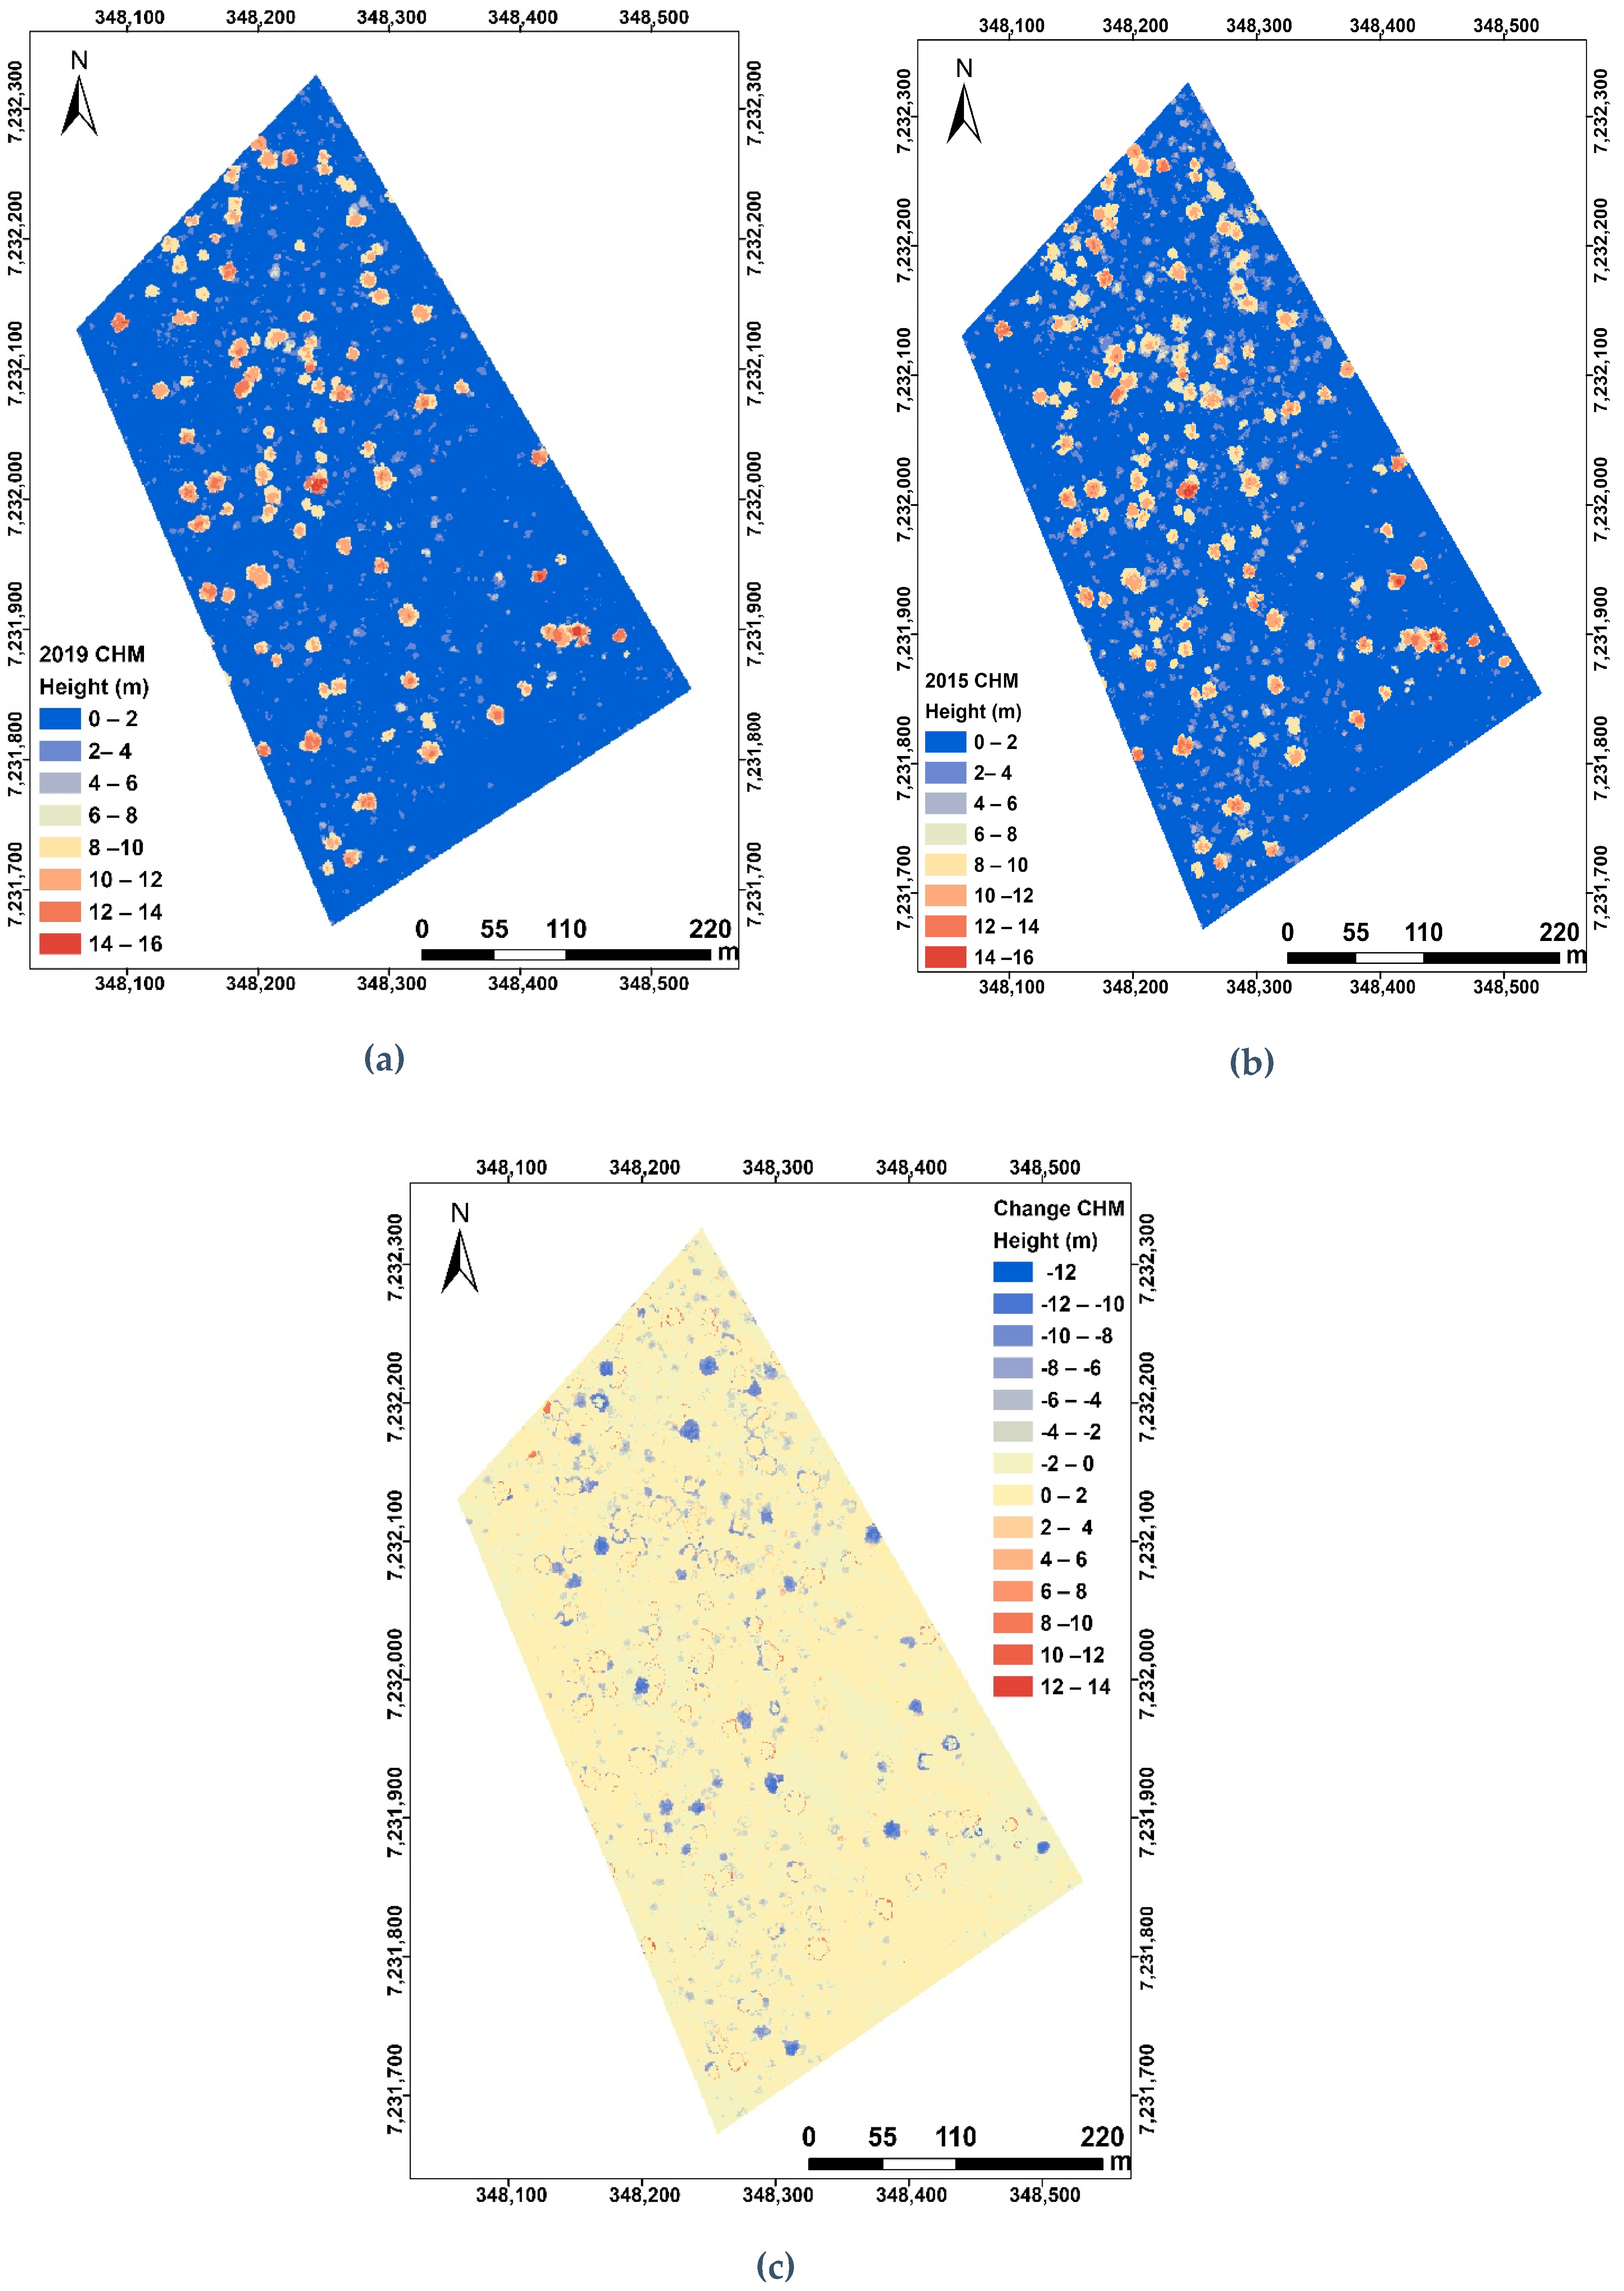
3.1. Canopy Height Models
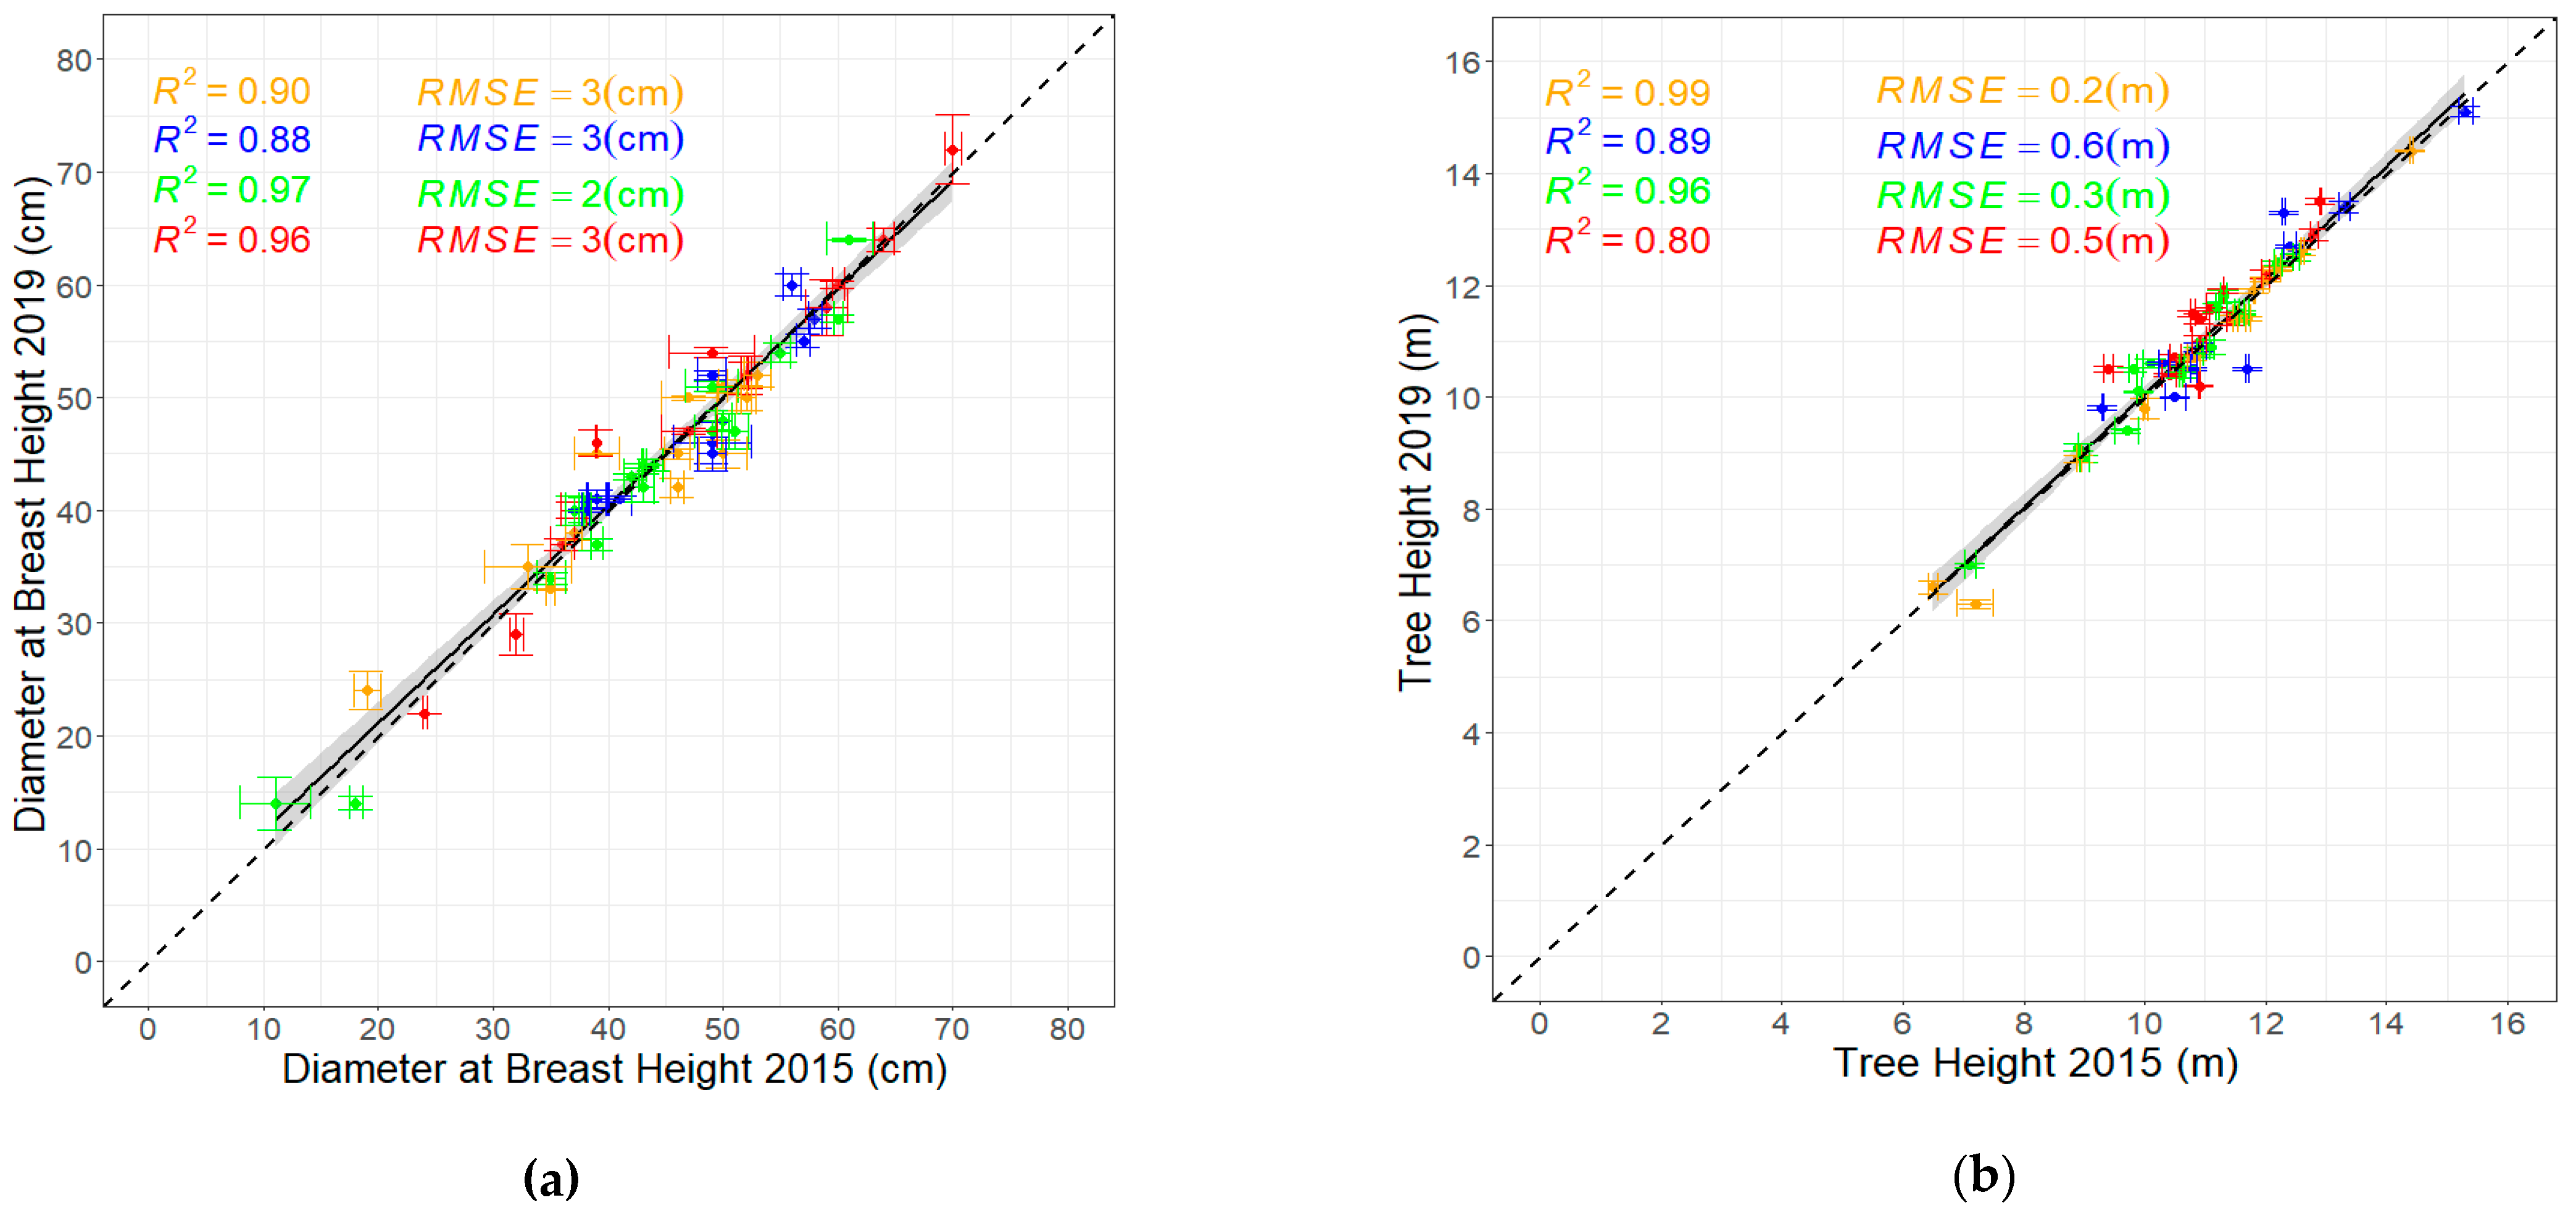
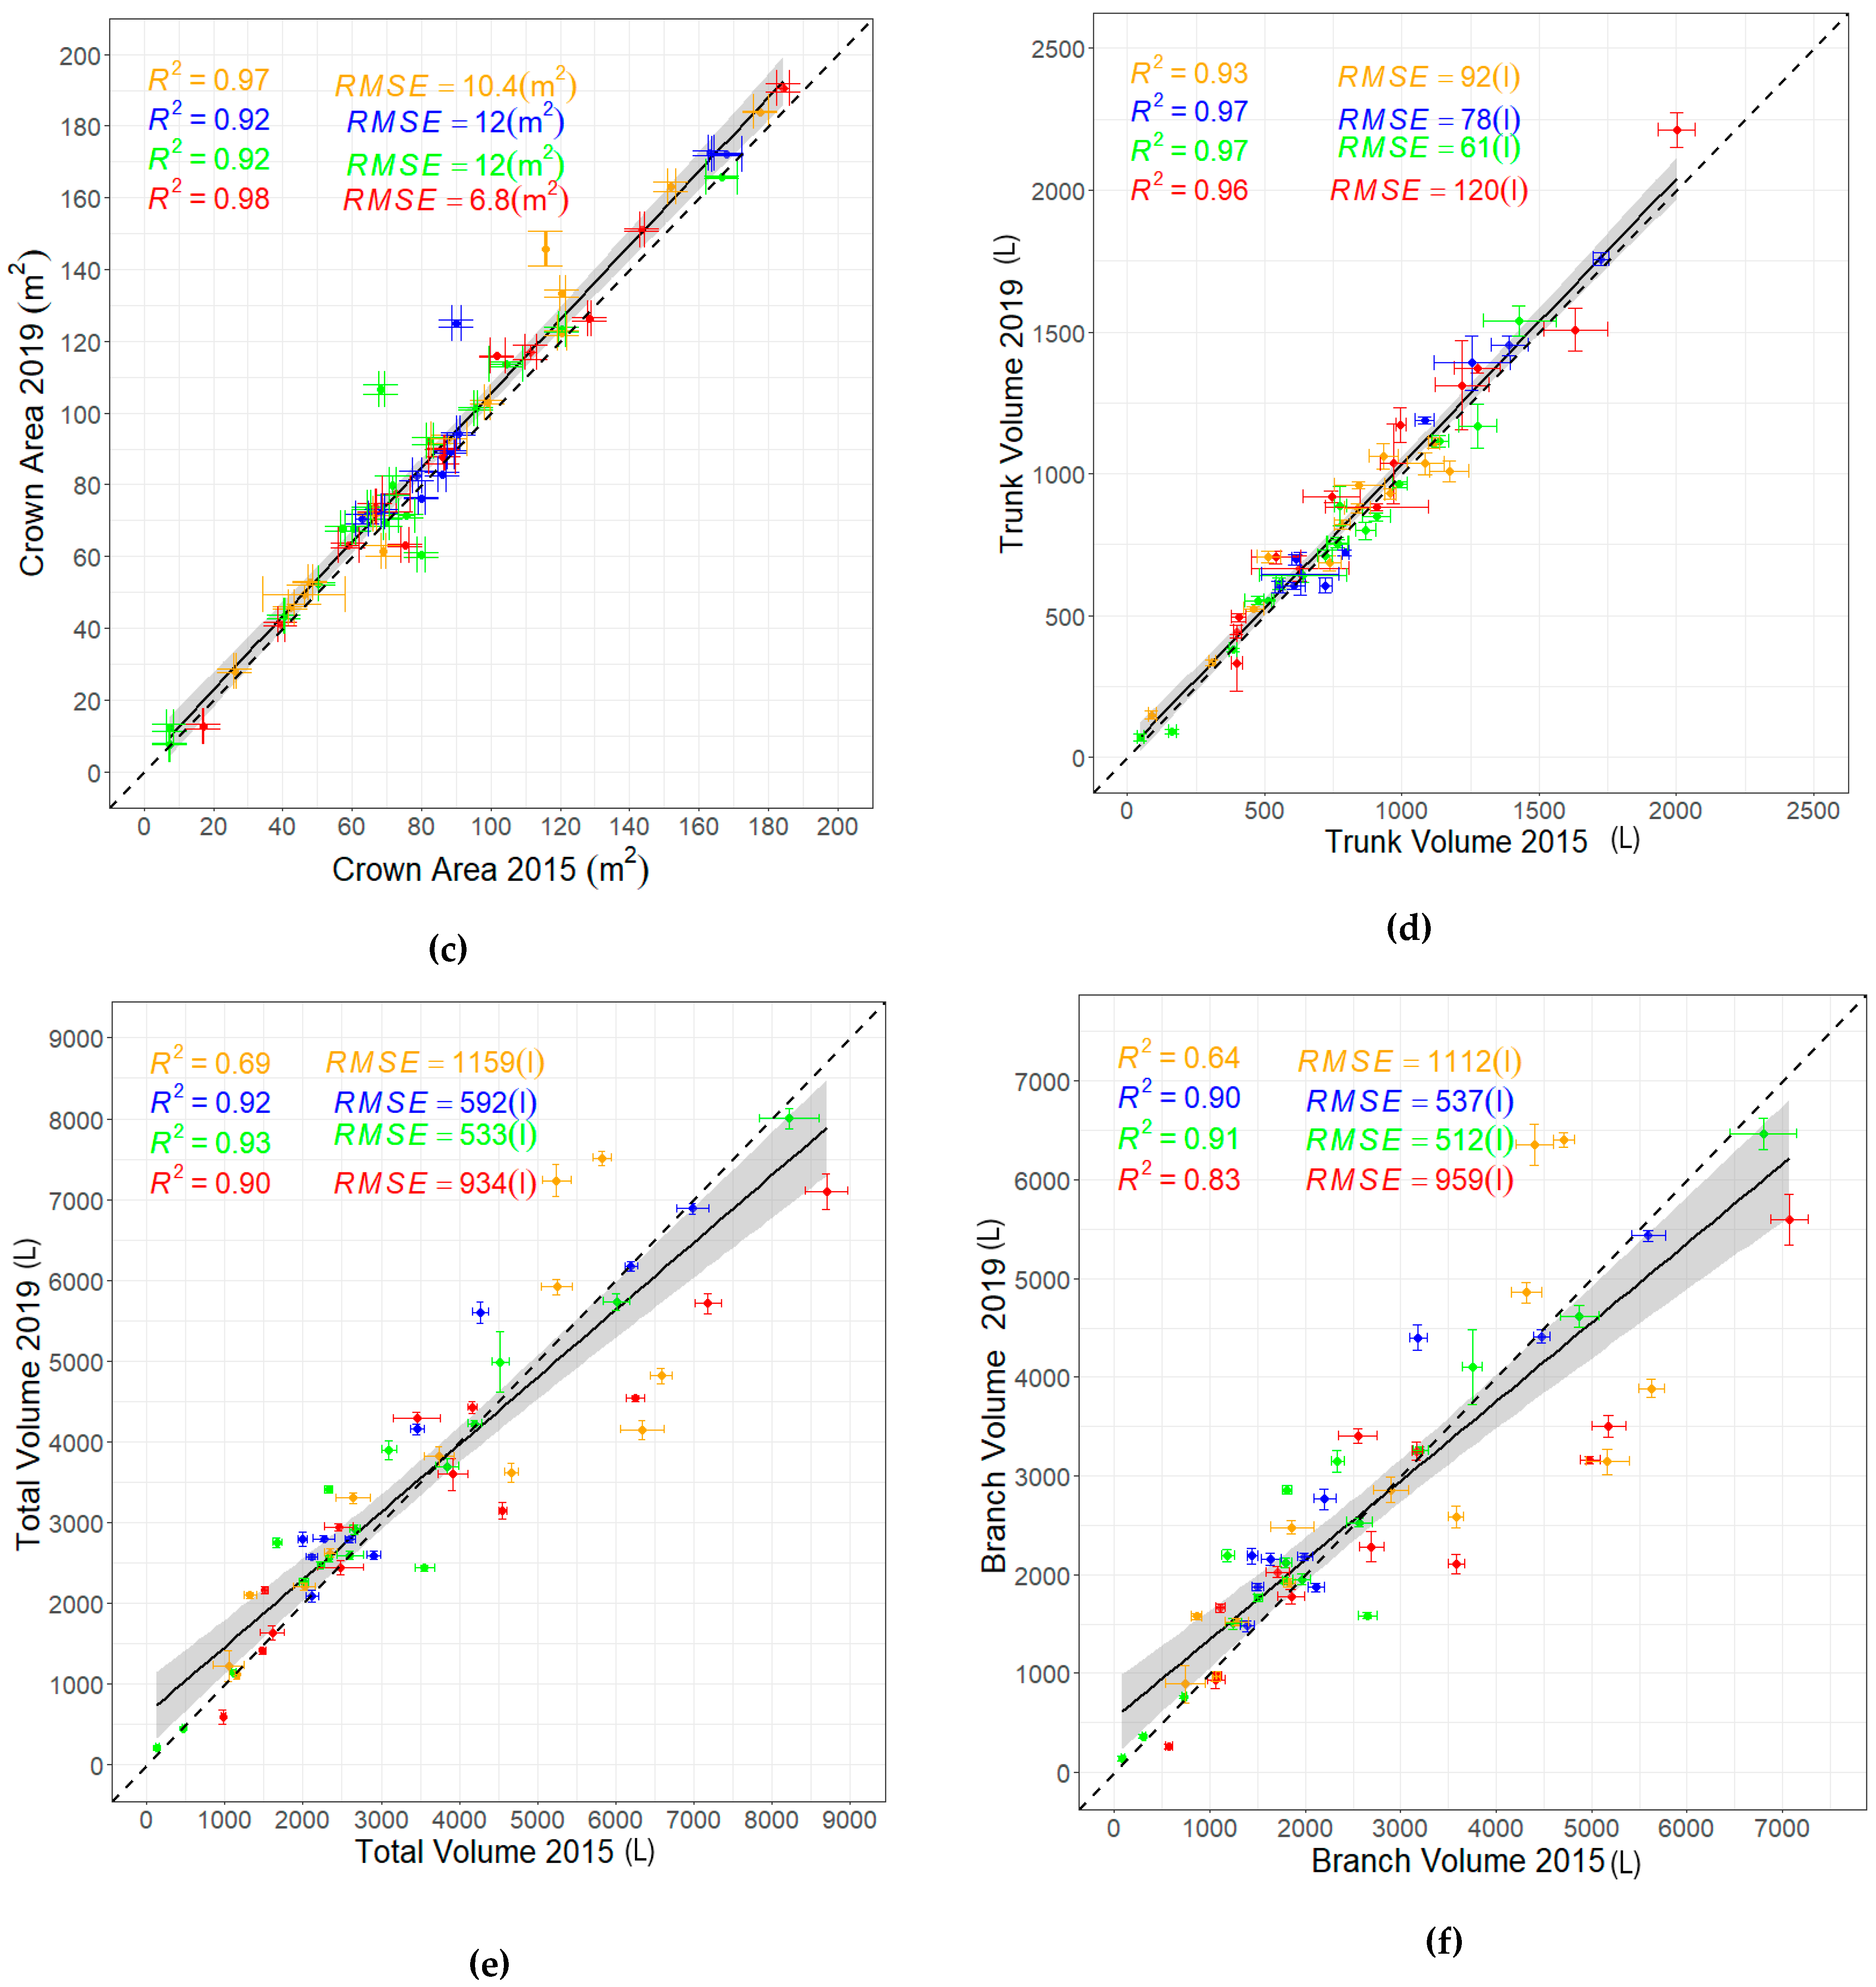
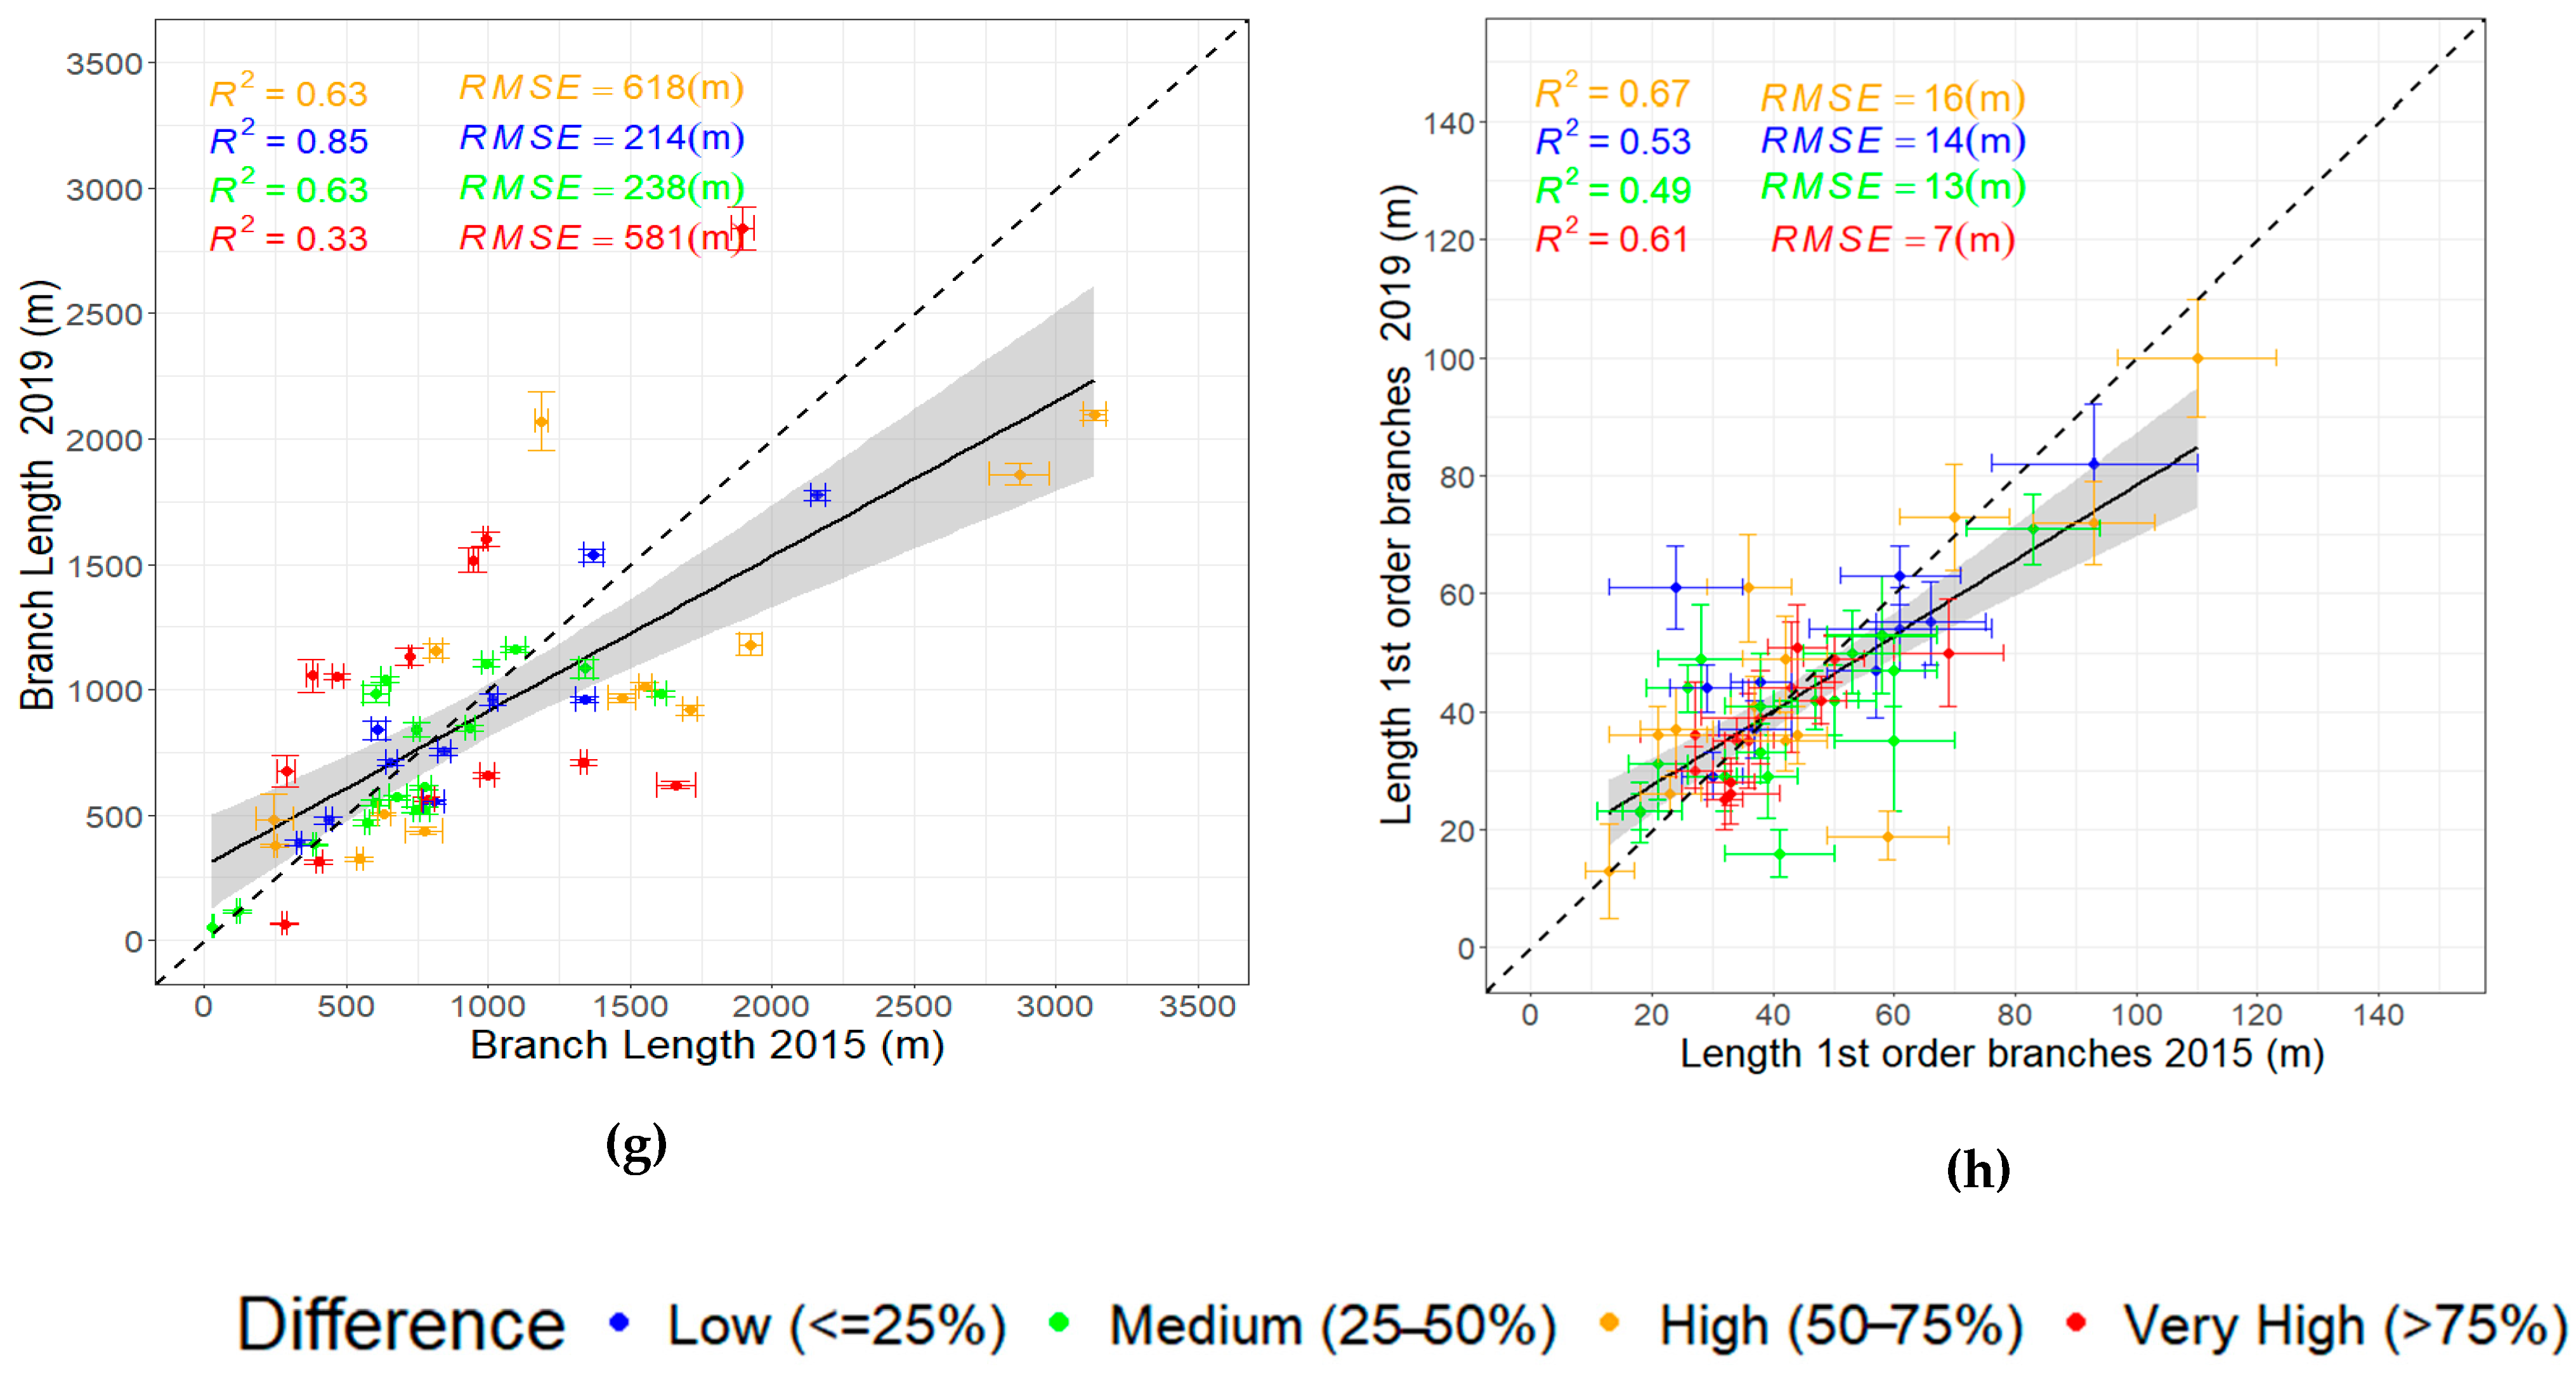
3.2. Parameters Derived from the Two Scanning Periods
3.3. Evaluating the Relationships Among Derived Tree Parameters
3.4. Comparing the Change in Tree Structural Parameters per Diameter Class
3.5. Comparison of TLS-Measured and Field-Measured DBH
4. Discussion
4.1. Use of Multi-Temporal TLS to Quantify Savanna Tree Structural Change
4.2. Effect of Point Density and QSM Modelling on Accurate Extraction of Tree Parameters and Change Estimation
4.3. Validation of TLS-Derived Parameters with Field Measurements
4.4. Future Outlook
5. Conclusions
- ➢
- We analyzed the changes in eight tree structural parameters and observed significant variations across different DBH classes, with the exception of branch length and 1st-order branch length. Minor changes in the tree structure within each DBH class were detectable, indicating that even slight alterations in tree structure can be effectively quantified using multi-temporal TLS and QSMs.
- ➢
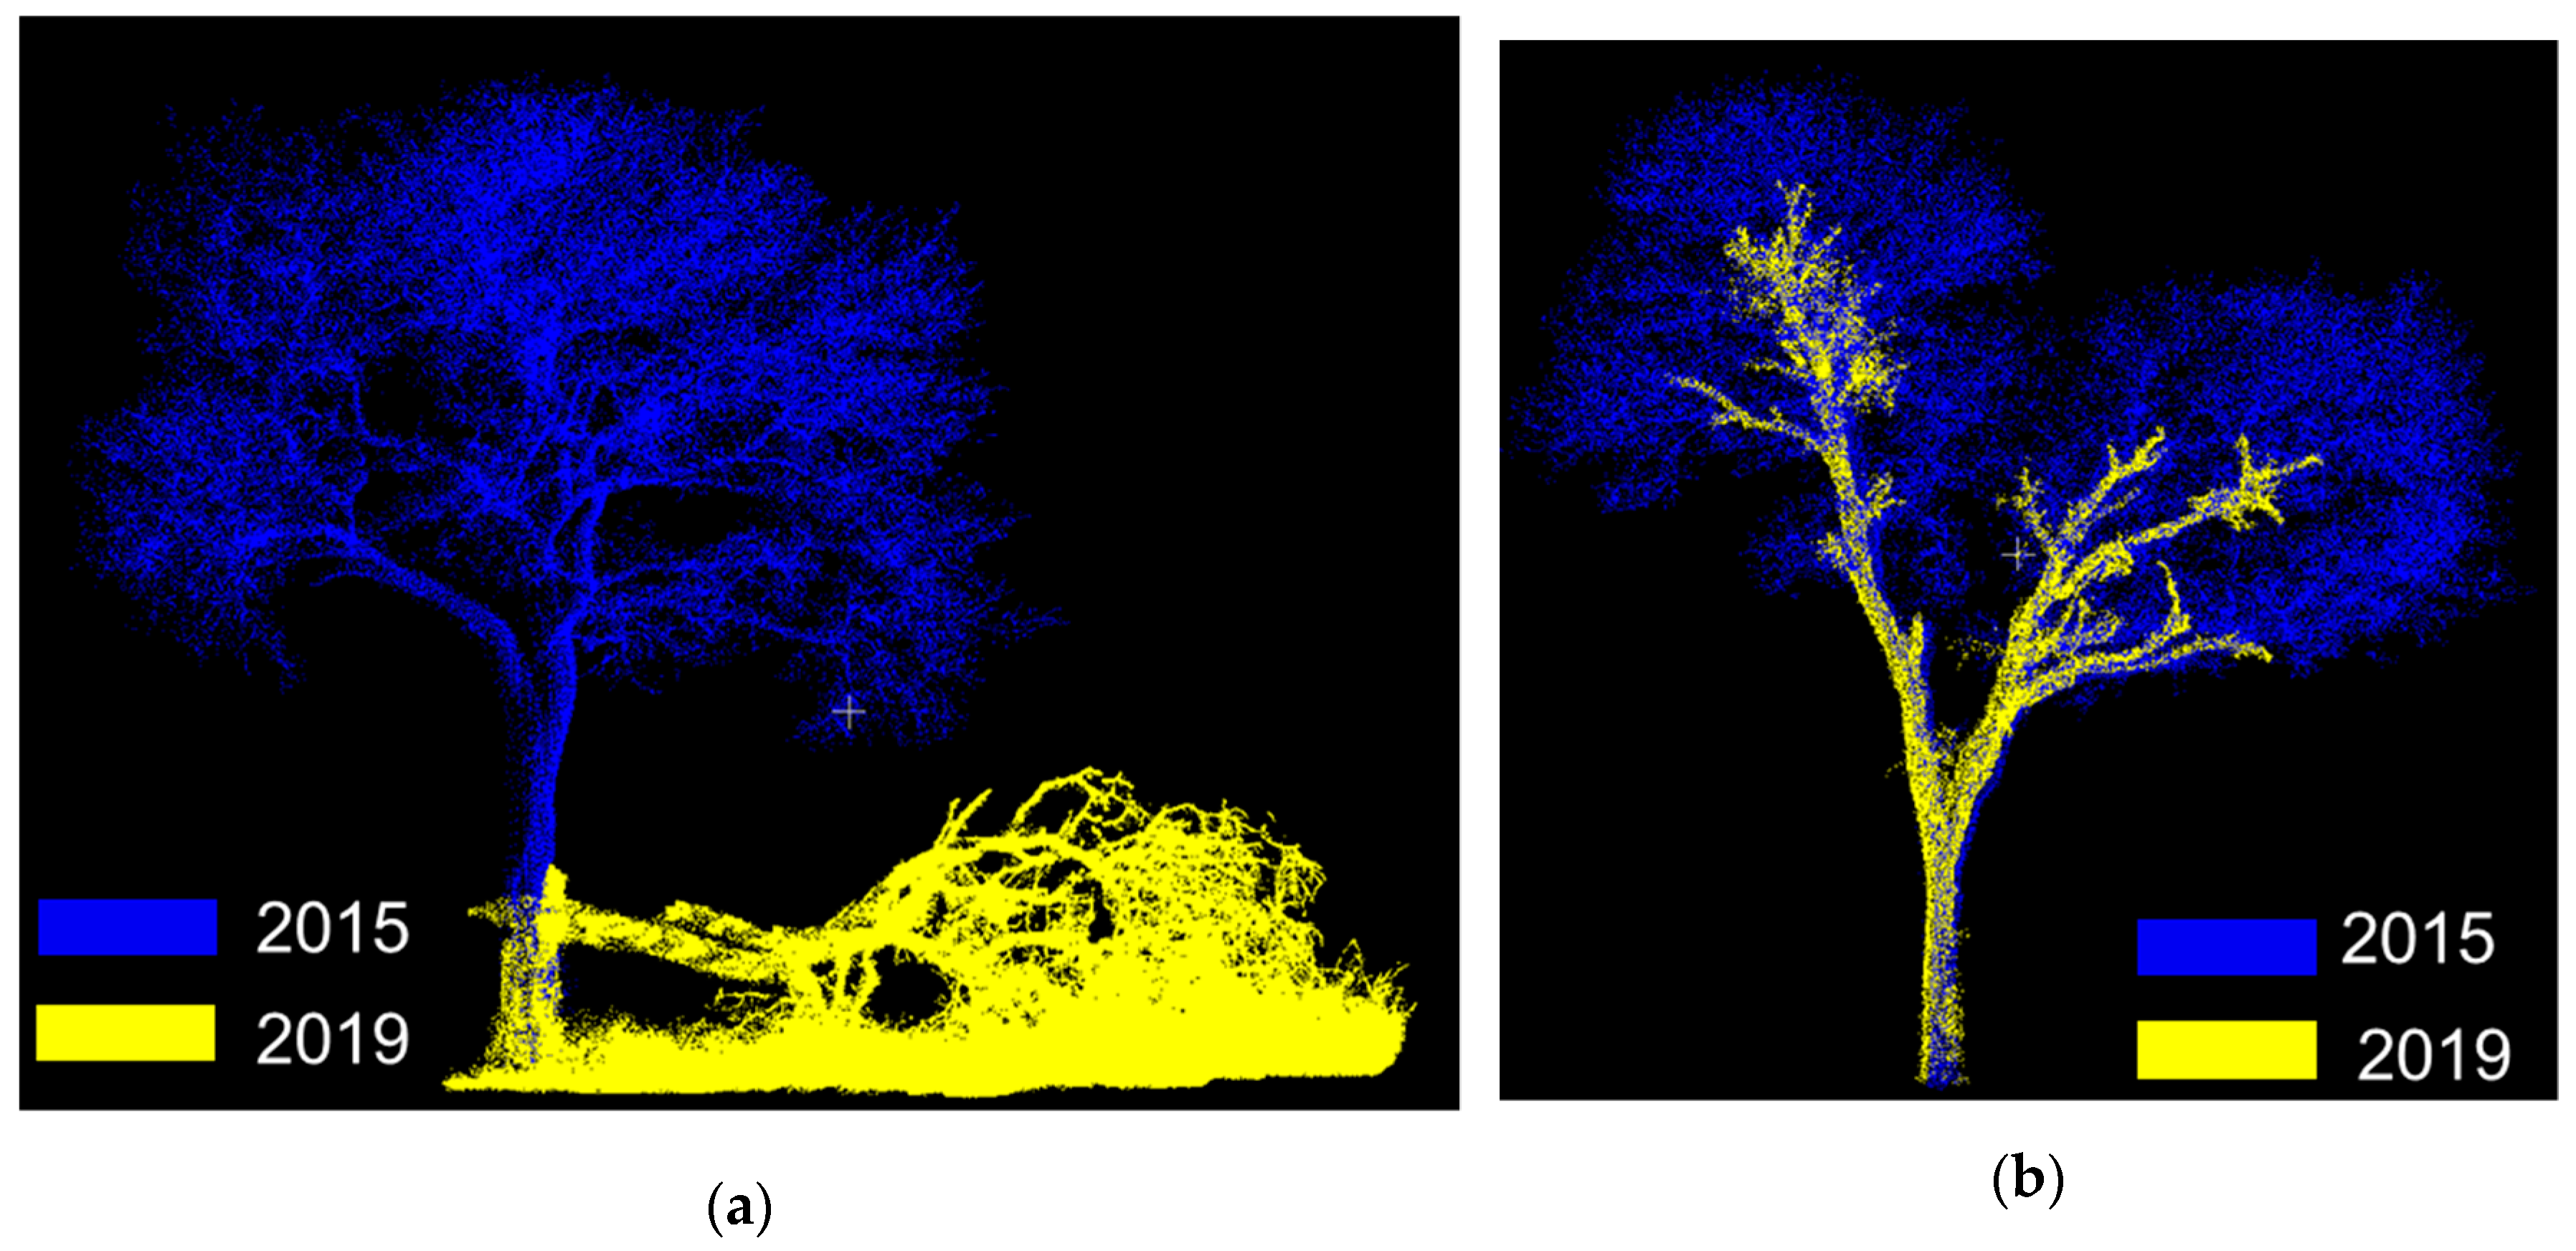
- The loss of trees between the two TLS campaigns was quantified to 75 trees, and modelling with QSMs estimated the total volume loss (branch + trunk) to be 83.4 m3.
- ➢
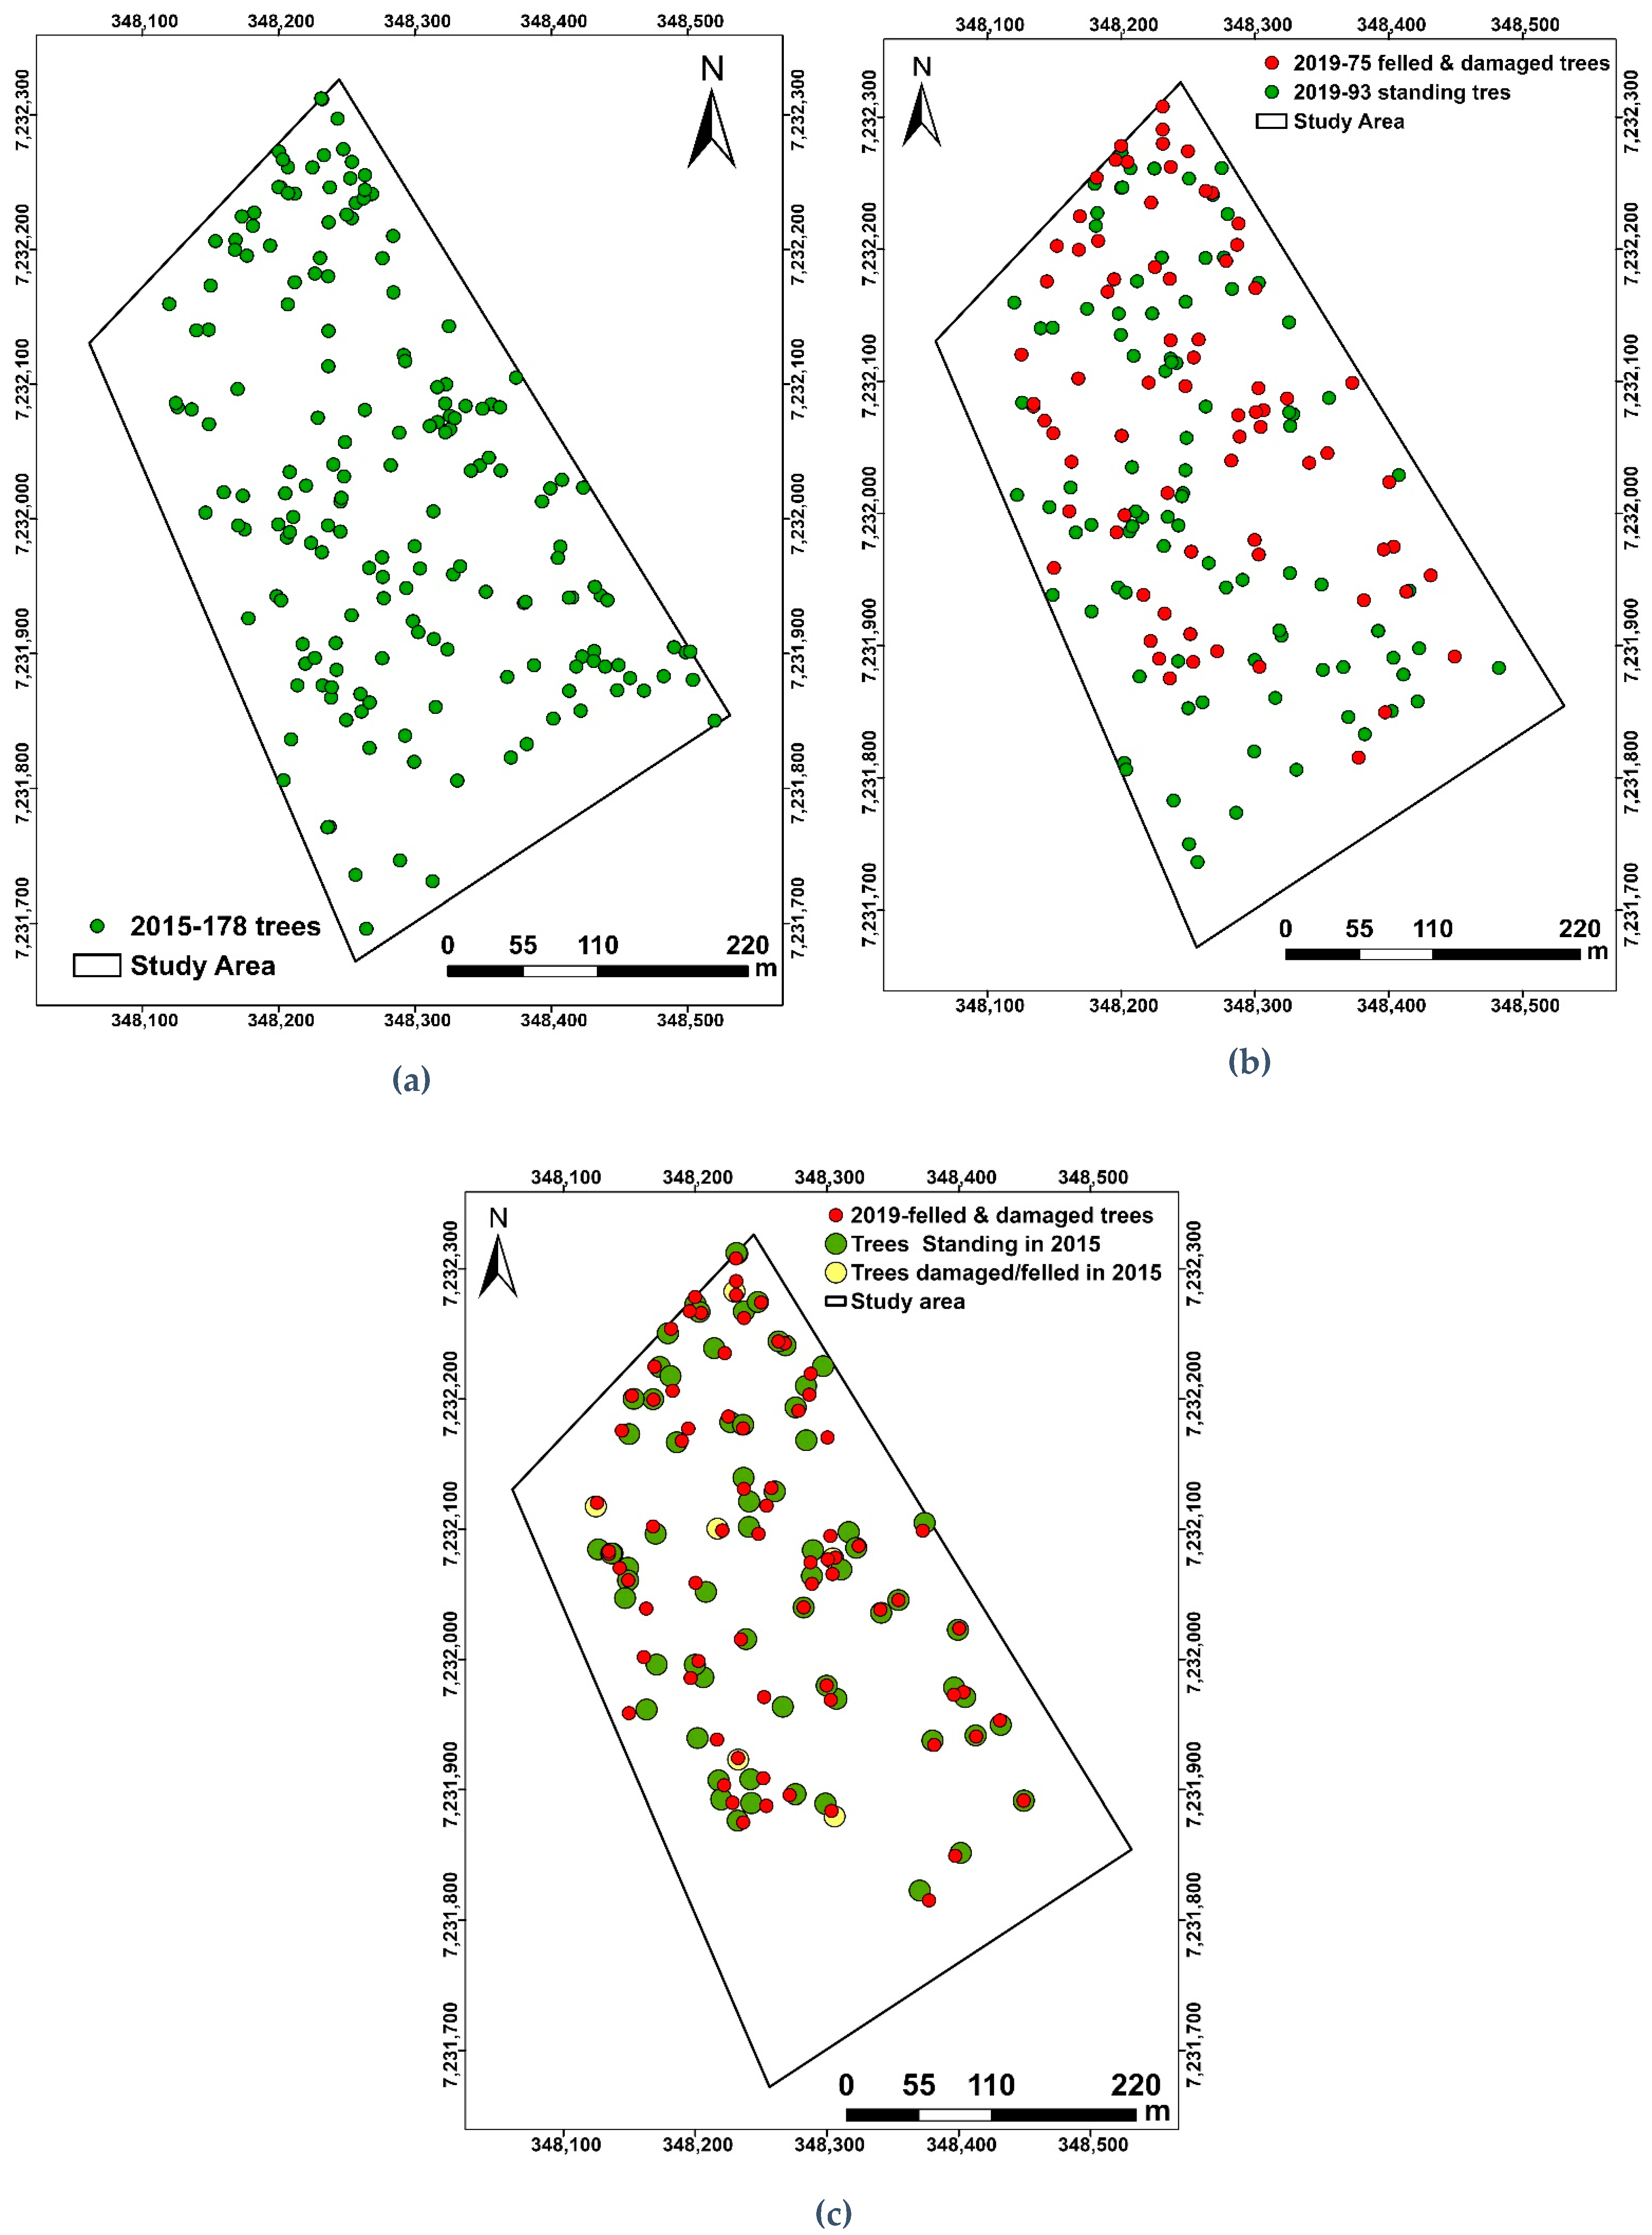
- 45% of the trees in 2015 were identified as felled or damaged in 2019 because of drought (11%) and elephant damage (89%).
- ➢
- DBH and crown area are strong predictors of tree volume. This was evidenced by the high positive correlations and low RMSEs observed between DBH, crown area, with volume parameters.
- ➢
- Differences in point density and scan resolutions affected the reliability of the parameters derived from the QSMs, particularly for complex tree parameters such as total volume, branch volume, and branch length. The highest calculated residuals were observed in the matched trees exhibiting a high (50–75%) and very high (> 75%) relative difference.
- ➢
- The difference in point density difference is negligible for tree parameters such as DBH, tree height, crown area, and trunk volume. The reported errors for these parameters remain relatively low, regardless of the variation in the number of points associated with the matched trees.
Author Contributions
Funding
Data Availability Statement
Acknowledgments
Conflicts of Interest
References
- Grace, J.; José, J.S.; Meir, P.; Miranda, H.S.; Montes, R.A. Productivity and carbon fluxes of tropical savannas. J. Biogeogr. 2006, 33, 387–400. [Google Scholar] [CrossRef]
- Higgins, S.I.; Bond, W.J.; Trollope, W.S.W. Fire, resprouting and variability: A recipe for grass-tree coexistence in savanna. J. Ecol. 2000, 88, 213–229. [Google Scholar] [CrossRef]
- McCleery, R.; Monadjem, A.; Baiser, B.; Fletcher, R.; Vickers, K.; Kruger, L. Animal diversity declines with broad-scale homogenization of canopy cover in African savannas. Biol. Conserv. 2018, 226, 54–62. [Google Scholar] [CrossRef]
- Levick, S.R.; Asner, G.P. The rate and spatial pattern of treefall in a savanna landscape. Biol. Conserv. 2013, 157, 121–127. [Google Scholar] [CrossRef]
- Stevens, N.; Erasmus, B.F.N.; Archibald, S.; Bond, W.J. Woody encroachment over 70 years in South African savannahs: Overgrazing, global change or extinction aftershock? Philos. Trans. R. Soc. B Biol. Sci. 2016, 371, 20150437. [Google Scholar] [CrossRef]
- Urban, M.; Heckel, K.; Berger, C.; Schratz, P.; Smit, I.P.J.; Strydom, T.; Baade, J.; Schmullius, C. Woody cover mapping in the savanna ecosystem of the Kruger National Park using sentinel-1 C-band time series data. Koedoe 2020, 62, a1621. [Google Scholar] [CrossRef]
- Bogdanovich, E.; Perez-Priego, O.; El-Madany, T.S.; Guderle, M.; Pacheco-Labrador, J.; Levick, S.R.; Moreno, G.; Carrara, A.; Pilar Martín, M.; Migliavacca, M. Using terrestrial laser scanning for characterizing tree structural parameters and their changes under different management in a Mediterranean open woodland. For. Ecol. Manag. 2021, 486, 118945. [Google Scholar] [CrossRef]
- Yrttimaa, T.; Luoma, V.; Saarinen, N.; Kankare, V.; Junttila, S.; Holopainen, M.; Hyyppä, J.; Vastaranta, M. Structural changes in Boreal forests can be quantified using terrestrial laser scanning. Remote Sens. 2020, 12, 2672. [Google Scholar] [CrossRef]
- Demol, M.; Verbeeck, H.; Gielen, B.; Armston, J.; Burt, A.; Disney, M.; Duncanson, L.; Hackenberg, J.; Kükenbrink, D.; Lau, A.; et al. Estimating forest above-ground biomass with terrestrial laser scanning: Current status and future directions. Methods Ecol. Evol. 2022, 13, 1628–1639. [Google Scholar] [CrossRef]
- Sheppard, J.; Morhart, C.; Hackenberg, J.; Spiecker, H. Terrestrial laser scanning as a tool for assessing tree growth. iForest 2017, 10, 172–179. [Google Scholar] [CrossRef]
- Xu, D.; Wang, H.; Xu, W.; Luan, Z.; Xu, X. LiDAR applications to estimate forest biomass at individual tree scale: Opportunities, challenges and future perspectives. Forests 2021, 12, 550. [Google Scholar] [CrossRef]
- Raumonen, P.; Kaasalainen, M.; Åkerblom, M.; Kaasalainen, S.; Kaartinen, H.; Vastaranta, M.; Holopainen, M.; Disney, M.; Lewis, P.; Markku, Å.; et al. Fast Automatic Precision Tree Models from Terrestrial Laser Scanner Data. Remote Sens. 2013, 5, 491–520. [Google Scholar] [CrossRef]
- Liang, X.; Hyyppä, J.; Kaartinen, H.; Holopainen, M.; Melkas, T. Detecting changes in forest structure over time with bi-temporal terrestrial laser scanning data. ISPRS Int. J. Geo-Inf. 2012, 1, 242–255. [Google Scholar] [CrossRef]
- Englhart, S.; Jubanski, J.; Siegert, F. Quantifying Dynamics in Tropical Peat Swamp Forest Biomass with Multi-Temporal LiDAR Datasets. Remote Sens. 2013, 5, 2368–2388. [Google Scholar] [CrossRef]
- Srinivasan, S.; Popescu, S.C.; Eriksson, M.; Sheridan, R.D.; Ku, N.W. Multi-temporal terrestrial laser scanning for modeling tree biomass change. For. Ecol. Manag. 2014, 318, 304–317. [Google Scholar] [CrossRef]
- Kaasalainen, S.; Krooks, A.; Liski, J.; Raumonen, P.; Kaartinen, H.; Kaasalainen, M.; Puttonen, E.; Anttila, K.; Mäkipää, R. Change detection of tree biomass with terrestrial laser scanning and quantitative structure modelling. Remote Sens. 2014, 6, 3906–3922. [Google Scholar] [CrossRef]
- Luck, L.; Kaestli, M.; Hutley, L.B.; Calders, K.; Levick, S.R. Reduced model complexity for efficient characterisation of savanna woodland structure using terrestrial laser scanning. Int. J. Appl. Earth Obs. Geoinf. 2023, 118, 103255. [Google Scholar] [CrossRef]
- Qi, Y.; Coops, N.C.; Daniels, L.D.; Butson, C.R. Comparing tree attributes derived from quantitative structure models based on drone and mobile laser scanning point clouds across varying canopy cover conditions. ISPRS J. Photogramm. Remote Sens. 2022, 192, 49–65. [Google Scholar] [CrossRef]
- Urban, M.; Berger, C.; Mudau, T.E.; Heckel, K.; Truckenbrodt, J.; Odipo, V.O.; Smit, I.P.J.; Schmullius, C. Surface moisture and vegetation cover analysis for drought monitoring in the southern Kruger National Park using Sentinel-1, Sentinel-2, and Landsat-8. Remote Sens. 2018, 10, 1482. [Google Scholar] [CrossRef]
- Thornley, R.; Spencer, M.; Zitzer, H.R.; Parr, C.L. Woody vegetation damage by the African elephant during severe drought at Pongola Game Reserve, South Africa. Afr. J. Ecol. 2020, 58, 658–673. [Google Scholar] [CrossRef]
- Smit, I.P.J.; Asner, G.P.; Govender, N.; Kennedy-Bowdoin, T.; Knapp, D.E.; Jacobson, J. Effects of Fire and Herbivory on the Stability of Savanna Ecosystems. Ecol. Appl. 2010, 84, 1865–1875. [Google Scholar] [CrossRef] [PubMed]
- Scheiter, S.; Higgins, S.I. Impacts of climate change on the vegetation of Africa: An adaptive dynamic vegetation modelling approach. Glob. Chang. Biol. 2009, 15, 2224–2246. [Google Scholar] [CrossRef]
- Osborne, C.P.; Charles-Dominique, T.; Stevens, N.; Bond, W.J.; Midgley, G.; Lehmann, C.E.R. Human impacts in African savannas are mediated by plant functional traits. New Phytol. 2018, 220, 10–24. [Google Scholar] [CrossRef]
- Sankaran, M.; Ratnam, J.; Hanan, N. Woody cover in African savannas: The role of resources, fire and herbivory. Glob. Ecol. Biogeogr. 2008, 17, 236–245. [Google Scholar] [CrossRef]
- Foxcroft, L.C.; Richardson, D.M.; Rejmánek, M.; Pyšek, P. Alien plant invasions in tropical and sub-tropical savannas: Patterns, processes and prospects. Biol. Invasions 2010, 12, 3913–3933. [Google Scholar] [CrossRef]
- Scholes, R.J.; Gureja, N.; Giannecchinni, M.; Dovie, D.; Wilson, B.; Davidson, N.; Piggott, K.; McLoughlin, C.; Van der Velde, K.; Freeman, A.; et al. The environment and vegetation of the flux measurement site near Skukuza, Kruger National Park. Koedoe 2001, 44, 73–84. [Google Scholar] [CrossRef]
- Dyer, C. New names for the African Acacia species in Vachellia and Senegalia. South. For. 2014, 76, iii. [Google Scholar] [CrossRef][Green Version]
- MacFadyen, S.; Zambatis, N.; Van Teeffelen, A.J.A.; Hui, C. Long-term rainfall regression surfaces for the Kruger National Park, South Africa: A spatio-temporal review of patterns from 1981 to 2015. Int. J. Climatol. 2018, 38, 2506–2519. [Google Scholar] [CrossRef]
- Sankaran, M. Droughts and the ecological future of tropical savanna vegetation. J. Ecol. 2019, 107, 1531–1549. [Google Scholar] [CrossRef]
- Scholes, R.J.; Archer, S.R. Tree-grass interactions in Savannas. Annu. Rev. Ecol. Syst. 1997, 28, 517–544. [Google Scholar] [CrossRef]
- Rice, K.J.; Matzner, S.L.; Byer, W.; Brown, J.R. Patterns of tree dieback in Queensland, Australia: The importance of drought stress and the role of resistance to cavitation. Oecologia 2004, 139, 190–198. [Google Scholar] [CrossRef] [PubMed]
- O’Brien, M.J.; Engelbrecht, B.M.J.; Joswig, J.; Pereyra, G.; Schuldt, B.; Jansen, S.; Kattge, J.; Landhäusser, S.M.; Levick, S.R.; Preisler, Y.; et al. A synthesis of tree functional traits related to drought-induced mortality in forests across climatic zones. J. Appl. Ecol. 2017, 54, 1669–1686. [Google Scholar] [CrossRef]
- Greenwood, S.; Ruiz-Benito, P.; Martínez-Vilalta, J.; Lloret, F.; Kitzberger, T.; Allen, C.D.; Fensham, R.; Laughlin, D.C.; Kattge, J.; Bönisch, G.; et al. Tree mortality across biomes is promoted by drought intensity, lower wood density and higher specific leaf area. Ecol. Lett. 2017, 20, 539–553. [Google Scholar] [CrossRef] [PubMed]
- RIEGL Laser Measurements Systems. RIEGL VZ-1000 High-Resolution and Accurate 3D Measurements. Data Sheet. 2017, pp. 1–4. Available online: http://www.riegl.com/uploads/tx_pxpriegldownloads/DataSheet_VZ-1000_2017-06-14.pdf (accessed on 4 December 2024).
- Dong, Y.; Fan, G.; Zhou, Z.; Liu, J.; Wang, Y.; Chen, F. Low cost automatic reconstruction of tree structure by adqsm with terrestrial close-range photogrammetry. Forests 2021, 12, 1020. [Google Scholar] [CrossRef]
- Li, W.; Guo, Q.; Jakubowski, M.K.; Kelly, M. A new method for segmenting individual trees from the lidar point cloud. Photogramm. Eng. Remote Sens. 2012, 78, 75–84. [Google Scholar] [CrossRef]
- Raumonen, P.; Casella, E.; Calders, K.; Murphy, S.; Åkerbloma, M.; Kaasalainen, M. Massive-Scale Tree Modelling From Tls Data. ISPRS Ann. Photogramm. Remote Sens. Spat. Inf. Sci. 2015, 2, 189–196. [Google Scholar] [CrossRef]
- The R Project for Statistical Computing. 2024. Available online: http://www.r-project.org (accessed on 4 December 2024).
- Munna, A.H.; Amuri, N.A.; Hieronimo, P.; Woiso, D.A. The right tree in the right place: Predicting and mapping global-scale suitable areas for Marula tree, Sclerocarya birrea, (A. Rich.) Horchst, subspecies cultivation, conservation, and use in restoring global drylands. Front. Biogeogr. 2023, 15, 1–15. [Google Scholar] [CrossRef]
- Munna, A.H.; Amuri, N.A.; Hieronimo, P.; Woiso, D.A. Modelling ecological niches of Sclerocarya birrea subspecies in Tanzania under the current and future climates. Silva Fenn. 2023, 57, 23009. [Google Scholar] [CrossRef]
- Martínez-Vilalta, J.; Lloret, F. Drought-induced vegetation shifts in terrestrial ecosystems: The key role of regeneration dynamics. Glob. Planet. Chang. 2016, 144, 94–108. [Google Scholar] [CrossRef]
- Ben-Shahar, R. Patterns of elephant damage to vegetation in northern Botswana. Biol. Conserv. 1993, 65, 249–256. [Google Scholar] [CrossRef]
- Clark, J.S.; Iverson, L.; Woodall, C.W.; Allen, C.D.; Bell, D.M.; Bragg, D.C.; D’Amato, A.W.; Davis, F.W.; Hersh, M.H.; Ibanez, I.; et al. The impacts of increasing drought on forest dynamics, structure, and biodiversity in the United States. Glob. Chang. Biol. 2016, 22, 2329–2352. [Google Scholar] [CrossRef] [PubMed]
- Galiano, L.; Martínez-Vilalta, J.; Sabaté, S.; Lloret, F. Determinants of drought effects on crown condition and their relationship with depletion of carbon reserves in a Mediterranean holm oak forest. Tree Physiol. 2012, 32, 478–489. [Google Scholar] [CrossRef]
- Husin, N.A.; Khairunniza-Bejo, S.; Abdullah, A.F.; Kassim, M.S.M.; Ahmad, D. Multi-temporal analysis of terrestrial laser scanning data to detect basal stem rot in oil palm trees. Precis. Agric. 2022, 23, 101–126. [Google Scholar] [CrossRef]
- Hopkinson, C.; Chasmer, L.; Hall, R.J. The uncertainty in conifer plantation growth prediction from multi-temporal lidar datasets. Remote Sens. Environ. 2008, 112, 1168–1180. [Google Scholar] [CrossRef]
- Duncanson, L.; Dubayah, R. Monitoring individual tree-based change with airborne lidar. Ecol. Evol. 2018, 8, 5079–5089. [Google Scholar] [CrossRef] [PubMed]
- Torralba, J.; Carbonell-Rivera, J.P.; Ruiz, L.Á.; Crespo-Peremarch, P. Analyzing TLS Scan Distribution and Point Density for the Estimation of Forest Stand Structural Parameters. Forests 2022, 13, 2115. [Google Scholar] [CrossRef]
- Sumnall, M.J.; Albaugh, T.J.; Carter, D.R.; Cook, R.L.; Hession, W.C.; Campoe, O.C.; Rubilar, R.A.; Wynne, R.H.; Thomas, V.A. Effect of varied unmanned aerial vehicle laser scanning pulse density on accurately quantifying forest structure. Int. J. Remote Sens. 2022, 43, 721–750. [Google Scholar] [CrossRef]
- Kükenbrink, D.; Gardi, O.; Morsdorf, F.; Thürig, E.; Schellenberger, A.; Mathys, L. Above-ground biomass references for urban trees from terrestrial laser scanning data. Ann. Bot. 2021, 128, 709–724. [Google Scholar] [CrossRef] [PubMed]
- Muumbe, T.P.; Singh, J.; Baade, J.; Raumonen, P.; Coetsee, C.; Thau, C.; Schmullius, C. Individual Tree-Scale Aboveground Biomass Estimation of Woody Vegetation in a Semi-Arid Savanna Using 3D Data. Remote Sens. 2024, 16, 399. [Google Scholar] [CrossRef]
- Morales, A.; Macfarlane, D.W. Reducing tree volume overestimation in quantitative structure models using modeled branch topology and direct twig measurements. For. Int. J. For. Res. 2024, cpae046. [Google Scholar] [CrossRef]
- Abegg, M.; Boesch, R.; Schaepman, M.E.; Morsdorf, F. Impact of Beam Diameter and Scanning Approach on Point Cloud Quality of Terrestrial Laser Scanning in Forests. IEEE Trans. Geosci. Remote Sens. 2021, 59, 8153–8167. [Google Scholar] [CrossRef]
- Kankare, V.; Puttonen, E.; Holopainen, M.; Hyyppä, J. The effect of TLS point cloud sampling on tree detection and diameter measurement accuracy. Remote Sens. Lett. 2016, 7, 495–502. [Google Scholar] [CrossRef]
- Morhart, C.; Schindler, Z.; Frey, J.; Sheppard, J.P.; Calders, K.; Disney, M.; Morsdorf, F.; Raumonen, P.; Seifert, T. Limitations of estimating branch volume from terrestrial laser scanning. Eur. J. For. Res. 2024, 143, 687–702. [Google Scholar] [CrossRef]
- Huang, H.; Li, Z.; Gong, P.; Cheng, X.; Clinton, N.; Cao, C.; Ni, W.; Wang, L. Automated methods for measuring DBH and tree heights with a commercial scanning lidar. Photogramm. Eng. Remote Sens. 2011, 77, 219–227. [Google Scholar] [CrossRef]
- Liu, G.; Wang, J.; Dong, P.; Chen, Y.; Liu, Z. Estimating individual tree height and diameter at breast height (DBH) from terrestrial laser scanning (TLS) data at plot level. Forests 2018, 9, 398. [Google Scholar] [CrossRef]
- Campos, M.B.; Litkey, P.; Wang, Y.; Chen, Y.; Hyyti, H.; Hyyppä, J.; Puttonen, E. A Long-Term Terrestrial Laser Scanning Measurement Station to Continuously Monitor Structural and Phenological Dynamics of Boreal Forest Canopy. Front. Plant Sci. 2021, 11, 606752. [Google Scholar] [CrossRef] [PubMed]
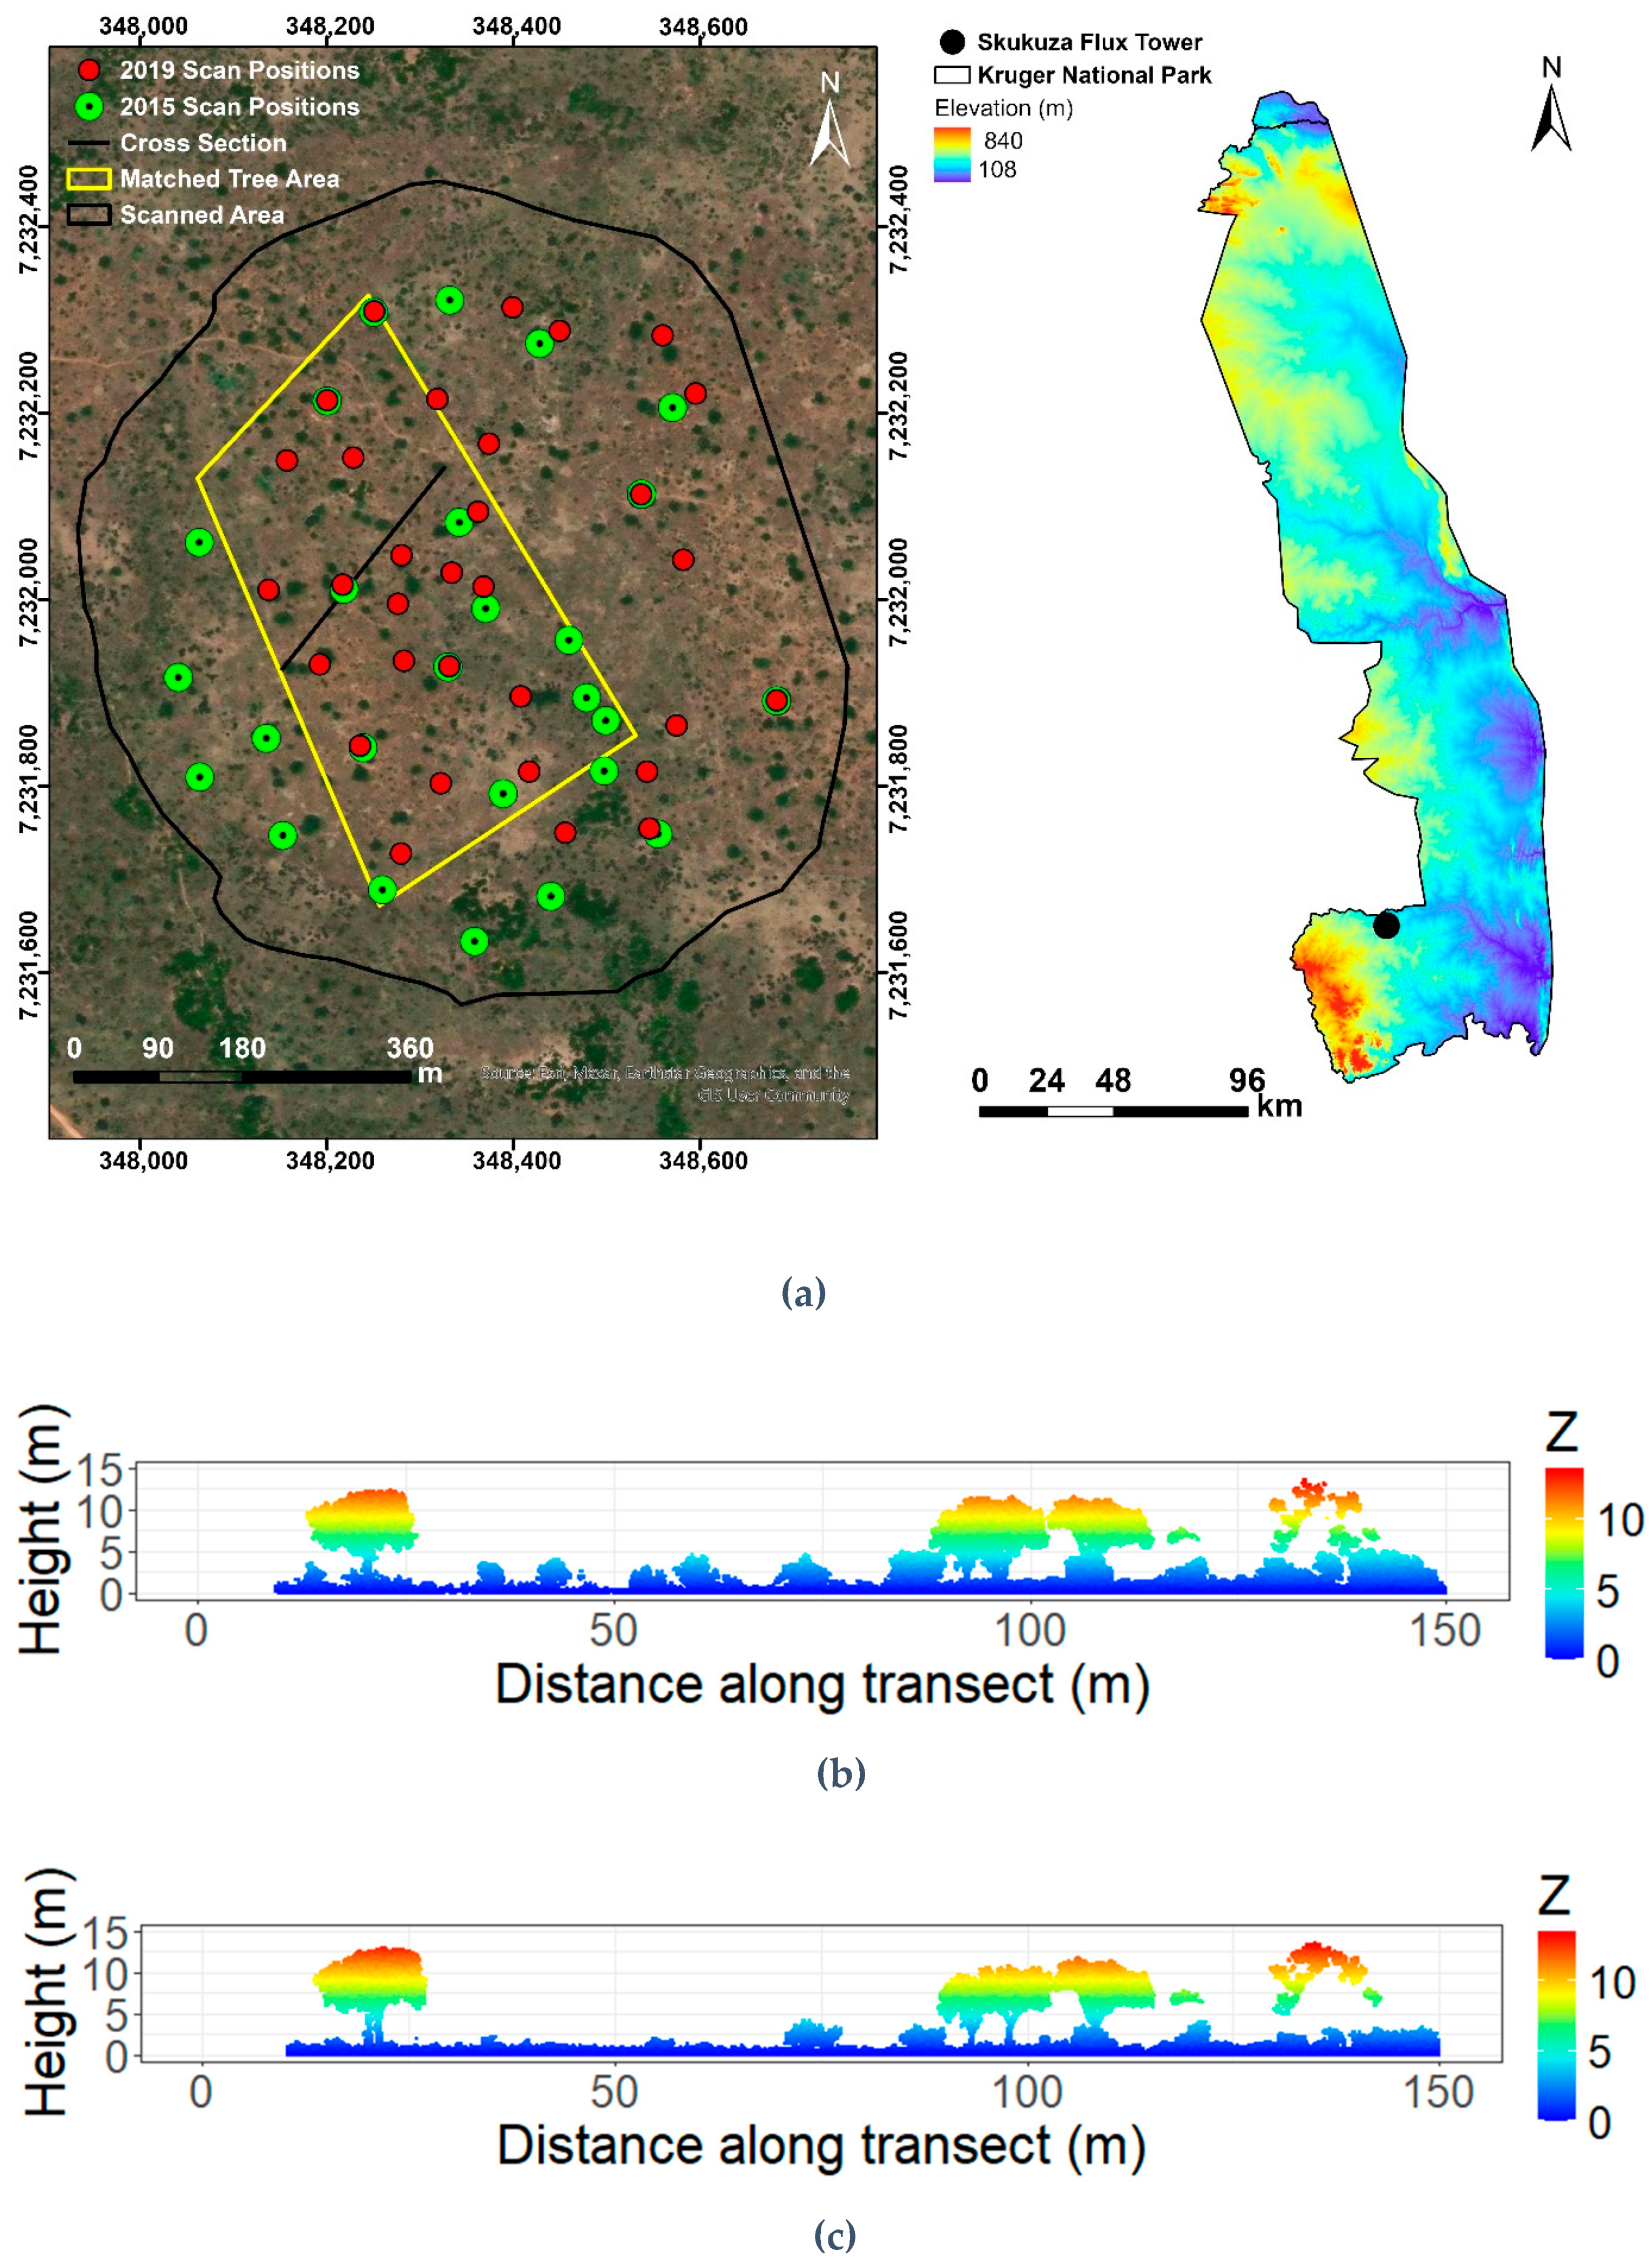




| 2015 | 2019 | |
|---|---|---|
| Scan Positions | 30 | 32 |
| Beam divergence | 0.3 mrad | 0.3 mrad |
| Pulse repetition rate | 300 kHz (450 m) | 300 kHz (450 m) |
| Angular Sampling | 0.015° | 0.025° |
| Tree Structural Parameter | Unit of Measurement | Definition |
|---|---|---|
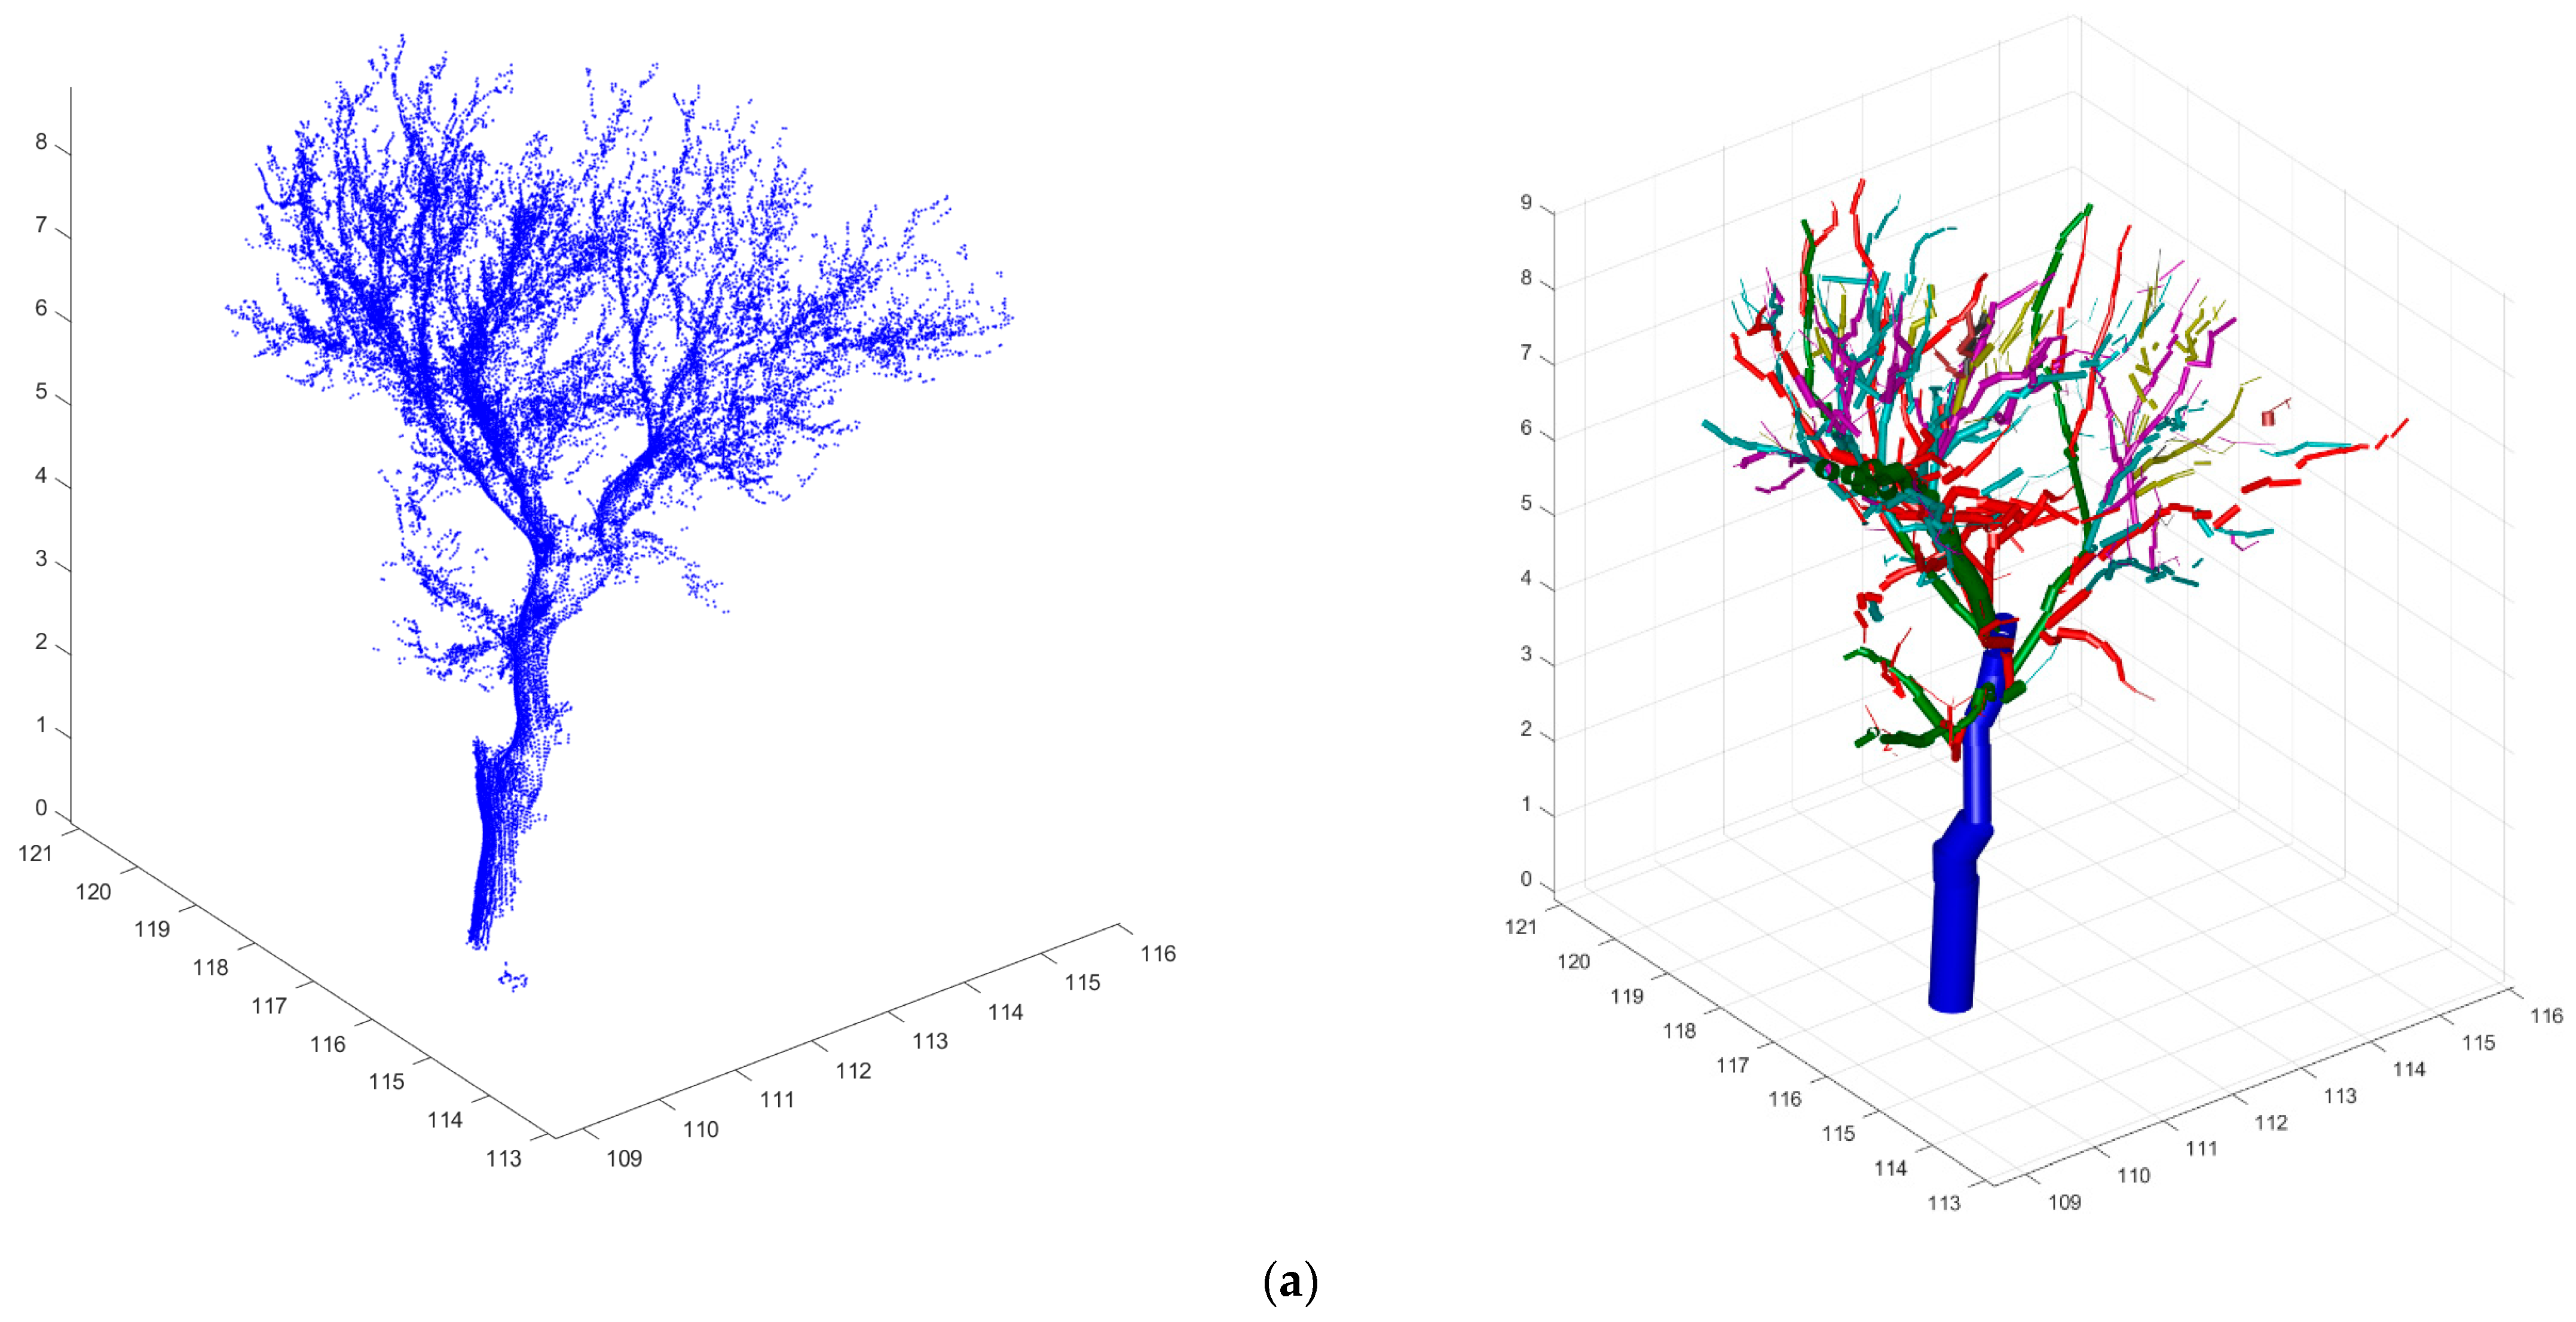
| Diameter at breast height (DBH) Tree height Crown area Trunk volume Total volume Branch volume Branch length 1st-order branch length | cm m m2 L L L m m | The diameter of the cylinder fitted to the height (1.1–1.5 m) Height of the tree Area of the crown’s planar projection’s convex hull The volume of the tree stem The total volume of the tree The volume of all the branches The total length of all the branches Total length of the main branches |
| 2015 | 2019 | ||||
|---|---|---|---|---|---|
| Predictor | Response | R2 | RMSE | R2 | RMSE |
| DBH | Tree Height | 0.36 | 8.6 m | 0.37 | 8.6 m |
| DBH | Crown area | 0.78 | 85.2 m2 | 0.81 | 91.1 m2 |
| DBH | Trunk vol | 0.91 | 883 L | 0.91 | 913 L |
| DBH | Total vol | 0.79 | 3576 L | 0.79 | 3657 L |
| DBH | Branch vol | 0.73 | 2662 L | 0.70 | 2702 L |
| DBH | Branch len | 0.54 | 908.3 m | 0.68 | 891.9 m |
| DBH | Branch len (1st) | 0.07 | 36.8 m | 0.25 | 37.2 m |
| Tree height | Crown area | 0.42 | 80.6 m2 | 0.45 | 85.3 m2 |
| Tree height | Trunk vol | 0.52 | 839 L | 0.57 | 868 L |
| Tree height | Total vol | 0.43 | 3360 L | 0.48 | 3460 L |
| Tree height | Branch vol | 0.39 | 2490 L | 0.41 | 2537 L |
| Tree height | Branch len | 0.38 | 894.3 m | 0.35 | 822.3 m |
| Tree height | Branch len (1st) | 0.30 | 38.3 m | 0.57 | 39.0 m |
| Crown area | Trunk vol | 0.75 | 863 L | 0.77 | 897 L |
| Crown area | Total vol | 0.81 | 3656 L | 0.84 | 3756 L |
| Crown area | Branch vol | 0.79 | 2765 L | 0.81 | 2825 L |
| Crown area | Branch len | 0.65 | 955.7 m | 0.84 | 948.7 m |
| Crown area | Branch len (1st) | 0.09 | 36.9 m | 0.34 | 37.7 m |
| Trunk vol | Total vol | 0.85 | 3672 L | 0.83 | 3742 L |
| Trunk vol | Branch vol | 0.77 | 2732 L | 0.72 | 2751 L |
| Trunk vol | Branch len | 0.54 | 916 m | 0.65 | 892.5 m |
| Trunk vol | Branch len (1st) | 0.15 | 37.3 m | 0.41 | 38.0 m |
| Total vol | Branch vol | 0.99 | 3066 L | 0.98 | 3010 L |
| Total vol | Branch len | 0.72 | 1005.1 m | 0.78 | 940.8 m |
| Total vol | Branch len (1st) | 0.24 | 37.9 m | 0.50 | 38.5 m |
| Branch vol | Branch len | 0.73 | 1017.9 m | 0.78 | 947.0 m |
| Branch vol | Branch len (1st) | 0.25 | 38.0 m | 0.49 | 38.5 m |
| Branch len | Branch len (1st) | 0.34 | 38.6 m | 0.33 | 37.7 m |
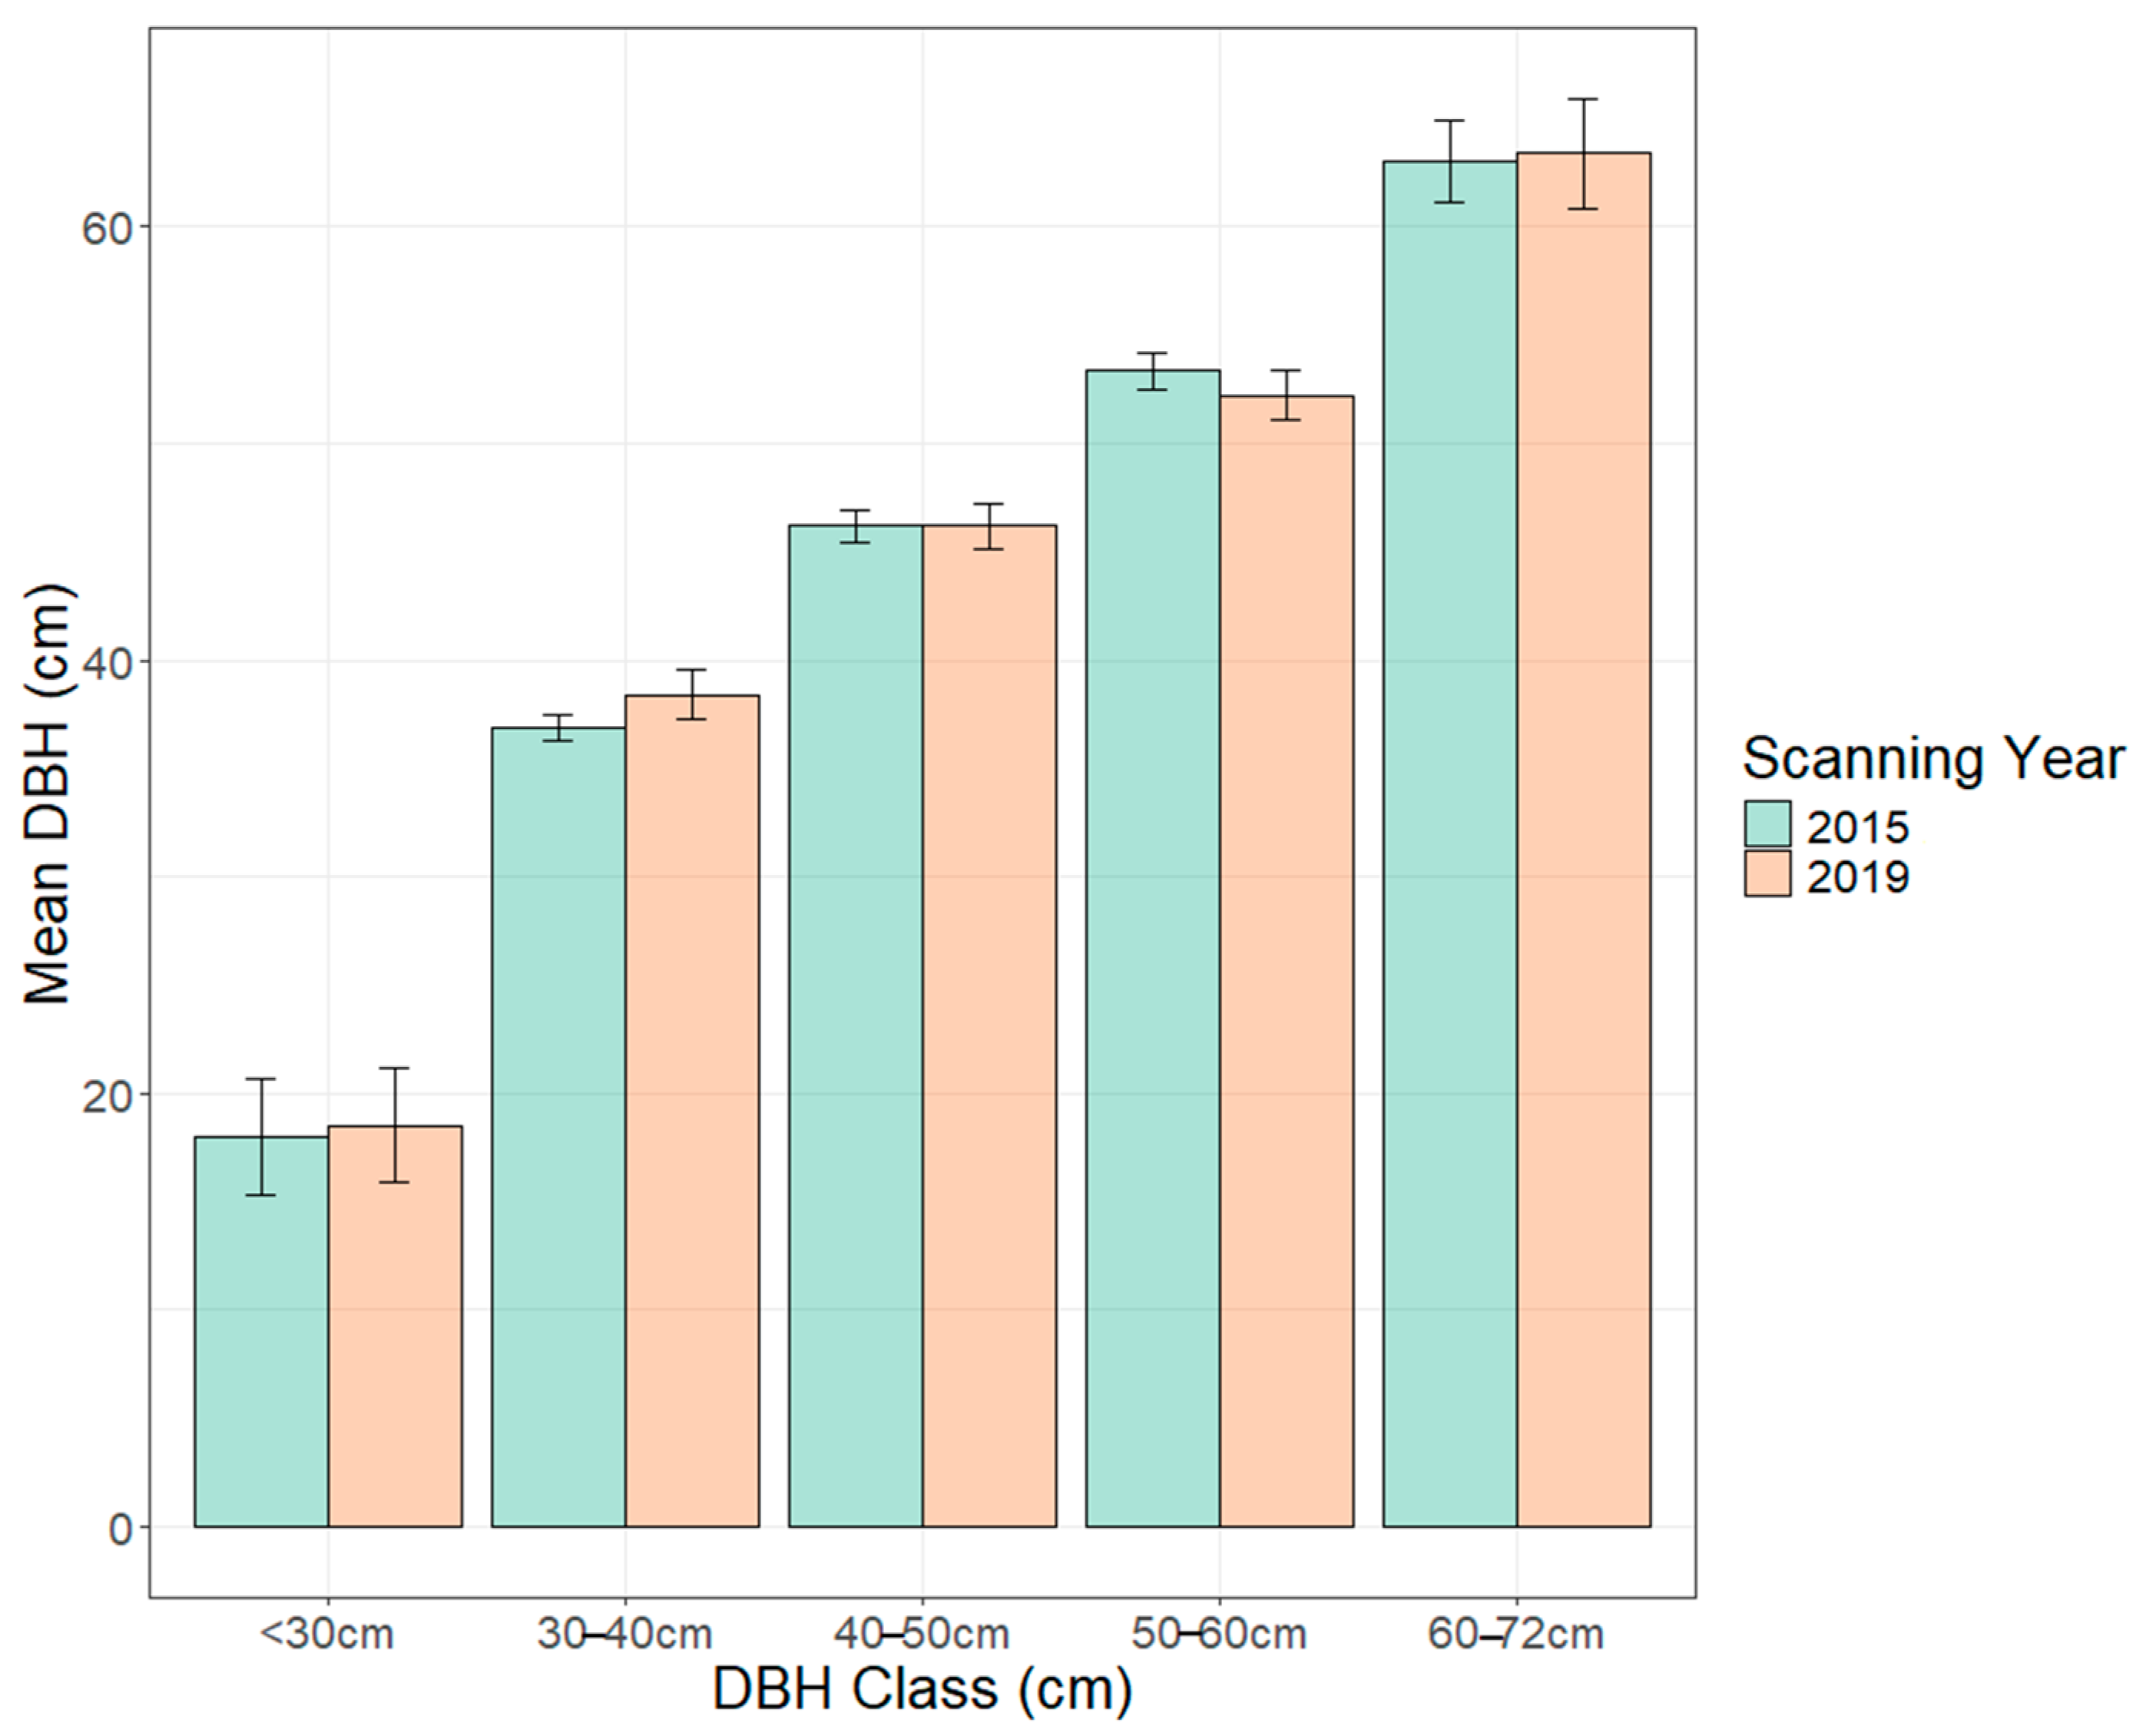
| Parameter | DBH Class cm (n) | 2015 DBH Mean ± SE | 2019 DBH Mean ± SE | p Value |
|---|---|---|---|---|
| DBH (cm) | <30 (4) | 18 ± 2.7 | 19 ± 2.6 | 0.83 |
| 30–40 (15) | 37 ± 0.6 | 38 ± 1.1 | 0.05 * | |
| 40–50 (15) | 46 ± 0.8 | 46 ± 1.0 | 1 | |
| 50–60 (14) | 53 ± 0.8 | 52 ± 1.1 | 0.07 | |
| 60–72 (5) | 63 ± 1.9 | 63 ± 2.5 | 0.72 |
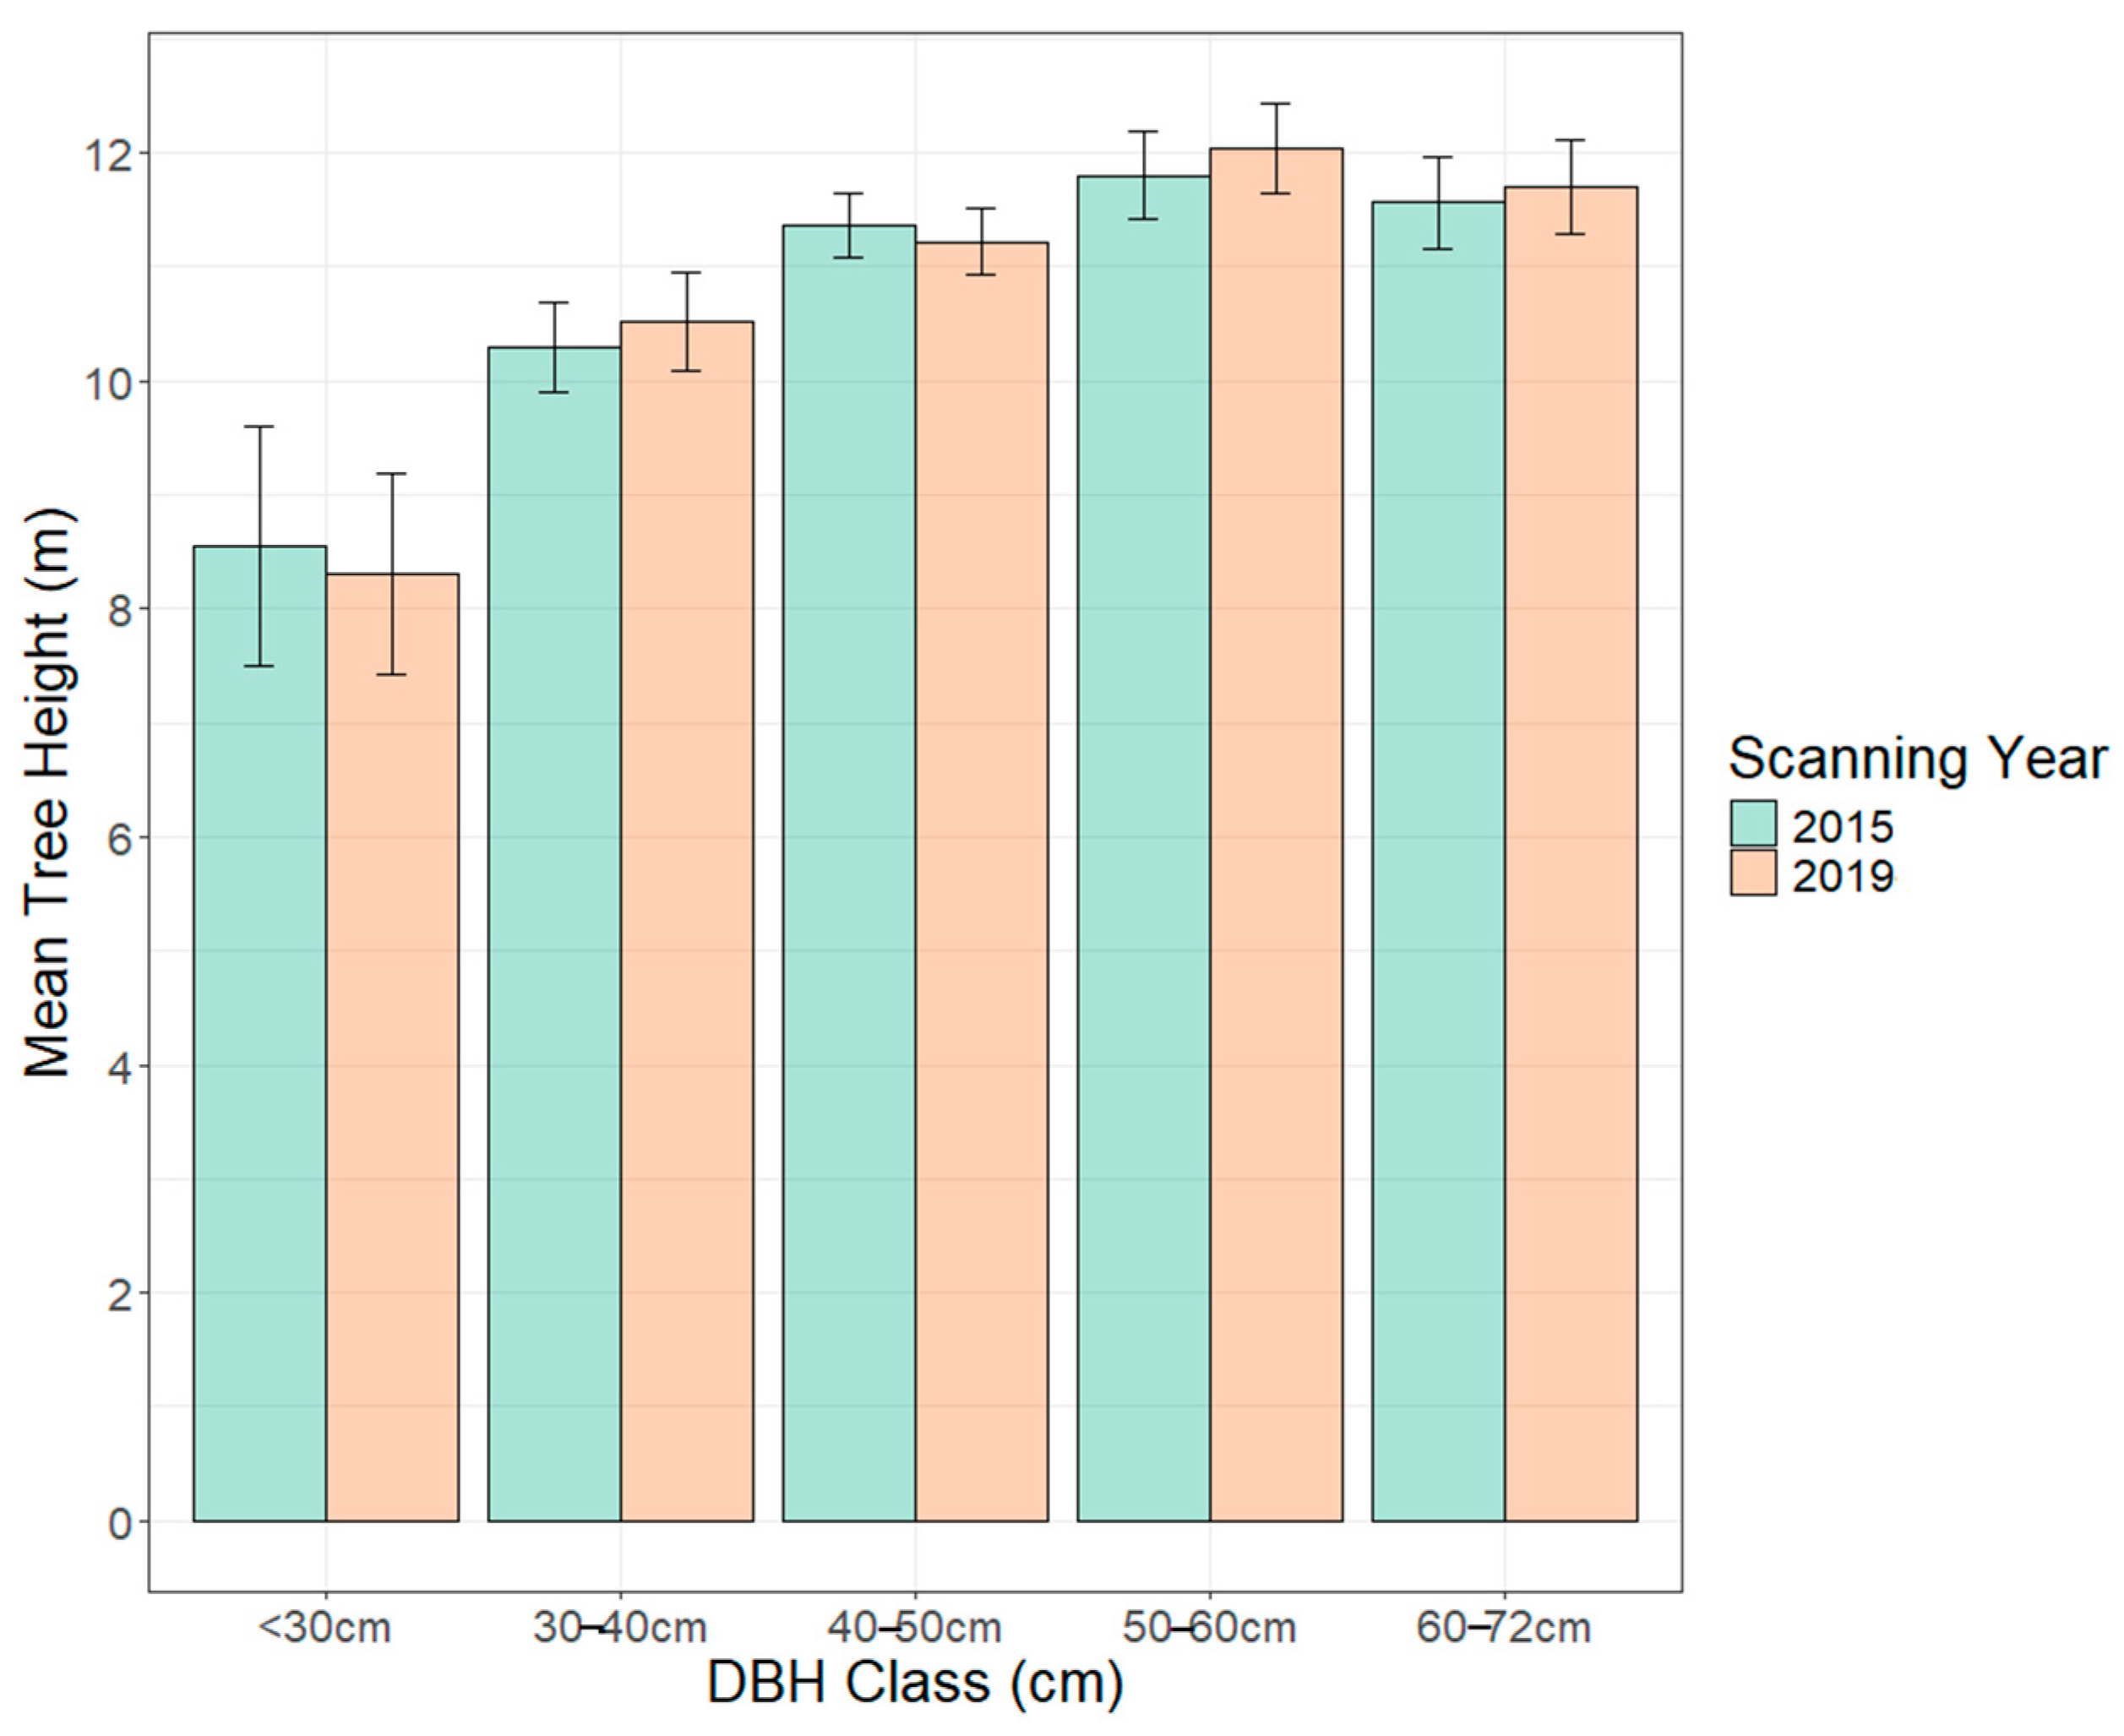
| Parameter | DBH Class cm (n) | 2015 TH Mean ± SE | 2019 TH Mean ± SE | p Value |
|---|---|---|---|---|
| Tree Height (m) | <30 (4) | 8.6 ± 1.0 | 8.3 ± 0.9 | 0.24 |
| 30–40 (15) | 10.3 ± 0.4 | 10.5 ± 0.4 | 0.09 | |
| 40–50 (15) | 11.4 ± 0.3 | 11.2 ± 0.3 | 0.16 | |
| 50–60 (14) | 11.8 ± 0.4 | 12.0 ± 0.4 | 0.02 * | |
| 60–72 (5) | 11.6 ± 0.4 | 11.7 ± 0.4 | 0.42 |
| Parameter | DBH Class cm (n) | 2015 CA Mean ± SE | 2019 CA Mean ± SE | p Value |
|---|---|---|---|---|
| Crown Area (m2) | <30 (4) | 14.5 ± 4.5 | 15.2 ± 4.5 | 0.77 |
| 30–40 (15) | 62.6 ± 3.8 | 66.1 ± 3.7 | 0.007 * | |
| 40–50 (15) | 86.2 ± 4.9 | 94.0 ± 6.3 | 0.04 * | |
| 50–60 (14) | 112.1 ± 10.8 | 117.5 ± 11.8 | 0.07 | |
| 60–72 (5) | 136.7 ± 21.3 | 140.3 ± 20.9 | 0.16 |
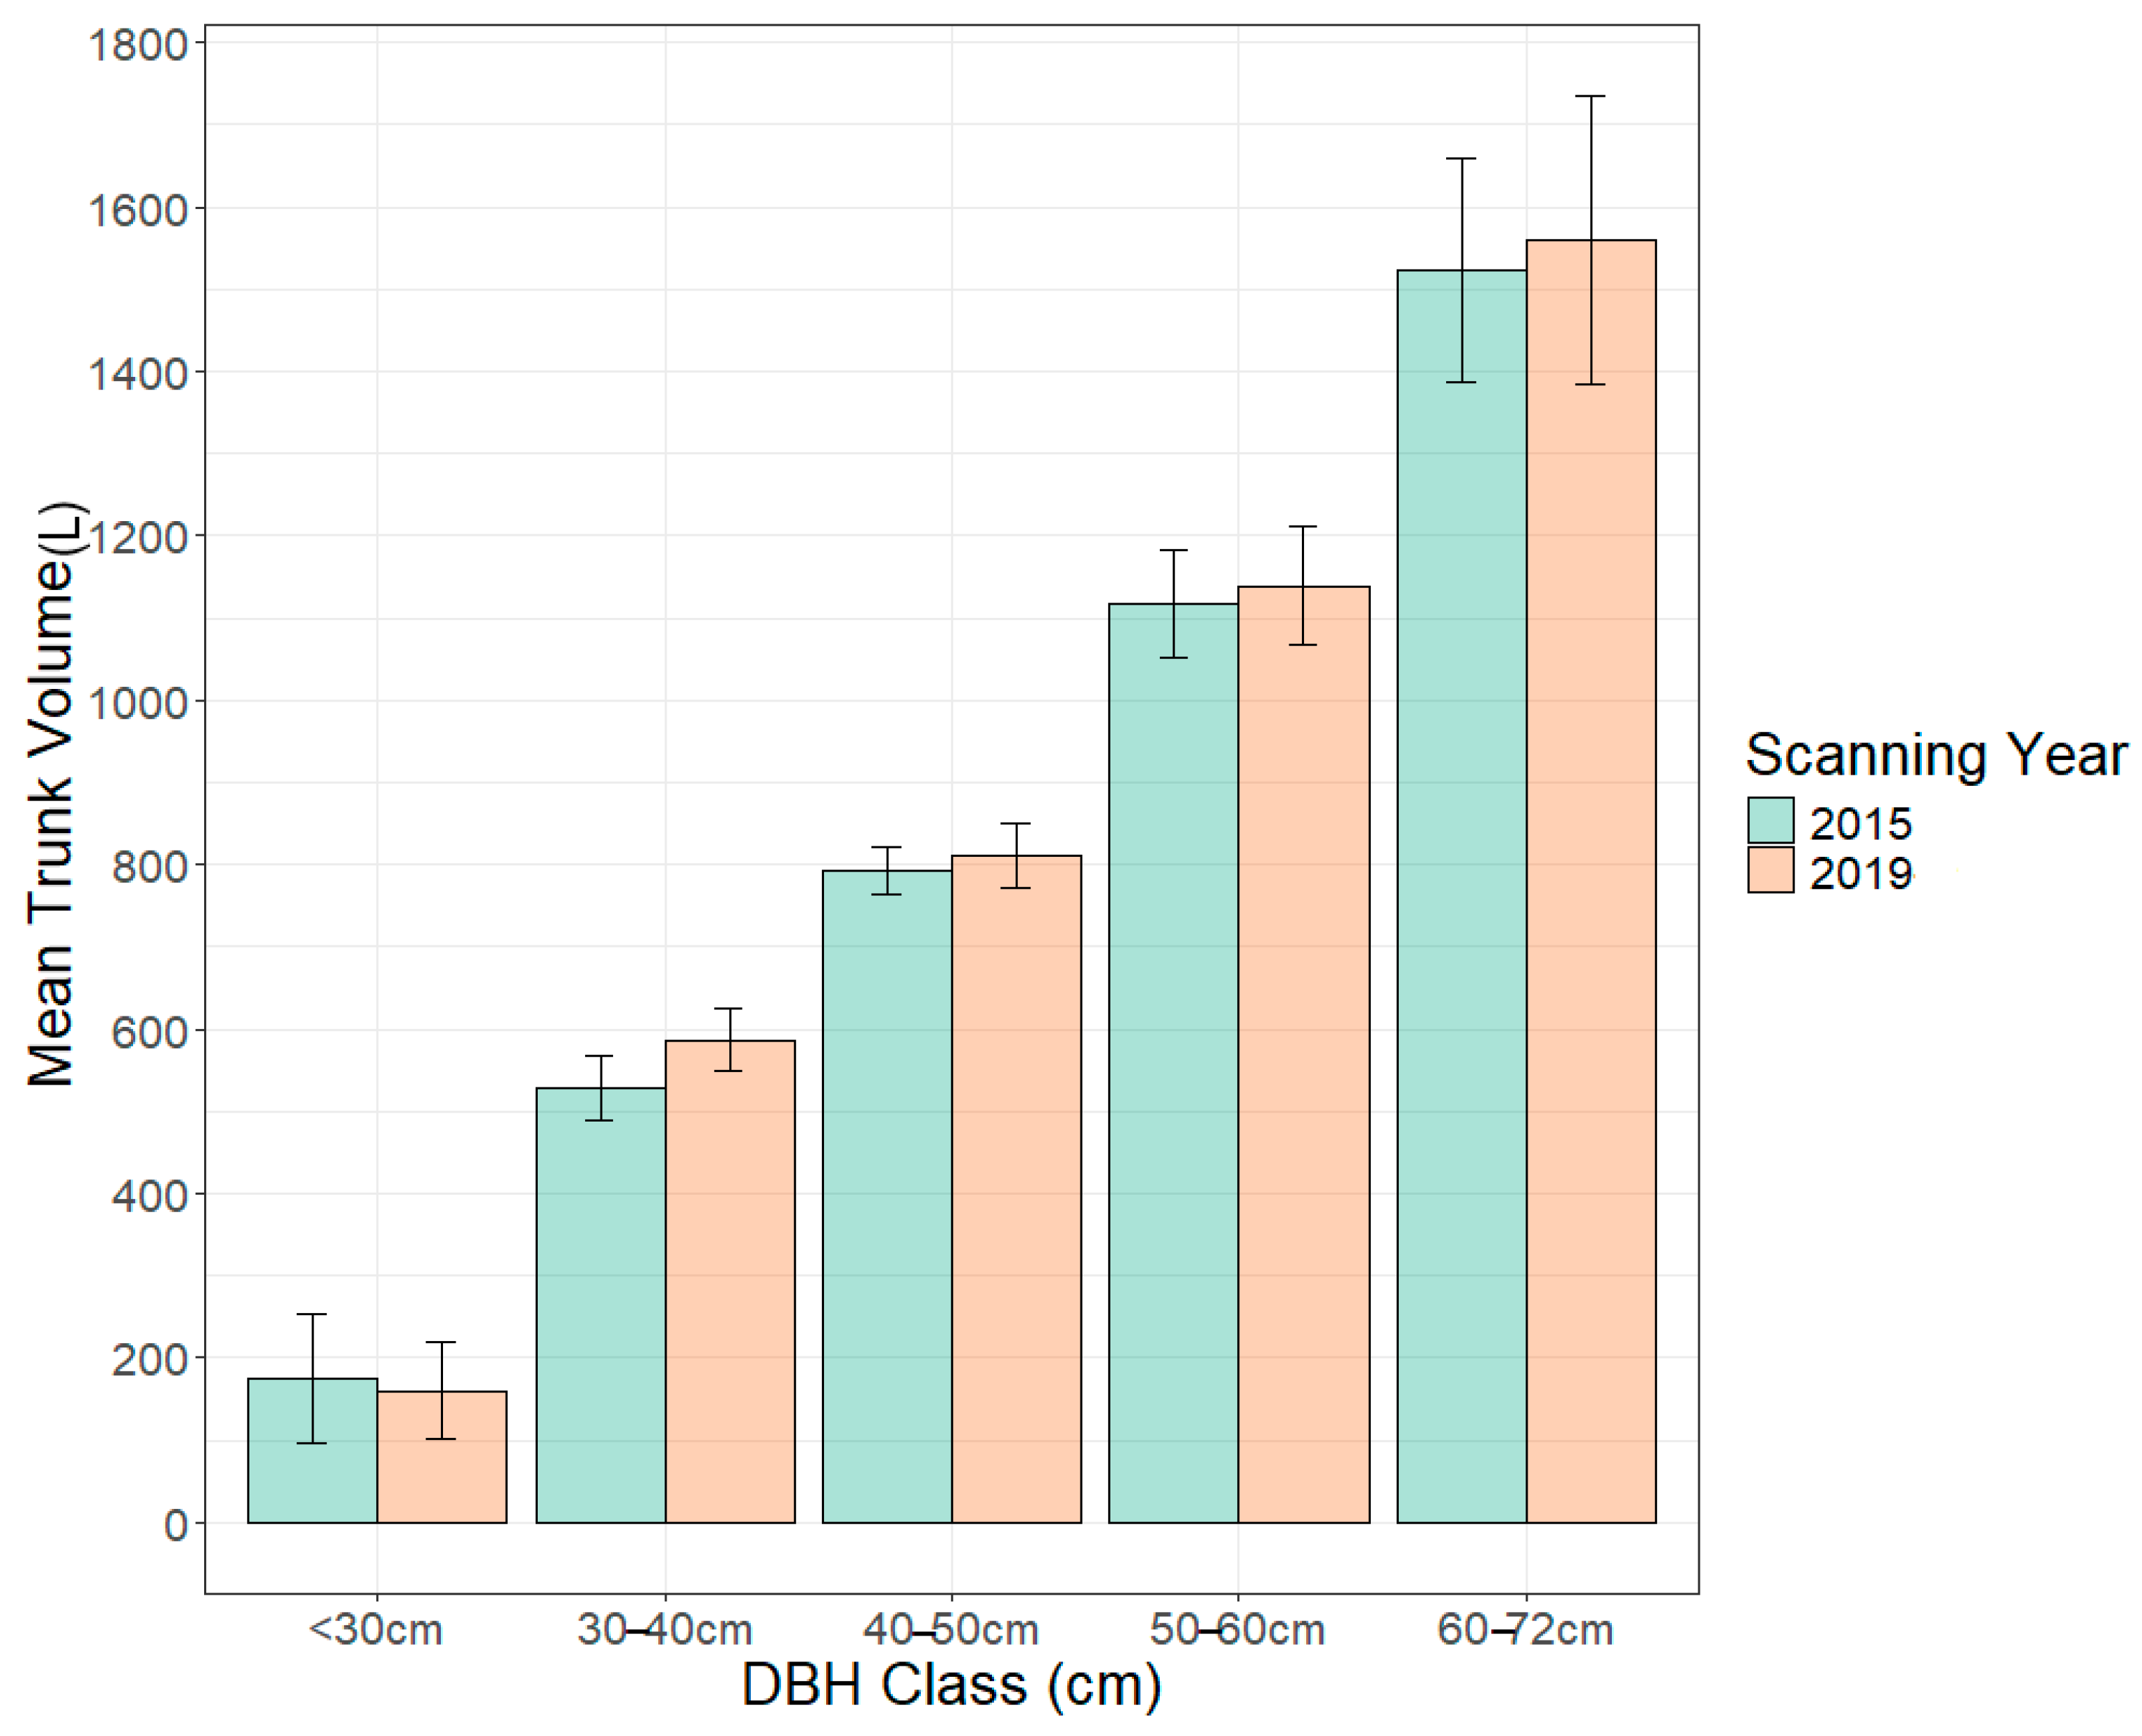
| Parameter | DBH Class cm (n) | 2015 TrV Mean ± SE | 2019 TrV Mean ± SE | p Value |
|---|---|---|---|---|
| Trunk Volume (L) | <30 (4) | 175 ± 78 | 160 ± 60 | 0.68 |
| 30–40 (15) | 528 ± 39 | 586 ± 38 | 0.002 * | |
| 40–50 (15) | 792 ± 29 | 811 ± 39 | 0.38 | |
| 50–60 (14) | 1117 ± 64 | 1138 ± 72 | 0.41 | |
| 60–72 (5) | 1523 ± 136 | 1559 ± 176 | 0.61 |
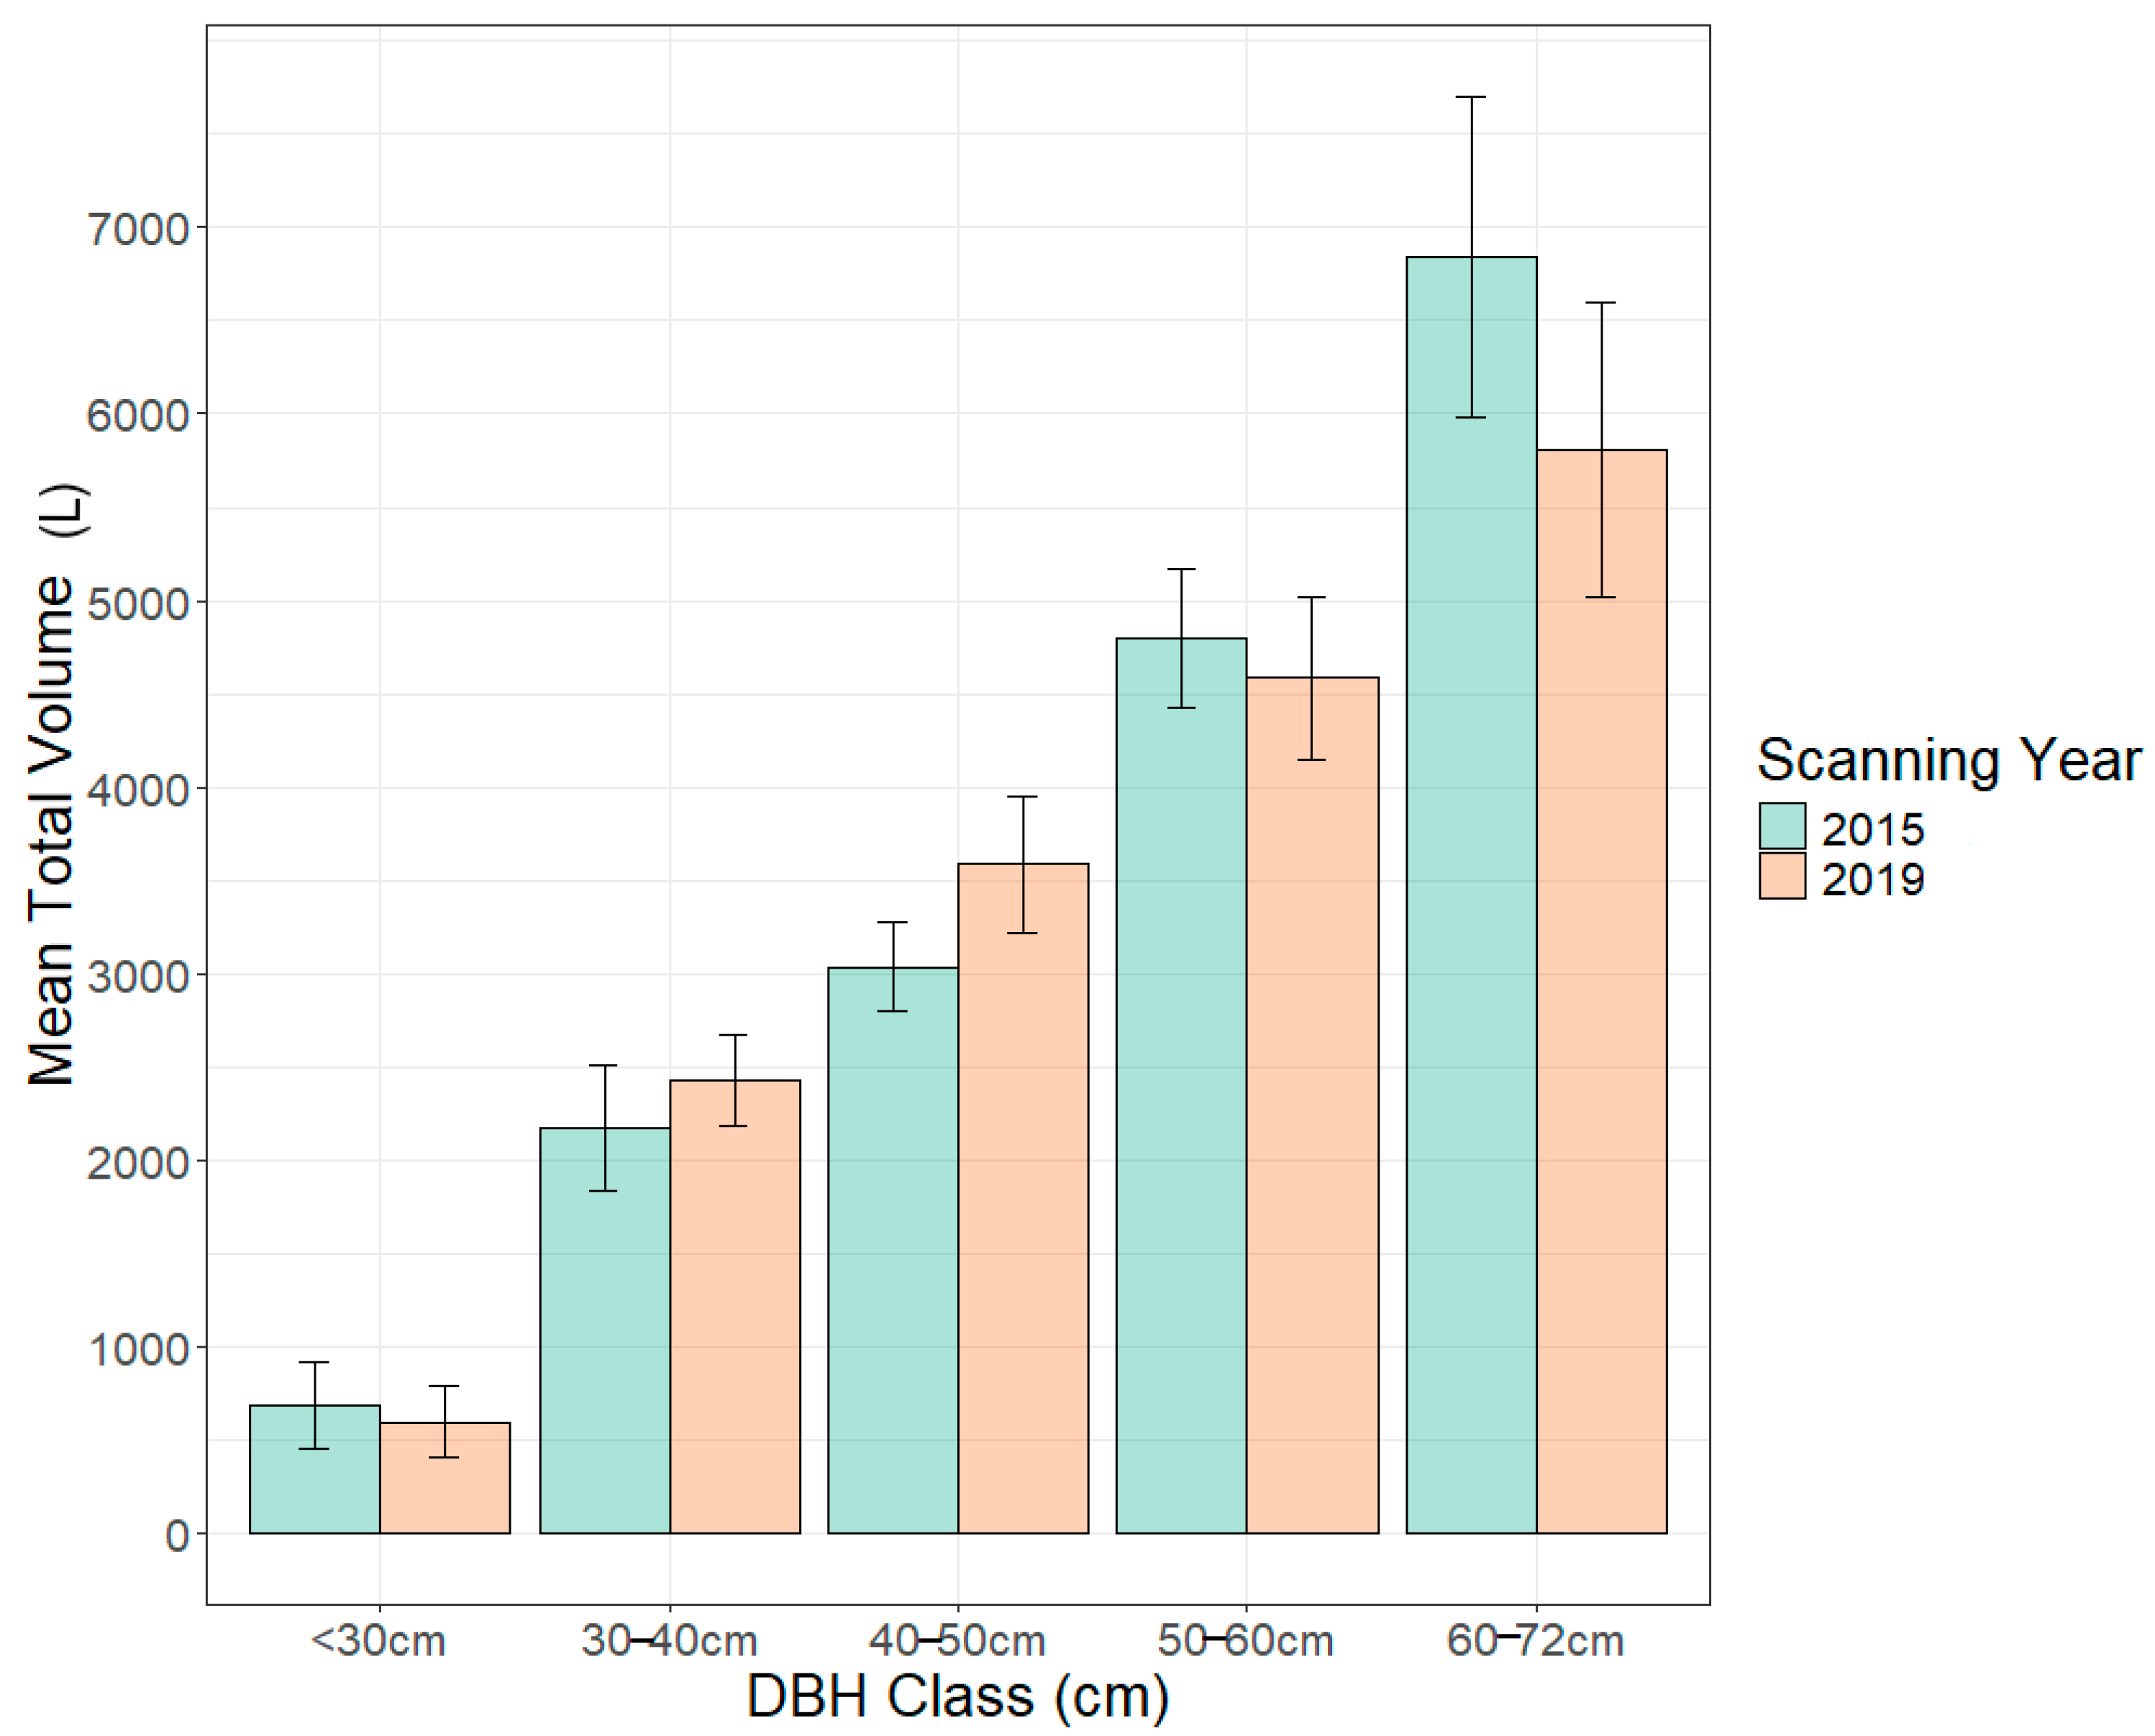
| Parameter | DBH Class cm (n) | 2015 ToV Mean ± SE | 2019 ToV Mean ± SE | p Value |
|---|---|---|---|---|
| Total Volume (L) | <30 (4) | 684 ± 234 | 591 ± 192 | 0.42 |
| 30–40 (15) | 2170 ± 341 | 2426 ± 240 | 0.17 | |
| 40–50 (15) | 3032 ± 239 | 3584 ± 370 | 0.007 * | |
| 50–60 (14) | 4797 ± 367 | 4583 ± 434 | 0.43 | |
| 60–72 (5) | 6842 ± 861 | 5809 ± 793 | 0.04 * |
| Parameter | DBH Class cm (n) | 2015 BrV Mean ± SE | 2019 BrV Mean ± SE | p Value |
|---|---|---|---|---|
| Branch Volume (L) | <30 (4) | 509 ± 211 | 431 ± 184 | 0.44 |
| 30–40 (15) | 1642 ± 305 | 1839 ± 211 | 0.27 | |
| 40–50 (15) | 2240 ± 227 | 2774 ± 345 | 0.007 * | |
| 50–60 (14) | 3679 ± 330 | 3444 ± 397 | 0.37 | |
| 60–72 (5) | 5319 ± 805 | 4250 ± 756 | 0.04 * |
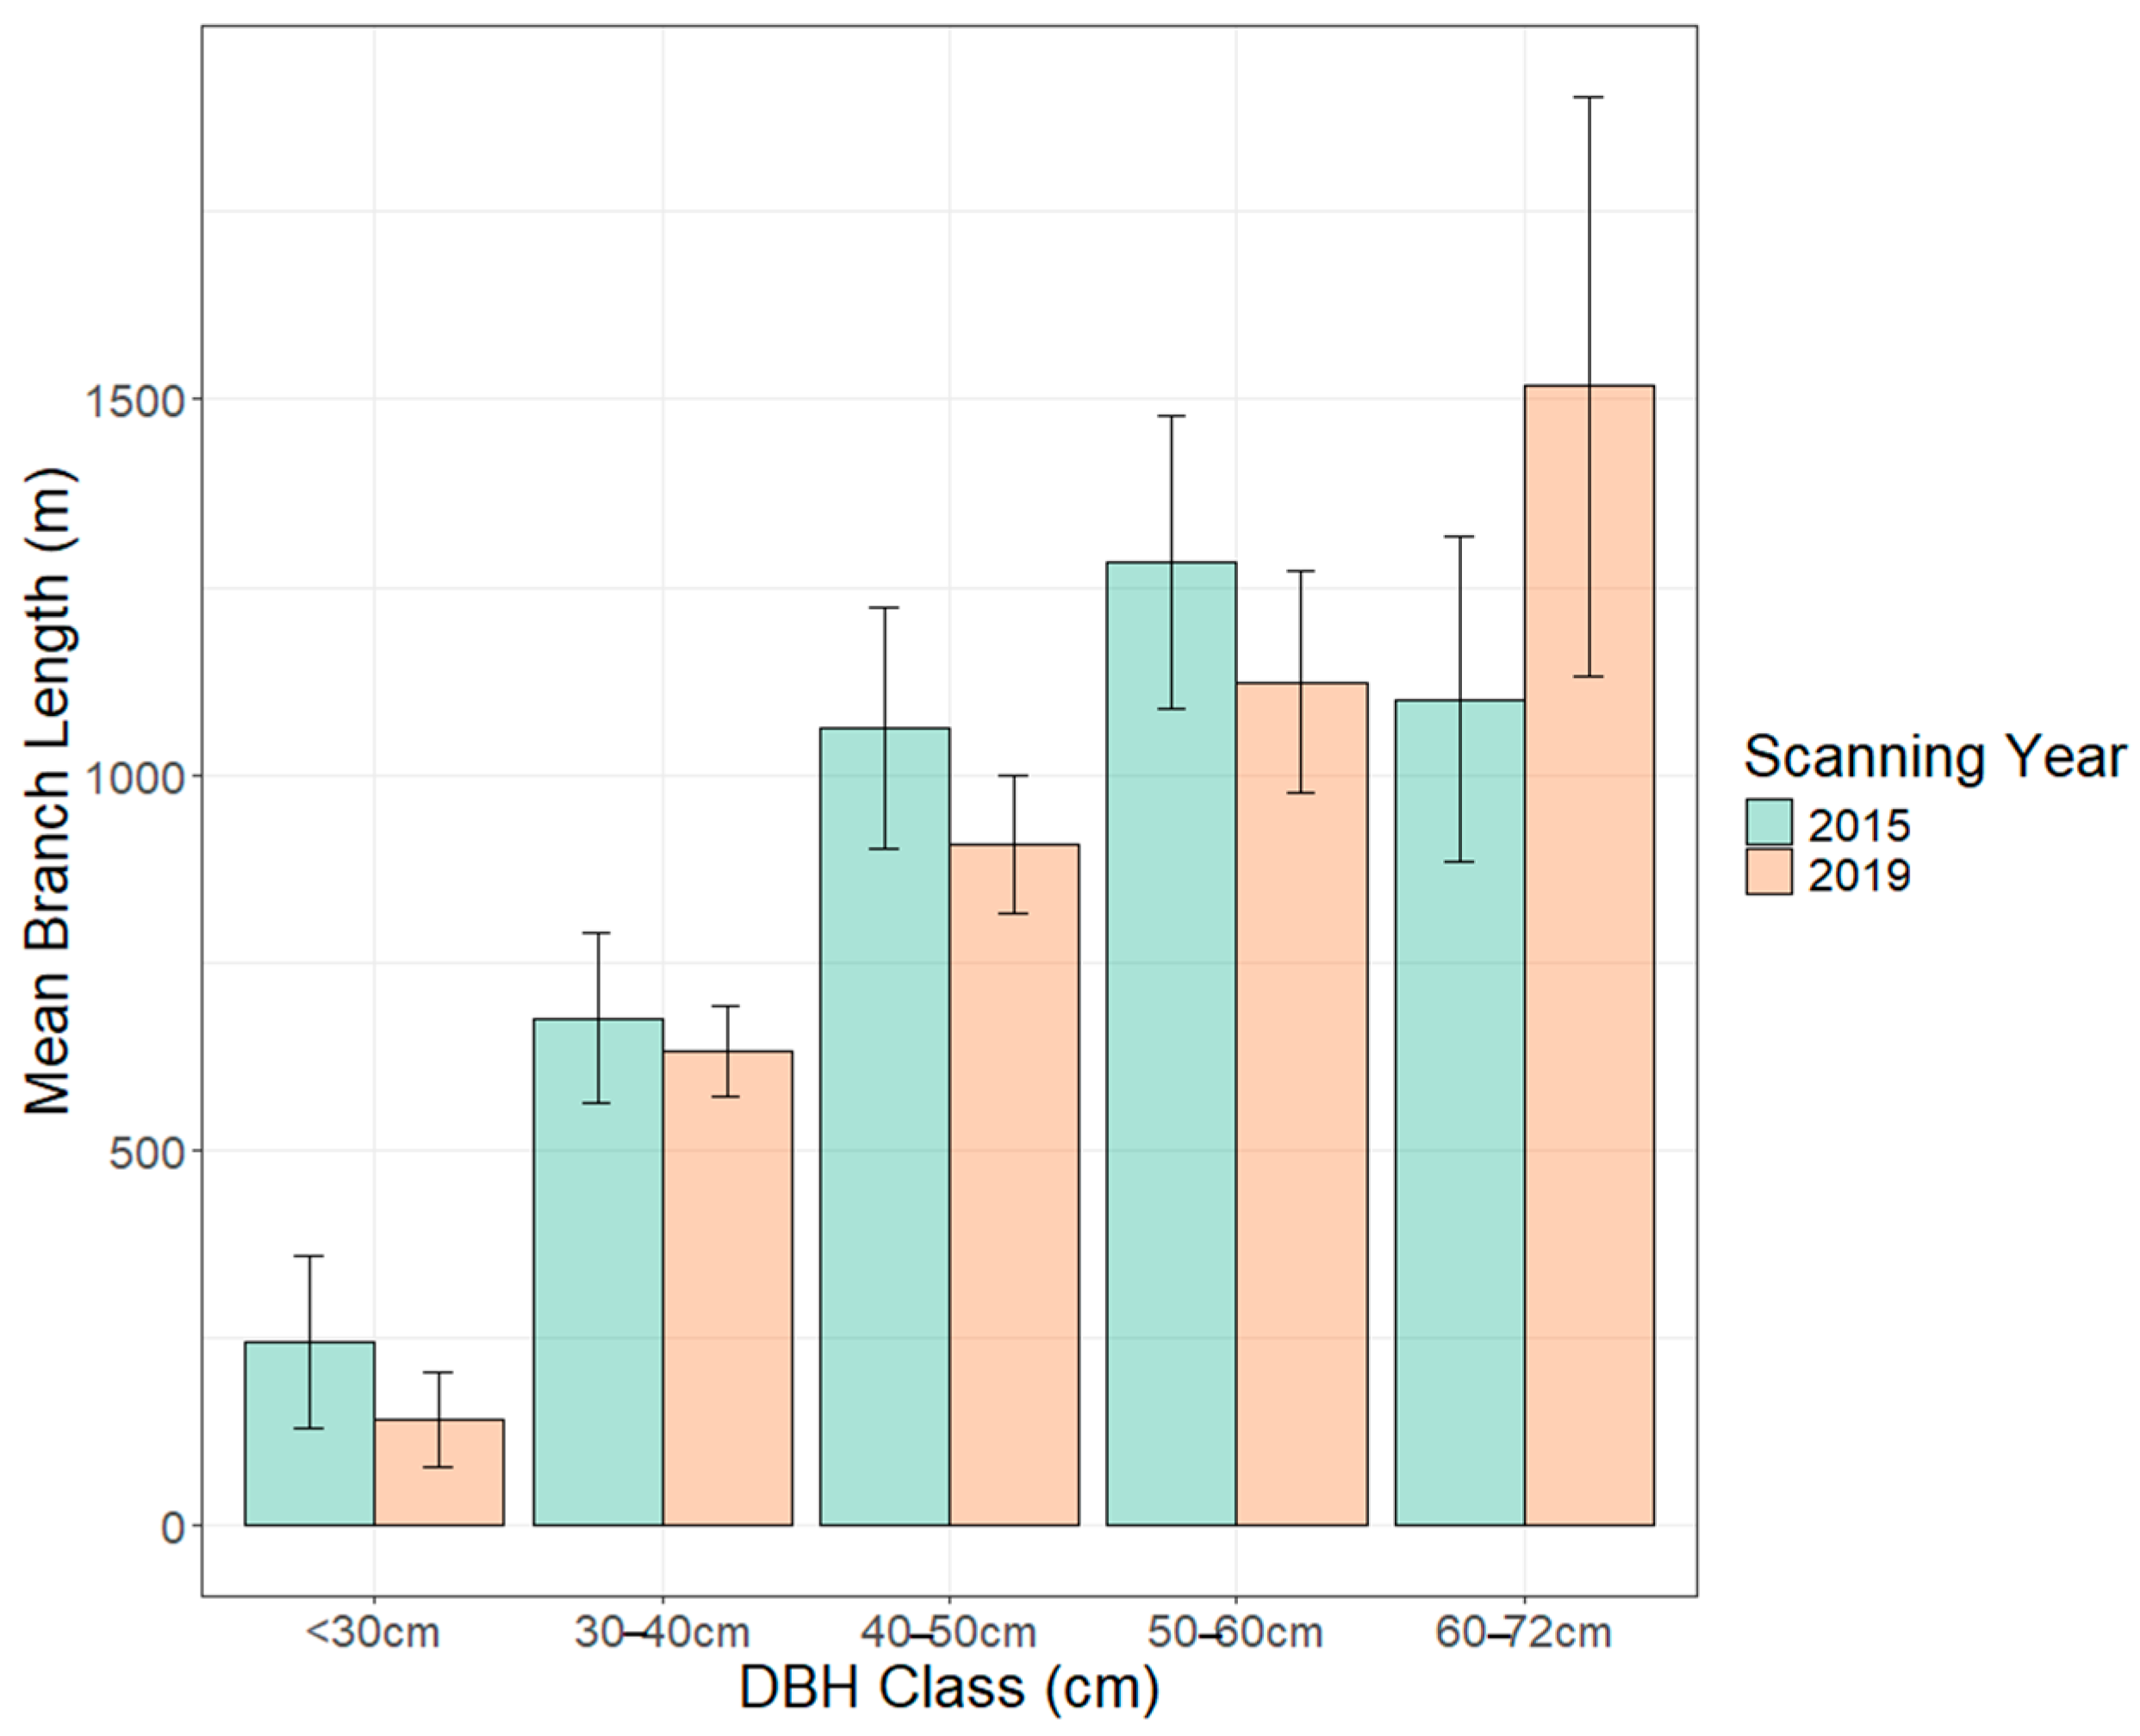
| Parameter | DBH Class cm (n) | 2015 BrL Mean ± SE | 2019 BrL Mean ± SE | p Value |
|---|---|---|---|---|
| Branch Length (m) | <30 (4) | 244 ± 114 | 140 ± 63 | 0.22 |
| 30–40 (15) | 675 ± 113 | 632 ± 60 | 0.64 | |
| 40–50 (15) | 1062 ± 161 | 907 ± 92 | 0.16 | |
| 50–60 (14) | 1284 ± 196 | 1123 ± 148 | 0.32 | |
| 60–72 (5) | 1101 ± 218 | 1518 ± 386 | 0.09 |
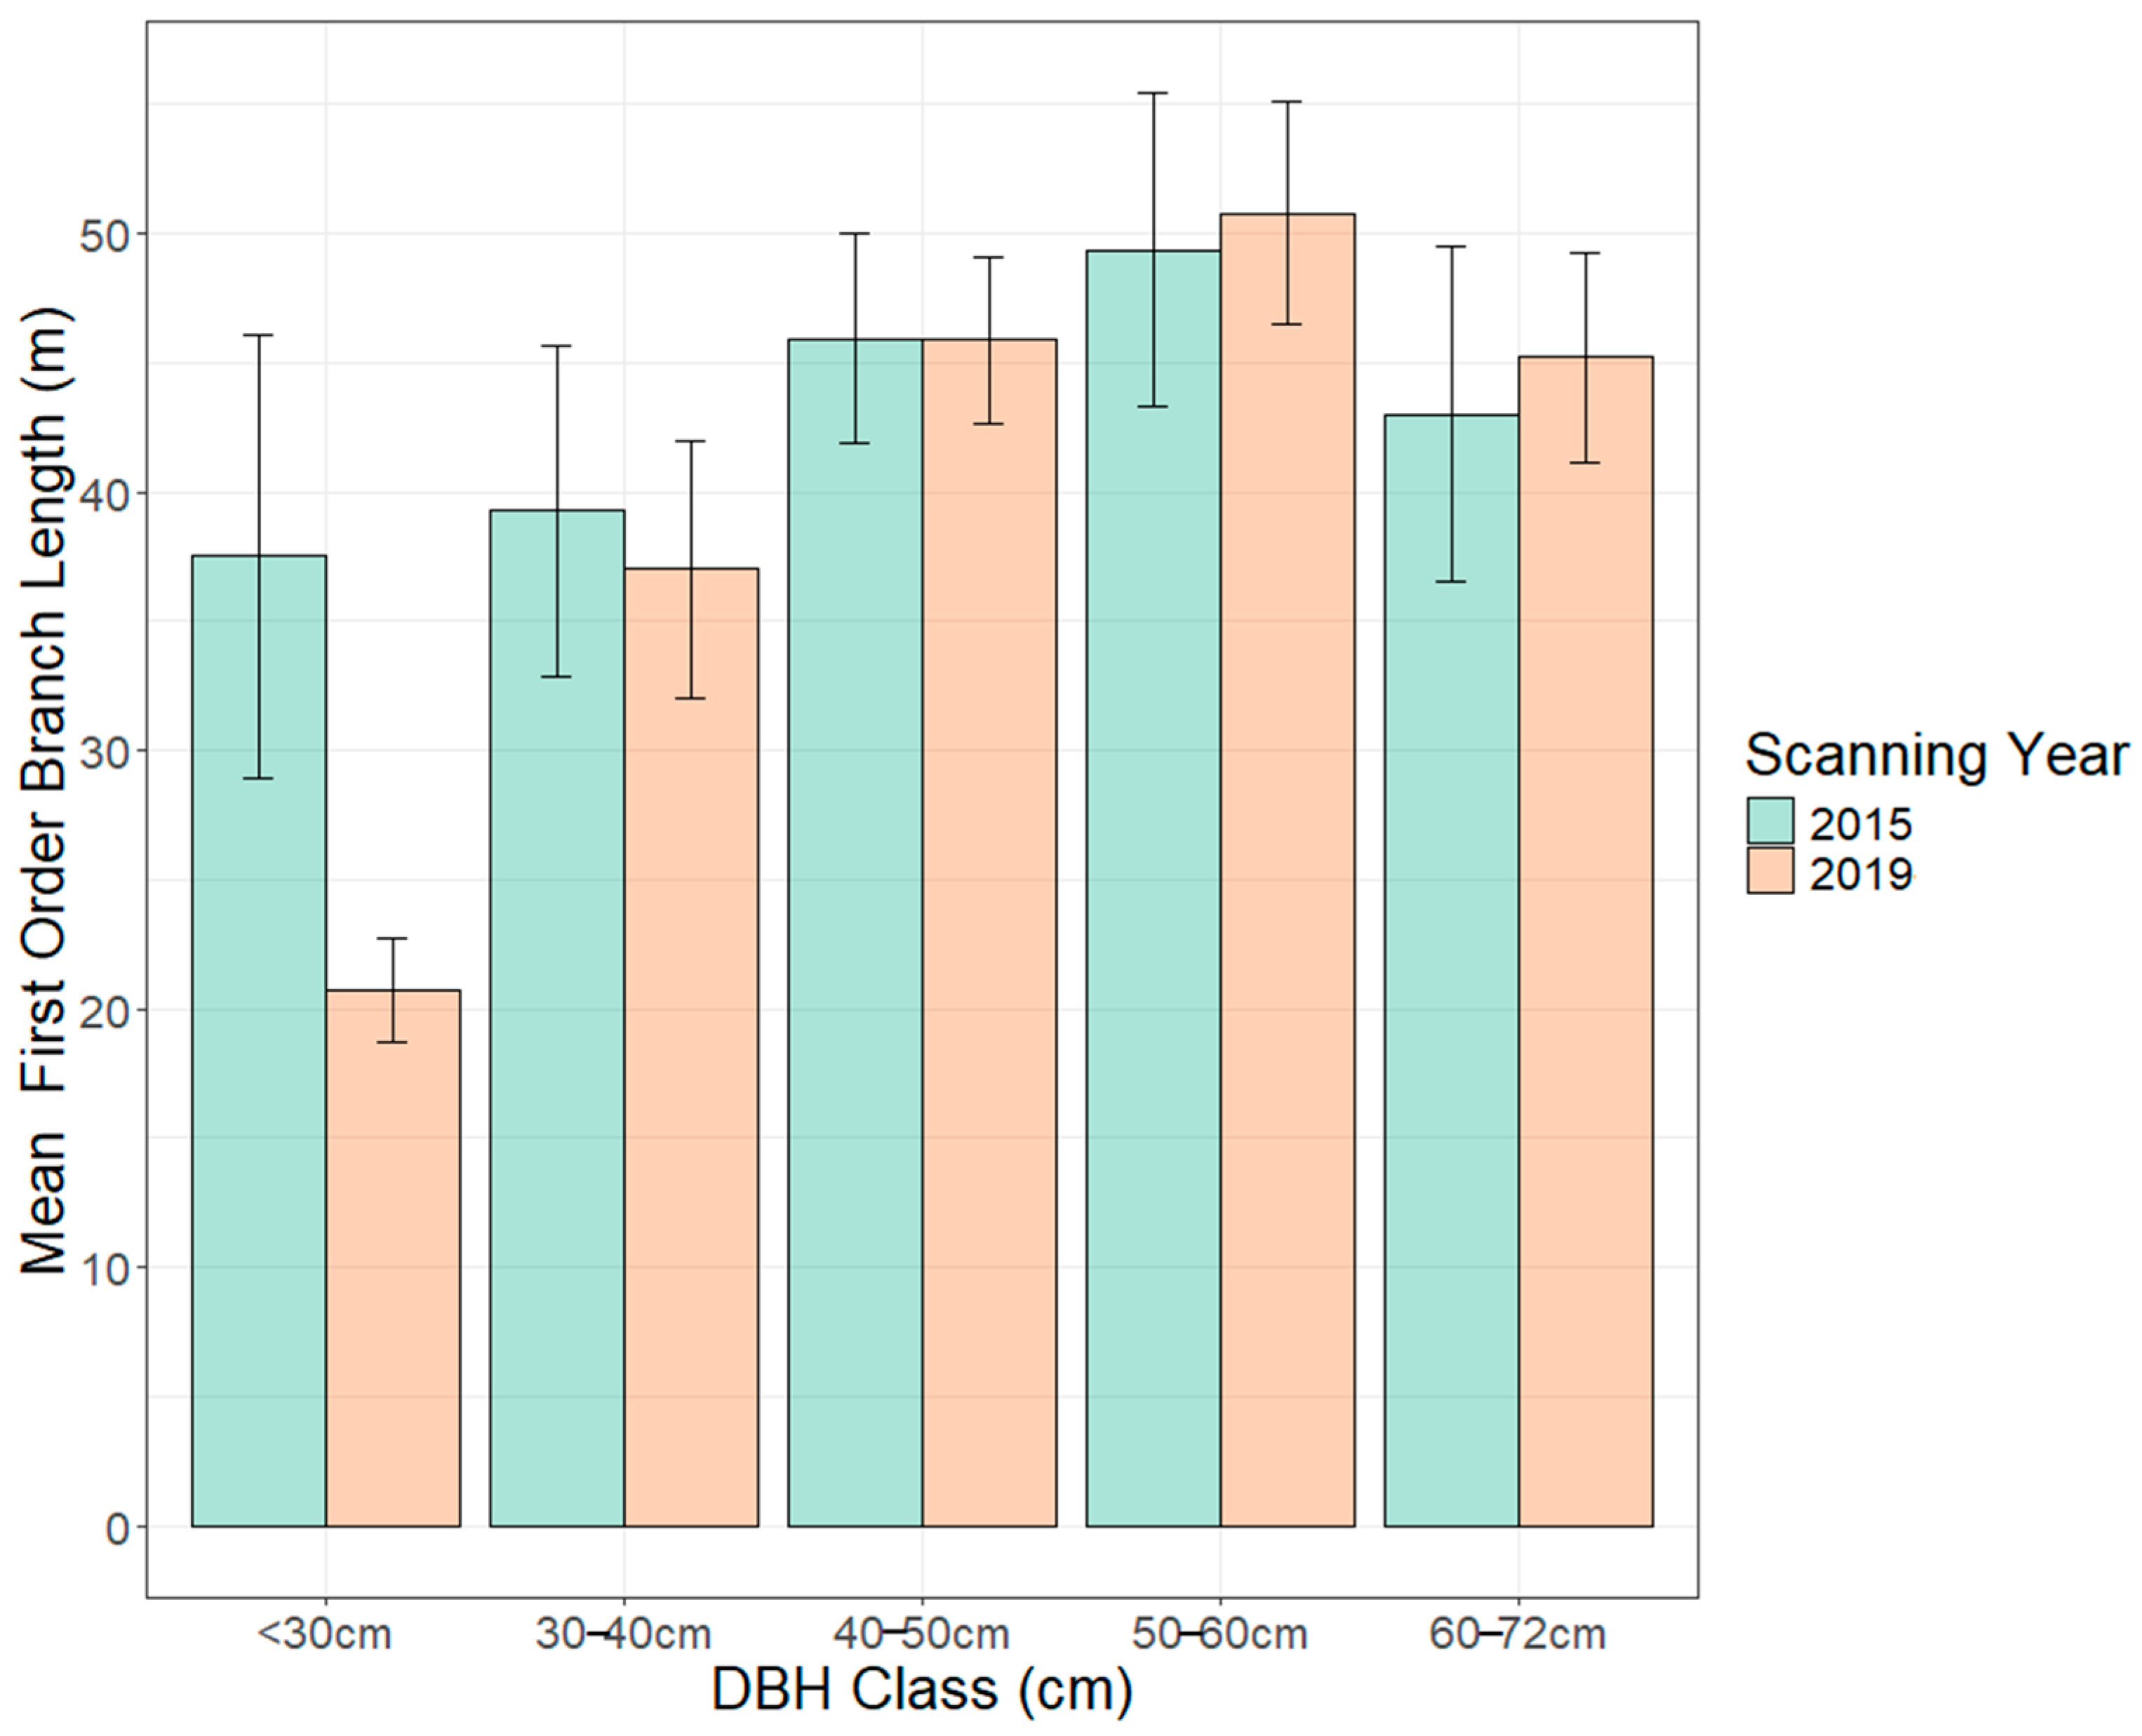
| Parameter | DBH Class cm (n) | 2015 LBO Mean ± SE | 2019 LBO Mean ± SE | p Value |
|---|---|---|---|---|
| 1st-order Branch Length (m) | <30 (4) | 38 ± 9 | 21 ± 2 | 0.19 |
| 30–40 (15) | 39 ± 6 | 37 ± 5 | 0.42 | |
| 40–50 (15) | 46 ± 4 | 46 ± 3 | 0.98 | |
| 50–60 (14) | 49 ± 6 | 51 ± 4 | 0.68 | |
| 60–72 (5) | 43 ± 6 | 45 ± 4 | 0.59 |
Disclaimer/Publisher’s Note: The statements, opinions and data contained in all publications are solely those of the individual author(s) and contributor(s) and not of MDPI and/or the editor(s). MDPI and/or the editor(s) disclaim responsibility for any injury to people or property resulting from any ideas, methods, instructions or products referred to in the content. |
© 2025 by the authors. Licensee MDPI, Basel, Switzerland. This article is an open access article distributed under the terms and conditions of the Creative Commons Attribution (CC BY) license (https://creativecommons.org/licenses/by/4.0/).
Share and Cite
Muumbe, T.P.; Baade, J.; Raumonen, P.; Coetsee, C.; Singh, J.; Schmullius, C. Quantifying Tree Structural Change in an African Savanna by Utilizing Multi-Temporal TLS Data. Remote Sens. 2025, 17, 757. https://doi.org/10.3390/rs17050757
Muumbe TP, Baade J, Raumonen P, Coetsee C, Singh J, Schmullius C. Quantifying Tree Structural Change in an African Savanna by Utilizing Multi-Temporal TLS Data. Remote Sensing. 2025; 17(5):757. https://doi.org/10.3390/rs17050757
Chicago/Turabian StyleMuumbe, Tasiyiwa Priscilla, Jussi Baade, Pasi Raumonen, Corli Coetsee, Jenia Singh, and Christiane Schmullius. 2025. "Quantifying Tree Structural Change in an African Savanna by Utilizing Multi-Temporal TLS Data" Remote Sensing 17, no. 5: 757. https://doi.org/10.3390/rs17050757
APA StyleMuumbe, T. P., Baade, J., Raumonen, P., Coetsee, C., Singh, J., & Schmullius, C. (2025). Quantifying Tree Structural Change in an African Savanna by Utilizing Multi-Temporal TLS Data. Remote Sensing, 17(5), 757. https://doi.org/10.3390/rs17050757


