Technical Note

A Physical-Based Semi-Automatic Algorithm for Post-Tropical Cyclone Identification and Tracking in Australia

by
Difei Deng
School of Science, University of New South Wales, Canberra, ACT 2600, Australia
Remote Sens. 2025, 17(3), 539; https://doi.org/10.3390/rs17030539
Submission received: 8 January 2025 / Revised: 30 January 2025 / Accepted: 31 January 2025 / Published: 5 February 2025

Abstract

:
Of all meteorological events, Tropical Cyclones (TCs) are by far the costliest of natural hazards around the globe. They typically lose their strength quite rapidly once making landfall. Recent studies have revealed that TCs, even degrading below TC strength after landfall, can survive for prolonged periods and still exert a significant impact as Post-Tropical Cyclones (PTCs). However, the widely used TC best track datasets, including the International Best Track Archive for Climate Stewardship, do not consistently track TCs for long enough following landfall to include complete PTC tracks. The absence of tracking limits our understanding of the overall TC-related impacts. In this study, we developed a semi-automatic tracking algorithm using satellite imagery and reanalysis data to extend TC tracks beyond the best track dataset until dissipation overland. Based on all landfalling TCs for the period 1990–2020 in Australia, these TCs can be further tracked overland for an additional 1.6 days on average, with a maximum of 15 days, since the last record in best track datasets. Although the intensity of Australian landfalling TCs has declined over the 30 years, they continue to linger over land for similar durations before dissipation, suggesting an increasing likelihood of favorable land conditions for TCs and PTCs.

Graphical Abstract

1. Introduction

Recent studies have indicated that global warming is likely to alter several characteristics of tropical cyclones (TCs). Although the number of TCs is projected to decrease, there is medium to high confidence in projections of increased mean and maximum TC intensities on a global scale under a warmer climate [1,2,3]. Additionally, observations have revealed a poleward and landward shift in the latitude of maximum intensity, as well as a slowing in the forward motion of TCs over recent decades [4,5,6]. These changes are accompanied by an increase in the landfall power dissipation index and a decrease in the decay rate of TCs post-landfall in certain basins [7,8]. It is suggested that the escalating impact of landfalling TCs is not limited to coastal communities but also extends to their post-tropical cyclone stages.
Post-tropical cyclones (PTCs) are former TCs that no longer possess enough tropical qualities and weaken below TC strength. PTCs can amplify the devastating impacts of TCs to regions beyond their typical reach, bringing damaging winds, extreme precipitation winds and prolonged flooding, which are expected to worsen under a warming climate [9]. For affected areas, these impacts are driven by the large volume of precipitation, the expansive size of the storms, and the short time frame in which intense rainfall occurs (e.g., [10]). PTCs include TCs undergoing extratropical transition (ET) into extratropical cyclones, remnant lows with maximum sustained winds of less than 17 m s−1 (34 knots), and other systems lacking frontal characteristics but possessing maximum winds exceeding 17 m s−1. The fraction of TCs undergoing ET is 25% globally, with about 40% of this occurring in the North Atlantic and West Pacific, 20% in the South Indian, and 8% in the South Pacific Ocean [11]. Future projections see stronger interactions between TCs and upstream troughs, a higher storm intensity during ET, transitions with longer durations, and as much as a 30% increase in precipitation within transitioning storms in the North Atlantic basin [12]. Liu et al. [13] further confirm a projected increase in the landfalling ET cyclone rain rate over land under anthropogenic warming, particularly for the eastern United States. In response to increased CO2, a greater ET fraction is expected globally, although the weakening of the rising branch of the Hadley Cell during summer can be attributed to the decrease in TC frequency [11,14]. These ET systems tend to be stronger than their mid-latitude counterparts and are particularly important for mid–high latitudes, such as Europe, during the hurricane season [9]. Other than the changes in ET, other types of PTCs may also inherit the escalating impacts of their former TCs on broader tropical and extratropical regions in the warming future. For example, TC Kelvin (2018) caused wind damage on the Pilbara coast following landfall in Western Australia, but a rain swath associated with its PTC cut the east–west highway and railway and bought floods as far as southern New South Wales [15]. However, their overall spatial–temporal change, particularly regarding newly affected regions and whether rainfall extends further poleward and inland, remains unclear. Future research efforts should further investigate this late phase of the storm life cycle [16].
In Australia, although only five TCs make landfall each year on average, it is one of the highest incidences of TC-related impact in the world [17]. Overland TC rainfall accounts for up to 40% of total rainfall on the west coast, and lower but still significant amounts occur over northern and eastern regions during each TC season [17,18]. Most studies use best track data provided by the Australian Bureau of Meteorology (BoM) or the International Best Track Archive for Climate Stewardship (IBTrACS). However, the inconsistent use of operational procedures and criteria for determining the cessation of TC tracking introduces significant uncertainties in studying the late phases of TCs (e.g., [9,18]). To address this issue, Ng et al. [19] extended TC tracks by extrapolating them for a further three days after the last recorded IBTrACS position. To include the PTCs, Bower et al. [20] utilized the ExTraTrack algorithm to extend IBTrACS until the pressure of the system rises above 1020 hPa or 14 days after ET occurs but exclude those systems with the elevated surface topography.
In this study, we propose a relatively objective method to track post-landfall TCs beyond their last recorded positions in the IBTrACS or BoM best track datasets until dissipation. Since automatically locating the center of PTCs over inland regions is challenging, especially when the weak systems split into several centers, the proposed method combines automatic tracking with manual correction, called the semi-automatic algorithm, to identify and track PTC centers. For the following sections, a description of the data and methods of analysis are included in Section 2. Section 3 describes the results found using the methodology for all landfalling TCs in Australia from 1990 to 2020. Section 4 and Section 5 include the discussion and conclusions.

2. Data and Methods

2.1. Observations and Reanalysis

Both the IBTrACS [21] and BoM best track datasets, which contain observations of TCs in Australia, are used to identify all Australian landfalling TC locations between 1990 and 2020. Infrared (IR) water vapor channel (near 6.7 μm) satellite imagery from the Gridded Satellite (GridSat-B1) data (0.07° × 0.07° every three hours) at the National Climate Data Center (NCDC), along with geopotential and vorticity fields from an ERA5 reanalysis (fifth major global reanalysis produced by ECMWF) of pressure levels from 1990 to 2020, are utilized to examine whether the full lifecycle of TCs, including the late stages until dissipation, is captured by the available best track datasets and then to track the system and determine whether an extension is required.
The Southern Hemisphere TC season is defined as the period from 1 July of one year to the last day of the last TC up to 30 June in the following year, in the Southern Hemisphere. For convenience, each season is labelled using the first of the two relevant calendar years; for example, the season covering the period July 1990 to June 1991 is referred to as season 1990/91.

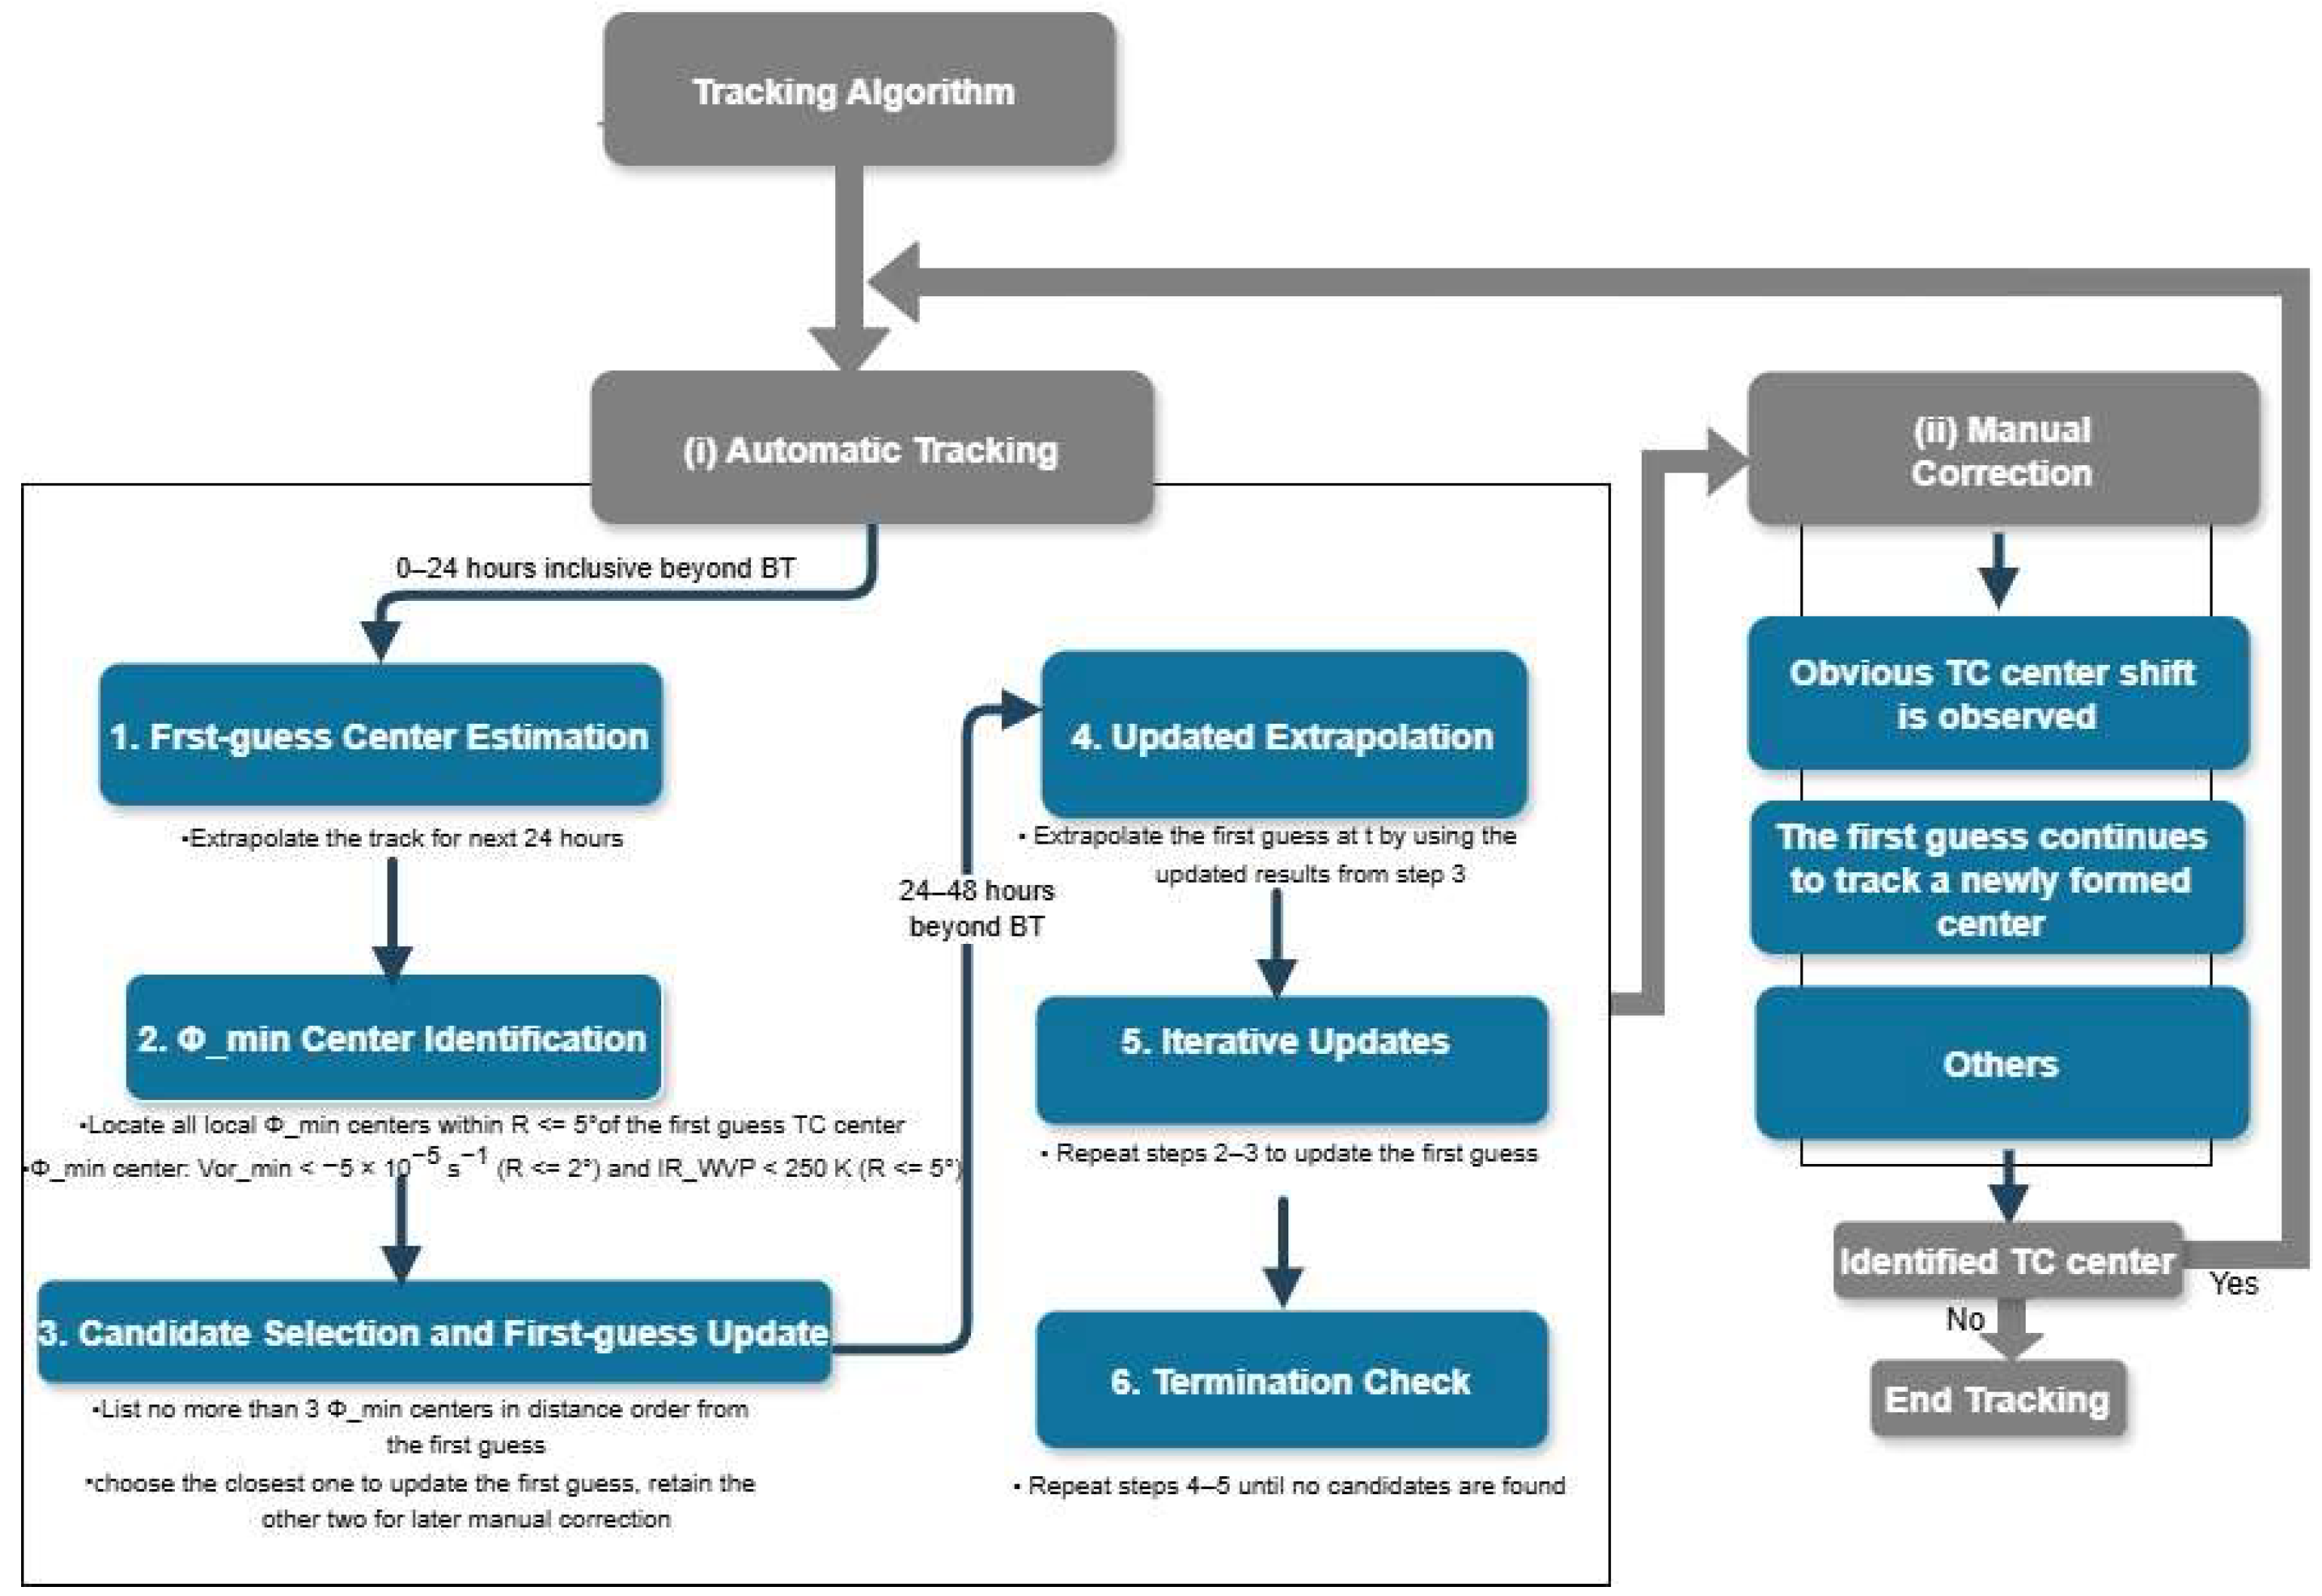
2.2. PTC Track Detection and Tracking Algorithm

To extend the existing TC tracks to analyze the complete life cycle of landfalling TCs in Australia, we first analyze two widely used TC best track datasets for Australian regions, including IBTrACS and the BoM best track dataset. As shown in Figure 1a, the final records for post-landfall TCs exhibit varied wind speeds. More than 50% of the post-landfall TC records stop when the systems no longer have maximum wind records (e.g., when they are too weak or the maximum surface wind over land cannot be resolved). Some records stop when the maximum wind speed drops below 17 m s−1, while others continue even when winds remain above this threshold. These records vary among tropical systems, extratropical systems, and unreported cases (Figure omitted). As also discussed in [19,20], inconsistencies in ending TC tracks within these best track datasets, coupled with their partial inclusion of PTC tracks, significantly limit our understanding of the full life cycle of their post-landfall impacts. To address this issue, we propose a new PTC track detection algorithm to identify and extend TC tracks to include their late phases until dissipation after landfall.
Since IBTrACS provides the most extensive and longest TC positional records compiled from various agencies (see Figure 1b), and because the BoM best track dataset is prioritized for detailed information on Australian overland TCs, we integrated these two datasets to maximize them. First, we matched all landfalling TCs in the BoM best track dataset with IBTrACS over Australia, which yields 131 matched TCs and another 12 unmatched landfalling TCs only available in IBTrACS from 1990/91 to 2019/20. Therefore, it is composed of 143 landfalling TCs in total in Australia. Then, we simply extend the BoM TC tracks by adding the additional track sections only archived in IBTrACS to make full use of both available datasets. The dataset that is generated by combining the BoM best track dataset with the IBTrACS additional track locations is referred to as “the merged best track dataset” (e.g., the green solid line in Figure 2a). Following that, using IR water vapor channel (near 6.7 μm) satellite imagery from the GridSat-B1 data obtained at the NCDC and the geopotential and vorticity fields from ERA5, an additional dataset is then developed by further extending the landfalling TC tracks beyond the merged best track dataset (BT), if extension is required. All candidate remnants are tracked every 3 h until they are no longer identifiable in the reanalysis fields and satellite imagery (e.g., the blue dashed line in Figure 2a).
The track-extending algorithm combines automatic tracking with manual checking to extend the tracks of landfalling TCs in Australia for every 48 h window beyond the last record in the BT dataset. The detailed workflow is summarized in Figure 3 and described below.
(i) 
Automatic Tracking (for each 3-h time step)
Day 1 (0–24 h beyond the last BT record, inclusive):
(1)
First-guess center estimation:
  • Extrapolate the TC track for 24 h to identify a first-guess TC center.
(2)
Geopotential Minimum Identification:
  • Locate all local geopotential minimum centers within a 5° radius of the first-guess TC center.
  • Filter candidates based on two thresholds: (a) the vorticity minimum value must be less than −5 × 10⁻⁵ s−1 and within a 2° radius of the geopotential minimum center; and (b) the IR water vapor value within a 5° radius of the geopotential minimum must be less than 230 K.
(3)
Candidate Selection and First-guess Update:
  • Identify and list up to three local geopotential minimum centers (candidates) ranked by their distance to the first-guess center.
  • Update the first-guess TC center with the closest candidate and save the remaining two for potential manual correction.
Day 2 (24–48 h beyond the last BT record):
(4)
Updated Extrapolation:
  • Extrapolate the first-guess TC center (t) using the updated position from step (3) for the previous 6 h period.
(5)
Iterative Updates:
  • Repeat steps (2)–(3) to update the first-guess TC center at time(t) for each 3 h time step and save the remaining two candidates.
(6)
Termination Check:
  • Continue the steps (4)–(5) for up to 48 h beyond the last BT record or terminate early if no valid candidates are identified.
(ii) 
Manual correction
While the automatic algorithm works for most cases, manual correction is applied because of the complexity of the TC circulation over land in the following scenarios.
  • Center Adjustment:
    • Review and correct the first-guess center when an obvious TC center shift is observed.
  • Termination of Tracking:
    • Stop tracking when the first-guess TC center continues to track a newly formed center instead of the original TC system.
  • Others:
    • If some other special cases are found.
Iterative 48 h Extensions:
Repeat the above steps (automatic tracking and manual correction) for subsequent 48 h windows until the TC track is fully extended, or the system dissipates.

3. Results

We apply the above algorithm to all 143 landfalling TCs over the Australian region from the 1990/91 to 2019/20 TC seasons and obtain the extended PTC track dataset (referred as EPT) and the complete tracks (CT), which include the merged best track dataset (BT) and EPT to cover the full TC lifecycle. Using the generated dataset, we first compare BT and CT. As shown in Figure 4, these post-landfall TC occurrences using BT are largely confined to within 1000 km of the coastline (Figure 4a), which has been analyzed in previous TC studies. However, these post-landfall TCs can have an influence further inland and affect the majority of the mainland if they continue to be tracked until dissipation (Figure 4b). The extensions are distributed both near the coast and further inland, and are mainly located in Western Australia, northern Australia and parts of Queensland, from the coast inland (Figure 4c). As the project focuses on the Australian continent rather than over the ocean, TC remnants or PTCs that move more than 500 km away from the Australian continent are not included in this study.
Based on our algorithm, not all landfalling TCs can be further tracked over land. As shown in Figure 5a, 69.2% of post-landfall TCs can be further tracked beyond the available BT while moving over land. The track lengths in the EPT vary in time, with a maximum of 15 days, and can be further tracked over land for another 1.6 days on average compared to the BT. Half of the post-landfall TCs move more than 1000–1500 km inland from the coast, but only one third (34.8%) of these are captured if only the available TC BT archives are used (Figure 5b). It is indicated that the partial exclusion of these PTCs in the TC best track dataset significantly restricts our understanding of the overall impact of TCs and their remnants, especially the possibility of TCs and PTCs surviving a prolonged period beyond the tropics or subtropics in the possible warming future.
Over the 30 years studied, the overland duration from TC landfall to the last record in the BT shows no obvious trend over time, with an average of 2.5 days, nor can a significant trend be identified from landfall to dissipation using the CT, with an average of 4 days over land (Figure 6a). In addition, little trend can be seen in the overland moving speed for these landfalling systems, despite being slightly faster in the CT after including PTCs (Figure 6b). Due to enhanced ocean surface warming, some studies have indicated that TCs tend to make landfall with a much stronger intensity, as evidenced in most basins globally [22,23]. However, the landfall intensity of TCs in Australia has decreased significantly with time in the last 30 years, at a rate of −3.74 m s−1 per decade (Figure 6c). Similar results were found in [24], in which, rather than an increasing trend being seen, as widely observed in the global average, a downward trend in the lifetime maximum intensity was observed for both southern Indian Ocean and southern Pacific Ocean major landfalling TCs (with the lowest maximum intensity being at least 50 m s−1), though the cause remains undetermined. Our results highlight that, even though the intensity of Australian landfalling TCs has decreased over the past 30 years, no significant change in overland duration has been found for these post-landfall TCs, and they are still able to survive and linger over land for similar durations before dissipating, suggesting that increasingly favorable overland conditions might be supporting TCs and PTCs; this will be explored in detail in our following paper.

4. Discussion

Many previous studies have examined TC activities over Australian regions in detail using the best track data provided by the BoM or the IBTrACS. However, because of the limitations of available best track datasets, most studies focus only on TCs with wind speeds above 17 m s−1 and/or within 500 km of TC landfall (e.g., [17,25]). By using the proposed landfalling TC track-extending algorithm and CT dataset in this study, we can expand the previous studies to include more regions over land. This allows us to comprehensively evaluate whether a warming climate increases the duration of TCs overland, using longer datasets; this is a topic that has not yet been fully explored. This algorithm provides critical insights for disaster management in inland areas by enhancing preparedness and response strategies for tracking weaker yet potentially impactful systems. It enables earlier, more targeted warnings and identifies high-risk zones with vulnerable infrastructure. Additionally, it could support long-term resilience planning and, when paired with communication tools, ensure that affected populations are better informed and prepared.
There are some limitations to the proposed method. First, due to the complexity of locating TC or PTC centers over land, manual corrections are applied in some cases to identify if there are any noticeable TC or PTC center shifts and determine whether tracking should be terminated. It is time-consuming to apply this method to broader global regions and longer time periods. Therefore, in our next step, based on the generated CT and EPT datasets, we will explore an automatic tracking method and test the possibility of using machine learning techniques, such as the generative adversarial network (GAN), to perform TC and PTC tracking over land. Moreover, this paper focuses on introducing the algorithm and less emphasis is placed on data analysis. Looking forward, we plan to utilize the generated CT dataset to gain deeper insights into the impact of precipitation caused by post-landfall TCs (see the case of TC Helen in Figure S1). This will include the exploration of potential new PTC-prone areas and the identification of previously less vulnerable overland regions that may face increased risks.

5. Conclusions

Recent studies have revealed that TCs, even degrading below TC strength after landfall, can survive for prolonged periods and still exert a significant impact [26]. However, the widely used historical TC best track datasets, including IBTrACS, do not consistently track TCs for long enough after they cease to be defined as TCs to include the last phase of the TC’s lifecycle. The absence of complete tracks of TCs and PTCs limits our understanding of the complete impacts of post-landfall TCs. To address the research gap, we develop a semi-automatic tracking algorithm by using satellite imagery and reanalysis data to extend their tracks beyond the best track dataset until dissipation overland, without specifying a fixed duration for TC extension, as is performed in other studies. By applying this method to all landfalling TCs in Australia during the period 1990–2020, we obtained the following results:
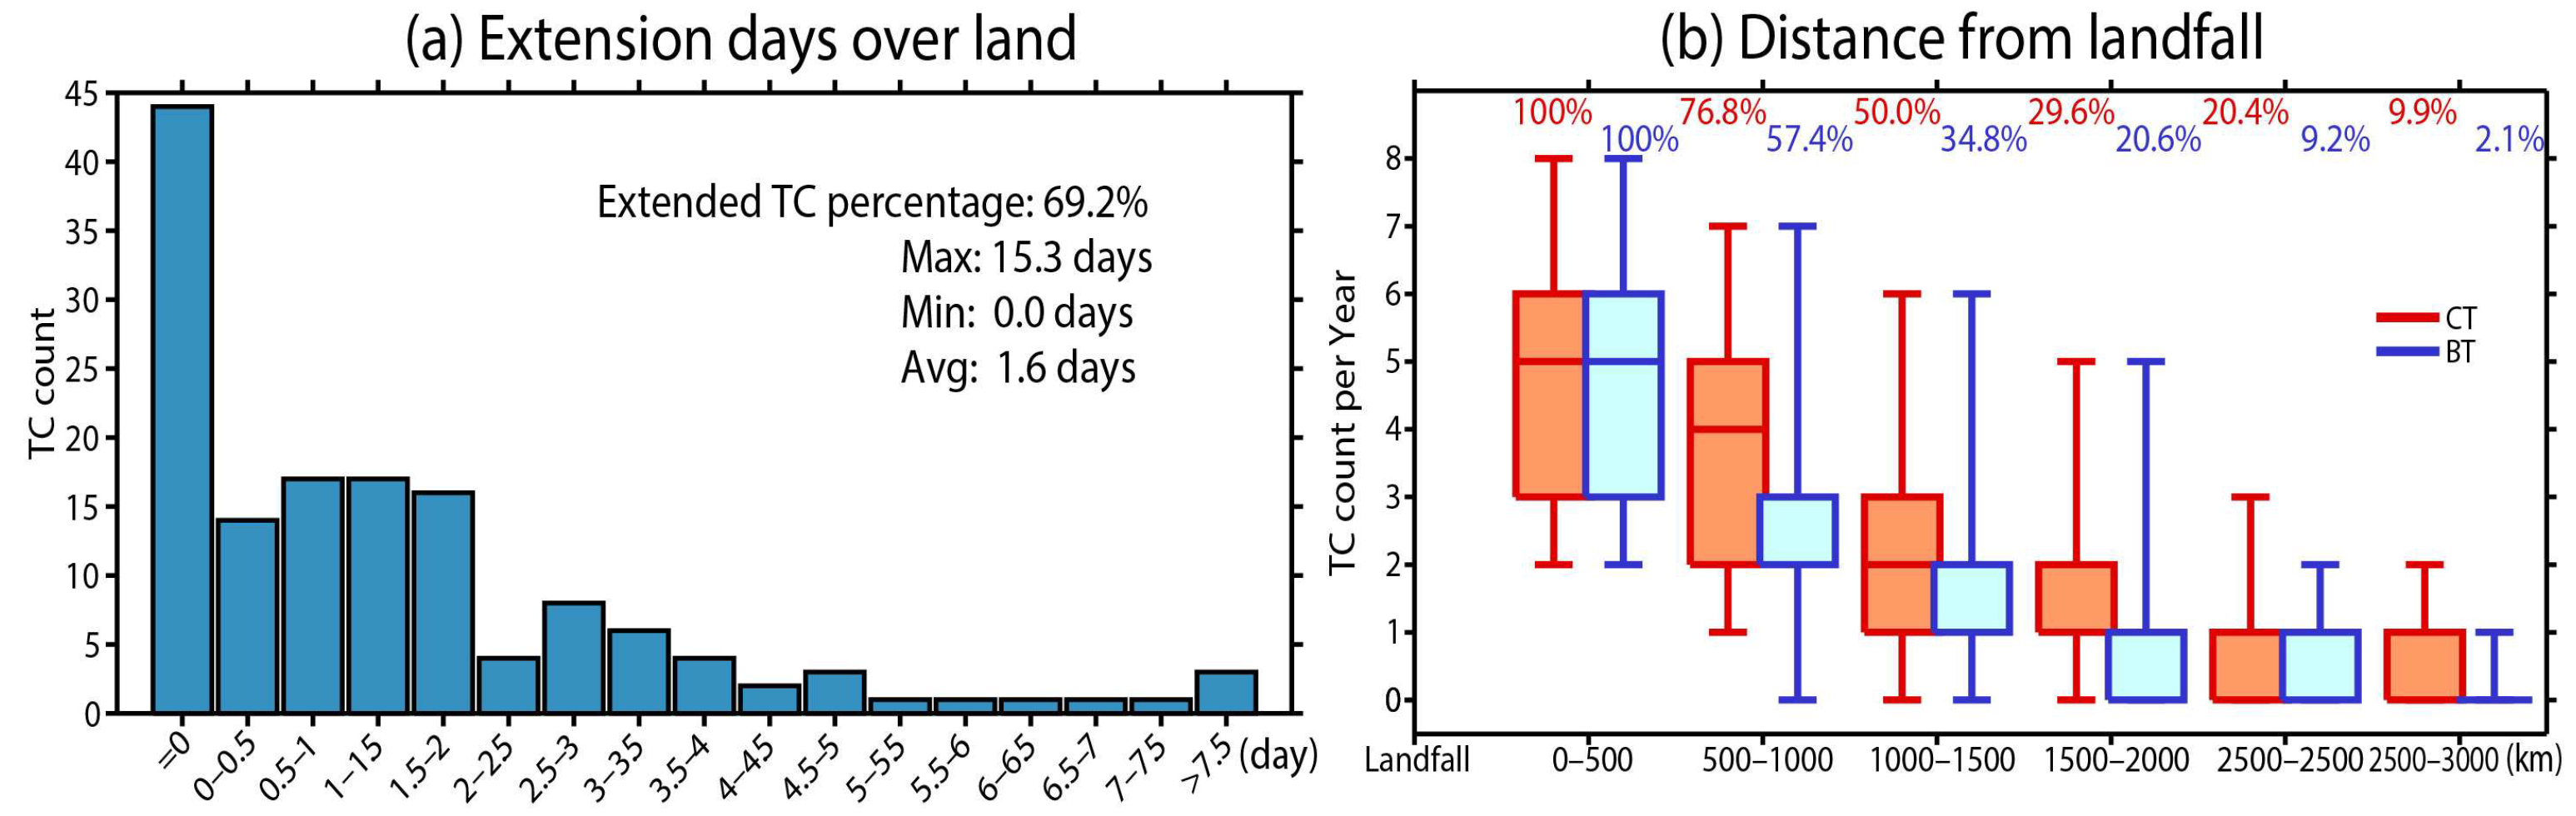
  • Around two thirds of landfalling TCs can be further tracked overland to include their associated PTCs before dissipation, with an additional 1.6 days on average and a maximum of 15 days beyond the last record in IBTrACS.
  • Half of post-landfall TCs move more than 1000–1500 km inland from the coast, but only one third of these systems are captured if only the available TC best track archives are used.
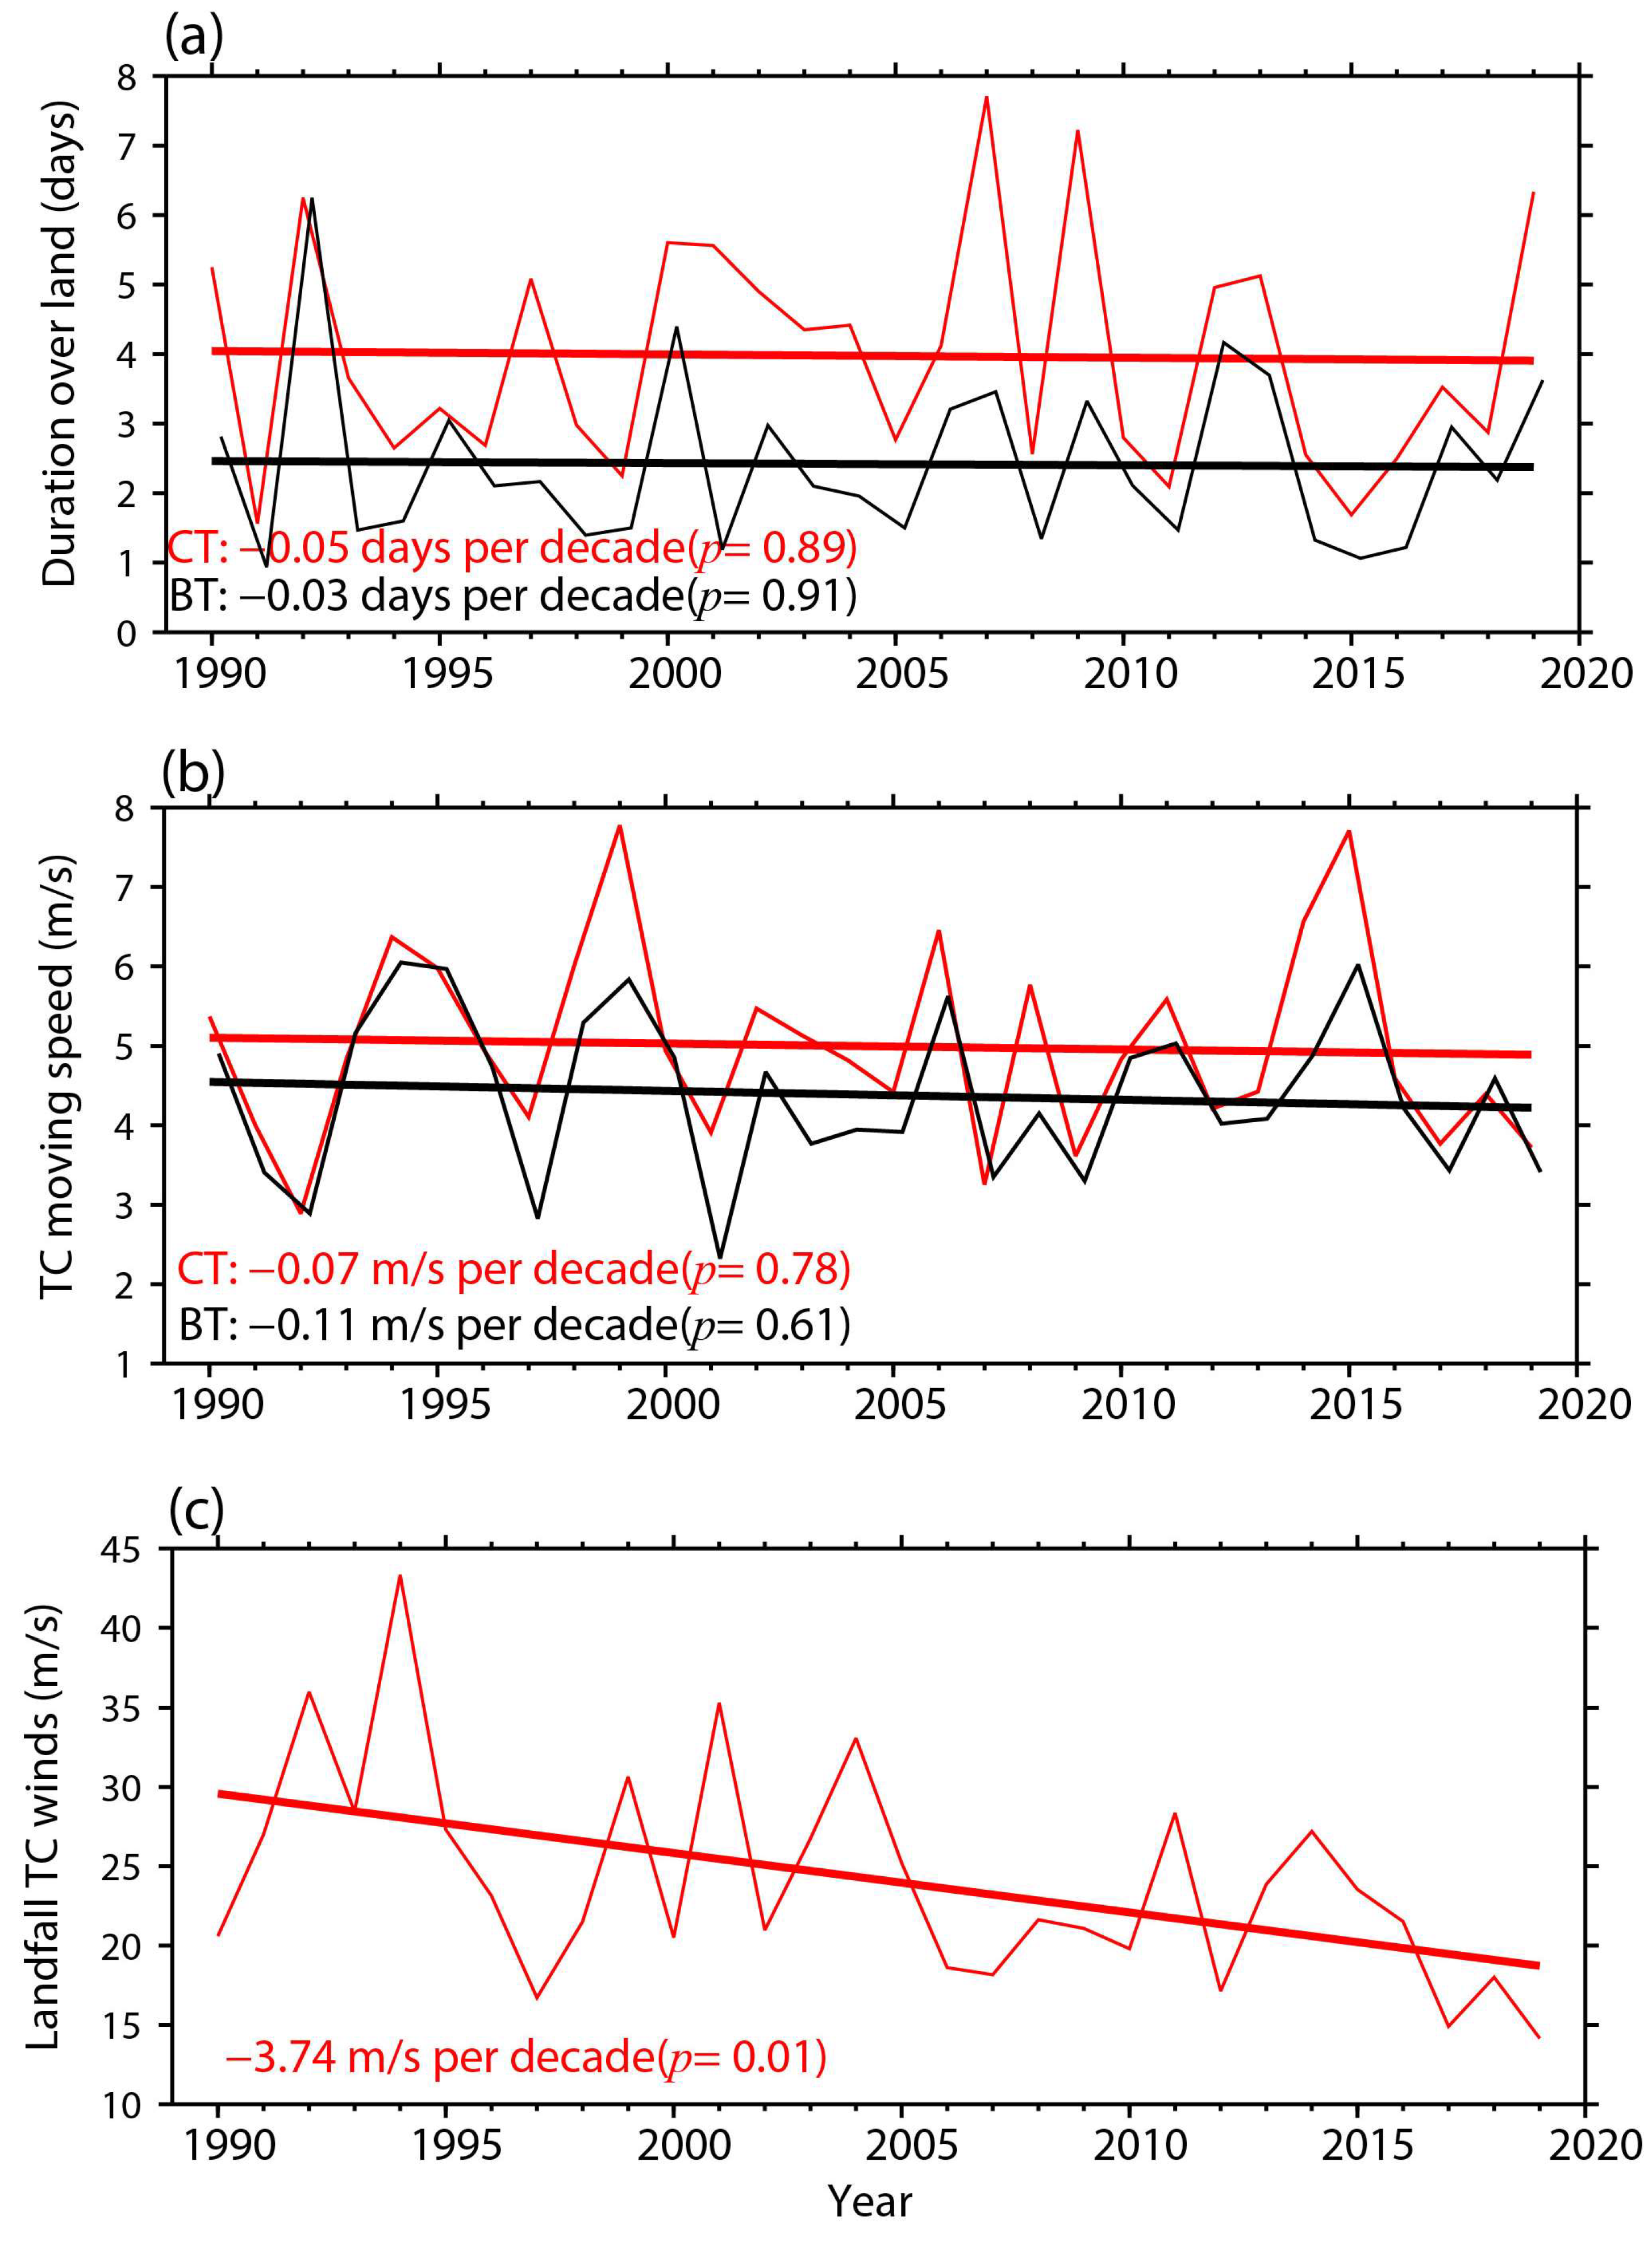
  • Even though the intensity of Australian landfalling TCs has decreased over the past 30 years, no significant change in overland duration has been found for these post-landfall TCs, indicating they have been able to survive and linger over land for similar periods before dissipating in the past 30 years.
  • The research underscores the importance of continuing to track these weak yet still impactful PTCs following landfall to better understand the impact of post-landfall TCs under current and future warming scenarios.

Supplementary Materials

The following supporting information can be downloaded at: https://www.mdpi.com/article/10.3390/rs17030539/s1, Figure S1: Track of TC Helen (2007) (black solid line) and its extended PTC track (black dashed line) using the proposed methods, along with observed rainfall (shading, unit: mm).

Funding

The research was supported by the Australian Research Council (ARC) funded Discovery Early Career Researcher Award project, grant number DE200101435.

Data Availability Statement

This paper uses IBTrACS data available at https://www.ncei.noaa.gov/products/international-best-track-archive (accessed on 24 August 2020) and BoM best-track data of Australian TCs available at http://www.bom.gov.au/cyclone/tropical-cyclone-knowledge-centre/databases/ (accessed on 16 August 2020). Satellite imagery from the GridSat-B1 data from the NCDC are available at https://www.ncdc.noaa.gov/gridsat/ (accessed on 24 August 2020). Other datasets are available in the National Computational Infrastructure data catalogue (identifiers are https://doi.org/10.25914/5fb115b82e2ba (accessed on 24 August 2020) for ERA5 reanalysis). Code for data decoding, cleaning, and analysis associated with the current research was created using standard scientific programming packages. A copy of the scripts for python and IDL users and generated CT dataset are available from the corresponding author upon reasonable request.

Acknowledgments

This research was undertaken with the assistance of resources and services from the National Computational Infrastructure (NCI), which is supported by the Australian Government.

Conflicts of Interest

The author declares no conflicts of interest.

Abbreviations

The following abbreviations are used in this manuscript:
TCsTropical Cyclones
PTCsPost-Tropical Cyclones
BoMBureau of Meteorology
IBTrACSInternational Best Track Archive for Climate Stewardship
BTMerged best track
EPTExtended PTC track
CTComplete track

References

  1. Kossin, J.P.; Olander, T.L.; Knapp, K.R. Trend analysis with a new global record of tropical cyclone intensity. J. Clim. 2013, 26, 9960–9976. [Google Scholar] [CrossRef]
  2. Sobel, A.H.; Camargo, S.J.; Emanuel, K.A.; Vecchi, G.A.; Knutson, T.R. Human influence on tropical cyclone intensity. Science 2016, 353, 242–246. [Google Scholar] [CrossRef] [PubMed]
  3. Bhatia, K.; Vecchi, G.; Murakami, H.; Underwood, S.; Kossin, J. Projected response of tropical cyclone intensity and intensification in a global climate model. J. Clim. 2018, 31, 8281–8303. [Google Scholar] [CrossRef]
  4. Kossin, J.P.; Emanuel, K.A.; Vecchi, G.A. The poleward migration of the location of tropical cyclone maximum intensity. Nature 2014, 509, 349–352. [Google Scholar] [CrossRef]
  5. Wang, S.; Toumi, R. Recent migration of tropical cyclones toward coasts. Science 2021, 371, 514–517. [Google Scholar] [CrossRef]
  6. Kossin, J.P. A global slowdown of tropical cyclone translation speed. Nature 2018, 558, 104–108. [Google Scholar] [CrossRef]
  7. Emanuel, K. Response of global tropical cyclone activity to increasing CO2: Results from downscaling CMIP6 models. J. Clim. 2021, 34, 57–70. [Google Scholar] [CrossRef]
  8. Li, L.; Chakraborty, P. Slower decay of landfalling hurricanes in a warming world. Nature 2020, 587, 230–234. [Google Scholar] [CrossRef]
  9. Sainsbury, E.M.; Schiemann, R.K.; Hodges, K.I.; Shaffrey, L.C.; Baker, A.J.; Bhatia, K.T. How important are post-tropical cyclones for European windstorm risk? Geophys. Res. Lett. 2020, 47, e2020GL089853. [Google Scholar] [CrossRef]
  10. Schumacher, R.S.; Johnson, R.H. Characteristics of US extreme rain events during 1999–2003. Weather Forecast. 2006, 21, 69–85. [Google Scholar] [CrossRef]
  11. Cheung, H.M.; Chu, J.E. Global increase in destructive potential of extratropical transition events in response to greenhouse warming. npj Clim. Atmos. Sci. 2023, 6, 137. [Google Scholar] [CrossRef]
  12. Michaelis, A. Climate Change Effects on the Extratropical Transition of Tropical Cyclones in High-Resolution Global Simulations. Ph.D. Dissertation, North Carolina State University Libraries, Raleigh, NC, USA, 2016; p. 156. Available online: http://www.lib.ncsu.edu/resolver/1840.20/36292 (accessed on 15 December 2024).
  13. Liu, M.; Vecchi, G.; Smith, J.A.; Murakami, H. The present-day simulation and twenty-first-century projection of the climatology of extratropical transition in the North Atlantic. J. Clim. 2017, 30, 2739–2756. [Google Scholar] [CrossRef]
  14. Chu, J.E.; Vecchi, G.; Murakami, H.; Emanuel, K. Reduced tropical cyclone densities and ocean effects due to anthropogenic greenhouse warming. Sci. Adv. 2020, 6, eabd5109. [Google Scholar] [CrossRef] [PubMed]
  15. Deng, D.; Ritchie, E.A. An unusual extreme rainfall event in Canberra Australia on February 2018. J. Geophys. Res. Atmos. 2019, 124, 4429–4445. [Google Scholar] [CrossRef]
  16. Wood, K.; Yanase, W.; Beven, J.; Camargo, S.J.; Courtney, J.B.; Fogarty, C.; Riboldi, J. Phase transitions between tropical, subtropical, and extratropical cyclones: A review from IWTC-10. Trop. Cyclone Res. Rev. 2023, 12, 294–308. [Google Scholar] [CrossRef]
  17. Khouakhi, A.; Villarini, G.; Vecchi, G.A. Contribution of tropical cyclones to rainfall at the global scale. J. Clim. 2017, 30, 359–372. [Google Scholar] [CrossRef]
  18. Dare, R.A.; Davidson, N.E.; McBride, J.L. Tropical cyclone contribution to rainfall over Australia. Mon. Weather Rev. 2012, 140, 3606–3619. [Google Scholar] [CrossRef]
  19. Ng, B.; Walsh, K.; Lavender, S. The contribution of tropical cyclones to rainfall in northwest Australia. Int. J. Climatol. 2014, 35, 2689–2697. [Google Scholar] [CrossRef]
  20. Bower, E.; Reed, K.A.; Ullrich, P.A.; Zarzycki, C.M.; Pendergrass, A.G. Quantifying heavy precipitation throughout the entire tropical cyclone life cycle. J. Hydrometeorol. 2022, 23, 1645–1662. [Google Scholar] [CrossRef]
  21. Knapp, K.R.; Kruk, M.C.; Levinson, D.H.; Diamond, H.J.; Neumann, C.J. The International Best Track Archive for Climate Stewardship (IBTrACS): Unifying tropical cyclone data. Bull. Am. Meteorol. Soc. 2010, 91, 363–376. [Google Scholar] [CrossRef]
  22. Mei, W.; Xie, S.P. Intensification of landfalling typhoons over the northwest Pacific since the late 1970s. Nat. Geosci. 2016, 9, 753–757. [Google Scholar] [CrossRef]
  23. Knutson, T.; Camargo, S.J.; Chan, J.C.; Emanuel, K.; Ho, C.H.; Kossin, J.; Wu, L. Tropical cyclones and climate change assessment: Part II: Projected response to anthropogenic warming. Bull. Am. Meteorol. Soc. 2020, 101, E303–E322. [Google Scholar] [CrossRef]
  24. Wang, S.; Toumi, R. More tropical cyclones are striking coasts with major intensities at landfall. Sci. Rep. 2022, 12, 5236. [Google Scholar] [CrossRef] [PubMed]
  25. Dare, R.A.; Davidson, N.E. Characteristics of tropical cyclones in the Australian region. Mon. Weather Rev. 2004, 132, 3049–3065. [Google Scholar] [CrossRef]
  26. Deng, D.; Dare, R.; Davidson, N.E. Tropical cyclone rainfall enhancement following landfalling over Australia. In Proceedings of the Australian Meteorological and Oceanographic Society Annual Conference, Canberra, Australia, 5–9 February 2024. [Google Scholar]
Figure 1. (a) PDF distribution of maximum wind speed intensity in the last available records for Australian landfalling TCs, and (b) the difference in tracking time between IBTrACS and the BoM best track dataset from 1990/91 to 2019/20. The golden bars indicate that IBTrACS begins tracking TCs earlier, while the blue bars show that IBTrACS ends tracking later than the BoM best track datasets.
Remotesensing 17 00539 g001
Figure 2. (a) Track of TC Winsome (2001): the solid red line is the BoM best track, the green line is IBTrACS, the section between the two black stars is the merged best track, and the blue dashed line is the complete TC track; (b) the remnant of TC Winsome (2001) IR imagery (grey shading), 700-hPa geopotential (golden contours) and vorticity (blue contours) and TRMM rainfall (shading) at 1500 UTC 14 February 2001 since best track stop record: ‘+’ is the first-guess TC center at 1500 UTC, ‘’ is the updated first-guess TC center, ‘🢐’ and ‘🢒’ indicate the other two candidates.
Remotesensing 17 00539 g002
Figure 3. Flowchart of the track-extending algorithm.
Remotesensing 17 00539 g003
Figure 4. Track density maps (1° × 1° resolution) using (a) the merged best track dataset (BT), (b) the complete track dataset (CT) and (c) extended post-TC track dataset (EPT).
Remotesensing 17 00539 g004
Figure 5. (a) PDF distribution of the extension time (days) of landfalling TCs and their remnants over land and (b) the TC counts per year as a function of distance (km) from landfall, in which the percentages at the top of the panel indicate the number relative to the landfall TC count.
Remotesensing 17 00539 g005
Figure 6. Trends in (a) overland duration, (b) moving speed using BT (black) and CT dataset (red), and (c) landfalling TC intensity based on the maximum wind speed (including only those TCs that remained over land for longer than 6 h after landfall to exclude systems skirting the islands and coastlines of Australia). Statistical tests are two-sided.
Remotesensing 17 00539 g006
Disclaimer/Publisher’s Note: The statements, opinions and data contained in all publications are solely those of the individual author(s) and contributor(s) and not of MDPI and/or the editor(s). MDPI and/or the editor(s) disclaim responsibility for any injury to people or property resulting from any ideas, methods, instructions or products referred to in the content.

