
Improving the Accuracy of Forest Structure Analysis by Consumer-Grade UAV Photogrammetry Through an Innovative Approach to Mitigate Lens Distortion Effects


Abstract
1. Introduction
2. Theoretical Background
3. Implementation
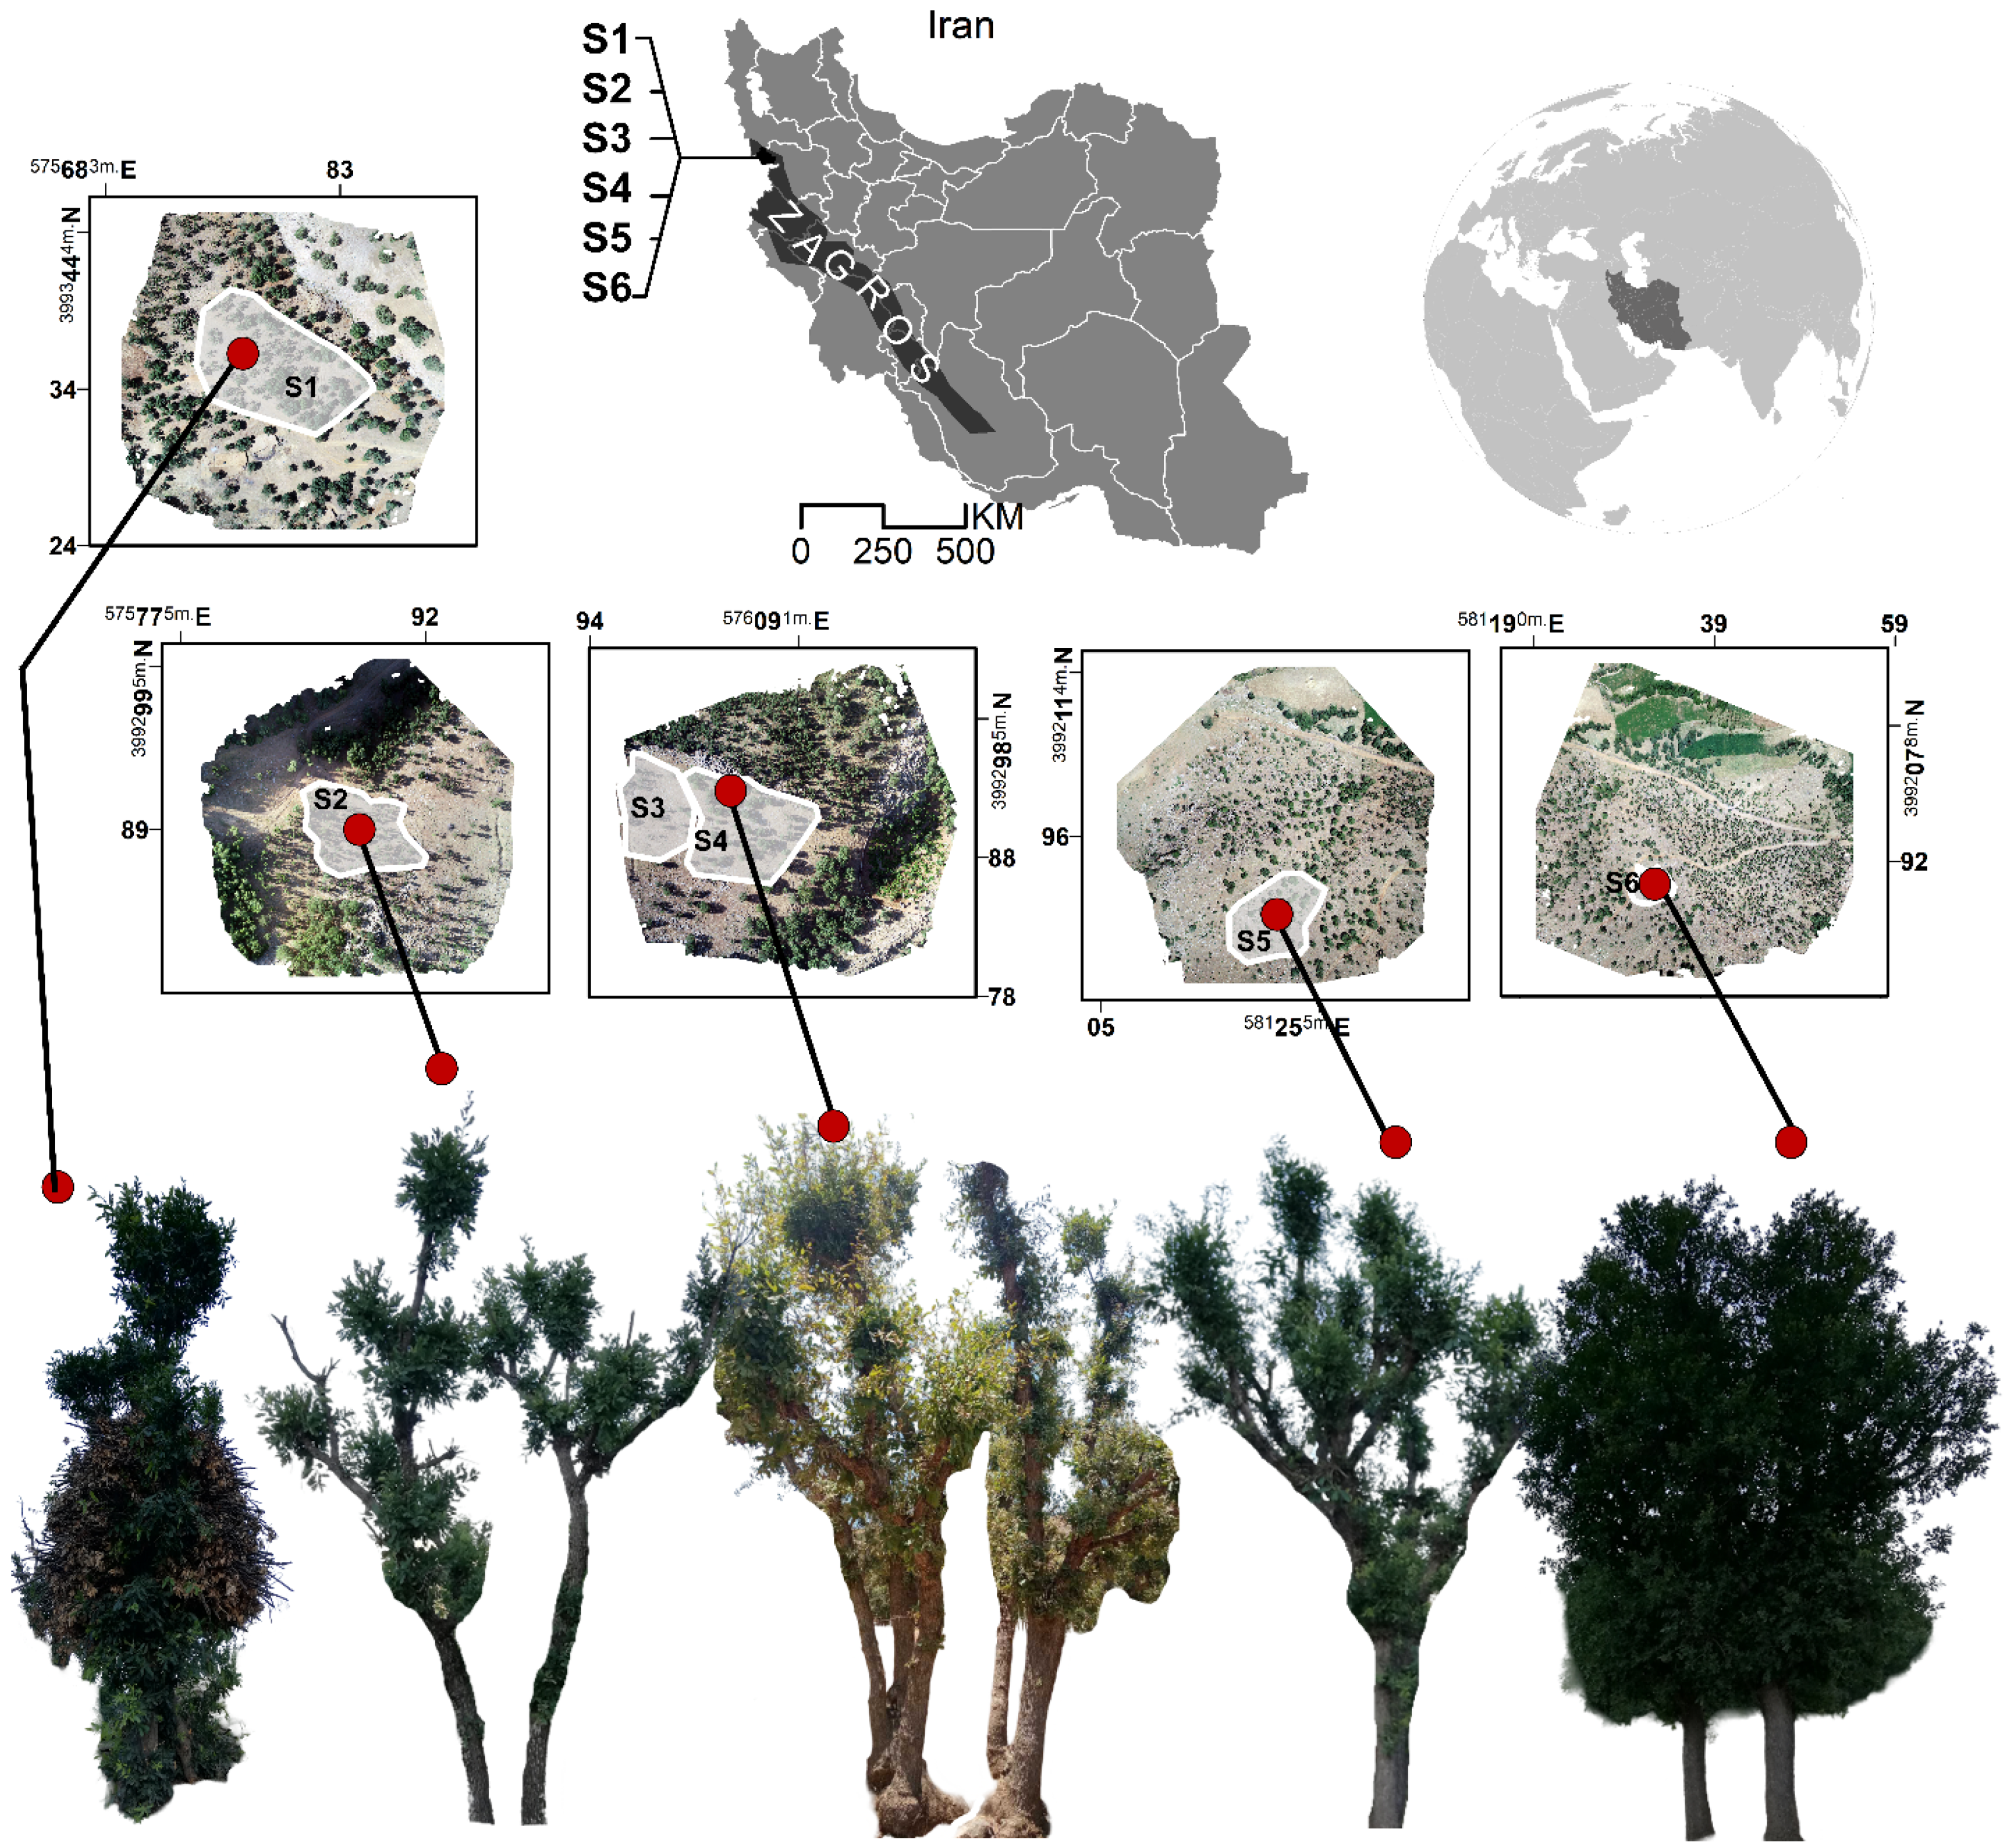
3.1. Study Area
3.2. Materials
3.2.1. UAV Imagery
3.2.2. Reference Data
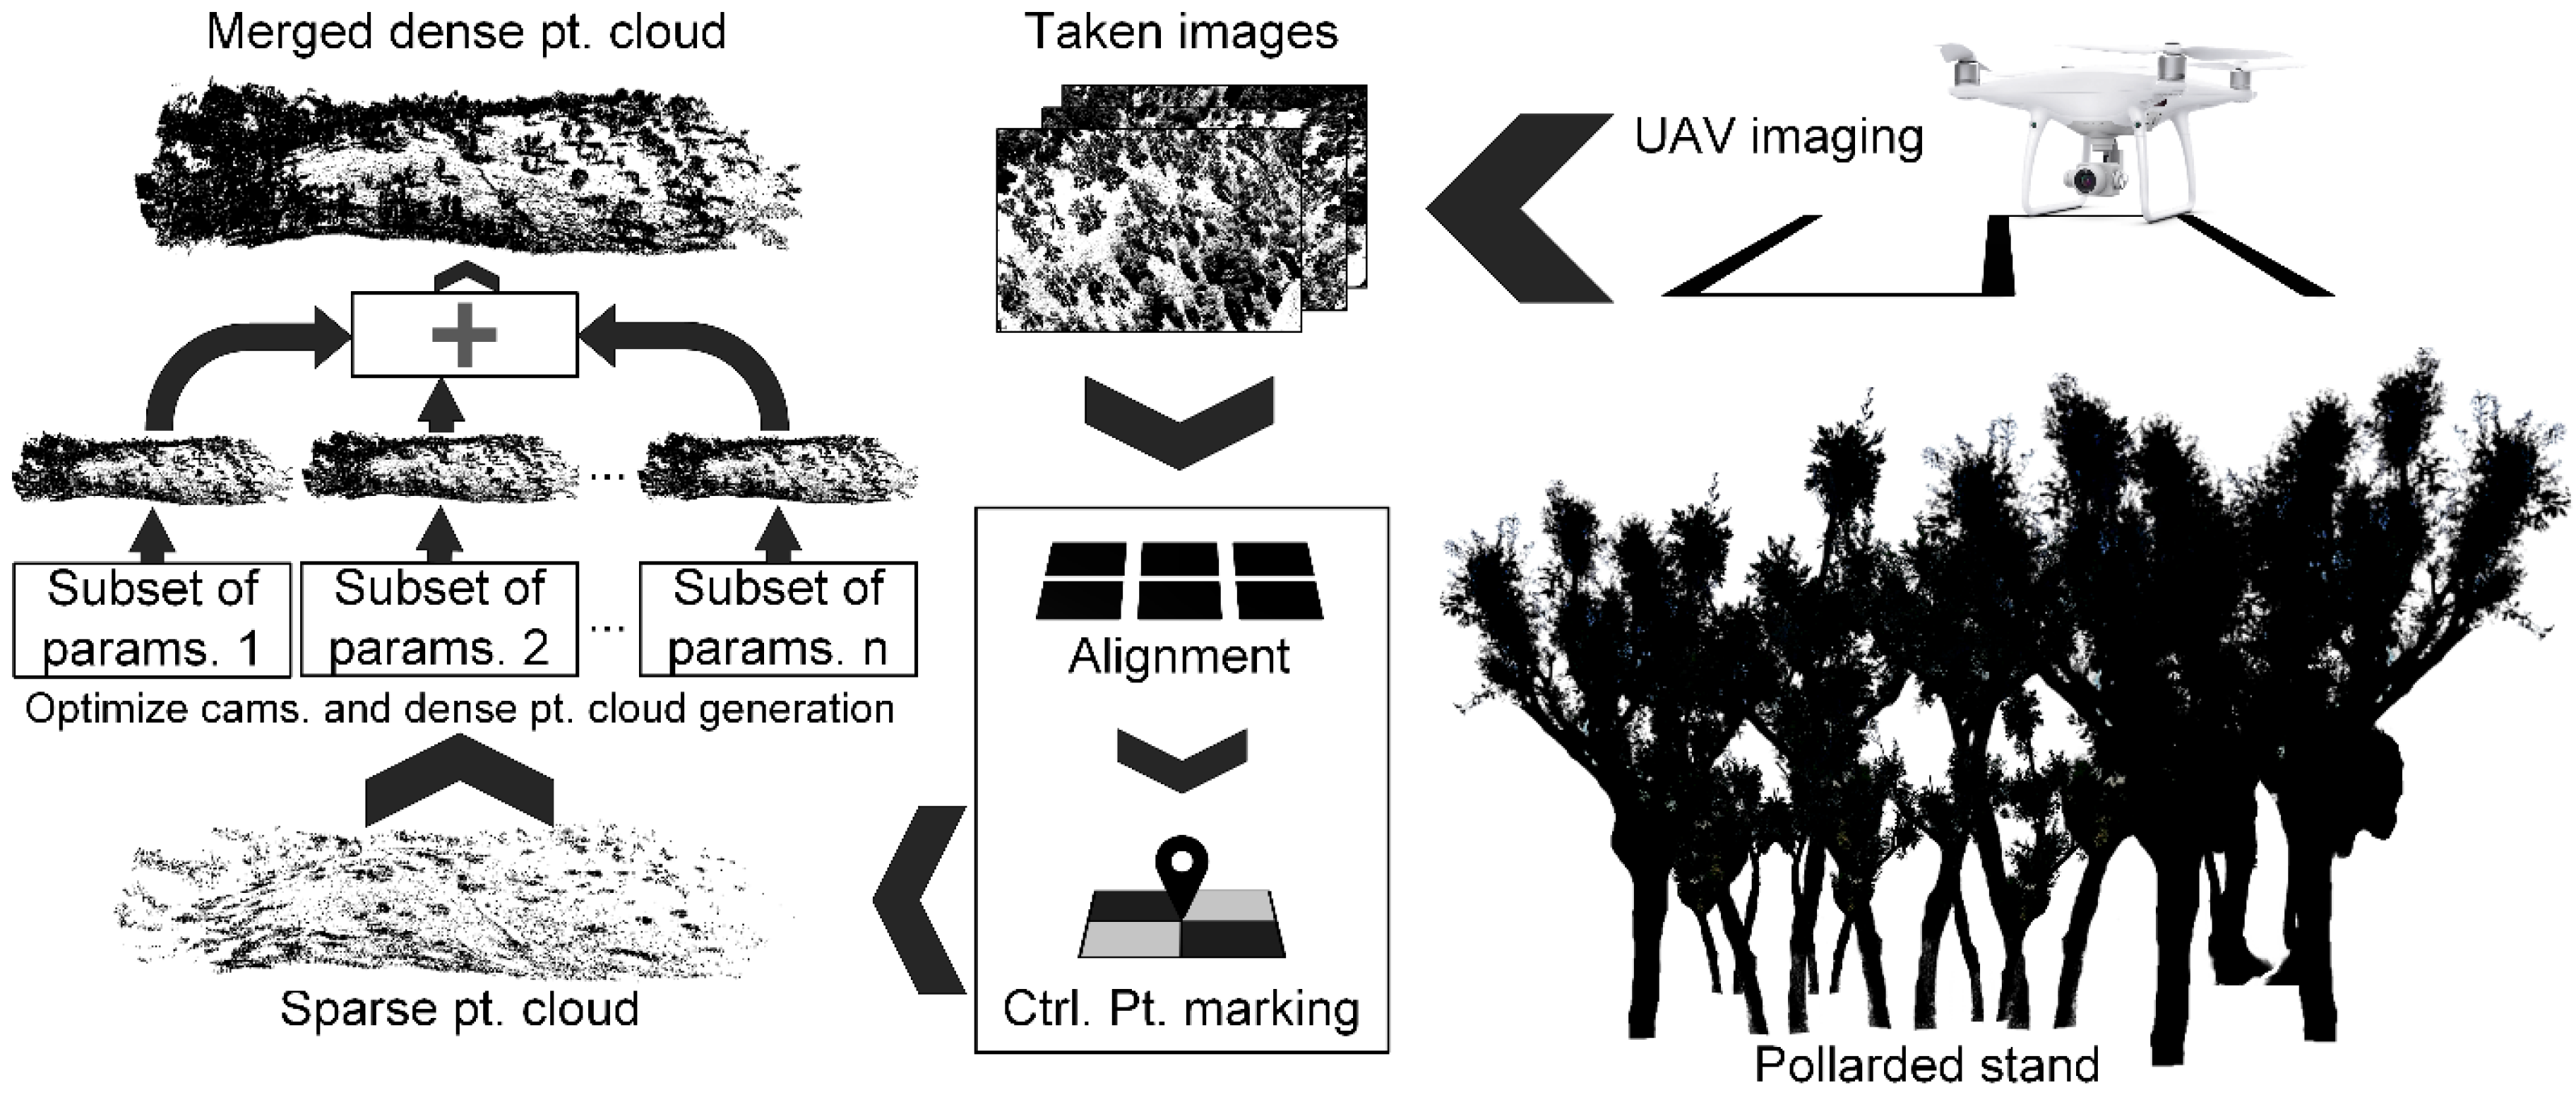
3.3. Methods
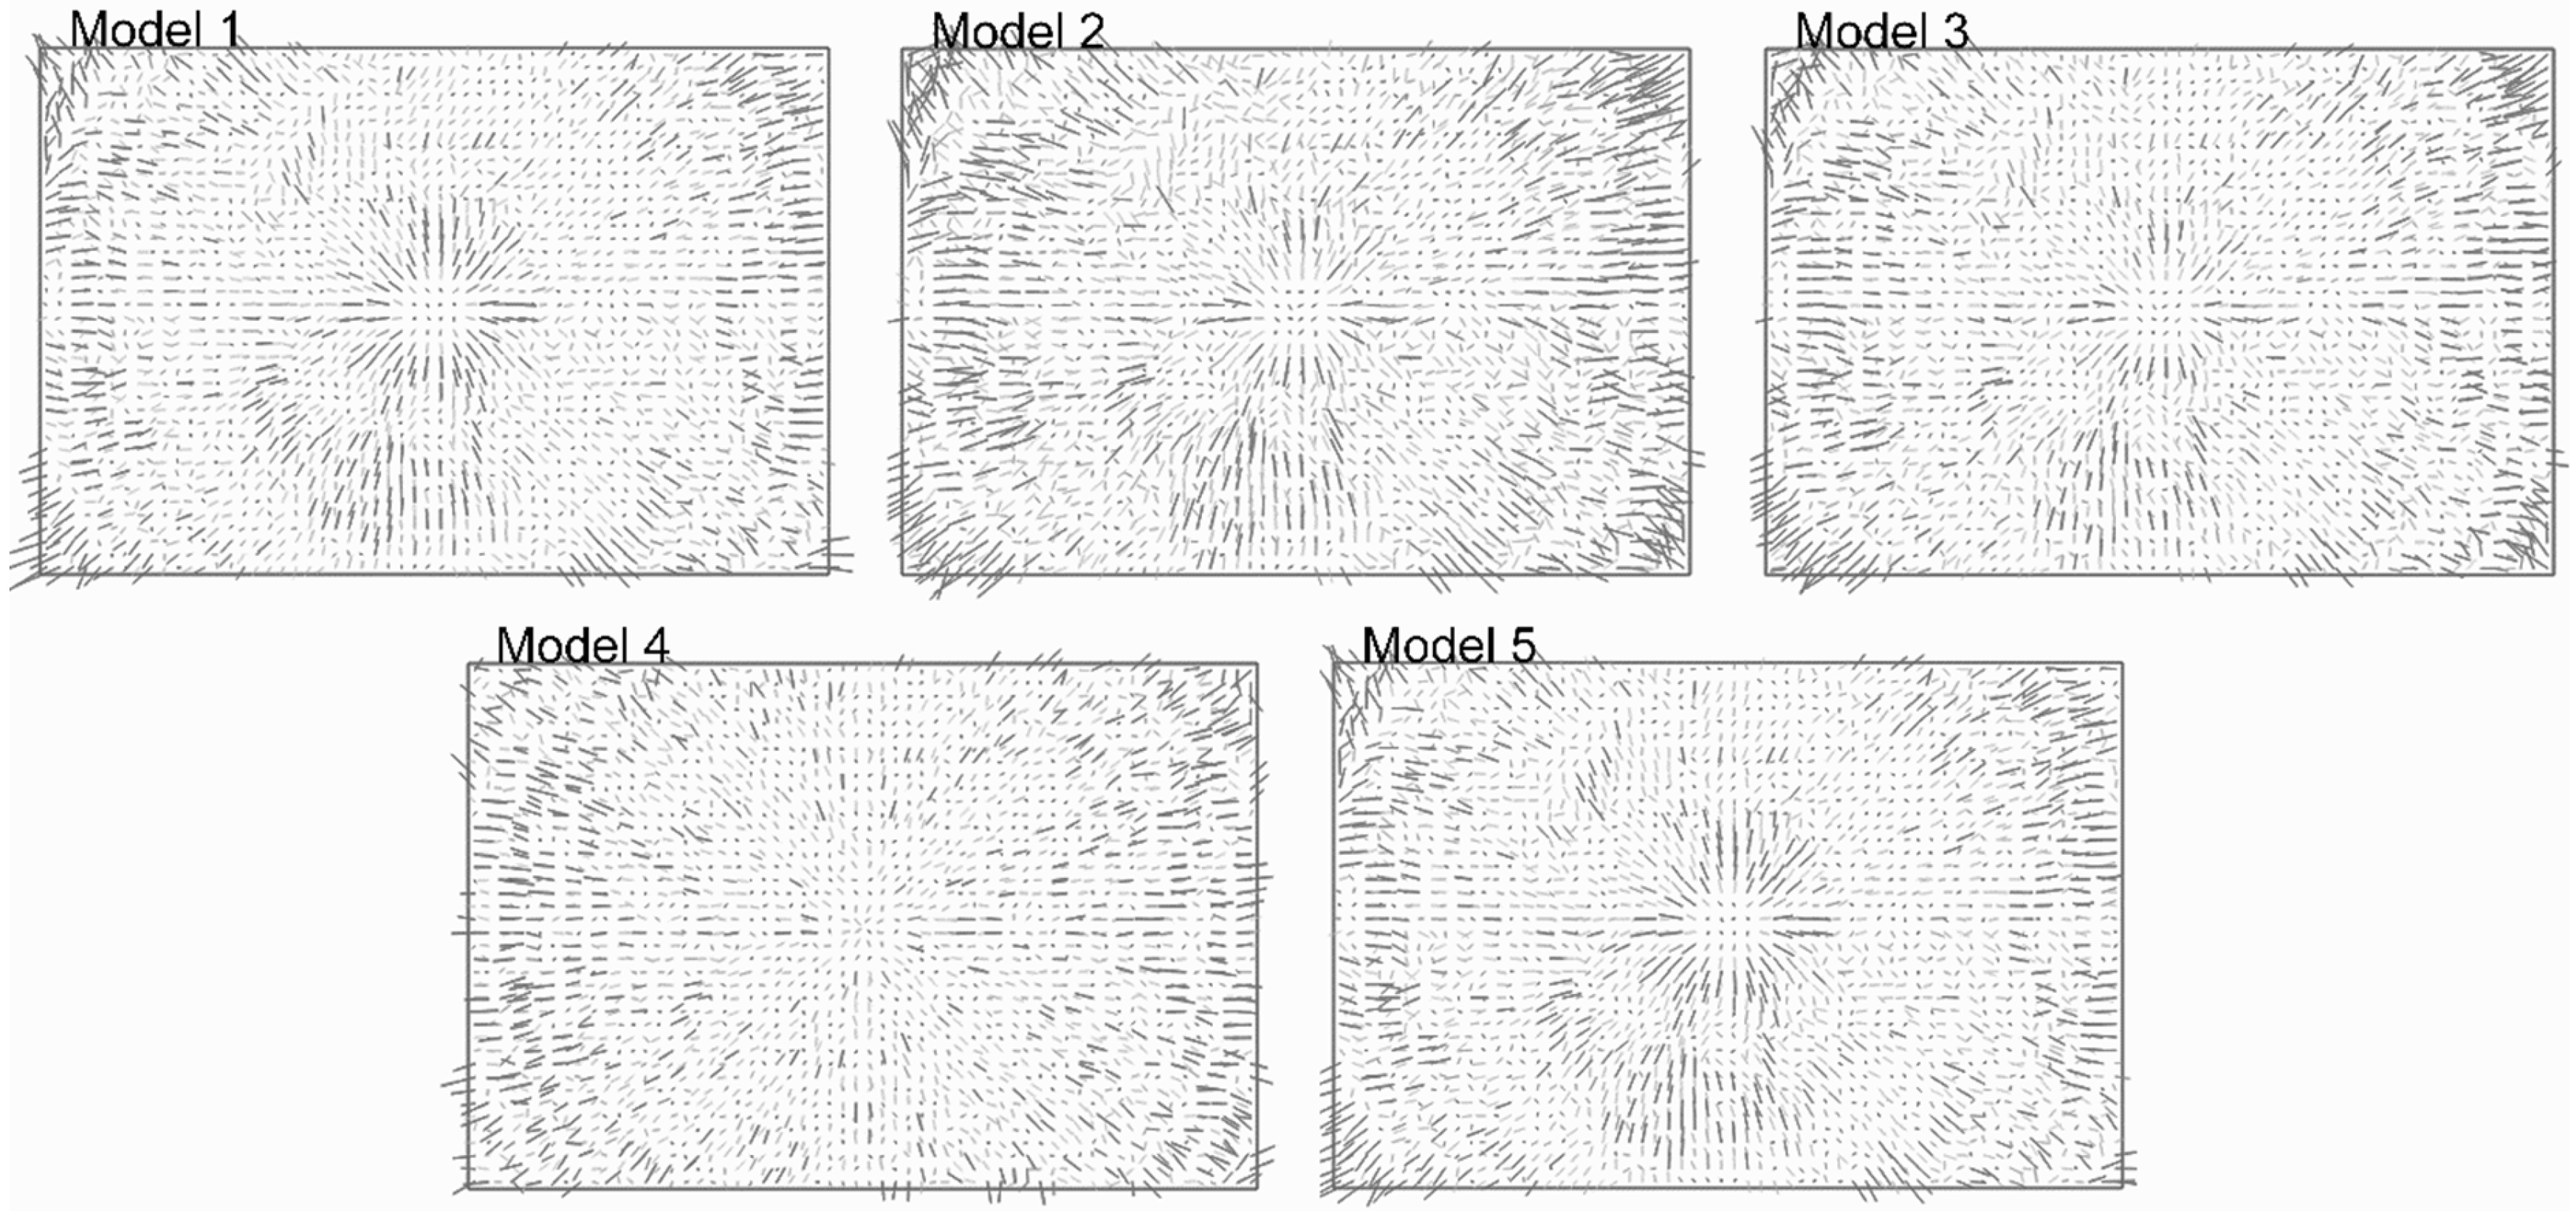
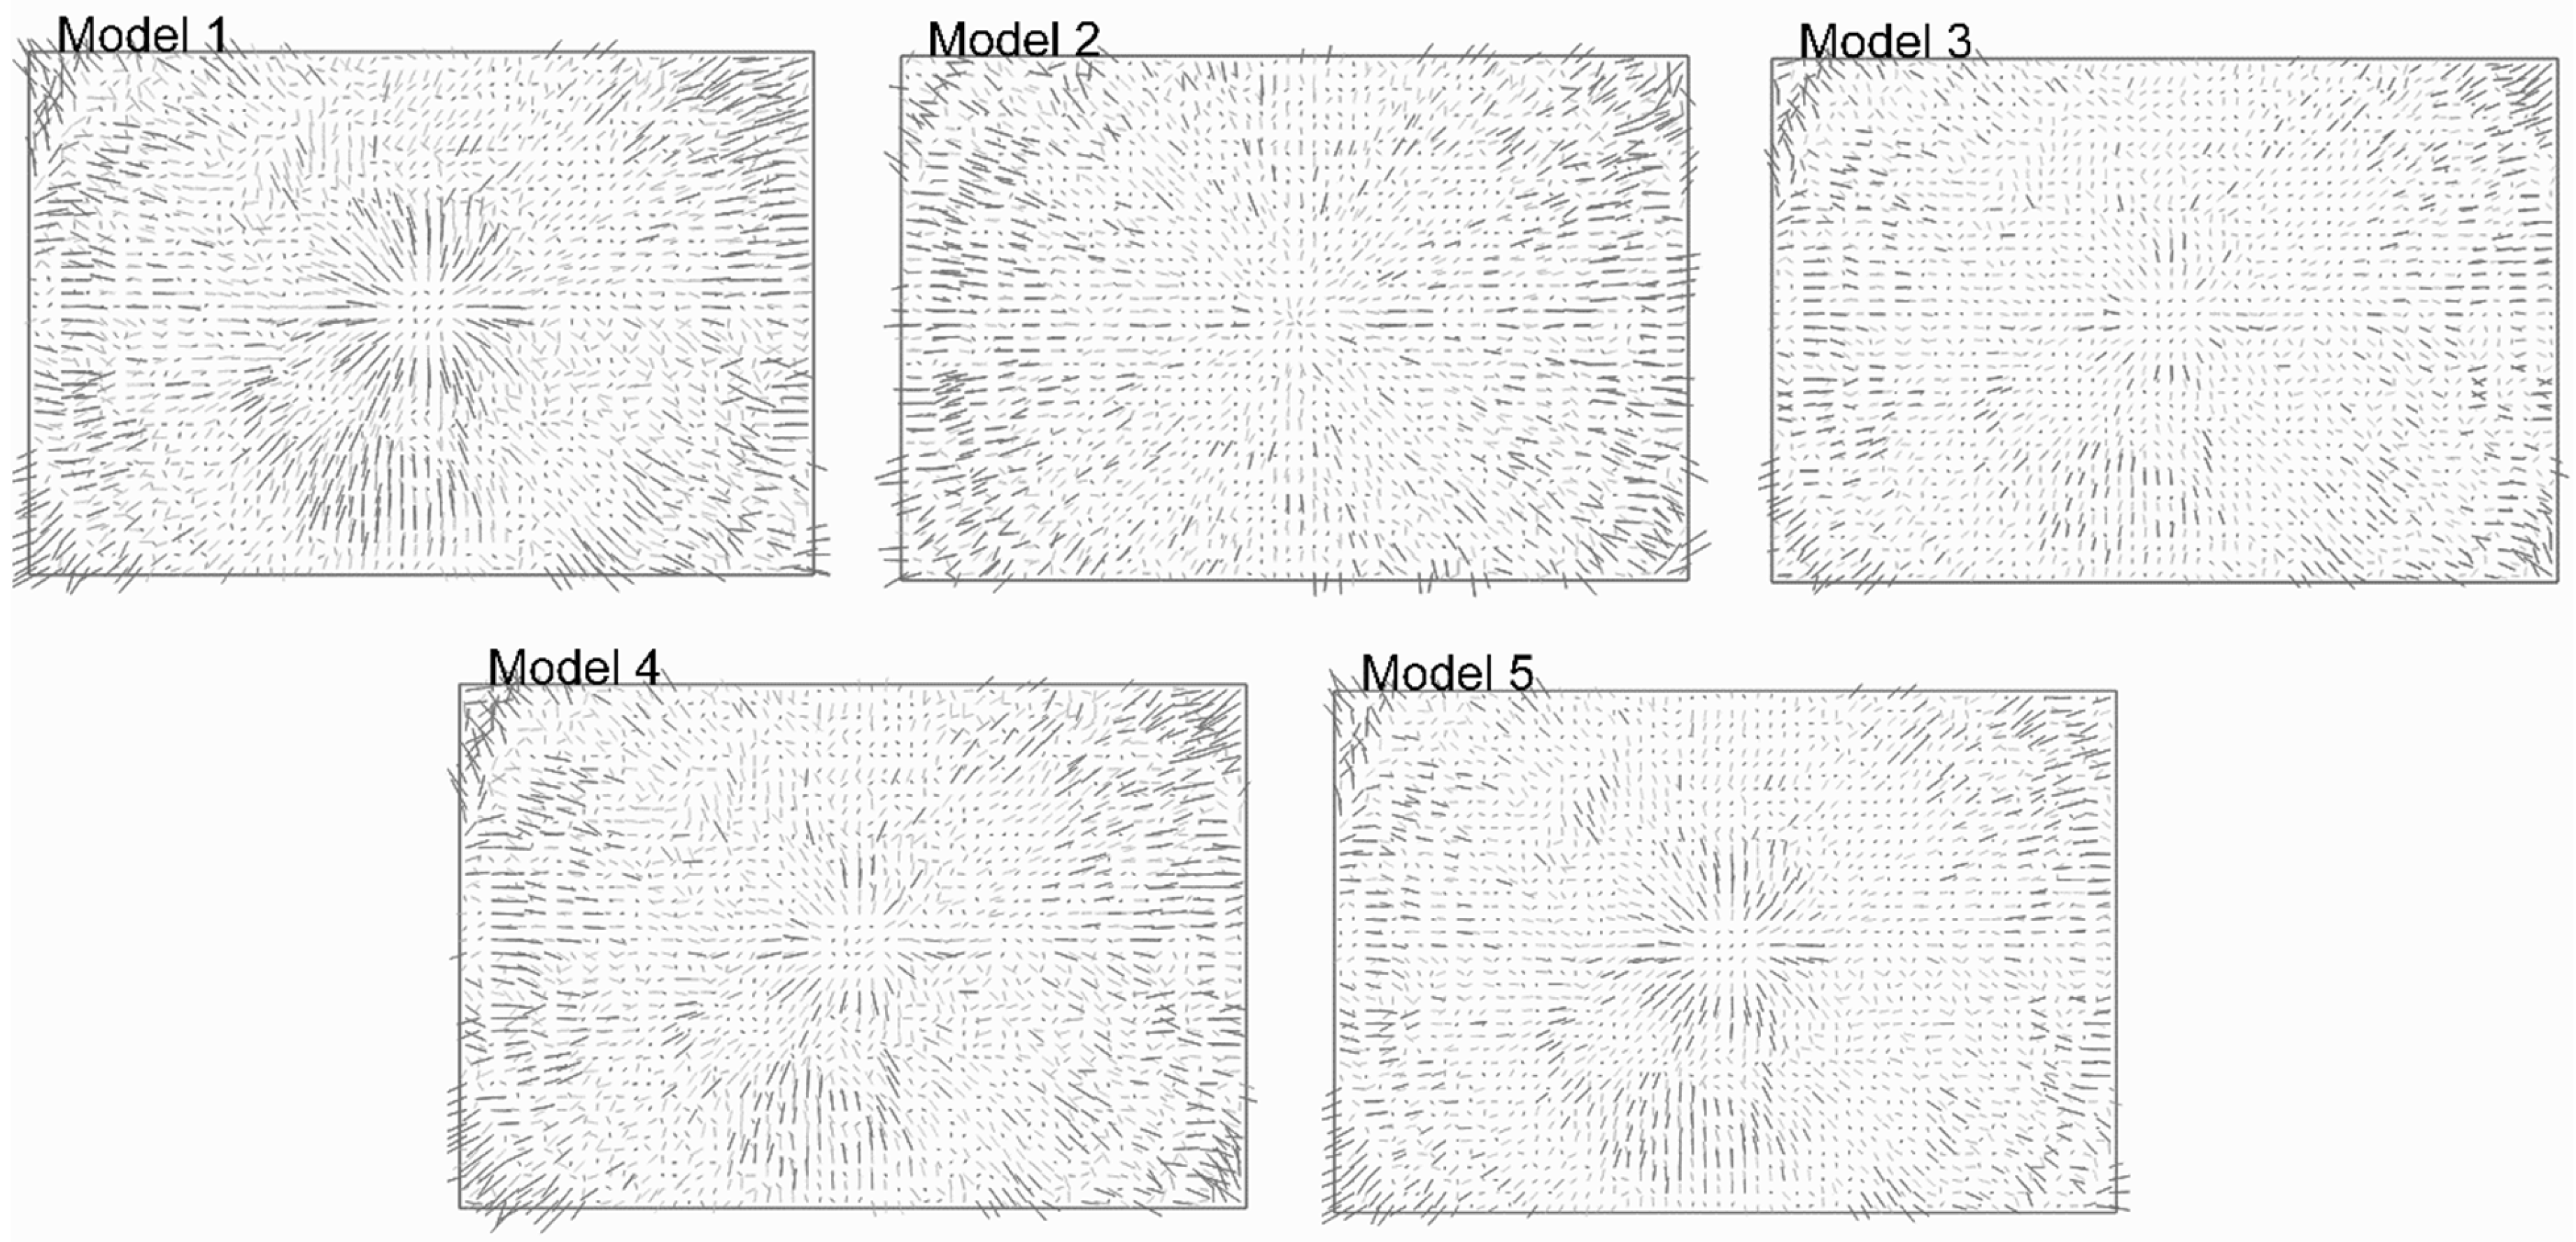
- k1, k2, k3, P1, P2 (the default and most used subset of parameters [32]);
- k1, k2, k3, k4, P1, P2;
- k1, k2, k3, k4, b1, P1, P2;
- k1, k2, k3, k4, P1, P2, b1, b2.
- Removed all points visible in two or fewer images;
- Removed key points in such a way that the reprojection error was halved, followed by an optimization of the camera parameters;
- Removed points in such a way that the reconstruction uncertainty was halved, followed by an optimization of the camera parameters;
- Removed points in such a way that the projection accuracy was halved, followed by an optimization of the camera parameters;
- Repeated these steps until the stopping condition was met.
3.4. Evaluation
4. Results
5. Discussion
6. Conclusions
Author Contributions
Funding
Data Availability Statement
Acknowledgments
Conflicts of Interest
References
- Paletto, A.; Favargiotti, S. Ecosystem Services: The Key to Human Well-Being. Forests 2021, 12, 480. [Google Scholar] [CrossRef]
- Jia, B.; Guo, W.; He, J.; Sun, M.; Chai, L.; Liu, J.; Wang, X. Topography, Diversity, and Forest Structure Attributes Drive Aboveground Carbon Storage in Different Forest Types in Northeast China. Forests 2022, 13, 455. [Google Scholar] [CrossRef]
- Sa, R.; Fan, W. Forest Structure Mapping of Boreal Coniferous Forests Using Multi-Source Remote Sensing Data. Remote Sens. 2024, 16, 1844. [Google Scholar] [CrossRef]
- Nowak, D.J.; Crane, D.E.; Stevens, J.C.; Hoehn, R.E.; Walton, J.T.; Bond, J. A Ground-Based Method of Assessing Urban Forest Structure and Ecosystem Services. Arboric. Urban For. 2008, 34, 347–358. [Google Scholar] [CrossRef]
- Fieber, K.D.; Davenport, I.J.; Tanase, M.A.; Ferryman, J.M.; Gurney, R.J.; Becerra, V.M.; Walker, J.P.; Hacker, J.M. Validation of Canopy Height Profile Methodology for Small-Footprint Full-Waveform Airborne LiDAR Data in a Discontinuous Canopy Environment. ISPRS J. Photogramm. Remote Sens. 2015, 104, 144–157. [Google Scholar] [CrossRef]
- Adamchuk, V.; Perk, R.; Schepers, J. Applications of Remote Sensing in Site-Specific Management; University of Nebraska Cooperative Extension Publication EC: Lincoln, NE, USA, 2003; p. 03-702. [Google Scholar]
- Akinbiola, S.; Salami, A.T.; Awotoye, O.O.; Popoola, S.O.; Olusola, J.A. Application of UAV Photogrammetry for the Assessment of Forest Structure and Species Network in the Tropical Forests of Southern Nigeria. Geocarto Int. 2023, 38, 2190621. [Google Scholar] [CrossRef]
- Frey, J.; Kovach, K.; Stemmler, S.; Koch, B. UAV Photogrammetry of Forests as a Vulnerable Process. A Sensitivity Analysis for a Structure from Motion RGB-Image Pipeline. Remote Sens. 2018, 10, 912. [Google Scholar] [CrossRef]
- Shimizu, K.; Nishizono, T.; Kitahara, F.; Fukumoto, K.; Saito, H. Integrating Terrestrial Laser Scanning and Unmanned Aerial Vehicle Photogrammetry to Estimate Individual Tree Attributes in Managed Coniferous Forests in Japan. Int. J. Appl. Earth Obs. Geoinf. 2022, 106, 102658. [Google Scholar] [CrossRef]
- Vacca, G.; Vecchi, E. UAV Photogrammetric Surveys for Tree Height Estimation. Drones 2024, 8, 106. [Google Scholar] [CrossRef]
- Zhang, J.; Lu, J.; Zhang, Q.; Qi, Q.; Zheng, G.; Chen, F.; Chen, S.; Zhang, F.; Fang, W.; Guan, Z. Estimation of Garden Chrysanthemum Crown Diameter Using Unmanned Aerial Vehicle (UAV)-Based RGB Imagery. Agronomy 2024, 14, 337. [Google Scholar] [CrossRef]
- Kameyama, S.; Sugiura, K. Estimating Tree Height and Volume Using Unmanned Aerial Vehicle Photography and SfM Technology, with Verification of Result Accuracy. Drones 2020, 4, 19. [Google Scholar] [CrossRef]
- Iglhaut, J.; Cabo, C.; Puliti, S.; Piermattei, L.; O’Connor, J.; Rosette, J. Structure from Motion Photogrammetry in Forestry: A Review. Curr. For. Rep. 2019, 5, 155–168. [Google Scholar] [CrossRef]
- Bolívar-Santamaría, S.; Reu, B. Assessing Canopy Structure in Andean (Agro)Forests Using 3D UAV Remote Sensing. Agrofor. Syst. 2024, 98, 1225–1241. [Google Scholar] [CrossRef]
- Swayze, N.C.; Tinkham, W.T.; Vogeler, J.C.; Hudak, A.T. Influence of Flight Parameters on UAS-Based Monitoring of Tree Height, Diameter, and Density. Remote Sens. Environ. 2021, 263, 112540. [Google Scholar] [CrossRef]
- Fakhri, A.; Latifi, H.; Samani, K.M.; Fassnacht, F.E. CaR3DMIC: A Novel Method for Evaluating UAV-Derived 3D Forest Models by Tree Features. ISPRS J. Photogramm. Remote Sens. 2024, 208, 279–295. [Google Scholar] [CrossRef]
- Mousavi, V.; Varshosaz, M.; Remondino, F.; Pirasteh, S.; Li, J. A Two-Step Descriptor-Based Keypoint Filtering Algorithm for Robust Image Matching. IEEE Trans. Geosci. Remote Sens. 2022, 60, 1–21. [Google Scholar] [CrossRef]
- Burdziakowski, P.; Bobkowska, K. UAV Photogrammetry under Poor Lighting Conditions—Accuracy Considerations. Sensors 2021, 21, 3531. [Google Scholar] [CrossRef]
- Fryer, J.G.; Brown, D.C. Lens Distortion for Close-Range Photogrammetry. Photogramm. Eng. Remote Sens. 1986, 52, 51–58. [Google Scholar]
- Tang, Z.; Grompone von Gioi, R.; Monasse, P.; Morel, J.-M. High-Precision Camera Distortion Measurements with a “Calibration Harp”. J. Opt. Soc. Am. A 2012, 29, 2134–2143. [Google Scholar] [CrossRef]
- Zhou, Y.; Rupnik, E.; Meynard, C.; Thom, C.; Pierrot-Deseilligny, M. Simulation and analysis of photogrammetric uav image blocks: Influence of camera calibration error. ISPRS Ann. Photogramm. Remote Sens. Spat. Inf. Sci. 2019, IV-2/W5, 195–200. [Google Scholar] [CrossRef]
- Harwin, S.; Lucieer, A.; Osborn, J. The Impact of the Calibration Method on the Accuracy of Point Clouds Derived Using Unmanned Aerial Vehicle Multi-View Stereopsis. Remote Sens. 2015, 7, 11933–11953. [Google Scholar] [CrossRef]
- Fakhri, A.; Latifi, H.; Mohammadi Samani, K.; Shakeri, Z.; Naghavi, H.; Fassnacht, F.E. Combination of UAV Photogrammetry and Field Inventories Enables Description of Height–Diameter Relationship within Semi-Arid Silvopastoral Systems. Remote Sens. 2023, 15, 5261. [Google Scholar] [CrossRef]
- Neale, W.T.; Hessel, D.; Terpstra, T. Photogrammetric Measurement Error Associated with Lens Distortion; SAE Technical Paper; SAE International: Warrendale, PA, USA, 2011. [Google Scholar]
- Chari, V.; Veeraraghavan, A. Lens Distortion, Radial Distortion. In Computer Vision: A Reference Guide; Ikeuchi, K., Ed.; Springer: Boston, MA, USA, 2014; pp. 443–445. ISBN 978-0-387-31439-6. [Google Scholar]
- Ma, X.; Zhu, P.; Li, X.; Zheng, X.; Zhou, J.; Wang, X.; Au, K.W.S. A Minimal Set of Parameters Based Depth-Dependent Distortion Model and Its Calibration Method for Stereo Vision Systems. IEEE Trans. Instrum. Meas. 2024, 73, 7004111. [Google Scholar] [CrossRef]
- Brown, D. Decentering Distortion of Lenses. Photogramm. Eng. 1966, 32, 444–462. [Google Scholar]
- Jazirehi, M.; Ebrahimi Rostaghi, M. Silviculture in Zagros; Tehran University Press: Teheran, Iran, 2003. [Google Scholar]
- Valipour, A.; Plieninger, T.; Shakeri, Z.; Ghazanfari, H.; Namiranian, M.; Lexer, M.J. Traditional Silvopastoral Management and Its Effects on Forest Stand Structure in Northern Zagros, Iran. For. Ecol. Manag. 2014, 327, 221–230. [Google Scholar] [CrossRef]
- Andersen, H.-E.; Reutebuch, S.E.; McGaughey, R.J. A Rigorous Assessment of Tree Height Measurements Obtained Using Airborne Lidar and Conventional Field Methods. Can. J. Remote Sens. 2006, 32, 355–366. [Google Scholar] [CrossRef]
- Luetzenburg, G.; Kroon, A.; Bjørk, A.A. Evaluation of the Apple iPhone 12 Pro LiDAR for an Application in Geosciences. Sci. Rep. 2021, 11, 22221. [Google Scholar] [CrossRef]
- Over, J.-S.R.; Ritchie, A.C.; Kranenburg, C.J.; Brown, J.A.; Buscombe, D.D.; Noble, T.; Sherwood, C.R.; Warrick, J.A.; Wernette, P.A. Processing Coastal Imagery with Agisoft Metashape Professional Edition, Version 1.6—Structure from Motion Workflow Documentation; Open-File Report; U.S. Geological Survey: Reston, VA, USA, 2021; p. 46.
- Mousavi, V.; Varshosaz, M.; Remondino, F. Using Information Content to Select Keypoints for UAV Image Matching. Remote Sens. 2021, 13, 1302. [Google Scholar] [CrossRef]
- Fassnacht, F.E.; White, J.C.; Wulder, M.A.; Næsset, E. Remote Sensing in Forestry: Current Challenges, Considerations and Directions. For. Int. J. For. Res. 2024, 97, 11–37. [Google Scholar] [CrossRef]
- Chen, Q.; Gao, T.; Zhu, J.; Wu, F.; Li, X.; Lu, D.; Yu, F. Individual Tree Segmentation and Tree Height Estimation Using Leaf-Off and Leaf-On UAV-LiDAR Data in Dense Deciduous Forests. Remote Sens. 2022, 14, 2787. [Google Scholar] [CrossRef]
- Zhang, Z.; Wang, T.; Skidmore, A.K.; Cao, F.; She, G.; Cao, L. An Improved Area-Based Approach for Estimating Plot-Level Tree DBH from Airborne LiDAR Data. For. Ecosyst. 2023, 10, 100089. [Google Scholar] [CrossRef]
- Wang, X.; Xiang, H.; Niu, W.; Mao, Z.; Huang, X.; Zhang, F. Oblique Photogrammetry Supporting Procedural Tree Modeling in Urban Areas. ISPRS J. Photogramm. Remote Sens. 2023, 200, 120–137. [Google Scholar] [CrossRef]
- Gao, Q.; Kan, J. Automatic Forest DBH Measurement Based on Structure from Motion Photogrammetry. Remote Sens. 2022, 14, 2064. [Google Scholar] [CrossRef]
- Franzel, S.; Carsan, S.; Lukuyu, B.; Sinja, J.; Wambugu, C. Fodder Trees for Improving Livestock Productivity and Smallholder Livelihoods in Africa. Curr. Opin. Environ. Sustain. 2014, 6, 98–103. [Google Scholar] [CrossRef]
- Geta, T.; Nigatu, L.; Animut, G. Evaluation of Potential Yield and Chemical Composition of Selected Indigenous Multi-Purpose Fodder Trees in Three Districts of Wolayta Zone, Southern Ethiopia. World Appl. Sci. J. 2014, 31, 399–405. [Google Scholar]
- Guyassa, E.; Raj, A.J.; Gidey, K.; Tadesse, A. Domestication of Indigenous Fruit and Fodder Trees/Shrubs in Dryland Agroforestry and Its Implication on Food Security. Int. J. Ecosyst. 2014, 4, 83–88. [Google Scholar]
- Lang, P.; Jeschke, M.; Wommelsdorf, T.; Backes, T.; Lv, C.; Zhang, X.; Thomas, F.M. Wood Harvest by Pollarding Exerts Long-Term Effects on Populus Euphratica Stands in Riparian Forests at the Tarim River, NW China. For. Ecol. Manag. 2015, 353, 87–96. [Google Scholar] [CrossRef]
- McNicol, I.M.; Mitchard, E.T.A.; Aquino, C.; Burt, A.; Carstairs, H.; Dassi, C.; Modinga Dikongo, A.; Disney, M.I. To What Extent Can UAV Photogrammetry Replicate UAV LiDAR to Determine Forest Structure? A Test in Two Contrasting Tropical Forests. J. Geophys. Res. Biogeosci. 2021, 126, e2021JG006586. [Google Scholar] [CrossRef]
- Cunliffe, A.M.; Anderson, K.; Boschetti, F.; Brazier, R.E.; Graham, H.A.; Myers-Smith, I.H.; Astor, T.; Boer, M.M.; Calvo, L.G.; Clark, P.E.; et al. Global Application of an Unoccupied Aerial Vehicle Photogrammetry Protocol for Predicting Aboveground Biomass in Non-Forest Ecosystems. Remote Sens. Ecol. Conserv. 2022, 8, 57–71. [Google Scholar] [CrossRef]
- Liang, H.; Lee, S.-C.; Bae, W.; Kim, J.; Seo, S. Towards UAVs in Construction: Advancements, Challenges, and Future Directions for Monitoring and Inspection. Drones 2023, 7, 202. [Google Scholar] [CrossRef]
- Lunetta, R.; Congalton, R.; Fenstermaker, L.; Jensen, J.; Mcgwire, K.; Tinney, L.R. Remote Sensing and Geographic Information System Data Integration- Error Sources and Research Issues. Photogramm. Eng. Remote Sens. 1991, 57, 677–687. [Google Scholar]
- Mousavi, V.; Varshosaz, M.; Rashidi, M.; Li, W. A New Multi-Criteria Tie Point Filtering Approach to Increase the Accuracy of UAV Photogrammetry Models. Drones 2022, 6, 413. [Google Scholar] [CrossRef]
- Krisanski, S.; Taskhiri, M.S.; Turner, P. Enhancing Methods for Under-Canopy Unmanned Aircraft System Based Photogrammetry in Complex Forests for Tree Diameter Measurement. Remote Sens. 2020, 12, 1652. [Google Scholar] [CrossRef]
- Nasiri, V.; Darvishsefat, A.A.; Arefi, H.; Pierrot-Deseilligny, M.; Namiranian, M.; Le Bris, A. Unmanned Aerial Vehicles (UAV)-Based Canopy Height Modeling under Leaf-on and Leaf-off Conditions for Determining Tree Height and Crown Diameter (Case Study: Hyrcanian Mixed Forest). Can. J. For. Res. 2021, 51, 962–971. [Google Scholar] [CrossRef]
- Ghasemi, M.; Latifi, H.; Pourhashemi, M. RGB-UAV Data Enables Cost-Effective Discrimination of Single-and Multi-Stem Oak Trees Across Semi-Arid Forest Ecosystems. 2023. Available online: https://papers.ssrn.com/sol3/papers.cfm?abstract_id=4544688 (accessed on 15 January 2025). [CrossRef]
- Hådem, I. Bundle Adjustment in Industrial Photogrammetry. Photogrammetria 1981, 37, 45–60. [Google Scholar] [CrossRef]


| Site Name | Evaluation Metric | |||||
|---|---|---|---|---|---|---|
| Site-Based | Tree-Based (rRMSE %) | |||||
| CaR3DMIC | Crown Area | Height | ||||
| Standard | Enhanced | Standard | Enhanced | Standard | Enhanced | |
| 1 | 0.70 | 0.89 | 24 | 16 | 6 | 6 |
| 2 | 0.74 | 0.86 | 21 | 9 | 15 | 13 |
| 3 | 0.68 | 0.88 | 15 | 3 | 7 | 6 |
| 4 | 0.69 | 0.84 | 39 | 23 | 14 | 9 |
| 5 | 0.66 | 0.79 | 18 | 9 | 5 | 3 |
| 6 | 0.70 | 0.84 | 12 | 3 | 3 | 2 |
Disclaimer/Publisher’s Note: The statements, opinions and data contained in all publications are solely those of the individual author(s) and contributor(s) and not of MDPI and/or the editor(s). MDPI and/or the editor(s) disclaim responsibility for any injury to people or property resulting from any ideas, methods, instructions or products referred to in the content. |
© 2025 by the authors. Licensee MDPI, Basel, Switzerland. This article is an open access article distributed under the terms and conditions of the Creative Commons Attribution (CC BY) license (https://creativecommons.org/licenses/by/4.0/).
Share and Cite
Fakhri, A.; Latifi, H.; Mohammadi Samani, K.; Fassnacht, F.E. Improving the Accuracy of Forest Structure Analysis by Consumer-Grade UAV Photogrammetry Through an Innovative Approach to Mitigate Lens Distortion Effects. Remote Sens. 2025, 17, 383. https://doi.org/10.3390/rs17030383
Fakhri A, Latifi H, Mohammadi Samani K, Fassnacht FE. Improving the Accuracy of Forest Structure Analysis by Consumer-Grade UAV Photogrammetry Through an Innovative Approach to Mitigate Lens Distortion Effects. Remote Sensing. 2025; 17(3):383. https://doi.org/10.3390/rs17030383
Chicago/Turabian StyleFakhri, Arvin, Hooman Latifi, Kyumars Mohammadi Samani, and Fabian Ewald Fassnacht. 2025. "Improving the Accuracy of Forest Structure Analysis by Consumer-Grade UAV Photogrammetry Through an Innovative Approach to Mitigate Lens Distortion Effects" Remote Sensing 17, no. 3: 383. https://doi.org/10.3390/rs17030383
APA StyleFakhri, A., Latifi, H., Mohammadi Samani, K., & Fassnacht, F. E. (2025). Improving the Accuracy of Forest Structure Analysis by Consumer-Grade UAV Photogrammetry Through an Innovative Approach to Mitigate Lens Distortion Effects. Remote Sensing, 17(3), 383. https://doi.org/10.3390/rs17030383