Article

Long-Term Spatiotemporal Pattern and Temporal Dynamic Simulation of Pine Wilt Disease

1
Key Laboratory of Remote Sensing and Digital Earth, Aerospace Information Research Institute, Chinese Academy of Sciences, Beijing 100101, China
2
University of Chinese Academy of Sciences, Beijing 100049, China
3
Center for Biological Disaster Prevention and Control, National Forestry and Grassland Administration, Shenyang 110034, China
4
Key Laboratory of National Forestry and Grassland Administration on Forest and Grassland Pest Monitoring and Warning, Shenyang 110034, China
5
Key Laboratory of Digital Earth Science, Aerospace Information Research Institute, Chinese Academy of Sciences, Beijing 100094, China
*
Author to whom correspondence should be addressed.
Remote Sens. 2025, 17(3), 348; https://doi.org/10.3390/rs17030348
Submission received: 2 December 2024 / Revised: 12 January 2025 / Accepted: 16 January 2025 / Published: 21 January 2025

Abstract

:
As a prominent forest pest on international quarantine lists, pine wilt disease (PWD) is characterized by its ease of transmission, rapid onset, high mortality rate, and the complexity of its prevention and control. The disease inflicts devastating damage on pine forest ecosystems and biodiversity in affected regions, resulting in substantial losses of ecological and economic value. This study uses 40 years of county-level data on PWD occurrences in China to investigate the historical spatiotemporal distribution patterns, the spreading process, and the impact of PWD on forest ecosystems. We divided the spread of PWD in China into three stages based on the changes in the number of affected areas. We used SaTScan spatial scanning to analyze the spatiotemporal distribution patterns and regional characteristics of the disease in each stage. Based on the spatial relationships of the affected areas, we identified two types of spread, namely continuous spread and leapfrogging spread, and conducted ecological models of the two spreading processes to describe the spread of PWD over the past 40 years. The results indicate that PWD has two major expansion periods in China. They show a diffusion pattern spreading from points to areas, ultimately forming four clusters with regional characteristics. Driving factors were selected for model construction based on the biological characteristics and spatiotemporal distribution patterns of PWD. The Susceptible (SIS) model and Random Forest (RF) model achieve good results in simulating continuous and leapfrog spread. By integrating the models of the two spreading processes, we can clearly quantify the 40-year spread of PWD in China. The long-term dynamic ecological modeling of PWD, based on historical dissemination characteristics, facilitates the development of disaster prediction models and the maintenance of forest ecosystems while also providing case studies for the invasion and spread of forest pests and pathogens.

1. Introduction

Plant pathogens cause severe losses in a wide range of crops and forest plant species worldwide, and they are a major obstacle to achieving sustainable agriculture and forestry [1]. Pathogens in forest ecosystems pose significant challenges to sustainable management by disrupting economic trade and causing substantial ecological damage [2]. Pine wilt disease (PWD), caused by the pine wilt nematode (PWN, Bursaphelenchus xylophilus), is a major plant epidemic threatening ecological and biological security [3,4]. Once infected by PWN, individual pine trees can die within as little as 40 days, and an entire pine forest can progress from infection to catastrophic destruction within 3 to 5 years [5]. It has been listed as a quarantine pest in more than 50 countries [6]. As a prominent forest pest on international quarantine lists, PWD is characterized by its ease of transmission, rapid onset, high mortality rate, and the complexity of its prevention and control. This disease poses a serious threat to the sustainability of forest ecosystem structure and function, as well as to national economic and social security, particularly in terms of natural landscapes, ecological environments, and socio-economic systems [7]. It leads to significant and irreversible transformations in primary forest ecosystems, such as tree species shifts, the destruction of wildlife habitats, a loss of soil and water conservation functions, and a decline in biodiversity.
North America is the native range of PWN, with its distribution spanning the United States, Canada, and Mexico. The intensification of global trade significantly contributes to the proliferation of forest disease worldwide [8]. PWN is currently found in China, the United States, Canada, Korea, Japan, Portugal, Spain, and other countries [9]. In 1982, PWN was first detected on a black pine (P. thunbergii) in Zhongshan Mausoleum, Nanjing, China [10]. Since its introduction, PWD has rapidly spread across China. Its leap-like dispersal pattern has led to outbreaks in multiple regions, exhibiting a diffusion mode from points to areas and from coastal regions to inland regions [11]. The occurrence of PWD represents a complex cycle involving the interaction of PWN, vector beetles, and host pine trees. The outbreak of PWD is influenced by climatic factors, with high temperatures and drought accelerating disease progression [12]. Recent climate changes have further increased opportunities for the invasion and expansion of the disease. Additionally, due to the high adaptability of PWN, it has breached traditional theoretical boundaries of suitable habitats, leading to an expansion into higher altitudes and high-latitude cold regions [13]. This has resulted in a gradual invasion into warm temperate zones and high-altitude regions such as the Qinling Mountains. To date, pine trees in 18 provinces (regions and municipalities) and 633 county-level administrative divisions in China have been infected with PWN (https://www.forestry.gov.cn/ (accessed on 20 November 2024)).
The spread of PWD is driven by two factors: long-distance dispersal primarily mediated by human activities and short-distance dispersal dominated by natural factors. Long-distance dispersal is a key factor that contributes to the high dispersal ability of invasive species [14,15,16]. High dispersal ability enables PWD to establish new populations in previously unvisited locations, leading to widespread expansion [17]. Research analyzing the genetic structure differences between pinewood nematode populations in the Guangdong and Jiangsu provinces of China suggests that the PWD outbreaks in Shaoguan City and Shantou City of Guangdong province were caused by human-mediated long-distance dispersal [18]. Long-distance dispersal can occur in various forms [19]. Human activities, such as logging or trade that involves wooden packaging material, increase the risk of accidentally transporting infested materials and may contribute to the rapid spread of the nematode. Thus, any connections between infested and non-infested areas (e.g., highways, railways, rivers, or electric power networks with wooden poles) likely increase the risk of invasion [8]. Transportation hubs have been reported to play a crucial role in occasional long-distance, human-mediated dispersal. The local range expansion of introduced species depends on their dispersal ability [20,21]. In most cases, this expansion occurs in heterogeneous environments, where spatial and temporal distributions of biotic and abiotic constraints vary [20]. This heterogeneity determines the influence and scale of landscape effects on species dispersal [22]. Mountain regions are major components of landscape heterogeneity. They exhibit contrasting climatic conditions and historically have shaped species’ genetic structures by affecting landscape connectivity [23]. Mountain ranges may delimit the distribution of native species and act as potential barriers to the spread of invasive species.
Several different modeling techniques have been used to predict the spread and/or epidemic of PWD. Due to the complexity of the disease, many studies have analyzed dispersal patterns to understand how invasive species spread [24]. Several papers have conducted relevant research on the modeling of forest pest spread. Zihua Zhao introduced a model describing the invasion dynamics of the oriental fruit fly by considering the synergy between climate change and transportation activities [25]. Olav Skarpaas used timber import data to develop an import model, studying the risk of forest pest introductions with bark beetles as an example [26]. Modeling PWD began in conjunction with biological invasion processes, such as emergence, survival, dispersal, reproduction, and disease transmission [27]. The dispersal of invasive species often includes two components: short-distance dispersal and long-distance dispersal. Some studies have developed individual-based models using mathematical structures to address overall disease spread controlled by key parameters [28]. Robinet applied a dispersal model to identify the fastest entry points for the Monochamus vector of PWD in Europe, considering both the local dispersal of the vector beetles (active flight) and long-distance dispersal (human-mediated spread), and two models were developed [24]. Additionally, individual-based models have been developed to simulate PWD spread [28]. These models are often more flexible in expressing individual-level behaviors due to the inclusion of local rules and their connection to population levels.
Invasive species cause substantial ecological and economic damage. They disrupt the fundamental structure of ecosystems. Therefore, controlling their spread is imperative to minimize further harm. The spread of PWD is a complex process, with both its causes and modes of transmission being multifaceted. Current research on PWD has not incorporated long-term historical spread patterns and often focuses on a single spread factor. This lack of comprehensive analysis of the entire disaster formation process makes it difficult to uncover the objective patterns of disease transmission. This study conducts a 40-year dynamic simulation of PWD in China, using counties as the research units. This study is the first to innovatively classify the spread process of PWD as follows: based on the transmission mechanisms of PWD, each newly affected county is categorized as either continuous spread or leapfrogging spread according to the spatial adjacency relationships among affected counties. Through an analysis of the temporal and spatial distribution characteristics of the disease, the spread of PWD in China is divided into three distinct stages. Taking into account the transmission processes of both spread modes at each stage, and relying on epidemic survey data, multi-source remote sensing data products, and socio-economic data, this study constructs RF (Random Forest) and SIS (Susceptible–Infectious–Susceptible) models to dynamically simulate these two spread modes. This methodology helps to sustain the health of pine forests and protect the ecological value of China’s forest ecosystems.

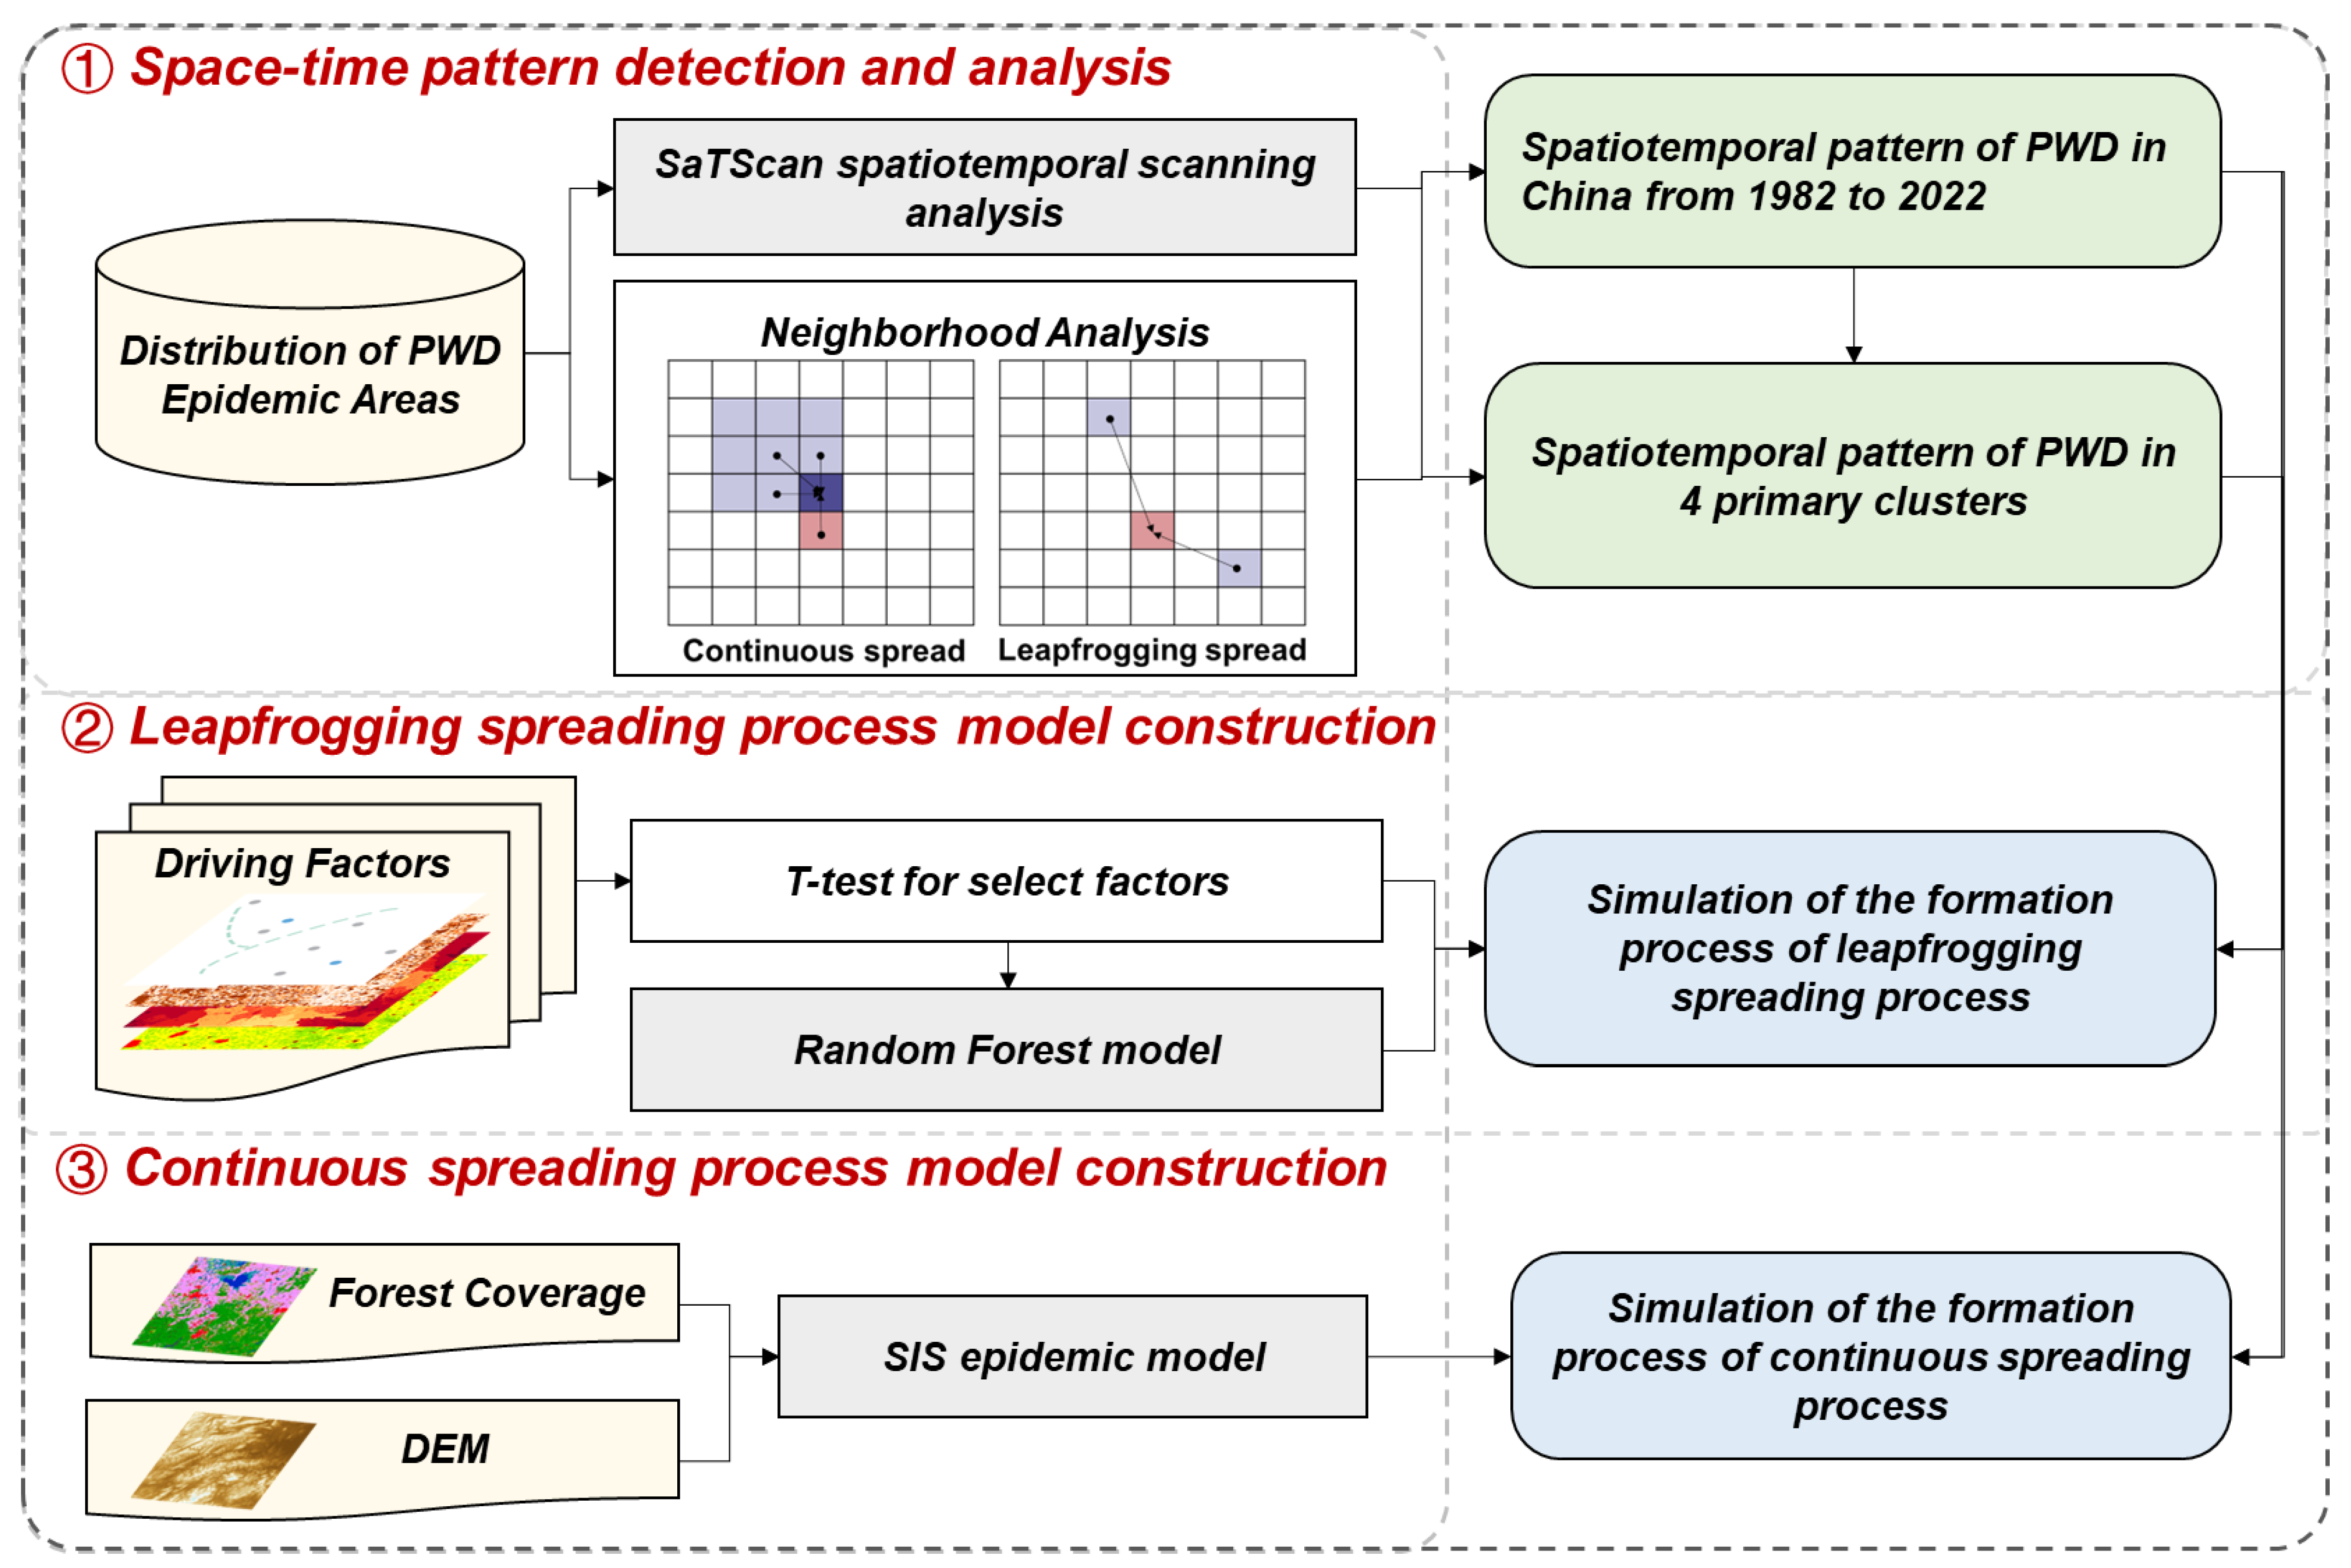
2. Materials and Methods

This chapter introduces the data and methods used in this study, organized within the framework of the study area, study method and model, and data sources.

2.1. Study Area

The study area is China, located in the northern temperate zone, with a diverse and complex natural climate and significant social variability, providing optimal conditions for pine growth and PWD occurrence. Pines occupy more than 23% of China’s forest area [29]. Climate-based habitat suitability studies suggest that the majority of regions in China provide favorable conditions for the survival of PWN [30]. Combined with the high adaptability of PWN, PWD has recently expanded beyond traditional habitat boundaries, meaning that areas in China with pine forests are likely at risk of PWD occurrence [31]. Under natural conditions, at least 17 tree species in China are susceptible to infection, with the primary hosts of PWN being Japanese red pine (P. densiflora), Japanese black pine (P. hunbergia), and Masson pine (P. massoniana) [7]. Research on PWD in China is characterized by the following features: (1) PWD spreads rapidly, significantly affecting tree survival; (2) China’s vast territory allows for the study of long-distance dispersal; and (3) PWD has been spreading in China for a sufficient duration.

2.2. Study Method and Model

This study employs neighborhood analysis to identify the spread patterns of PWD in affected areas. Using SaTScan [11] spatiotemporal scanning and mathematical statistical methods, the research analyzes the different spread methods and spatiotemporal distribution characteristics of PWD. The 40-year spread of PWD in China is divided into two parts: leapfrogging spread and continuous spread. Due to the differences in transmission methods, distances, and related influencing factors between the two spread processes, this study constructs two models to describe these processes. Below is the research pathway (Figure 1).

2.2.1. SaTScan Model

The SaTScan spatiotemporal scanning method is widely used for cluster detection and early warning in epidemiology [32]. It effectively reduces the subjectivity of cluster analysis by examining disease occurrence and clustering from both temporal and spatial dimensions. This study utilizes SaTScanTM v9.5 software with a discrete Poisson model to analyze the spatiotemporal patterns of PWD distribution. During the scanning process, a scan statistic based on the log-likelihood ratio (LLR) is calculated, reflecting the difference in area within and outside the scanning window. In the results, the scanning window with the highest LLR value is considered a cluster area, and other statistically significant scanning windows are also identified as cluster areas. The LLR formula is as follows:
L L R = log s E s S S s S E s S s I ·
Here, s represents the actual infection within the scanning window; S s denotes infection outside the window; E s is the expected infection within the window under the null hypothesis, adjusted by containment correction; S E s represents the theoretical infection outside the window, and I · is an indicator function.

2.2.2. Leapfrogging Spreading Process

(1)
Driving Factors
Based on the long-distance spread process and principles of PWD, the leapfrogging spread process considers 12 driving factors from three perspectives: the source of spread, pathway, and introduction event. The factors required for model construction are listed in Table 1.
(2)
Random Forest model
Random Forest (RF), first introduced by Breiman in 2001 [33], is a widely utilized machine learning approach comprising numerous classification and regression trees [34]. A major benefit of RF models for prediction modeling is the ability to handle datasets with a large number of predictor variables. This classifier has become popular in fields such as data mining, remote sensing, and bioinformatics research. The RF model employs the bootstrap resampling technique to extract multiple samples from the original dataset as training sets, thereby enhancing diversity among decision trees. The model constructs a decision tree for each bootstrap sample. After k rounds of training, a sequence of classification models { h 1 x , h 2 x ,…… h k x } is obtained. These models are then integrated into a classification system, where the final prediction is determined through a voting mechanism. The final classification decision formula is as follows:
H x = a r g max Y i = 1 k I h i x = Y
In this context, H x represents the combined classification model, where h i denotes the classification model of an individual decision tree, Y represents the output variable, and I ·   is the indicator function.
This study applies the RF model to construct a leapfrogging spread model for PWD. County-level historical occurrence data over 40 years serve as the dependent variable input, with disease presence marked as 0 (absent) and 1 (present). Based on the biological characteristics of PWD and its transmission patterns in China, the factors listed in Table 1 are selected as leapfrogging variables for the construction of the Random Forest model.

2.2.3. Continuous Spreading Process

Infectious disease models, commonly used in epidemiology to describe the spread of infectious diseases within a population, can be categorized into SI, SIS, SIR, SIRS, and SEIR models based on specific disease characteristics [35]. In these models, S (Susceptible) represents individuals at risk of infection upon contact with an infected individual; E (Exposed) refers to those who have been exposed but are not yet infectious, used for diseases with a latent period; I (Infectious) denotes individuals who can transmit the disease to S; and R (Recovered) represents individuals who have recovered and are immune to reinfection. Infectious disease models, when combined with remote sensing and geographic information system (GIS) technologies, have found applications across multiple fields, including geography and biology [36,37].
Considering that PWD at the county level lacks a latent period and that areas where PWD has been eradicated may still experience recurrent outbreaks, this study employs the SIS model to simulate the continuous spread of PWD. The SIS model describes the dynamic process between S and I counties. Counties with host distribution are classified as S, while infected counties are classified as I. Counties can transition from a susceptible state to an infected state and revert to a susceptible state upon recovery. In the equations, β and γ represent the infection rate and recovery rate, respectively. Here, S represents the proportion of susceptible counties at time t, I represents the proportion of infected counties at time t, β is the transmission rate, and γ is the recovery rate. The model equation is as follows:
d S d t = β · S · I γ · I
This study uses the initial transmission rate and recovery rate from the early stage of PWD spread, during which only continuous spread occurs, as substitutes for the overall effect of fixed influencing factors such as habitat suitability for PWD, the distribution of vector insects, host pine susceptibility, and landscape connectivity. These factors are challenging to capture at the county level, while transmission and recovery rates can reflect their aggregate effect regionally. Additionally, as continuous spread is a complex process involving multiple coupled factors, analyzing the initial stage before leapfrogging spread occurs can mitigate the impact of human factors on the spread rate. The least squares method is used to calculate the transmission rate and recovery rate, which serve as parameter inputs for the model. Here, I d a t a i represents the actual infection status of unit i , and I m o d e l i , β , γ represents the infection status of unit i calculated based on the given β and γ . The defined least square objective function L β , γ is as follows:
L β , γ = t = 0 N I d a t a i I m o d e l i , β , γ 2
In the SIS model, contact between S and I units during the continuous spread process depends on the adjacency relationships between counties, and a spatial adjacency matrix is constructed based on these relationships.
A i j = 1 D E M Resistance · H o s t R e s i s t a n c e   if   i j   and   i   is   adjacent   to   j   0   if   i = j   and   i   is   notadjacent   to   j
Due to significant variations in elevation and forest cover across regions, these factors create important barriers in the spread process. In adjacency calculations, the elevation barrier threshold is set at 700 m [3]. When elevation is below 700 m, no barrier effect is applied; above 700 m, the barrier effect intensifies with increasing elevation. Vegetation distribution also considers urban vegetation cover; forest distribution is extracted from land use data. When the forest cover rate of a county unit exceeds 30%, no barrier effect is applied, while below 30%, the barrier effect increases as the vegetation area decreases. These factors are used to adjust the adjacency matrix for input into the model.

2.3. Data Source

2.3.1. PWD Data

County-level historical survey data on PWD are provided by the Forest and Grassland Pest Control Station under the Center for Biological Disaster Prevention and Control, National Forestry and Grassland Administration (NFGA). The historical records of PWD in China consist of the names of affected counties, the time of outbreak, and the time of eradication. Epidemic areas are managed at the county level, with local forestry bureaus conducting disaster surveys, implementing control measures, and assessing the impact of the disaster. The dataset documents the annual occurrence of PWD in counties across China over a continuous 40-year period from 1982 to 2022. Affected counties are coded as 1, while unaffected counties are coded as 0. These data are collected annually during autumn and spring surveys conducted by local and county-level forestry bureaus, verified by the Quarantine Office of the Forest and Grassland Pest Control Station, and published annually in the NFGA Bulletin (https://www.forestry.gov.cn/ (accessed on 23 October 2023)).

2.3.2. Host Data

The distribution of host pine trees is a necessary condition for the occurrence of PWD. This study uses counties in China as the research unit, requiring each unit to be marked for the presence or absence of host pine tree distribution. Currently, long-term pine tree distribution data from 1982 to 2022 are unavailable. To address this, forest distribution data were used as a substitute because pine trees are widely distributed across China, and this study is conducted at the county level, where the specific locations of pine forests are not required. Therefore, time-series forest distribution data were utilized to mark the presence of host trees. The study employed the China National Land Use and Land Cover Dataset (CNLUCC) (http://www.resdc.cn/), which has a spatial resolution of 30 m, and the overall accuracy is 85.72%. The land use types in this dataset include six categories: arable land, forest land, grassland, water bodies, built-up land, and unused land. Based on the temporal stages of PWD occurrence in China, forest land was extracted as the land use type from the dataset, and the forest area was aggregated to the county level. The average values were calculated according to the disaster occurrence time stages. Counties with forest coverage were assigned a value of 1, while counties without forest coverage were assigned a value of 0 based on the forest distribution data.

2.3.3. Other Data

The data sources for the factors of PWD used in this study are listed in Table 2. The following data meet the requirements for studying 40 years of PWD. Temporal raster data are averaged over specific time periods based on the stages of the disease outbreak, while vector data are aggregated at the county level for model construction.

3. Results

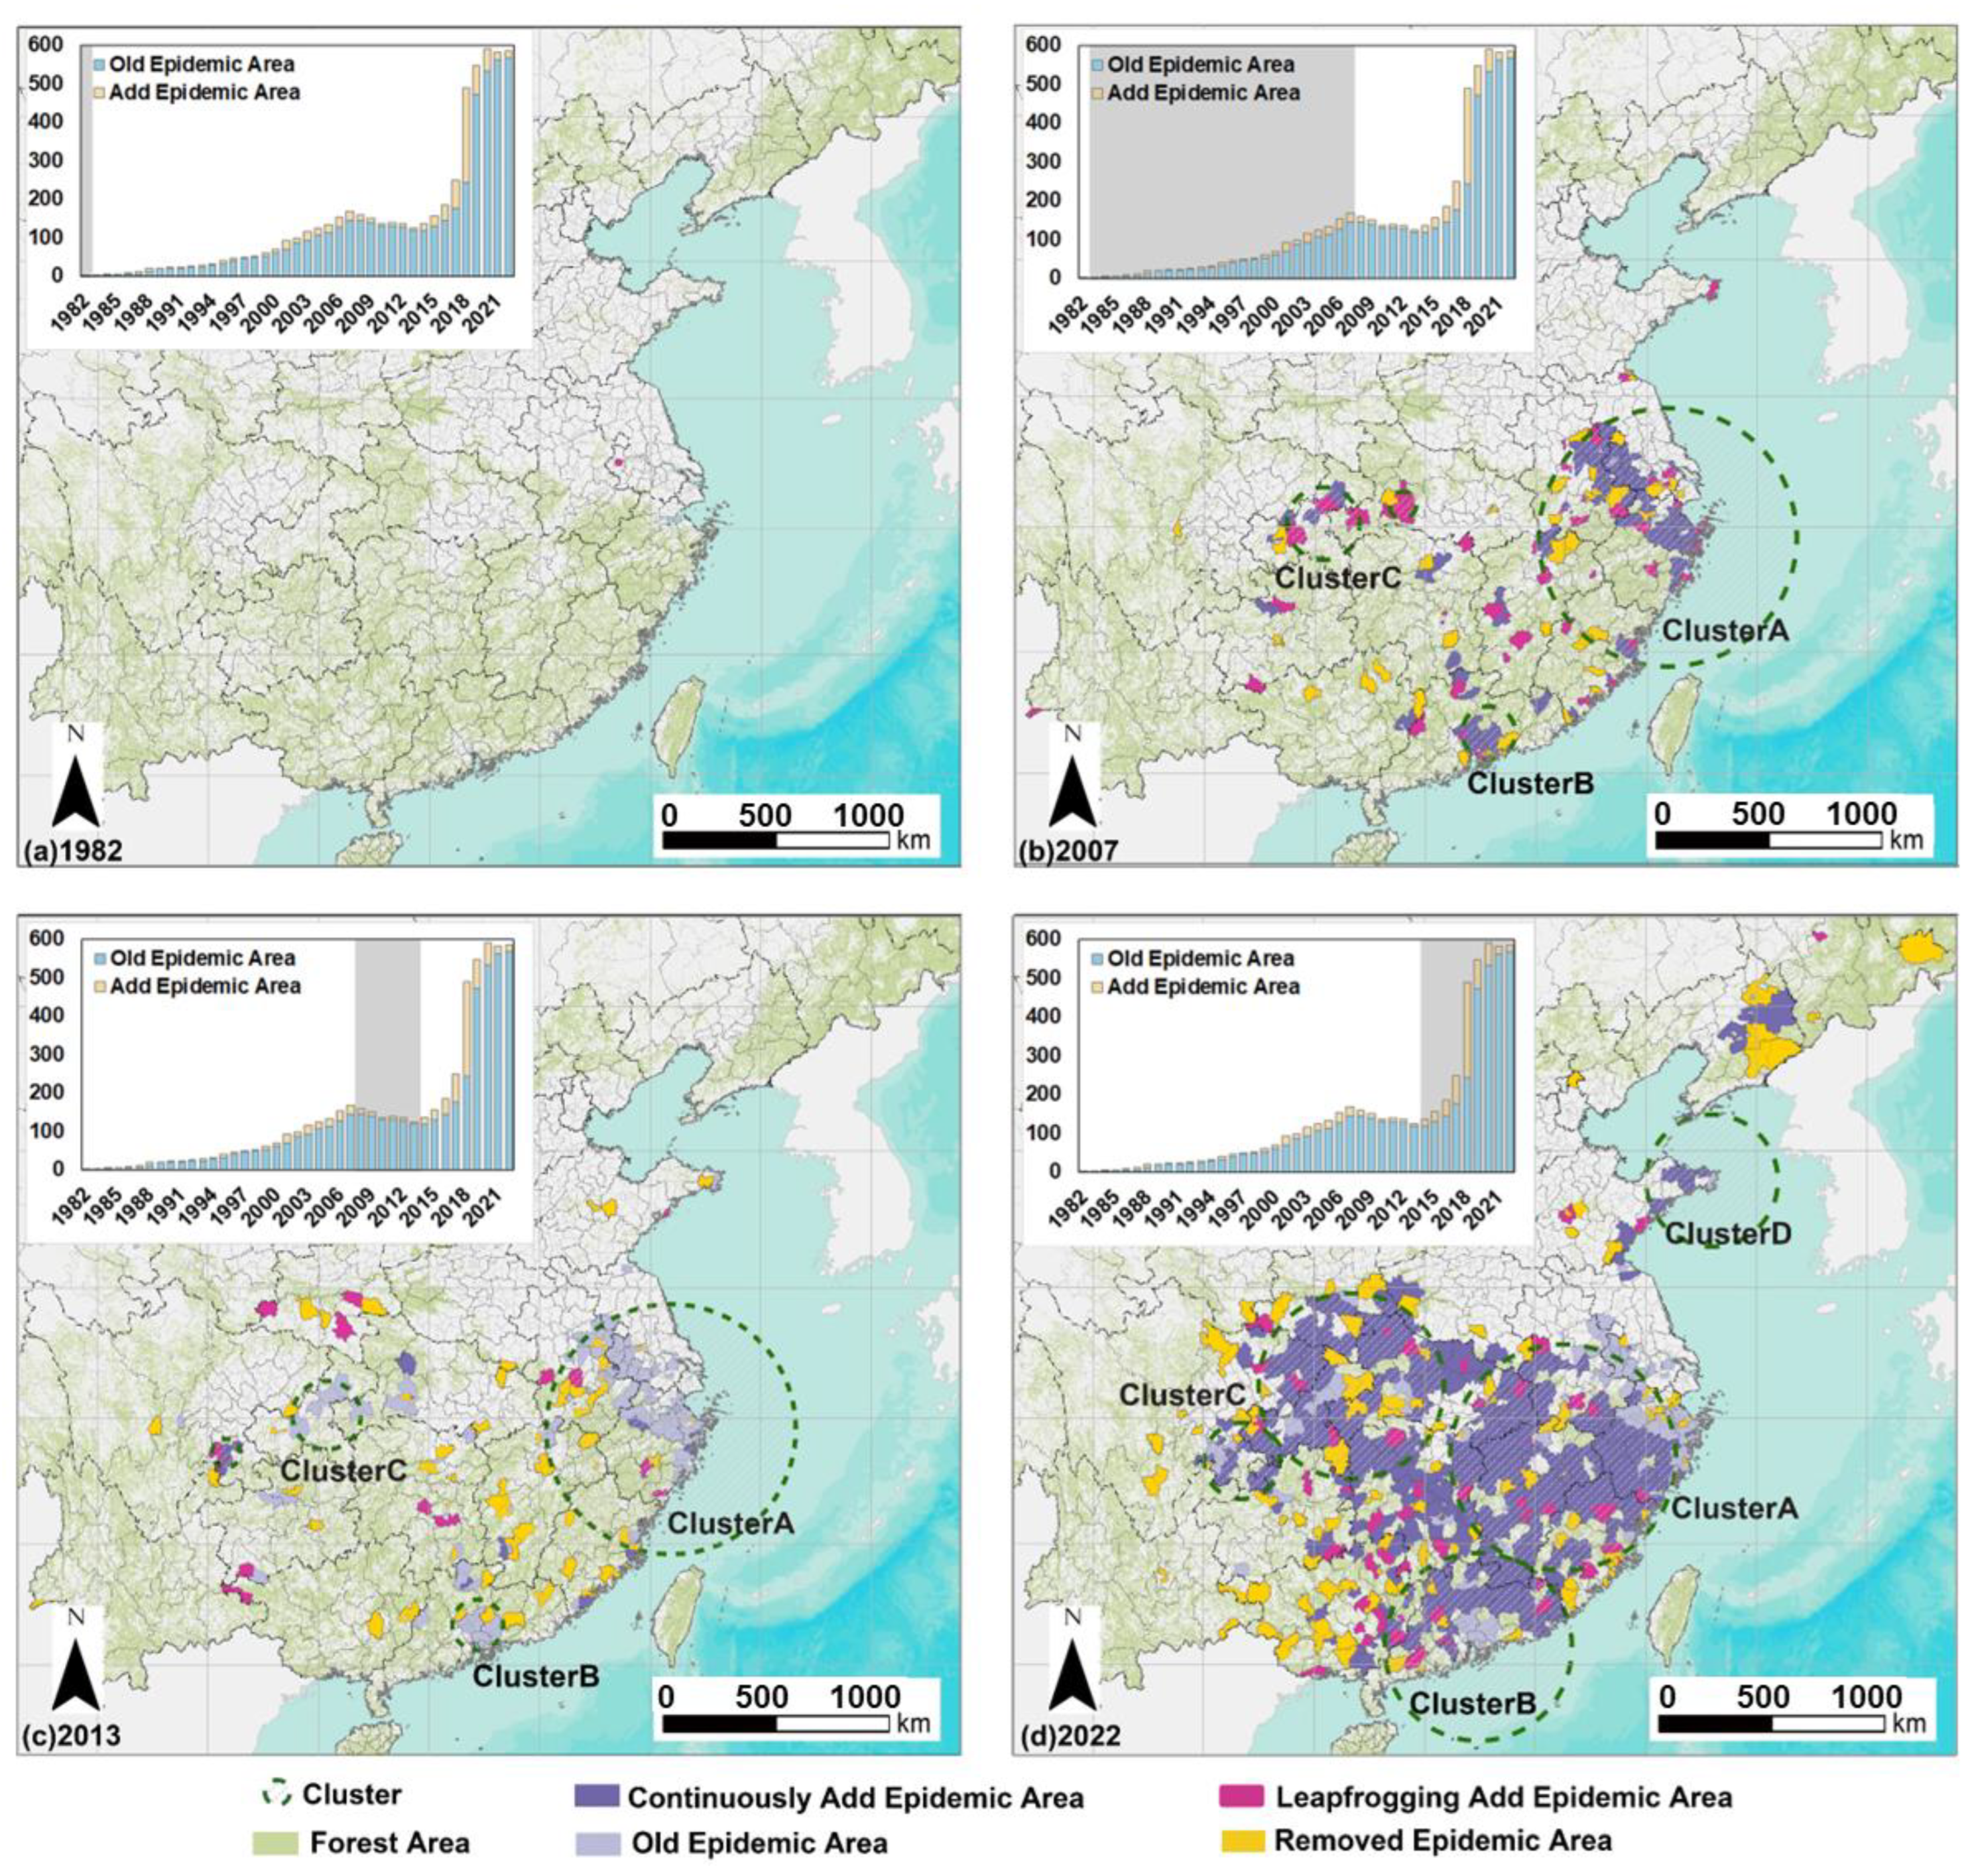
3.1. Spatiotemporal Pattern of PWD in China from 1982 to 2022

Based on the annual statistics of affected counties, the spread of PWD from 1982 to 2022 can be divided into three distinct phases. The spatiotemporal patterns of PWD across the three phases are shown in Figure 2. The period from 1982 to 2007 corresponds to the introduction phase, during which the number of affected counties gradually increased. The period from 2008 to 2013 represents a control phase, where the number of newly affected areas decreased. The period from 2014 to 2022 represents the rapid expansion phase, with the epidemic spreading quickly across China. From the bar chart obtained through statistical analysis, it can be observed that the expansion of PWD in China primarily occurred during stage 1 and stage 3. The spread of PWD during these two stages exhibited a diffusion pattern in space, spreading from points to areas. And the spread rate increased sharply in stage 3. These processes ultimately led to the formation of four significant clusters nationwide.
In stage 1 (1982–2007), PWD first appeared in 1982. By 2007, 214 new infected areas were identified, including 88 areas affected by leapfrogging spread and 126 by continuous spread. Consequently, three initial clusters formed in China: Cluster A (LLR = 97.352109; radius = 450.705711) in the border area of the Jiangsu, Anhui, and Zhejiang provinces; Cluster B (LLR = 22.075629; radius = 98.070563) centered in Shenzhen, Guangdong province; and Cluster C (LLR = 6.850824; radius = 126.38512) in Chongqing. In stage 2 (2008–2013), the spread of PWD in China was initially controlled, with 55 new infected areas identified, including 24 new areas affected by leapfrogging spread and 31 by continuous spread. The growth rate of infected areas slowed, and many areas were eradicated, especially in the Jiangxi, Fujian, and Guangdong provinces. The radii of the three clusters did not change significantly as seen in the following values: Cluster A (LLR = 85.768651; radius = 436.014769), Cluster B (LLR = 23.960466; radius = 93.691456), and Cluster C (LLR = 7.201875; radius = 118.795913). In stage 3 (2014–2022), PWD rapidly expanded in China, with 572 new infected areas identified, including 96 new areas affected by leapfrogging spread and 476 by continuous spread. Numerous infected areas appeared south of the Yangtze River, spreading northwards and connecting existing clusters. The three clusters merged, with Cluster A (LLR = 121.39248; radius = 397.881458) shifting inland (southwest), and Clusters B (LLR = 37.85685; radius = 347.55474) and C (LLR = 45.408385; radius = 319.678954) rapidly increasing in radius. A new cluster formed in the coastal area of Shandong province (Cluster D; LLR = 8.535063 and radius = 211.195276).

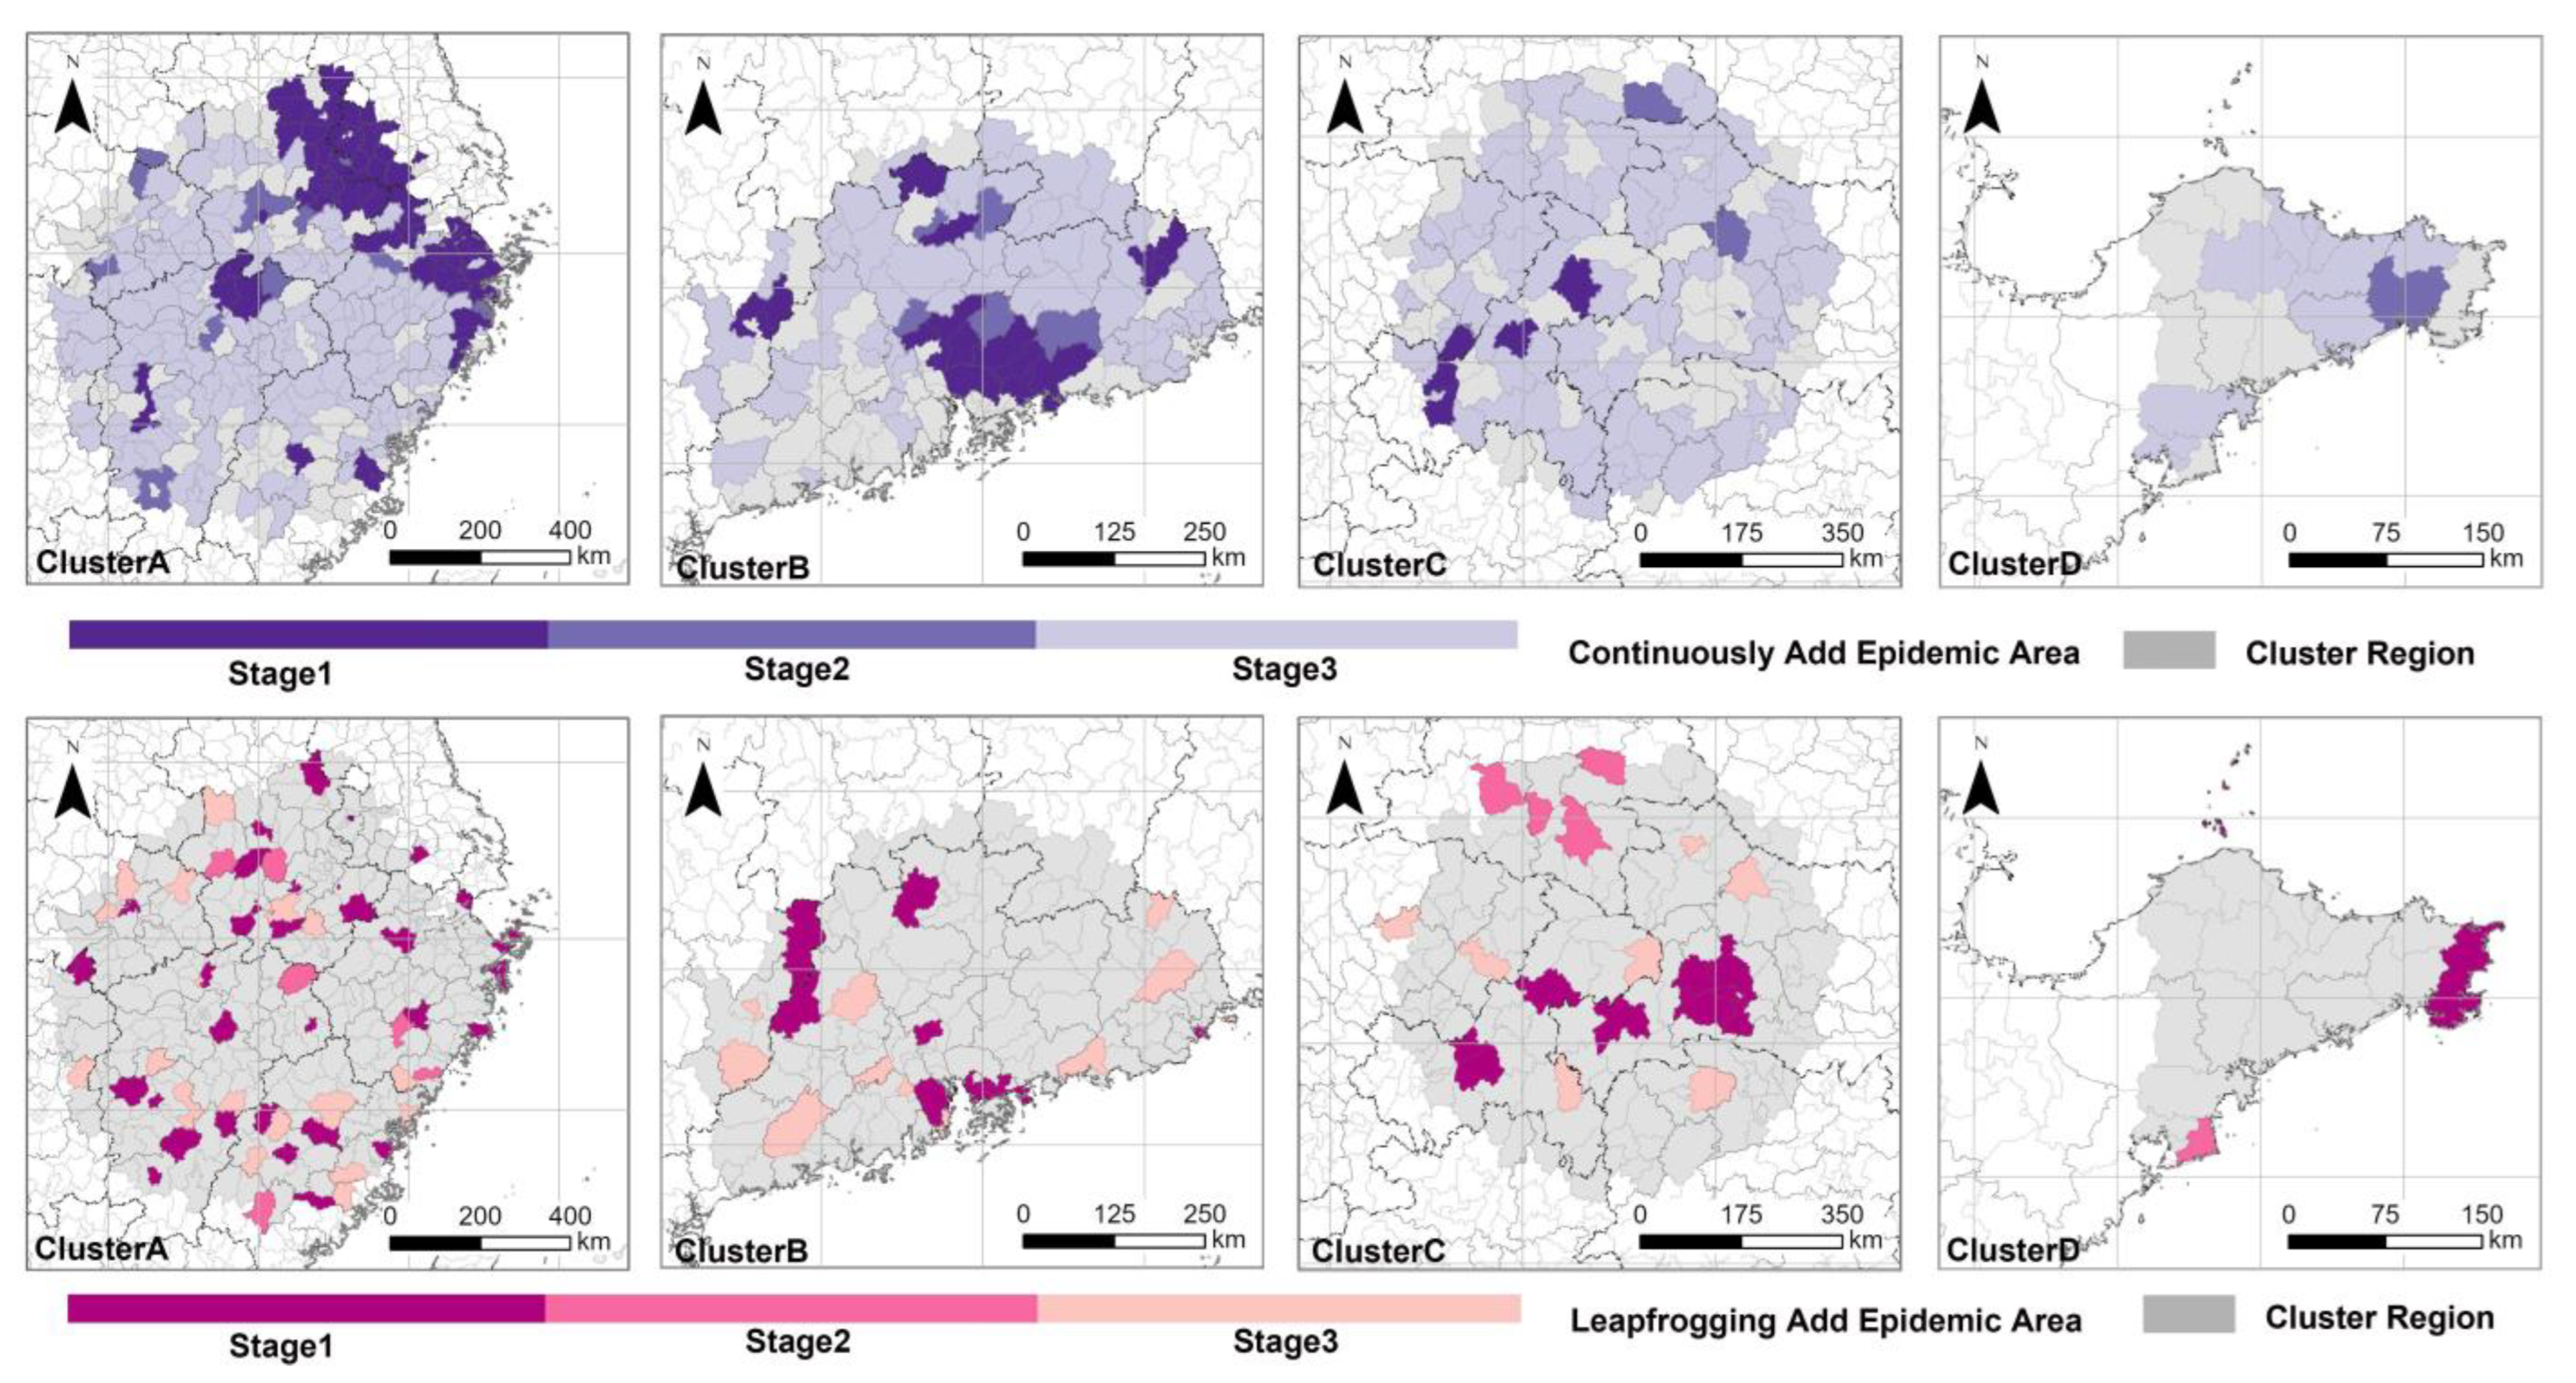
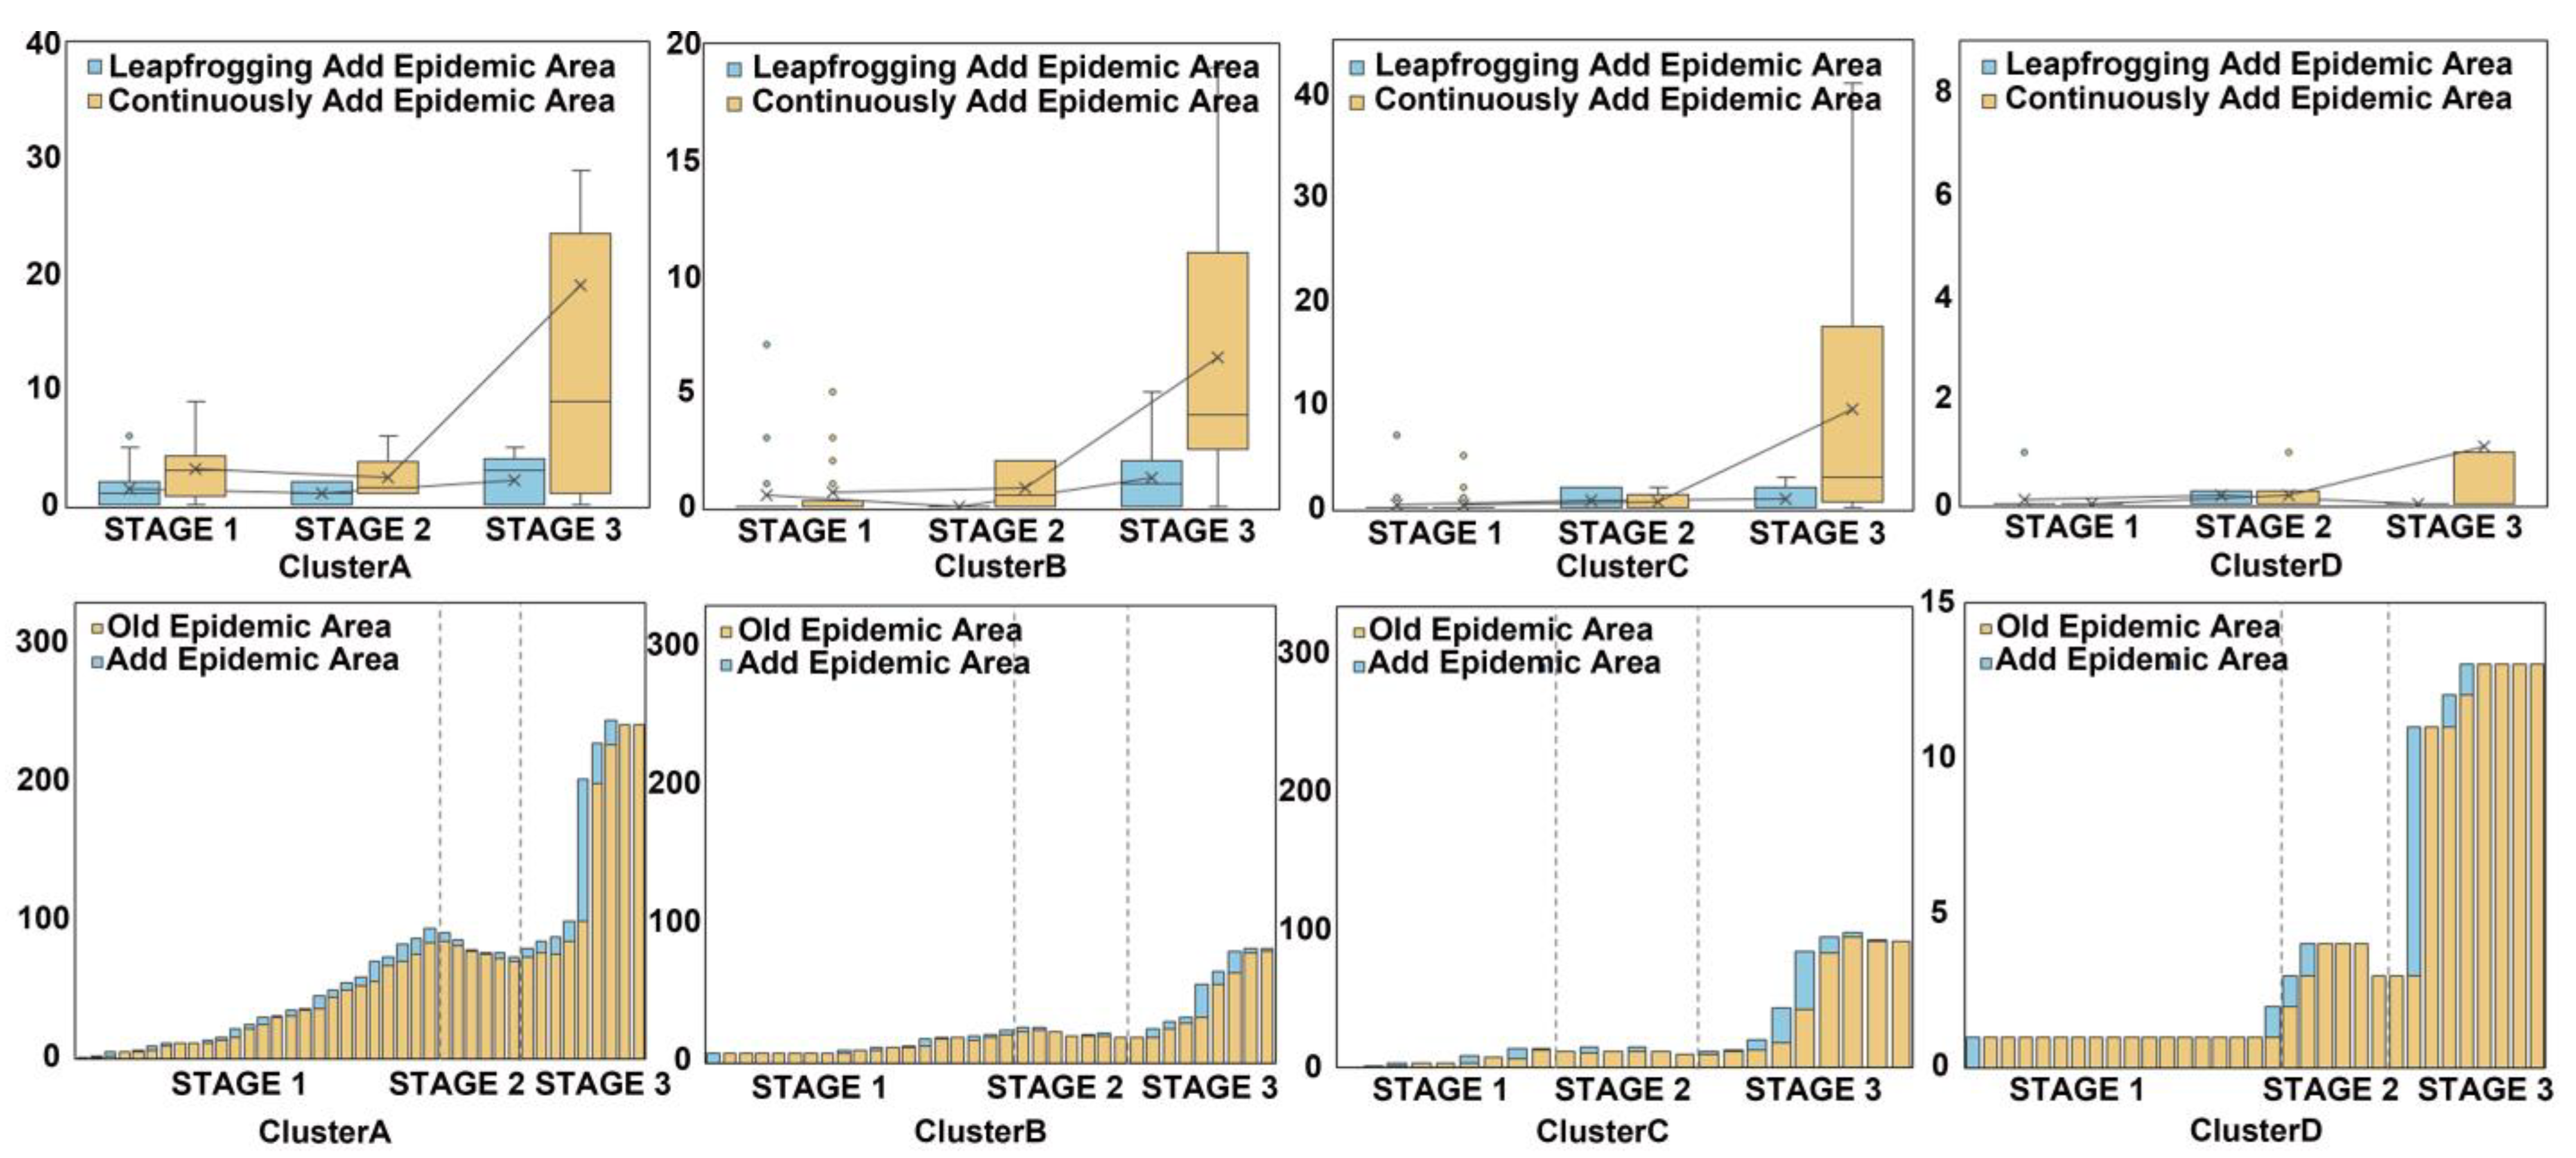
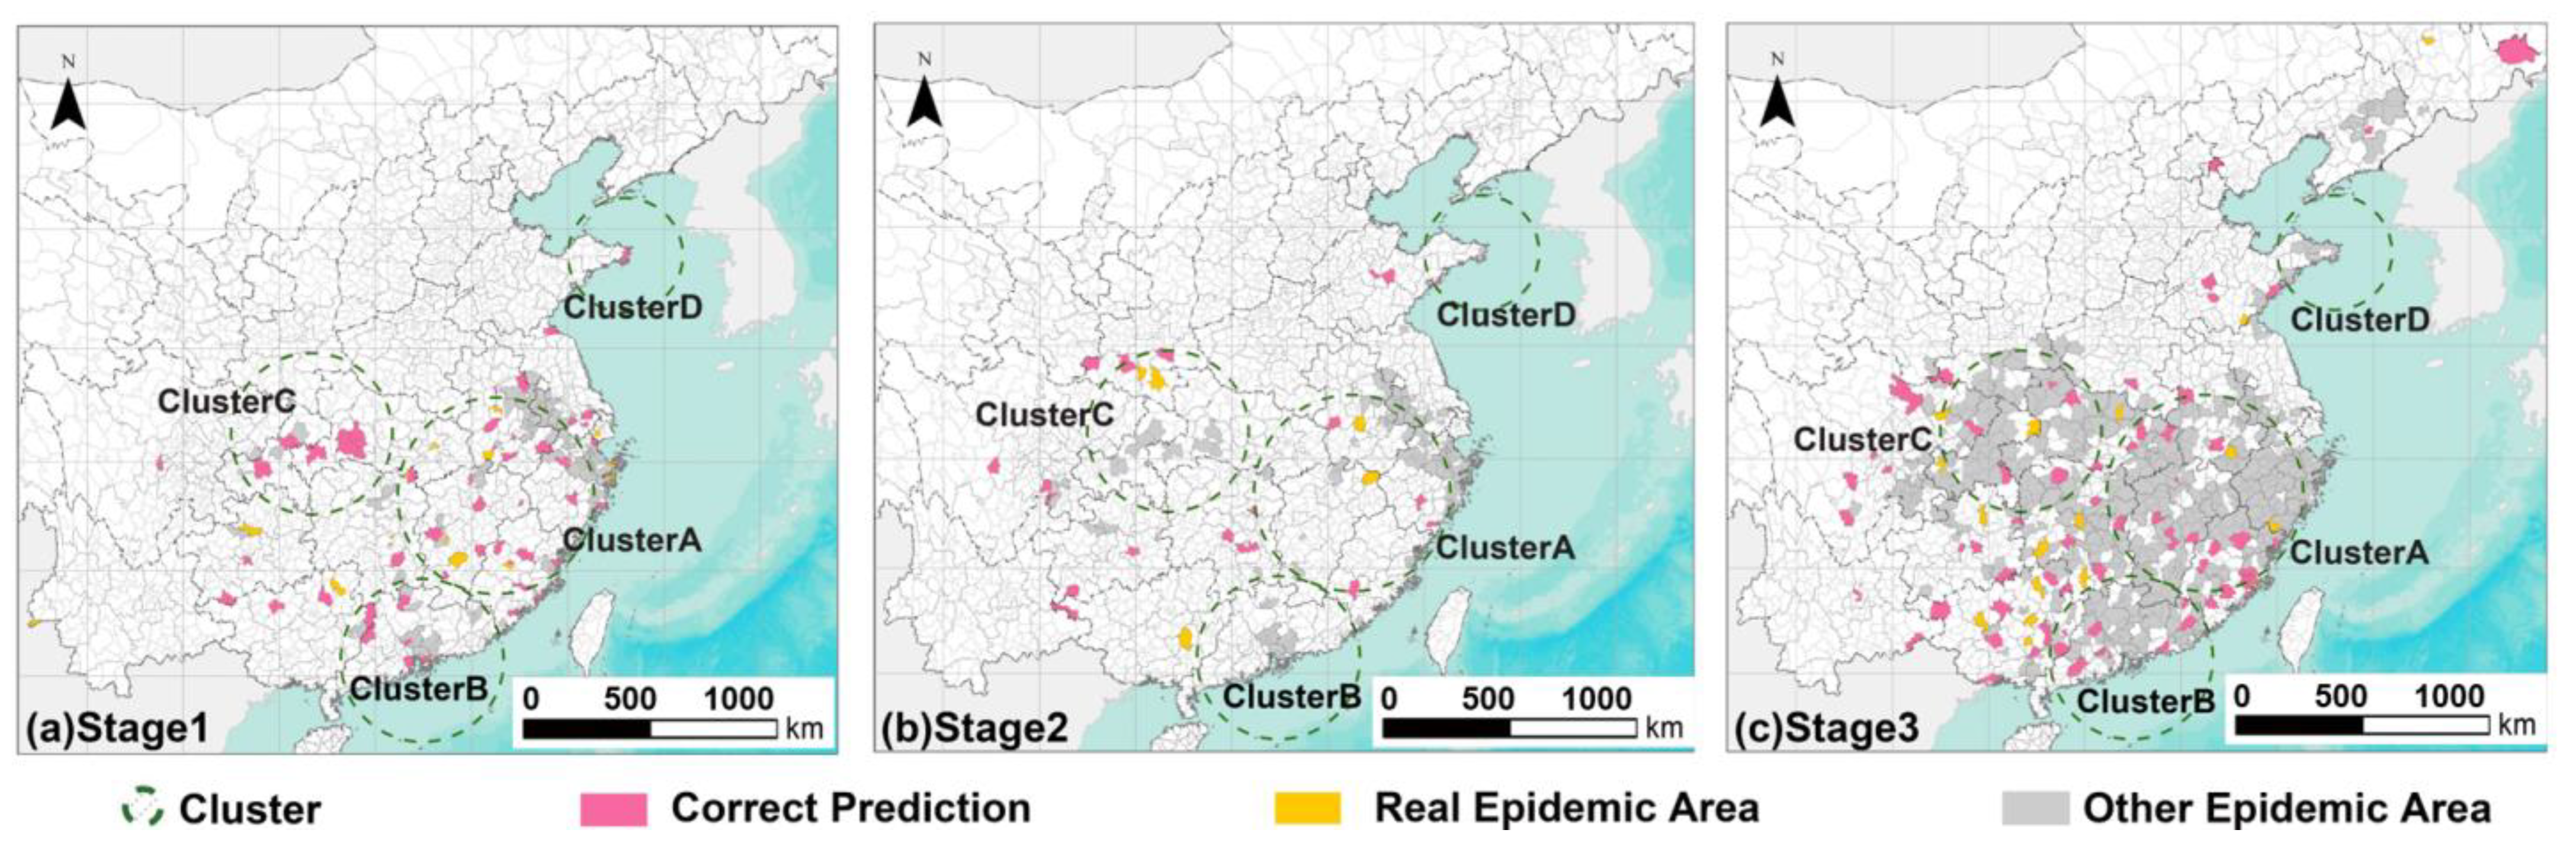
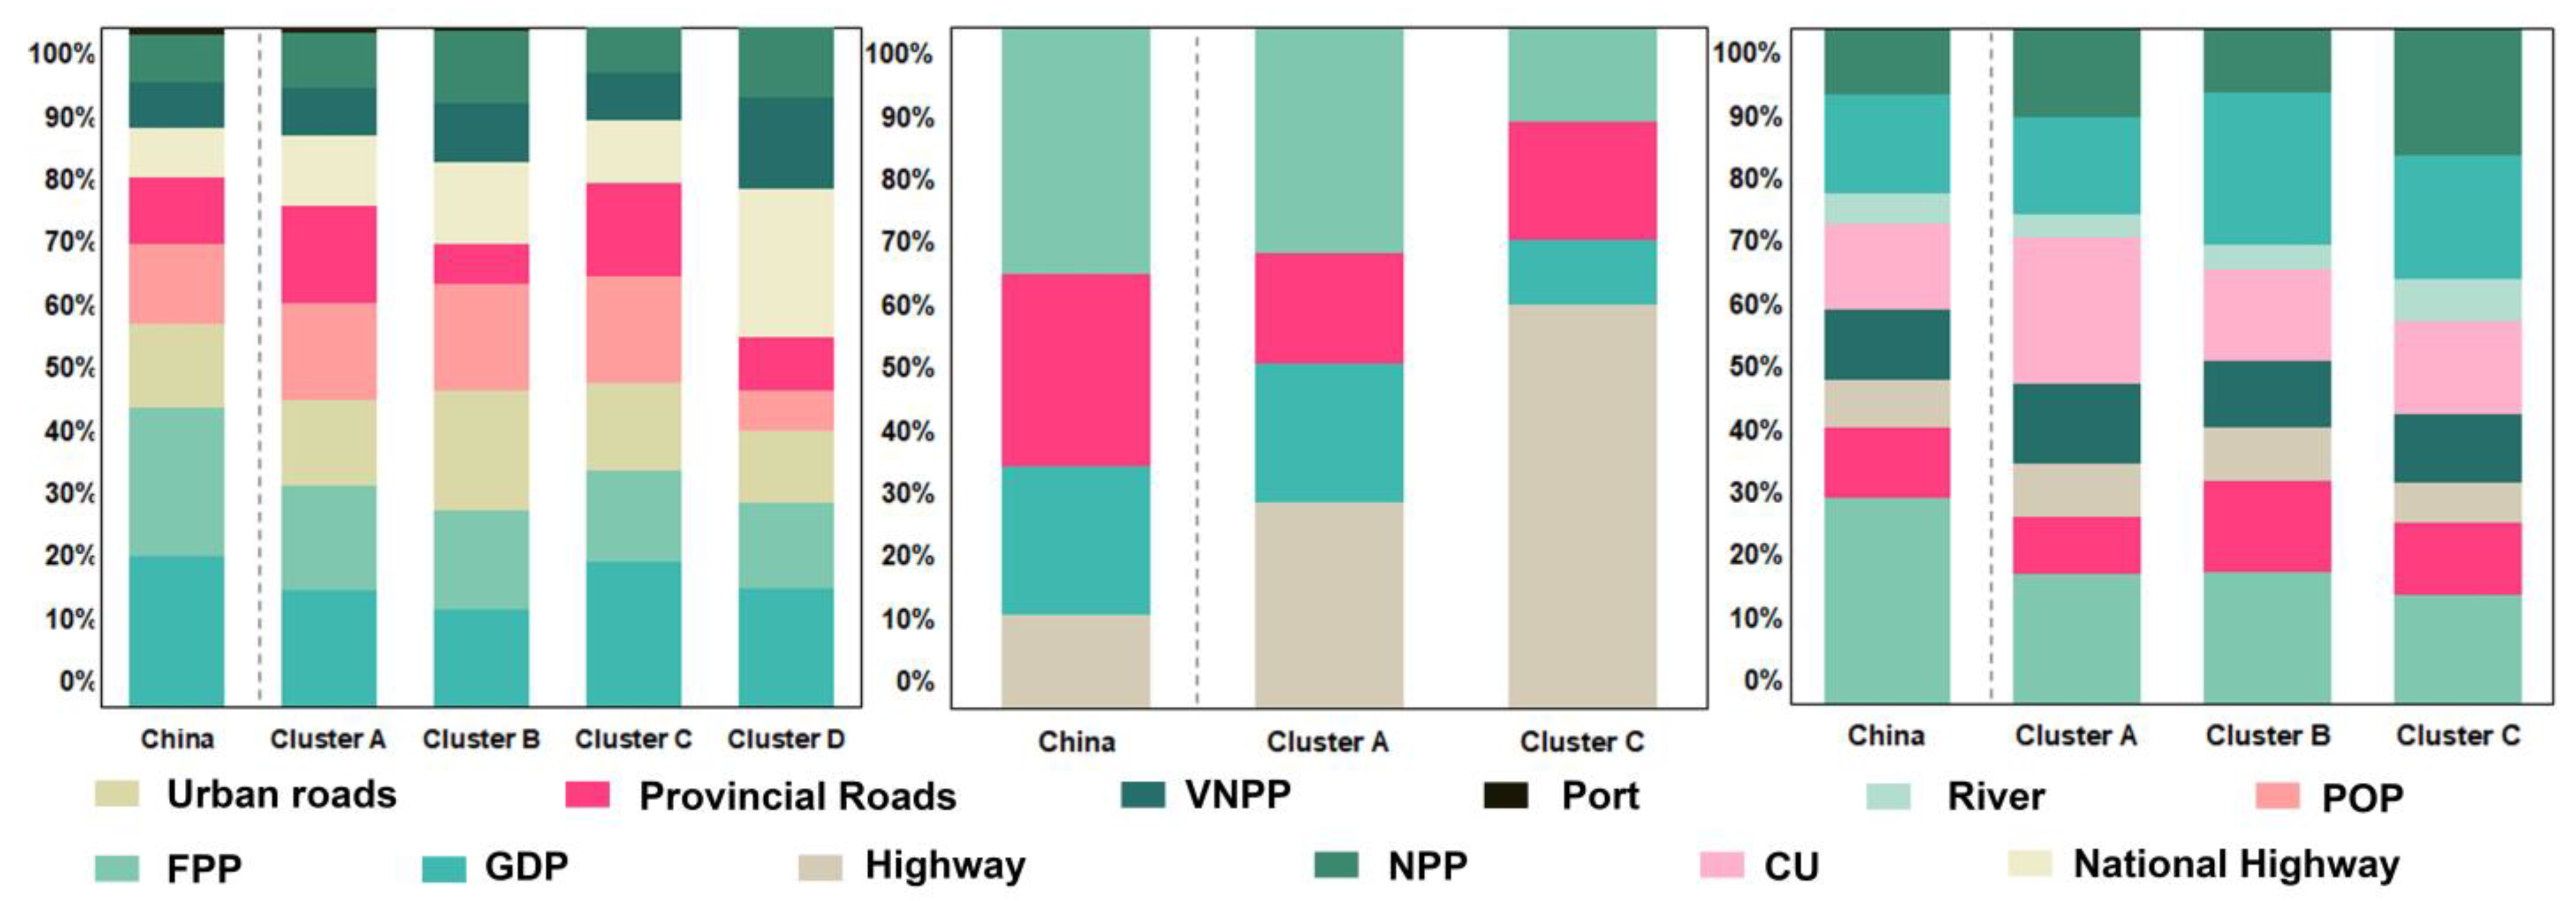
3.2. Spatiotemporal Pattern of PWD in Four Primary Clusters

From the results in Section 3.1, it is evident that the 40-year spread of PWD in China has resulted in the formation of four major clusters. Considering the regional characteristics of PWD spread, this section further explores the formation process of the current spatiotemporal patterns of PWD in the four regions over three stages (Figure 3 and Figure 4). The results show that both continuous and leapfrogging spread of PWD exhibit regional characteristics with different rates and directions in each region. The overall growth trend of infected areas shows that the growth trends in Clusters A, B, and C are consistent with the national trend. The number of infected areas in Cluster D gradually increased across the three stages.
The number of new leapfrogging spread infected areas varied across different clusters and time stages, showing no clear pattern in spread rate. Clusters A and C did not exhibit a clear directionality, with new infected areas being evenly distributed. In Cluster B, however, there was a distinct directional spread, mostly concentrated in the eastern part of the cluster. In terms of time, most continuous new infections in Clusters A and B occurred during the first and third stages. Cluster D had fewer areas infected by leapfrogging spread, appearing mainly in the first and second stages. For continuous new infections, Clusters A and B, with long histories of infection, saw more continuous new areas in the first stage than in the second stage. In the first stage, Cluster A expanded significantly towards the coastal region of Zhejiang province. Cluster B saw the spread of infections from Shenzhen to Huizhou, Shenzhen city, and Guangzhou city, with multiple continuous new areas also appearing in Shaoguan city and Meizhou city. Clusters C and D experienced a continuous increase in new infected areas over time, with significant spread occurring in the later stages. In the second stage, all four regions had a few continuous new areas, mostly in regions with many continuous new infections from the first stage. The number of infected areas in all four clusters exploded in the third stage, with almost all counties within the clusters becoming infected areas.

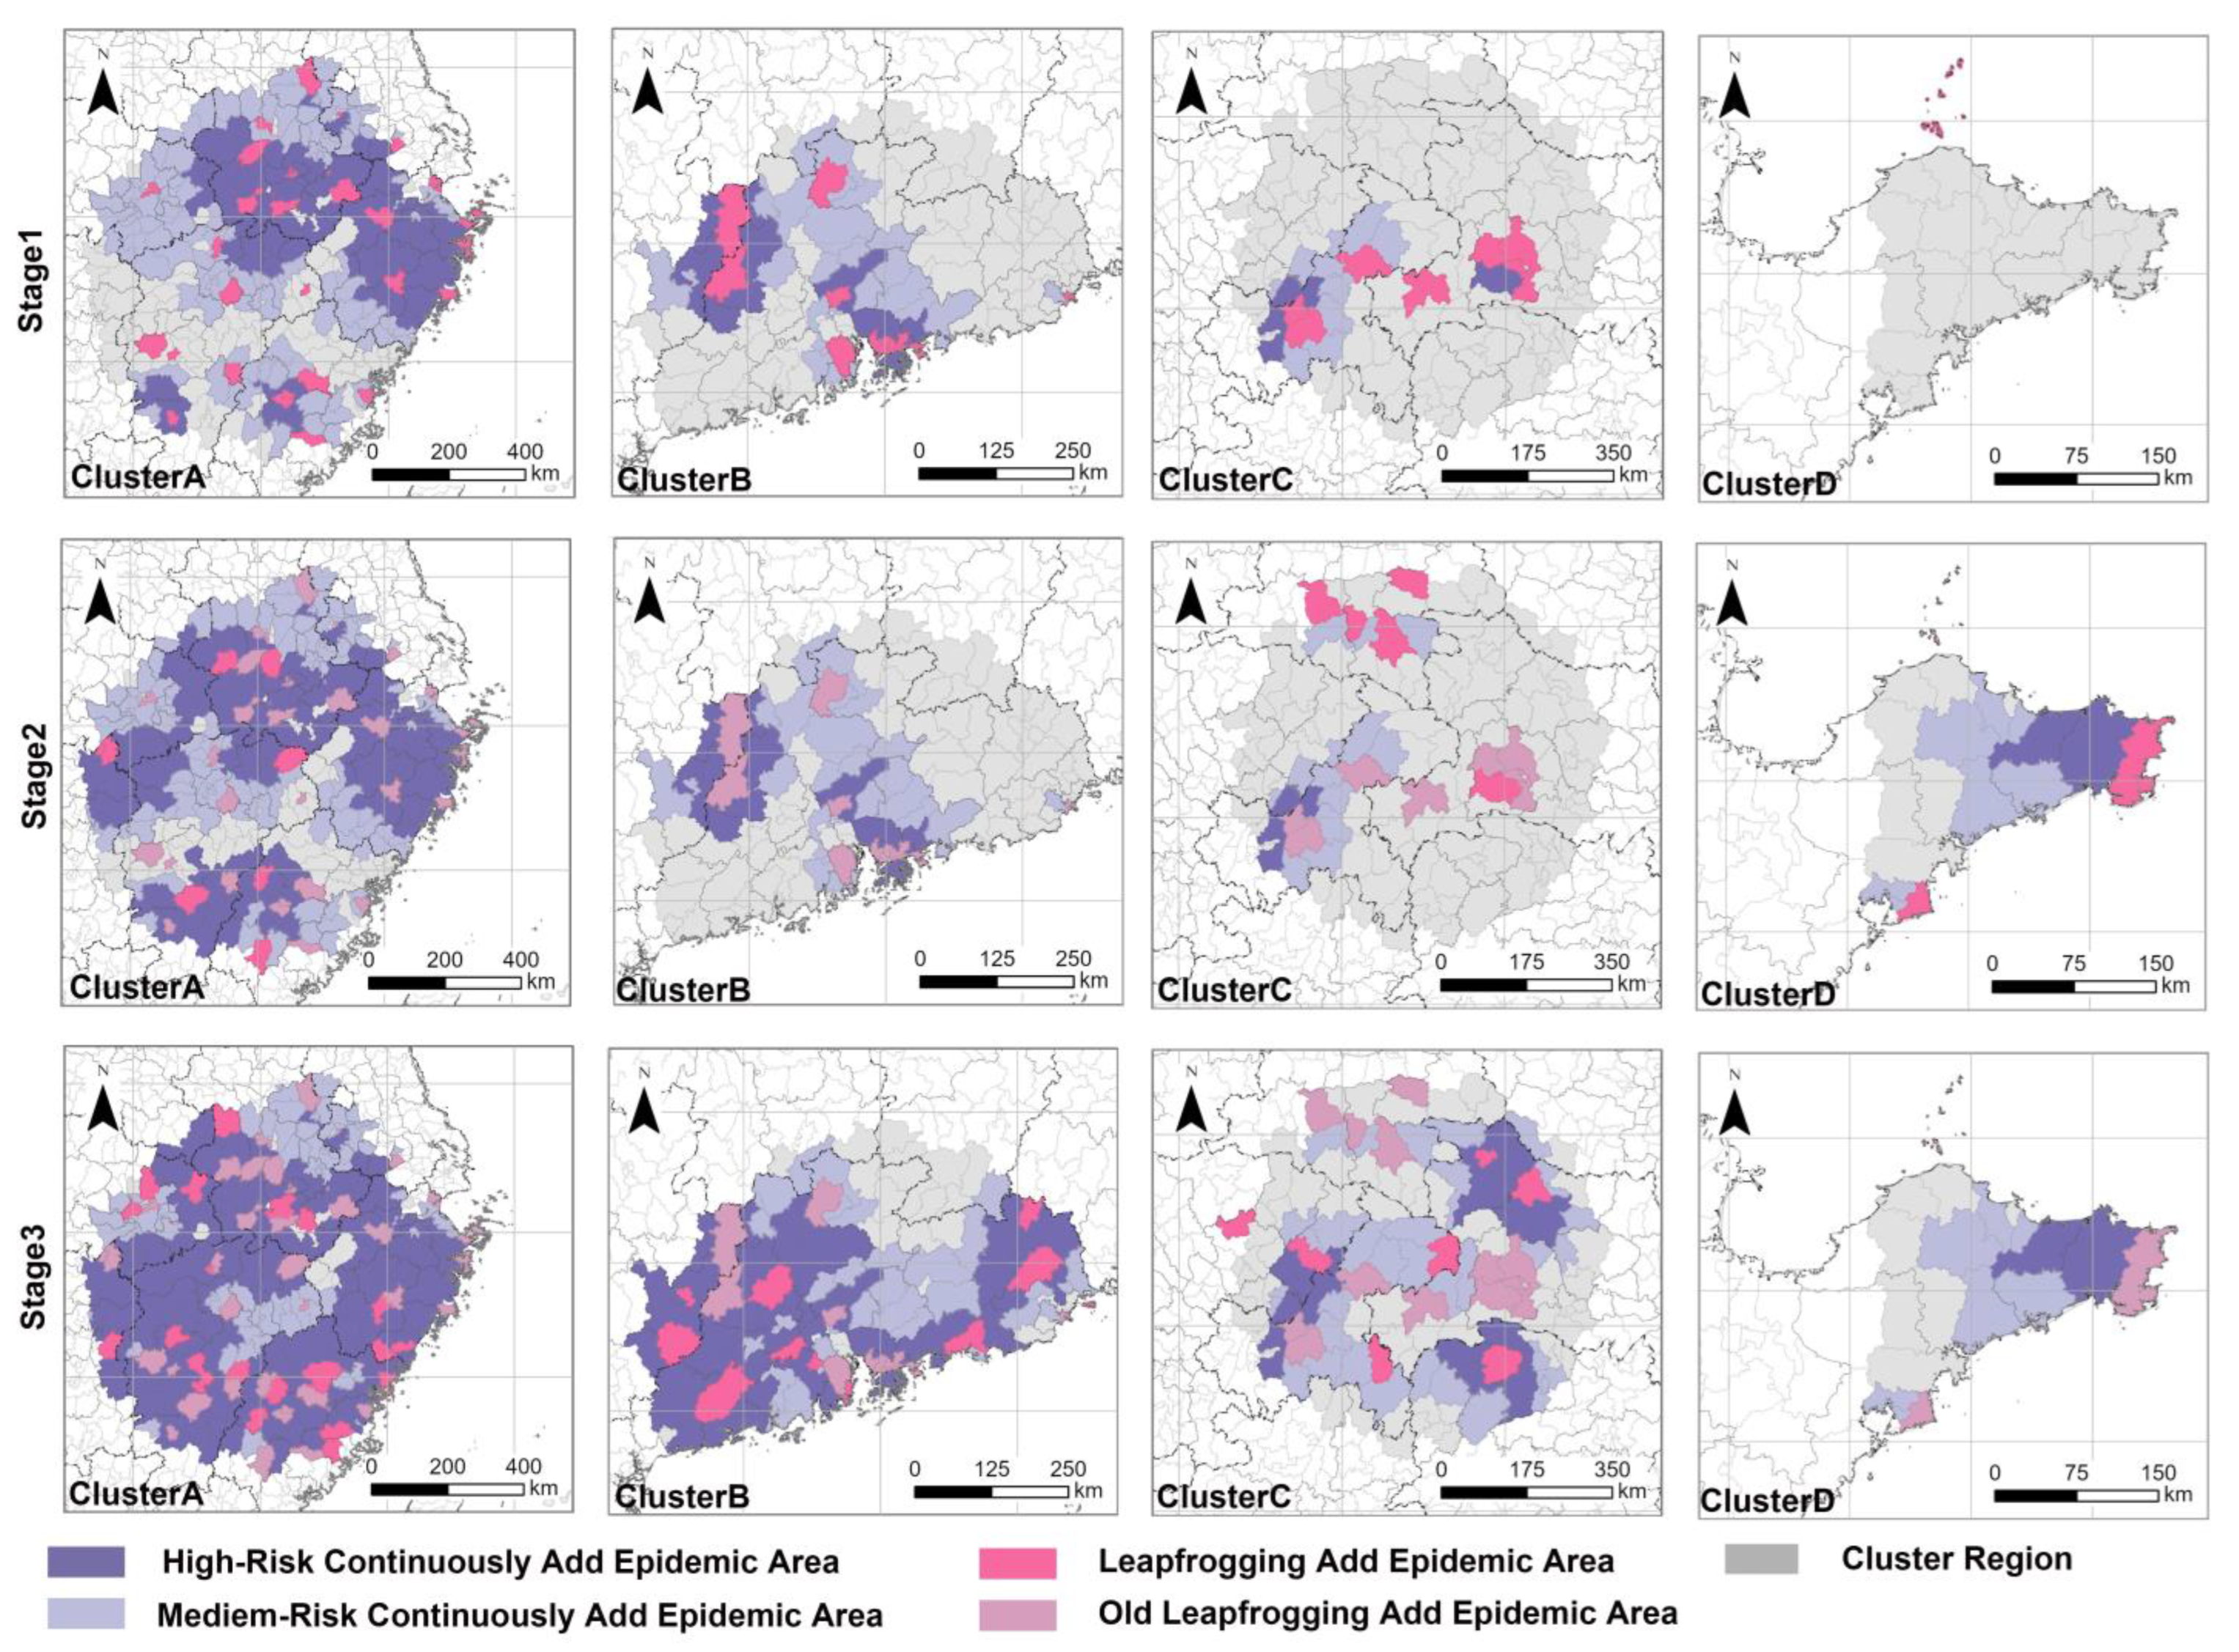
3.3. A Simulation of the Formation Process of the Leapfrogging Spreading Process

The results of the t-test are presented in Table 3. In the first stage, significant differences were observed in port cities, areas with high population mobility, and GDP. Among them, VNPP, NPP, FPP, POP, GDP, CU, road network, and Port (a total of 10 factors) showed significant differences between leapfrog epidemic plots and non-leapfrog newly affected epidemic plots. In the second stage, FPP, GDP, highways, and provincial roads were significantly different between leapfrog epidemic plots and non-leapfrog epidemic plots. In the third stage, PWD was more likely to occur in areas with changes in construction land area. VNPP, NPP, FPP, GDP, CU, rivers, highways, and provincial roads (a total of eight factors) showed significant differences between leapfrog newly affected epidemic plots and non-leapfrog newly affected epidemic plots.
The factors selected using the t-test were utilized to construct an RF model. The RF model showed good results (Figure 5) in the leapfrogging spread process, with an overall accuracy greater than 0.95 and a recall rate of 1. The contribution rate of each factor in the model is shown in Figure 6. In the first stage, the model had an overall accuracy of 0.96, a precision of 0.96, and a recall rate of 1. The driving factors with the highest contribution rates (>10%) were FPP (17.7%), POP (15.7%), GDP (14.7%), urban roads (11.5%), and provincial roads (10.9%). The importance of driving factors varied among the four clusters. In Clusters A and C, leap-type spread was more influenced by economic level and roads. In Cluster B, the distribution of road networks played a significant role, while in Cluster D, road networks and the distribution and changes in wood processing plants were more influential. In the second stage, the overall accuracy was 0.98, the precision was 0.99, and the recall rate was 1. Among the four driving factors, FPP, provincial roads, and GDP each had a contribution rate greater than 20%, with FPP contributing as much as 36%. Since there were no new leap-type infections in Clusters B and D during this stage, only the contribution rates for Clusters A and C were calculated. In Cluster A, FPP and highways had the highest contribution rates, while in Cluster C, highways contributed more than 50%. In the third stage, the model had an overall accuracy of 0.95, a precision of 0.95, and a recall rate of 1. Among the eight driving factors, FPP had a contribution rate of over 30%. Additionally, GDP, CU, VNPP, and provincial roads had high contribution rates, each greater than 10%. New leap-type infections appeared in Clusters A, B, and C during this stage. In Cluster A, CU and FPP had the highest contribution rates at 19% and 22%, respectively. In Cluster B, GDP and FPP were the most significant, with contribution rates of 22% and 19%. In Cluster C, NPP, GDP, and FPP had contribution rates of 18%, 18%, and 16%, respectively.

3.4. A Simulation of the Formation Process of the Continuous Spreading Process

After the epidemic enters an infected area through leapfrogging spread, it spreads to surrounding counties through continuous spread. The results obtained while considering the barrier effect of mountain ranges and urban forest density are shown in Figure 7.
Cluster A’s initial continuous spread period was from 1982 to 1988, with a spread rate of 0.49. This region showed many high-risk continuous new infections around the leap-type spread areas. Due to the high spread rate and minimal elevation and forest barriers, the epidemic rapidly spread around new leap-type infected areas in all three stages. Cluster B’s initial continuous spread period was from 1988 to 1998, with a spread rate of 0.06. In this cluster, new leap-type infections and subsequent spread occurred in both the first and third stages. The first stage had a low spread risk around Shaoguan city and Shenzhen city, but in the third stage, the barrier effect decreased, resulting in high-risk continuous spread around new infected areas. Cluster C’s initial continuous spread period was from 2001 to 2007 with a spread rate of 0.1. This region had a low spread rate. Although new leap-type infections and continuous spread occurred in all three stages, the spread rate was low, and the epidemic did not quickly spread to surrounding areas. However, in the third stage, the epidemic began to spread widely, resulting in high-risk infected areas. This spread trend aligns with the actual spread trend. Cluster D’s initial continuous spread period was from 2007 to 2015, with a spread rate of 0.85. The SIS model simulation results indicate that, by the second stage, the entire D region was at risk of infection, with the spread rate being faster than the actual spread.

4. Discussion

This study developed two models to address the continuous and leapfrog spread processes of PWD, effectively describing its dynamic spread in China. In the leapfrog spread process of PWD, a combination of t-tests and random forest models was utilized to effectively identify factors related to the disease’s spread. This model achieved high simulation accuracy on a national scale, enabling the assessment of future PWD risks in specific regions based on human activities. The human-driven leapfrog spread model demonstrated that different combinations of human-driven factors during the three stages of PWD spread could effectively explain the causes of long-distance introductions at different stages. At the regional scale, the SIS continuous spread model simulated the risk of PWD spread under uncontrolled conditions, providing a comprehensive representation of the continuous diffusion process. However, using vegetation coverage and altitude to simulate the continuous spread of PWD at the county level cannot accurately reflect its historical spread in China. This limitation arises from the complex nature of continuous spread at the county scale, which involves the coupling of natural factors and human-driven factors. Moreover, the intensity of human control measures varies significantly across regions. In infected areas and their surroundings, local governments often implement targeted control measures, making it difficult to disregard the impact of human interventions. The two models effectively describe the dynamic spread of PWD in China over the past 40 years and provide a comprehensive explanation of how the disease has occurred and spread.
The combined effects of human and natural factors have accelerated the northward and southwestward spread of PWD. The results show that the expansion of PWD in China mainly occurred in the first and third stages, ultimately forming four significant clusters. The first stage was characterized by gradual spread, while the third stage saw a full outbreak. The findings suggest that the epidemic introduction during the first stage (1982–2007) was closely related to socioeconomic factors, with varying spread rates after initial introductions. This characteristic was confirmed by the leapfrog spread observed in Zhoushan city and Ningbo city. As early as 2006, research indicated that Zhejiang province had a high potential risk of PWD due to its developed economy, convenient transportation, and frequent timber movement [11]. Following the initial outbreaks, the spread rate was higher in areas surrounding Jiangsu and Guangdong. Based on China’s natural environment and previous studies, it can be inferred that the continuous distribution of host trees was a key factor for the sustained spread of PWD in these regions. In Zhejiang, the widespread planting of highly susceptible Japanese black pine, especially in the coastal mountainous areas of Ningbo, Taizhou, and Wenzhou, has made it a high-risk area for PWD [38]. In Guangdong, with 2.45 million hectares of pine forests, 80.3% of which are Masson pine (a pioneer species for afforestation in the south), the high proportion of pure pine forests and low biodiversity reduce overall forest resilience. This led to the rapid spread and outbreak of PWD from the initial detection in Shenzhen to Huizhou, Dongguan, and Guangzhou [39]. The third stage (2014–2022) of the epidemic was closely linked to human activities. The results reveal that human-driven factors, such as populations active near forests, changes in construction land area, and variations in the number of timber processing plants, accounted for over 50% of the total contribution rate. With the rapid development of China’s telecommunications, power, and transportation sectors, the affected area increased dramatically from 2014 to 2022 [11,40]. These findings align with previous PWD studies. The survey results indicate that, in the overall human-mediated spread process, 37.66% is due to the transportation of infected pine wood, 41.56% is due to the inflow with goods packaging, 18.18% is due to the implementation of power grid renovation projects, and 2.6% is due to the transportation of optical cable reels during the installation of communication equipment (https://www.forestry.gov.cn/ (accessed on 4 October 2022)). Previous studies have shown that the large-scale interprovincial transfer of untreated or inadequately treated contaminated logs, timber, firewood, and packaging materials leads to the outflow of contaminated logs [41].
The analysis of the driving factors behind the spread of PWD in this study plays a critical role in disaster prevention and control. China has accumulated 40 years of experience in the prevention and control of PWD, developing relatively advanced management techniques. This study examines the causes of PWD across different stages of its spread in China, leveraging its long history to deeply and comprehensively identify various types of driving factors. The findings not only support current disaster prevention strategies but also provide new technical guidance for controlling the spread of PWD. First, PWD spreads more rapidly in forests dominated by monoculture pine plantations. This is due to the low species diversity and widespread distribution of host pine trees in such areas. This characteristic is evident from the early rapid spread observed in the clusters of Jiangsu and Guangdong provinces. Previous research has demonstrated that establishing barriers to control beetle population density can effectively prevent the spread of PWN [42]. Therefore, this issue should be carefully considered when designing afforestation and artificial forest projects. Second, the effective control of human-mediated spread is crucial. The results indicate that, during the early stages of PWD spread in China, outbreaks primarily occurred in economically developed regions. However, with the country’s economic growth and regional development, timber processing plants and construction projects (i.e., areas with changes in construction land) have played a significant role in the spread of PWD, serving as both the starting points and endpoints of human-mediated dispersal. These areas should be key targets for strict prevention and control measures to prevent disaster occurrences. Based on current PWD prevention and control practices, controlling timber movement between infected and non-infected areas in advance and formulating management strategies can effectively reduce the unnecessary spread of PWN [8]. Importantly, prevention efforts should not only focus on controlling PWD after such activities occur but also include proactive disaster prevention measures before the initiation of activities in areas at risk of PWD introduction.
In summary, this study comprehensively reveals the transmission patterns of PWD. Such research approaches can also be extended to the study of other pests and diseases. For pests and diseases that spread through both human-mediated and natural pathways, analyzing their transmission processes from these two perspectives allows for a clearer understanding of the causes of outbreaks. This study selects driving factors based on the biological characteristics of PWD to construct models. Future applications of these models to other studies will require the identification and incorporation of specific driving factors relevant to the particular pests or diseases under investigation. However, this study has limitations. The models for the spread mechanisms of PWD were constructed at the county level. The advantage of using the county scale lies in its ability to effectively capture the impact of human factors on the long-distance spread of PWD, as validated by the results of this study. However, the county scale is relatively coarse for studying the natural spread of PWD, making it challenging to fully account for the combined effects of various natural factors, such as climate, altitude, tree species distribution, and precipitation, on the spread process. In this study, the SIS model used the initial spread rate of epidemic introduction as the natural spread rate for a region. Future research should adopt more refined scales, leveraging the advantages of remote sensing data in constructing vegetation pest and disease models at the landscape scale. Spectral data can be used to extract the susceptibility potential of host pine trees and their distribution density, combined with natural environmental data such as temperature, precipitation, and other meteorological variables [43]. Advanced modeling approaches can then simulate and calculate the spread rate of PWD across different regions. In the core areas of PWD occurrence, localized disaster spread models can be developed to achieve targeted regional disaster control. By incorporating human activities and the two transmission pathways of vector beetles, mathematical models can effectively address current challenges [28]. Additionally, the current research relies solely on spatial analysis methods and remote sensing data from a geographical perspective to simulate the spread process, lacking integration with genomics and landscape ecology. This limitation constrains the depth of understanding regarding the mechanisms underlying the spread process.

5. Conclusions

This study constructed spatiotemporal scanning models and disaster spread models to quantify the 40-year spread process of PWD in China. The results reveal the spatiotemporal dynamics and driving factors behind the 40-year spread of PWD in China. The findings contribute to predicting future trends of the epidemic and identifying key areas for disaster prevention and control, providing scientific and technological support for the preservation of China’s pine forest ecosystems. In the future, to further trace the sources of spread, it will be essential to integrate remote sensing science with genetic studies to investigate the distribution of PWD populations and the patterns of changes in their genetic structures.

Author Contributions

Conceptualization, Z.H.; methodology, Z.H. and W.H.; validation, Z.H.; formal analysis, Z.H., J.G. and Y.Z.; investigation, Z.H. and B.Z.; data curation, Z.H., G.F. and Y.C.; writing—original draft preparation, Z.H.; writing—review and editing, Z.H., B.Z. and W.H.; supervision, B.Z. and W.H.; funding acquisition, W.H. All authors have read and agreed to the published version of the manuscript.

Funding

This research was funded by the National Key R&D Program of China (2021YFD1400902), the National Natural Science Foundation of China (42201355), and the SINO-EU Dragon 6 proposal (ID 95250).

Data Availability Statement

The datasets presented in this article are not readily available because some data is confidential. Requests to access these datasets should be directed to the National Forestry and Grassland Administration of China.

Conflicts of Interest

The authors declare no conflict of interest.

References

  1. Espada, M.; Filipiak, A.; Li, H.; Shinya, R.; Vicente, C.S.L. Editorial: Global occurrence of pine wilt disease: Biological interactions and integrated management. Front. Plant Sci. 2022, 13, 993482. [Google Scholar] [CrossRef] [PubMed]
  2. Boyd, I.L.; Freer-Smith, P.H.; Gilligan, C.A.; Godfray, H.C.J. The consequence of tree pests and diseases for ecosystem services. Science 2013, 342, 1235773. [Google Scholar] [CrossRef] [PubMed]
  3. Zhao, B.G.; Futai, K.; Sutherland, J.R.; Takeuchi, Y. Pine Wilt Disease; Springer: Berlin/Heidelberg, Germany, 2008. [Google Scholar]
  4. Mamiya, Y.; Kiyohara, T. Description of Bursaphelenchus lignicolus n. sp.(Nematoda: Aphelenchoididae) from pine wood and histopathology of nematode-infested trees. Nematologica 1972, 18, 120–124. [Google Scholar] [CrossRef]
  5. Cheng, G.; Lu, Q.; Feng, Y.M.; Li, Y.X.; Wang, Y.L.; Zhang, X.Y. Temporal and Spatial Dynamic Pattern of Pine Wilt Disease Distribution in China Predicted under Climate Change Scenario. Sci. Silvae Sin. 2015, 51, 119–126. [Google Scholar] [CrossRef]
  6. Tóth, Á. Bursaphelenchus xylophilus, the pinewood nematode: Its significance and a historical review. Acta Biol. Szeged. 2011, 55, 213–217. [Google Scholar]
  7. Ye, J.R. Epidemic status of pine wilt disease in China and its prevention and control techniques and counter measures. Sci. Silvae Sin. 2019, 55, 1–10. [Google Scholar]
  8. Robinet, C.; Roques, A.; Pan, H.; Fang, G.; Ye, J.; Zhang, Y.; Sun, J. Role of human-mediated dispersal in the spread of the pinewood nematode in China. PLoS ONE 2009, 4, e4646. [Google Scholar] [CrossRef]
  9. Mota, M.M.; Vieira, P.R. Pine wilt disease: A worldwide threat to forest ecosystems. Nematology 2009, 11, 727–734. [Google Scholar] [CrossRef]
  10. Cheng, R.; Lin, M.; Li, W.; Fang, Z. Pine Wilt disease caused by pinewood nematode on black pine in Nanjing. For. Pest Dis. 1983, 4, 1–5. [Google Scholar]
  11. Hao, Z.; Huang, J.; Li, X.; Sun, H.; Fang, G. A multi-point aggregation trend of the outbreak of pine wilt disease in China over the past 20 years. For. Ecol. Manag. 2022, 505, 119890. [Google Scholar] [CrossRef]
  12. Hirata, A.; Nakamura, K.; Nakao, K.; Kominami, Y.; Tanaka, N.; Ohashi, H.; Takano, K.T.; Takeuchi, W.; Matsui, T. Potential distribution of pine wilt disease under future climate change scenarios. PLoS ONE 2017, 12, e0182837. [Google Scholar] [CrossRef] [PubMed]
  13. Zheng, Y.; Liu, P.; Shi, Y.; Wu, H.; Yu, H.; Jiang, S. Difference analysis on pine wilt disease between Liaoning Province of northeastern China and other epidemic areas in China. J. Beijing For. Univ. 2021, 43, 155–160. [Google Scholar] [CrossRef]
  14. Smith, T.M.; York, P.H.; Broitman, B.R.; Thiel, M.; Hays, G.C.; van Sebille, E.; Putman, N.F.; Macreadie, P.I.; Sherman, C.D.H. Rare long-distance dispersal of a marine angiosperm across the Pacific Ocean. Glob. Ecol. Biogeogr. 2018, 27, 487–496. [Google Scholar] [CrossRef]
  15. Trakhtenbrot, A.; Nathan, R.; Perry, G.; Richardson, D.M. The importance of long-distance dispersal in biodiversity conservation. Divers. Distrib. 2005, 11, 173–181. [Google Scholar] [CrossRef]
  16. Lee, S.; Cho, H.; Choi, Y.; Choi, W.I.; Chung, H.I.; Lim, N.O.; Nam, Y.; Jeon, S. Path-finding algorithm as a dispersal assessment method for invasive species with human-vectored long-distance dispersal event. Divers. Distrib. 2022, 28, 1214–1226. [Google Scholar] [CrossRef]
  17. Travis, J.M.; Dytham, C. Dispersal evolution during invasions. Evol. Ecol. Res. 2002, 4, 1119–1129. [Google Scholar] [CrossRef]
  18. Ding, X.L.; Wang, Q.T.; Lin, S.; Zhao, R.W.; Zhang, Y.; Ye, J.R. Analysis of Genetic Variations of Bursaphelenchus xylophilus Populations between Guangdong and Jiangsu Provinces with SN Marker. Sci. Silvae Sin. 2022, 58, 1–9. [Google Scholar] [CrossRef]
  19. Bullock, J.M.; Bonte, D.; Pufal, G.; Carvalho, C.d.S.; Chapman, D.S.; García, C.; García, D.; Matthysen, E.; Delgado, M.M. Human-mediated dispersal and the rewiring of spatial networks. Trends Ecol. Evol. 2018, 33, 958–970. [Google Scholar] [CrossRef]
  20. Haran, J.; Roques, A.; Bernard, A.; Robinet, C.; Roux, G. Altitudinal Barrier to the Spread of an Invasive Species: Could the Pyrenean Chain Slow the Natural Spread of the Pinewood Nematode? PLoS ONE 2015, 10, e0134126. [Google Scholar] [CrossRef]
  21. Evans, H.F.; McNAMARA, D.G.; Braasch, H.; Chadoeuf, J.; Magnusson, C. Pest Risk Analysis (PRA) for the territories of the European Union (as PRA area) on Bursaphelenchus xylophilus and its vectors in the genus Monochamus. EPPO Bull. 1996, 26, 199–249. [Google Scholar] [CrossRef]
  22. Zeller, K.A.; McGarigal, K.; Whiteley, A.R. Estimating landscape resistance to movement: A review. Landsc. Ecol. 2012, 27, 777–797. [Google Scholar] [CrossRef]
  23. Schmitt, T. Biogeographical and evolutionary importance of the European high mountain systems. Front. Zool. 2009, 6, 9. [Google Scholar] [CrossRef] [PubMed]
  24. Robinet, C.; Van Opstal, N.; Baker, R.; Roques, A. Applying a spread model to identify the entry points from which the pine wood nematode, the vector of pine wilt disease, would spread most rapidly across Europe. Biol. Invasions 2011, 13, 2981–2995. [Google Scholar] [CrossRef]
  25. Zhao, Z.; Reddy, G.V.P.; Chen, L.; Qin, Y.; Li, Z. The synergy between climate change and transportation activities drives the propagation of an invasive fruit fly. J. Pest Sci. 2020, 93, 615–625. [Google Scholar] [CrossRef]
  26. Skarpaas, O.; Økland, B. Timber import and the risk of forest pest introductions. J. Appl. Ecol. 2009, 46, 55–63. [Google Scholar] [CrossRef]
  27. Togashi, K.; Shigesada, N. Spread of the pinewood nematode vectored by the Japanese pine sawyer: Modeling and analytical approaches. Popul. Ecol. 2006, 48, 271–283. [Google Scholar] [CrossRef]
  28. Xia, C.; Chon, T.-S.; Takasu, F.; Choi, W.I.; Park, Y.-S. Simulating Pine Wilt disease dispersal with an Individual-Based Model incorporating individual movement patterns of Vector Beetles. Front. Plant Sci. 2022, 13, 886867. [Google Scholar] [CrossRef]
  29. Zhang, K. Research Advances of Pine Wood Nematode Disease in China. World For. Res. 2010, 23, 59–63. [Google Scholar]
  30. Ye, J.; Wu, X. Research progress of pine wilt disease. For. Pest Dis. 2022, 41, 1–10. [Google Scholar] [CrossRef]
  31. Jiang, S.W.; Wu, H.; Li, D.B.; Luo, Z.Q.; He, S.; Song, Y.S. Analysis on disaster characteristics of pine wood nematode in Northeast China. For. Pest Dis. 2022, 41, 9–15. [Google Scholar] [CrossRef]
  32. Kulldorff, M.; Heffernan, R.; Hartman, J.; Assunção, R.; Mostashari, F. A space-time permutation scan statistic for disease outbreak detection. PLoS Med. 2005, 2, 216–224. [Google Scholar] [CrossRef] [PubMed]
  33. Breiman, L. Random Forests. Mach. Learn. 2001, 45, 5–32. [Google Scholar] [CrossRef]
  34. Breiman, L.; Friedman, J.; Olshen, R.; Stone, C. Cart. In Classification and Regression Trees; CRC: Boca Raton, FL, USA, 1984. [Google Scholar]
  35. Allen, L.J.S. Some discrete-time SI, SIR, and SIS epidemic models. Math. Biosci. 1994, 124, 83–105. [Google Scholar] [CrossRef] [PubMed]
  36. Hamada, M.; Takasu, F. Equilibrium properties of the spatial SIS model as a point pattern dynamics-How is infection distributed over space? J. Theor. Biol. 2019, 468, 12–26. [Google Scholar] [CrossRef]
  37. Shang, Y. Distribution dynamics for SIS model on random networks. J. Biol. Syst. 2012, 20, 213–220. [Google Scholar] [CrossRef]
  38. Li, L.Y.; Gao, L.; Wen, Y.L.; Shen, Y.Q. Advances in Research on Bursaphelenchus xylophilus. J. Zhejiang For. Sci. Technol. 2006, 5, 74–80. [Google Scholar] [CrossRef]
  39. Huang, H.H.; Liu, C.Y.; Hu, L.L.; Huang, Y.; Huang, H.; Zhao, D. Continuous control technology of pine wilt disease in Guangdong province. For. Pest Dis. 2022, 41, 36–42. [Google Scholar] [CrossRef]
  40. Hao, Z.; Huang, J.; Zhou, Y.; Fang, G. Spatiotemporal Pattern of Pine Wilt Disease in the Yangtze River Basin. Forests 2021, 12, 731. [Google Scholar] [CrossRef]
  41. Wang, C. Study on the Harm of Pine Wood Nematode Disease and Comprehensive Control Countermeasures. Anhui Agric. Sci. Bull. 2015, 21, 108–109. [Google Scholar]
  42. Liebhold, A.M.; Tobin, P.C. Population Ecology of Insect Invasions and Their Management. Annu. Rev. Entomol. 2008, 53, 387–408. [Google Scholar] [CrossRef]
  43. Zhao, X.; Qi, J.; Xu, H.; Yu, Z.; Yuan, L.; Chen, Y.; Huang, H. Evaluating the potential of airborne hyperspectral LiDAR for assessing forest insects and diseases with 3D Radiative Transfer Modeling. Remote Sens. Environ. 2023, 297, 113759. [Google Scholar] [CrossRef]
Figure 1. Research pathway diagram.
Remotesensing 17 00348 g001
Figure 2. The process of spatial distribution formation of epidemic areas of PWD across three epidemic stages (with the gray area in the bar chart representing the current epidemic stage).
Remotesensing 17 00348 g002
Figure 3. The gradual spread process of PWD in four cluster regions.
Remotesensing 17 00348 g003
Figure 4. The changes in the number of PWD counties across four clustered regions during the three spread stages.
Remotesensing 17 00348 g004
Figure 5. Simulation results obtained using the Random Forest model.
Remotesensing 17 00348 g005
Figure 6. The contribution rates of different driving factors in the model.
Remotesensing 17 00348 g006
Figure 7. The staged simulation results of the SIS model in the four clusters.
Remotesensing 17 00348 g007
Table 1. Names of driving factors.
TypeFactor Name (Meaning)Description
Source of spreadNPP (Number of Processing Plants)The number of timber processing plants within the county and the increments in timber processing plants across different time periods.
VNPP (Variation in Number of Processing Plants)
PathwayFPP (Forest Proximate People)The maximum population within one kilometer of forests within the county, derived from host data and population data.
HighwayThe number of different types of roads in each county.
National highway
Provincial roads
Urban roads
RiverMajor rivers in China (with ports distributed along them).
PortCounties with ports identified using WPI data.
Introduction eventCU (Changes of Urbanized)Urbanization data are used to extract the area CU within each county, reflecting the timber transport volume through project implementation.
GDP (Gross Domestic Product)The total GDP value within the county.
POP (Change of Population)Population changes within the county across different time periods, representing population mobility.
Table 2. The source of the research data.
NameSourceTypeTemporal Type
ElevationThe SRTM 30 m DEM dataset.TiffNon-temporal
Forest coverageThis study employed the China National Land Use and Land Cover Dataset (CNLUCC).TiffTemporal
Population dataGHS-POP R2023A—GHS multi-temporal population grid dataset (1975–2030), with a spatial resolution of 100 m.TiffTemporal
GDP dataThe spatial distribution dataset of China’s GDP on a kilometer grid scale is sourced from the Science Data Bank for Resources and Environmental Sciences, with a spatial resolution of 1000 m.TiffTemporal
Urbanization dataGHS-SMOD R2023A—GHS settlement layers, applying the Degree of Urbanization methodology (stage I) to GHS-POP R2023A and GHS-BUILT-S R2023A, covering multiple temporal points (1975–2030), with a spatial resolution of 1000 m.TiffTemporal
Timber processing plant dataThe data extraction process obtained attributes such as names, geographic coordinates (latitude and longitude), and establishment years (https://www.qcc.com/ (accessed on 23 October 2023)).ShpTemporal
Port dataThe World Port Index.ShpNon-temporal
RiverThe Geographic Data Sharing Infrastructure at the College of Urban and Environmental Science, Peking University.ShpNon-temporal
Road networkThe Geographic Data Sharing Infrastructure at the College of Urban and Environmental Science, Peking University.ShpNon-temporal
Table 3. t-test (two-tailed) of 12 factors.
stage 1
FactorVNPPNPPFPPPOPGDPCU
p value0.06460.0501<0.0001<0.0001<0.00010.2829
nsns************ns
SigYesYesYesYesYesNo
FactorRiverHighwayNational highwayProvincial roadsUrban roadsPort
p value0.96990.00150.00140.0014<0.0001<0.0001
ns**************
SigNoYesYesYesYesYes
stage 2
FactorVNPPNPPFPPPOPGDPCU
p value0.98510.11570.00020.41170.07870.2021
nsns***nsnsns
SigNoNoYesNoYesNo
FactorRiverHighwayNational highwayProvincial roadsUrban roadsPort
p value0.1950.00020.32490.00080.42560.6164
ns***ns***nsns
SigNoYesNoYesNoNo
stage 3
FactorVNPPNPPFPPPOPGDPCU
p value<0.00010.0003<0.00010.1522<0.0001<0.0001
***********ns********
SigYesYesYesNoYesYes
FactorRiverHighwayNational highwayProvincial roadsUrban roadsPort
p value0.03520.04540.10760.00930.12050.887
**ns**ns
SigYesYesNoYesNoNo
Significance was marked as * p < 0.05, ** p < 0.01, *** p < 0.001, and **** p < 0.0001 to indicate increasing levels of significance, with p < 0.1 indicating weak significance.
Disclaimer/Publisher’s Note: The statements, opinions and data contained in all publications are solely those of the individual author(s) and contributor(s) and not of MDPI and/or the editor(s). MDPI and/or the editor(s) disclaim responsibility for any injury to people or property resulting from any ideas, methods, instructions or products referred to in the content.

