Article

Quantifying the Contribution of Forest Restoration to Wind Erosion Control Using RWEQ—A Case Study of Duolun County in Inner Mongolia, China

1
Xilinhot National Meteorological Observatory, Xilinhot 026000, China
2
Xilinhot Field Research Station for Grassland Ecological Meteorology, China Meteorological Administration, Xilinhot 026000, China
3
School of Remote Sensing and Geomatics Engineering, Nanjing University of Information Science and Technology, Nanjing 210044, China
4
Tongliao Meteorological Bureau, Tongliao 028000, China
5
Duolun County Meteorological Bureau, Duolun 027300, China
*
Author to whom correspondence should be addressed.
Remote Sens. 2025, 17(23), 3861; https://doi.org/10.3390/rs17233861 (registering DOI)
Submission received: 16 October 2025 / Revised: 20 November 2025 / Accepted: 26 November 2025 / Published: 28 November 2025

Highlights

What are the main findings?
  • The Revised Wind Erosion Equation (RWEQ) model was applied to quantify wind erosion and sand fixation at fine spatial resolution.
  • A scenario-based analytical framework was developed to isolate and quantify the specific contribution of forest restoration to wind-erosion control.
What is the implication of the main finding?
  • Revealed that large-scale afforestation markedly enhanced regional wind erosion control capacity.
  • Provides a quantitative basis for evaluating ecological restoration programs and guiding sustainable land management in arid and semi-arid regions.

Abstract

Wind erosion is one of the most severe environmental problems in arid and semi-arid regions, posing a serious threat to ecological security and human settlements. Afforestation is widely acknowledged as a practical strategy for mitigating wind erosion. However, quantitative assessments of the relationship between forest restoration and wind erosion control remain limited, particularly over long temporal scales and at fine spatial resolutions. This study takes Duolun County, Inner Mongolia, as a representative case to examine the role of large-scale forest restoration in controlling wind erosion. Specifically, land use dynamics from 1985 to 2024 were mapped using a time series of Landsat imagery to identify forest expansion. Then, the Revised Wind Erosion Equation (RWEQ) was applied to simulate the spatiotemporal variations in wind erosion and sand fixation. Finally, a scenario-based framework contrasting forested and non-forested conditions was used to isolate and quantify the contribution of forest restoration to wind erosion control. Results showed that forest cover increased significantly from 3.95% to 36.19% over the past 40 years, with expansion primarily concentrated in the central desertified regions and the northern hilly areas. Sand fixation increased from 8.70 × 10 5 t to 8.20 × 10 6 t, with an average annual growth of 9.06 × 10 4 t/year. Spatially, growth rates were more pronounced in the central and northern regions than in the south. Ecological restoration programs contributed substantially to wind erosion control, with their attributable sand fixation increasing from near zero to 6.61 × 10 5 t, with an average annual rate of 8.21 × 10 3 t/year. These findings provide new insights into the role of large-scale forest restoration in enhancing sand fixation and mitigating wind erosion.

1. Introduction

Wind erosion is one of the most severe land degradation processes in arid and semi-arid regions, leading to the loss of fertile topsoil, vegetation degradation, and land desertification [1,2,3]. It not only threatens agricultural productivity and ecological security but also undermines human well-being [4,5]. In northern China, particularly on the Inner Mongolia Plateau and surrounding regions, the combined effects of aridity, limited precipitation, and frequent strong winds have led to widespread wind erosion and desertification, posing challenges to ecological sustainability and socio-economic development [6,7].
Over the past decades, a series of large-scale ecological restoration programs—such as the Beijing–Tianjin Sandstorm Source Control Project (BTSSCP), the Three-North Shelterbelt Program (TNS), and the Grain for Green Project (GGP)—have been implemented to mitigate wind erosion through vegetation restoration [8,9,10]. These initiatives have effectively increased vegetation cover, enhanced soil stability, and improved regional ecological functions [9,11,12]. Nevertheless, quantitatively assessing the long-term impacts of vegetation restoration on wind erosion and sand fixation remains a critical scientific challenge, largely due to the complex interactions among climate, land use, and surface conditions over extended timescales.
To simulate wind erosion processes, several process-based models have been developed, including the Wind Erosion Equation (WEQ) [13], the Texas A&M Erosion Analysis Model (TEAM) [14], the Wind Erosion Simulation System (WESS) [15], the Wind Erosion Prediction System (WEPS) [16], the Wind Erosion Assessment Model (WEAM) [17], and the Revised Wind Erosion Equation (RWEQ) [18]. Earlier empirical models (e.g., WEQ) are simple but typically require site-specific calibration, limiting their large-scale applicability. More process-oriented models (e.g., WEPS, WESS) offer detailed physical representations but demand extensive field data and computational resources, constraining their use for multi-decadal, regional assessments. In contrast, RWEQ strikes a balance between process realism and input simplicity. It captures the fundamental mechanisms of wind erosion—including particle entrainment, soil erodibility, and the influence of surface roughness and vegetation cover—while requiring only moderate input data. Many of its parameters can be derived from remote sensing and meteorological datasets, enabling consistent regional and long-term simulations. Therefore, RWEQ has been widely applied across the arid and semi-arid regions of northern China [19,20,21].
Land-use and land-cover change (LUCC) is a key driver of wind erosion and its regulation. Different land-use types exhibit distinct susceptibilities: croplands and bare lands are highly vulnerable to wind erosion, while forests and grasslands play vital roles in sand fixation [22,23,24,25]. Consequently, LUCC directly influences the magnitude and spatial distribution of wind erosion. Understanding these dynamics is essential for improving ecosystem services and supporting sustainable land management in arid regions. Recent studies have increasingly explored the linkages among LUCC, climate, and wind erosion. For instance, Sun et al. [26] employed multiple stepwise regression to quantify the relative contributions of NDVI, wind, and aridity index to erosion variability; Chi et al. [27] used multi-year average climatic variables as inputs to wind erosion models to isolate the effect of LUCC; and Cao et al. [28] directly compared annual erosion estimates without explicitly accounting for climate variability. However, studies based solely on interannual comparisons of erosion magnitude risk conflating LUCC effects with climate-driven fluctuations. Similarly, multi-year averaging approaches, while effective for highlighting LUCC effects under simplified climatic conditions, tend to obscure interannual variability and climate–land-use interactions. Furthermore, most existing works have examined the combined influence of multiple land-use types, whereas the independent contribution of specific land-use transitions (such as forest restoration) to wind erosion control and sand fixation remains poorly quantified. This gap limits our ability to understand the true ecological benefits of targeted restoration programs.
Against this backdrop, this study focuses on Duolun County in the central Inner Mongolia Plateau, a representative agro-pastoral ecotone that is highly vulnerable to wind erosion and has undergone large-scale afforestation over the past several decades [29,30]. Using high-resolution LUCC data from 1985 to 2024 in combination with the RWEQ model, the study quantifies the contribution of forest restoration to wind erosion control. Specifically, the study includes three main objectives: (1) to classify land use and analyze the spatiotemporal dynamics of forest cover over the past four decades; (2) to simulate long-term variations in wind erosion intensity and sand fixation capacity; and (3) to assess the ecological benefits of afforestation in mitigating wind erosion. These findings provide new insights into the ecological value of forest restoration and offer guidance for optimizing ecological restoration planning and land management in arid and semi-arid regions.

2. Study Area and Data

2.1. Study Area

Duolun County ( 41 ° 46 42 ° 36 N, 115 ° 51 116 ° 54 E) is located in the southeastern part of Xilingol League, Inner Mongolia Autonomous Region, with a total area of approximately 3950 km2 (Figure 1). The county experiences a typical temperate continental climate, transitioning from semi-arid to semi-humid conditions. The mean annual temperature is approximately 1.6 °C, with an average wind speed of 3.6 m/s. Annual precipitation averages 504 mm, most of which occurs between June and August. The terrain is dominated by hills and plains, with elevations ranging from 1145 m to 1793 m and an average elevation of 1350 m. Low-elevation areas are primarily located in the central part of the county, whereas higher elevations occur in the southern and northern regions.
Duolun County is a typical ecologically fragile area, severely affected by wind erosion and desertification. In the 1970s and 1980s, over 70% of the county was covered by sandy land. Serving as an important sandstorm barrier for the Beijing–Tianjin region, the county has undergone large-scale ecological restoration since 2000, including extensive afforestation and the GGP, which have substantially improved vegetation cover. Forests are mainly distributed in hilly and mountainous areas, whereas grasslands and croplands are concentrated on the plains. Due to its representative ecological vulnerability and role in sandstorm mitigation, Duolun County serves as an ideal case study for evaluating the wind erosion control benefits of afforestation and ecological restoration projects.

2.2. Data Sources

In this study, three types of data were employed: meteorological data, remote sensing data, and soil data. Table 1 summarizes the datasets and variables used in this study.

2.2.1. Meteorological Data

Meteorological data were obtained from the ERA5-Land reanalysis dataset released by the European Centre for Medium-Range Weather Forecasts (ECMWF). ERA5-Land is a widely used reanalysis dataset, which produces a global data by merging model data with observations to provide gridded information of a large number of surface and near-surface variables with a resolution of 0.1° (∼10 km) and an hourly temporal resolution. In this study, precipitation, wind speed, and potential evapotranspiration data were extracted from ERA5-Land dataset during 1985–2024. In this study, precipitation and potential evapotranspiration were aggregated to monthly totals, while wind speed was averaged to daily values for analysis.
Snow cover data with a 25 km resolution were obtained from a long-term snow depth dataset, which was accessed from the Cold and Arid Region Science Data Center.

2.2.2. Remote Sensing Data

Landsat multi-temporal imagery from 1985 to 2024 was used for land use classification, including Landsat 5 TM (1985–2011), Landsat 7 ETM+ (2012), and Landsat 8 OLI (2013–2024). The data were obtained from the Google Earth Engine platform as Level-2 products, providing surface reflectance corrected for geometric and atmospheric effects, with a 16-day revisit interval and a spatial resolution of 30 m for the multispectral bands. To enhance classification accuracy, three spectral indices—the Normalized Difference Vegetation Index (NDVI), the Normalized Difference Built-up Index (NDBI), and the Modified Normalized Difference Water Index (MNDWI)—were first calculated using the average of Landsat images from June to August and then incorporated as additional input features for classification. In addition, a 30 m resolution land cover dataset developed by Yang and Huang (CLCD_V01) was used as auxiliary data to further guide the classification [31]. Topographic data were obtained from the Shuttle Radar Topography Mission (SRTM) with a spatial resolution of 30 m and used to derive slope for input into the RWEQ model.

2.2.3. Soil Data

Soil data were obtained from the National Tibetan Plateau Data Center [32], with a spatial resolution of 30 arc-seconds (approximately 1 km at the equator). To ensure spatiotemporal consistency, all datasets were reprojected to the UTM projection and resampled to 30 m spatial resolution using bilinear interpolation method.

2.3. Land-Use Classification

To accurately identify forest land, land-use classification was first conducted. Following China’s LUCC classification system [33], land use in the study area was categorized into six first-class types: bare land, grassland, cropland, water, built-up land, and forest. Random Forest (RF) algorithm was employed to classify land use [34,35]. RF has been widely applied in land cover mapping and has demonstrated superior classification performance [36,37,38].
Training samples for each year were obtained using a sample migration strategy [39]. Specifically, regions of interest (ROIs) were manually selected in a reference year to establish a high-quality training dataset. Euclidean Distance (ED) and Spectral Angle Distance (SAD) (Equations (1) and (2)) were then used to measure similarity between the reference year and the target year. In the target year, samples satisfying both thresholds were considered “unchanged” and successfully transferred, whereas samples exceeding the thresholds were deemed “changed” and excluded. The successfully transferred samples were used as the training dataset for the target year. In this study, 2020 was chosen as the reference year.
E D = i = 1 N ( X i ( t 1 ) X i ( t 2 ) ) 2
S A R = i = 1 N X i ( t 1 ) X i ( t 2 ) i = 1 N ( X i ( t 1 ) ) 2 X i ( t 2 ) ) 2
where X i is the variables used in this study, including the Blue, Green, Red, NIR, SWIR1, and SWIR2 bands; t 1 and t 2 represent the reference year and the target year, respectively. A larger SAR and a smaller ED indicate higher similarity between two sample points, suggesting little change in the corresponding area. In this study, points with SAR > 0.96 and ED < 0.05 were identified as transferable samples [40].
To further improve classification accuracy, NDVI, MNDWI, NDBI, and additional land cover information (CLCD) were incorporated as prior knowledge into the RF classifier. All samples were randomly divided into training and test sets. Classification performance was assessed on the test set using confusion matrices, from which overall accuracy (OA) and the Kappa coefficient were computed to quantitatively evaluate the reliability of the land-use classification.

2.4. RWEQ Model

The RWEQ model was employed to estimate soil wind erosion in this study. The wind erosion prevention service (SR) was calculated as the difference between potential wind erosion modulus ( S L P ) under bare soil conditions and actual soil erosion modulus ( S L ) under existing vegetation cover, as expressed by the following equation:
S R = S L P S L
S L P = 2 · Z S p 2 · Q m a x p · e ( Z / S p ) 2
S p = 150.71 · ( W F · E F · S C F · K ) 0.3711
Q m a x p = 109.8 · ( W F · E F · S C F · K )
S L = 2 · Z S 2 · Q max · e ( Z / S ) 2
S = 150.71 · ( W F · E F · S C F · K · C ) 0.3711
Q max = 109.8 · ( W F · E F · S C F · K · C )
where SR is the reduced amount of wind erosion (kg/m2). S P and S are the potential critical plot length and the critical plot length (m), respectively. Q m a x p and Q m a x are the potential maximum sediment transport capacity and maximum sediment transport capacity (kg/m). z is the distance at which maximum erosion occurs, set to 50 m in this study [21,41]. WF is the weather factor (kg/m); EF is the soil erodibility factor (dimensionless); SCF is the soil crust factor (dimensionless); and K is the surface roughness factor (dimensionless) [42,43]; C is the vegetation cover factor (dimensionless) [44]. Detailed equations are provided in Supplementary Materials.

2.5. Evaluation of Sand Fixation Benefits

To quantitatively assess the contribution of forest restoration to wind erosion control, a scenario-based evaluation framework was established. This framework allows for the explicit comparison of wind erosion conditions with and without the implementation of the GGP, thereby isolating the ecological effects of afforestation. Two contrasting scenarios were constructed:
Scenario A (With Afforestation): The sand fixation service (SR) was simulated under actual land-use conditions, incorporating the forested areas established through the GGP. This scenario represents the current, post-restoration state of the landscape.
Scenario B (Without Afforestation): To simulate the situation in the absence of the GGP, newly afforested areas were reverted to their pre-restoration land-use types (e.g., cropland or grassland), and SR was recalculated under these hypothetical conditions. This scenario serves as a counterfactual baseline for assessing restoration effects.
The wind erosion control benefit (WECB, kg/m2) derived from afforestation was quantified as the difference in sand fixation between the two scenarios, expressed as
W E C B = S R A S R B
where S R A and S R B represent the simulated sand fixation (kg/m2) under Scenario A and Scenario B, respectively.
A positive WECB value indicates an improvement in the landscape’s capacity to resist wind erosion due to afforestation and ecological restoration activities. Thus, WECB directly reflects the additional soil retention provided by forest restoration, with higher values signifying greater effectiveness in wind erosion mitigation.

2.6. Trend Analysis

To examine the spatiotemporal variations in sand fixation and wind erosion control benefits over a long-term period from 1985 to 2024, the Theil–Sen median trend estimator and the Mann–Kendall (MK) test were applied at the pixel level. These two non-parametric methods were jointly used to quantify the magnitude and statistical significance of long-term trends.
The Theil–Sen median method [45], also known as the Sen’s slope estimator, provides a robust estimate of the monotonic trend by computing the median of all pairwise slopes between time-series observations. Owing to its high computational efficiency and insensitivity to outliers, this method has been widely employed in environmental and climatic studies [46,47,48].
The MK test [49,50] was used to assess the statistical significance and direction of the detected trends. This rank-based test does not require the data to follow any specific distribution and is less affected by missing or extreme values, making it particularly suitable for long-term environmental datasets [51,52]. Following previous studies [53,54], the significance of the detected trends was classified into seven categories: extremely significant increases, significant increases, slightly significant increases, not significant, slightly significant decreases, significant decreases and extremely significant decreases, corresponding to codes 3, 2, 1, 0, −1, −2, and −3, respectively.

3. Results

3.1. Land Use Classification and Forest Cover Change

Table 2 summarizes the classification accuracy of land-use maps from 1985 to 2024. Detailed confusion matrices and classification result maps are provided in the Supplementary Materials (Table S1 and Figure S1). The results demonstrated a consistently high level of accuracy across the four decades. Overall, the OA of land-use classification exceeded 95% in most year, while the Kappa coefficient remained stable within the range of 0.88–0.96. Slight declines in OA were observed in a few years (such as 2002–2006), mainly due to extensive cloud cover that reduced image quality and consequently affected classification performance. These findings underscore both the strong agreement with validation data and the temporal stability of the classification performance. Such robustness provides a solid foundation for subsequent analyses of land cover change, wind erosion modeling, and the ecological benefits of afforestation.
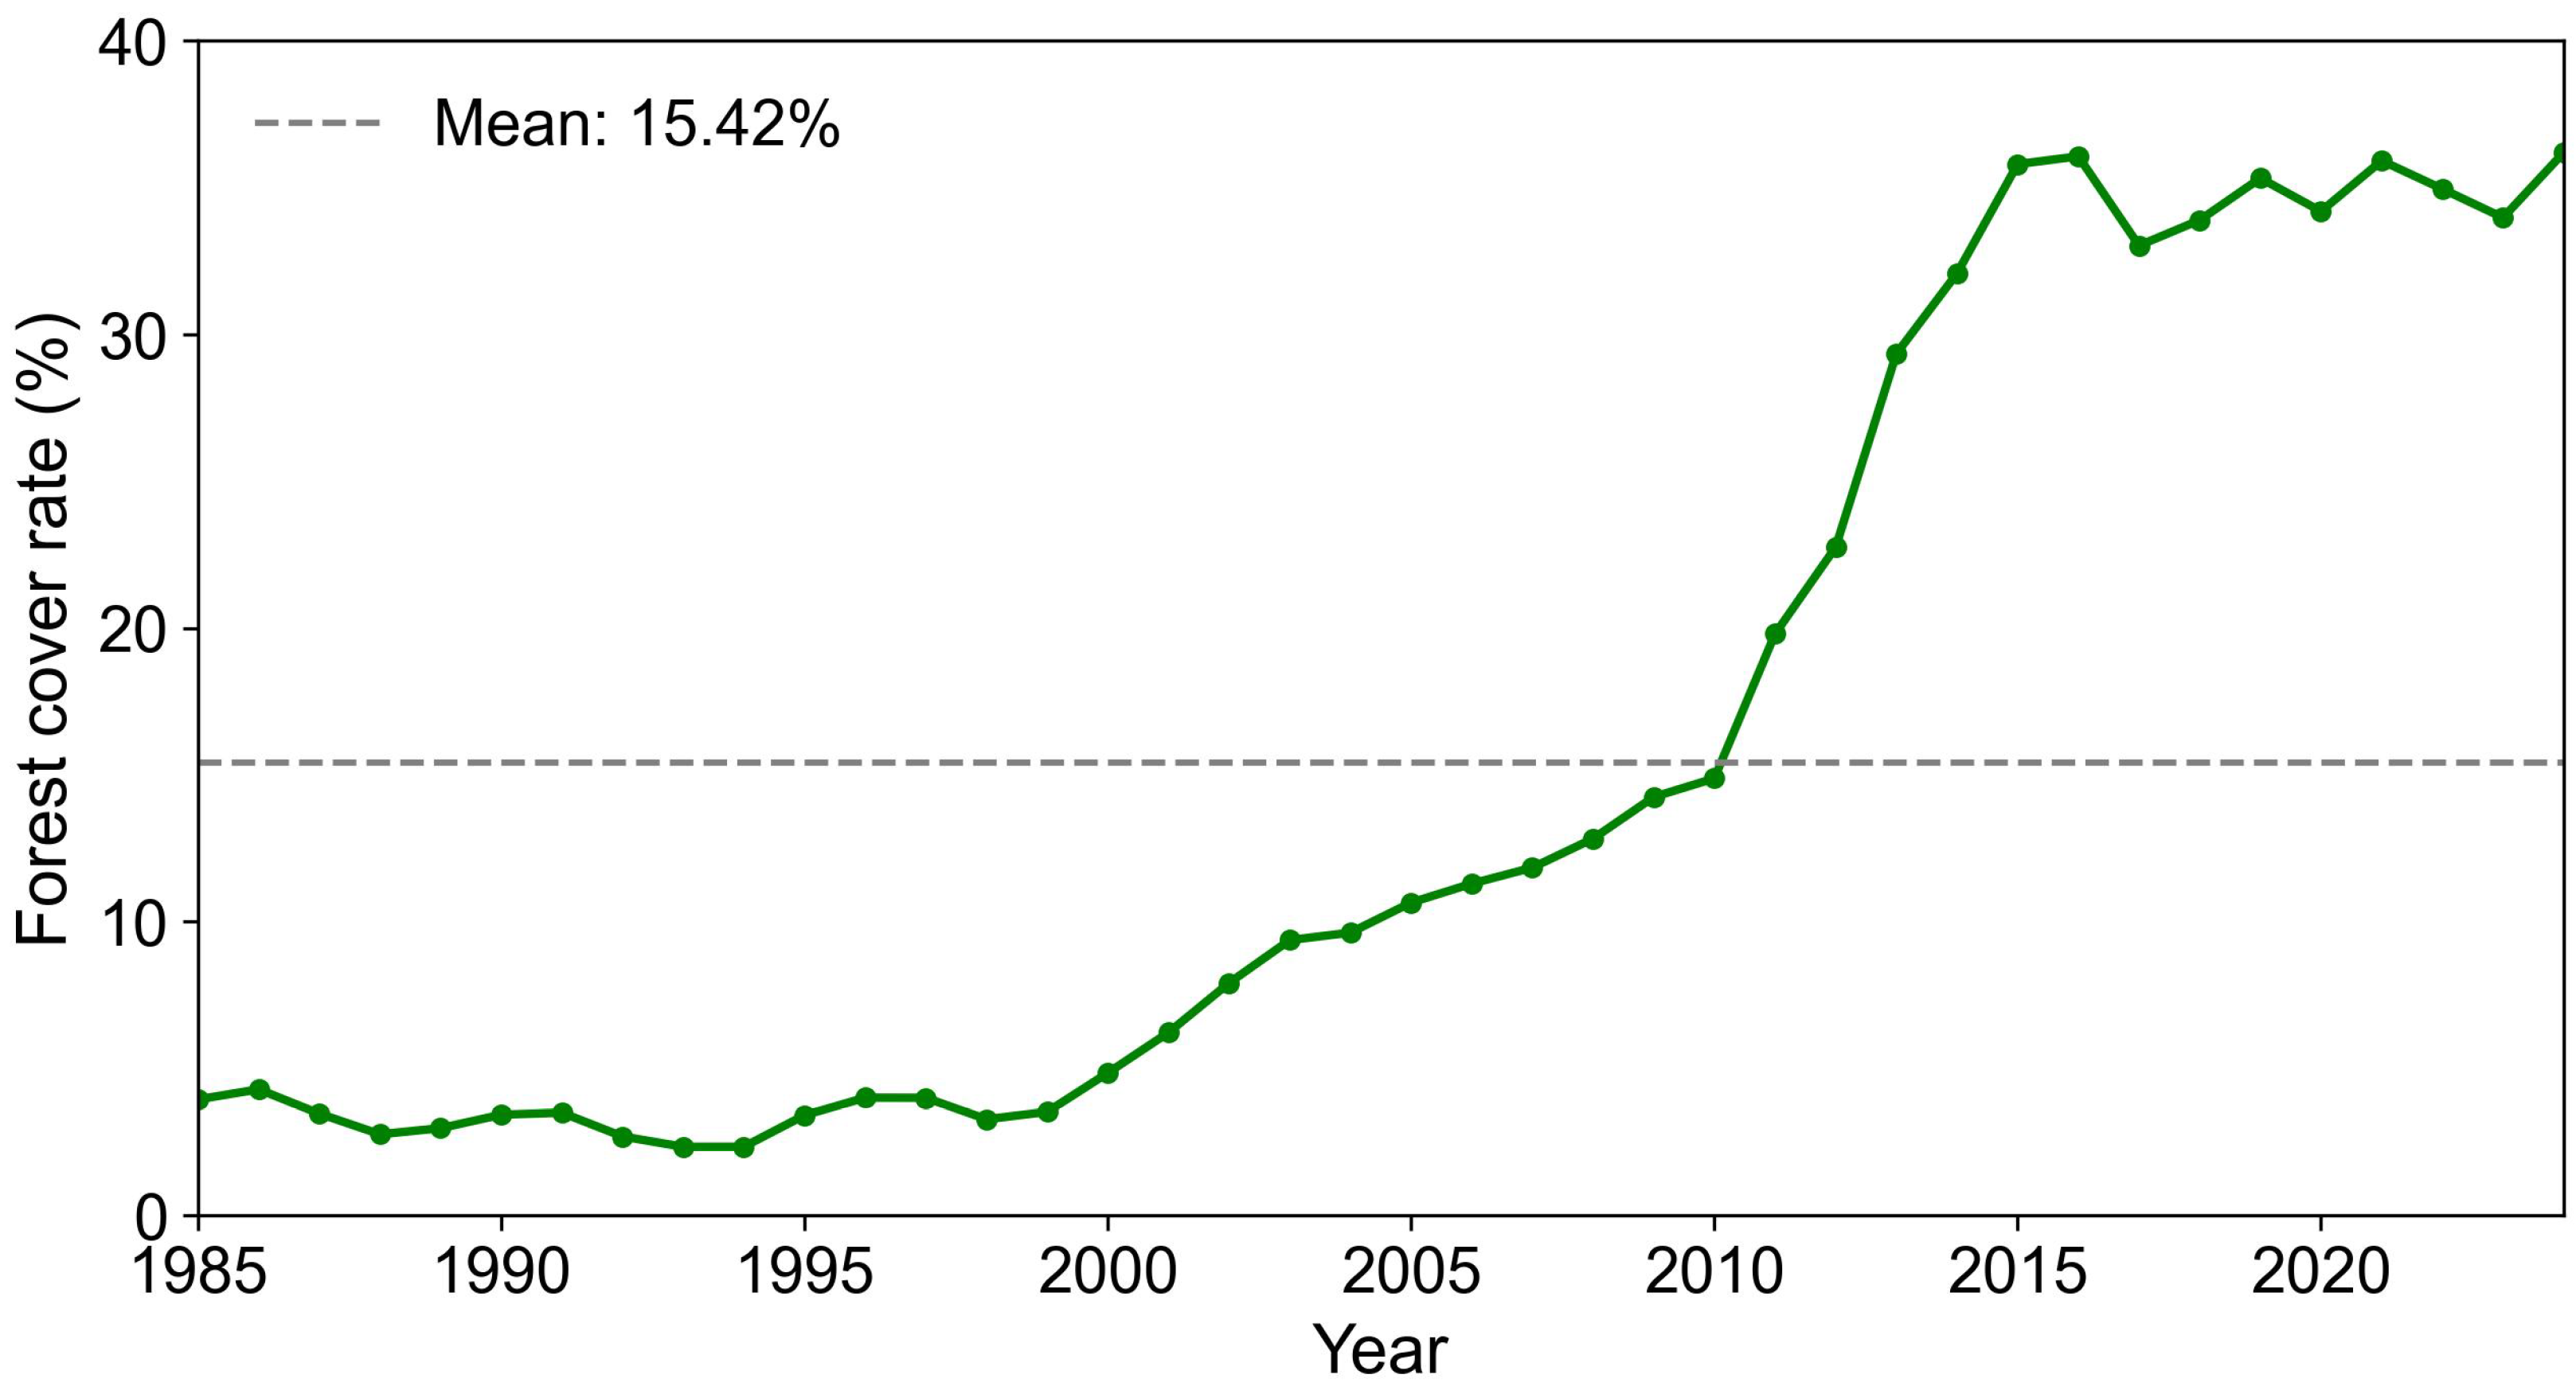
The annual forest cover in Duolun County from 1985 to 2024 was calculated based on the land-use classification results (Figure 2). Over the past four decades, forest cover increased significantly from 3.95% in 1985 to 36.19% in 2024, with an average annual growth rate of 0.98%/year. Based on changes in forest expansion rates, the entire period can be divided into four distinct stages. Low-level fluctuations stage (1985–2000): forest cover remained at a low level, fluctuating between 3% and 5%, reflecting conditions prior to the launch of large-scale ecological restoration programs. Slow growth stage (2000–2010): during the early phase of restoration, forest cover gradually increased, reaching 14.88% by 2010, with an average annual growth of about 1%. Rapid growth stage (2010–2015): driven by stronger policy support and intensified afforestation efforts, forest cover rose sharply, reaching nearly 36% by 2015, with an average annual growth rate of 4.18%. Relative stabilization stage (2015–2024): forest cover stabilized between 34% and 36%, indicating a shift from expansion to maintenance. The temporal dynamics of forest expansion were closely aligned with the time-point of ecological restoration projects, highlighting the effectiveness of large-scale afforestation and reforestation in reshaping regional vegetation patterns.
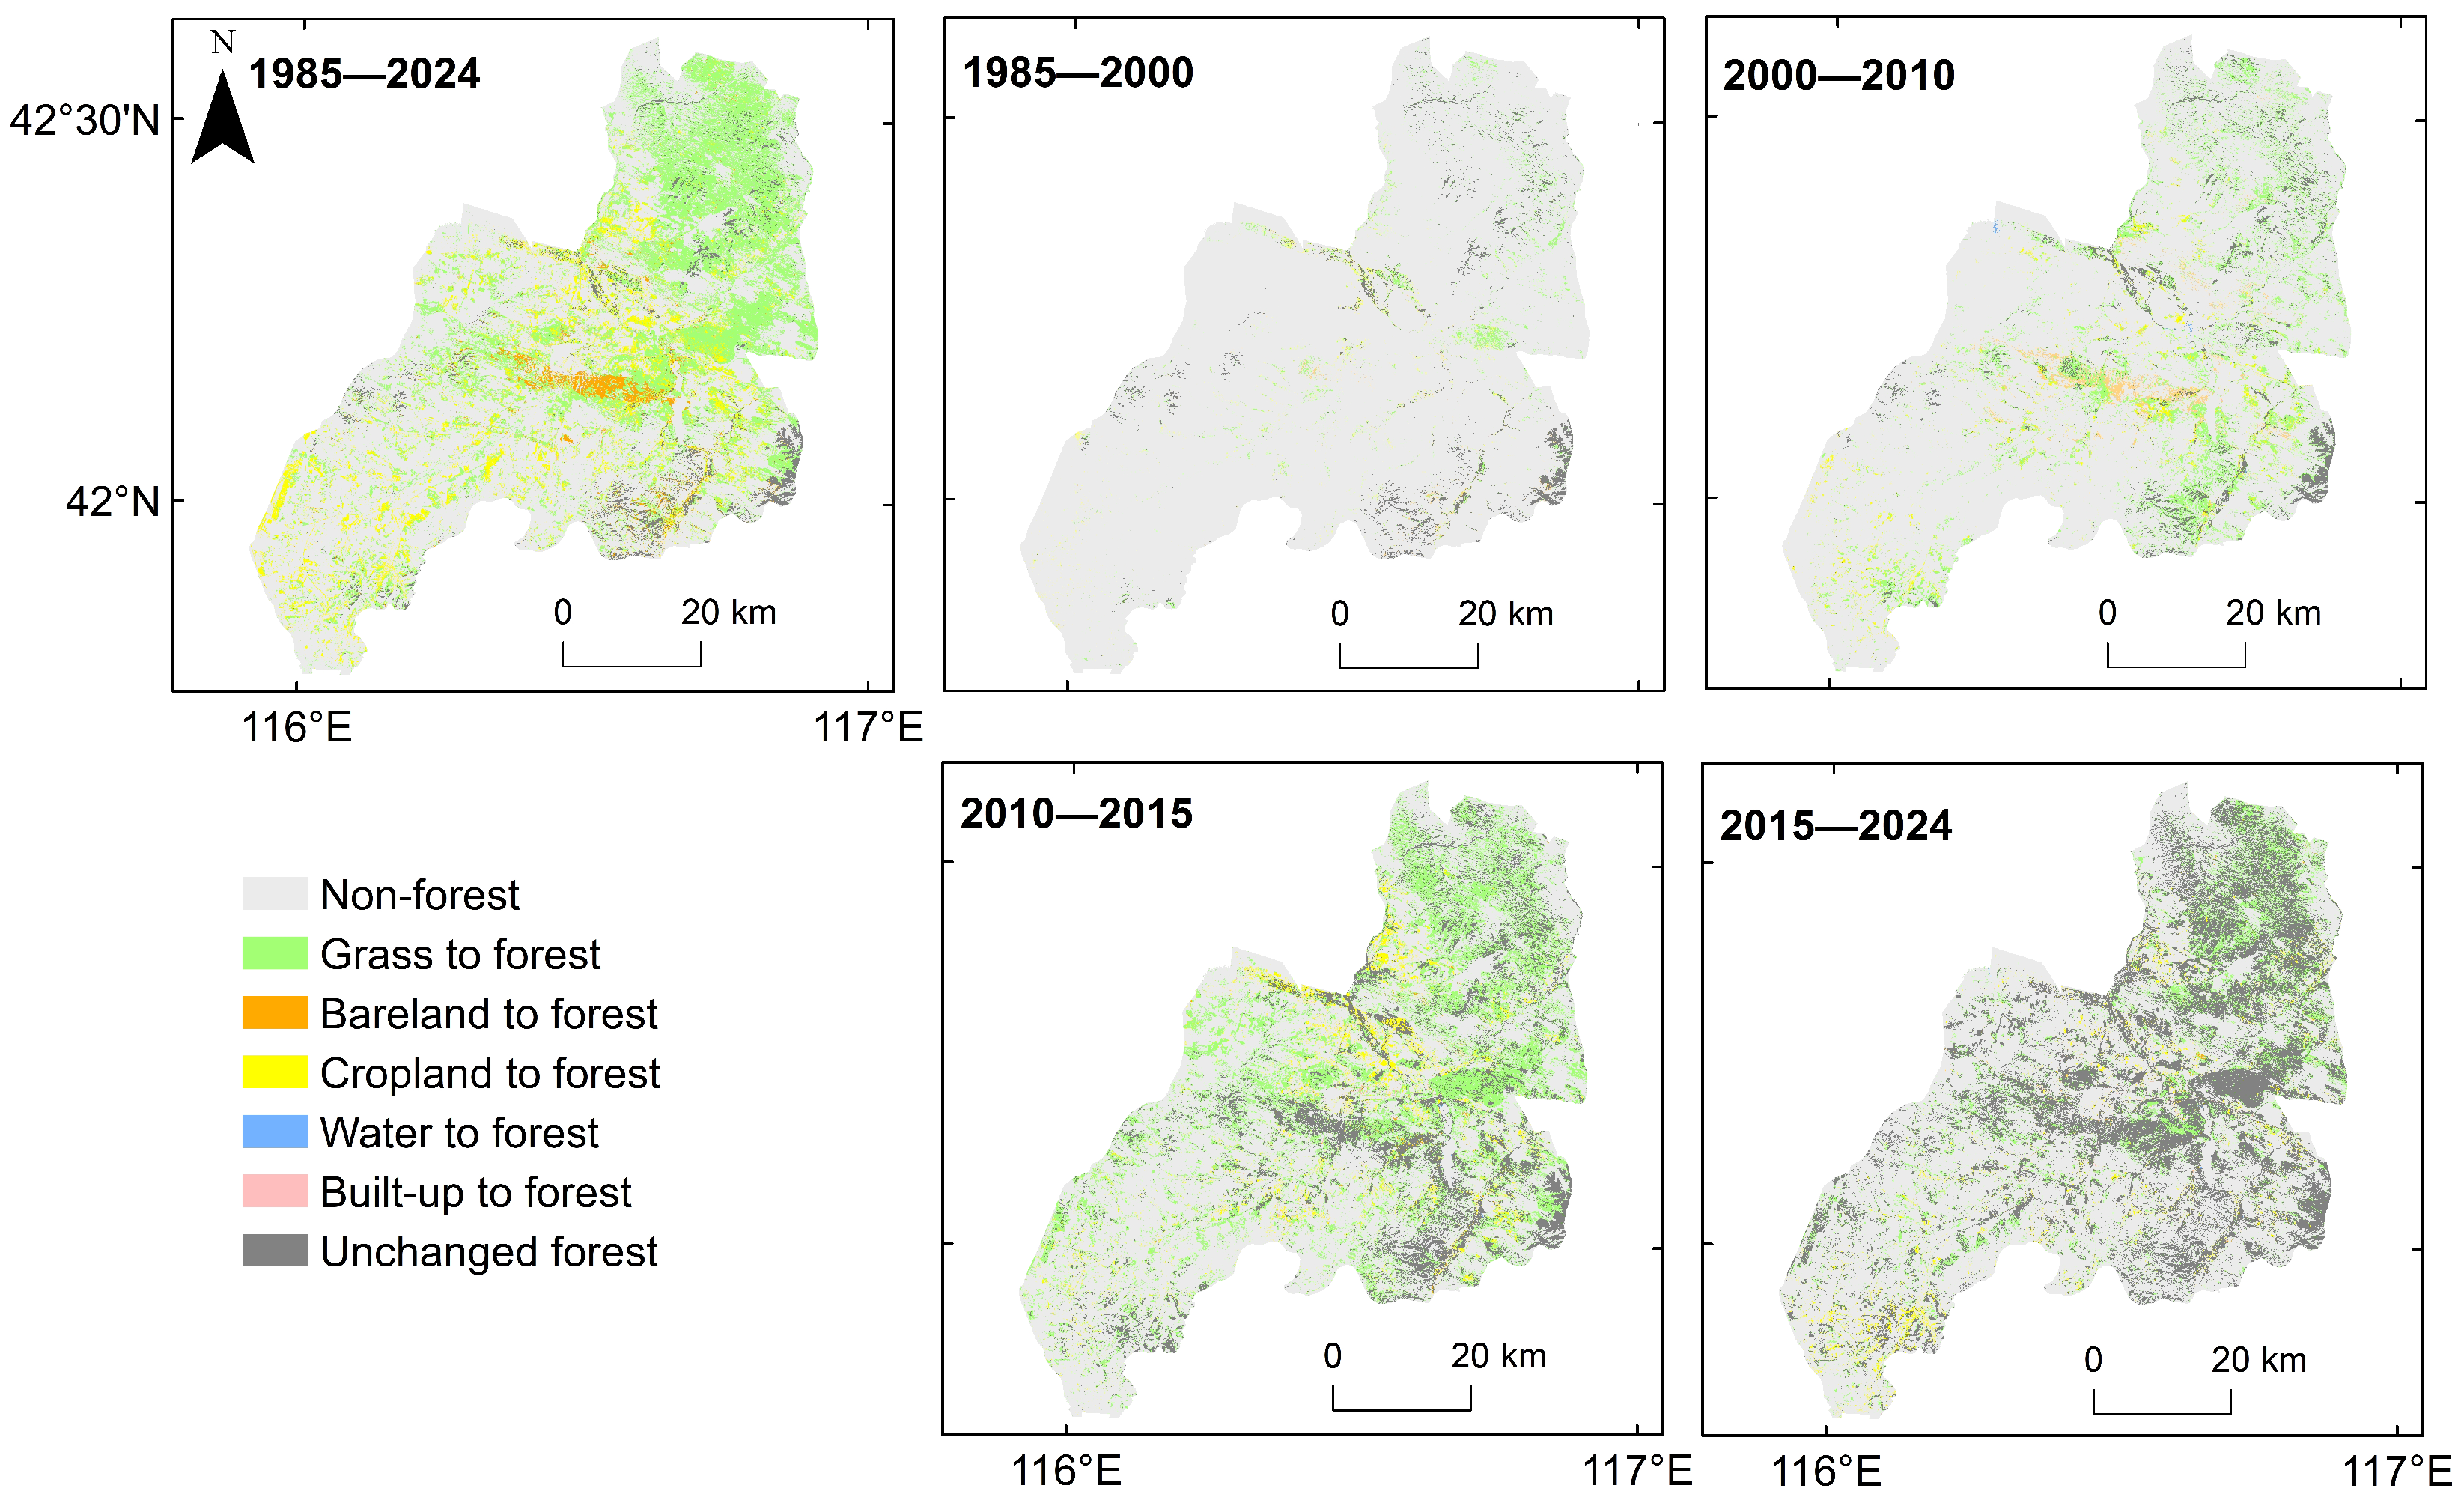
Figure 3 shows the spatial distribution of the source composition of newly added forest in Duolun County from 1985 to 2024. Over the 40-year period, newly added forest accounted for 33.05% of the county’s total area. Spatially, the distribution of new forests was widespread, forming contiguous patches in the northern and central regions, while being relatively scattered in the south. The newly added forest primarily originated from conversions of grassland, cropland, and bare land. Grassland-to-forest conversion dominated, contributing 73.63% of new forests, with a widespread spatial pattern, particularly concentrated in the northern hilly regions. Cropland-to-forest conversion accounted for 19.11%, mainly occurring in central and southern low-elevation areas. Bare land-to-forest conversion contributed 5.68% of the new forest, primarily in the central desertification regions. Conversions from other land-cover types contributed less than 2% to the new forest and can be considered negligible. Phased analysis revealed that grassland-to-forest conversion throughout four phases, peaking in 2010–2015 (51.25%), followed by 2000–2010 (22.19%) and 2015–2024 (22.07%). Cropland-to-forest conversion was most prominent during 2010–2015 (43.07%), then 2015–2024 (25.13%) and 2000–2010 (22.23%). Bare land-to-forest conversion was largely concentrated in 2000–2010 (73.19%).

3.2. Spatiotemporal Variations in Sand Fixation

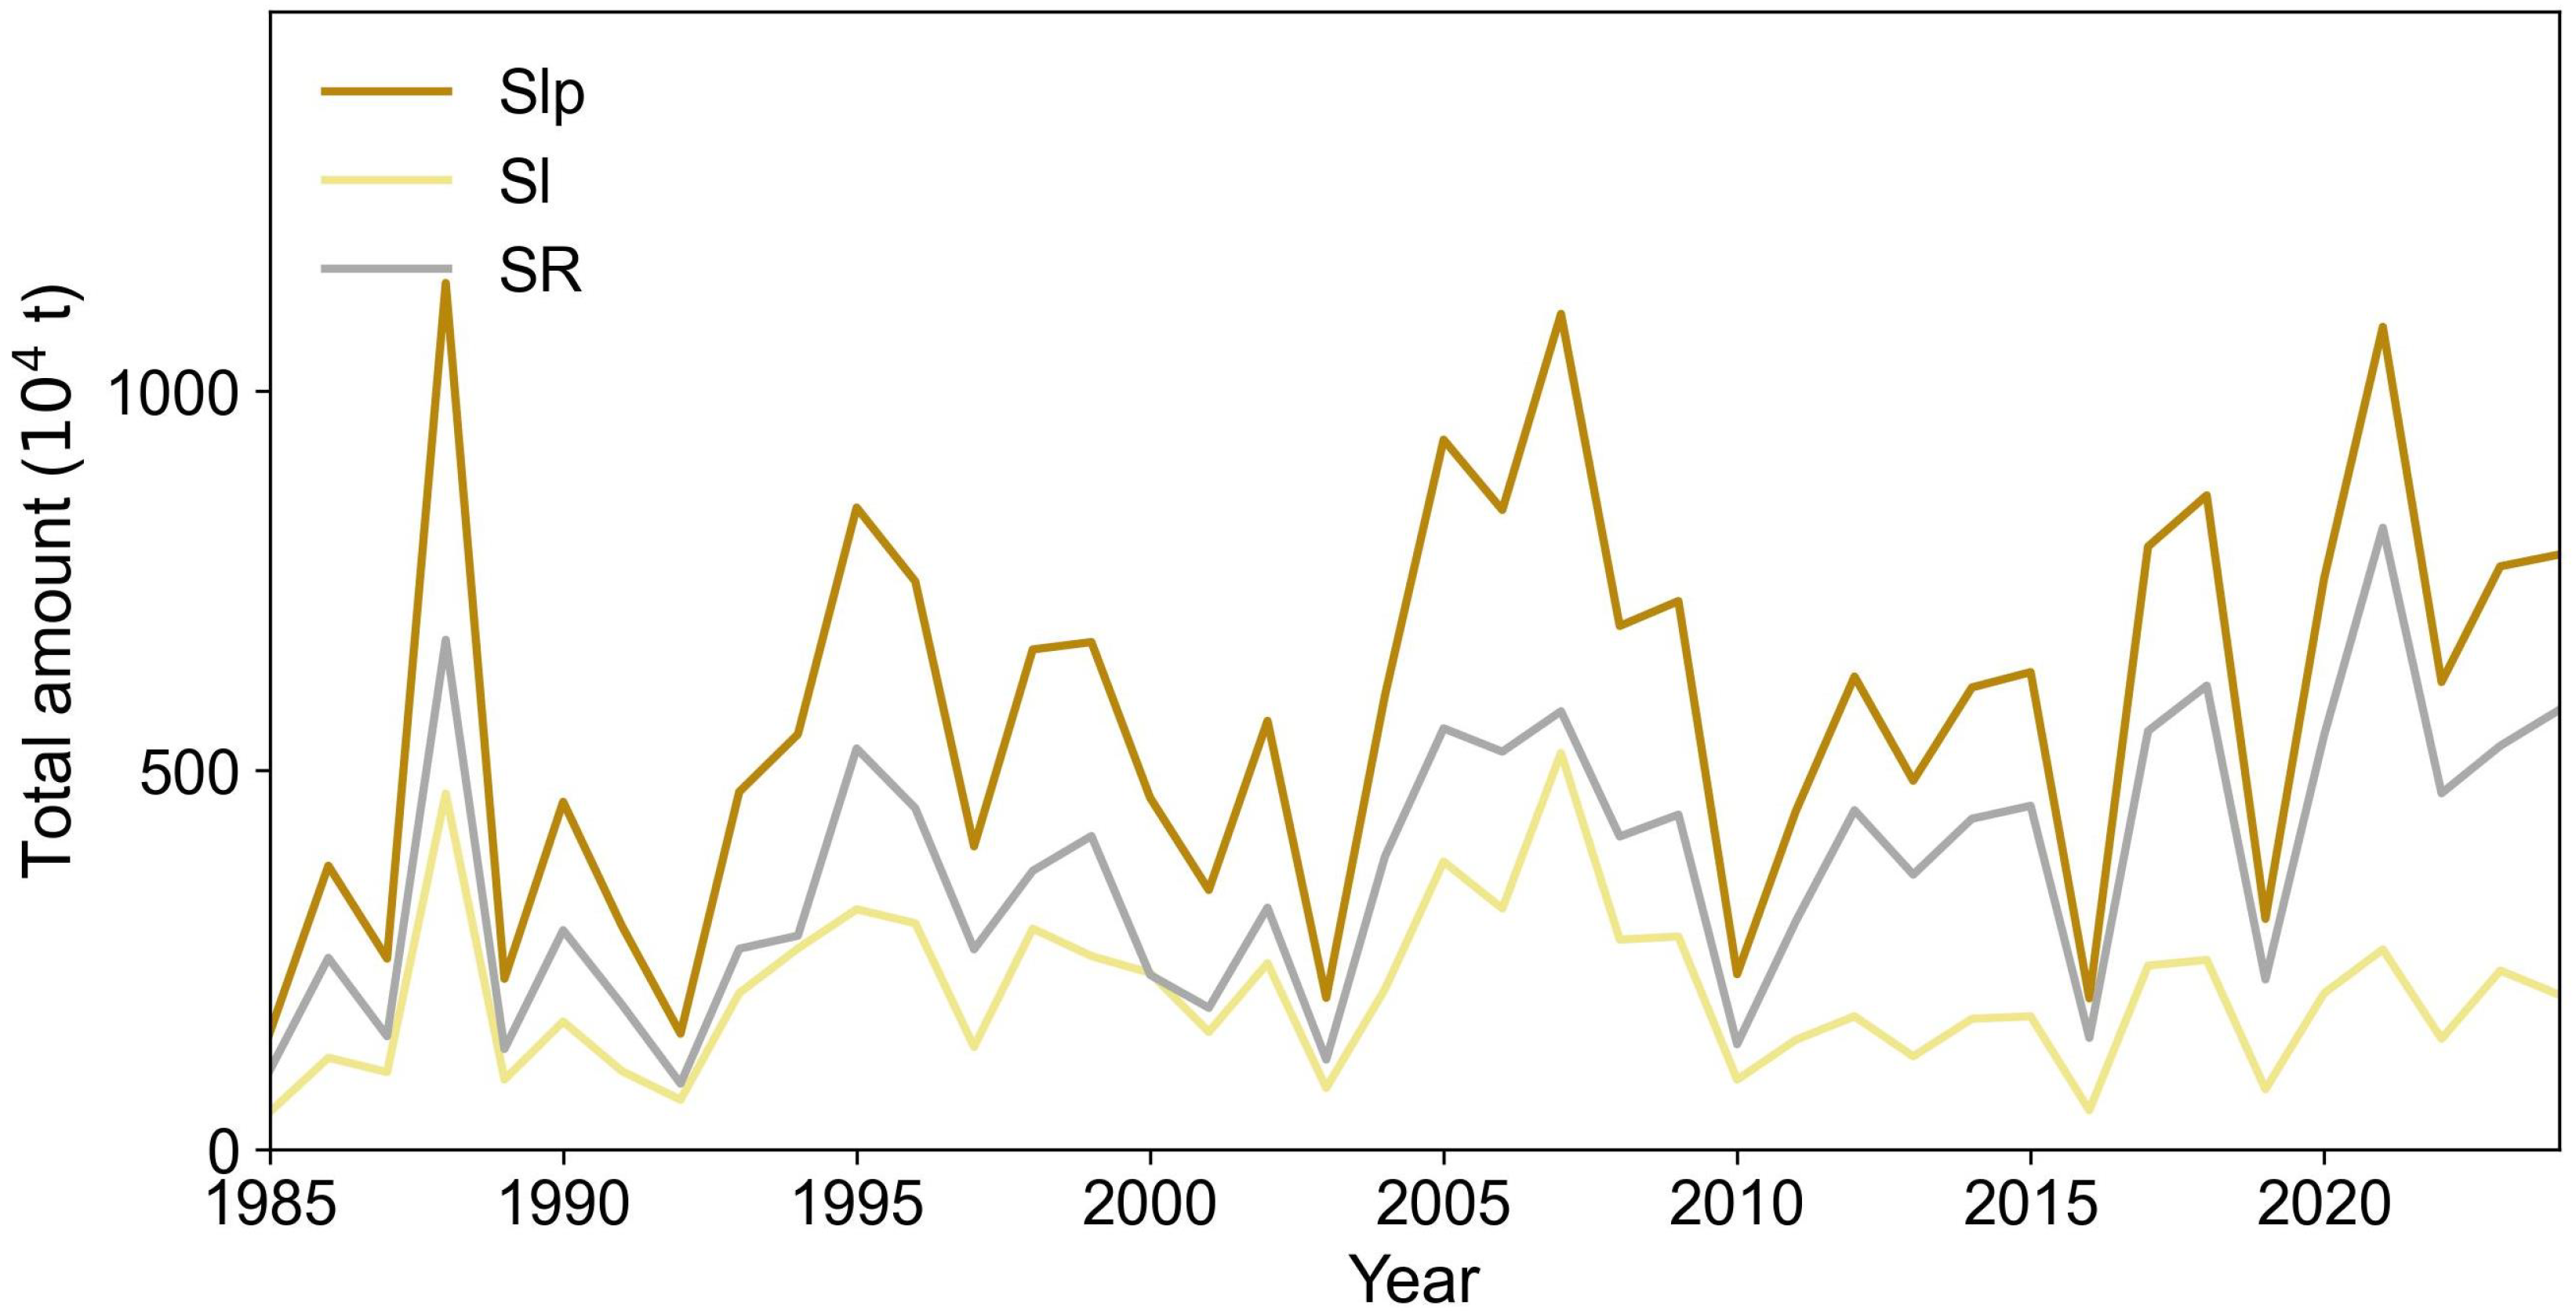
Figure 4 illustrates the temporal variations in potential wind erosion (Slp), actual wind erosion (Sl), and wind erosion prevention service (SR) in Duolun County from 1985 to 2024. Slp consistently exceeded Sl with mean values of 5.76 × 10 6 t and 2.05 × 10 6 t, respectively. Actual erosion accounted for only 36% of potential erosion, highlighting the crucial role of vegetation in mitigating wind erosion. SR exhibited significant interannual fluctuations but an overall increasing trend of 9.06 × 10 4 t/year, rising from 8.70 × 10 5 t in 1992 to 8.20 × 10 6 t in 2021, indicating a steady enhancement of wind erosion prevention services during the past four decades.
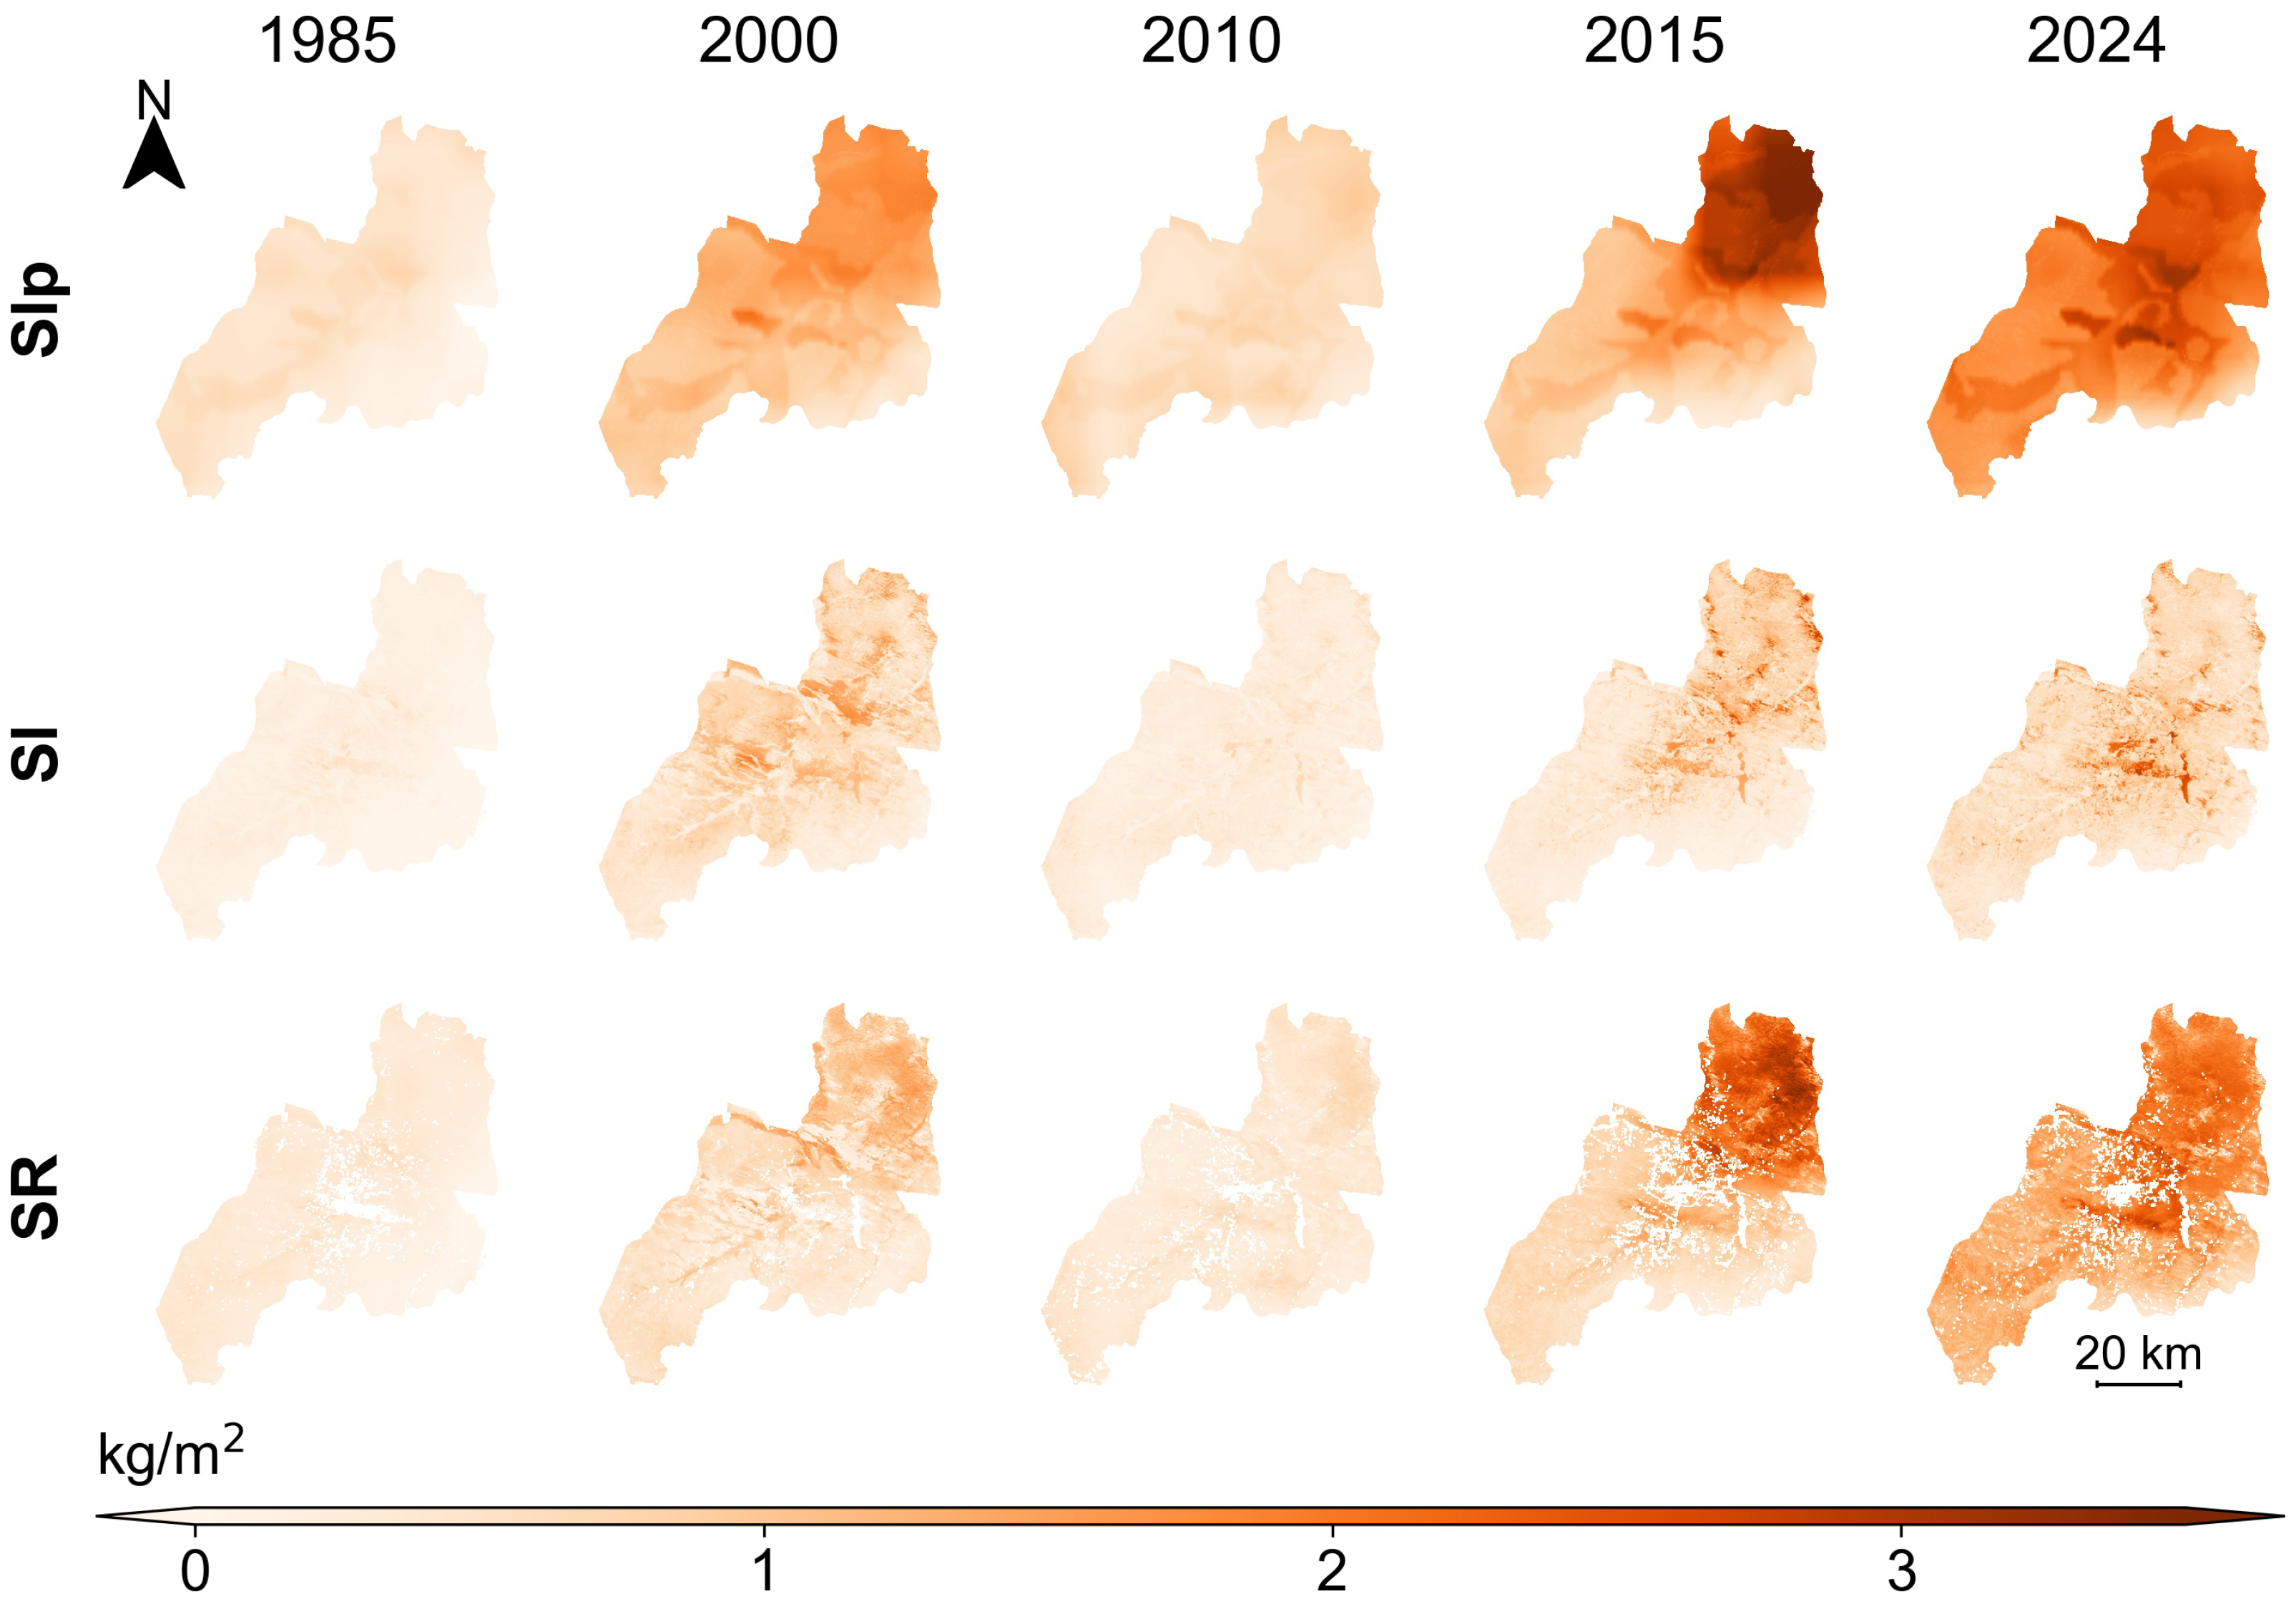
Figure 5 shows the spatial distribution of Slp, Sl, and SR across five representative years. Overall, Slp consistently exceeded Sl across all periods. High Slp values were observed in the northern region in 2015 and across the entire study area in 2024, with potential erosion reaching up to 3 kg/m2 in 2015 and exceeding 2 kg/m2 in 2024. In contrast, Sl remained low (mostly 0–1 kg/m2) and exhibited limited spatial variability, highlighting the effectiveness of large-scale forest restoration and ecological conservation efforts since 2010 in mitigating erosion risks. SR exhibited spatial patterns similar to Slp. During periods of low erosion potential (1985 and 2010), SR values were generally below 1 kg/m2 with minimal spatial variation. When erosion pressure intensified (2000 and 2015), SR increased, particularly in northern areas, reaching 1–3 kg/m2 and locally exceeded 3.5 kg/m2 in 2015. By 2024, despite persistent high erosion potential, SR values remained elevated at 1–2 kg/m2, reflecting the combined effects of climatic conditions and ongoing ecological interventions.
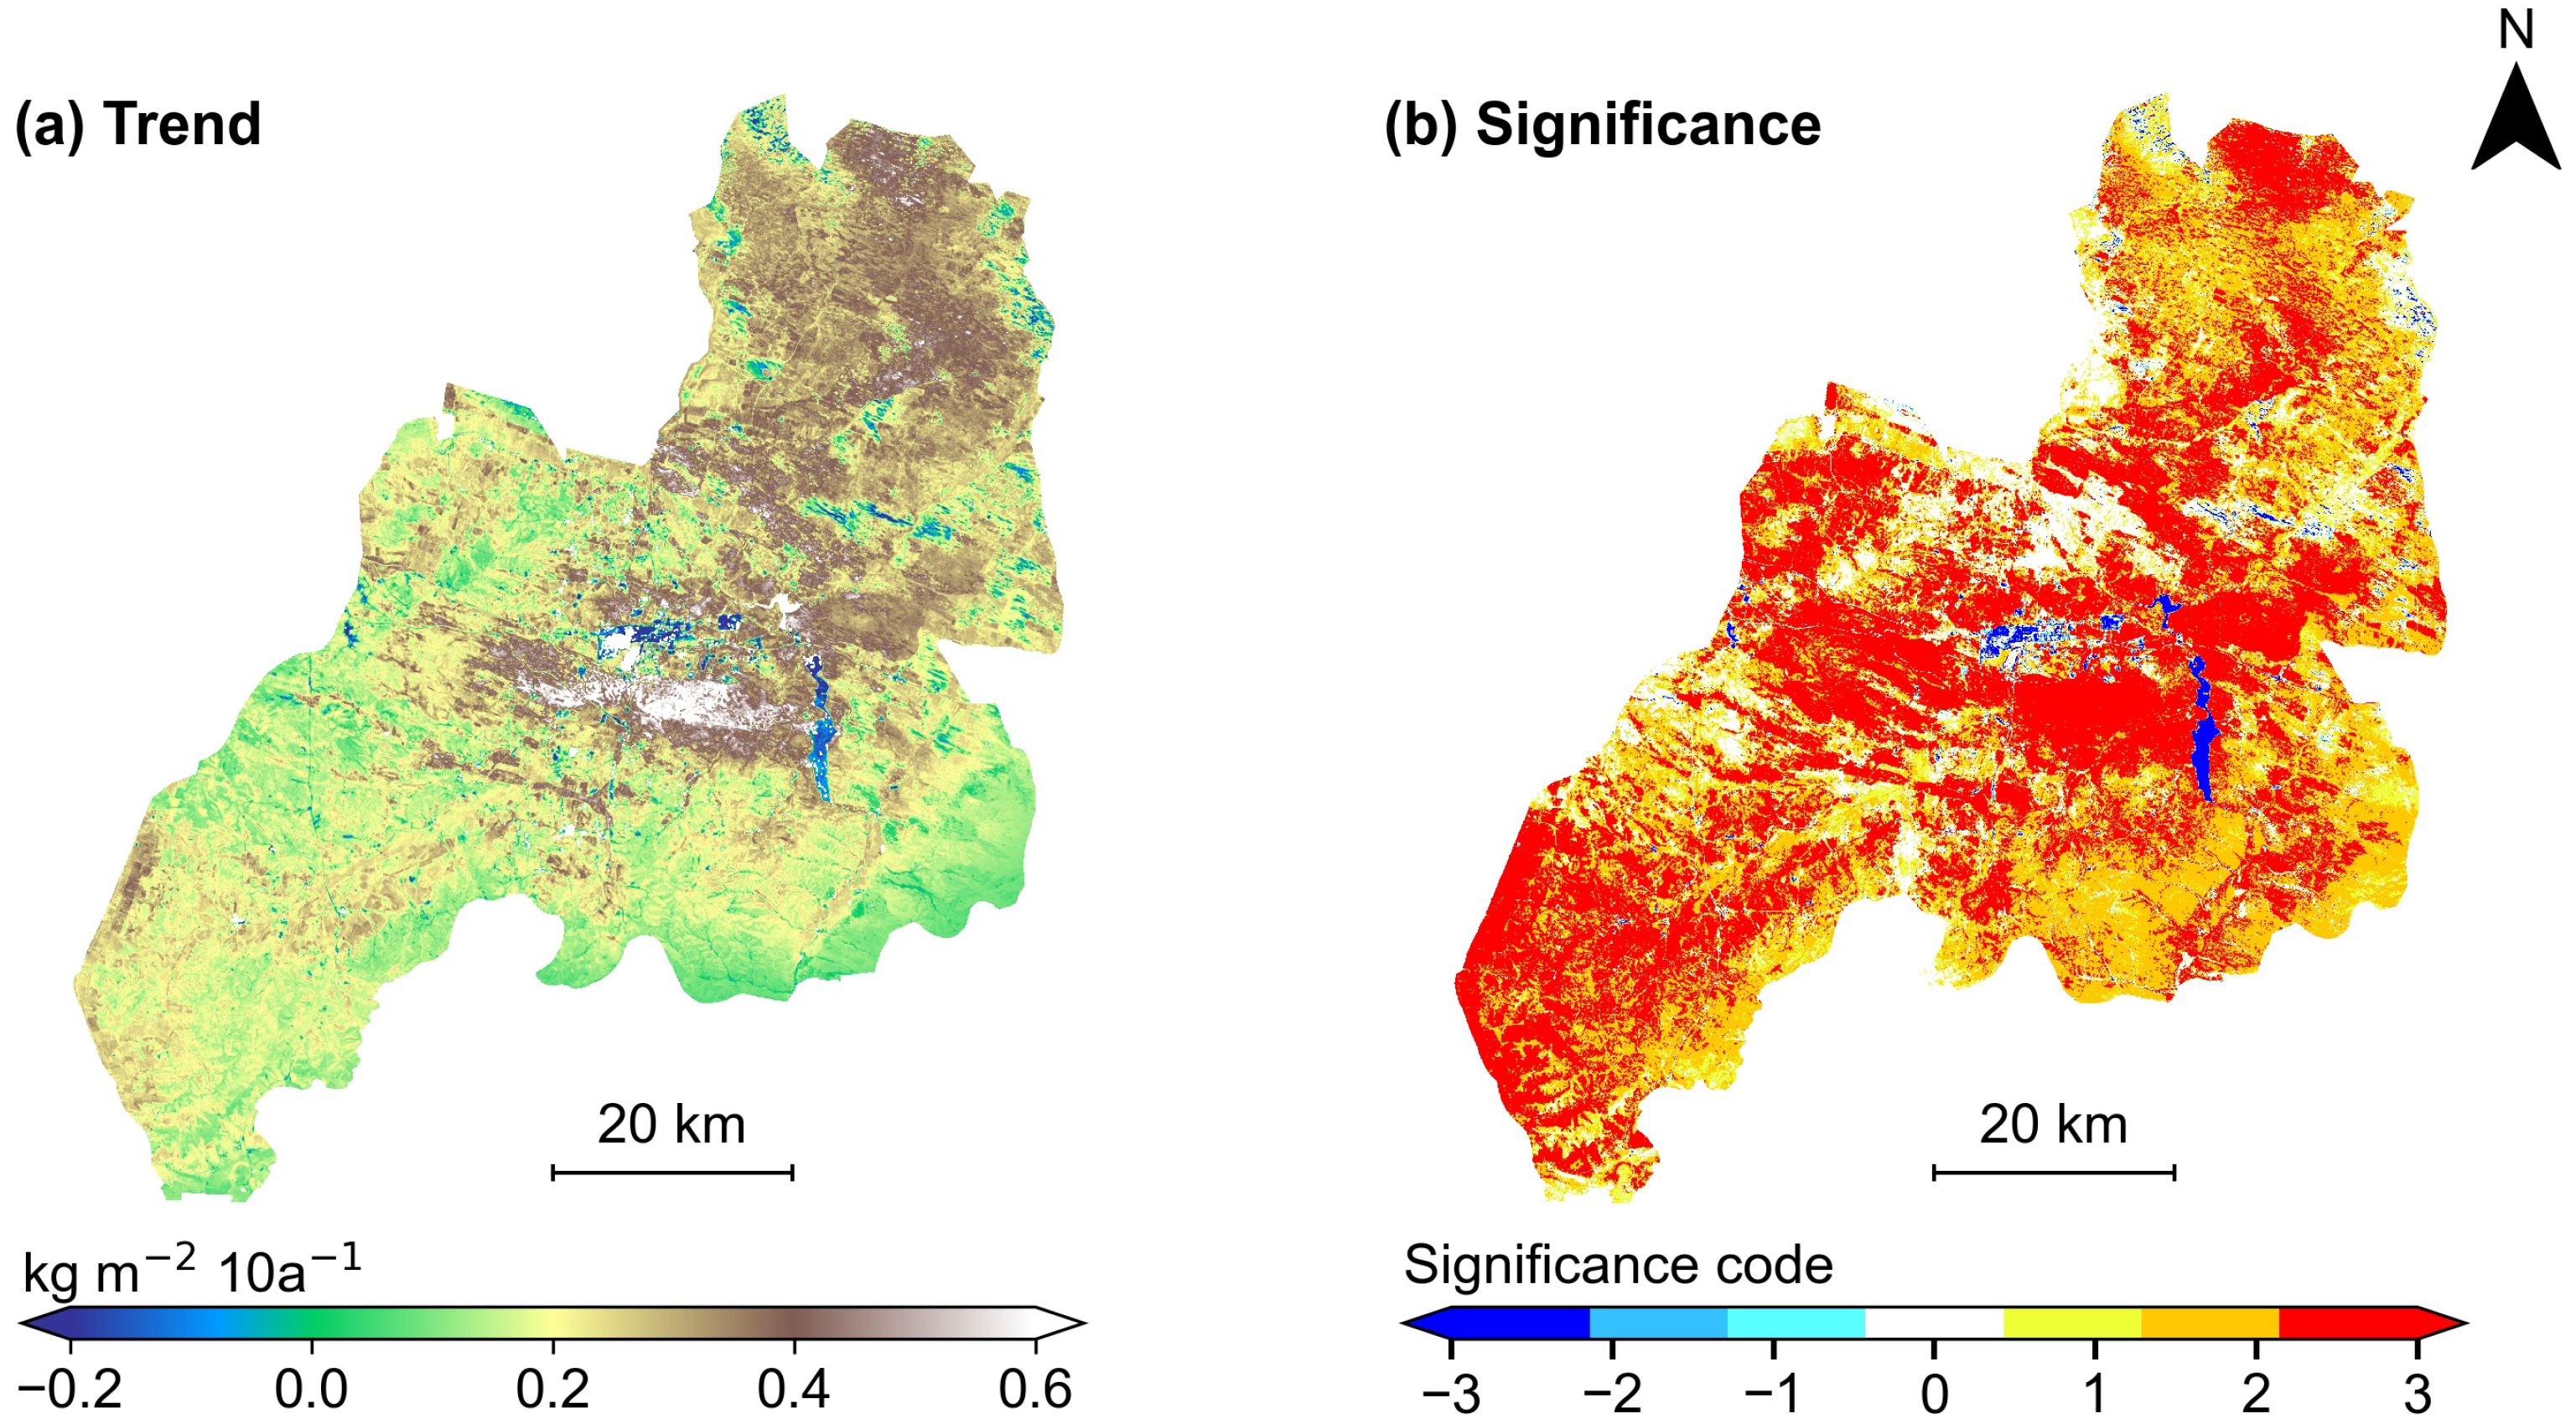
Figure 6 presents the spatial trends and significance of SR in Duolun County from 1985 to 2024. SR showed a widespread increasing trend, with rates of 0.1 to 0.3 kg/m2 per decade across most areas. The strongest increases (0.4–0.6 kg/m2 per decade) occurred in the northern hills and central desertified zones, whereas slight decreases (−0.3–0.1 kg/m2 per decade) were confined to the Luan River basin and urban centers. Significance analysis showed that 87.07% of the area passed the 90% confidence level, of which 98.26% displayed upward trends. Extremely significant increases (48.33%) were concentrated in the southern and central forest restoration zones, while significant and slightly significant increases (38.05% and 11.87%) occurred mainly in northern and eastern areas. Only 1.74% of the region experienced declines, primarily in the Luan River basin and urban land. These results highlight that long-term afforestation and land management efforts have substantially enhanced regional wind erosion control.

3.3. Forest Expansion and Wind Erosion Control

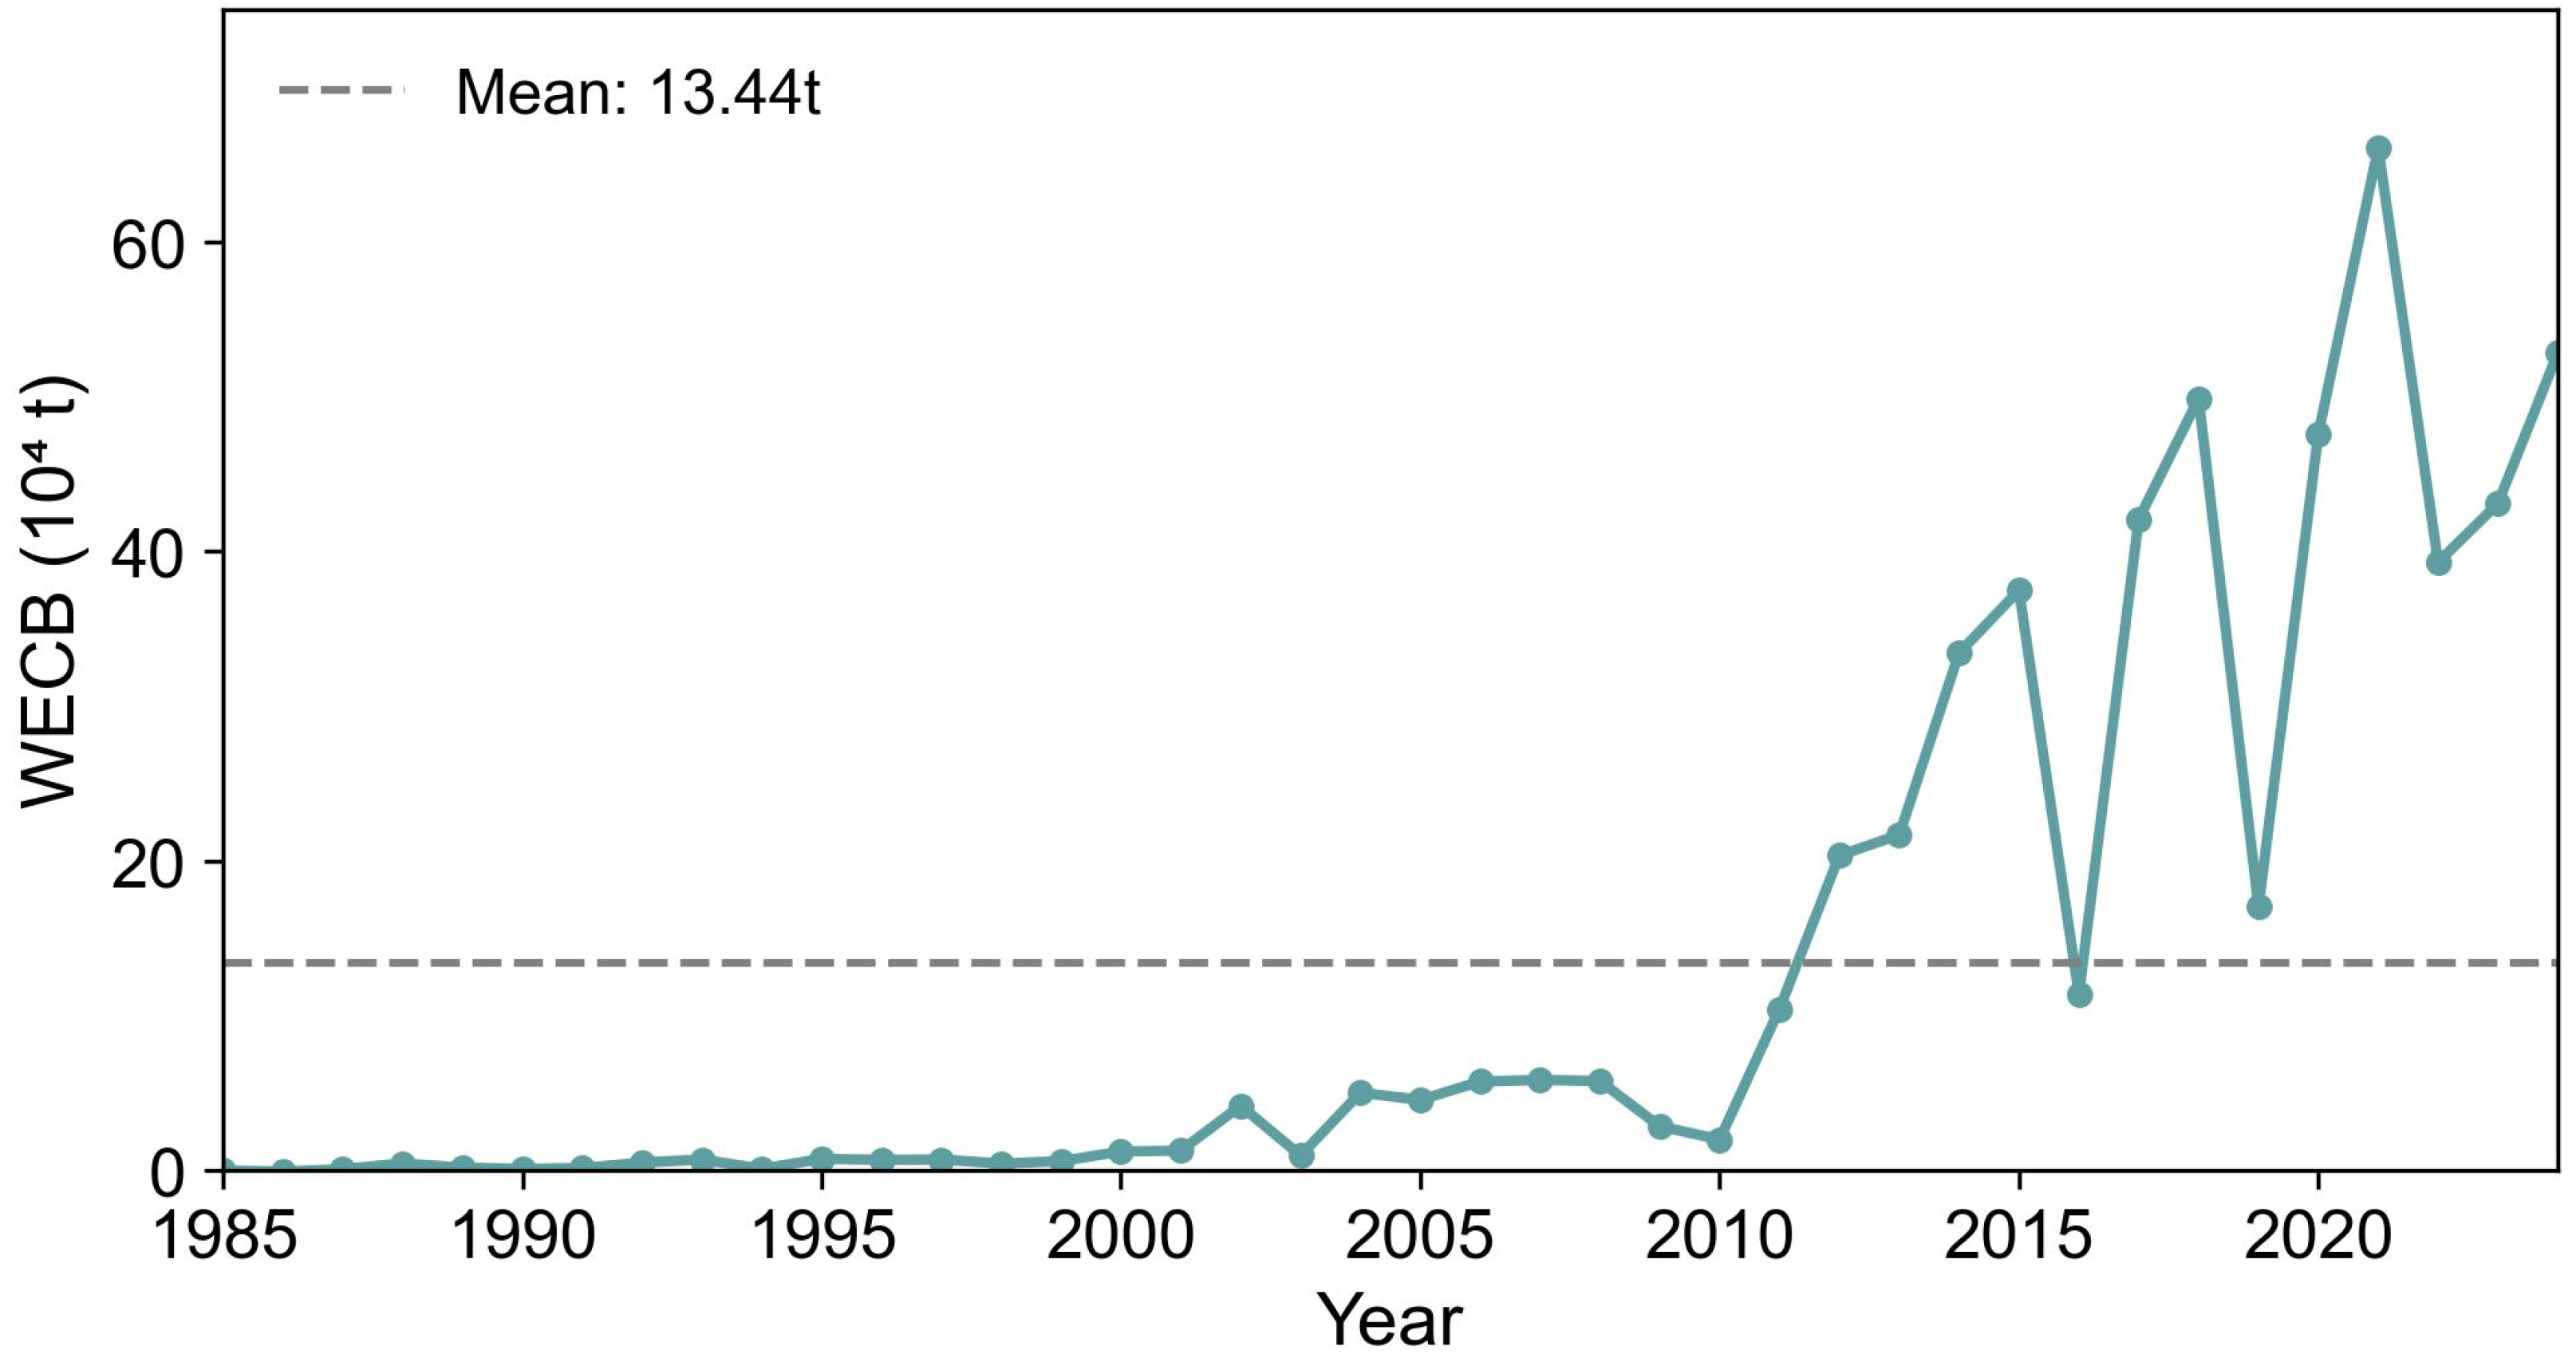
Figure 7 illustrates the temporal evolution of WECB from 1985 to 2024. Overall, WECB increased markedly from near zero to 6.61 × 10 5 t, with an average growth rate of 8206.70 t/year, closely following the implementation of major afforestation and ecological restoration programs. During 1985–2000, WECB remained low, reflecting the limited impact of early small-scale restoration efforts. From 2000 to 2010, it rose steadily from 1.20 × 10 4 t to 2.84 × 10 4 t (≈1600 t/year) as large-scale programs such as the GGP began. A rapid increase occurred during 2010–2015, reaching 3.75 × 10 5 t at an annual rate of 7.10 × 10 4 t/year, highlighting the strong erosion reduction effect of extensive afforestation. After 2015, WECB continued to grow at an annual rate of about 4.17 × 10 4 t/year, indicating that sustained forest protection further enhanced erosion control. Occasional declines in certain years (such as 2010, 2016, 2019) were mainly associated with reduced wind speeds and fewer erosion events. These results demonstrate that large-scale afforestation and ecological restoration substantially strengthened wind erosion control relative to a no-restoration baseline.
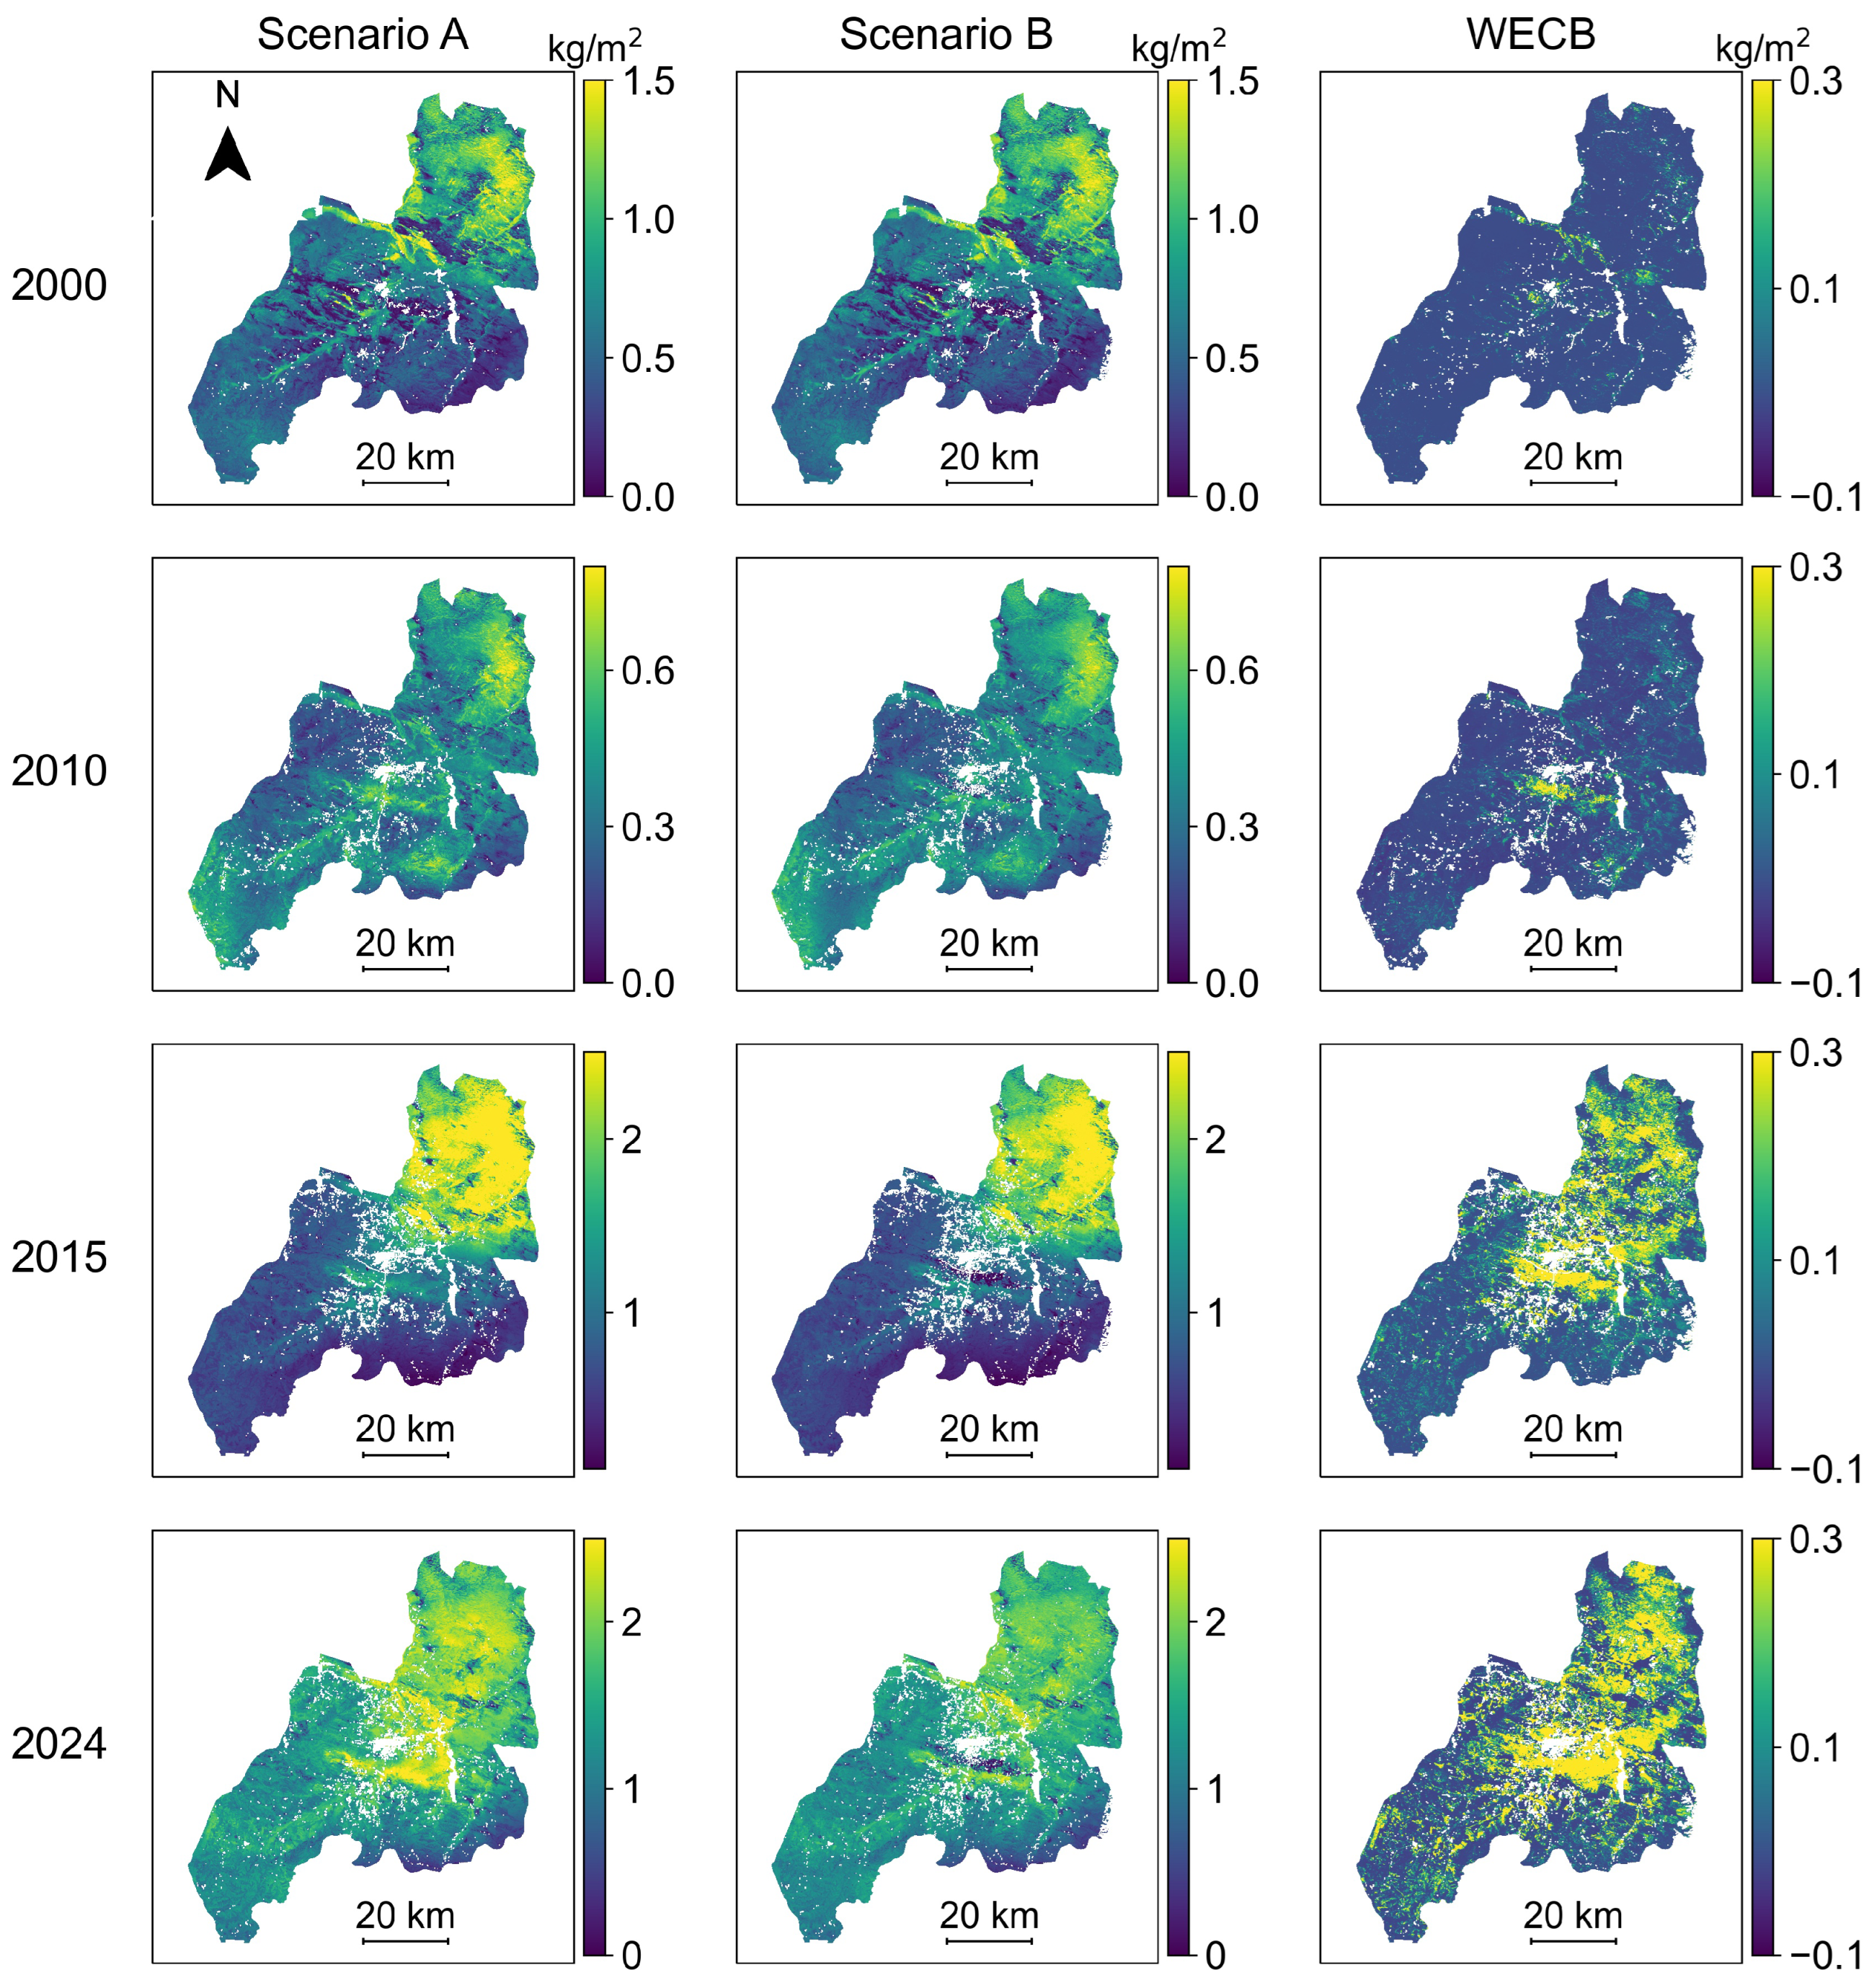
Figure 8 shows the spatial distributions of SR under Scenarios A and B, and their differences (WECB), for 2000, 2010, 2015, and 2024. The year 1985 was excluded because it served as the baseline with identical SR values under both scenarios. Overall, the spatial pattern of WECB was closely associated with forest expansion (Figure 3). In 2000, WECB values were generally low (−1–0.3 kg/m2) and spatially scattered. By 2010, with forest recovery in the central region, distinct high-WECB areas (0.3 to 0.7 kg/m2) emerged. In 2015, newly restored forests in the central and northern regions exhibited higher WECB values, reaching 1–2 kg/m2 and 0.2–0.6 kg/m2, respectively. By 2024, forest cover became more continuous, and high-WECB areas further expanded, exceeding 2 kg/m2 in the central region and 0.2–0.8 kg/m2 in the north. However, in the southwestern region, vegetation recovery remained limited, resulting in correspondingly lower wind erosion control benefits.
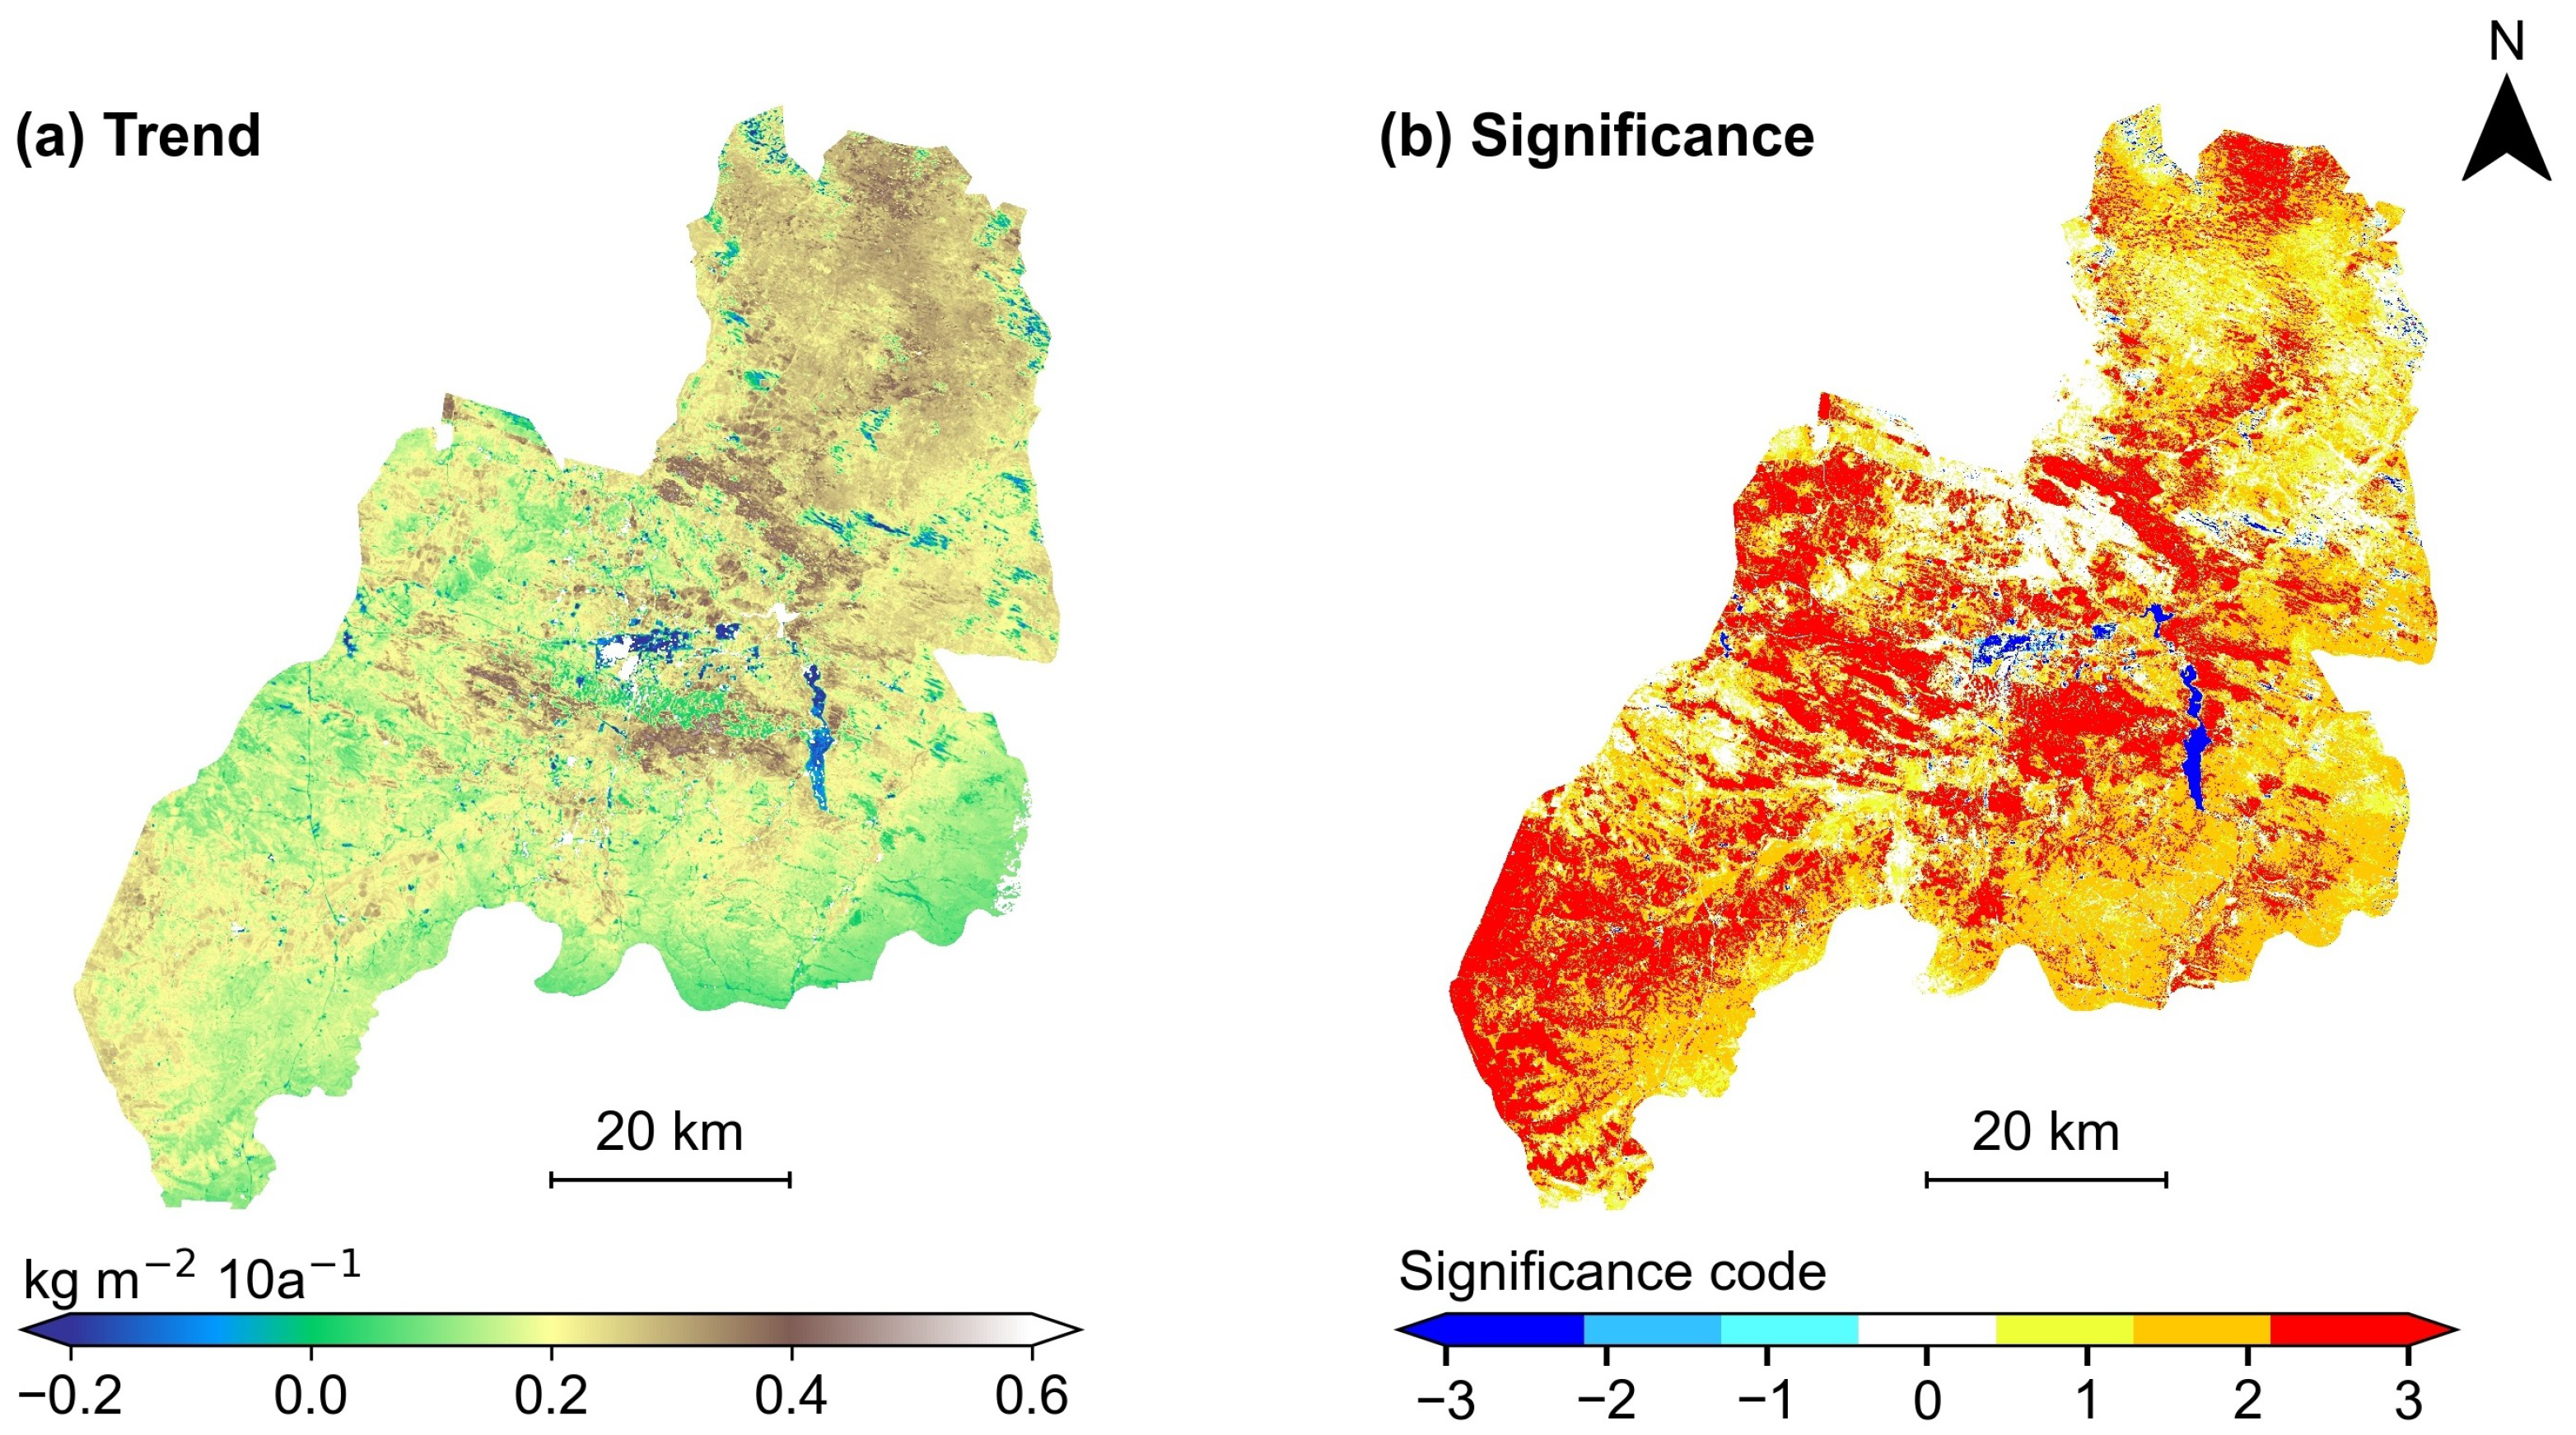
To facilitate comparison with Scenario A, the Theil–Sen median and MK tests were also applied to Scenario B (Figure 9). Overall, SR under Scenario B showed an increasing trend, but the magnitude was lower than in Scenario A, with most areas increasing by only 0–0.1 kg/m2 per decade. High-value SR clusters observed in the central and northern regions under Scenario A were largely absent in Scenario B, indicating that large-scale afforestation was the main driver of these concentrated gains. Notably, even without the GGP, SR trends in Scenario B remained positive, likely reflecting grassland recovery and other ecological protection measures. Significance analysis revealed that 83.34% of the area passed the 90% confidence level, of which 98.12% exhibited increasing trends, comparable to Scenario A. However, the proportions of significance levels differed between the two scenarios. Under Scenario B, 45.3% of the area showed significant increases, 35.6% extremely significant increases, and 17.3% slightly significant increases. Spatially, areas that were extremely significant under Scenario A—central, north-central, and southeastern regions—shifted to significant or slightly significant increases under Scenario B. Similarly, northern regions that were significant under Scenario A were reduced to slightly significant. These results demonstrate that large-scale afforestation not only accelerated sand fixation but also produced stronger and more spatially concentrated improvements in erosion control than passive vegetation recovery alone.

4. Discussion

4.1. Spatiotemporal Dynamics and Mechanisms

Long-term RWEQ simulations demonstrate that large-scale afforestation and ecological restoration have significantly enhanced the sand fixation capacity in Duolun County, although the effects are temporally and spatially heterogeneous. The SR time series reveals four distinct phases: a low-impact period (1985–2000) preceding major interventions, a steady growth stage (2000–2010) concurrent with the implementation of the GGP, a rapid accumulation phase (2010–2015), and a relatively stable growth stage after 2015. This temporal pattern aligns closely with the timeline of regional restoration projects and indicates a lagged ecological response, as it typically takes several years for canopy closure, litter accumulation, and soil stabilization to translate into measurable reductions in wind erosion [55,56].
The observed decline in wind erosion modulus can be attributed to the combined effects of increasing surface roughness and canopy cover, which reduce threshold friction velocity and sediment entrainment, together with the accumulation of litter and root reinforcement that enhance soil cohesion and surface crusting [9,57,58]. Although interannual variability in near-surface wind conditions modulates this trend, vegetation recovery remains the dominant control. Overall, these results suggest that land cover transformation and ecological restoration are the primary drivers of wind erosion reduction, while climatic variability chiefly governs short-term fluctuations and extreme years.
Spatially, the heterogeneity in SR improvement reflects the interaction between ecological potential and geomorphological forcing. High SR clusters in the central and northern hilly areas correspond to continuous forest expansion and canopy connectivity, which effectively reduce sand transport distance and near-surface wind speed. In contrast, the southwestern and peripheral zones—characterized by limited vegetation recovery—show weaker or negligible improvements. These contrasts highlight that ecological potential (e.g., soil conditions, seedling survival, precipitation) determines restoration success, whereas wind and terrain factors (dominant direction, topographic acceleration) define baseline erosion pressure. Where both factors are favorable, afforestation produces strong and spatially coherent benefits, but under climatic or edaphic constraints, passive or fragmented recovery remains insufficient to deliver comparable sand fixation effects.
Pixel-wise trend and significance analyses reinforce these interpretations. Compared with the passive-restoration counterfactual (Scenario B), active afforestation (Scenario A) not only increased the mean SR but also reshaped its spatial structure, generating contiguous high-SR clusters and amplifying the overall magnitude of improvement. Although Scenario B still exhibited broadly positive trends—reflecting the contributions of grassland and non-forest restoration programs—the greater magnitude and spatial coherence of Scenario A indicate that targeted afforestation accelerates and amplifies ecosystem service gains beyond what passive natural recovery alone can achieve.

4.2. Comparison with Previous Studies

To evaluate the reliability of our RWEQ-based simulations, we compared our results with two previous studies conducted in the same region [59,60]. To the best of our knowledge, no prior research has directly quantified the contribution of forest restoration to wind erosion control in Duolun County. Therefore, our comparison focuses on three key aspects: (1) the accuracy of the estimated wind erosion modulus, (2) the spatial consistency and credibility of the simulated distribution, and (3) the temporal coherence of the observed trends.
Dang et al. [59] reported that the total actual wind erosion in Duolun County was 1.36 × 10 5 t in 2000 and 6.38 × 10 4 t in 2016. In comparison, our RWEQ-based simulations estimated 2.33 × 10 6 t and 5.18 × 10 5 t for the corresponding years. Although the values are higher, both datasets exhibit the same order of magnitude and a consistent decreasing trend, indicating that our simulations reasonably capture the long-term erosion dynamics. The higher estimates in our results is likely attributable to differences in meteorological forcing. Dang et al. [59] interpolated station observations, whereas our study used reanalysis-based meteorological inputs. A comparison of 2 m wind speeds shows that station observations were 2.15 m/s and 2.28 m/s in 2000 and 2016, respectively, while the reanalysis products reported higher values of 2.66 m/s and 2.78 m/s for the same years. Because wind speed is strongly amplified within the RWEQ formulation, the use of higher reanalysis wind speeds can plausibly explain the elevated erosion estimates in our simulations.
Dai et al. [60] did not report total erosion estimates but mapped actual wind erosion for 2017, with values ranging from 0 to 0.99 kg/m2. In our simulations, the 2017 erosion ranged from 0 to 3 kg/m2, and this difference may also arise from systematic differences in meteorological inputs. Spatially, Dai et al. [60] identified a gradient of increasing erosion potential from southwest to northeast, which aligns well with the spatial pattern of actual erosion reproduced in this study (Supplementary Figure S2).
In terms of temporal dynamics, both Dang et al. and Dai et al. [59,60] reported declining trends in actual wind erosion and increasing trends in wind erosion control, which are fully consistent with our long-term simulations. Specifically, Dai et al. [60] observed slight to significant decreases in Sl across most non-water areas, corresponding well with our finding that SR generally increased over vegetated land (Figure 6). These consistencies indicate that both the magnitudes and temporal patterns produced by our RWEQ-based simulations are reasonable and supported by existing literature, thereby confirming the robustness and reliability of the modeling framework employed in this study.

4.3. Natural Factors Associated with the Change in Wind Erosion Modulus

(1)
Wind speed and sand-driving days
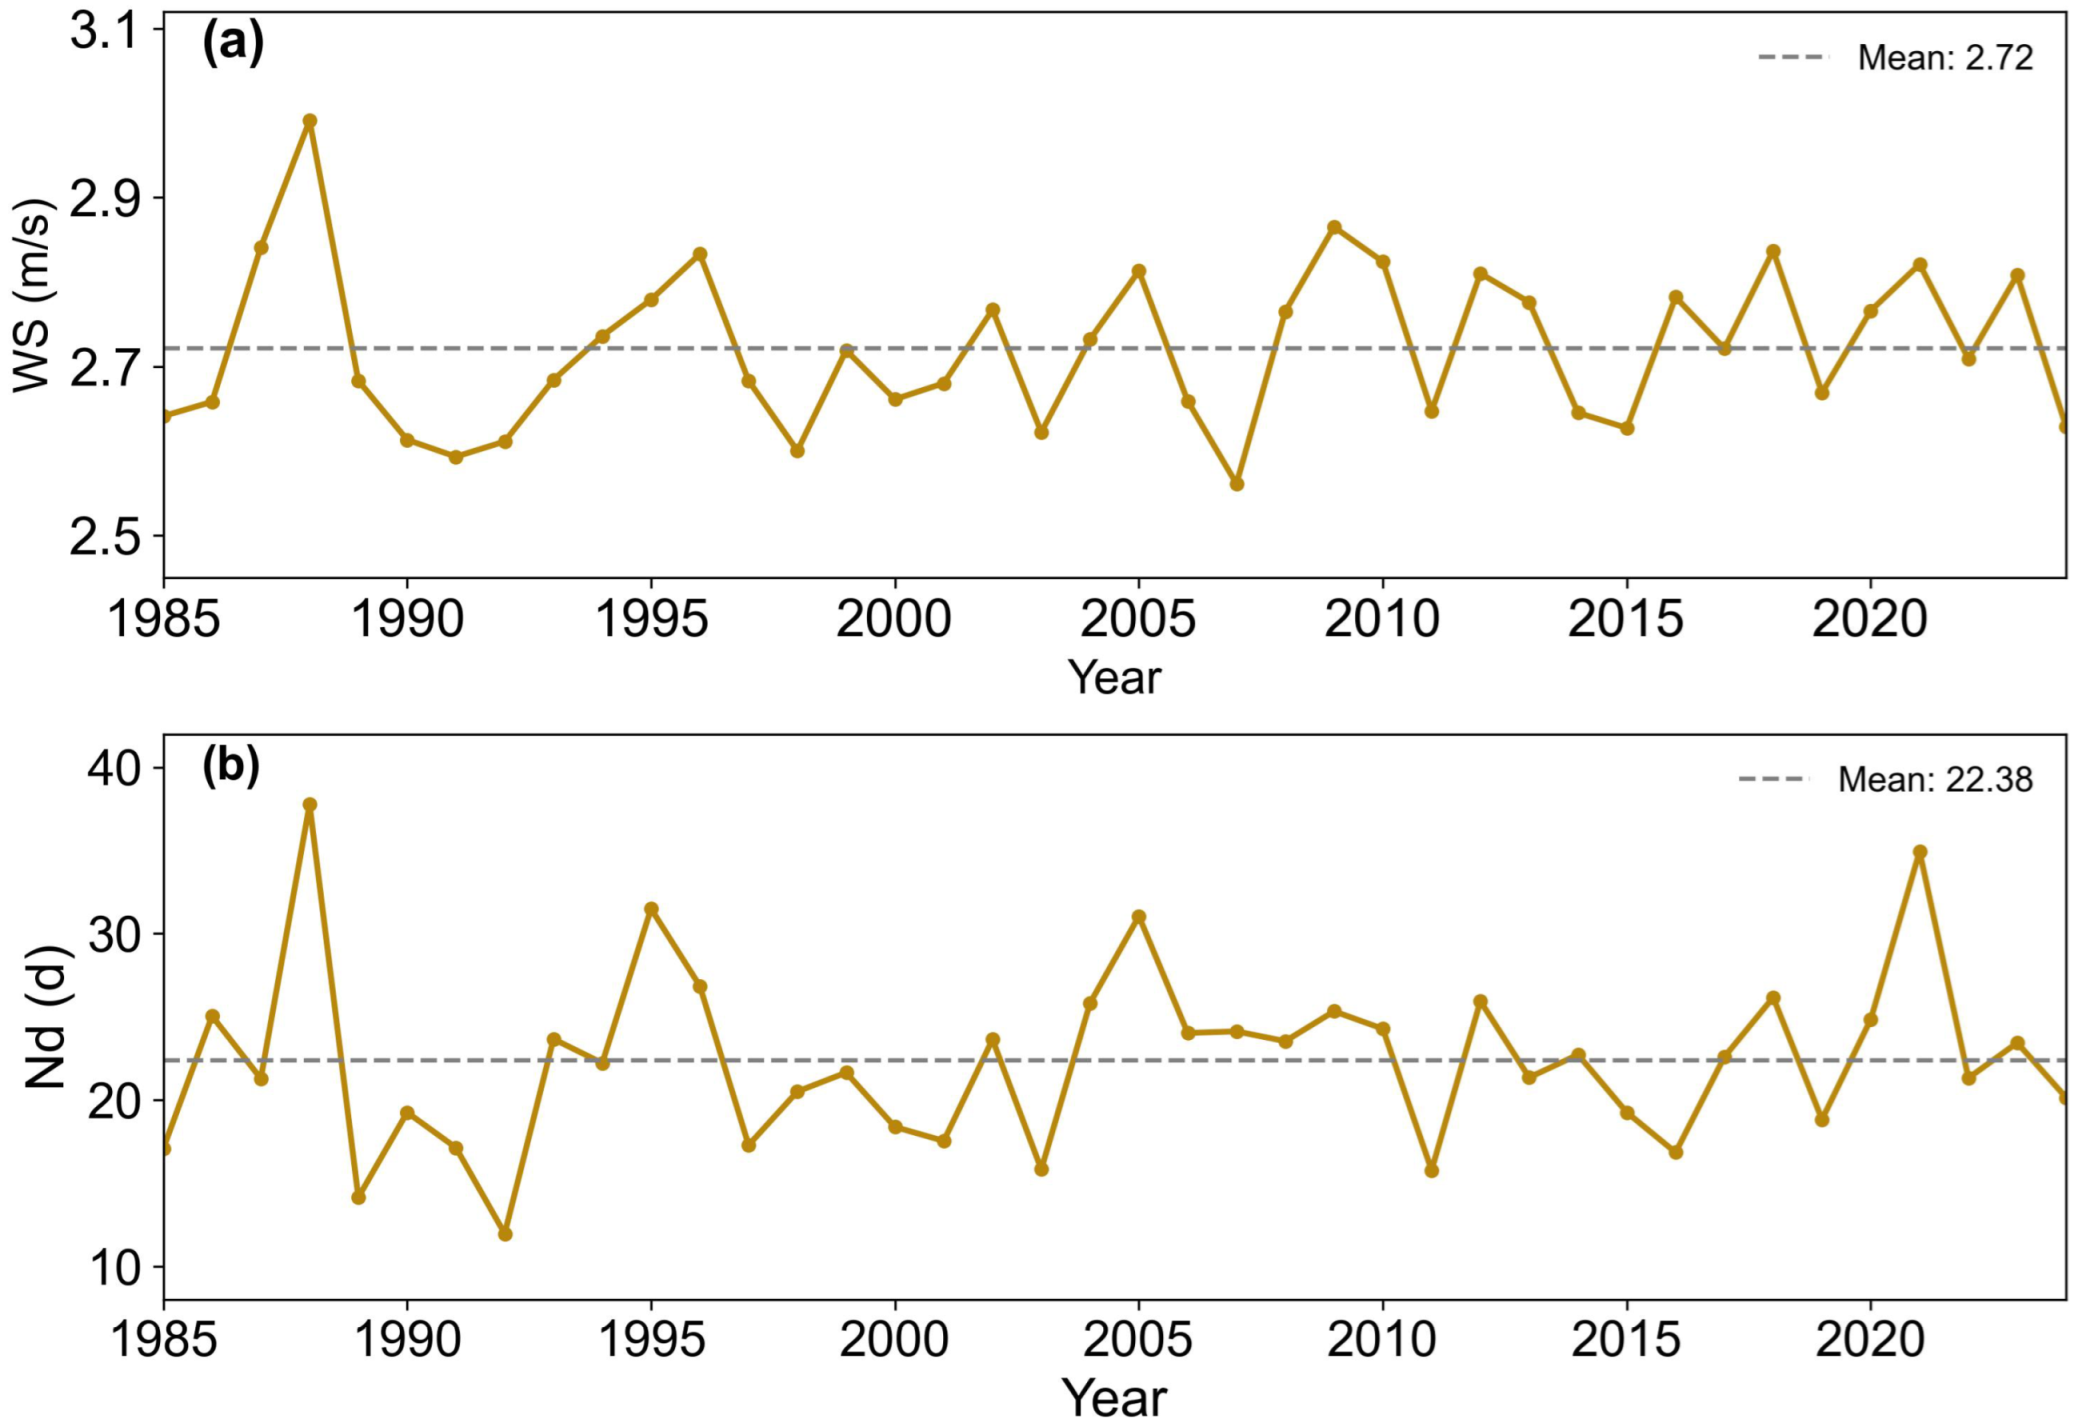
Wind speed and the sand-driving days are the two primary meteorological drivers of wind erosion intensity. Wind speed directly controls the initiation and transport of soil particles, while its variability significantly regulates regional wind erosion dynamics. Reanalysis data from 1985 to 2024 show that the mean annual wind speed peaked in 1988 (2.99 m/s) and the lowest value in 2007 (2.56 m/s) (Figure 10a). Regression analysis indicates a significant positive correlation between wind speed and both potential wind erosion modulus ( r = 0.37 , p < 0.05 ) and actual wind erosion modulus ( r = 0.29 , p < 0.05 ). This suggests that wind speed largely determines the likelihood and severity of wind erosion.
In contrast, the number of sand-driving days reflects how frequently wind conditions exceed the threshold for soil particle entrainment, thereby exerting a cumulative effect on erosion processes. Based on daily wind speed records, we calculated the annual sand-driving days in the study area from 1985 to 2024 (Figure 10b). The maximum occurred in 1988 (38 days), followed by 2021 (35 days), whereas 1989 recorded only 14 days. Regression analysis revealed strong positive correlations with potential ( r = 0.79 , p < 0.05 ) and actual wind erosion modulus ( r = 0.69 , p < 0.05 ). These findings highlight that variations in both wind speed and sand-driving days jointly modulate the interannual fluctuations in wind erosion intensity across the region.
(2)
Precipitation and temperature
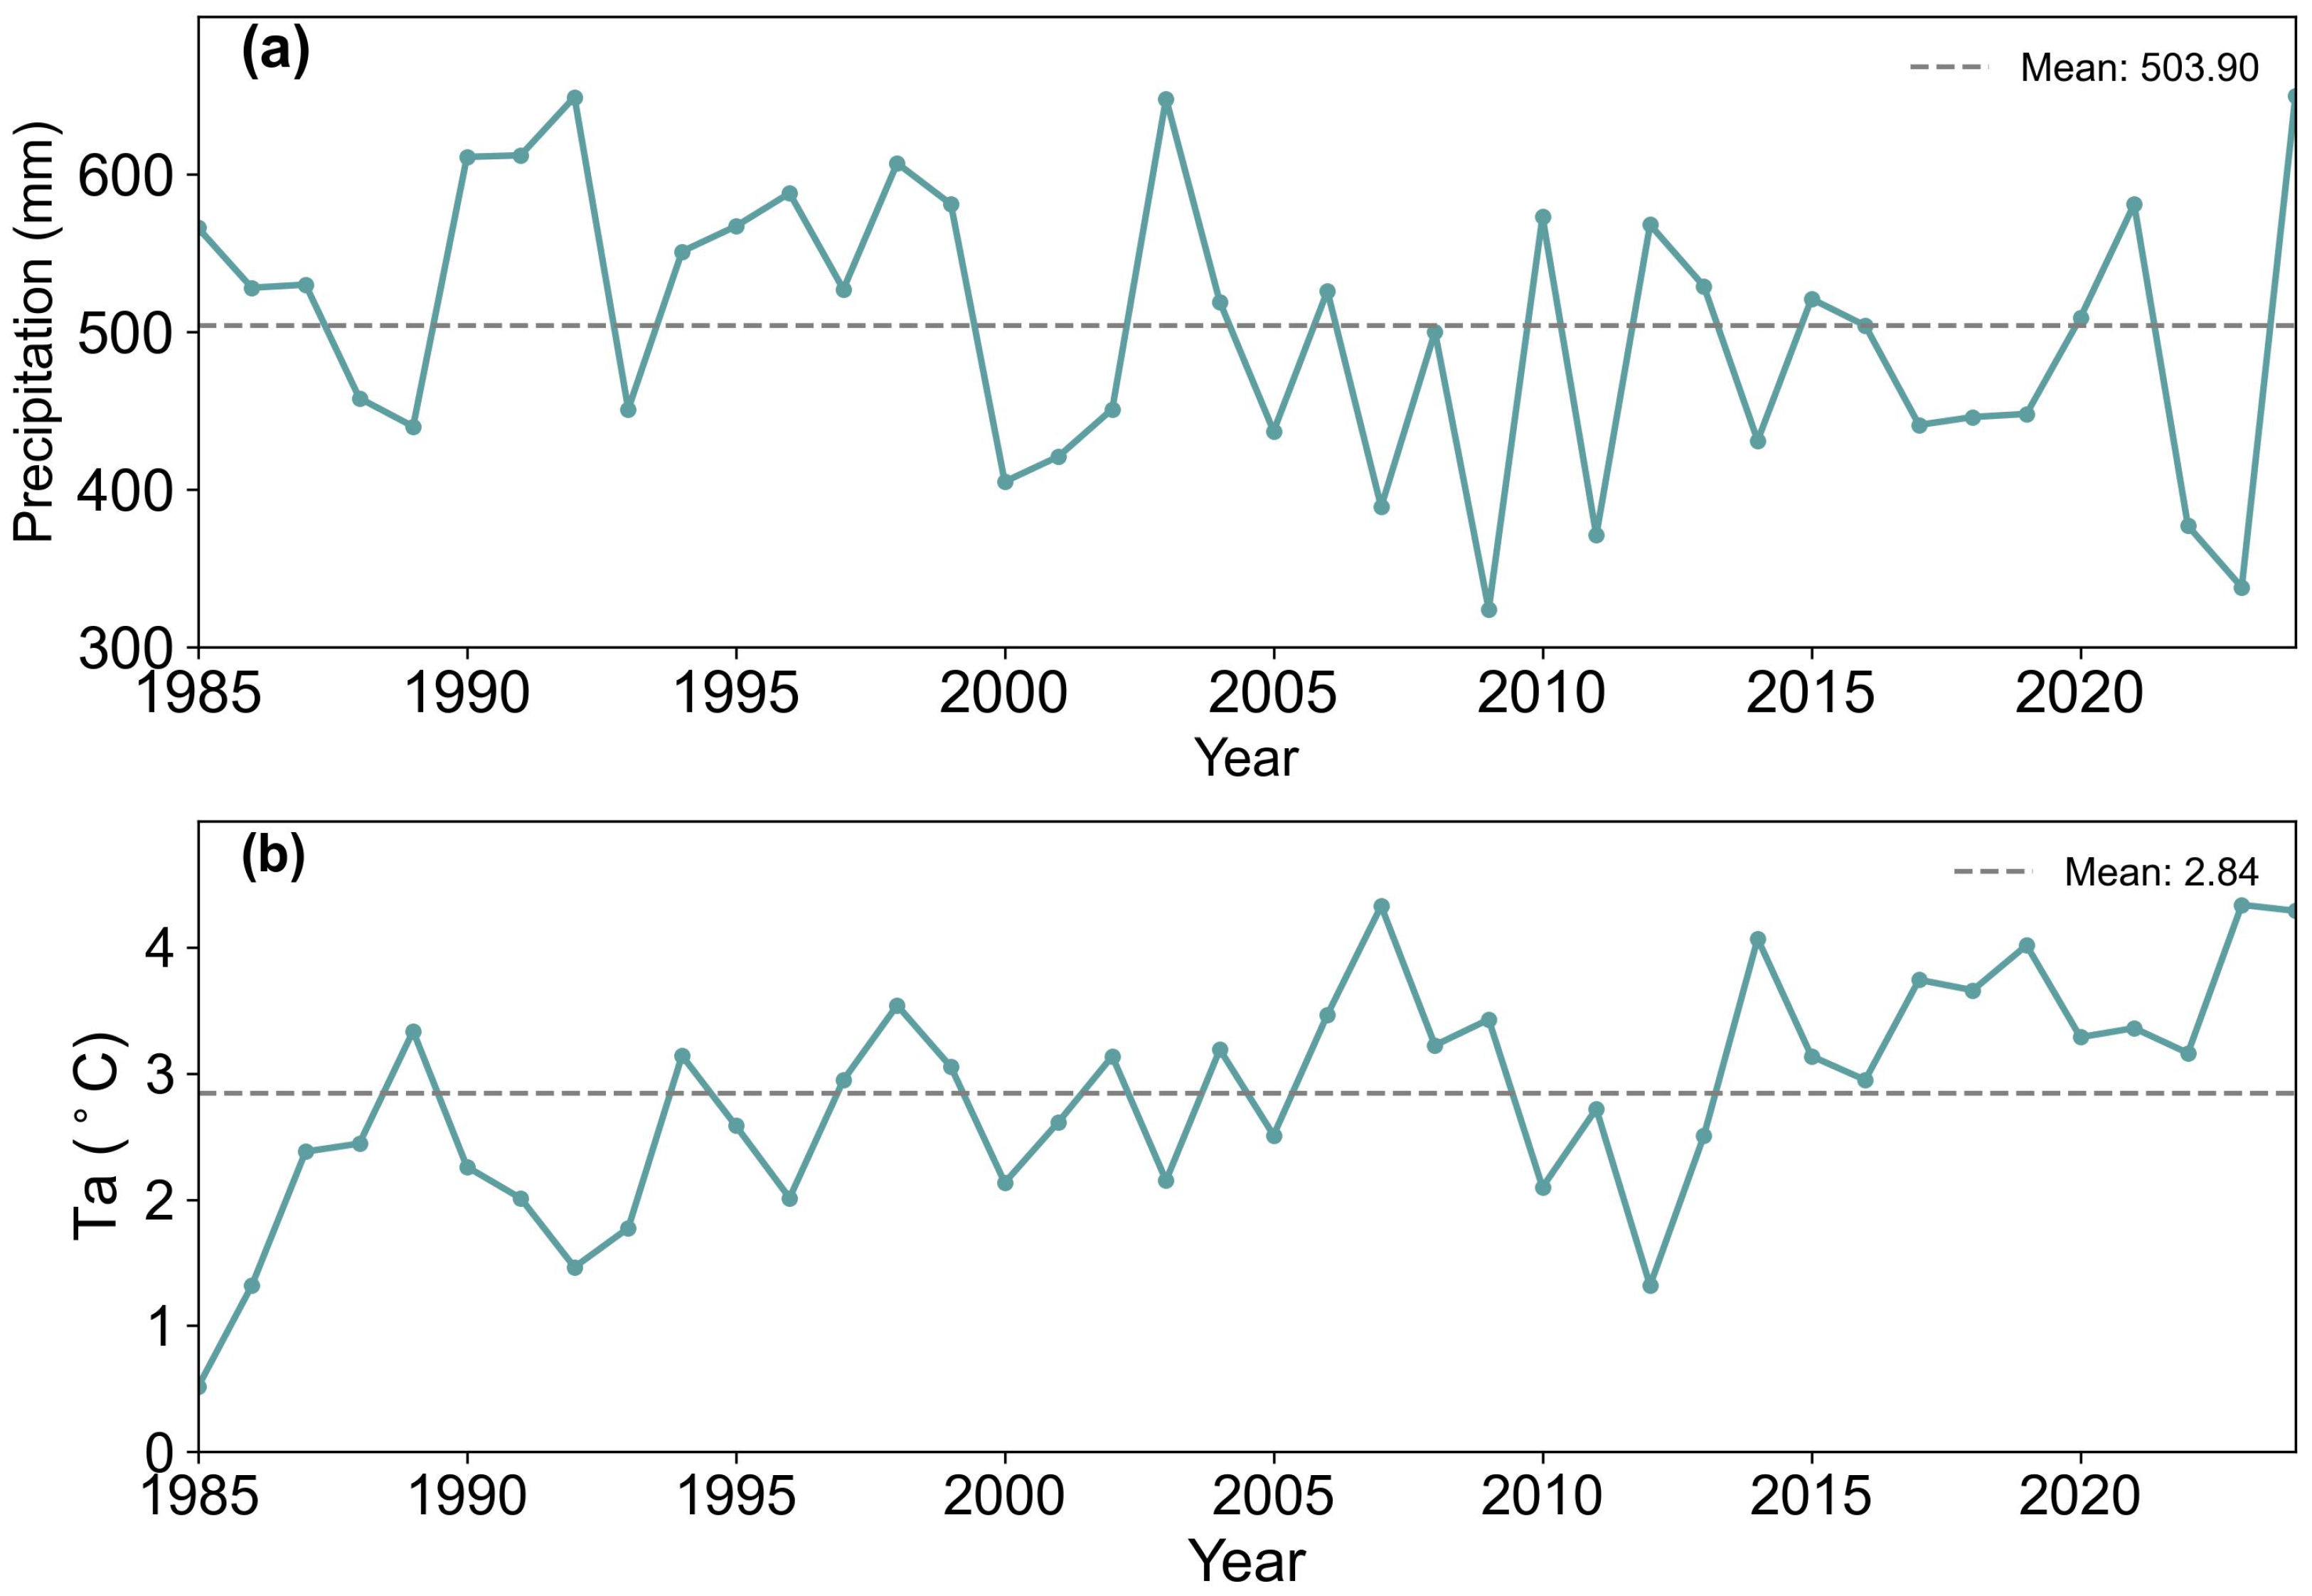
Precipitation and temperature are two fundamental climatic factors regulating wind erosion processes. Reanalysis data indicate pronounced interannual fluctuations in annual precipitation between 1985 and 2024 (Figure 11a). The maximum was recorded in 1992 (649.12 mm), while the minimum occurred in 2009 (324.35 mm), with a long-term mean of 503.90 mm. Regression analysis shows that precipitation was insignificantly correlated with potential wind erosion modulus ( r = 0.24 , p > 0.1 ), but exhibited a slight significant negative correlation with actual wind erosion modulus ( r = 0.27 , p < 0.1 ). Although the statistical relationship is weak, increased rainfall can mitigate soil erosion to some extent by enhancing vegetation growth, promoting soil crust formation, and improving surface resistance to wind erosion.
Temperature exhibited a distinct increasing trend over the same period (Figure 11b), ranging from a minimum of 0.51 °C in 1985 to a maximum of 4.34 °C in 2023. Regression analysis shows a significant positive correlation between temperature and potential wind erosion modulus ( r = 0.49 , p < 0.001 ), and a slight significant positive correlation with actual wind erosion modulus ( r = 0.37 , p < 0.1 ). This pattern can be explained by high temperatures accelerate surface evaporation and reduce soil moisture, which constrains vegetation growth and consequently increases the risk of wind erosion.

4.4. Limitations

Although the RWEQ model has been extensively validated and applied in semi-arid regions, this study lacked direct field validation of the simulated SR and WECB values due to limited site-level measurements in Duolun County. This limitation introduces potential uncertainty in the absolute magnitudes of the results, although the relative spatial and temporal patterns align well with previous studies. Future efforts should incorporate field observations, UAV-based surface monitoring, and localized meteorological data to enhance model calibration and validation.
Second, the scenario-based approach assumes a static counterfactual condition by reverting afforested areas to their pre-GGP land uses. While this simplification enables clear quantification of afforestation-induced wind erosion control benefits, it inevitably overlooks natural ecological dynamics, such as vegetation succession, climate variability, and other disturbances. As a result, the estimated WECB may not fully represent temporal ecosystem changes. Future studies should consider coupling dynamic vegetation and climate models to capture the evolving landscape processes more realistically.
Third, the spatial resolution of some key driving factors is relatively coarse. Climate variables such as wind speed, precipitation, and potential evapotranspiration were obtained from the ERA5-Land reanalysis dataset. Although the temporal resolution is high, the spatial resolution (0.1°) may not adequately represent local variations in wind fields, particularly in arid and semi-arid regions where wind patterns are highly heterogeneous. Future research could improve the spatial representation of driving factors by incorporating higher-resolution climate and soil datasets.

5. Conclusions

This study quantified the long-term impact of forest expansion on wind erosion control in Duolun County over the period 1985–2024 using a “with-forest vs. without-forest” scenario framework combined with the RWEQ model and high-resolution LUCC data. The results show that forest cover in Duolun County increased from 3.95% to 36.19% over the past four decades, primarily in the central desertified and northern hilly regions. Correspondingly, sand fixation increased from 8.70 × 10 5 t in 1992 to 8.20 × 10 6 t in 2021, with an average annual growth of 9.06 × 10 4 t/year. Spatially, the central and northern regions exhibited higher SR increases, up to 0.4–0.6 kg/m2 per decade. Scenario-based analysis revealed that sand fixation attributable to the ecological restoration projects ranged from near zero to 6.61 × 10 5 t over the past four decades, with an average growth rate of 8206.70 t/year. The results also quantitatively demonstrate afforestation not only accelerated sand fixation but also produced more pronounced spatial improvements in erosion control. This work provides scientific support for ecological restoration and land management in arid and semi-arid zones.

Supplementary Materials

The following supporting information can be downloaded at https://www.mdpi.com/article/10.3390/rs17233861/s1.

Author Contributions

Methodology, Data curation, Formal analysis, Software, Writing—original draft, Y.X. (Yan Xin); Software, Validation, S.Z.; Investigation, Data curation, Z.L., Y.Y.; Conceptualization, Methodology, Y.X. (Yongming Xu); Conceptualization, Writing—review & editing, H.L.; Supervision, L.S. All authors have read and agreed to the published version of the manuscript.

Funding

This research was funded by the Scientific Experiment Foundation of Inner Mongolia Meteorological Bureau of under Grant nmqxkxsy202411; Scientific Experiment Foundation of Inner Mongolia Meteorological Bureau of under Grant nmqxkxsy202412; Xilin Gol League Leaderboard-Based Project Assignment Grant number JBGS202502; the National Natural Science Foundation of China Grant numbers 42271351, 41871028, and 42171101; the Postgraduate Research and Practice Innovation Program of Jiangsu Province Grant number KYCX23_1382.

Data Availability Statement

The data presented in this study are available upon request from the corresponding author.

Acknowledgments

The authors would like to thank the Cold and Arid Region Science Data Center for providing snow cover data, the US Geological Survey for providing Landsat data and SRTM/DEM data, and the European Centre for Medium-Range Weather Forecasts for providing ERA5 reanalysis data.

Conflicts of Interest

The authors declare no conflicts of interest.

References

  1. Auerswald, K.; Fiener, P.; Dikau, R. Rates of sheet and rill erosion in Germany—A meta-analysis. Geomorphology 2009, 111, 182–193. [Google Scholar] [CrossRef]
  2. Buschiazzo, D.E.; Zobeck, T.M. Validation of WEQ, RWEQ and WEPS wind erosion for different arable land management systems in the Argentinean Pampas. Earth Surf. Process. Landf. J. Br. Geomorphol. Res. Group 2008, 33, 1839–1850. [Google Scholar] [CrossRef]
  3. Wei, X.; Wu, X.; Wang, D.; Wu, T.; Li, R.; Hu, G.; Zou, D.; Bai, K.; Ma, X.; Liu, Y.; et al. Spatiotemporal variations and driving factors for potential wind erosion on the Mongolian Plateau. Sci. Total Environ. 2023, 862, 160829. [Google Scholar] [CrossRef] [PubMed]
  4. Xiao, L.; Li, G.; Zhao, R.; Zhang, L. Effects of soil conservation measures on wind erosion control in China: A synthesis. Sci. Total Environ. 2021, 778, 146308. [Google Scholar] [CrossRef] [PubMed]
  5. Zhao, H.; Zhang, F.; Yu, Z.; Li, J. Spatiotemporal variation in soil degradation and economic damage caused by wind erosion in Northwest China. J. Environ. Manag. 2022, 314, 115121. [Google Scholar] [CrossRef] [PubMed]
  6. Hoffmann, C.; Funk, R.; Reiche, M.; Li, Y. Assessment of extreme wind erosion and its impacts in Inner Mongolia, China. Aeolian Res. 2011, 3, 343–351. [Google Scholar] [CrossRef]
  7. Jiang, H.; Gao, W.; Liu, B.; Chang, A.; Guo, Q. Quantifying soil wind erosion attribution in Inner Mongolia’s desert grassland. Sci. Rep. 2025, 15, 14319. [Google Scholar] [CrossRef]
  8. Du, H.; Liu, X.; Jia, X.; Li, S.; Fan, Y. Assessment of the effects of ecological restoration projects on soil wind erosion in northern China in the past two decades. CATENA 2022, 215, 106360. [Google Scholar] [CrossRef]
  9. Feng, S.; Zhao, W.; Yan, J.; Xia, F.; Wang, H.; Zhou, A.; Pereira, P. Vegetation restoration contributes to a reduction in wind and water erosion in China’s drylands. Appl. Geogr. 2025, 176, 103517. [Google Scholar] [CrossRef]
  10. Han, Y.; Zhao, W.; Zhou, A.; Pereira, P. Water and wind erosion response to ecological restoration measures in China’s drylands. Geoderma 2023, 435, 116514. [Google Scholar] [CrossRef]
  11. Jinger, D.; Kaushal, R.; Kumar, R.; Paramesh, V.; Verma, A.; Shukla, M.; Chavan, S.B.; Kakade, V.; Dobhal, S.; Uthappa, A.R.; et al. Degraded land rehabilitation through agroforestry in India: Achievements, current understanding, and future prospectives. Front. Ecol. Evol. 2023, 11, 1088796. [Google Scholar] [CrossRef]
  12. Wang, C.; Liang, W.; Yan, J.; Jin, Z.; Zhang, W.; Li, X. Effects of vegetation restoration on local microclimate on the Loess Plateau. J. Geogr. Sci. 2022, 32, 291–316. [Google Scholar] [CrossRef]
  13. Woodruff, N.P.; Siddoway, F. A wind erosion equation. Soil Sci. Soc. Am. J. 1965, 29, 602–608. [Google Scholar] [CrossRef]
  14. Gregory, J.M.; Wilson, G.R.; Singh, U.B.; Darwish, M.M. TEAM: Integrated, process-based wind-erosion model. Environ. Model. Softw. 2004, 19, 205–215. [Google Scholar] [CrossRef]
  15. Van Pelt, R.S.; Zobeck, T.M.; Potter, K.N. Validation of the Wind Erosion Equation (WEQ) for discrete periods and of the wind erosion stochastic simulator (WESS) for single events. In Soil Erosion; American Society of Agricultural and Biological Engineers: St. Joseph, MI, USA, 2001; p. 683. [Google Scholar]
  16. Hagen, L. A wind erosion prediction system to meet user needs. J. Soil Water Conserv. 1991, 46, 106–111. [Google Scholar] [CrossRef]
  17. Shao, Y.; Raupach, M.R.; Leys, J.F. A model for predicting aeolian sand drift and dust entrainment on scales from paddock to region. Soil Res. 1996, 34, 309–342. [Google Scholar] [CrossRef]
  18. Fryrear, D.; Bilbro, J.; Saleh, A.; Schomberg, H.; Stout, J.; Zobeck, T. RWEQ: Improved wind erosion technology. J. Soil Water Conserv. 2000, 55, 183–189. [Google Scholar] [CrossRef]
  19. Chai, Y.; Zuo, H.; Yan, M.; Zuo, T.; Yan, Y. Evaluation of Kubuqi Desert Wind Erosion Prevention Service and drivers of the actual wind erosion studies Based on RWEQ Model from 2000 to 2022. PLoS ONE 2025, 20, e0321260. [Google Scholar] [CrossRef]
  20. Mo, J.; Li, J.; Wang, Z.; Song, Z.; Feng, J.; Che, Y.; Rong, J.; Gu, S. Spatiotemporal evolution of wind erosion and ecological service assessments in Northern Songnen Plain, China. Sustainability 2023, 15, 5829. [Google Scholar] [CrossRef]
  21. Huang, M.; Xiao, Y.; Zhang, C.; Zhen, L.; Qin, K.; Liu, J.; Xu, J.; Gan, S.; Liu, J.; Lu, C.; et al. Wind erosion prevention and trans-boundary ecosystem service payments in the Hunshandake region. J. Clean. Prod. 2024, 475, 143664. [Google Scholar] [CrossRef]
  22. Li, D.; Xu, D. Sand fixation function response to climate change and land use in northern China from 1981 to 2015. Aeolian Res. 2019, 40, 23–33. [Google Scholar] [CrossRef]
  23. Liu, Y.F.; Liu, Y.; Shi, Z.H.; Lopez-Vicente, M.; Wu, G.L. Effectiveness of re-vegetated forest and grassland on soil erosion control in the semi-arid Loess Plateau. CATENA 2020, 195, 104787. [Google Scholar] [CrossRef]
  24. Nikseresht, F.; Lenka, L.; Saleh, Y. Assessing the Effects of Climate Change and Land Use/Land Cover on Wind Erosion in Western Slovakia Using GIS and Analytic Hierarchy Process. Land Cover on Wind Erosion in Western Slovakia Using GIS and Analytic Hierarchy Process. Available online: https://ssrn.com/abstract=4746209 (accessed on 10 September 2025).
  25. Vos, H.C.; Karst, I.G.; Eckardt, F.D.; Fister, W.; Kuhn, N.J. Influence of crop and land management on wind erosion from sandy soils in dryland agriculture. Agronomy 2022, 12, 457. [Google Scholar] [CrossRef]
  26. Sun, R.; He, H.; Jing, Y.; Leng, S.; Yang, G.; Lü, Y.; Borrelli, P.; Chen, L.; Fu, B. Global wind erosion reduction driven by changing climate and land use. Earth’s Future 2024, 12, e2024EF004930. [Google Scholar] [CrossRef]
  27. Chi, W.; Wang, Y.; Lou, Y.; Na, Y.; Luo, Q. Effect of land use/cover change on soil wind erosion in the yellow river basin since the 1990s. Sustainability 2022, 14, 12930. [Google Scholar] [CrossRef]
  28. Cao, X.; Cheng, Y.; Jiao, J.; Jian, J.; Bai, L.; Li, J.; Ma, X. Impact of land use/cover changes on soil erosion by wind and water from 2000 to 2018 in the Qaidam Basin. Land 2023, 12, 1866. [Google Scholar] [CrossRef]
  29. Aruhan; Liu, D. Study on the influencing factors of the evolution of space pattern based on principal component analysis in Duolun County. Sci. Rep. 2024, 14, 20567. [Google Scholar]
  30. Bai, Z.; Han, L.; Jiang, X.; Liu, M.; Li, L.; Liu, H.; Lu, J. Spatiotemporal evolution of desertification based on integrated remote sensing indices in Duolun County, Inner Mongolia. Ecol. Inform. 2022, 70, 101750. [Google Scholar]
  31. Yang, J.; Huang, X. 30 m annual land cover and its dynamics in China from 1990 to 2019. Earth Syst. Sci. Data Discuss. 2021, 13, 3907–3925. [Google Scholar] [CrossRef]
  32. Shangguan, W.; Dai, Y.; Liu, B.; Zhu, A.; Duan, Q.; Wu, L.; Ji, D.; Ye, A.; Yuan, H.; Zhang, Q.; et al. A China data set of soil properties for land surface modeling. J. Adv. Model. Earth Syst. 2013, 5, 212–224. [Google Scholar] [CrossRef]
  33. Zhang, Z.; Wang, X.; Zhao, X.; Liu, B.; Yi, L.; Zuo, L.; Wen, Q.; Liu, F.; Xu, J.; Hu, S. A 2010 update of National Land Use/Cover Database of China at 1:100000 scale using medium spatial resolution satellite images. Remote Sens. Environ. 2014, 149, 142–154. [Google Scholar] [CrossRef]
  34. Adam, E.; Mutanga, O.; Odindi, J.; Abdel-Rahman, E.M. Land-use/cover classification in a heterogeneous coastal landscape using RapidEye imagery: Evaluating the performance of random forest and support vector machines classifiers. Int. J. Remote Sens. 2014, 35, 3440–3458. [Google Scholar] [CrossRef]
  35. Camargo, F.F.; Sano, E.E.; Almeida, C.M.; Mura, J.C.; Almeida, T. A comparative assessment of machine-learning techniques for land use and land cover classification of the Brazilian tropical savanna using ALOS-2/PALSAR-2 polarimetric images. Remote Sens. 2019, 11, 1600. [Google Scholar] [CrossRef]
  36. Talukdar, S.; Singha, P.; Mahato, S.; Pal, S.; Liou, Y.A.; Rahman, A. Land-use land-cover classification by machine learning classifiers for satellite observations—A review. Remote Sens. 2020, 12, 1135. [Google Scholar] [CrossRef]
  37. Breiman, L. Random forests. Machine Learn. 2001, 45, 5–32. [Google Scholar] [CrossRef]
  38. Rigatti, S.J. Random forest. J. Insur. Med. 2017, 47, 31–39. [Google Scholar] [CrossRef]
  39. Fekri, E.; Latifi, H.; Amani, M.; Zobeidinezhad, A. A training sample migration method for wetland mapping and monitoring using sentinel data in google earth engine. Remote Sens. 2021, 13, 4169. [Google Scholar] [CrossRef]
  40. Peng, Y.; Wei, Z.; Cui, B. Unsupervised SAR Change Detection Method Based on Refined Sample Selection. ISPRS Ann. Photogramm. Remote Sens. Spat. Inf. Sci. 2022, 3, 665–672. [Google Scholar] [CrossRef]
  41. Hu, W.; Wu, X.; Zhang, K. Spatiotemporal change of beneficiary area from wind erosion prevention service in the Ulan Buh Desert in 2008 and 2018. Geogr. Sustain. 2022, 3, 119–128. [Google Scholar] [CrossRef]
  42. Li, H.; Wang, T.; Zheng, L.; Cui, X.; Yuan, Y.; Sun, L. Assessment of Windbreak and Sand Fixation Function in Duolun County, Inner Mongolia Driven by Ecological Restoration Projects based on RWEQ Model. Environ. Monit. Forewarning 2025, 17, 37–45. [Google Scholar]
  43. Zhu, M.; Tian, Y.; Jin, L.; Tian, J.; Song, L.; Cui, J.; Zheng, X.; Li, X. Temporal and spatial variations of wind reduction and sand fixation function of ecological barrier zone on the southern edge of Horqin Sandy Land and influencing factors. Chin. J. Ecol. 2025, 44, 1857–1865. [Google Scholar]
  44. Peng, W.; Wang, Z.; Li, H.; Liu, B. Spatio-Temporal Changes of Sand-Fixing Function and Its Driving Forces in the Middle and Lower Reaches of Heihe River Basin. Res. Environ. Sci. 2020, 33, 2734–2744. [Google Scholar]
  45. Sen, P.K. Estimates of the regression coefficient based on Kendall’s tau. J. Am. Stat. Assoc. 1968, 63, 1379–1389. [Google Scholar] [CrossRef]
  46. Sunny Agarwal, A.S.; Singh, S.P. Analysis and interpretation of rainfall trend using mann-kendall’s and sen’s slope method. Indian J. Ecol. 2021, 48, 453–457. [Google Scholar]
  47. Şen, Z.; Şişman, E. Risk attachment Sen’s Slope calculation in hydrometeorological trend analysis. Nat. Hazards 2024, 120, 3239–3252. [Google Scholar] [CrossRef]
  48. Wang, X.; Li, T.; Ikhumhen, H.O.; Sá, R.M. Spatio-temporal variability and persistence of PM2. 5 concentrations in China using trend analysis methods and Hurst exponent. Atmos. Pollut. Res. 2022, 13, 101274. [Google Scholar] [CrossRef]
  49. Kendall, M.G. Rank Correlation Methods; C. Griffin & Co. Ltd.: London, UK, 1948. [Google Scholar]
  50. Mann, H.B. Nonparametric tests against trend. Econom. J. Econom. Soc. 1945, 13, 245–259. [Google Scholar] [CrossRef]
  51. Milentijevic, N.; Bačević, N.; Ristić, D.; Valjarević, A.; Pantelić, M.; Kićović, D. Application of Mann-Kendal (MK) test in trend analysis of air temperature and precipitation: Case of Mačva district (Serbia). Bull. Nat. Sci. Res. 2020, 10, 37–43. [Google Scholar] [CrossRef]
  52. Sang, Y.F.; Wang, Z.; Liu, C. Comparison of the MK test and EMD method for trend identification in hydrological time series. J. Hydrol. 2014, 510, 293–298. [Google Scholar] [CrossRef]
  53. Girma, A.; Qin, T.; Wang, H.; Yan, D.; Gedefaw, M.; Abiyu, A.; Batsuren, D. Study on Recent Trends of Climate Variability Using Innovative Trend Analysis: The Case of the upper Huai River Basin. Pol. J. Environ. Stud. 2020, 29. [Google Scholar] [CrossRef]
  54. Xin, Y.; Xu, Y.; Tong, X.; Mo, Y.; Liu, Y.; Zhu, S. Evaluating warming trend over the tibetan plateau based on remotely sensed air temperature from 2001 to 2020. Clim. Change 2024, 177, 131. [Google Scholar] [CrossRef]
  55. Luo, Q.; Zhen, L.; Xiao, Y.; Wang, H. The effects of different types of vegetation restoration on wind erosion prevention: A case study in Yanchi. Environ. Res. Lett. 2020, 15, 115001. [Google Scholar] [CrossRef]
  56. Wu, Z.; Wang, M.; Zhang, H.; Du, Z. Vegetation and soil wind erosion dynamics of sandstorm control programs in the agro-pastoral transitional zone of northern China. Front. Earth Sci. 2019, 13, 430–443. [Google Scholar] [CrossRef]
  57. Wang, L.; Mu, Y.; Zhang, Q.; Jia, Z. Effects of vegetation restoration on soil physical properties in the wind–water erosion region of the northern Loess Plateau of China. CLEAN–Soil Air Water 2012, 40, 7–15. [Google Scholar]
  58. Tian, P.; Tian, X.; Geng, R.; Zhao, G.; Yang, L.; Mu, X.; Gao, P.; Sun, W.; Liu, Y. Response of soil erosion to vegetation restoration and terracing on the Loess Plateau. CATENA 2023, 227, 107103. [Google Scholar] [CrossRef]
  59. Dang, D.; Li, X.; Li, S.; Dou, H. Ecosystem Services and Their Relationships in the Grain-for-Green Programme—A Case Study of Duolun County in Inner Mongolia, China. Sustainability 2018, 10, 4036. [Google Scholar] [CrossRef]
  60. Dai, L.; Tang, H.; Pan, Y.; Liang, D. Enhancing Ecosystem Services in the Agro-Pastoral Transitional Zone Based on Local Sustainable Management: Insights from Duolun County in Northern China. Land 2022, 11, 805. [Google Scholar] [CrossRef]
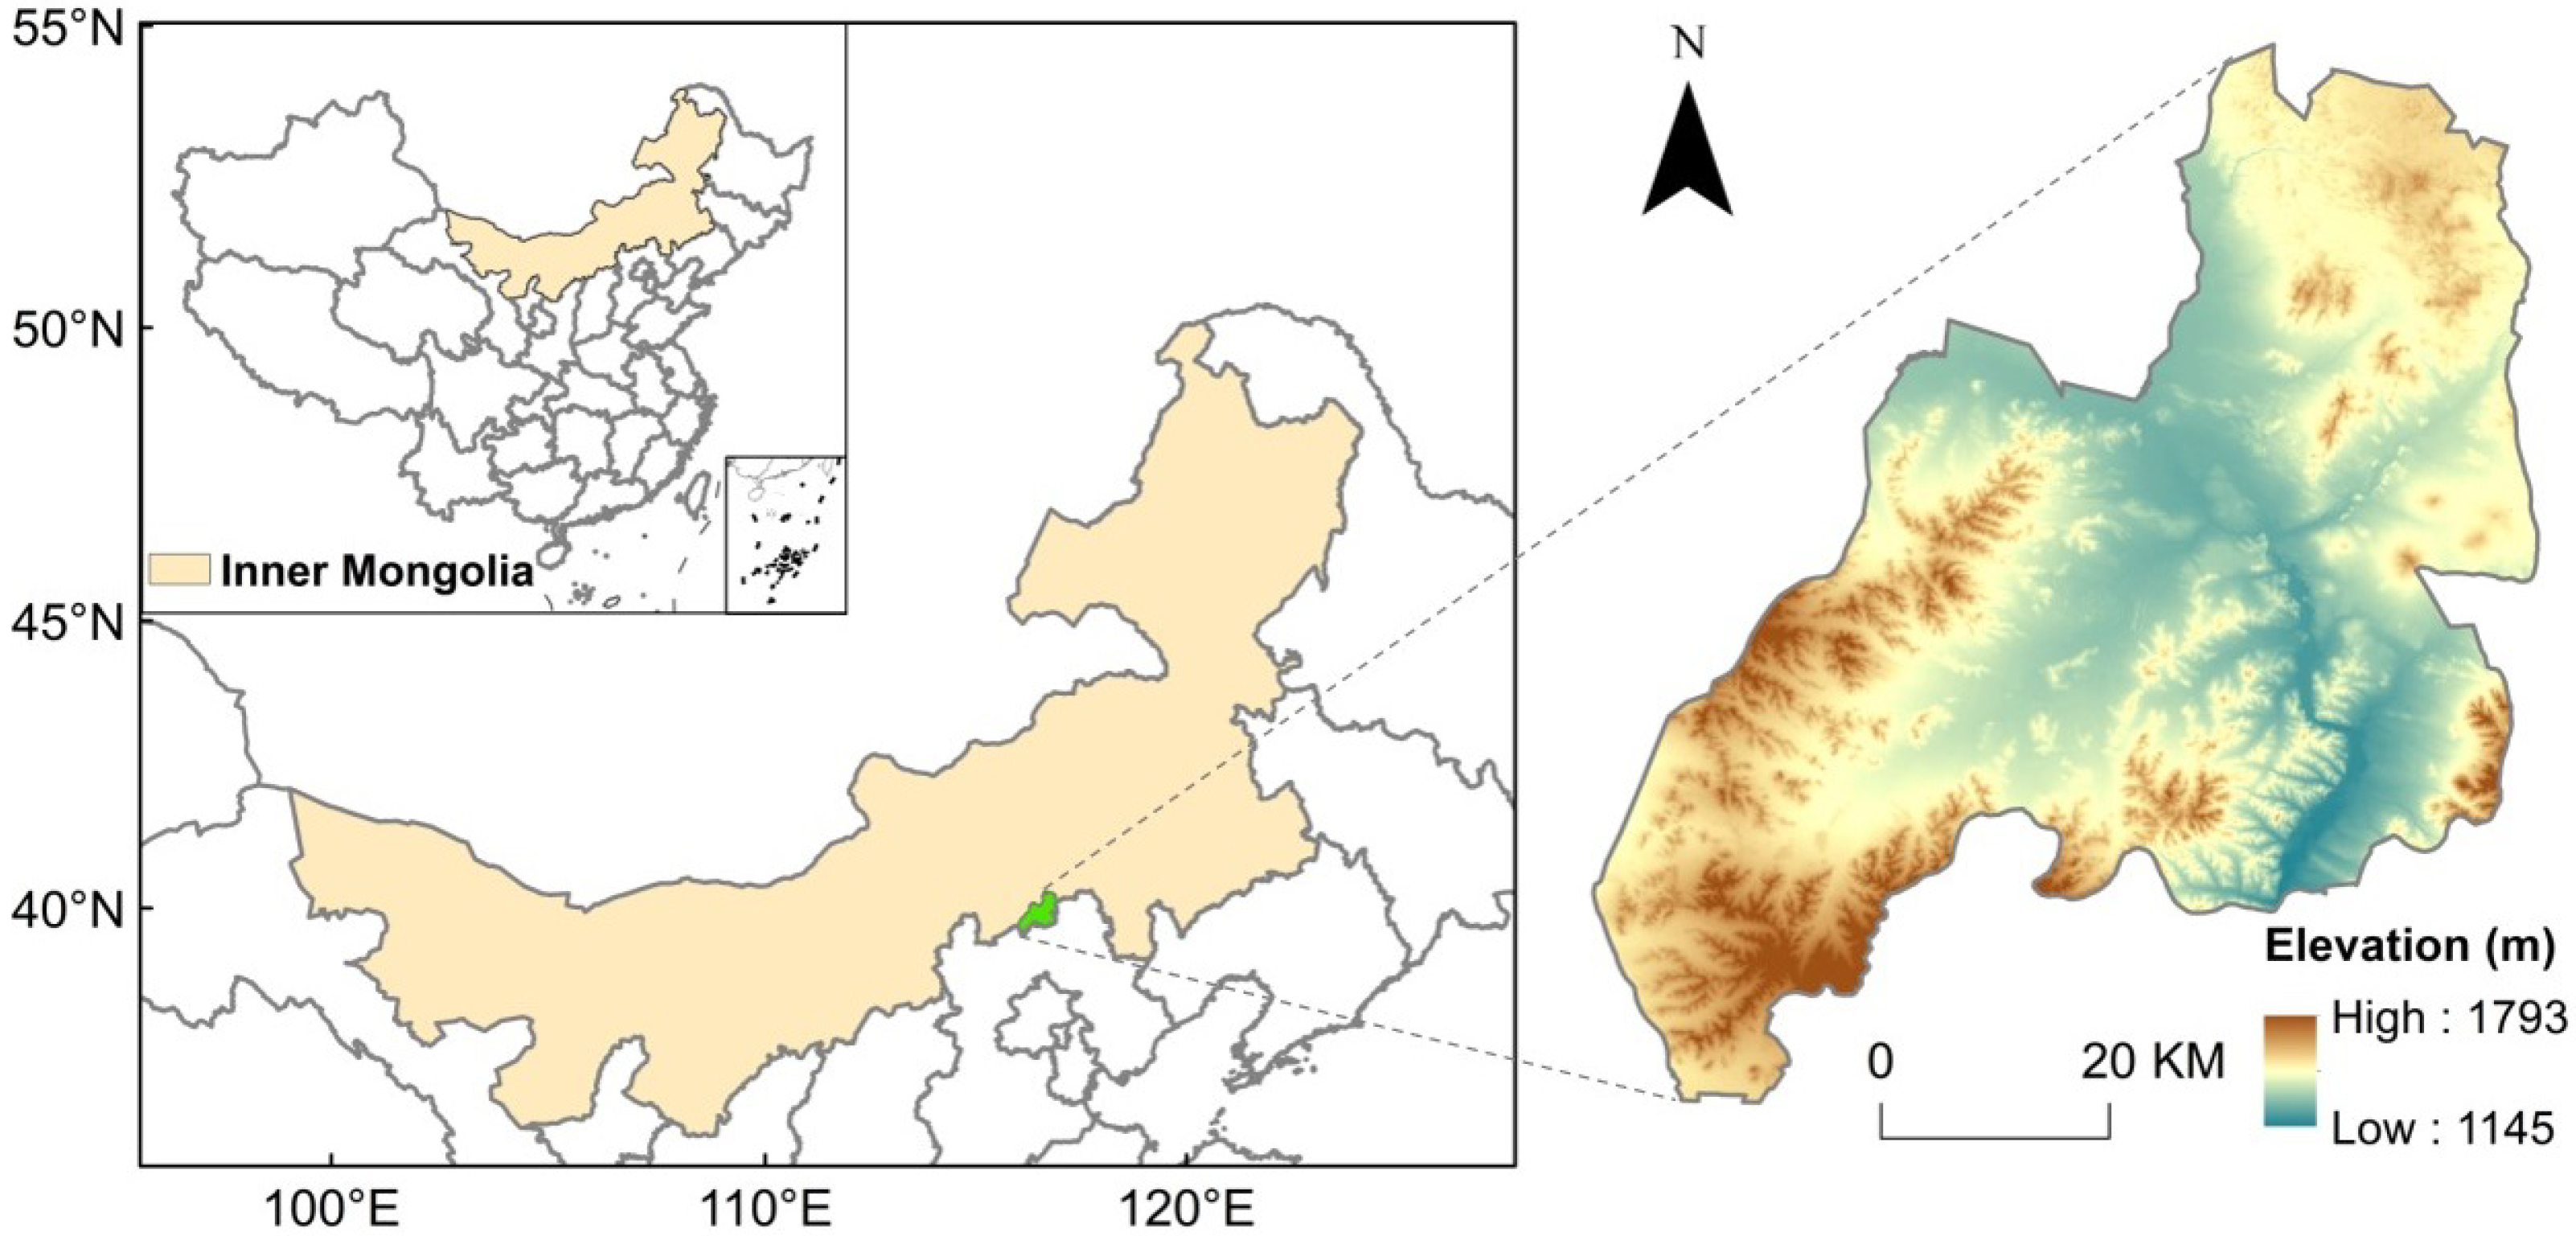
Figure 1. Location of Duolun County in Inner Mongolia of China.
Remotesensing 17 03861 g001
Figure 2. Forest cover rate in Duolun County from 1985 to 2024.
Remotesensing 17 03861 g002
Figure 3. Spatial distribution of source composition of newly added forest in Duolun County from 1985 to 2024.
Remotesensing 17 03861 g003
Figure 4. Interannual changes of Slp, Sl, and SR in Duolun County from 1985 to 2024.
Remotesensing 17 03861 g004
Figure 5. Spatial distribution of Slp, Sl, and SR in 1985, 2000, 2010, 2015, and 2024.
Remotesensing 17 03861 g005
Figure 6. Spatial distributions of the (a) trends and (b) significance of the SR in Duolun County from 1985 to 2024.
Remotesensing 17 03861 g006
Figure 7. Temporal variations in WECB in Duolun County from 1985 to 2024.
Remotesensing 17 03861 g007
Figure 8. Spatiotemporal distributions of SR under Scenarios A and B and their difference (WECB) for 2000, 2010, 2015, and 2024.
Remotesensing 17 03861 g008
Figure 9. Spatial distributions of (a) the trends and (b) significance of the SR under Scenario B from 1985 to 2024.
Remotesensing 17 03861 g009
Figure 10. Interannual variations in wind speed (a) and sand-driving days (b) in Duolun County from 1985 to 2024.
Remotesensing 17 03861 g010
Figure 11. Interannual variations in precipitation (a) and temperature (b) in Duolun County from 1985 to 2024.
Remotesensing 17 03861 g011
Table 1. Datasets and variables used in this study.
DatasetVariableResolutionData Source
 Precipitation0.1°/hourly 
ERA5-LandWind speed0.1°/hourlyEuropean Centre for Medium-Range Weather Forecasts (https://www.ecmwf.int/)
 Potential evapotranspiration0.1°/hourly 
Snow coverSnow depth25 km/dailyNational Tibetan Plateau Data Center (https://data.tpdc.ac.cn/home)
 Surface reflectance30 m/16 d 
 NDVI30 m/16 d 
LandsatNDBI30 m/16 dGoogle Earth Engine (https://earthengine.google.com/)
 MNDWI30 m/16 d 
Land cover dataLand cover type30 m/yearlyZenodo (https://zenodo.org/)
DEMSlope30 m/-Google Earth Engine (https://earthengine.google.com/)
Soil dataSoil Properties30 arc-seconds/-National Tibetan Plateau Data Center (https://data.tpdc.ac.cn/home)
Table 2. Classification accuracy of land use mapping from 1985 to 2024.
YearOAKappaYearOAKappaYearOAKappaYearOAKappa
19850.960.9219950.960.9220050.940.9020150.970.95
19860.950.9119960.960.9220060.930.9020160.970.95
19870.950.8819970.960.9320070.960.9320170.970.95
19880.960.9019980.970.9220080.960.9320180.960.94
19890.950.8919990.960.9220090.950.9320190.960.95
19900.960.9220000.950.9220100.960.9420200.970.96
19910.950.8920010.950.9320110.940.9120210.970.95
19920.950.8920020.940.9020120.950.9220220.970.95
19930.960.9020030.940.9120130.960.9420230.970.96
19940.950.9020040.930.8920140.960.9420240.960.95
Disclaimer/Publisher’s Note: The statements, opinions and data contained in all publications are solely those of the individual author(s) and contributor(s) and not of MDPI and/or the editor(s). MDPI and/or the editor(s) disclaim responsibility for any injury to people or property resulting from any ideas, methods, instructions or products referred to in the content.