Article

Impact of Joint Assimilating AWS and Radar Observations on the Analysis and Forecast of a Squall Line with Complex Terrain

1
Key Laboratory of Meteorological Disaster, Ministry of Education (KLME)/Joint International Research Laboratory of Climate and Environment Change (ILCEC)/Collaborative Innovation Center on Forecast and Evaluation of Meteorological Disasters (CIC-FEMD), Nanjing University of Information Science & Technology, Nanjing 210044, China
2
State Key Laboratory of Severe Weather, Chinese Academy of Meteorological Sciences, Beijing 100081, China
3
Nanjing Meteorological Bureau, Nanjing 210019, China
4
Anhui Meteorological Observatory, Hefei 230031, China
*
Author to whom correspondence should be addressed.
These authors contributed equally to this work.
Remote Sens. 2025, 17(23), 3860; https://doi.org/10.3390/rs17233860 (registering DOI)
Submission received: 26 September 2025 / Revised: 14 November 2025 / Accepted: 25 November 2025 / Published: 28 November 2025
(This article belongs to the Section Atmospheric Remote Sensing)

Highlights

What are the main findings?
  • A radar assimilation scheme with spatial truncation enhances convective structure representation and suppresses false echoes.
  • Joint assimilation of AWS and radar data improves horizontal continuity and vertical consistency in convective analyses.
What are the implications of the main findings?
  • Assimilating AWS before radar establishes a balanced boundary-layer environment, strengthening cold-pool intensity and updraft coupling.
  • This assimilation sequence enables more accurate reproduction of convective circulation and vertical wind structures within the squall line.

Abstract

Based on the WRF-3DVar system, this study investigates the impacts of assimilating radar and automatic weather station (AWS) observations, both independently and jointly, for a squall line case that occurred over complex terrain in China on 30 May 2024. It is found that radar data assimilation with spatial truncation significantly enhances the representation of convective structures while reducing false echoes by about 40%. However, when the variance and correlation length scales are enlarged, reflectivity intensity is increased by 5–10 dBZ with false signals and positional errors also introduced, while a balanced scheme is observed to yield the highest skill scores. Assimilation of AWS alone provides limited improvements, whereas radar assimilation introduces localized structures that rapidly decay within 1–2 h due to the absence of boundary-layer constraints. The benefits of joint assimilation are clearly demonstrated in terms of spatial continuity and vertical consistency, with the assimilation order being identified as a decisive factor. When AWS is assimilated prior to radar, low-level thermodynamic and dynamic conditions are optimized, leading to strengthened cold pool structures by around 2 K, enhanced updrafts by over 20%, and improved wind distribution. The critical role of AWS-radar joint assimilation in capturing the dynamical characteristics of squall lines is thus highlighted. Detailed examination of the forecast and analysis indicates that assimilating AWS before radar not only optimizes boundary-layer conditions but also enhances the coupling between cold pools and updrafts, resulting in improved simulation accuracy in both horizontal and vertical structures. These findings provide valuable insights for advancing the prediction of severe convective systems.

1. Introduction

Strong convective weather systems are recognized for their rapid onset, localized characteristics, and severe destructive potential. Squall lines, as typical mesoscale convective systems (MCSs), are generally composed of intense convective cells arranged along a line and are accompanied by distinct trailing layered precipitation regions. Their internal dynamics are influenced by frontal development, the formation and propagation of cold pools, interaction with environmental wind shear, and characteristic rear-inflow jets. The capacity of these systems to trigger regional heavy rainfall, severe thunderstorms, strong downdrafts, and even tornadoes has been well documented [1]. Notable differences between MCSs and isolated deep convection in terms of occurrence frequency, spatial scale, and precipitation efficiency have also been identified through statistical and observational studies [2]. The dominant role of the interaction between cold pools and low-level wind shear in squall line development and maintenance has been emphasized in theoretical and idealized numerical studies. The classical RKW theory proposed by Rotunno et al. [3] demonstrates that the balance between cold pool intensity and vertical wind shear governs the strength and duration of squall lines. Numerical simulations by Weisman & Klemp [4] further indicated that the magnitude and distribution of environmental shear directly influence the evolution of convective system structures and potential organizational modes. Recently, the three-dimensional structure and organization of squall lines have been better understood through high-resolution observations and convection-scale models. Fan et al. [5], based on multiple model comparisons for the MC3E case, showed that different cloud microphysics schemes result in notable variations in reproducing cold pool intensity and updrafts. WRF sensitivity experiments by Bao et al. [6] further highlighted the substantial effect of microphysics schemes on squall line dynamics and precipitation distribution. It has been suggested that microphysical processes not only affect precipitation characteristics but also feed back into cold pool and rear-inflow structures through evaporation, condensation, and melting. Long-term unified observational data products for MCSs provided by Li et al. [2] have further revealed variations in convective system evolution and precipitation contribution across different climate regions.
Three-dimensional variational assimilation (3DVar) generates an optimal analysis by minimizing a cost function that includes both background and observation terms at a single analysis time. In the 3DVar framework, the background error covariance matrix is used to describe the balance relationships between different physical variables and governs the spatial spread of observational information, thereby decisively affecting the physical consistency and locality of the analysis [7]. ECMWF full implementation of 3DVar provides a model for large-scale and global assimilation [8]. Practical and efficient representations of the background error covariance matrix have been developed through numerical and statistical techniques such as recursive filters, spectral/structure function methods, and control variable transformations [9]. At the convective-scale and regional model level, WRF-DA integrates 3DVar into WRF/MM5, demonstrating the technical feasibility of assimilating radar, satellite, and ground-based AWS observations [10]. The construction of 3DVar background errors in AROME-France also emphasizes the necessity of designing dedicated background error covariance matrices for convective scales [11]. In addition to three-dimensional variational methods, four-dimensional variational assimilation (4D-Var) and ensemble Kalman filter (EnKF) techniques have been widely applied in observational assimilation studies. Xu et al. [12] incorporated precipitation data and large-scale analysis constraints into 4D-Var for a case study of the “21.7” extreme rainfall event. Hybrid approaches combining 3DVar/4D-Var with EnKF have been shown to improve performance in both global and regional forecasting systems [13].
Radar observations, due to their high temporal and spatial resolution, are used to directly detect the internal dynamic structure reflected from radial velocity and microphysical and precipitation particles structures of convective storms. They are considered central to convective analysis and assimilation studies [14,15,16]. Radial velocity observations can effectively constrain near-surface and mid-level winds at the convective scale, thereby improving the representation of vortices and inflow/outflow structures. Reflectivity is used to provide direct observational constraints on precipitation location, phase partitioning, and microphysical processes. The combination of both observation types has been shown to enhance the quality of initial wind and precipitation [14,17]. Recent studies on radar data assimilation evaluated the effect of different momentum control variables on the analysis and forecast of convective systems under a northeastern cold vortex background [18]. Compared with ground-based observations, AWS data, due to the dense networks and high observation frequency, are able to capture near-surface pressure, temperature, humidity, and wind with high sensitivity, and are essential for depicting cold pools, boundary layer heterogeneity, and convective triggering conditions. Numerous studies have shown that the appropriate assimilation of near-surface observations can significantly enhance short-term forecasts of temperature, humidity, and wind near the surface, directly influencing cold pool strength and location analyses [19,20].
Radar and AWS observations therefore exhibit clear physical synergistic effects: radar provides detailed convective dynamics and microphysics, whereas AWS imposes strong boundary layer and surface constraints. Recent system developments indicate that joint assimilation of these two observation types markedly improves convective system analysis and short-term forecasts, particularly in representing convective initiation, cold pool evolution, and precipitation distribution. Previous research has demonstrated that the physical synergistic effects between radar and AWS data provides robust theoretical and practical support for improving heavy rainfall forecasts. For example, Hou et al. [21] evaluated the effects of radar and AWS assimilation during a heavy rainfall event in southern China, showing that their combination significantly enhanced short-term precipitation forecast accuracy. Data assimilation experiments using Doppler radar and surface observations were conducted in Ha et al. [22] during a heavy rainfall event in central South Korea, demonstrating improved agreement between simulated and observed precipitation. Chen et al. [23] applied a 3DVar assimilation framework in Taiwan to jointly assimilate radar and surface observations for afternoon thunderstorms, revealing effective improvement in convective location and intensity forecasts. These studies collectively indicate that radar-AWS joint assimilation is highly valuable for improving numerical forecasts of strong convection and heavy rainfall.
Although prior studies have examined the impacts of combined radar and AWS data assimilation in several weather systems, the investigation of the data assimilation schemes in the usage of the both radar and AWS data is still limited, especially for squall line events and severe wind events with complex terrain. In this study, the impact of radar observations assimilation will be explored using different spatial truncation strategies and assimilation scales before the joint assimilation schemes are further investigated. Unlike the bulk of earlier studies that centered on heavy-precipitation cases, this study examines a squall line event distinguished by violent surface winds yet only modest precipitation. This distinction is crucial, as wind-dominated convective systems typically display structural and dynamical characteristics markedly different from those of precipitation-driven events, and their accurate representation in high-resolution simulations remains challenging—particularly when complex topography exerts a strong influence. By selecting a strong-wind event, this study further emphasizes the role of low-level wind observations from AWS and the capacity of radar reflectivity assimilation to improve the organization and evolution of wind convective structures.
The study is organized as follows: Section 2 describes the data and methods in the WRFDA system. Section 3 presents the case overview, model configurations, and experimental design. Section 4 provides a detailed description of the results, with the first part discussing radar assimilation, including observation spatial truncation and scale exploration, and the second part examining the joint assimilation of radar and AWS observations from both analysis and forecast perspectives. Finally, Section 5 presents the conclusions and discussion.

2. Data and Methods

2.1. 3DVar Method in WRFDA

This study employs the Weather Research and Forecasting (WRF) model combined with its official WRF Data Assimilation (WRFDA) system for the investigation [10,24]. WRFDA provides a three-dimensional variational (3DVar) assimilation method, whose core concept is to integrate the background field with observational information by minimizing a cost function. Specifically, the 3DVar assimilation method is based on minimizing the following cost function:
J ( x ) = J b + J o = 1 2 ( x x b ) T B 1 ( x x b ) + 1 2 y o H ( x ) T R 1 y o H ( x ) .
Here, the cost function is defined as comprising two parts: the background component J b and the observation component J o . The analysis vector, background vector, and observation vector are represented by x , x b , and y o , respectively. The background error covariance matrix and the observation error covariance matrix are denoted by B and R , respectively. The nonlinear observation operator is employed to map model variables to observation space. In the assimilation implementation, the WRFDA system combines flow-dependent background error covariance estimation and applies recursive filtering and eigenvector decomposition to localize the B matrix, effectively integrating static background errors with dynamic constraints from short-term forecasts [25]. The system can assimilate multiple types of observational data, including radar reflectivity and radial velocity, satellite radiance, ground-based automatic weather stations, and radiosonde observations, providing solid technical support for detailed analysis and short-term forecasts of high-impact weather [26]. The background error statistics were estimated through the National Meteorological Center (NMC, now known as NCEP) method [7], which utilizes the mean differences between forecasts of 24 h and 12 h valid at the same analysis time over a one-month period. In this study, the Control Variable Option 7 (CV7) of the WRF-3DVAR system was employed, incorporating meridional wind, zonal wind, surface pressure, temperature, and relative humidity.

2.2. Radar Observations

2.2.1. DA Method

In this study, high-resolution observations of reflectivity and radial velocity are obtained from two S-band Doppler weather radars of the China Next Generation Weather Radar (CINRAD): the Beijing radar (116.472°E, 39.811°N; 31.3 m) and the Zhangbei radar (114.696°E, 41.115°N; 1426.4 m). Both radars operate in the Plan Position Indicator (PPI) scanning mode with a range resolution of 250 m, completing one volume scan approximately every 6 min. The distribution of radar observation stations is indicated by black pentagrams in Figure 1. In the WRF-3DVar system, radial velocity and reflectivity are incorporated into Doppler radar data assimilation. The relationship between radial velocity and model variables is expressed as follows:
V r = u x x i r i + v y y i r i + ( w v e ) z z i r i .
Equation (2) details the observations operator for Doppler radar radial velocity, involving the wind components ( u , v , w ), the radar position ( x , y , z ) and the radar observation location ( x i , y i , z i ). The distance between the radar and the observation point is denoted by r i , and the terminal velocity v e is related to the rainwater mixing ratio. Although vertical velocity w is not a control variable, it influences the temperature, humidity, and horizontal wind. These parameters collectively define the relationship between radial velocity and model variables. The standard of the observation error was specified as 2 m/s for radial velocity and 5 dBZ for reflectivity during the DA.
For radar reflectivity, there is a relationship between reflectivity and hydrometeor variables, such as rain and cloud water content. The equivalent reflectivity factor Z e is obtained by summing the backscattered contributions from all atmospheric particles [17]. Specifically, Z e represents the radar return produced collectively by every type of hydrometeor within a sampled volume, but expressed as though it originated solely from liquid water droplets. In this study, the indirect assimilation approach is adopted, in which the hydrometeor phase and its partitioning are diagnosed following the temperature-dependent method of Gao and Stenrud [14] when relating radar reflectivity to individual hydrometeor species. In data assimilation applications, Z e serves as an effective indicator of precipitation intensity and spatial distribution. Consequently, the relationship between Z e and hydrometeor mixing ratios is typically represented using a power-law formulation as follows:
Z e = Z ( q r ) + Z ( q s ) + Z ( q g ) ,
where the terms Z ( q r ) , Z ( q s ) , and Z ( q g ) respectively denote the portions of total reflectivity attributed to rainwater, snow, and graupel. The reflectivity values are computed from the mixing ratios of the corresponding hydrometeor species. For each species, the relationship is defined by
Z ( q x ) = a x ( ρ q x ) 1.75 ,
in which a x represents a constant unique to the specific hydrometeor type, ρ denotes the air density, and q x is the mixing ratio associated with that hydrometeor (rainwater q r , graupel q g , or snow q s ). The constant a x is determined according to the dielectric factor, density, and intercept parameter of the hydrometeor x [27].

2.2.2. Spatial Truncation

The preliminary quality control process consists of two steps. First, the library in Python (version 3.8) processes raw radar observations, removing isolated noise points, ground clutter, and secondary echoes. Second, the SOLO3 (Software LROSE-Solo3: C++ Version of SOLO Polar Radar Data Display and Editor) performs further quality control, including noise removal, clear-air echo elimination, and Doppler velocity folding correction [28].
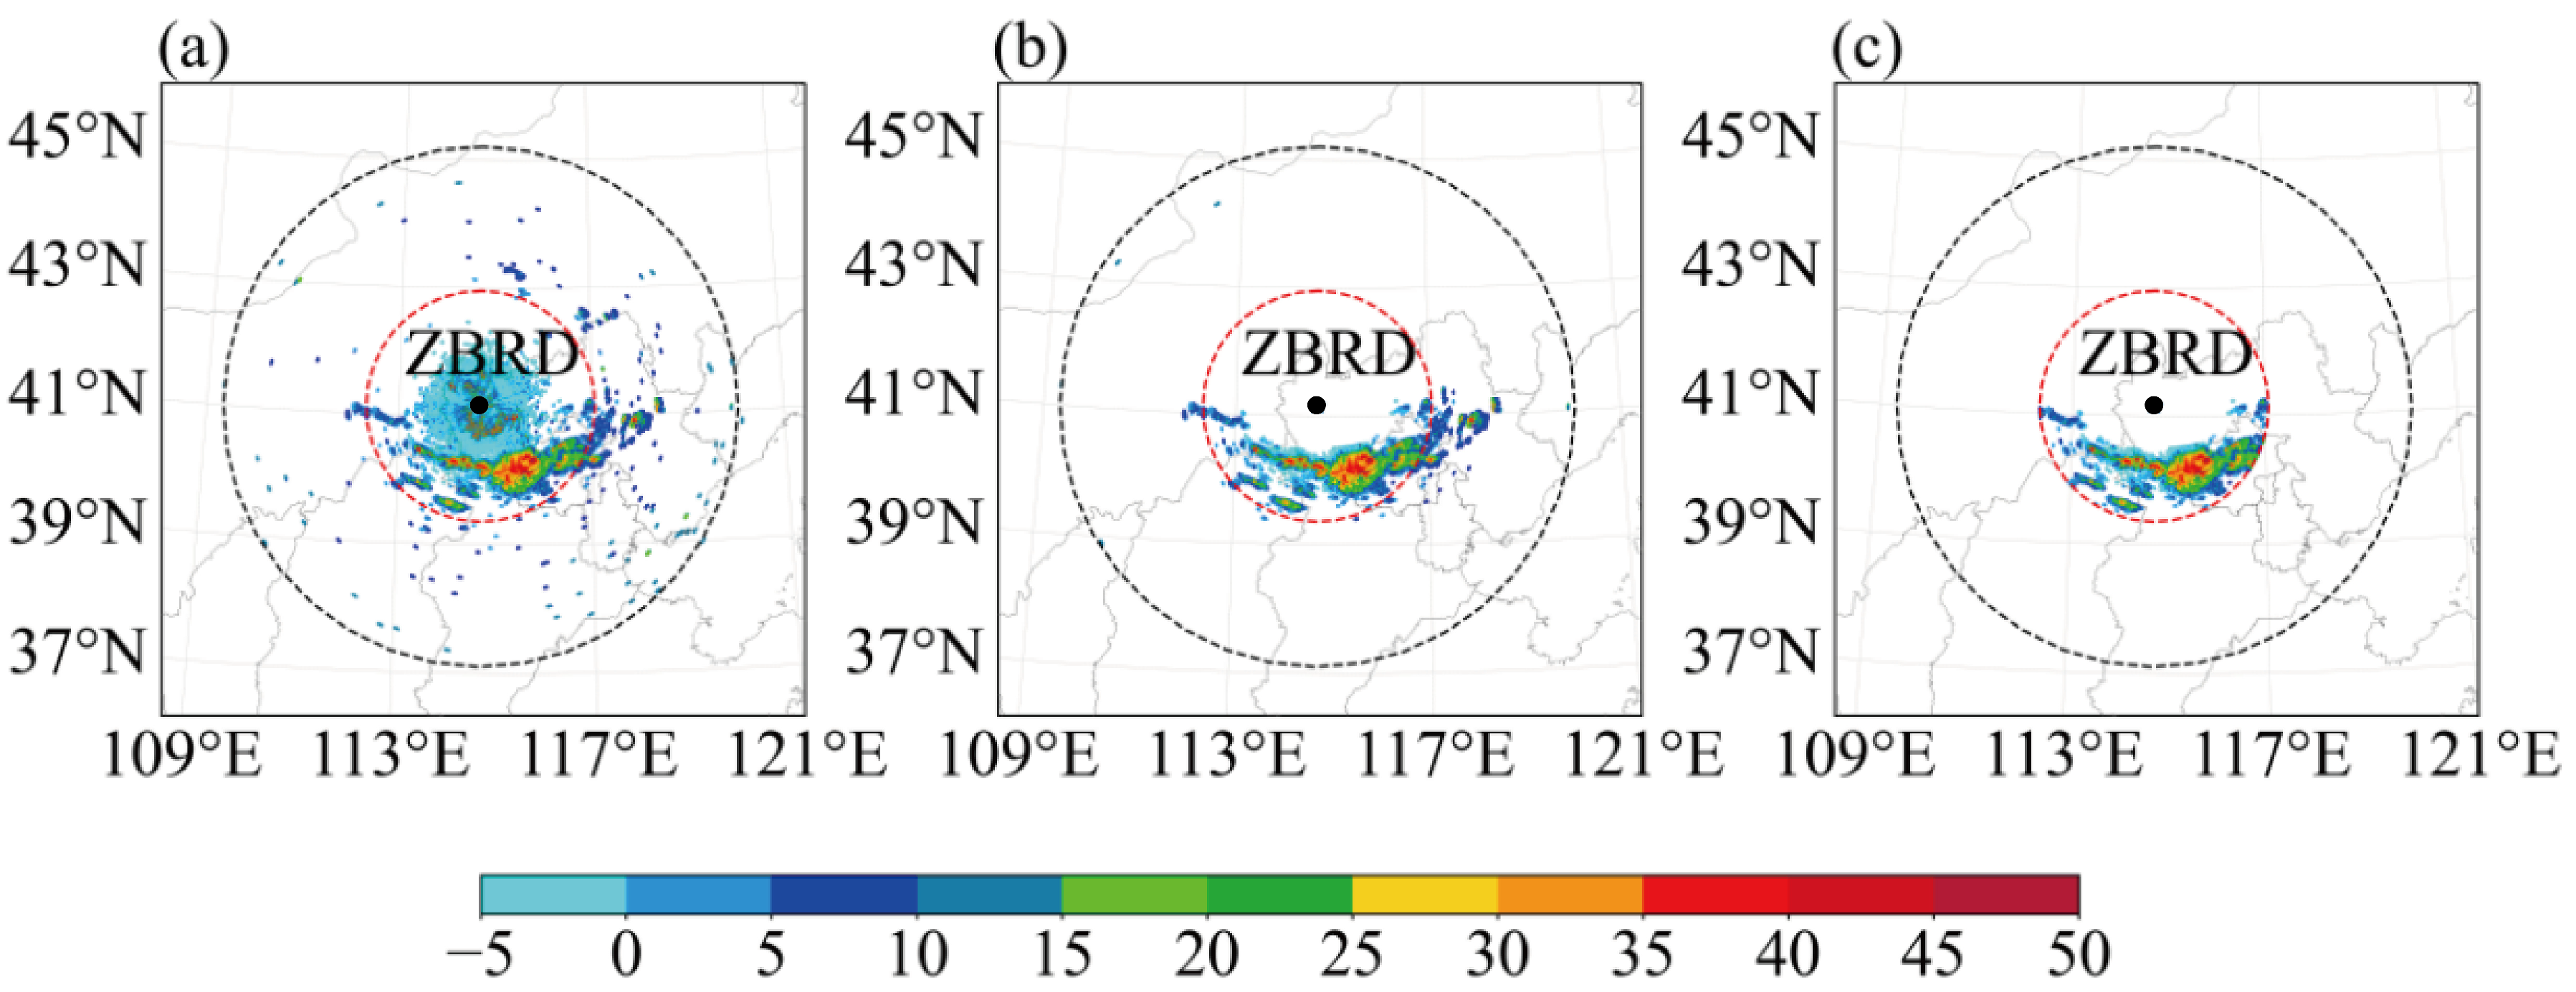
As shown in Figure 2a, the initial data display clear-air echoes near the radar center, with a strong echo region located slightly to the south. The observed area is also contaminated by false noise and clutter. In contrast, Figure 2b demonstrates that unreasonable clear-air echoes near the radar center were removed, and most noise points in distant regions were eliminated after preliminary quality control. For radar observation truncation, a spatial truncation radius of 200 km is applied to the filtered echoes after preliminary quality control. Echoes within 200 km of the radar are retained, while those beyond this range are discarded. This 200 km truncation radius was determined considering both the spatial scale of convective systems typically observed in the Beijing region and the density of ground-based radar coverage. It effectively encompasses the main convective structures while preventing the inclusion of distant, low-quality echoes. Figure 2c effectively truncates weak echoes beyond the 200 km radius, preserving and emphasizing strong central echoes while removing false weak echoes. This further improves radar observation quality beyond the initial quality control. The radar observation quality control and spatial truncation methods described above were uniformly applied to the BJRD radar.

2.3. Surface Observations

The AWS observations used in this study are provided by the National Meteorological Service Center as ground-based automatic weather station data. After quality control, they are input into the assimilation system, covering conventional near-surface meteorological variables such as temperature, humidity, pressure, and wind speed and direction. With dense spatial coverage and high temporal frequency, these observations play an important role in constraining boundary layer structure, cold pool development, and convective triggering conditions. The specific distribution of automatic weather stations is shown as gray points within D02 in Figure 1. As seen in the figure, the stations are densely distributed and cover a wide area within the study region. The spatial density of the 12,706 automatic weather stations within D02 is indicated by gray points in Figure 1, and the observations were recorded every 10 min. During the observation preprocessing stage, standard quality control procedures were applied, including outlier removal and spatial neighborhood consistency checks. Observations were then mapped to the model grid, interpolated to assimilation grid points, and assigned typical observation error standards recommended in the literature: approximately 1 K for temperature, 1 g/kg or 5% relative humidity for moisture [29,30].
Assimilation was implemented within the WRFDA 3DVar framework, using a cost function consistent with Equation (1). Surface observation assimilation adjusts the background field by minimizing this cost function, strengthening the constraint of boundary layer temperature and humidity on model forecasts. In joint assimilation experiments, AWS assimilation can be conducted alone (AWS-only experiment) or combined with radar observations.

2.4. Choice of Variance and Length Scaling Parameters

During the assimilation process, the setting of variance and length scale parameters is crucial. In this study, the variance and length scaling parameters for radar reflectivity assimilation were set within the ranges of 1–3 and 0.1–0.3, respectively. These values were determined through extensive sensitivity experiments, which indicated that they produce physically consistent increments while minimizing spurious echoes. Smaller length scales (0.1–0.3) are particularly suitable for high-resolution convective-scale systems, as they constrain the analysis to observed convective structures without excessive smoothing, consistent with previous studies [26,31]. Wang and Liu [31] showed that reducing horizontal correlation length scales enhances the analysis of convective echoes and suppresses spurious structures, while Chen et al. [26] demonstrated that smaller length scales improve forecast performance in radar radial velocity assimilation by reducing false signals and maintaining physically coherent flow patterns. Based on these findings, the selected scaling parameters ensure stable and physically meaningful analysis increments for the rapidly evolving, short-lived squall line examined in this study.

3. Case Overview and Experiments

3.1. Case Overview

Beijing was impacted by a severe convective event, with a squall line propagating from the west, posing significant hazards to life and property. The squall line was observed entering the Beijing area as early as 06:00 UTC, and peak instantaneous winds were recorded around 06:30 UTC, causing substantial damage in the southwestern sectors of the city. After 07:00 UTC, the squall line weakened and gradually shifted eastward, moving away from Beijing. It should be noted that no widespread heavy rainfall was observed during this event.
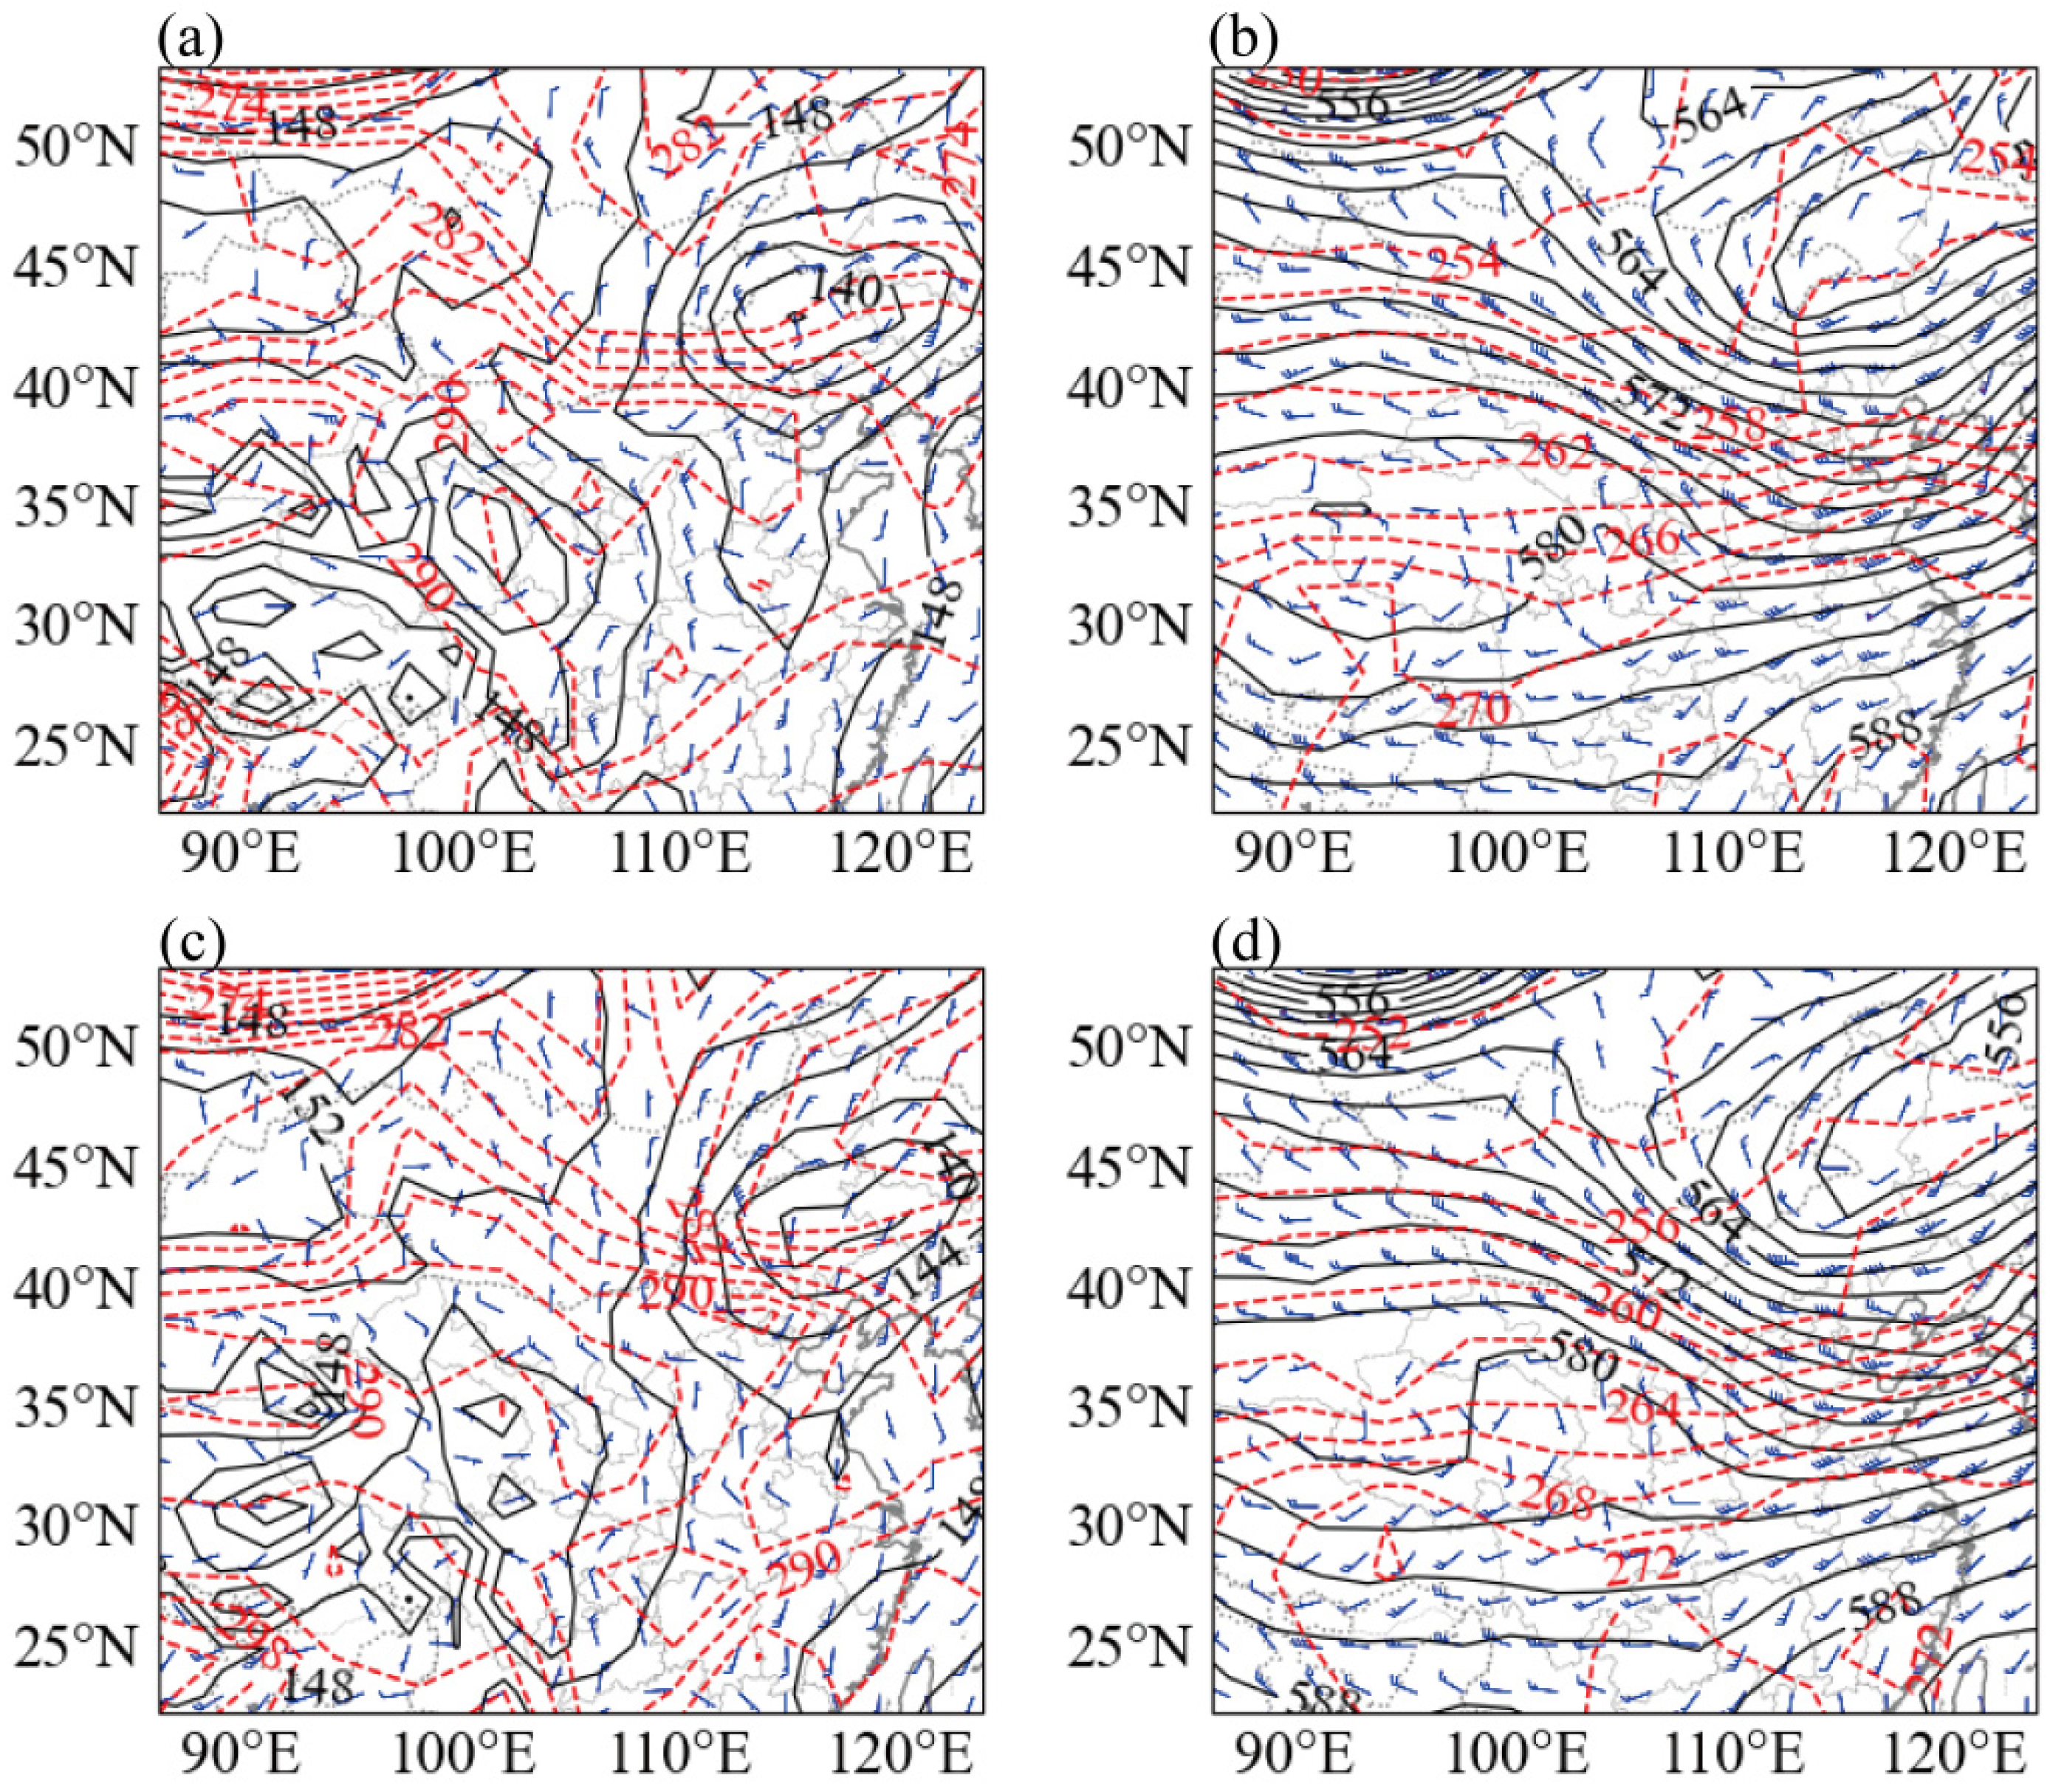
Geopotential height, temperature, and winds at 850 hPa and 500 hPa at 00:00 UTC and 04:00 UTC on 30 May 2024 are shown in Figure 3, providing the large-scale synoptic background for convective initiation and development. At 850 hPa (Figure 3a,c), a low-pressure trough and a closed low center over western North China were identified at 00:00 UTC (Figure 3a), indicating pronounced low-level convergence. Isotherms in this region exhibited steep gradients, reflecting a strong thermal contrast between cold northern air and warm, moist southern flows near 30–35°N. Convergence of southerly and northerly winds over North China supplied abundant thermodynamic instability and moisture, which favored convective development. By 04:00 UTC (Figure 3c), the low-level trough had migrated eastward and deepened, with a strengthened temperature gradient, and convergence and upward motion from central North China to the Bohai coast were intensified, suggesting mature conditions for convective initiation.
At 500 hPa (Figure 3b,d), North China was influenced by a mid-level trough at 00:00 UTC (Figure 3b), extending eastward along its axis and accompanied by a westerly jet. Mid-level cold air intrusion was evident from isotherms, reducing temperatures aloft and increasing the vertical temperature difference between mid- and lower levels, thereby enhancing static instability. The winds exhibited northwesterly flow and embedded jet streaks, providing favorable upper-level divergence. In Figure 3d, the mid-level trough continued its eastward movement, with further tightening of geopotential contours and expanded influence of cold air, accentuating horizontal temperature contrasts at 04:00 UTC. The jet axis shifted southward and intensified, and the coupling between upper-level divergence and low-level convergence facilitated the organization and strengthening of the convective system.
In summary, during this episode, the interaction of low-level warm, moist advection with mid-level cold air intrusion, combined with a coherent upper-level and lower-level divergence system, created a classic environment conducive to strong convection. These conditions ultimately led to the formation and intensification of the squall line over North China.

3.2. Model Configurations and Experimental Design

3.2.1. Model Configurations

Version 4.3 of the mesoscale Weather Research and Forecasting (WRF) model was employed in this study to perform numerical simulations and observational assimilation experiments for a strong convective squall line event. The WRF-ARW dynamical core was used in conjunction with the WRF 3DVar assimilation system to incorporate and constrain multiple observational datasets.
The computational domain was configured with a two-way nested grid to balance large-scale background field constraints with the capability to resolve convective-scale structures. The simulation domain was centered over North China, with its center at 37°N, 105°E (Figure 2). The outer domain had a horizontal resolution of 9 km, encompassing China and adjacent regions to fully capture large-scale circulation features derived from reanalysis data. The inner domain was designed with a 3 km resolution, covering North and Central China, allowing detailed representation of strong convective systems such as squall lines. Grid sizes were set to 649 × 500 for the outer domain and 550 × 424 for the inner domain. Vertically, 59 levels were included, with the model top at 10 hPa, ensuring adequate representation of tropospheric and lower stratospheric processes.
Model physical schemes were applied consistently across both outer and inner domains. The Thompson cloud microphysical scheme [32] was implemented, longwave and shortwave radiation transfer was represented by the RRTMG scheme [33], land surface processes were simulated using the NOAH land surface model [34,35], and boundary layer processes were represented by the Mellor-Yamada-Janjic (MYJ) planetary boundary layer scheme [36,37,38].
Initial and lateral boundary conditions were provided by the ERA5 reanalysis datasets (0.25° × 0.25° horizontal resolution) with 6 h temporal resolution. To improve the representation of convective-scale systems, observation assimilation experiments were conducted using the WRFDA system.

3.2.2. Experimental Design

To address the primary research objectives, nine numerical experiments were designed, as summarized in Table 1. These include a control experiment (CTRL), a radar assimilation experiment without distance-truncated quality control (DA_RA4_woTrc), four radar assimilation experiments with varying combinations of variance and correlation length scales, one experiment assimilating only AWS observations, and two joint assimilation experiments with different assimilation sequences. It should be mentioned that except for the experiment DA_RA4_woTrc, all other radar assimilation experiments employed distance-truncated radar data. The four radar data assimilation experiments, DA_RA1, DA_RA2, DA_RA3, and DA_RA4, correspond to variance and correlation length scale combinations of (1, 0.1), (1, 0.3), (3, 0.1), and (3, 0.3), respectively. The two joint assimilation experiments both incorporated radar and AWS observations but in different sequences. In DA_JOINT1, radar observations were assimilated first, and the resulting analysis was subsequently used as input for AWS assimilation to generate the final output. DA_JOINT2 followed the reverse sequence. In addition, to illustrate the impact of spatial truncation, the DA_RA4_woTrc experiments adopted the variance and correlation length scale combination of (1, 0.1) to compare with DA_RA1.
Figure 4 presents the experimental workflow employed in this study. The control experiment was integrated from 00:00 UTC to 09:00 UTC on 30 May 2024 and served as the baseline simulation. The assimilation sensitivity experiments were conducted following a two-stage design. During the first stage, from 00:00 UTC to 04:00 UTC, a spin-up period was implemented, which allows the model to adequately adjust initial conditions and reduce instabilities inherent in the initial fields to formal simulation. Observations were assimilated at 15 min intervals from 04:00 UTC to 06:00 UTC, ensuring that observational information was fully incorporated and gradually influenced model evolution. Boundary conditions were updated every 15 min and gradually transmitted from the outer to the inner domain. Once the final assimilation was completed, the resulting analysis was directly employed as the initial condition for the subsequent 3 h forecast to 09:00 UTC.

4. Results

4.1. Radar Assimilation

4.1.1. Spatial Truncation Radar Reflectivity Observations

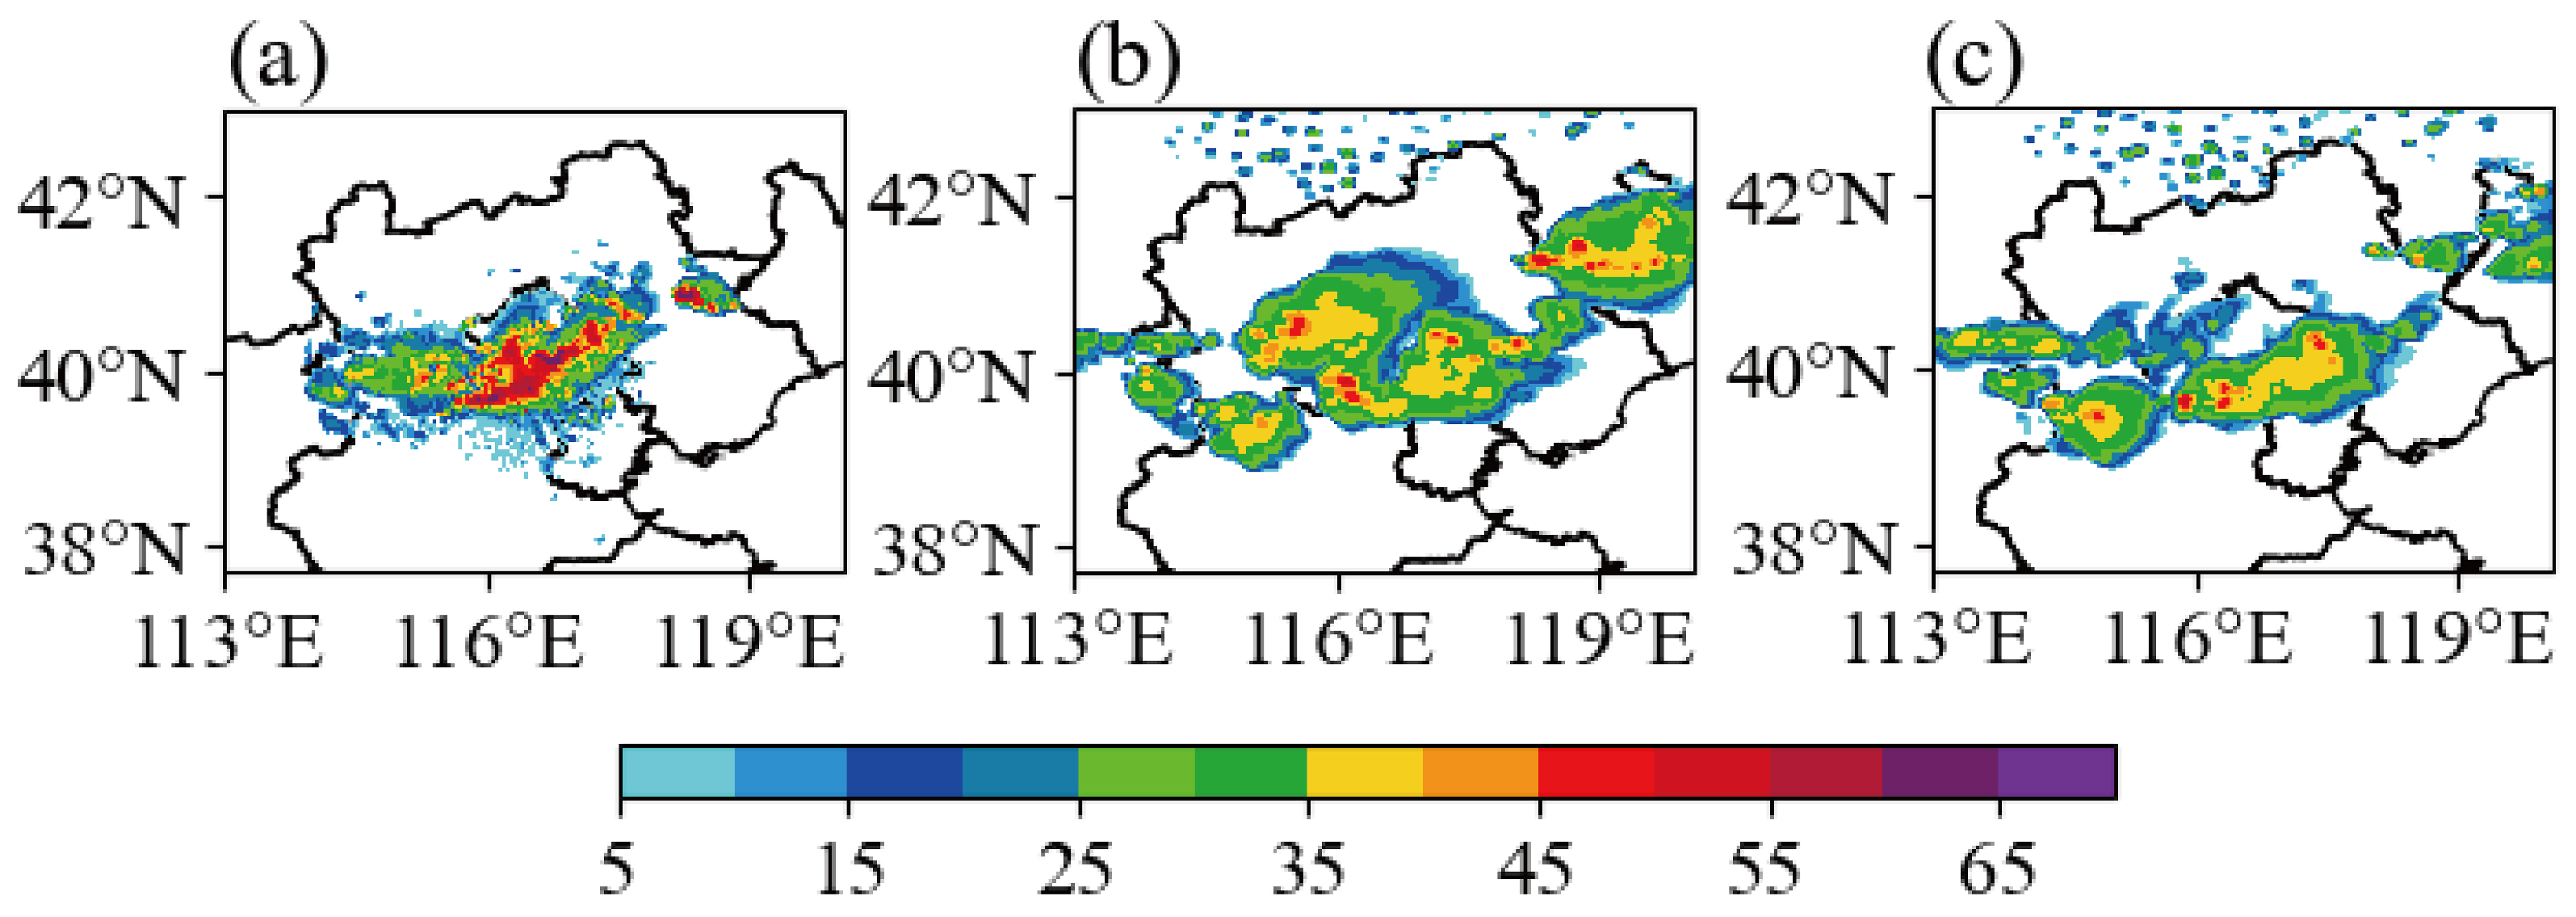
In this study, composite reflectivity refers to the maximum radar reflectivity detected vertically through the entire atmospheric column, representing the strongest echo intensity at any level within the radar volume. Focusing on spatial truncation, Figure 5 presents a comparison of simulated composite reflectivity at 07:00 UTC on 30 May 2024 for two radar assimilation experiments, DA_RA4_woTrc and DA_RA4. The main locations of the convective system were captured by both experiments to a reasonable extent, particularly the echo structures over Beijing and adjacent areas, demonstrating good agreement with observations. These results indicate that radar assimilation, whether implemented in DA_RA4_woTrc or DA_RA4, contributes positively to the localization of the convective system. However, significant differences were identified between the two experiments in terms of echo intensity and structural detail. Both experiments underestimated the strength of observed intense echoes, and the coverage of high-reflectivity regions was smaller than observed, suggesting that the model struggles to fully reproduce convective core intensity. Differences in spurious echoes were also evident. In DA_RA4_woTrc, a large area of unrealistic echo appeared west of 116°E and north of 40°N, where observations showed no significant echo, indicating that false signals were introduced during assimilation. In contrast, DA_RA4 exhibited no such spurious structures, and its echo distribution was more consistent with observations.
Overall, although the intensity of strong convective echoes was underestimated in both experiments, DA_RA4provided improved spatial realism, particularly by avoiding spurious echoes. These findings suggest that DA_RA4 more effectively utilized observational information and error constraints, thereby enhancing the model’s capability to reproduce the spatial organization of the convective system. They also demonstrate that even a limited number of truncated observations can exert a critical influence. Subsequent analyses of scale sensitivity and joint assimilation are therefore conducted using the truncated observations.

4.1.2. Assimilation Scales of Radar Observations

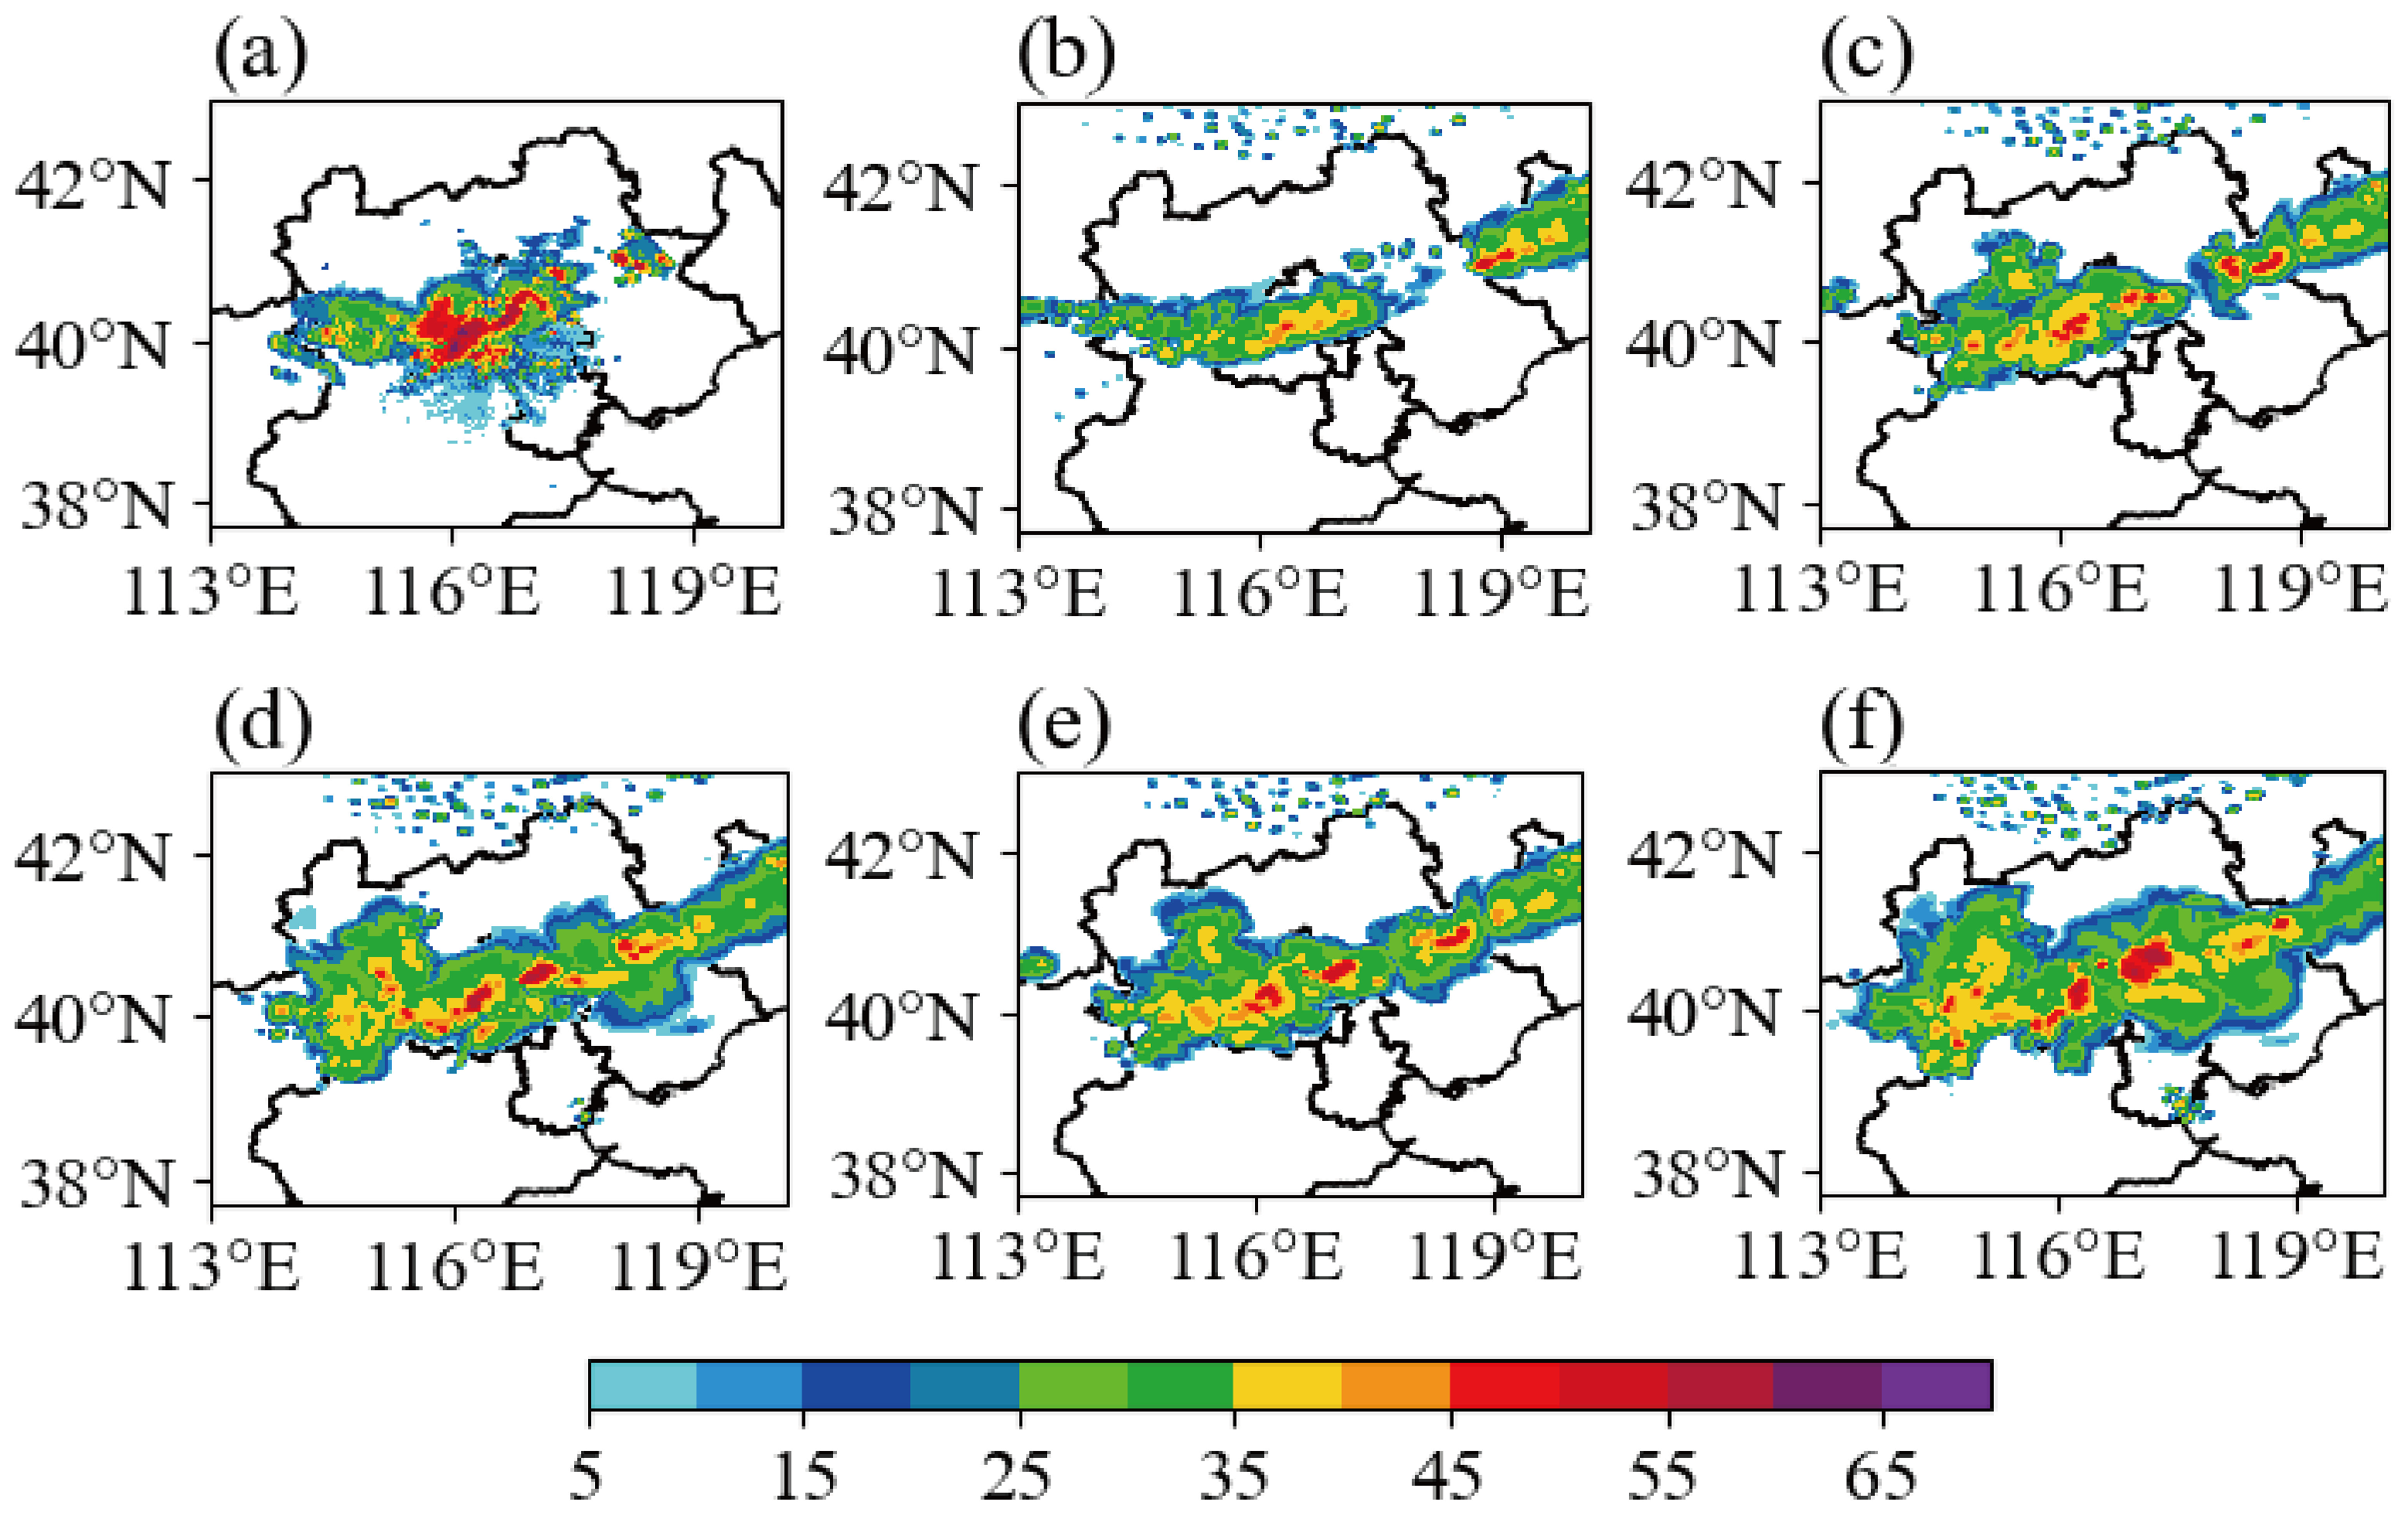
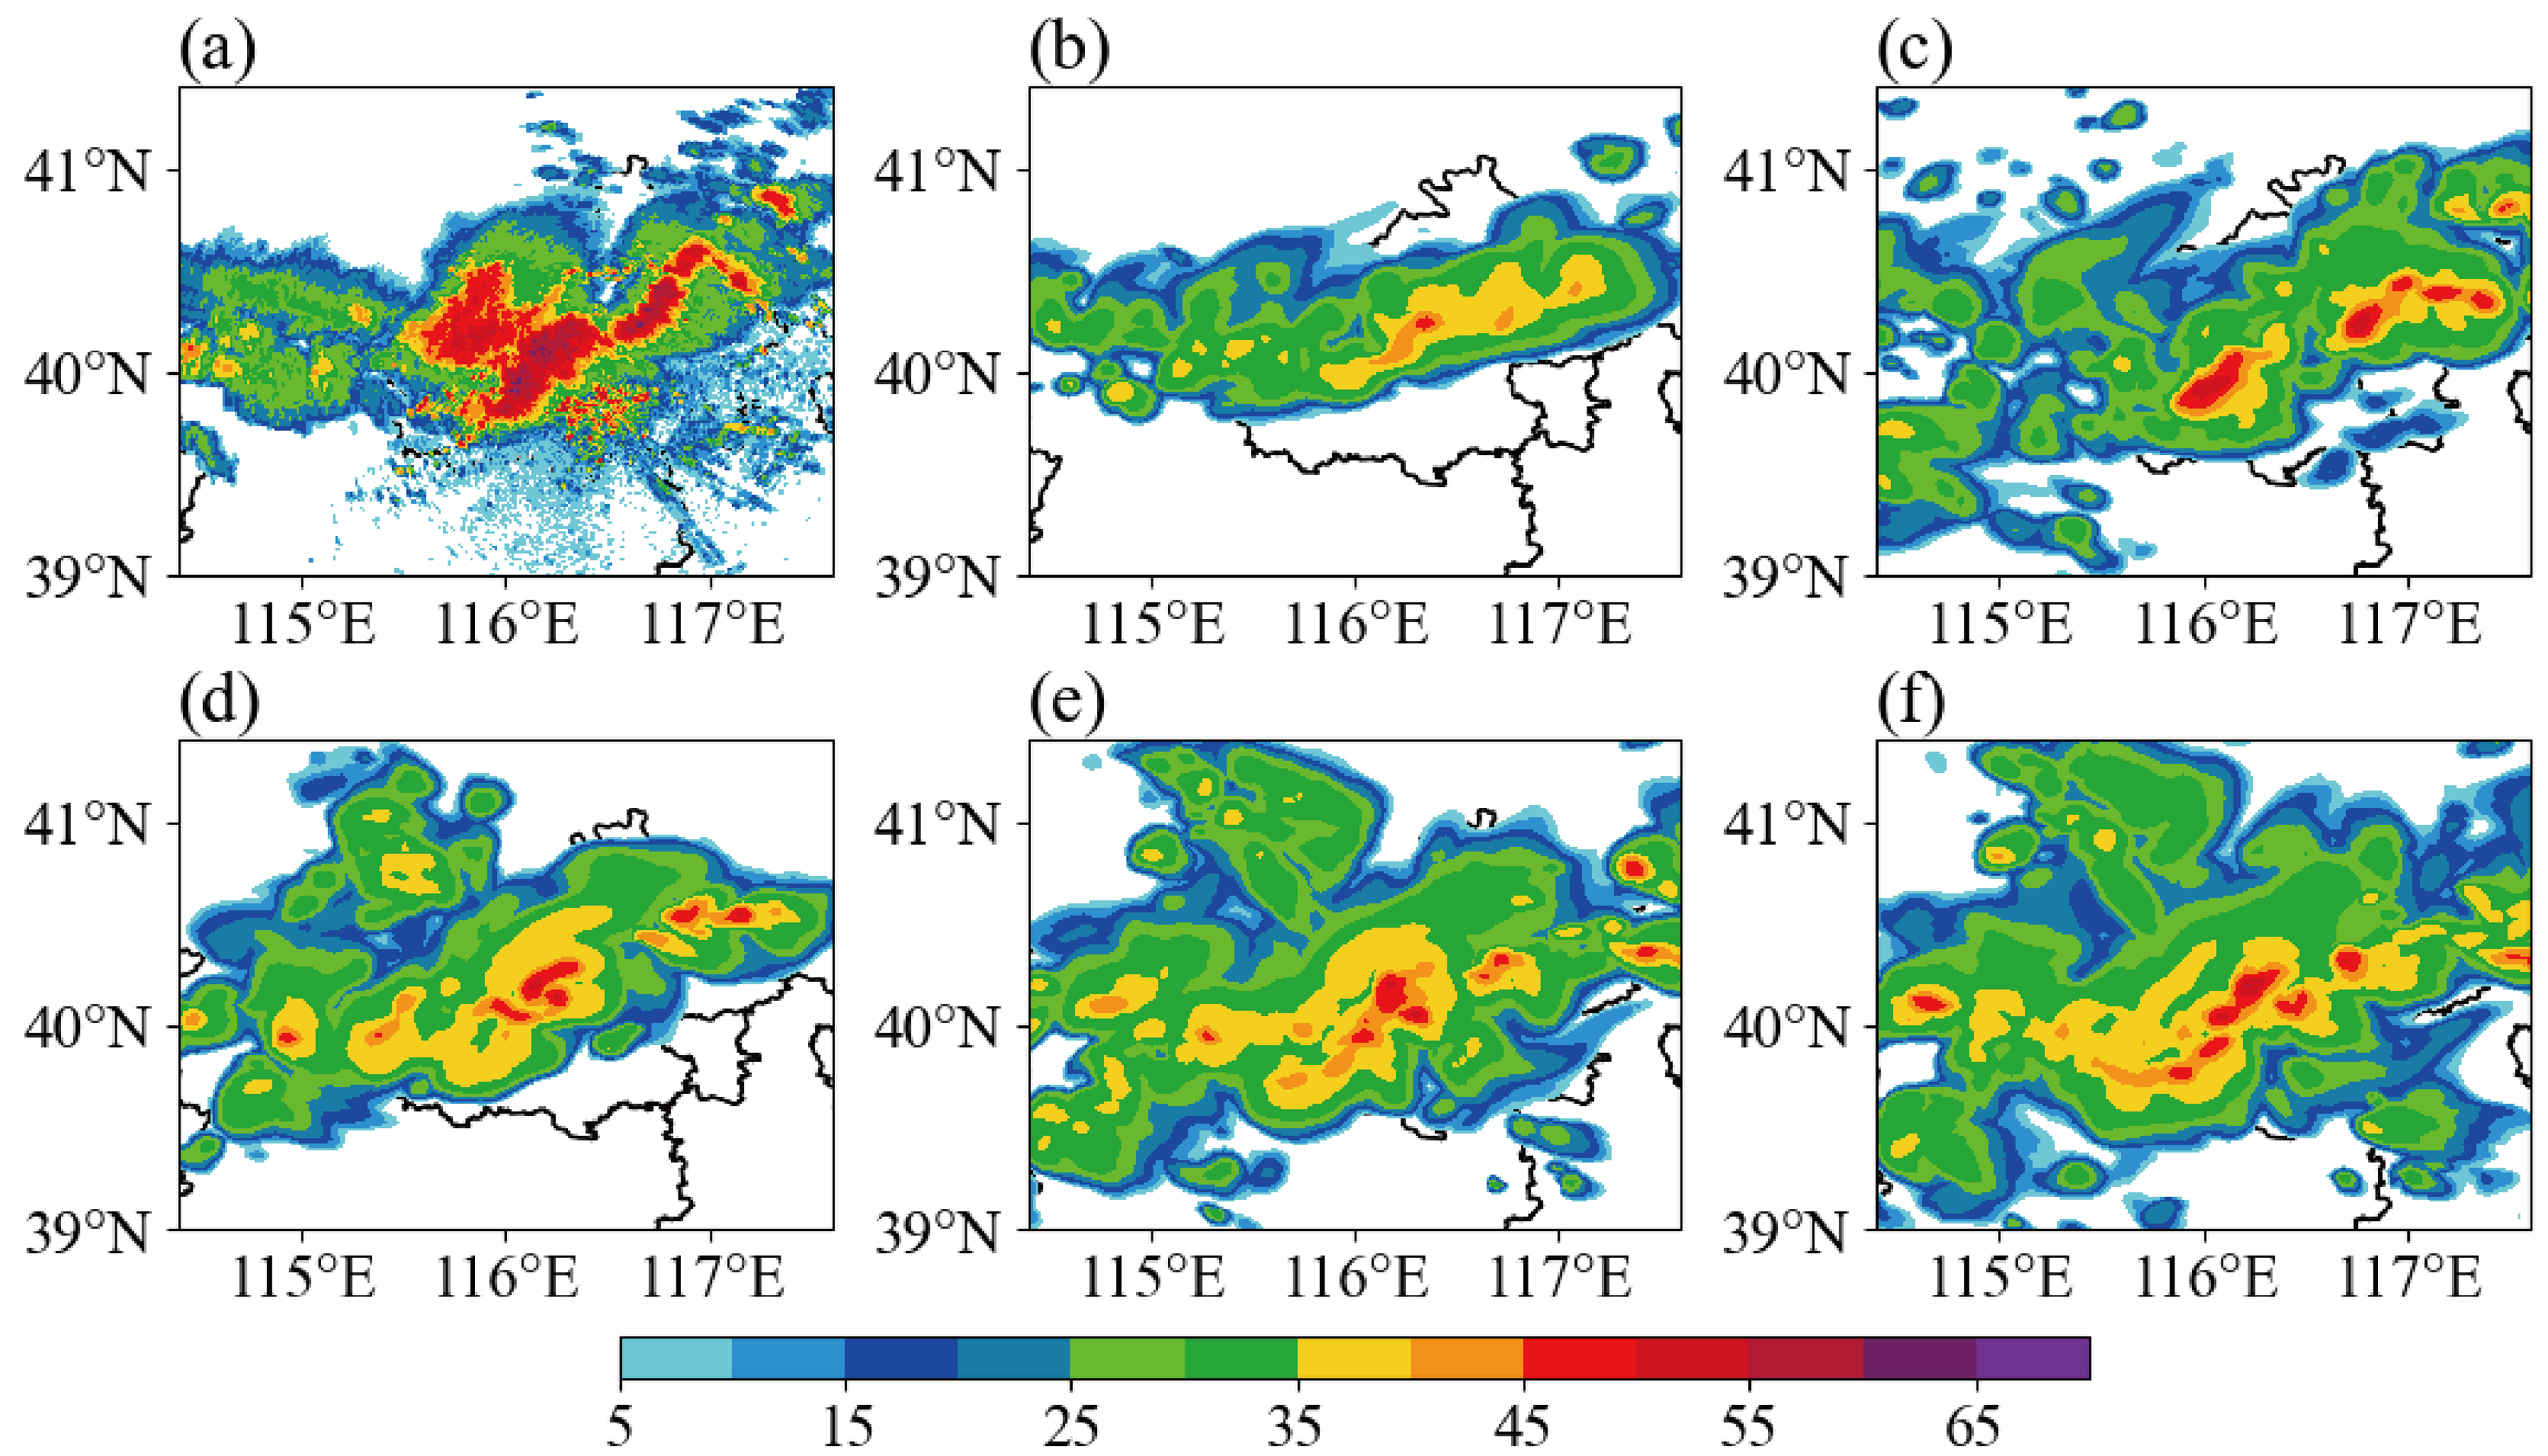
In radar reflectivity assimilation, the selection of an appropriate background error correlation length scale is critical, as scales that are too small or too large can introduce distinct issues. Scales that are too small may fail to capture strong convective signals, whereas overly large scales can generate spurious structures and positional errors. In Figure 6, the CTRL experiment (Figure 6b) reproduces the strong echo features observed only weakly, with overall reflectivity being underestimated and major convective cores poorly represented. These results indicate that reliance solely on the model’s physical processes and initial conditions is insufficient to accurately simulate this strong convective event.
In contrast, the four radar assimilation experiments (DA_RA1, DA_RA2, DA_RA3, and DA_RA4) substantially enhanced echo intensity and the organization of the convective system. DA_RA1 (Figure 6c) exhibits the closest agreement with observations in both reflectivity magnitude and spatial distribution, successfully capturing the locations and intensities of the primary convective cores. As the assimilation scale increases, reflectivity intensity strengthens progressively, but deviations from observations also increase (Figure 6d–f). Larger scales generate stronger echoes in some areas but simultaneously introduce more spurious signals and positional errors, especially in regions where no significant echoes were observed. These findings demonstrate that excessive assimilation scales amplify the propagation of background and observational errors, thereby distorting local convective details.
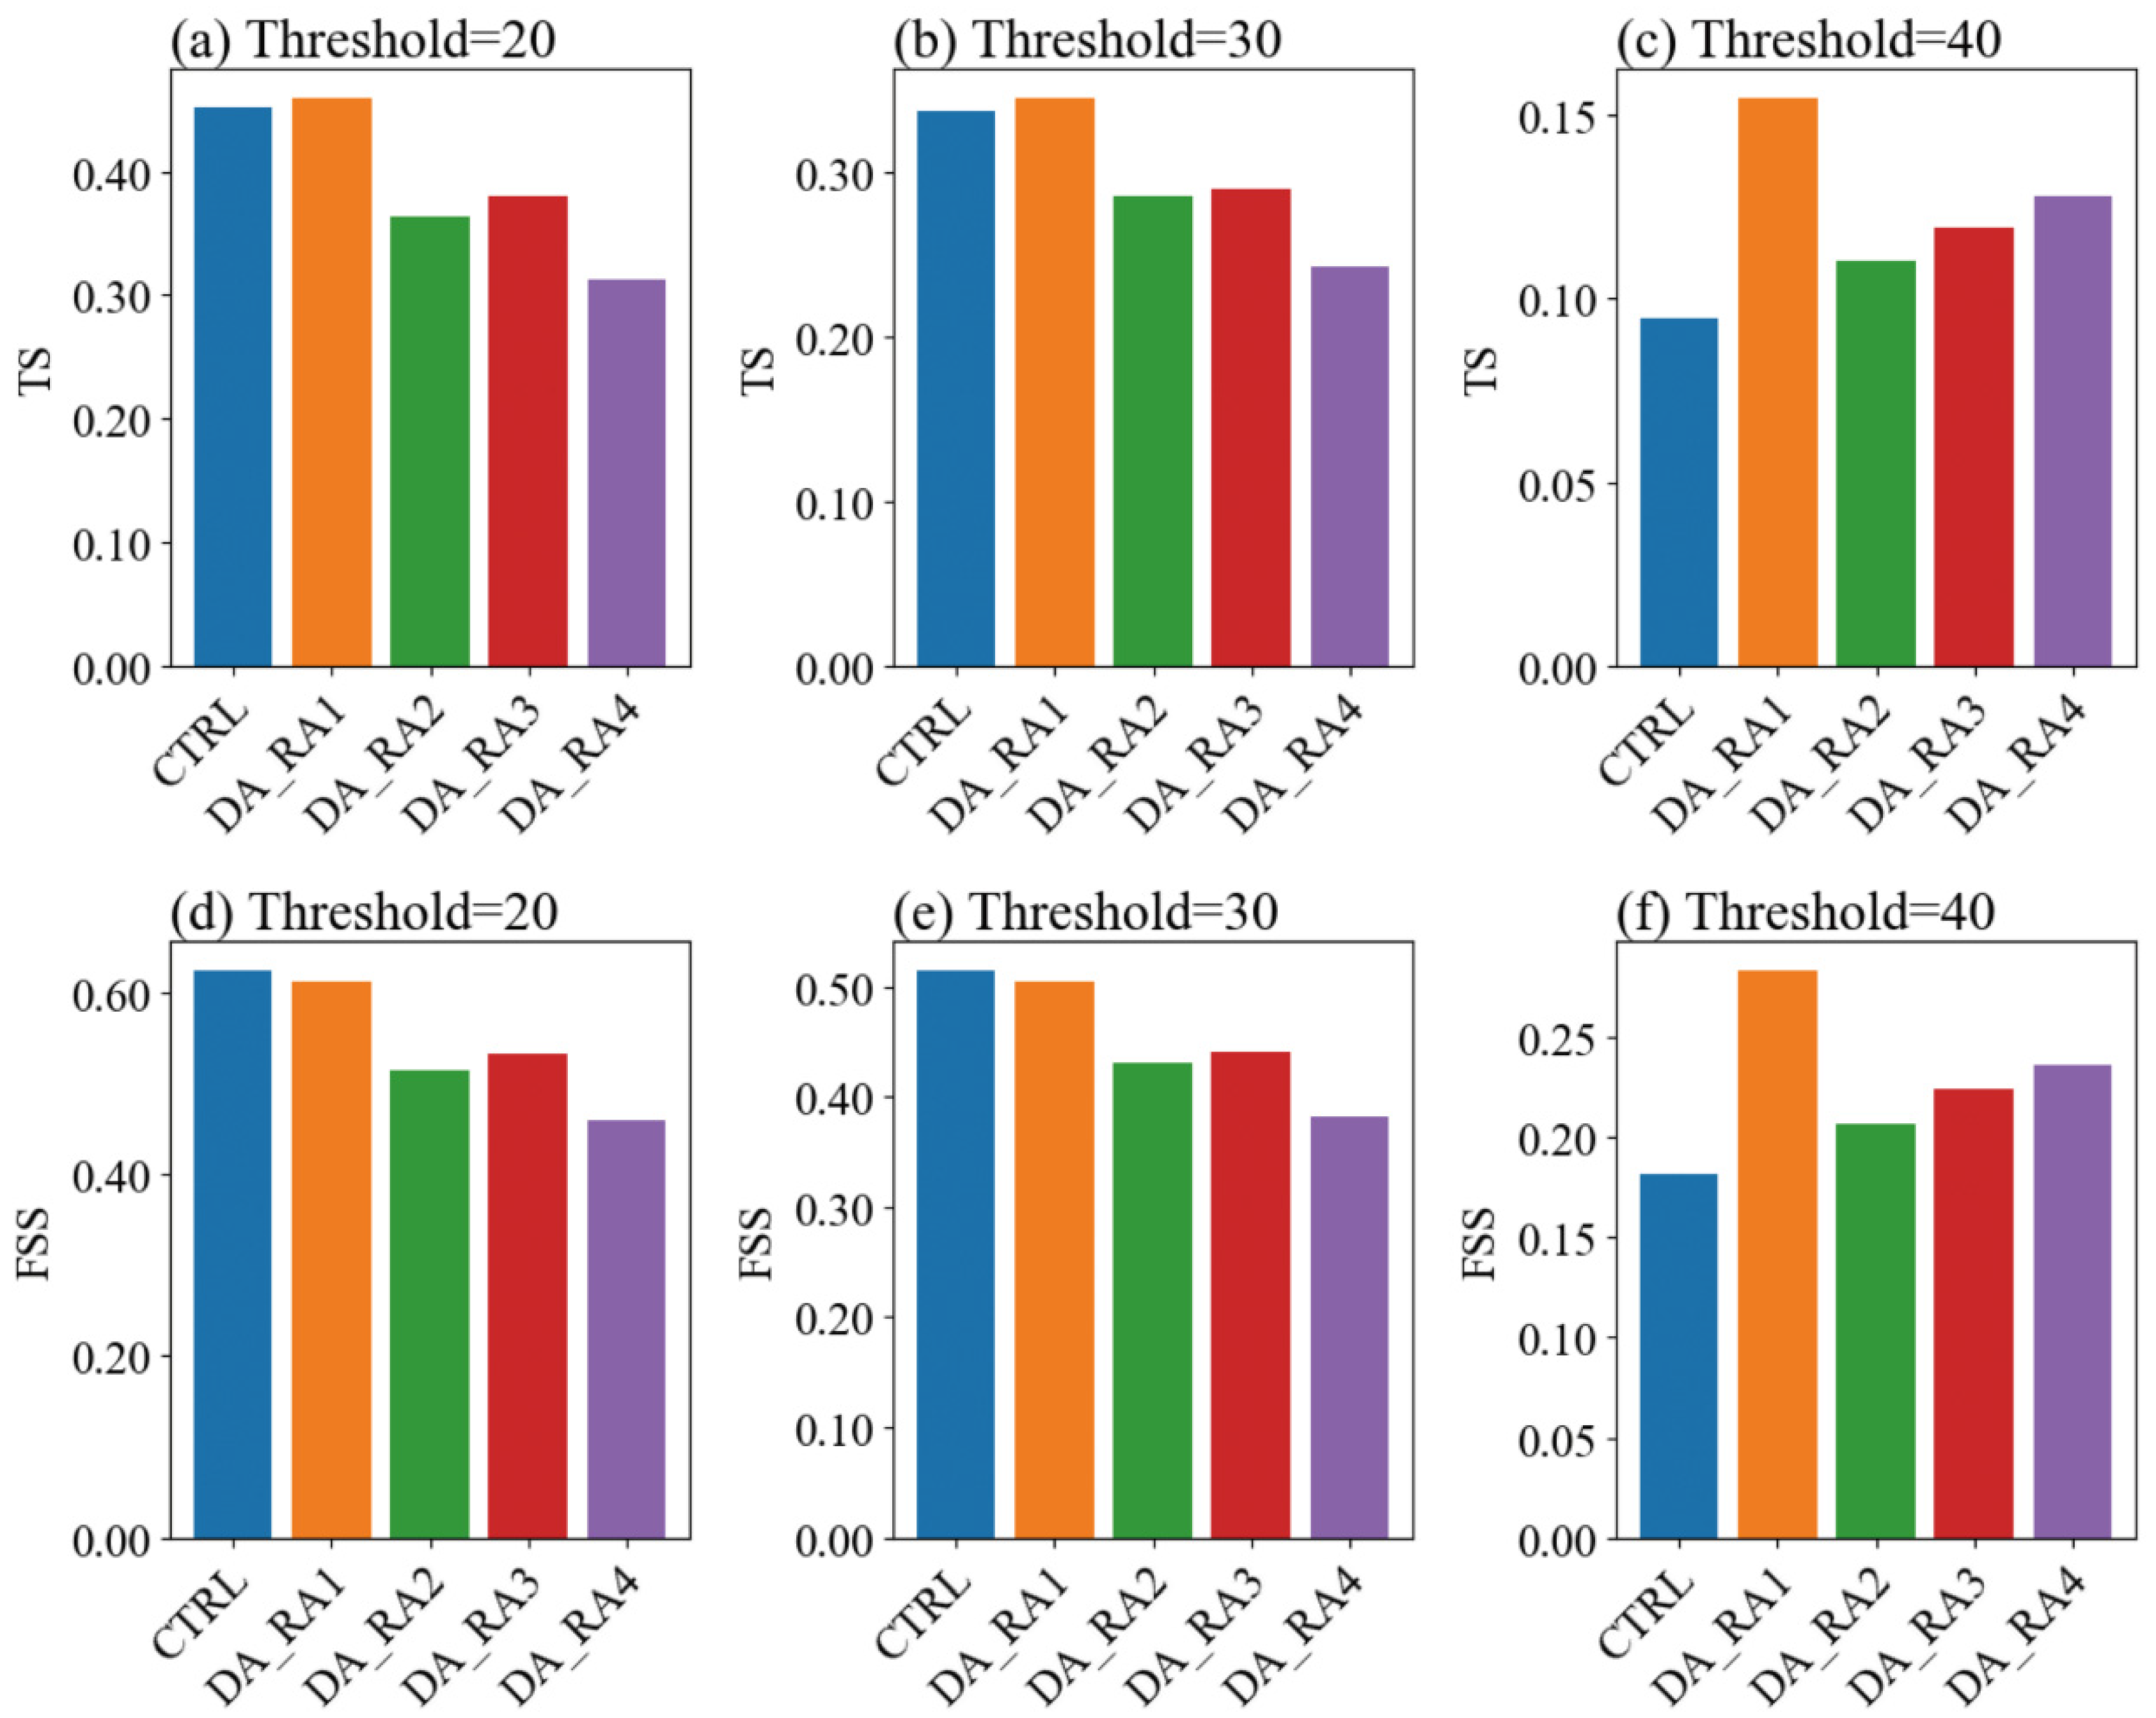
To quantify these differences, Figure 7 presents the TS and FSS at 20, 30, and 40 dBZ thresholds. The Threat Score (TS) is a widely used categorical verification metric that measures the overall accuracy of forecast events by accounting for both hits and false alarms. It is defined as the ratio of the number of correctly predicted events (hits) to the total number of events that were either forecast or observed [39]. The Fractions Skill Score (FSS) is a neighborhood-based spatial verification metric that assesses the similarity between the spatial distributions of forecast and observed fields. Instead of relying on point-to-point comparisons, FSS evaluates the fractional coverage of events within a given neighborhood, thereby accounting for small spatial displacements that often occur in high-resolution convective forecasts [40].
The TS primarily reflects the balance between hits and false alarms for specific threshold areas, whereas the FSS evaluates the model’s ability to reproduce spatial structures. At 20 and 30 dBZ thresholds, the CTRL experiment’s TS is slightly higher than DA_RA2, DA_RA3, and DA_RA4, and only lower than DA_RA1, suggesting that although reflectivity is underestimated, the spatial distribution of weak-to-moderate echoes is relatively uniform with few spurious signals, resulting in relatively high statistical scores. At the 40 dBZ threshold (Figure 7c), the CTRL TS decreases substantially, falling below DA_RA3 and DA_RA1, indicating poor reproduction of intense convective cores. Conversely, DA_RA1 maintains high TS values across all thresholds, demonstrating strong performance for intense convective echoes and highlighting its advantage in representing core structures.
For FSS, a distinct pattern is observed. At 20 and 30 dBZ thresholds, CTRL and DA_RA1 show similar FSS values, approximately 0.6 and 0.5, which are higher than those of DA_RA2, DA_RA3, and DA_RA4, indicating that the spatial distribution of weak-to-moderate echoes is well captured. At the 40 dBZ threshold (Figure 7f), DA_RA1 achieves an FSS of 0.3, substantially higher than CTRL and the other experiments, which all score below 0.15.
To further understand the observed reduction in skill at the highest threshold, it is necessary to examine the factors contributing to the decreased performance for intense convective cores. The reduction in TS and FSS at the 40 dBZ threshold reflects the inherent difficulty of representing strong convective cores, which are highly localized, rapidly evolving, and often smaller than the model grid spacing. Small spatial displacements can lead to large penalties in verification metrics, and while assimilation adjusts the broader environment, it cannot fully constrain fine-scale, high-intensity structures due to observational and resolution limitations. The superior performance of DA_RA1 shows that careful selection of variance and correlation length scales can improve core representation, but the decrease at 40 dBZ highlights a general limitation in reproducing intense convective structures.
These results indicate that DA_RA1 provides the best spatial reproduction of strong convective regions, consistent with TS results, further confirming its superiority in representing convective core structures.
Combining the findings from Figure 6 and Figure 7, it is evident that increasing the assimilation scale enhances reflectivity intensity but also exacerbates spurious signals and positional errors. DA_RA1 attains a relative balance between intensity and spatial distribution, achieving the best performance in both TS and FSS. Differences between TS and FSS are also notable: TS emphasizes point-to-point agreement and is sensitive to spurious echoes and positional errors, whereas FSS emphasizes spatial pattern similarity and better reflects the model’s capability to capture overall convective structures. In this study, although CTRL occasionally outperforms DA_RA2, DA_RA3 and DA_RA4 in TS at certain thresholds, its advantage in FSS is limited, particularly at higher thresholds where performance declines. These results indicate that reliance solely on TS may underestimate deficiencies in simulating overall convective organization, while FSS provides a more comprehensive evaluation. Overall, DA_RA1 achieves an optimal balance in both TS and FSS and is thus considered the most appropriate scheme for representing this convective event. In subsequent analyses, FSS will be adopted as the primary metric for evaluating forecasts.

4.2. Combined Assimilation of AWS and Radar Data

4.2.1. Analysis Results

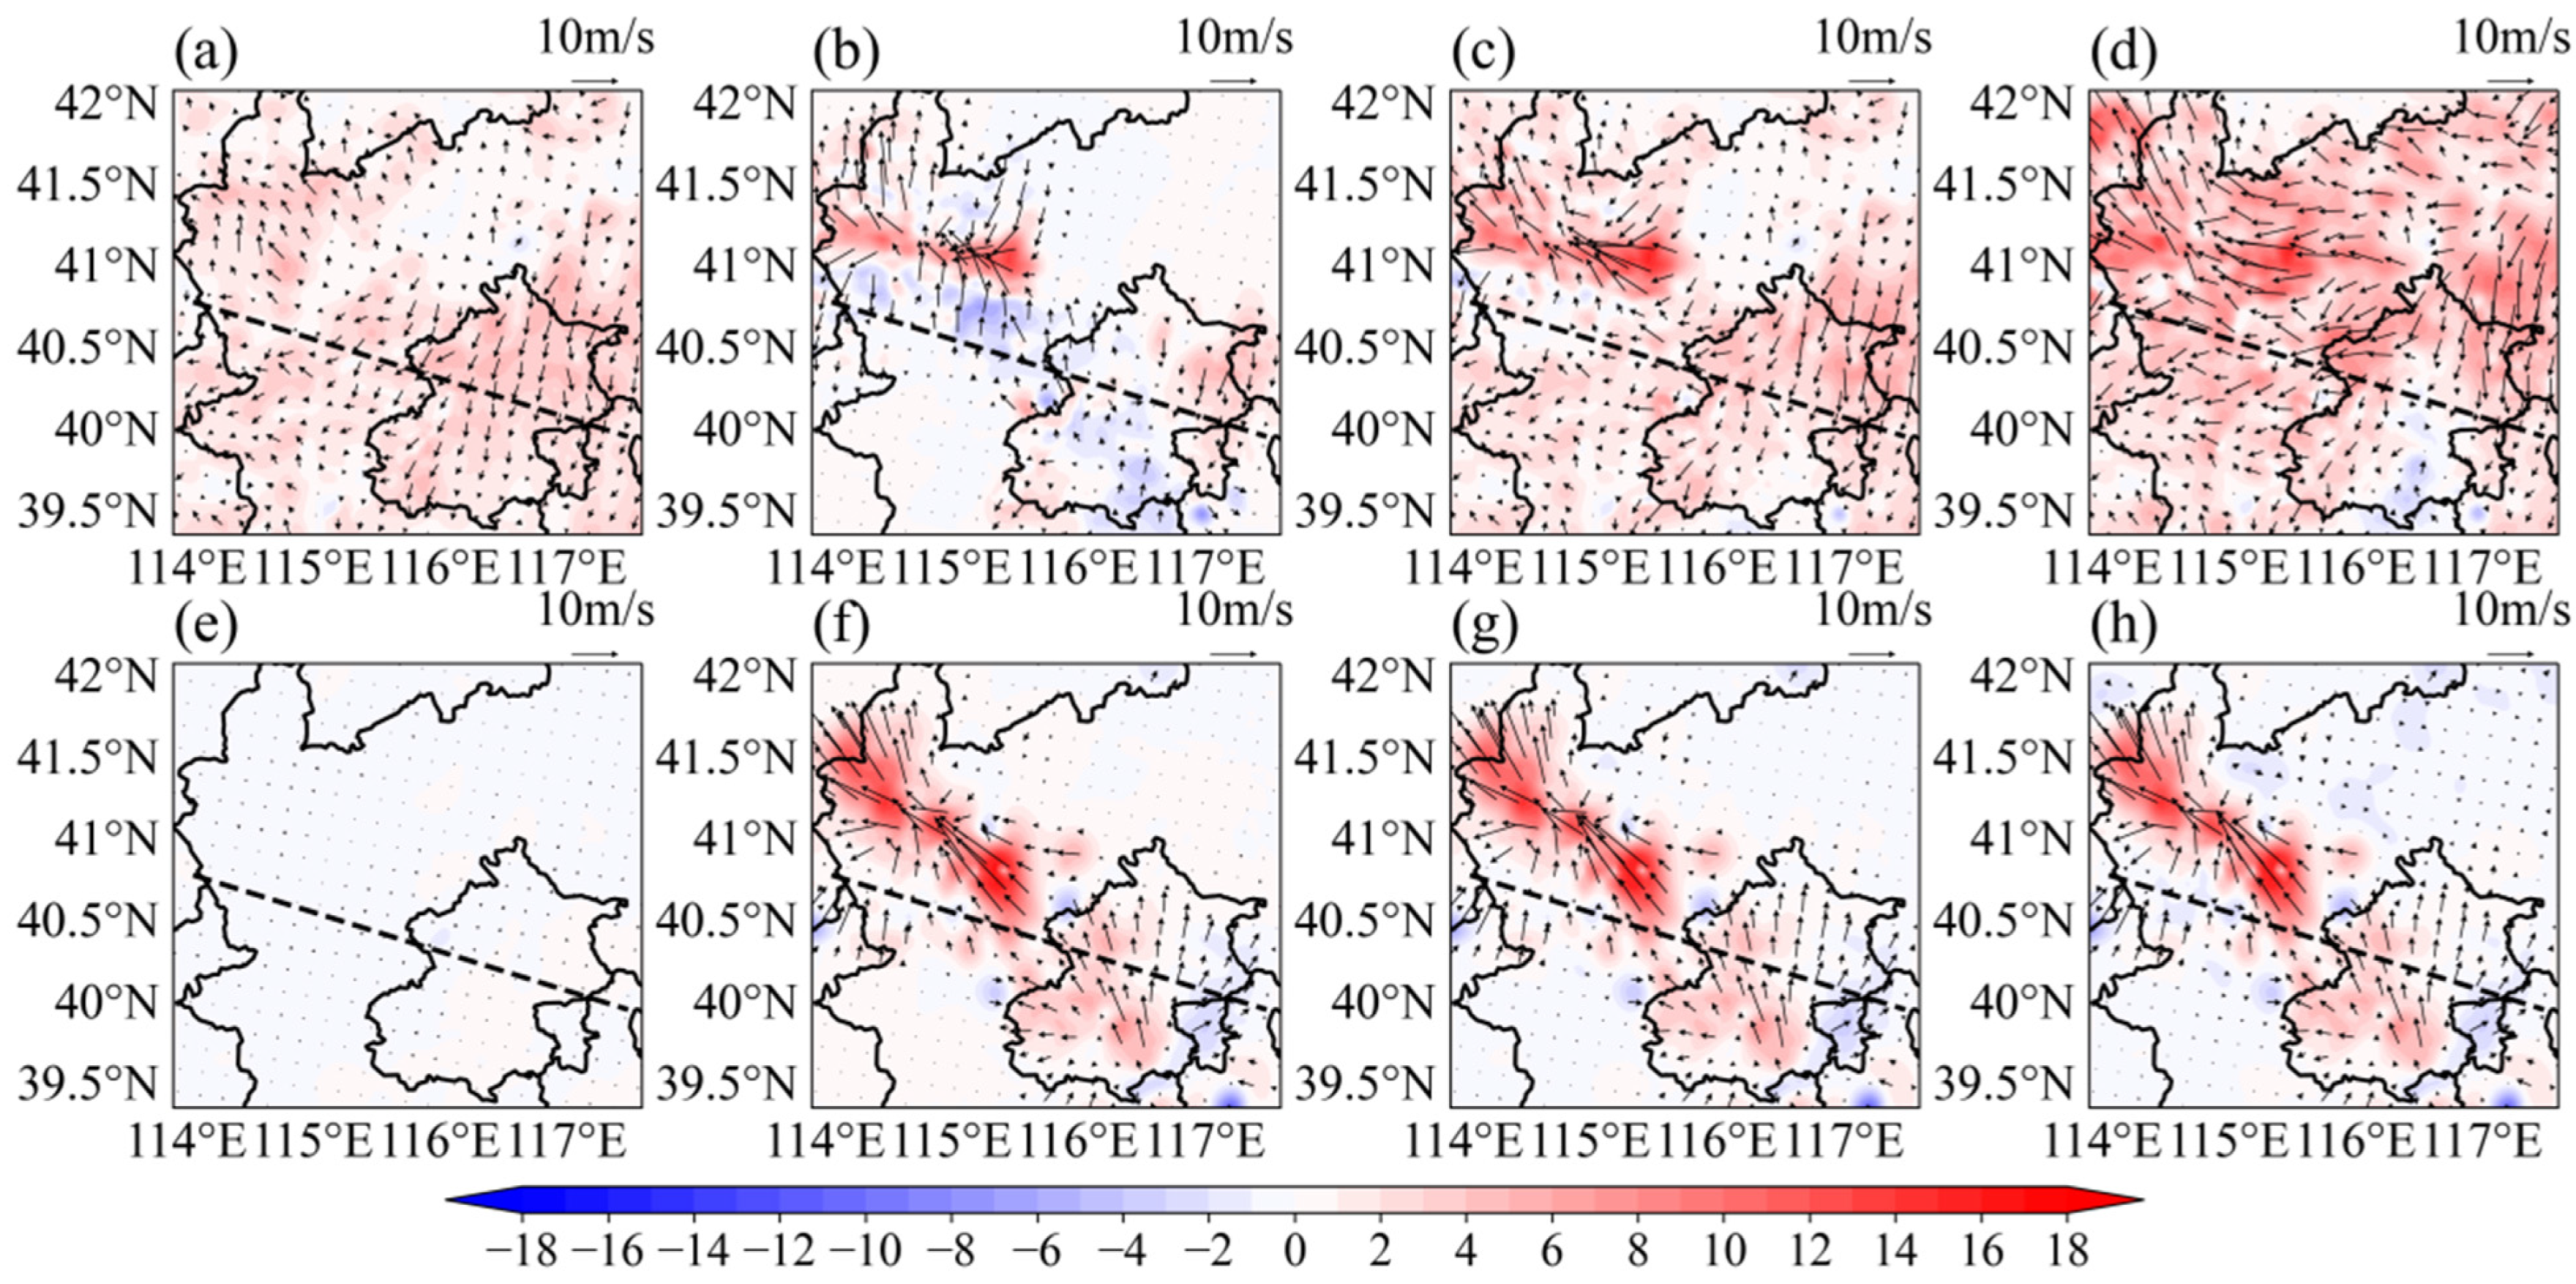
From Figure 8, substantial differences in wind increments at 900 hPa and 700 hPa are observed among the experiments. These increments correspond to the first data assimilation (04:00 UTC), representing the initial adjustments applied by each experiment. In DA_AWS (Figure 8a,e), the wind increments at 900 hPa are notably stronger than at 700 hPa, reflecting the nature of surface station observations, which provide dense near-surface information but limited mid-level coverage. The increments are predominantly small-scale, weak, and scattered, indicating that although AWS observations slightly adjust the large-scale flow, they are insufficient to produce significant convective-scale wind modifications. In contrast, DA_RA1 (Figure 8b,f) produces stronger mid-level increments at 700 hPa, where surface observations contribute little. Near the convective system, characteristic positive-negative dipole structures are generated, with local increment magnitudes exceeding 15 m/s and evident vector convergence features, demonstrating that radar observations effectively constrain mid-level to low-level circulations, particularly enhancing convergence near convective triggering regions.
The joint assimilation experiments, DA_JOINT1 (Figure 8c,g) and DA_JOINT2 (Figure 8d,h), exhibit stronger spatial continuity and larger increment amplitudes compared with single-source assimilation. Extensive convergence zones are produced near the convective line, with pronounced 700 hPa banded increments, indicating more organized inflow structures. Differences in assimilation sequence are apparent: DA_JOINT1 tends to form more localized convergence centers, whereas DA_JOINT2 generates both strong local convergence centers and continuous adjustments over a broader spatial domain. Overall, joint assimilation enhances low-level convergence and improves wind consistency both horizontally and vertically.
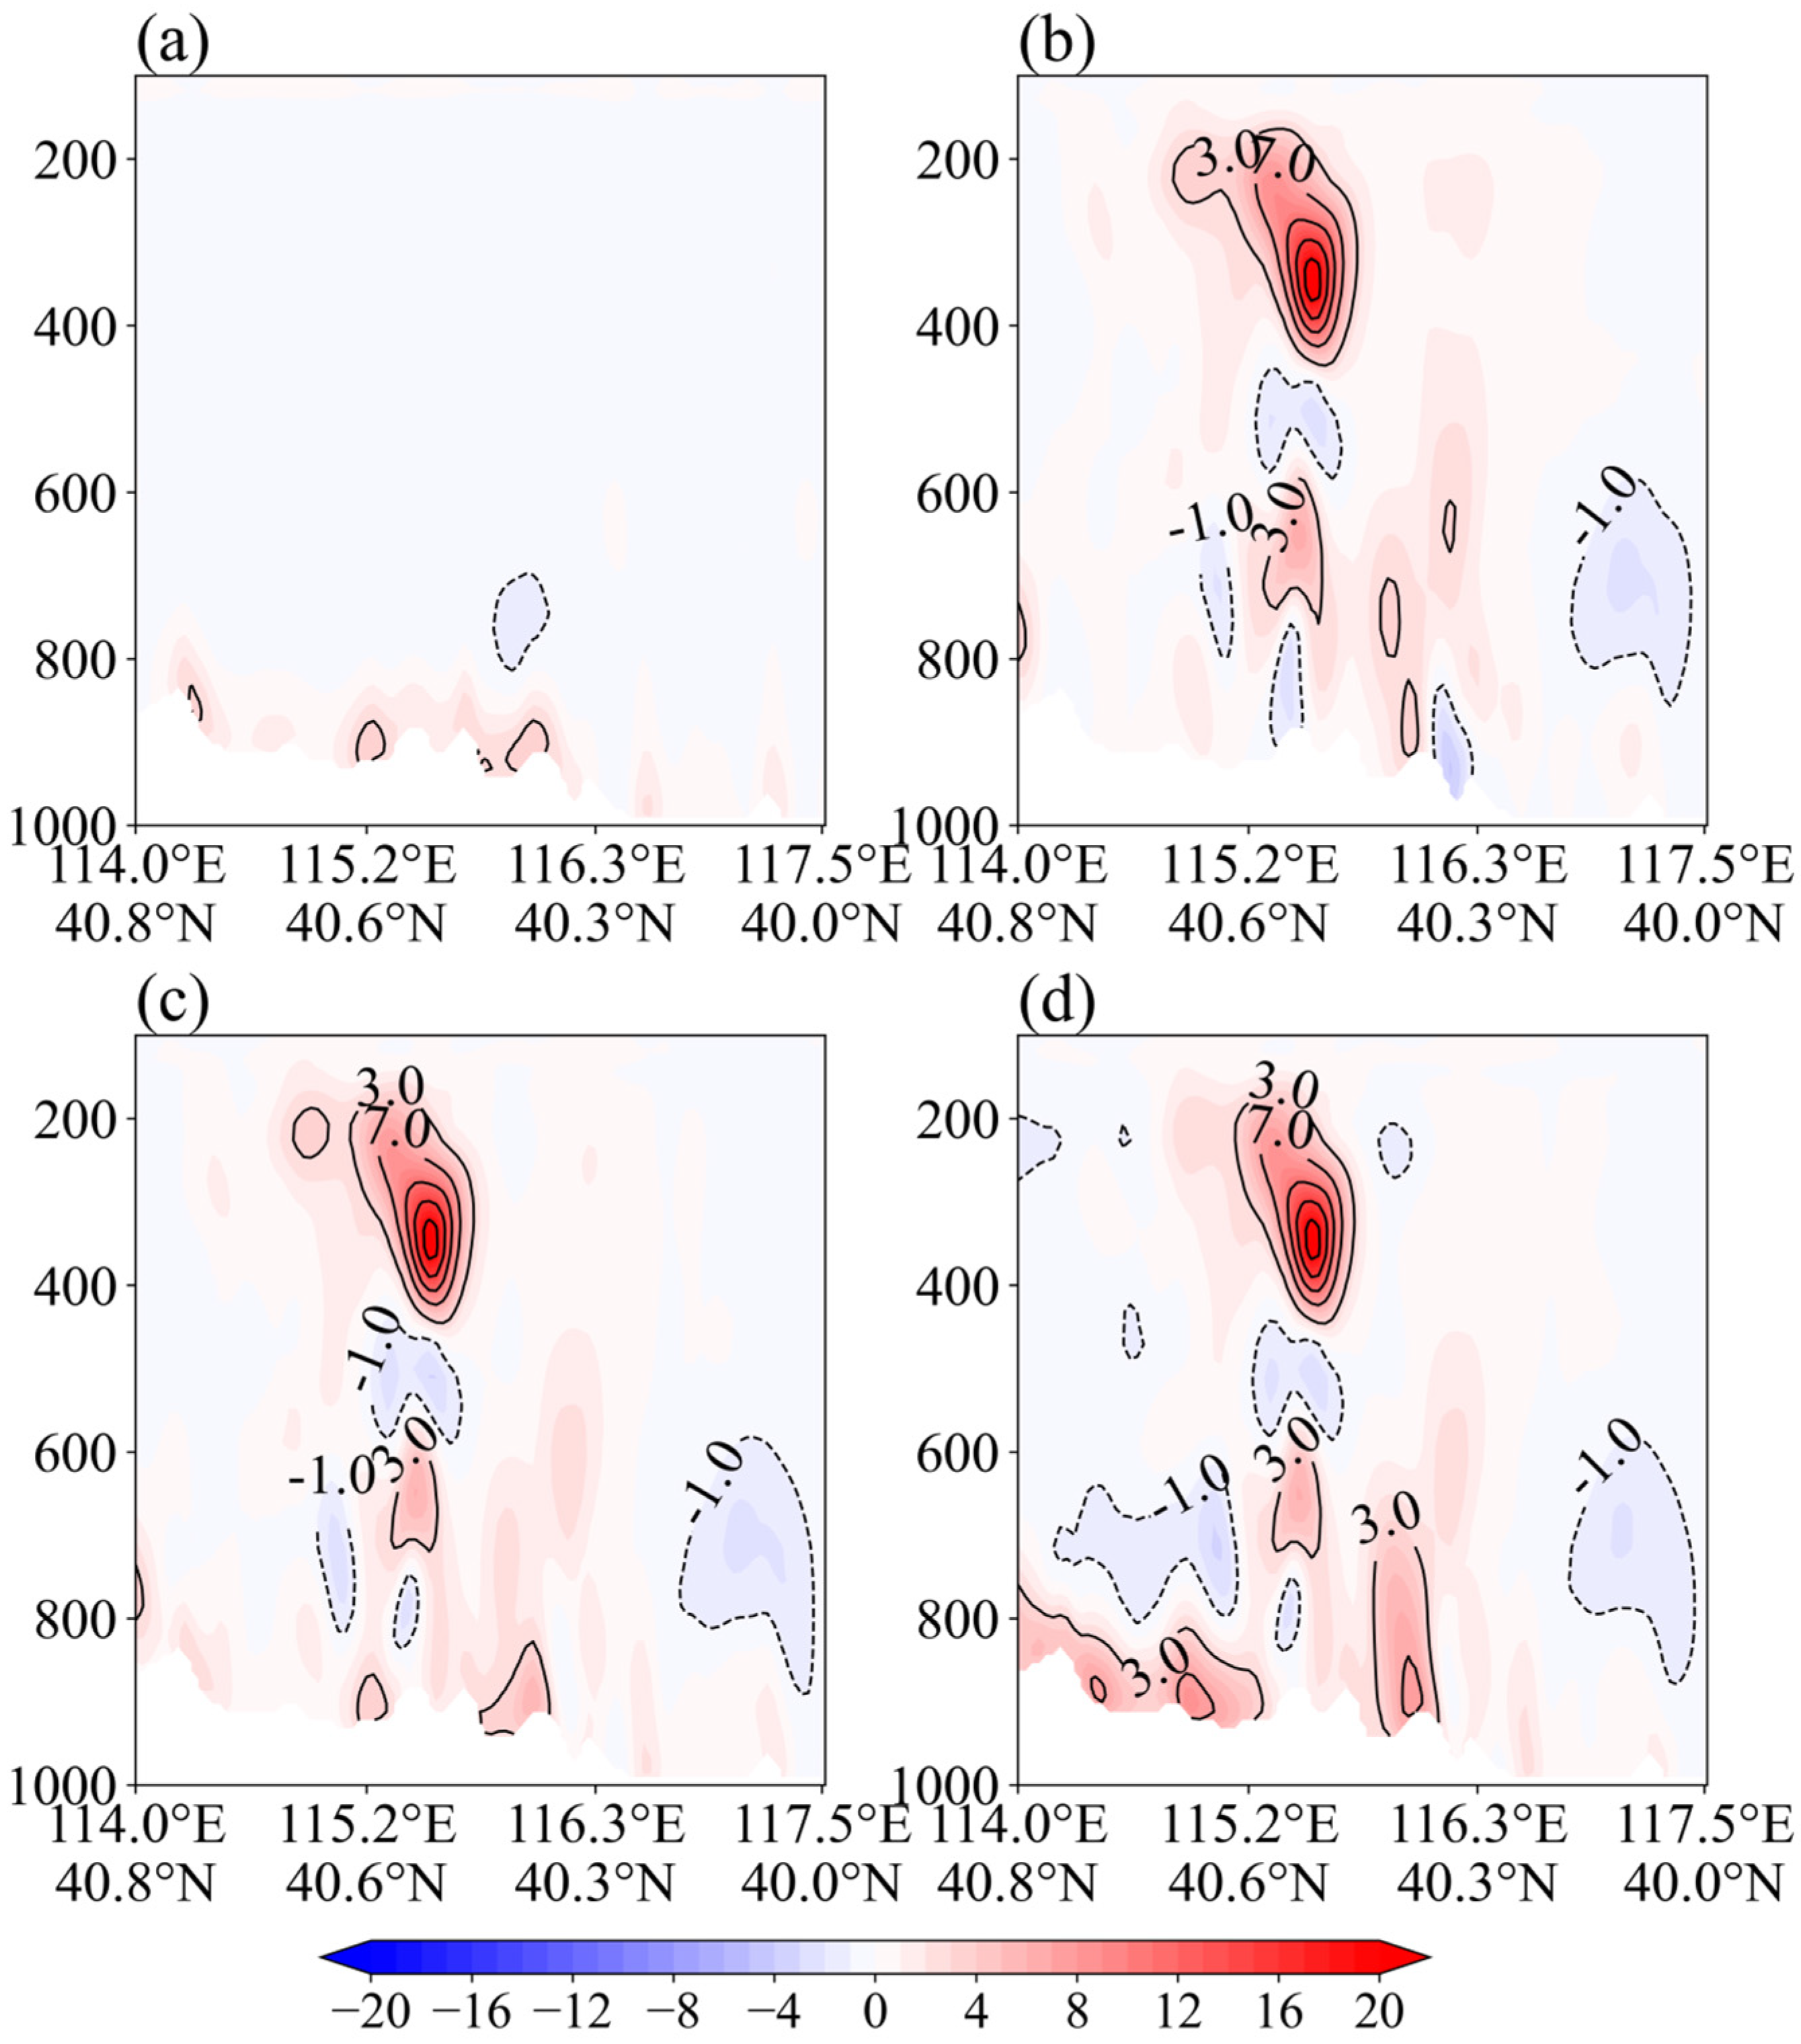
Figure 9 further illustrates vertical cross-sectional structures along the convective line, providing a more detailed view of how different assimilation strategies influence mid- to low-level circulations and vertical coupling. In DA_AWS (Figure 9a), increments are confined near the surface (900–1000 hPa), weak in magnitude, and fail to form continuous upward motions. DA_RA1 (Figure 9b) produces strong positive increments between 400 and 600 hPa, peaking above 7 m/s, accompanied by underlying negative increments, forming a typical tangential or radial wind adjustment pattern within convective updraft regions. This “positive aloft, negative below” distribution highlights the advantage of radar observations in representing mid-level inflow and low-level outflow. DA_JOINT1 (Figure 9c) generates a broader positive increment band between 200 and 500 hPa, with a reduced negative increment region, indicating that joint assimilation strengthens mid-level inflow while suppressing imbalanced noise, producing physically more consistent increments. DA_JOINT2 (Figure 9d) exhibits a similar pattern, but the positive increments extend deeper into lower levels with stronger low-level convergence signals, suggesting that this assimilation sequence better reinforces wind adjustments associated with cold pools and convective initiation zones.
The assimilation sequence of DA_JOINT2 establishes a balanced boundary-layer environment by correcting near-surface wind fields. This adjustment enhances low-level convergence, which in turn support the development and maintenance of convective updrafts, providing a physically consistent basis for the observed superiority of this assimilation order over the assimilation sequences of DA_JOINT1.
In summary, Figure 8 and Figure 9 indicate that: (1) assimilation of surface AWS observations alone is insufficient to substantially adjust convective-scale circulations; (2) assimilation of radar observations alone produces stronger, localized mid-level structures but with some spatial difference; and (3) joint assimilation provides clear advantages in horizontal continuity and vertical consistency, enhancing low-level convergence and mid-level inflow to better represent the convective dynamics of squall lines. Furthermore, the assimilation sequence influences the increment distribution: assimilating radar first followed by AWS (DA_JOINT1) emphasizes mid-level inflow, whereas assimilating AWS first followed by radar (DA_JOINT2) emphasizes low-level convergence. This demonstrates that the order of assimilation can affect the analysis and potentially influence subsequent forecasts of convective evolution. Assimilating radar first embeds convective-scale details into the initial field, but without a balanced surface thermal and large-scale environmental background, these adjustments may be unstable and decay rapidly. Conversely, assimilating AWS first effectively corrects near-surface temperature, moisture, and winds, establishing a more balanced environmental background, upon which radar observations can embed convective-scale perturbations, maintaining persistent and physically consistent convective structures.

4.2.2. Forecast Results

Figure 10 shows the horizontal distributions of observed radar composite reflectivity and simulations from five experiments (CTRL, DA_AWS, DA_RA1, DA_JOINT1, and DA_JOINT2). In the CTRL experiment (Figure 10b), most regions exhibit moderate reflectivity, with widespread light-blue to green areas and few high-reflectivity patches, indicating that the control run underestimates localized strong convection and inadequately represents its spatial structure. DA_AWS (Figure 10c) produces yellow-to-orange patches in some areas, suggesting that assimilation of AWS data enhances weak-to-moderate convective regions, though coverage remains limited. DA_RA1 (Figure 10d) generates distinct red high-reflectivity patches in localized areas, demonstrating that radar assimilation effectively intensifies strong convective cores, although some weak-convection regions still differ from observations.
For joint assimilation, DA_JOINT1 (Figure 10e), in which radar is assimilated before AWS, exhibits increased reflectivity across multiple regions, with yellow-to-orange areas expanding and some approaching red, indicating that combined radar and AWS assimilation improves horizontal convective structures. DA_JOINT2 (Figure 10f), with AWS assimilated first followed by radar, produces the highest reflectivity, with large red areas covering key locations, most effectively reproducing strong convective cores. Mechanistically, in DA_JOINT2, low-level winds and boundary-layer conditions are first optimized through AWS assimilation, adjusting cold-pool structures, followed by radar assimilation to constrain the spatial location and intensity of strong convective cores, resulting in optimal high-reflectivity representation. In comparison, DA_JOINT1 captures the core through initial radar assimilation, but subsequent AWS assimilation provides limited adjustment in high-reflectivity regions, yielding slightly lower values than DA_JOINT2.
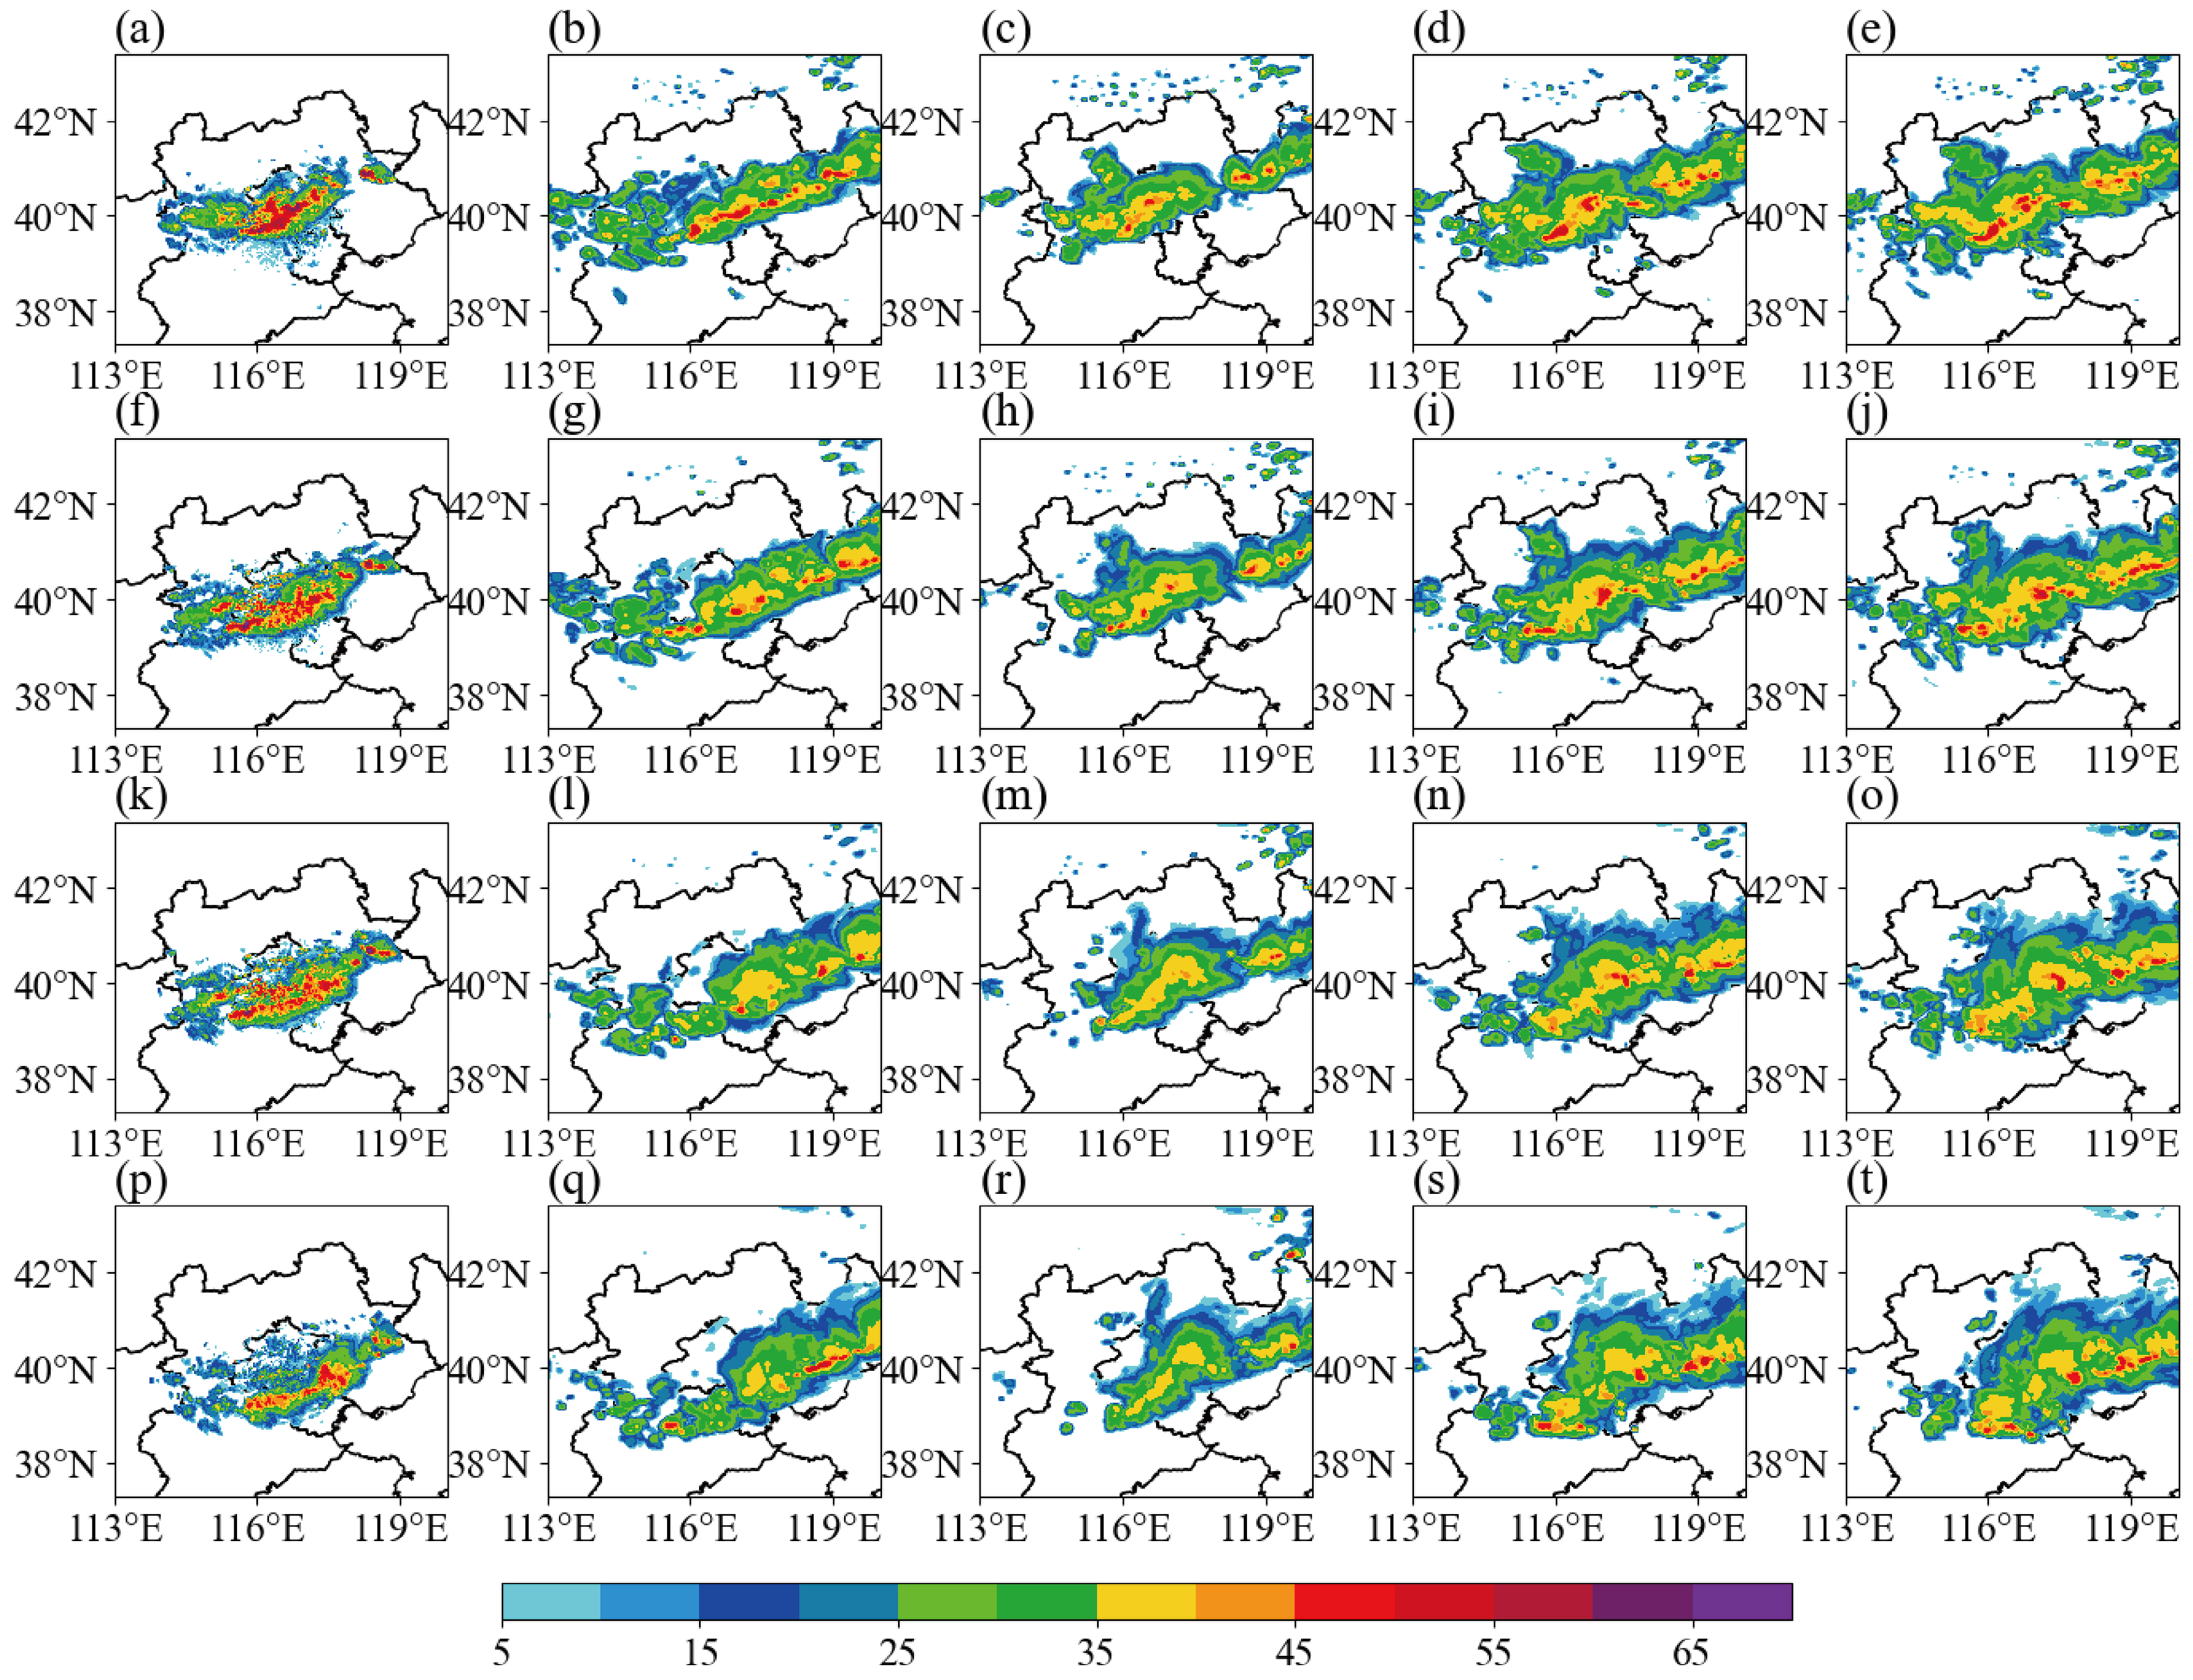
Figure 11 displays the observed radar reflectivity alongside the composite reflectivity fields derived from four data assimilation experiments, spanning four distinct time intervals on 30 May 2024. At 07:00 UTC, all assimilation experiments are able to reproduce the convective band seen in the observations. DA_AWS reconstructs the weaker and moderate reflectivity regions but underestimates the strength and coverage of the high-reflectivity core. Noticeably stronger reflectivity is produced in DA_RA1 in the convective centers, with red regions appearing more concentrated than in DA_AWS. The joint assimilation experiments perform more favorably: DA_JOINT1 captures the structure of the main convective axis with better fidelity, whereas DA_JOINT2 produces high-reflectivity areas that are closer to the observations and exhibit slightly stronger and more spatially coherent patterns. By 07:30 UTC, all simulations display some degree of weakening, but the primary convective band remains recognizable. The convective core in DA_AWS becomes fragmented, while DA_RA1 still maintains localized high reflectivity despite a reduced extent. The advantages of joint assimilation remain evident, particularly for DA_JOINT2, which preserves a more continuous high-reflectivity region and reproduces patchy high-value structures similar to the observations, indicating better retention of convective organization. At 08:00 UTC, forecast errors accumulate and the reflectivity weakens substantially in all experiments compared with earlier times. Even so, the joint assimilation results remain superior to those from the single-dataset experiments. DA_JOINT2 shows less degradation in intensity than DA_JOINT1, and its reflectivity pattern remains more consistent with the observed structure. By 08:30 UTC (bottom row), the overall forecast quality has degraded further, with reflectivity fields becoming more dispersed in all experiments. DA_AWS can no longer maintain a coherent convective pattern, while DA_RA1 retains some localized strong echoes but with scattered spatial distribution. In contrast, both DA_JOINT1 and DA_JOINT2 continue to preserve the linear convective structure in key regions. DA_JOINT2 produces a more continuous and less degraded reflectivity field, again outperforming DA_JOINT1.
Overall, as the forecast advances from 07:00 to 08:30 UTC, all experiments exhibit a progressive loss of skill in their ability to reproduce the location and intensity of the primary precipitation band, although the core convective structures remain captured to varying degrees. Differences among the assimilation approaches also become increasingly evident over time. The two joint assimilation experiments (DA_JOINT1 and DA_JOINT2) consistently exhibit superior performance in retaining the spatial organization and intensity of the convective system, with DA_JOINT2 providing the best results.
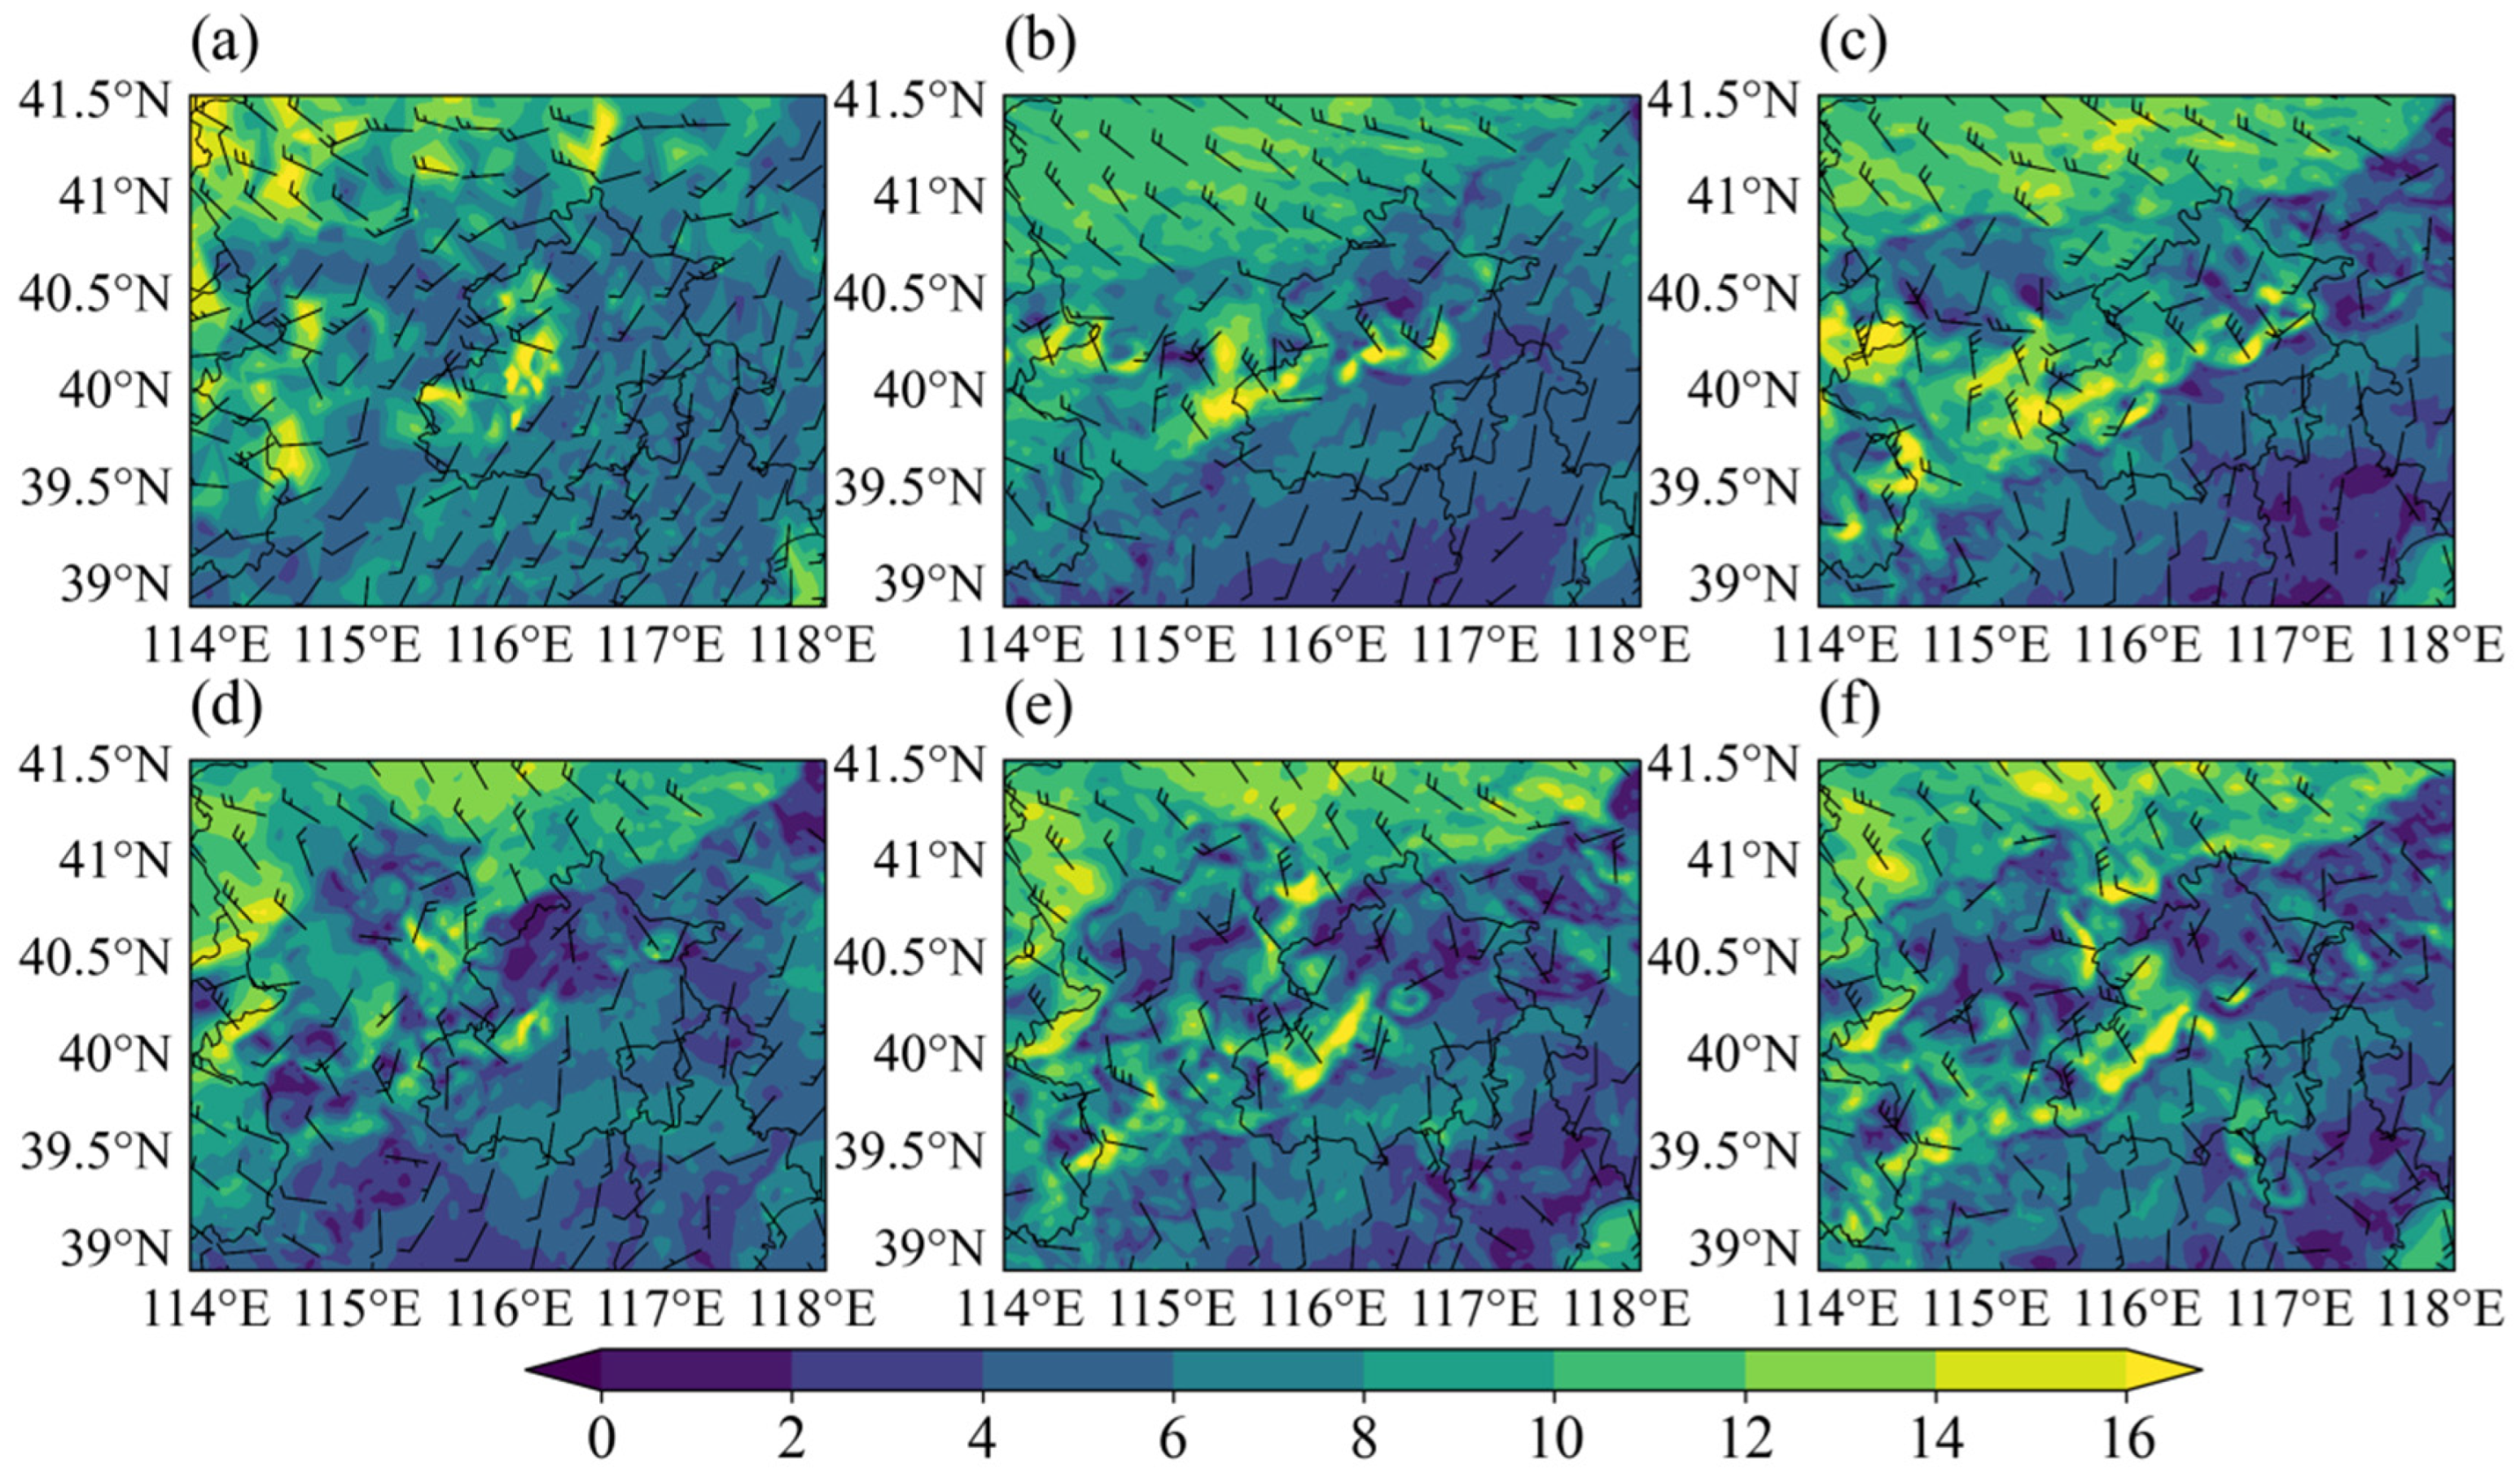
Figure 12 presents the 10 m winds. In CTRL (Figure 12b), wind speeds are moderate and uniform, with short, smooth vectors and few high-wind areas, consistent with low-reflectivity regions. DA_AWS (Figure 12c) enhances wind speeds in localized regions, with more green patches and longer, denser vectors, reflecting improvements in low-level winds via AWS assimilation. DA_RA1 (Figure 12d) strengthens localized high-wind areas, with dark-green patches coinciding with high-reflectivity regions, demonstrating the ability of radar assimilation to capture convective strong winds. In joint assimilation, DA_JOINT1 (Figure 12e) exhibits widespread high-wind regions, whereas DA_JOINT2 (Figure 12f) achieves the largest coverage and highest wind speeds, particularly near strong convective cores, with dense and elongated vectors, indicating optimal coupling between low-level winds and convective structures.
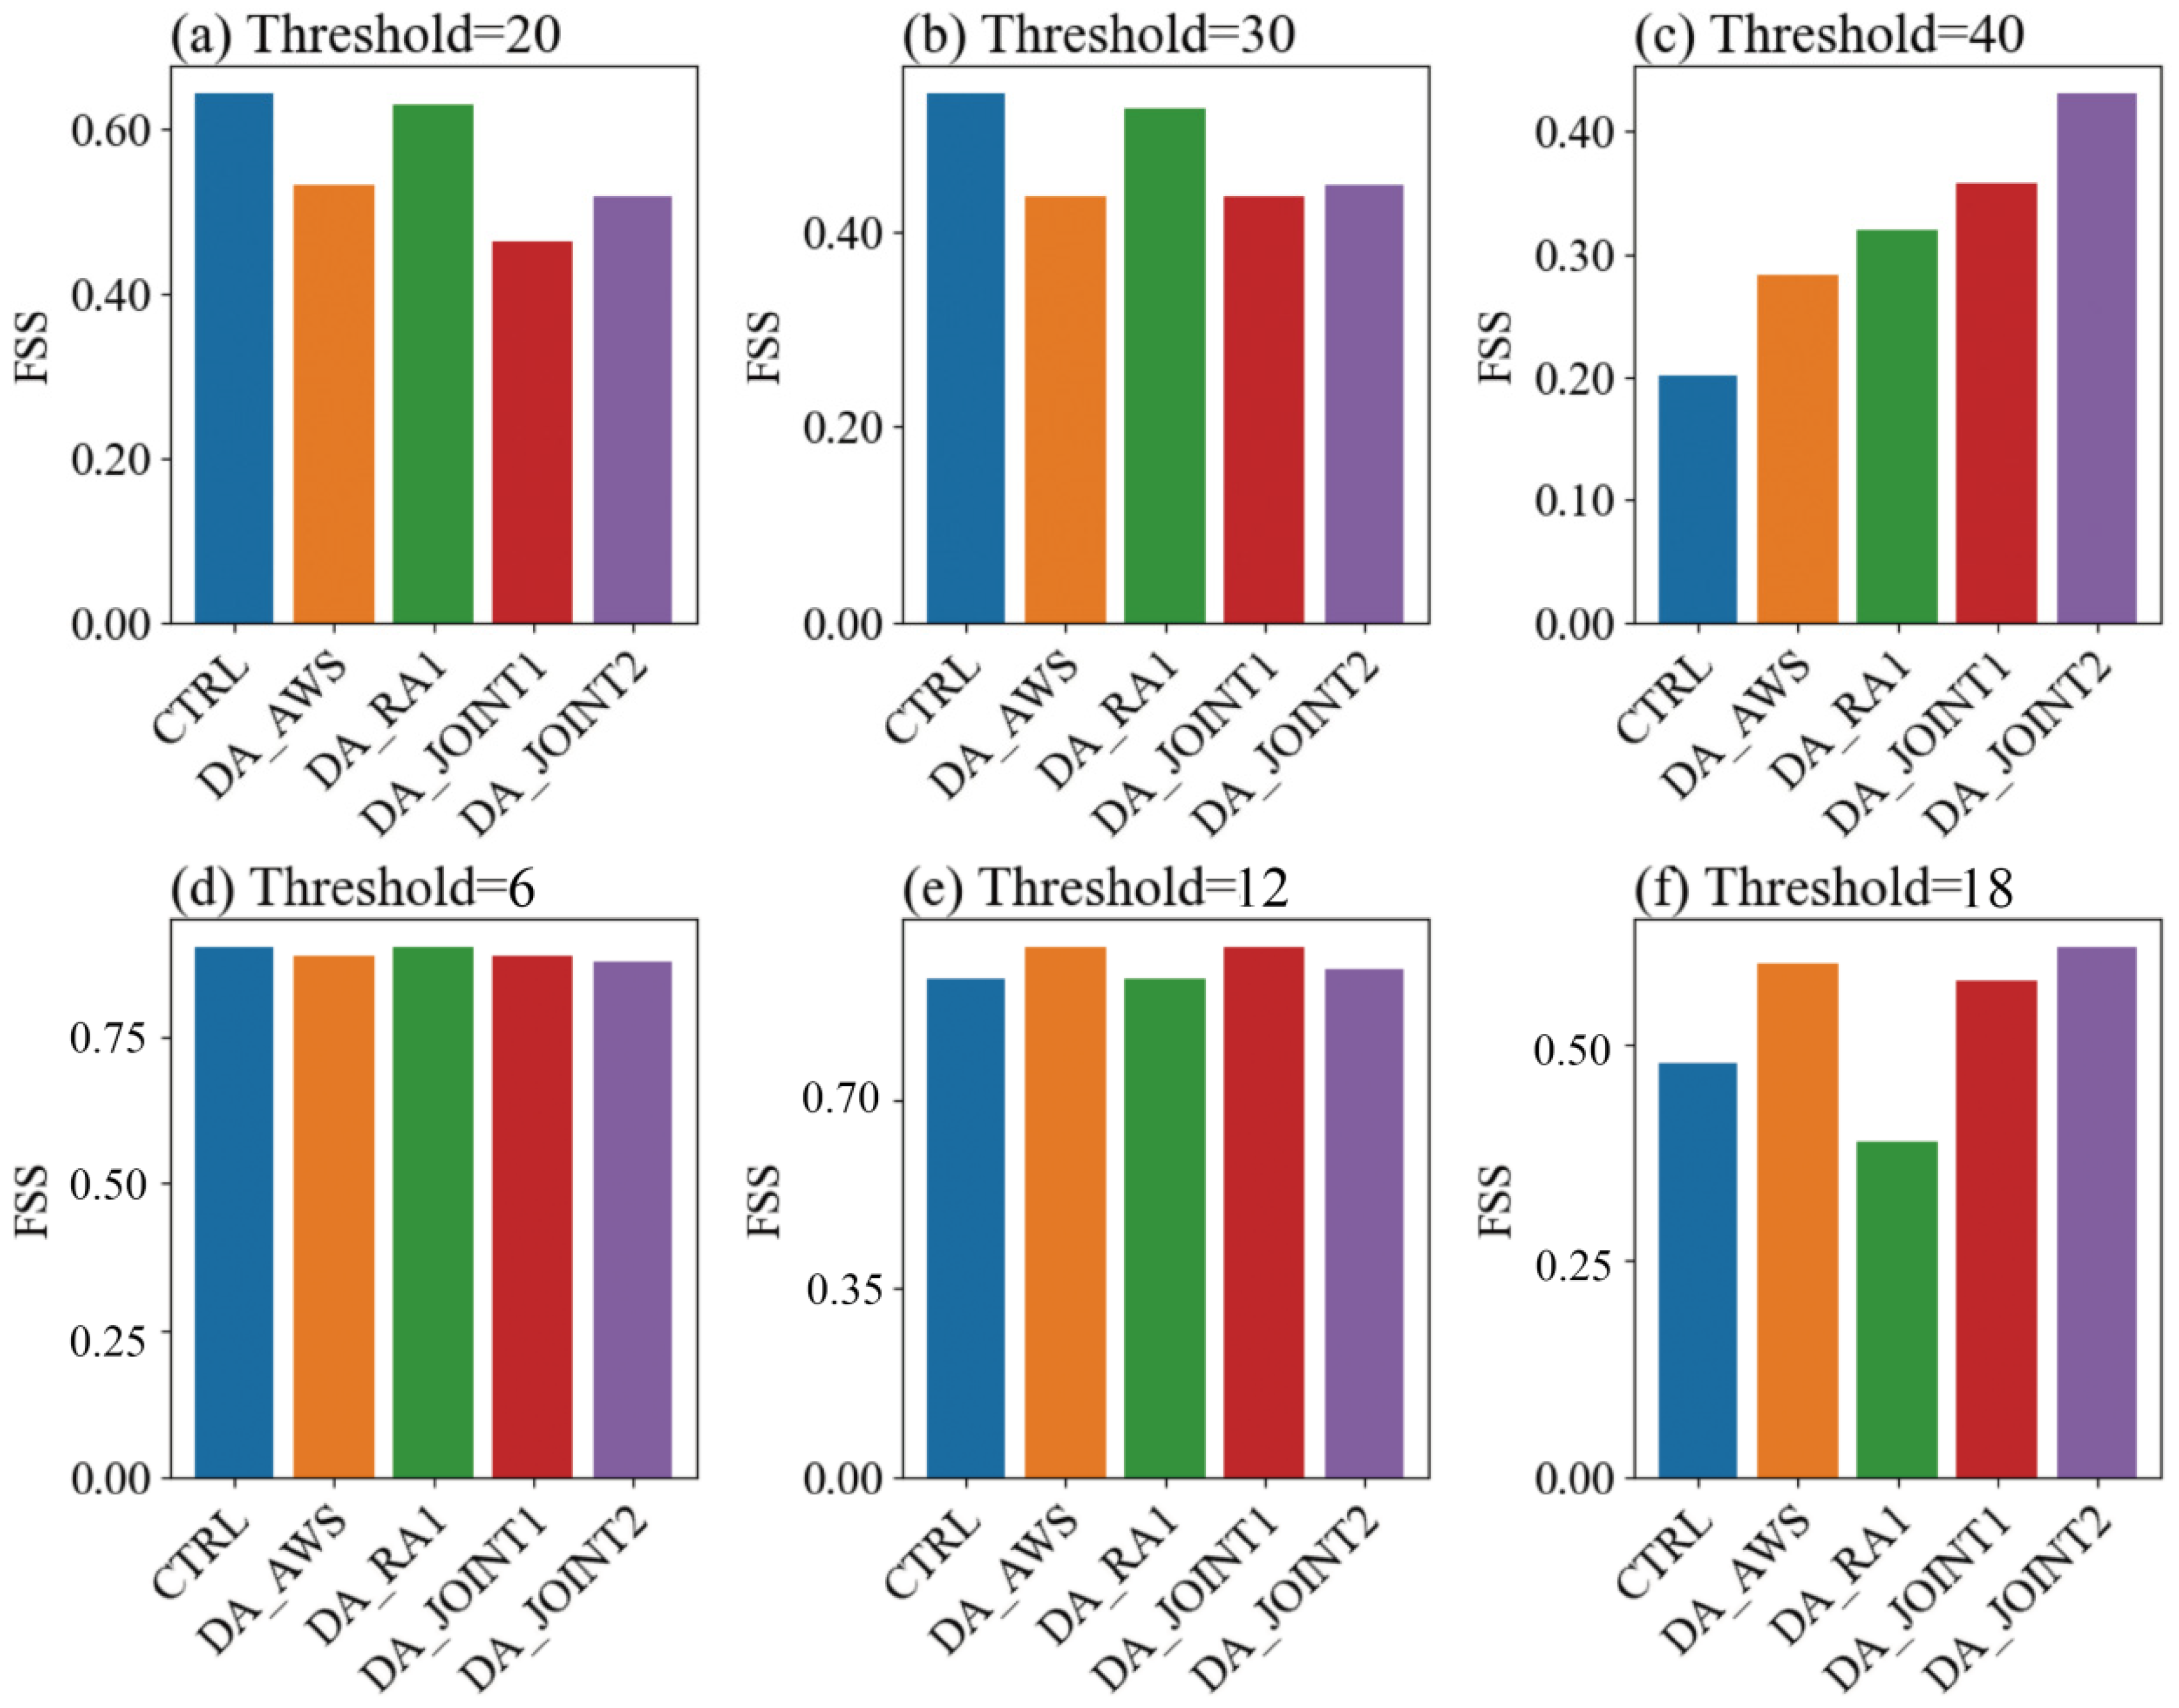
Figure 13 quantitatively evaluates forecast skill for reflectivity and wind speed using the Fractions Skill Score (FSS). For composite reflectivity at 20 dBZ, CTRL and DA_RA1 perform well under weak convection, while DA_AWS and DA_JOINT2 are slightly lower, and DA_JOINT1 slightly worse. At 30 dBZ, a similar trend persists, showing the dominant role of radar data in reproducing moderate convection. At the high 40 dBZ threshold, only DA_JOINT2 exceeds 0.4, substantially outperforming other experiments, indicating the best representation of strong convective cores. Mechanistically, AWS-first assimilation optimizes low-level winds and boundary-layer states, followed by radar assimilation to constrain strong convective cores, improving FSS at high thresholds.
For wind FSS, similar patterns are observed. At the low 6 m/s threshold, all experiments score above 0.8, indicating good reproduction of low-wind areas. At 12 m/s, DA_AWS and DA_JOINT1 slightly outperform DA_JOINT2, whereas DA_RA1 and CTRL show weaker performance, highlighting the effect of AWS assimilation on low-level winds under moderate conditions. At 18 m/s, DA_JOINT2 achieves the highest scores, particularly in gusts near the squall line, as AWS-first assimilation establishes an optimized low-level wind background for subsequent radar assimilation to capture strong convective cores and associated high winds, ensuring consistency with observations and maximizing FSS under high-wind conditions.
In summary, assimilation of AWS or radar alone improves moderate convection and winds locally but remains limited in strong convective cores and high-wind regions. Joint assimilation integrates the advantages of both datasets. DA_JOINT2, with AWS-first sequencing, maximizes radar constraints on strong convection while optimizing low-level winds, aligning high-reflectivity and high-wind regions with observations. Comparison between DA_JOINT1 and DA_JOINT2 indicates that although radar assimilation can directly capture convective updrafts, a biased environmental background may reduce the effectiveness of strong convective signals. AWS-first assimilation corrects large-scale temperature, moisture, and low-level winds, establishing a balanced boundary-layer environment, upon which radar assimilation embeds convective-scale perturbations, substantially enhancing the simulation of the convective system.
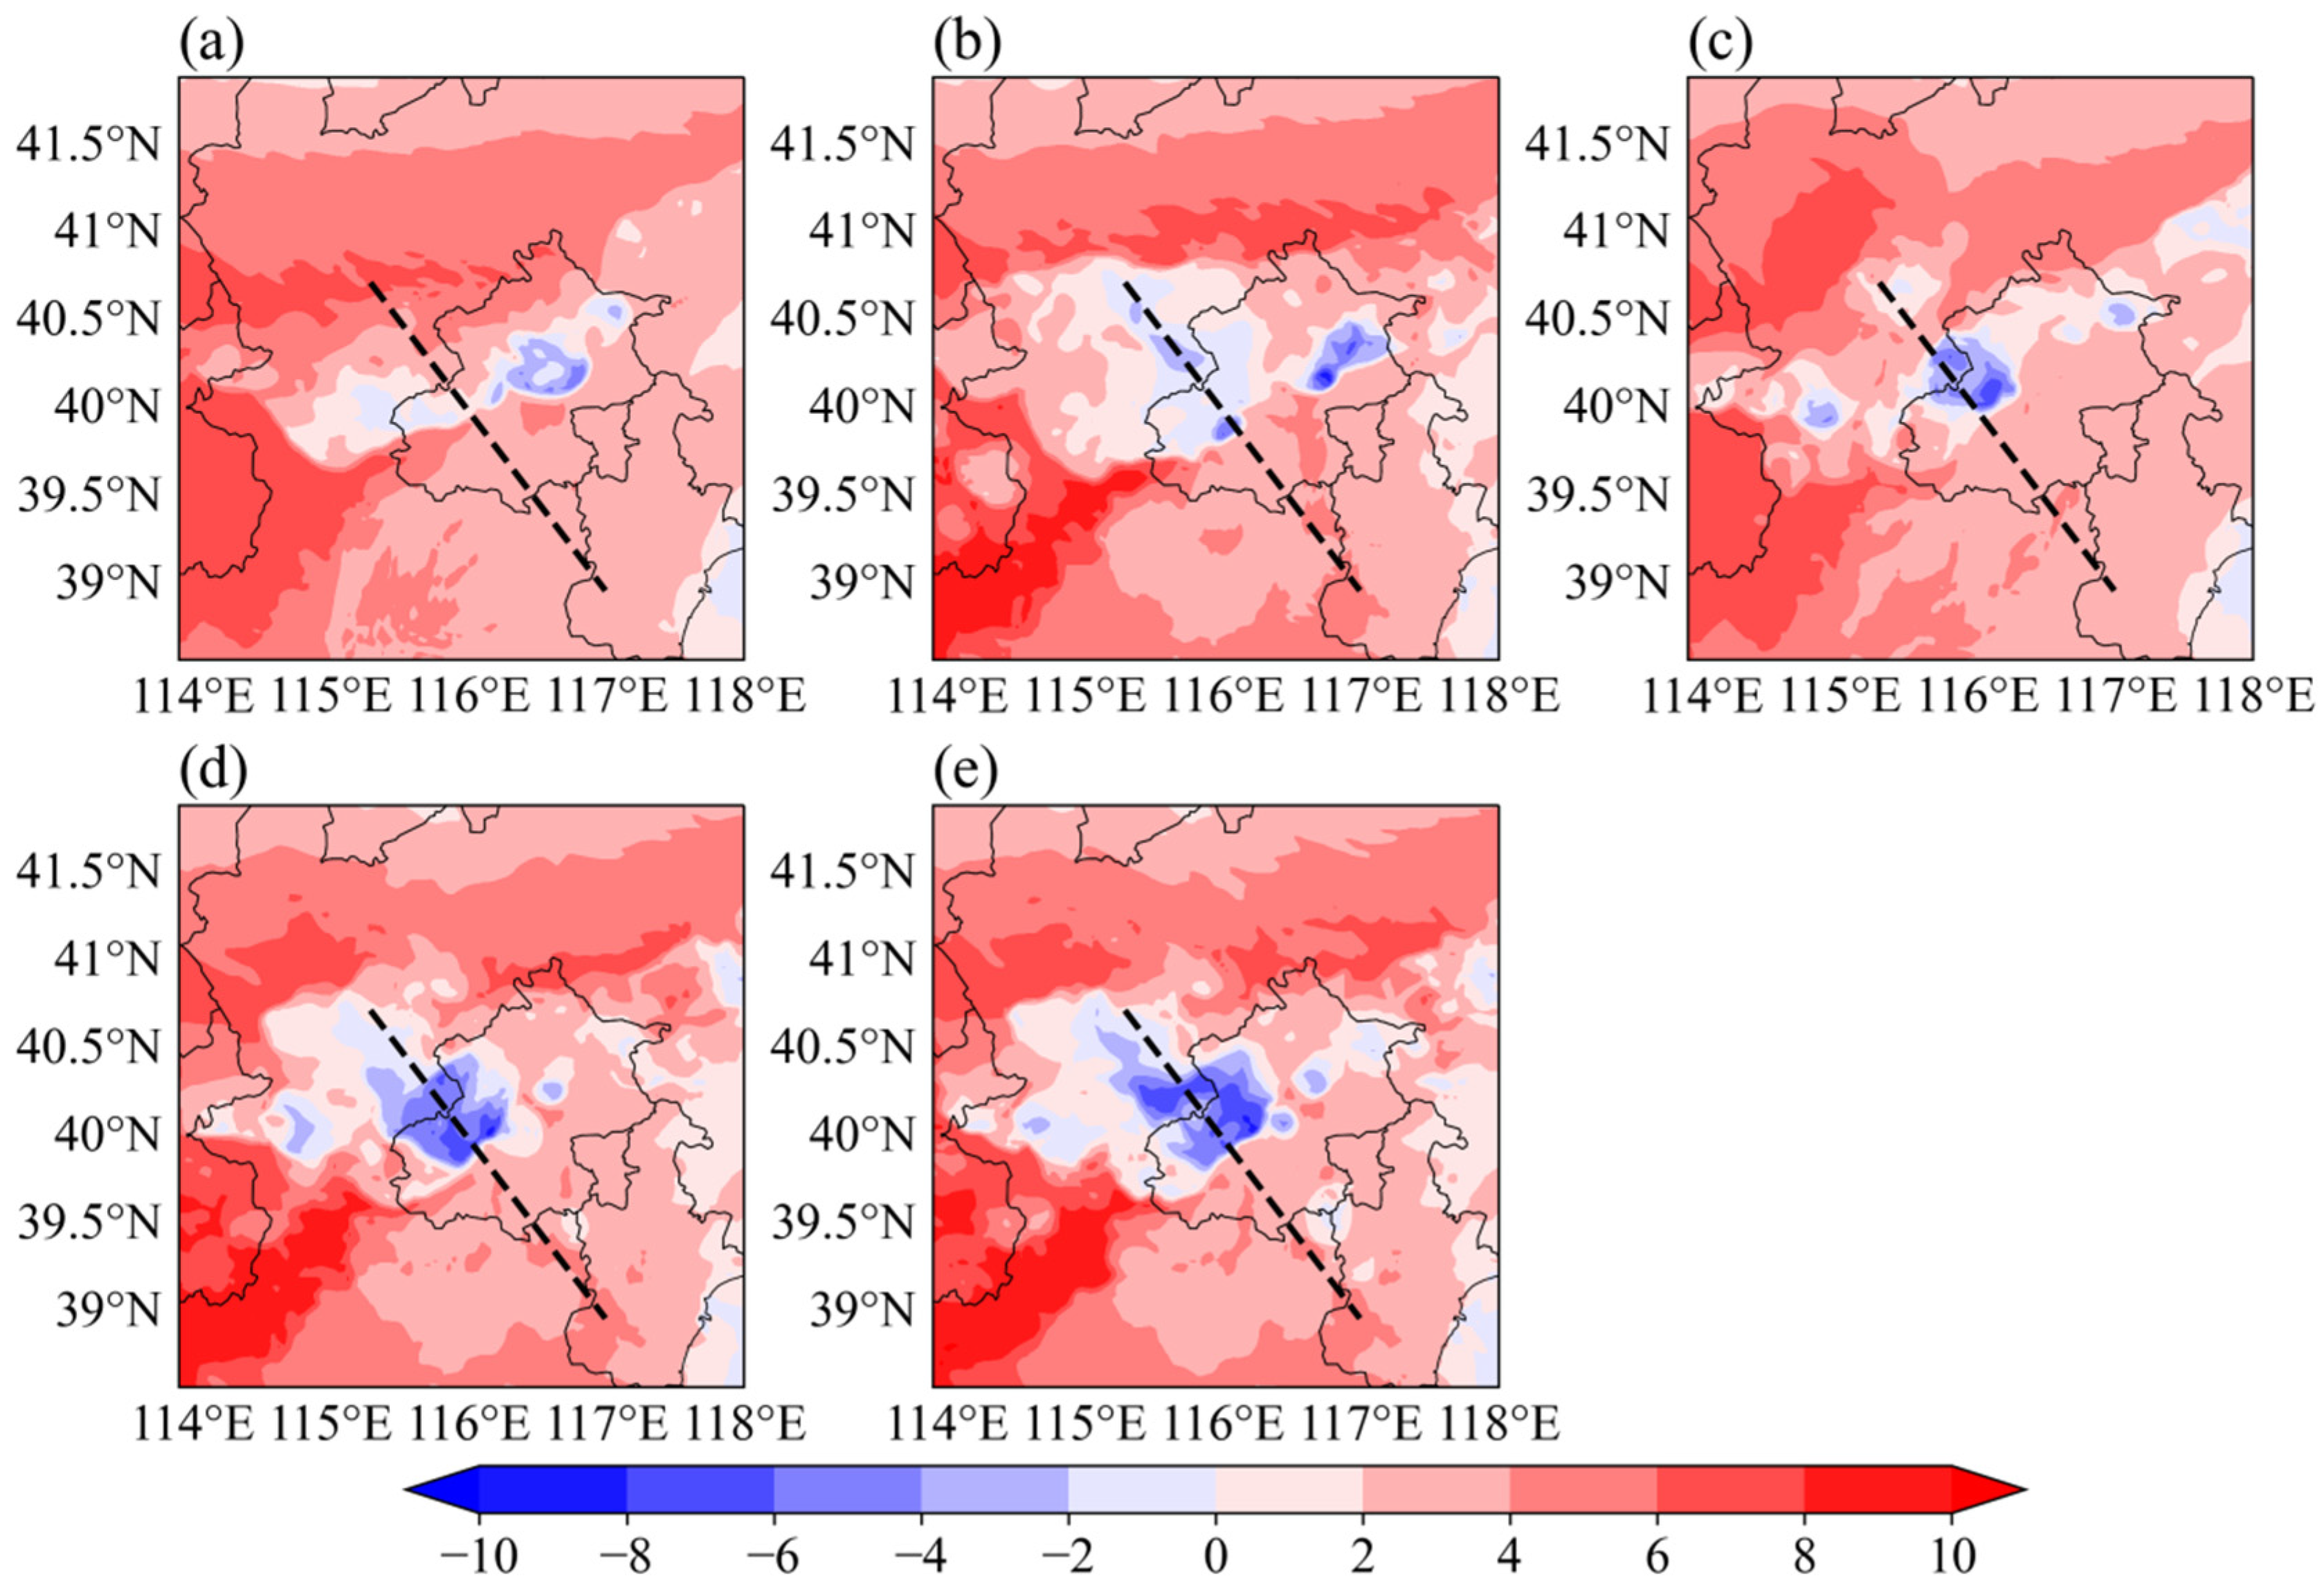
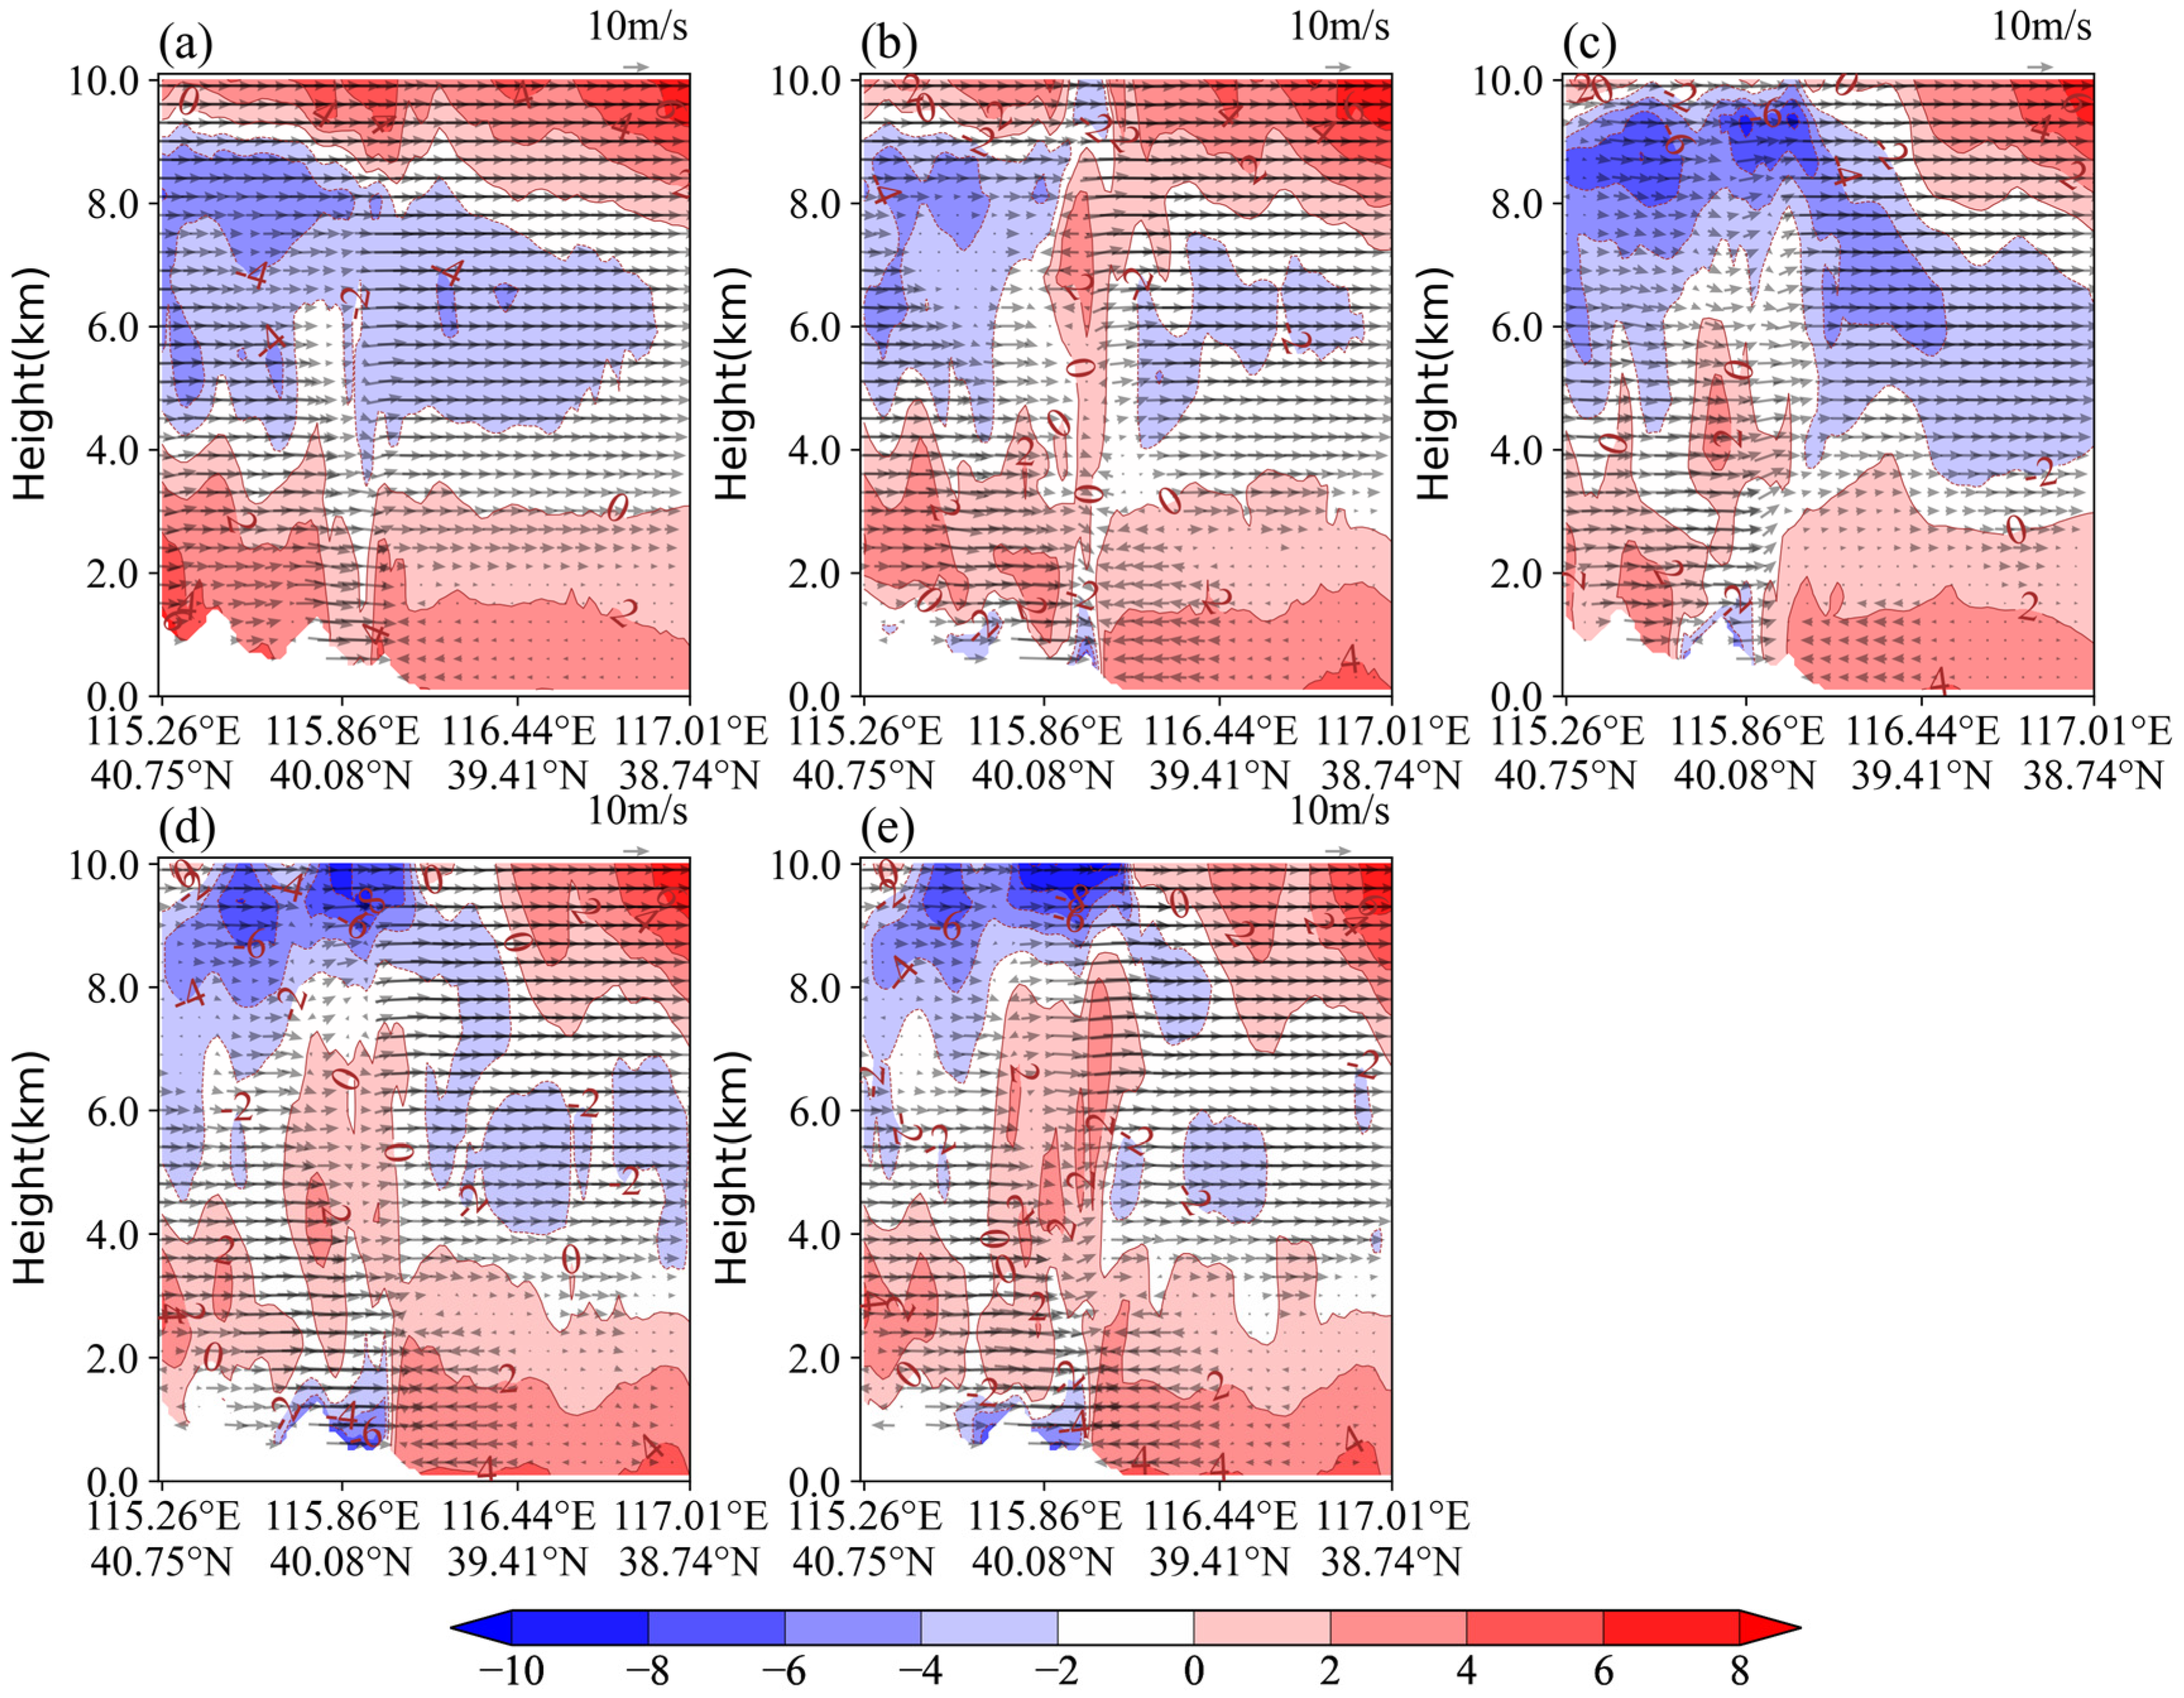
Figure 14 and Figure 15 show surface potential temperature perturbations and vertical cross-sectional structures for five assimilation experiments, emphasizing differences in cold-pool development and vertical circulation.
At the surface level, the CTRL experiment (Figure 14a) presents moderate negative temperature perturbations, with maximum cooling of approximately −3 K over central and western Beijing. The cold-pool signature is weak, and negative perturbation areas are limited, indicating that simulations without observational assimilation fail to adequately reproduce boundary-layer disturbances and cold-pool formation. In DA_AWS (Figure 14b), the negative perturbation area is expanded and intensity increases locally to −6 K, particularly over central and western Beijing, demonstrating that AWS assimilation improves low-level boundary-layer temperature structures and partially strengthens cold-pool formation, although impacts on convective cores remain limited. DA_RA1 (Figure 14c) further enlarges the negative perturbation region, producing strong local cooling (−6 K) in central and western areas, reflecting the ability of radar assimilation to capture localized intensification of convective cold pools, but overall spatial coverage remains smaller than that achieved with joint assimilation.
Joint assimilation experiments show clear improvements. DA_JOINT1 (Figure 14d), with radar assimilated first followed by AWS, produces extensive negative perturbations (−6 K) across central and southwestern Beijing, indicating that radar constraints on convective cores are effectively combined with AWS-driven optimization of low-level winds and boundary-layer temperature. DA_JOINT2 (Figure 14e), with AWS assimilated first followed by radar, slightly exceeds DA_JOINT1 in both coverage and intensity, extending cold-pool influence farther southwest. By first adjusting low-level boundary-layer states through AWS assimilation and then embedding radar-constrained convective cores, DA_JOINT2 generates surface temperature perturbations that are more consistent with observations, providing physically balanced initial conditions for strong convection.
Vertical cross-sections (Figure 15) further illustrate impacts on vertical circulations. In CTRL (Figure 15a), near-surface cold eddies and vertical wind vectors are weak, indicating that squall-line vertical motion and updrafts are poorly represented without assimilation. DA_AWS (Figure 15b) produces small near-surface cold eddies (−2 K) and modest vertical wind enhancement, slightly improving low-level cold pools and updrafts. DA_RA1 (Figure 15c) generates localized cold eddies (−2 K) with moderately enhanced vertical motion, demonstrating that radar assimilation improves mid-level inflow, although vertical extent remains limited.
Joint assimilation markedly enhances vertical structures. DA_JOINT1 (Figure 15d) exhibits extensive cold eddies from the surface to 2 km (−6 K) with strong updrafts and coherent circulation within convective cores. DA_JOINT2 (Figure 15e) further improves vertical representation, with cold-pool coverage extending above 2 km, intensified vertical winds, and well-organized, continuous circulation. AWS-first assimilation establishes a balanced low-level boundary-layer temperature and wind environment, providing a suitable background for subsequent radar assimilation to accurately reproduce strong convective updrafts and cold-pool structures. In contrast, DA_JOINT1, with radar assimilated first, captures convective cores, but subsequent AWS assimilation provides limited refinement of low-level cold pools and vertical circulation, resulting in slightly weaker vertical structures.
The differences among the experiments also influence the dynamic coordination between convective updrafts and the surrounding environment. In DA_JOINT2, stronger and more continuous vertical circulations are established, which facilitate more efficient interactions between the updrafts and the ambient flow. As a result, ascending air is enabled to draw momentum and moisture from a broader low-level inflow region, supporting the maintenance and organization of the squall-line convection. In contrast, weaker coupling is observed in DA_JOINT1, where the less-developed low-level circulation constrains the exchange between updrafts and environmental inflows, leading to fragmented convective structures and reduced vertical coherence.
Combined analyses of horizontal fields and vertical cross-sections indicate that joint assimilation substantially improves cold-pool strength, low-level wind structures, and updrafts. Consistent with horizontal reflectivity and wind results shown in Figure 10, Figure 11 and Figure 12, DA_JOINT2 outperforms DA_JOINT1 and single-source assimilation experiments in terms of surface potential temperature perturbations and cold-pool intensity and extent, while its vertical winds and circulation structures are the most complete, enabling a more accurate reproduction of strong updrafts and high-wind regions associated with the squall line. These results demonstrate that assimilating AWS observations prior to radar data plays a critical role in optimizing low-level boundary-layer states and enhancing cold-pool development and updrafts, thereby improving simulation fidelity in both horizontal and vertical structures.

5. Discussion

This study focuses on an organized squall line, and the proposed AWS-first assimilation strategy is expected to be beneficial for other convective regimes as well. Its applicability to more disorganized or short-lived systems, such as isolated or multi-cell convection, will be further investigated in future work. Although combined assimilation of AWS and S-band radar observations has significantly improved both analysis and forecast, future research will also consider the application of other radar bands, such as X-band radar. Additionally, while radar spatial truncation has been used to reduce false echoes, the relationship between specific truncation distances and false echo occurrence requires further investigation. For the next stage of research, we plan to select cases with longer-lasting phenomena, such as persistent precipitation events, to further investigate the extended forecast performance of data assimilation. Furthermore, it is worth noting that other choice of control variables should also be considered in the future; for example, with the use of vertical velocity, vorticity, or divergence to further improve the representation of convergence zones in convective systems

6. Conclusions

Accurate forecasting of squall lines and severe wind events relies critically on multi-source observations and diverse assimilation strategies. Using the WRF-3DVar system, this study examined a squall-line case that occurred on the afternoon of 30 May 2024 over complex terrain in China, focusing on the individual assimilation of radar observations and the combined assimilation of AWS and radar data. The primary goal was to reveal the key role of joint AWS-radar assimilation in enhancing the analysis and forecast performance of squall-line systems.
Regarding the use of truncated radar observations, DA_RA4 exhibited superior spatial realism compared with DA_RA4_woTrc, particularly in avoiding false echoes. Although the truncated observations constituted a relatively small fraction of the total data, they were sufficient to provide critical constraints on observation utilization and error control, thereby improving the reproduction of convective system spatial structures. Concerning the choice of variance and correlation length scales, increasing the assimilation scale enhanced reflectivity intensity but also amplified false signals and positional errors. Among the experiments, DA_RA1 achieved a balanced representation of intensity and spatial distribution and performed best in both TS and FSS, making it the most reasonable configuration for capturing this convective event.
The most significant findings concern the effects of joint assimilation and the impact of assimilation sequence. Assimilation of AWS data alone was insufficient to substantially correct convective-scale circulation, while radar-only assimilation could generate strong localized structures in the mid-levels but lacked constraints on low-level thermodynamic and environmental fields, often leading to imbalanced analyses that decayed rapidly during model integration. In contrast, joint assimilation demonstrated clear advantages in both spatial continuity and vertical consistency, strengthening low-level convergence and enhancing mid-level inflow to better capture the dynamical characteristics of squall-line convection.
Among the joint assimilation experiments, DA_JOINT1 (radar first, then AWS) primarily emphasized mid-level inflow correction, whereas DA_JOINT2 (AWS first, then radar) optimized low-level temperature, moisture, and winds to establish a more balanced thermodynamic and dynamical background. This sequence allowed subsequent radar-constrained convective signals to be embedded and maintained in a balanced environment. Consequently, DA_JOINT2 outperformed all other schemes in terms of surface potential temperature perturbations, cold-pool intensity and extent, and vertical wind and circulation structures, more accurately reproducing the strong updrafts and high-wind regions associated with the squall line. These results demonstrate that assimilating AWS observations prior to radar not only optimizes low-level boundary-layer conditions but also enhances the coupling between cold pools and updrafts, improving simulation fidelity in both horizontal and vertical structures, and providing valuable guidance for operational forecasting of severe convective systems.

Author Contributions

Conceptualization, R.Z.; writing—original draft, R.Z. and C.L.; writing—review and editing, D.X. and C.L.; formal analysis; Z.H. and D.X.; data curation, R.Z. and Z.H. All authors have read and agreed to the published version of the manuscript.

Funding

This research was primarily supported by National Key Research and Development Program of China (2024YFC2815702), the National Natural Science Foundation of China (42475157), Special Project for Innovation and Development of China Meteorological Administration (CXFZ2025J116), General Program of Jiangsu Meteorological Bureau (KM202409), Open Grants of the State Key Laboratory of Severe Weather (2024LASW-B13), Key Laboratory of Urban Meteorology, China Meteorological Administration, Beijing (LUM-2025-02), the Open Grants of East China Phased Array Weather Radar Application Joint Laboratory (EPJF202503), China Meteorological Administration Tornado Key Laboratory (TKL202306), the Beijige Funding from Jiangsu Research Institute of Meteorological Science (BJG202503), the Shanghai Typhoon Research Foundation (TFJJ202107), National Natural Science Foundation of China (42330611), IWHR Research & Development Support Program (JZ0199A022021).

Data Availability Statement

The data from two S-band Doppler weather radars and automatic weather stations can be obtained from the Chinese Meteorological Administration (CMA) upon request. The conventional observations were provided by the National Centers for Environmental Prediction (NCEP) through the operational Global Telecommunication System (GTS) (http://rda.ucar.edu/datasets/ds337.0/, accessed on 6 November 2025). Part of the software employed in this study was developed by the National Center for Atmospheric Research (NCAR) and is based on version 4.3 of the WRF and WRF-3DVAR systems. The reanalysis data used for model simulations were retrieved from the ERA5 dataset (https://cds.climate.copernicus.eu/datasets/reanalysis-era5-single-levels?tab=overview, accessed on 6 November 2025). All figures were produced using Python version 3.8 (https://www.python.org, accessed on 6 November 2025).

Acknowledgments

We acknowledge the High-Performance Computing Center of Nanjing University of Information Science & Technology for their support of this work.

Conflicts of Interest

The authors declare no conflicts of interest.

References

  1. Houze, R.A. Mesoscale convective systems. Rev. Geophys. 2004, 42, RG4003. [Google Scholar] [CrossRef]
  2. Li, J.; Feng, Z.; Qian, Y.; Leung, L.R. A high-resolution unified observational data product of mesoscale convective systems and isolated deep convection in the United States for 2004–2017. Earth Syst. Sci. Data 2021, 13, 827–856. [Google Scholar] [CrossRef]
  3. Rotunno, R.; Klemp, J.B.; Weisman, M.L. A theory for strong, long-lived squall lines. J. Atmos. Sci. 1988, 45, 463–485. [Google Scholar] [CrossRef]
  4. Weisman, M.L.; Klemp, J.B. The dependence of numerically simulated convective storms on vertical wind shear and buoyancy. Mon. Weather Rev. 1982, 110, 504–520. [Google Scholar] [CrossRef]
  5. Fan, J.; Han, B.; Varble, A.; Morrison, H.; North, K.; Kollias, P.; Chen, B.; Dong, X.; Giangrande, S.E.; Khain, A.; et al. Cloud-resolving model intercomparison of an MC3E squall line case: Part I—Convective updrafts. J. Geophys. Res. Atmos. 2017, 122, 9351–9378. [Google Scholar] [CrossRef]
  6. Bao, J.-W.; Michelson, S.A.; Grell, E.D. Microphysical process comparison of three microphysics parameterization schemes in the WRF model for an idealized squall-line case study. Mon. Weather Rev. 2019, 147, 3093–3120. [Google Scholar] [CrossRef]
  7. Parrish, D.F.; Derber, J.C. The National Meteorological Center’s spectral statistical-interpolation analysis system. Mon. Weather Rev. 1992, 120, 1747–1763. [Google Scholar] [CrossRef]
  8. Courtier, P.; Andersson, E.; Heckley, W.; Vasiljevic, D.; Hamrud, M.; Hollingsworth, A.; Rabier, F.; Fisher, M.; Pailleux, J. The ECMWF implementation of three-dimensional variational assimilation (3DVar). Q. J. R. Meteorol. Soc. 1998, 124, 1783–1807. [Google Scholar] [CrossRef]
  9. Purser, R.J.; Wu, W.S.; Parrish, D.F.; Roberts, N.M. Numerical aspects of the application of recursive filters to variational statistical analysis. Part I: Spatially homogeneous and isotropic Gaussian covariances. Mon. Weather Rev. 2003, 131, 1524–1535. [Google Scholar] [CrossRef]
  10. Barker, D.M.; Huang, W.; Guo, Y.-R.; Bourgeois, A.J.; Xiao, Q.N. A three-dimensional variational data assimilation system for MM5: Implementation and initial results. Mon. Weather Rev. 2004, 132, 897–914. [Google Scholar] [CrossRef]
  11. Brousseau, P.; Berre, L.; Bouttier, F.; Desroziers, G. Background-error covariances for a convective-scale data-assimilation system: AROME-France 3DVar. Q. J. R. Meteorol. Soc. 2011, 137, 409–422. [Google Scholar] [CrossRef]
  12. Xu, D.; Song, T.; Li, H.; Min, J.; Luo, J.; Shen, F. Four-Dimensional Variational Assimilation of Precipitation Data with the Large-Scale Analysis Constraint in the 21.7 Extreme Rainfall Event in China. J. Geophys. Res. Atmos. 2025, 130, e2024JD042522. [Google Scholar] [CrossRef]
  13. Buehner, M.; Houtekamer, P.L.; Charette, C.; Mitchell, H.L.; He, B. Intercomparison of variational data assimilation and the ensemble Kalman filter for global deterministic NWP. Part I: Description and single-observation experiments. Mon. Weather Rev. 2010, 138, 1550–1566. [Google Scholar] [CrossRef]
  14. Gao, J.; Stensrud, D.J. Assimilation of reflectivity data in a convective-scale, cycled 3DVAR framework with hydrometeor classification. J. Atmos. Sci. 2012, 69, 1054–1065. [Google Scholar] [CrossRef]
  15. Sun, J.; Xue, M.; Wilson, J.W.; Zawadzki, I.; Ballard, S.P.; Onvlee-Hooimeyer, J.; Joe, P.; Barker, D.M.; Li, P.-W.; Golding, B.; et al. Use of NWP for nowcasting convective precipitation: Recent progress and challenges. Bull. Am. Meteorol. Soc. 2014, 95, 409–426. [Google Scholar] [CrossRef]
  16. Shen, F.; Shu, A.; Min, J.; Wu, Z.; Wang, Y.; Xu, D.; Chen, J.; Wan, S. Assimilation of dual-pol radar KDP observations with the GSI ensemble Kalman filter for the analysis and prediction of a squall line. J. Geophys. Res. Atmos. 2025, 130, e2024JD041933. [Google Scholar] [CrossRef]
  17. Tong, M.; Xue, M. Ensemble Kalman filter assimilation of Doppler radar data with a compressible nonhydrostatic model: OSS experiments. Mon. Weather. Rev. 2005, 133, 1789–1807. [Google Scholar] [CrossRef]
  18. Shen, F.; Song, L.; Li, H.; He, Z.; Xu, D. Effects of Different Momentum Control Variables in Radar Data Assimilation on the Analysis and Forecast of a Strong Convective System in the Northeast China. SSRN 2022. [Google Scholar] [CrossRef]
  19. Pu, Z.; Zhang, H.; Anderson, J. Ensemble Kalman filter assimilation of near-surface observations over complex terrain: Comparison with 3DVAR for short-range forecasts. Tellus A Dyn. Meteorol. Oceanogr. 2013, 65, 19620. [Google Scholar] [CrossRef]
  20. Benjamin, S.G.; Weygandt, S.S.; Brown, J.M.; Hu, M.; Alexander, C.R.; Smirnova, T.G.; Olson, J.B.; James, E.P.; Dowell, D.C.; Grell, G.A.; et al. A North American hourly assimilation and model forecast cycle: The Rapid Refresh. Mon. Weather Rev. 2016, 144, 1669–1694. [Google Scholar] [CrossRef]
  21. Hou, T.; Min, J.; Xue, M.; Luo, Y. Evaluation of radar and automatic weather station data assimilation for a heavy rainfall event in southern China. Adv. Atmos. Sci. 2015, 32, 1065–1080. [Google Scholar] [CrossRef]
  22. Ha, J.-H.; Lee, J.-H.; Kwon, T.-Y. Observation and numerical simulations with radar and surface data assimilation for heavy rainfall over central Korea. Adv. Atmos. Sci. 2011, 28, 573–590. [Google Scholar] [CrossRef]
  23. Chen, I.-H.; Wang, W.; Sun, J.; Xu, D. Improving afternoon thunderstorm prediction over Taiwan through 3DVar-based radar and surface data assimilation. Weather Forecast. 2020, 35, 2373–2391. [Google Scholar] [CrossRef]
  24. Skamarock, W.C.; Klemp, J.B.; Dudhia, J.; Gill, D.O.; Barker, D.; Duda, M.G.; Huang, X.-Y.; Wang, W.; Powers, J.G. A Description of the Advanced Research WRF, version 3; NCAR Technical Note NCAR/TN-475+STR; University Corporation for Atmospheric Research: Boulder, CO, USA, 2008; Available online: https://opensky.ucar.edu/islandora/object/technotes:500 (accessed on 1 November 2025).
  25. Barker, D.; Huang, X.Y.; Liu, Z.; Auligné, T.; Zhang, X.; Rugg, S.; Ajjaji, R.; Bourgeois, A.; Bray, J.; Chen, Y.; et al. The Weather Research and Forecasting Model’s Community Variational/Ensemble Data Assimilation System: WRFDA. Bull. Am. Meteorol. Soc. 2012, 93, 831–843. [Google Scholar] [CrossRef]
  26. Chen, J.; Xu, D.; Shu, A.; Song, L. The Impact of Radar Radial Velocity Data Assimilation Using WRF-3DVAR System with Different Background Error Length Scales on the Forecast of Super Typhoon Lekima (2019). Remote Sens. 2023, 15, 2592. [Google Scholar] [CrossRef]
  27. Wang, X.; Shen, F.; Wan, S.; Liu, J.; Fei, H.; Shao, C.; Yuan, S.; Chen, J.; Yuan, X. Enhancing Typhoon Doksuri (2023) Forecasts via Radar Data Assimilation: Evaluation of Momentum Control Variable Schemes with Background-Dependent Hydrometeor Retrieval in WRF-3DVAR. Atmosphere 2025, 16, 797. [Google Scholar] [CrossRef]
  28. NCAR/UCAR. Lrose-Solo3: C++ Version of SOLO Polar Radar Data Display and Editor. 2025. Available online: https://github.com/NCAR/lrose-solo3 (accessed on 1 November 2025).
  29. Ha, S.-Y.; Snyder, C. Influence of surface observations in mesoscale data assimilation using an ensemble Kalman filter. Mon. Weather Rev. 2014, 142, 1489–1508. [Google Scholar] [CrossRef]
  30. Lei, L.; Anderson, J.L. Impacts of frequent assimilation of surface pressure observations on atmospheric analyses. Mon. Weather Rev. 2014, 142, 4477–4483. [Google Scholar] [CrossRef]
  31. Wang, S.; Liu, Z. A radar reflectivity operator with ice-phase hydrometeors for variational data assimilation (version 1.0) and its evaluation with real radar data. Geosci. Model Dev. 2019, 12, 4031–4051. [Google Scholar] [CrossRef]
  32. Thompson, G.; Field, P.R.; Rasmussen, R.M.; Hall, W.D. Explicit forecasts of Winter Precipitation Using an Improved Bulk Microphysics Scheme. Part II: Implementation of a New Snow Parameterization. Mon. Weather Rev. 2008, 136, 5095–5115. [Google Scholar] [CrossRef]
  33. Iacono, M.J.; Delamere, J.S.; Mlawer, E.J.; Shephard, M.W.; Clough, S.A.; Collins, W.D. Radiative forcing by long-lived greenhouse gases: Calculations with the AER radiative transfer models. J. Geophys. Res. Atmos. 2008, 113, D13103. [Google Scholar] [CrossRef]
  34. Mukul Tewari, N.C.; Tewari, M.; Chen, F.; Wang, W.; Dudhia, J.; LeMone, M.; Mitchell, K.; Ek, M.; Gayno, G.; Wegiel, J. Implementation and verification of the unified NOAH land surface model in the WRF model (Formerly Paper Number 17.5). In Proceedings of the 20th Conference on Weather Analysis and Forecasting/16th Conference on Numerical Weather Prediction, Seattle, WA, USA, 12–16 January 2004. [Google Scholar]
  35. Janjic, Z.I. The Step-Mountain Eta Coordinate Model: Further developments of the convection, viscous sublayer, and turbulence closure schemes. Mon. Weather Rev. 1994, 122, 927–945. [Google Scholar] [CrossRef]
  36. Mesinger, F. Forecast upper tropospheric turbulence within the framework of the Mellor-Yamada 2.5 closure. In Research Activities in Atmospheric and Oceanic Modeling; CAS/JSC WGNE Report No. 18; WMO: Geneva, Switzerland, 1993; pp. 4.28–4.29. Available online: https://cir.nii.ac.jp/crid/1571980075271328640 (accessed on 20 November 2025).
  37. Li, Z.H.; Luo, Y.L. Modeling and analysis of the dynamical and microphysical structures of two cellular rainstorms in South China coasts. Torrential Rain Disasters 2025, 44, 576–591. (In Chinese) [Google Scholar] [CrossRef]
  38. Wang, H.T.; Liu, X.X.; Wang, Q.C.; Li, N.; Zhou, T.; Liu, Q.; Zhang, X.; Xu, M. Analysis of environmental conditions and trigger mechanism of an elevated thunderstorm in early spring in North China. Torrential Rain Disasters 2025, 44, 361–370. (In Chinese) [Google Scholar] [CrossRef]
  39. Wilks, D.S. Statistical Methods in the Atmospheric Sciences, 3rd ed.; Academic Press: Cambridge, MA, USA, 2011; p. 704. [Google Scholar]
  40. Roberts, N.M.; Lean, H.W. Scale-selective verification of rainfall accumulations from high-resolution forecasts of convective events. Mon. Weather Rev. 2008, 136, 78–97. [Google Scholar] [CrossRef]
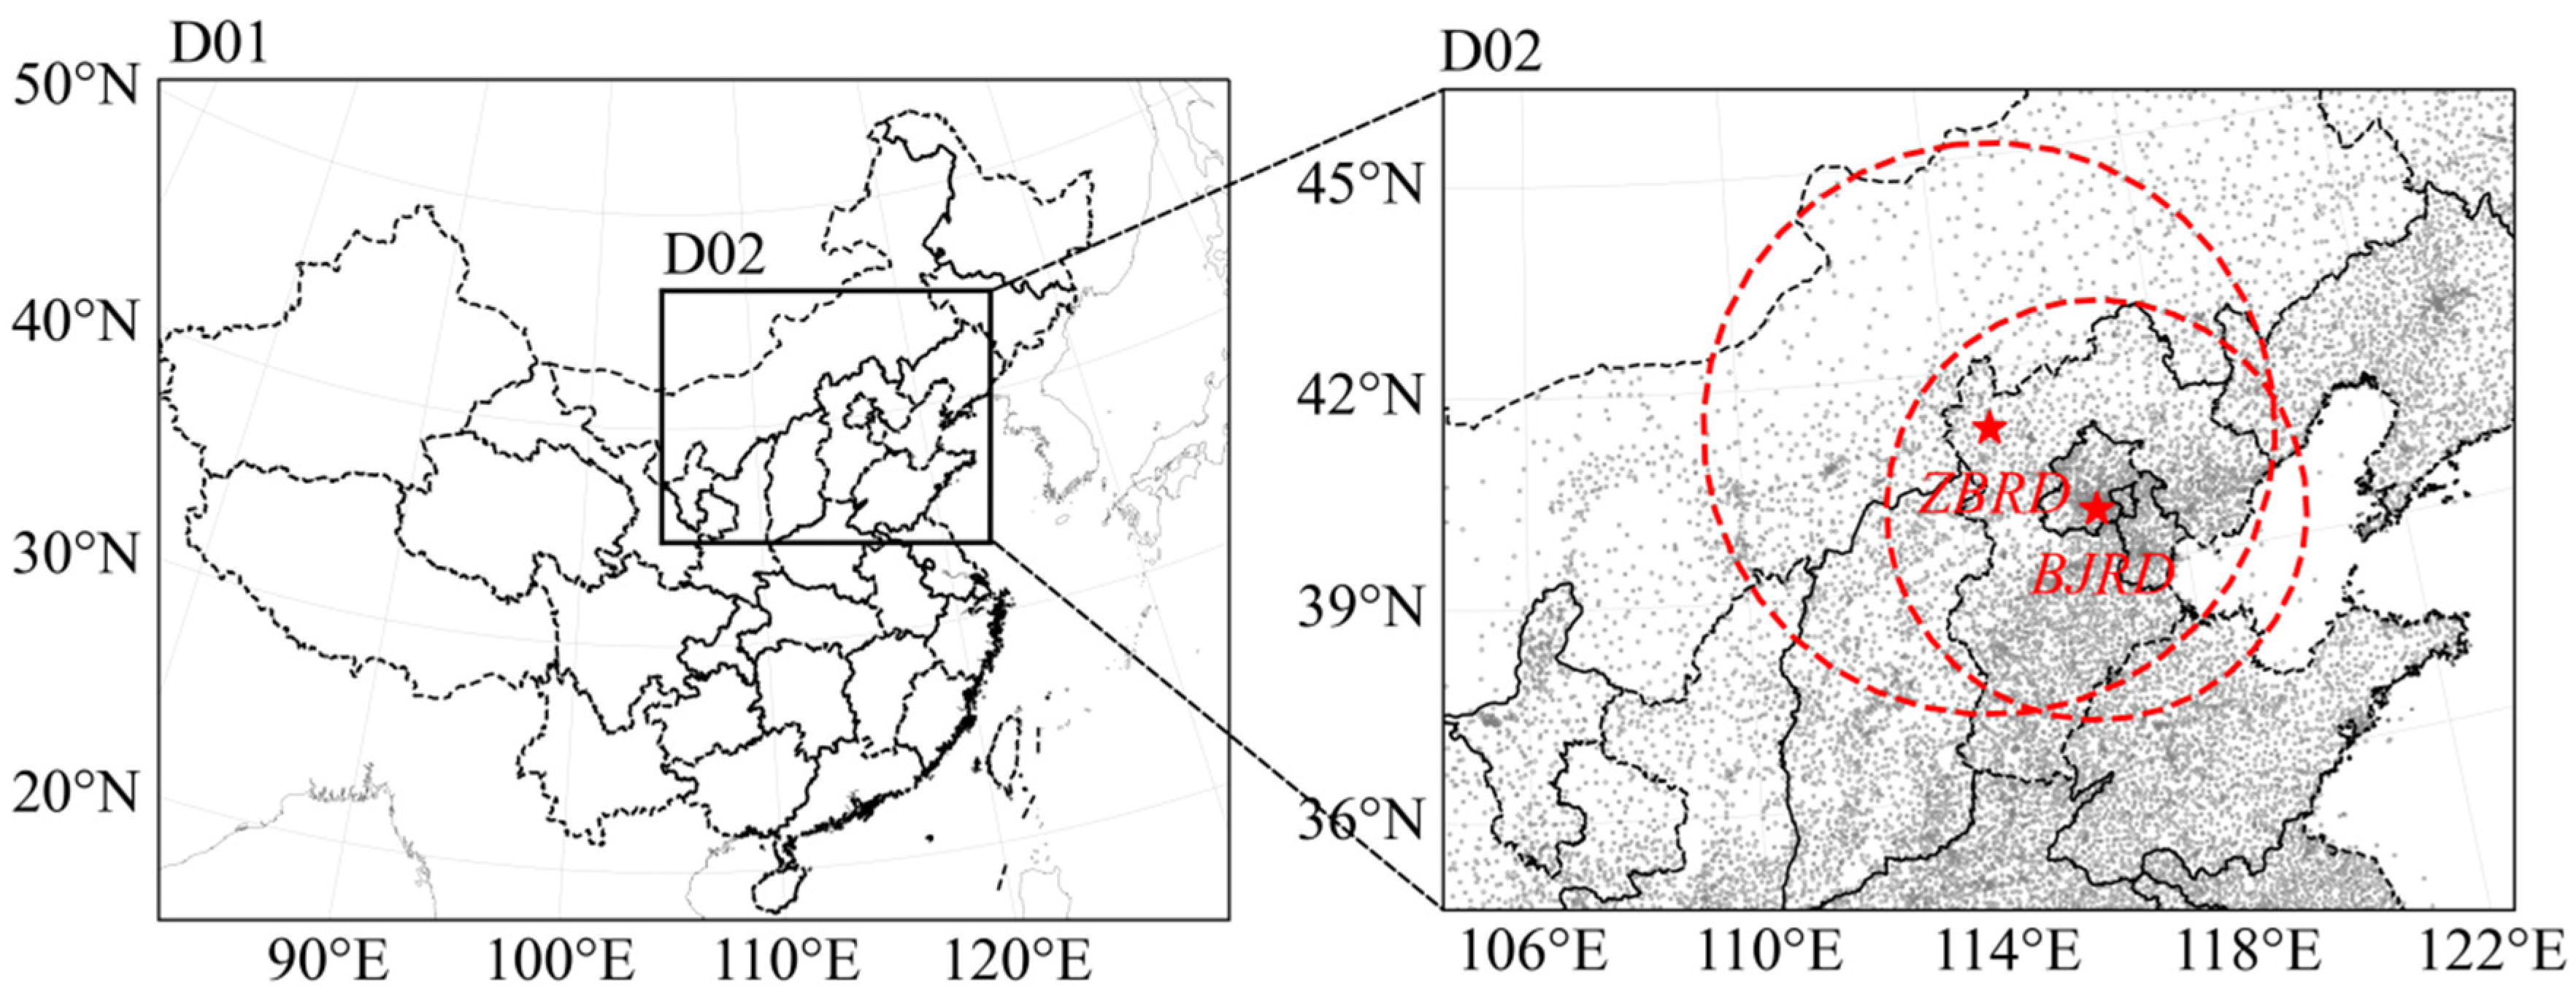
Figure 1. The WRF model domains of 9 km (D01) and 3 km (D02) (black solid lines), the locations (red pentagrams) and ranges (red dotted rings) of two radars from Beijing (BJRD) and Zhangbei (ZBRD), the distribution of AWS (gray points).
Remotesensing 17 03860 g001
Figure 2. Doppler radar reflectivity (shaded, units: dBZ) of the first sweep at 05:30 UTC on 30 May. (a) Raw data of ZBRD; (b) ZBRD data after quality control; (c) ZBRD after quality control with observations truncation. The dotted rings show the ranges of observations (black dotted rings) and truncation (red dotted rings) of ZBRD. The black points represent the locations of ZBRD.
Remotesensing 17 03860 g002
Figure 3. Geopotential height (black solid lines; units: dagpm), temperature (red dotted lines; units: K), and wind (blue wind barbs) of ECMWF analyses at (a,c) 850 hPa and (b,d) 500 hPa at 00:00 UTC (the top panel) and 04:00 UTC (the bottom panel) on 30 May 2024.
Remotesensing 17 03860 g003
Figure 4. The flow chart for the data assimilation.
Remotesensing 17 03860 g004
Figure 5. (a) The observed radar reflectivity and the composite reflectivity (shaded, units: dBZ) for (b) DA_RA4_woTrc, (c) DA_RA4 at 07:00 UTC on 30 May 2024.
Remotesensing 17 03860 g005
Figure 6. (a) The observed radar reflectivity and the composite reflectivity (shaded, units: dBZ) for (b) CTRL, (c) DA_RA1, (d) DA_RA2, (e) DA_RA3, (f) DA_RA4 at 06:30 UTC on 30 May 2024.
Remotesensing 17 03860 g006
Figure 7. Threat score (the top panel) and fractions skill score (the bottom panel) of composite reflectivity for five experiments with thresholds of (a,d) 20, (b,e) 30, and (c,f) 40, respectively, at 06:30 UTC on 30 May 2024.
Remotesensing 17 03860 g007
Figure 8. Wind increments (shaded, m/s) at 900 hpa (the top panel) and 700 hpa (the bottom panel) for (a,e) DA_AWS, (b,f) DA_RA1, (c,g) DA_JOINT1, (d,h) DA_JOINT2 at 04:00 UTC.
Remotesensing 17 03860 g008
Figure 9. Vertical cross-sections for (a) DA_AWS, (b) DA_RA1, (c) DA_JOINT1, (d) DA_JOINT2 at 04:00 UTC.
Remotesensing 17 03860 g009
Figure 10. (a) The observed radar reflectivity and the composite reflectivity (shaded, units: dBZ) for (b) CTRL, (c) DA_AWS, (d) DA_RA1, (e) DA_JOINT1, (f) DA_JOINT2 at 06:30 UTC on 30 May 2024.
Remotesensing 17 03860 g010
Figure 11. (a,f,k,p) The observed radar reflectivity and the composite reflectivity (shaded, units: dBZ) for (b,g,l,q) DA_AWS, (c,h,m,r) DA_RA1, (d,i,n,s) DA_JOINT1, and (e,j,o,t) DA_JOINT2 at 07:00 UTC (the top panel), 07:30 UTC (the second panel), 08:00 UTC (the third panel), and 08:30 UTC (the bottom panel) on 30 May 2024.
Remotesensing 17 03860 g011
Figure 12. (a) The observed surface wind of AWS and 10 m wind (wind barbs and shaded, m/s) for (b) CTRL, (c) DA_AWS, (d) DA_RA1, (e) DA_JOINT1, (f) DA_JOINT2 at 06:30 UTC on 30 May 2024.
Remotesensing 17 03860 g012
Figure 13. Fractions skill score of composite reflectivity (the top panel) with thresholds of (a) 20, (b) 30, and (c) 40, respectively, and wind speed (the bottom panel) with thresholds of (d) 6, (e) 12, and (f) 18, respectively, for five experiments at 06:30 UTC on 30 May 2024.
Remotesensing 17 03860 g013
Figure 14. Surface potential temperature perturbations (shaded, K) for (a) CTRL, (b) DA_AWS, (c) DA_RA1, (d) DA_JOINT1, (e) DA_JOINT2 at 06:30 UTC on 30 May 2024.
Remotesensing 17 03860 g014
Figure 15. Vertical cross-sections of potential temperature perturbations (shaded, K) and vertical wind (vector, m/s) for (a) CTRL, (b) DA_AWS, (c) DA_RA1, (d) DA_JOINT1, (e) DA_JOINT2 at 06:30 UTC on 30 May 2024.
Remotesensing 17 03860 g015
Table 1. Experiment scheme.
NumberExperimentObservations
1CTRLNo.
2DA_RA4_woTrcRadar observation without spatial truncation.
3DA_RA1Radar observation with spatial truncation.
4DA_RA2
5DA_RA3
6DA_RA4
7DA_AWSAWS observation.
8DA_JOINT1Both AWS observation and radar observation with spatial truncation.
9DA_JOINT2
Disclaimer/Publisher’s Note: The statements, opinions and data contained in all publications are solely those of the individual author(s) and contributor(s) and not of MDPI and/or the editor(s). MDPI and/or the editor(s) disclaim responsibility for any injury to people or property resulting from any ideas, methods, instructions or products referred to in the content.