Article

Individual Tree-Level Biomass Mapping in Chinese Coniferous Plantation Forests Using Multimodal UAV Remote Sensing Approach Integrating Deep Learning and Machine Learning

by
Yiru Wang
1,2,3,
Zhaohua Liu
4,
Jiping Li
1,2,3,
Hui Lin
1,2,3,5,
Jiangping Long
1,2,3,5,
Guangyi Mu
6,
Sijia Li
4 and
Yong Lv
1,2,3,*
1
Faculty of Forestry, Central South University of Forestry and Technology, Changsha 410004, China
2
Key Laboratory of National Forestry and Grassland Administration on Forest Resources Management and Monitoring in Southern China, Changsha 410004, China
3
Research Center of Forestry Remote Sensing & Information Engineering, Central South University of Forestry & Technology, Changsha 410004, China
4
Northeast Institute of Geography and Agroecology, Chinese Academy of Sciences, Changchun 130102, China
5
Hunan Provincial Key Laboratory of Forestry Remote Sensing Based Big Data & Ecological Security, Changsha 410004, China
6
Jilin Provincial Key Laboratory of Municipal Wastewater Treatment, Changchun Institute of Technology, Changchun 130012, China
*
Author to whom correspondence should be addressed.
Remote Sens. 2025, 17(23), 3830; https://doi.org/10.3390/rs17233830
Submission received: 19 October 2025 / Revised: 21 November 2025 / Accepted: 26 November 2025 / Published: 26 November 2025

Highlights

What are the main findings?
  • An attention-enhanced, multi-scale detector (NB-YOLOv8: NAM + BiFPN) markedly achieves individual-tree detection in dense conifer plantations (precision 92.3%, recall 90.6%), with the largest gains for small-diameter crowns versus YOLOv8 and watershed baselines.
  • Fusing UAV RGB texture features with LiDAR-derived CHM and modeling with Random Forest yields robust tree-level AGB estimates (R2 = 0.65–0.76); SHAP (SHapley Additive exPlanations) analysis reveals locally varying feature effects that often diverge from global importance rankings.
What are the implications of the main findings?
  • The hybrid deep-learning + machine-learning workflow enables effective, fine-resolution carbon mapping and stand diagnostics (e.g., early detection of suppressed trees, prioritization of thinning zones) from multi-source UAV data.
  • Model interpretability via SHAP supports defensible management decisions by exposing species- and site-specific drivers of AGB, guiding transferable feature selection and reducing black-box risk for real-world deployment.

Abstract

Accurate estimation of individual tree aboveground biomass (AGB) is essential for understanding forest carbon dynamics, optimizing resource management, and addressing climate change. Conventional methods rely on destructive sampling, whereas unmanned aerial vehicle (UAV) remote sensing provides a non-destructive alternative. In this study, spectral indices, textural features, and canopy height attributes were extracted from high-resolution UAV optical imagery and Light Detection And Ranging (LiDAR) point clouds. We developed an improved YOLOv8 model (NB-YOLOv8), incorporating Neural Architecture Manipulation (NAM) attention and a Bidirectional Feature Pyramid Network (BiFPN), for individual tree detection. Combined with a random forest algorithm, this hybrid framework enabled accurate biomass estimation of Chinese fir, Chinese pine, and larch plantations. NB-YOLOv8 achieved superior detection performance, with 92.3% precision and 90.6% recall, outperforming the original YOLOv8 by 4.8% and 4.2%, and the watershed algorithm by 12.4% and 11.7%, respectively. The integrated model produced reliable tree-level AGB predictions (R2 = 0.65–0.76). SHapley Additive exPlanation (SHAP) analysis further revealed that local feature contributions often diverged from global rankings, underscoring the importance of interpretable modeling. These results demonstrate the effectiveness of combining deep learning and machine learning for tree-level AGB estimation, and highlight the potential of multi-source UAV remote sensing to support large-scale, fine-resolution forest carbon monitoring and management.

1. Introduction

Accurate estimation of forest biomass at the individual tree-level constitutes a fundamental prerequisite for understanding ecosystem structure–function relationships and optimizing sustainable management strategies [1,2]. Precise quantification of individual tree biomass not only elucidates tree growth competition dynamics and carbon allocation mechanisms but also provides scientific foundations for forest carbon sink quantification, biodiversity conservation, and differentiated silvicultural operations [3,4,5]. However, conventional plot-level approaches based on remote sensing often fail to meet the precision standards required for individual-tree-scale biomass estimation due to spatial heterogeneity and mixed-pixel effects, whereas field-based measurements remain the reference standard for accuracy [6].
The rapid development of Unmanned Aerial Vehicle (UAV) remote sensing technology has provided a novel opportunity for individual tree-level monitoring [7,8]. By equipping UAV with high-resolution optical cameras and Light Detection And Ranging (LiDAR) sensors, it becomes possible to simultaneously acquire canopy spectral texture information and three-dimensional structural parameters. Optical imagery can capture subtle spectral variations within the canopy foliage, while LiDAR point clouds are capable of penetrating canopy gaps to accurately reconstruct the vertical structure of individual trees [9,10,11,12]. The synergy between these two data sources helps compensate for the limitations of using a single modality—such as the spectral saturation observed in optical imagery and the weak sensitivity of LiDAR to foliar biochemical parameters [13,14]. This multi-source data fusion strategy thus provides a technically feasible solution for individual tree segmentation and biomass inversion in complex forest stands [15,16,17]. However, the efficient processing and extraction of effective features from multi-source data remain critical challenges in achieving high-precision individual tree segmentation and biomass estimation.
Precise detection is a prerequisite for accurate individual tree biomass estimation. However, existing tree detection methods face significant challenges in dense plantation forests. Traditional watershed algorithms rely on local gradient extrema in canopy images for detection, making them highly sensitive to overlapping canopy areas and resulting in a serious omission of small diameter trees [18,19,20,21]. In contrast, deep learning models employ Convolutional Neural Networks (CNNs) to automatically extract multi-level features that capture canopy texture, shape, and spatial context, thereby significantly enhancing target detection efficiency in complex backgrounds [22,23,24,25]. Their end-to-end learning framework reduces the subjectivity inherent in manually designed features and, through data augmentation strategies, helps alleviate the limitations posed by insufficient labeled data. Moreover, the multi-scale perception capability of deep learning enables adaptation to canopies of varying densities and morphologies, achieving more precise boundary delineation in overlapping regions.
Nevertheless, current models are still constrained by their reliance on a single feature pyramid structure to represent morphological heterogeneity and the absence of an adaptive mechanism to enhance fine canopy edge details, which contributes to the continued high omission rates for small-diameter trees [26,27,28,29,30,31]. Additionally, the training process heavily depends on the registration accuracy between high-resolution imagery and LiDAR point clouds, and the generalizability of these models in complex terrain scenarios remains to be improved. These challenges underscore the urgent need for an adaptive improvement algorithm that integrates multi-scale feature fusion with attention mechanisms to overcome the accuracy and generalization limitations of existing segmentation technologies.
Furthermore, the use of traditional machine learning algorithms for biomass estimation faces another challenge. While machine learning algorithms can integrate multi-source features to improve prediction accuracy, their “black-box” nature results in a lack of ecological interpretability in the model’s decision-making process [32,33,34,35,36,37]. Traditional feature importance metrics, such as IncNodePurity, assess the global contribution of variables by calculating the decrease in node purity, which reflects the average impact of features on the overall model prediction [38,39]. However, they fail to quantify the dynamic influence of features in local samples. For instance, Canopy Height Model (CHM) derived from LiDAR may show a strong positive contribution in low biomass samples due to the linear relationship between tree height and biomass, whereas in high biomass areas, the increasing complexity of the canopy structure may lead to a reduced contribution. Such nonlinear responses are common in heterogeneous stands, but traditional methods struggle to capture their spatial heterogeneity patterns.
Based on the aforementioned challenges, this study focuses on typical coniferous plantations in China and proposes a hybrid framework that integrates NB-YOLOv8 with Random Forest (RF) algorithm to achieve high-precision individual tree detection and biomass mapping. First, by incorporating a Neural Architecture Manipulation (NAM) attention mechanism and a Bidirectional Feature Pyramid Network (BiFPN) multi-scale feature fusion module, the model enhances its ability to identify complex canopy edges and small-diameter trees, thereby addressing the high omission rates and poor adaptability seen in traditional segmentation methods and ultimately improving individual tree segmentation accuracy. Second, a random forest-based biomass estimation model is constructed by combining UAV optical imagery and LiDAR point cloud data to exploit the synergistic effects of spectral and structural features, mitigating the spectral saturation issues in high biomass areas. Finally, a game theory-based SHapley Additive exPlanations (SHAP) interpretability framework is introduced to quantify the spatial heterogeneity of feature contributions, revealing the local mechanisms of variables such as the CHM and texture indices. The results of this study will provide actionable ecological evidence for carbon sink hotspot identification, forest stand structure optimization, and differentiated thinning strategies.

2. Data and Method

2.1. Study Area

This study was conducted at two locations: the Wangyedian Forest Farm in Inner Mongolia (longitude 118.09–118.30°E, latitude 41.21–41.39°N) and the Huangfengqiao Forest Farm in Hunan Province (longitude 113.57–113.87°E, latitude 27.05–27.38°N) (Figure 1). The Wangyedian Forest Farm is situated in a warm temperate semi-arid region characterized by middle-mountainous terrain, with elevations ranging from 800 to 1890 m. The area experiences an annual precipitation of 400–600 mm and an average annual temperature of 4.2 °C, with pine and larch being the dominant species. In contrast, the Huangfengqiao Forest Farm is located in a subtropical monsoon humid climate zone, with an average annual temperature of 17.8 °C and an annual precipitation of 1410.8 mm, where fir is the primary tree species.

2.2. Ground Data

Field surveys were conducted in two stages based on updated forest management inventory data. The first survey was carried out in September 2017 at the Wangyedian Forest Farm, and the second was completed in July 2022 at the Huangfengqiao Forest Farm. According to the distribution of coniferous stands, a total of 48 square plots (20 m × 20 m) were established, including 16 plots in Chinese pine (Pinus tabuliformis, CP) stands, 11 plots in larch (Larix gmelinii) stands, and 21 plots in Chinese fir (Cunninghamia lanceolata, CF) plantations. The coordinates of the plot center and the four corner points were recorded using Real-time Kinematic (RTK) GNSS equipment. Within each plot, all trees with a diameter at breast height (DBH) ≥ 5 cm were measured. DBH was recorded using a diameter tape, while tree height and crown height were measured using a TruPulse 200 laser rangefinder. Crown diameter was measured along the north–south and east–west directions using a tape measure, and the average value was used for analysis.
A total of 957 Chinese pine, 664 larch and 1658 Chinese fir trees were surveyed at the two sites. The sample characteristics are shown in Table 1. Tree-level aboveground biomass was calculated using species-specific allometric equations in Table 2. Chinese pine biomass ranged from 1.76 to 1225.38 kg with a standard deviation of 134.63 kg. Larch biomass ranged from 2.49 to 164.08 kg with a standard deviation of 28.51 kg. Chinese fir biomass ranged from 1.25 to 1008.02 kg with a standard deviation of 129.21 kg. All measurements were taken under clear-sky conditions during the growing season.

2.3. UAV Data

This UAV aerial survey employed a DJI Matrice 300 RTK professional-grade flight platform (DJI Innovations, Shenzhen, China) equipped with a Hasselblad L1D-20c aerial camera (Hasselblad, Gothenburg, Sweden, featuring a 1-inch CMOS sensor with 20 million effective pixels) and a Chansi L1 LiDAR module. During the mission, the UAV maintained an altitude of 100–150 m and a flight speed of 10–12 m per second while following an intelligently planned flight path. The forward and lateral overlaps were set at 80% and 70%, respectively, and RTK real-time dynamic differential positioning technology was used to ensure centimeter-level positioning accuracy. The UAV data acquisition and field sample collection were conducted during the same periods to ensure temporal consistency between remote-sensing and ground observations. For the Wangyedian Forest Farm, UAV imagery and field measurements of CP and larch were collected in September 2017, corresponding to the peak of the local growing season. For the Huangfengqiao Forest Farm, UAV imagery and field data of CF were obtained in July 2022, also during the growing season under clear-sky conditions.

2.3.1. Orthophoto Processing

In this study, high-resolution RGB orthophotos were generated from the UAV imagery using DJI software (version 3.9.0). Raw images were first inspected to remove frames affected by motion blur, over-exposure, or cloud cover greater than 10%. The remaining images, together with onboard RTK information, were then used for aerial triangulation and bundle adjustment, during which a set of RTK-surveyed ground control points was introduced to improve georeferencing accuracy. After camera pose optimization, a dense point cloud and digital surface model were produced, and orthorectified image tiles were mosaicked into seamless Digital Orthophoto Maps with a ground sampling distance of 0.05 m. Finally, basic radiometric normalization was applied to reduce brightness differences among overlapping images.

2.3.2. LiDAR Point Cloud Data Processing

The LiDAR data were collected using the DJI Zenmuse L1 laser scanner (DJI Innovations, Shenzhen, China; wavelength 905 nm; scanning rate 240,000 points s−1; point density ≥ 160 points m−2; vertical accuracy ±5 cm). All point-cloud processing was performed in LiDAR360 software. The raw point clouds were first filtered to remove noise and classify ground and non-ground points using the built-in progressive TIN densification algorithm. A high-accuracy digital elevation model (DEM) was then generated from the ground class. The digital surface model (DSM) was derived from the highest non-ground returns, and the CHM was produced by subtracting the DEM from the DSM at 0.1 m resolution. Subsequent refinement included smoothing, removal of negative artifacts, and gap-filling to ensure a continuous canopy surface.

2.4. Process of This Study

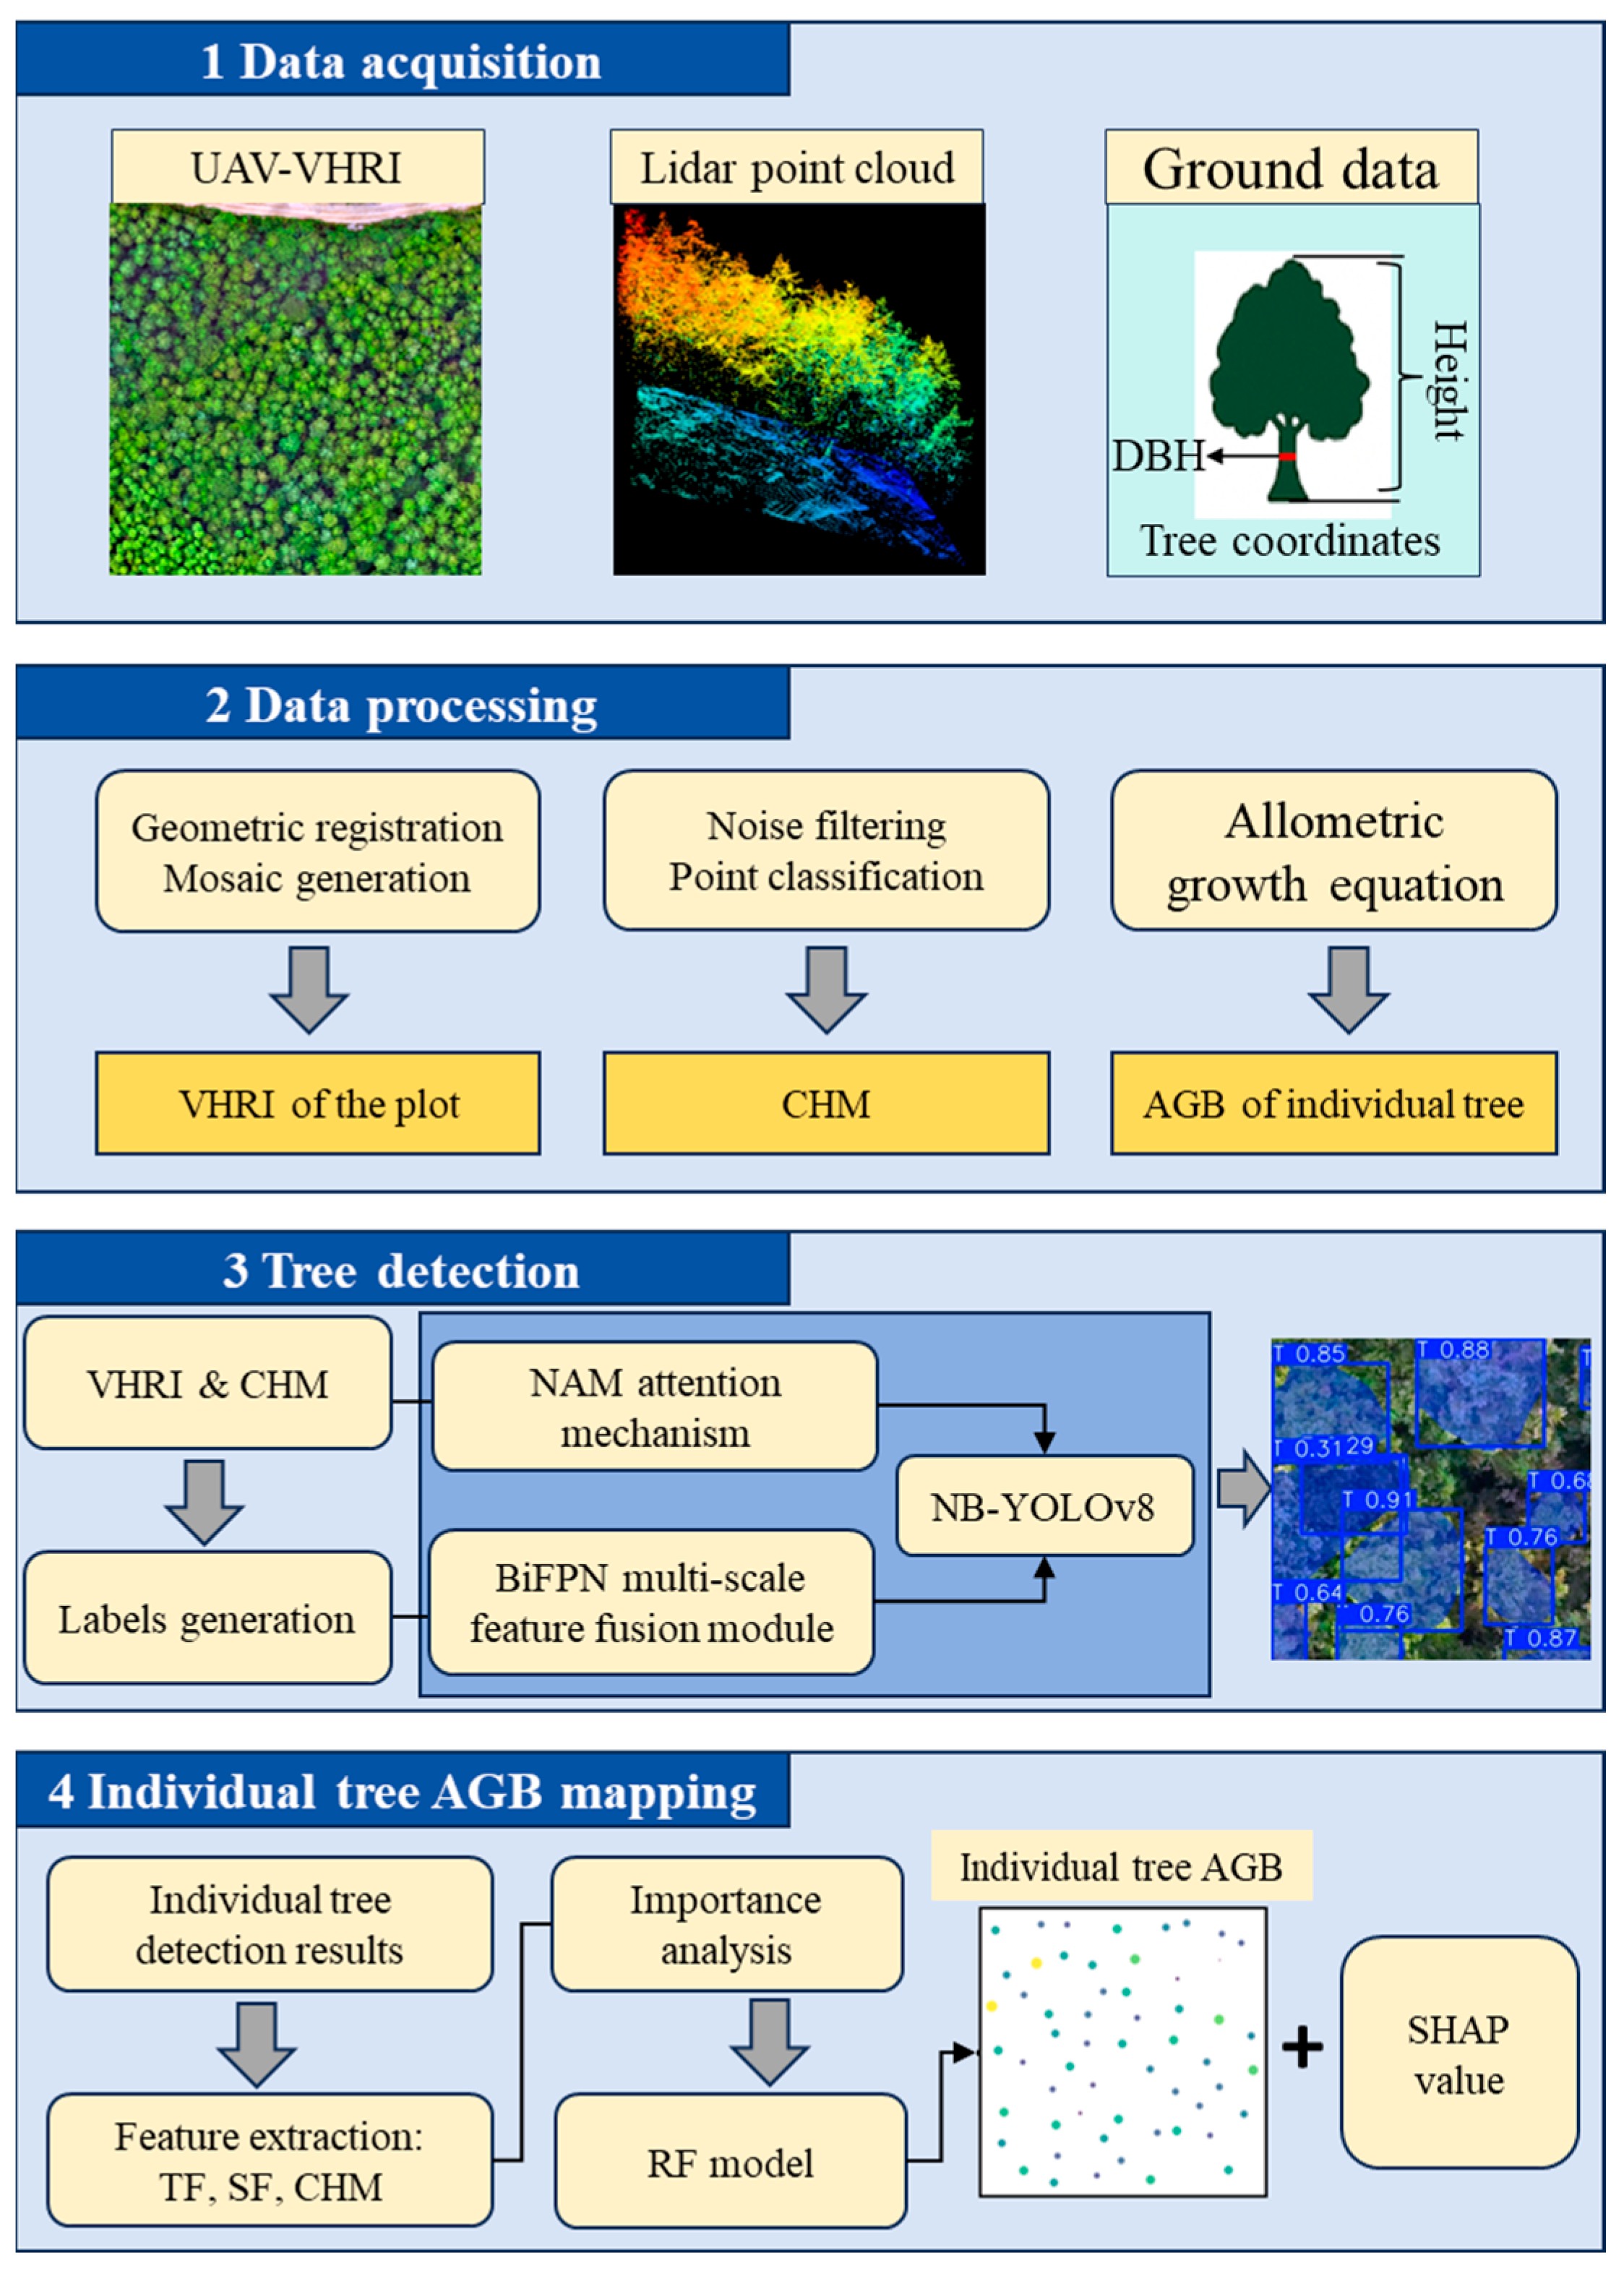
The overall technical workflow of this study is illustrated in Figure 2. Firstly, UAV-acquired imagery and LiDAR point cloud data were processed to generate high-resolution orthophotos and CHM for each sample plot. Secondly, the YOLOv8 model was optimized by integrating the NAM and BiFPN to construct the enhanced NB-YOLOv8 model. This improved model was then compared with the original YOLOv8 and the traditional watershed segmentation algorithm. Finally, based on the individual tree detection results, visible-band vegetation indices and CHM features were extracted to build an interpretable RF model for individual tree AGB mapping.

2.5. Individual Tree Detection Algorithm

2.5.1. YOLOv8 Architecture

YOLOv8, the latest evolution in single-stage object detection models, comprises three core components: the Backbone, Neck, and Head [40,41,42]. The Backbone is designed based on the Cross Stage Partial Darknet (CSPDarknet) architecture from the YOLO series, utilizing modular stacking structures, including Convolutional Block Sequence (CBS), C2f, and Spatial Pyramid Pooling Fast (SPPF), to effectively extract multi-scale features. The Neck employs a Path Aggregation Network- Feature Pyramid Network (PAN-FPN) structure to achieve feature pyramid fusion, where the newly added C2f module enhances feature reuse efficiency through multi-branch residual connections. The Head adopts a decoupled detection head, separating classification and regression tasks to improve detection accuracy. Compared with its predecessors, YOLOv8 introduces the Task Aligned Assigner in its loss function design, optimizing the assignment of positive and negative samples through a task alignment mechanism [43,44,45]. In this study, tree crown detection was performed using the YOLOv8n model implemented in the PyTorch 2.0 framework. The model was trained on a NVIDIA RTX 4090 GPU with a learning rate of 0.001, batch size of 16, input image size of 512 × 512 pixels, and 200 epochs. Data augmentation techniques, including random flipping, rotation, and brightness adjustment, were applied to improve generalization.

2.5.2. NB-YOLOv8 Algorithm

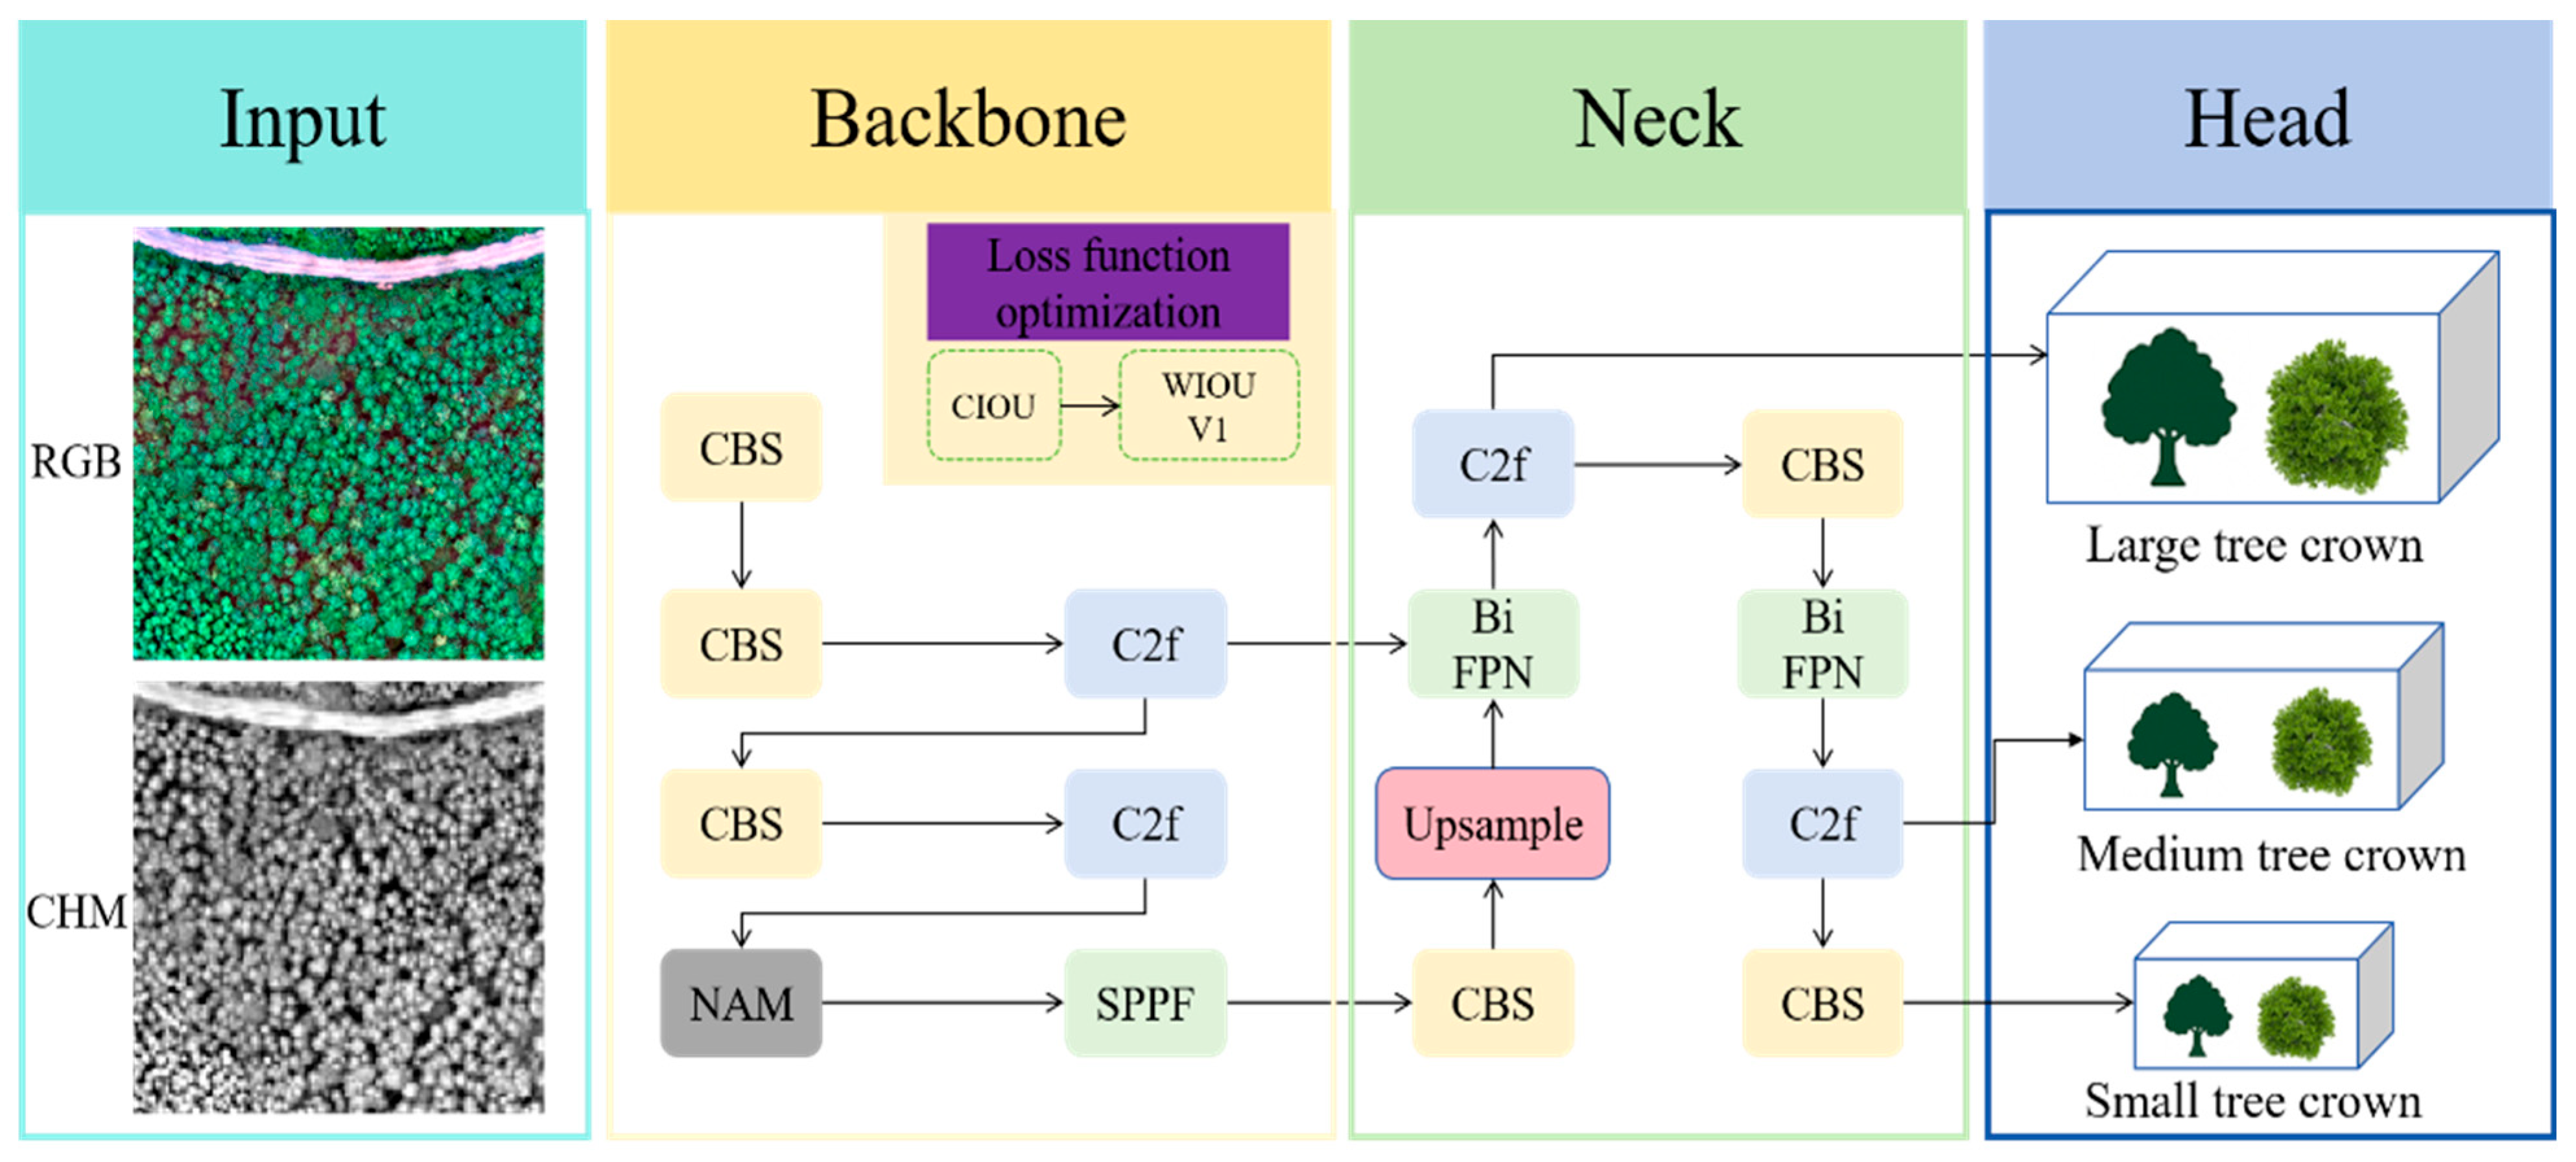
To address the issues of canopy overlap interference and poor adaptability to multi-scale targets in the original YOLOv8 structure for individual tree recognition tasks in plantations, we introduce the NAM attention module to enhance feature discriminability. Additionally, we replace the original PAN-FPN structure with BiFPN to improve multi-scale detection capabilities. The structure of the NB-YOLOv8 algorithm is shown in Figure 3.
(1) NAM attention mechanism
To improve the model’s ability to express features in scenarios with canopy overlap and complex backgrounds, the NAM attention mechanism module is embedded at the end of the Backbone [46,47]. This module enhances the feature response of key areas through a dual-path design of channel attention and spatial attention. The channel branch uses a batch normalization layer to generate channel weights, and the calculation method is defined as follows
W c = σ ( B N ( F ) )
where F is Input feature map from the previous layer, BN is Batch Normalization operation used to normalize feature distributions across the mini-batch. σ is Sigmoid activation function, W c is Channel attention weight map derived via normalization and activation to emphasize informative channels.
The spatial branch generates the spatial attention map through convolutional normalization, and its calculation method is defined as follows
W s = σ ( C o n v ( B N ( F ) ) )
where W s is Spatial attention map generated through convolution and normalization to highlight salient spatial regions. The final feature fusion is represented as
F = F W c W s
where is Element-wise multiplication operator, used here with broadcasting to apply attention weights. F is Output feature map enhanced by dual attention mechanisms. This module, through a lightweight design, effectively enhances the response of canopy edge features while suppressing background noise interference.
(2) BiFPN multi-scale feature fusion module
To enhance the model’s adaptability to recognizing trees of different sizes, this study replaces the PANet in the original Neck structure of YOLOv8 with a BiFPN [48,49,50]. This structure introduces a cross-scale bidirectional path design and incorporates a recurrent feature fusion mechanism. By combining a learnable weighting strategy, it enables dynamic information integration between feature layers. The learnable weights allow for adaptive weighted fusion of the feature layers, and its calculation method is defined as follows
f i ^ = w i · f i ϵ + w j
where f i ^ is the fused output feature map after weighted aggregation of multi-scale features. f i is input feature map at level i from different stages of the feature pyramid, w i is trainable scalar weight assigned to the i-th input feature, ϵ = 0.0001.

2.5.3. Watershed Algorithm

The Watershed Algorithm (WA) is a classic image segmentation method based on mathematical morphology [51,52]. Its basic idea is to treat the image’s grayscale gradient as a terrain surface and simulate the flooding process to determine the boundaries of regions. The segmentation process involves three key steps, first, the morphological gradient of the input image is calculated to obtain a gradient field that reflects edge intensity. Second, local extrema detection is used to extract initial seed labels, with common methods including distance transform or extrema point search, though these can be affected by noise in complex backgrounds, leading to false labels. Finally, the region “flooding” starts from the seed points, and when the floods of different labeled regions meet, a watershed line is formed, thus completing the watershed division of the image. This algorithm does not require training data and has low computational complexity, but its segmentation performance largely depends on the quality of the gradient field.
In this study, the watershed segmentation algorithm was applied to the CHM derived from LiDAR data rather than directly on optical imagery. The CHM provides detailed vertical canopy structure information, which is more suitable for individual tree delineation. Before segmentation, the CHM was smoothed using a Gaussian filter (3 × 3 kernel) to reduce noise and prevent over-segmentation. Local maxima were extracted using a 5 × 5 moving window to represent potential tree apexes and were used as seed points for the watershed transform. The watershed algorithm was then applied to the filtered CHM, followed by morphological opening to eliminate spurious artifacts and ensure continuous and accurate crown boundaries.

2.6. Extracting Variables Related to Individual Tree Biomass

2.6.1. Spectral Feature

The optical band combinations listed in Table 3 were selected through band sensitivity analysis and vegetation index correlation tests on UAV orthomosaics. R, G, B, and NIR bands were used to compute vegetation indices such as NDVI, ExG, and GLI, followed by Pearson correlation analysis to identify bands with high separability and low redundancy relative to LiDAR-derived canopy features. Although IHS and PCA transformations were tested, they reduced the biophysical interpretability of the spectral indices. Therefore, the final band combinations were selected to preserve ecological meaning while maintaining strong statistical independence, which improved model performance (R2 increased by 0.07–0.12 compared with PCA inputs).
By performing mathematical operations on the single-band data, visible-light vegetation indices were calculated to amplify differences between the forest canopy and the background. These vegetation indices have been shown to be closely correlated with forest biomass [53]. The spectral features (SF), including reflectance from the three individual bands and the visible-light vegetation indices, were extracted for mapping individual tree biomass, as shown in Table 3.

2.6.2. Texture Features

Texture features (TF) quantify the spatial distribution patterns of gray values in canopy images, effectively characterizing structural attributes such as individual tree branch-leaf density and the regularity of their arrangement. This approach compensates for the limitations of spectral indices in capturing the spatial heterogeneity of biomass. In this study, eight texture features were extracted using the Gray-Level Co-occurrence Matrix (GLCM) [54]—namely, contrast (CON), correlation (COR), energy (EN), homogeneity (HO), entropy (ENT), variance (VAR), mean (ME), and Dissimilarity (DIS)—and were employed to develop the individual tree biomass model [55].

2.7. Establishment of the Individual Tree AGB Model

2.7.1. Feature Selection of Variables of Interest

The boruta algorithm was used to select the features related to the individual tree AGB [56]. The algorithm adds shaded features to the original dataset, compares the original features with the shaded features, and gradually removes non-significant features through multiple iterations and hypothesis testing. The Boruta algorithm fully considers the nonlinear relationships and interactions among variables while reducing the influence of manually set thresholds, making the feature selection process more robust and comprehensive. In this study, the Boruta algorithm was executed with 100 iterations (maxRuns = 100) and a significance threshold of p < 0.05.

2.7.2. RF Model

RF is an ensemble learning method based on decision trees that enhances a model’s generalization ability and robustness by constructing multiple decision trees and aggregating their predictions through voting [57]. RF can effectively handle nonlinear relationships, reduce overfitting, and perform well with high-dimensional data, which is why it is widely used in biomass estimation and other ecological modeling tasks. The Random Forest parameters were optimized using a grid-search strategy based on out-of-bag (OOB) error minimization. ntree values ranged from 100 to 1000 and mtry from 2 to 12. The optimal configuration was selected when OOB error stabilized, balancing accuracy and computational efficiency.

2.7.3. Calculating SHAP Values to Explain Feature Contributions

To further enhance the interpretability of the model, this study employed the SHAP method to analyze the feature importance of the RF regression model. The SHAP method is based on principles from game theory and quantifies the impact of each feature on the model’s prediction by calculating its marginal contribution across different prediction scenarios [58,59,60,61]. SHAP plots display the feature importance of different individuals, visually reflecting the direction and magnitude of each variable’s contribution to individual tree biomass estimation. Additionally, SHAP can reveal the nonlinear relationships and interactions between features and the prediction results, providing a more comprehensive basis for the scientific interpretation and practical application of biomass estimation models.

2.8. Accuracy Verification

2.8.1. Verification of Individual Tree Detection Accuracy

The accuracy of individual tree detection is measured by calculating Recall, Precision, and F1-score, with the following formulas
P r e c i s i o n = P t P t + P f
R e c a l l = P t P t + N f
F 1 - score = 2 P r e c i s i o n × R e c a l l P r e c i s i o n + R e c a l l
where P t is the number of correctly detected tree crowns, P f is the number of crowns incorrectly identified as trees, and N f is the number of missed tree crowns. The metrics assess the proportion of detected crowns that are actually trees, representing the ratio of correctly detected crowns within the actual tree crowns. The F1-score, which combines both Precision and Recall, provides a more comprehensive evaluation of the detection model’s performance. It balances the trade-off between Recall and Precision, offering a more holistic assessment of the model’s effectiveness.

2.8.2. Validation of Individual Tree AGB Estimation

The performance of the RF model is evaluated using 5-fold cross-validation. And the Coefficient of Determination (R2), RMSE, and MAE were calculated to evaluate the individual tree AGB mapping results.
R 2 = 1 i = 1 n y i y ^ i 2 i = 1 n y i y ¯ 2
R M S E = 1 n i = 1 n y i y ^ i 2
M A E = 1 n i = 1 n y i y ^ i
where y i is the observed AGB, y ^ i is the predicted AGB value predicted, y ¯ is the mean of the observations, and n is the number of samples. R2 reflects the model’s ability to explain biomass variation, and the RMSE further quantifies the magnitude of the error, giving it a more intuitive physical meaning.

3. Results

3.1. Individual Tree Detection Results

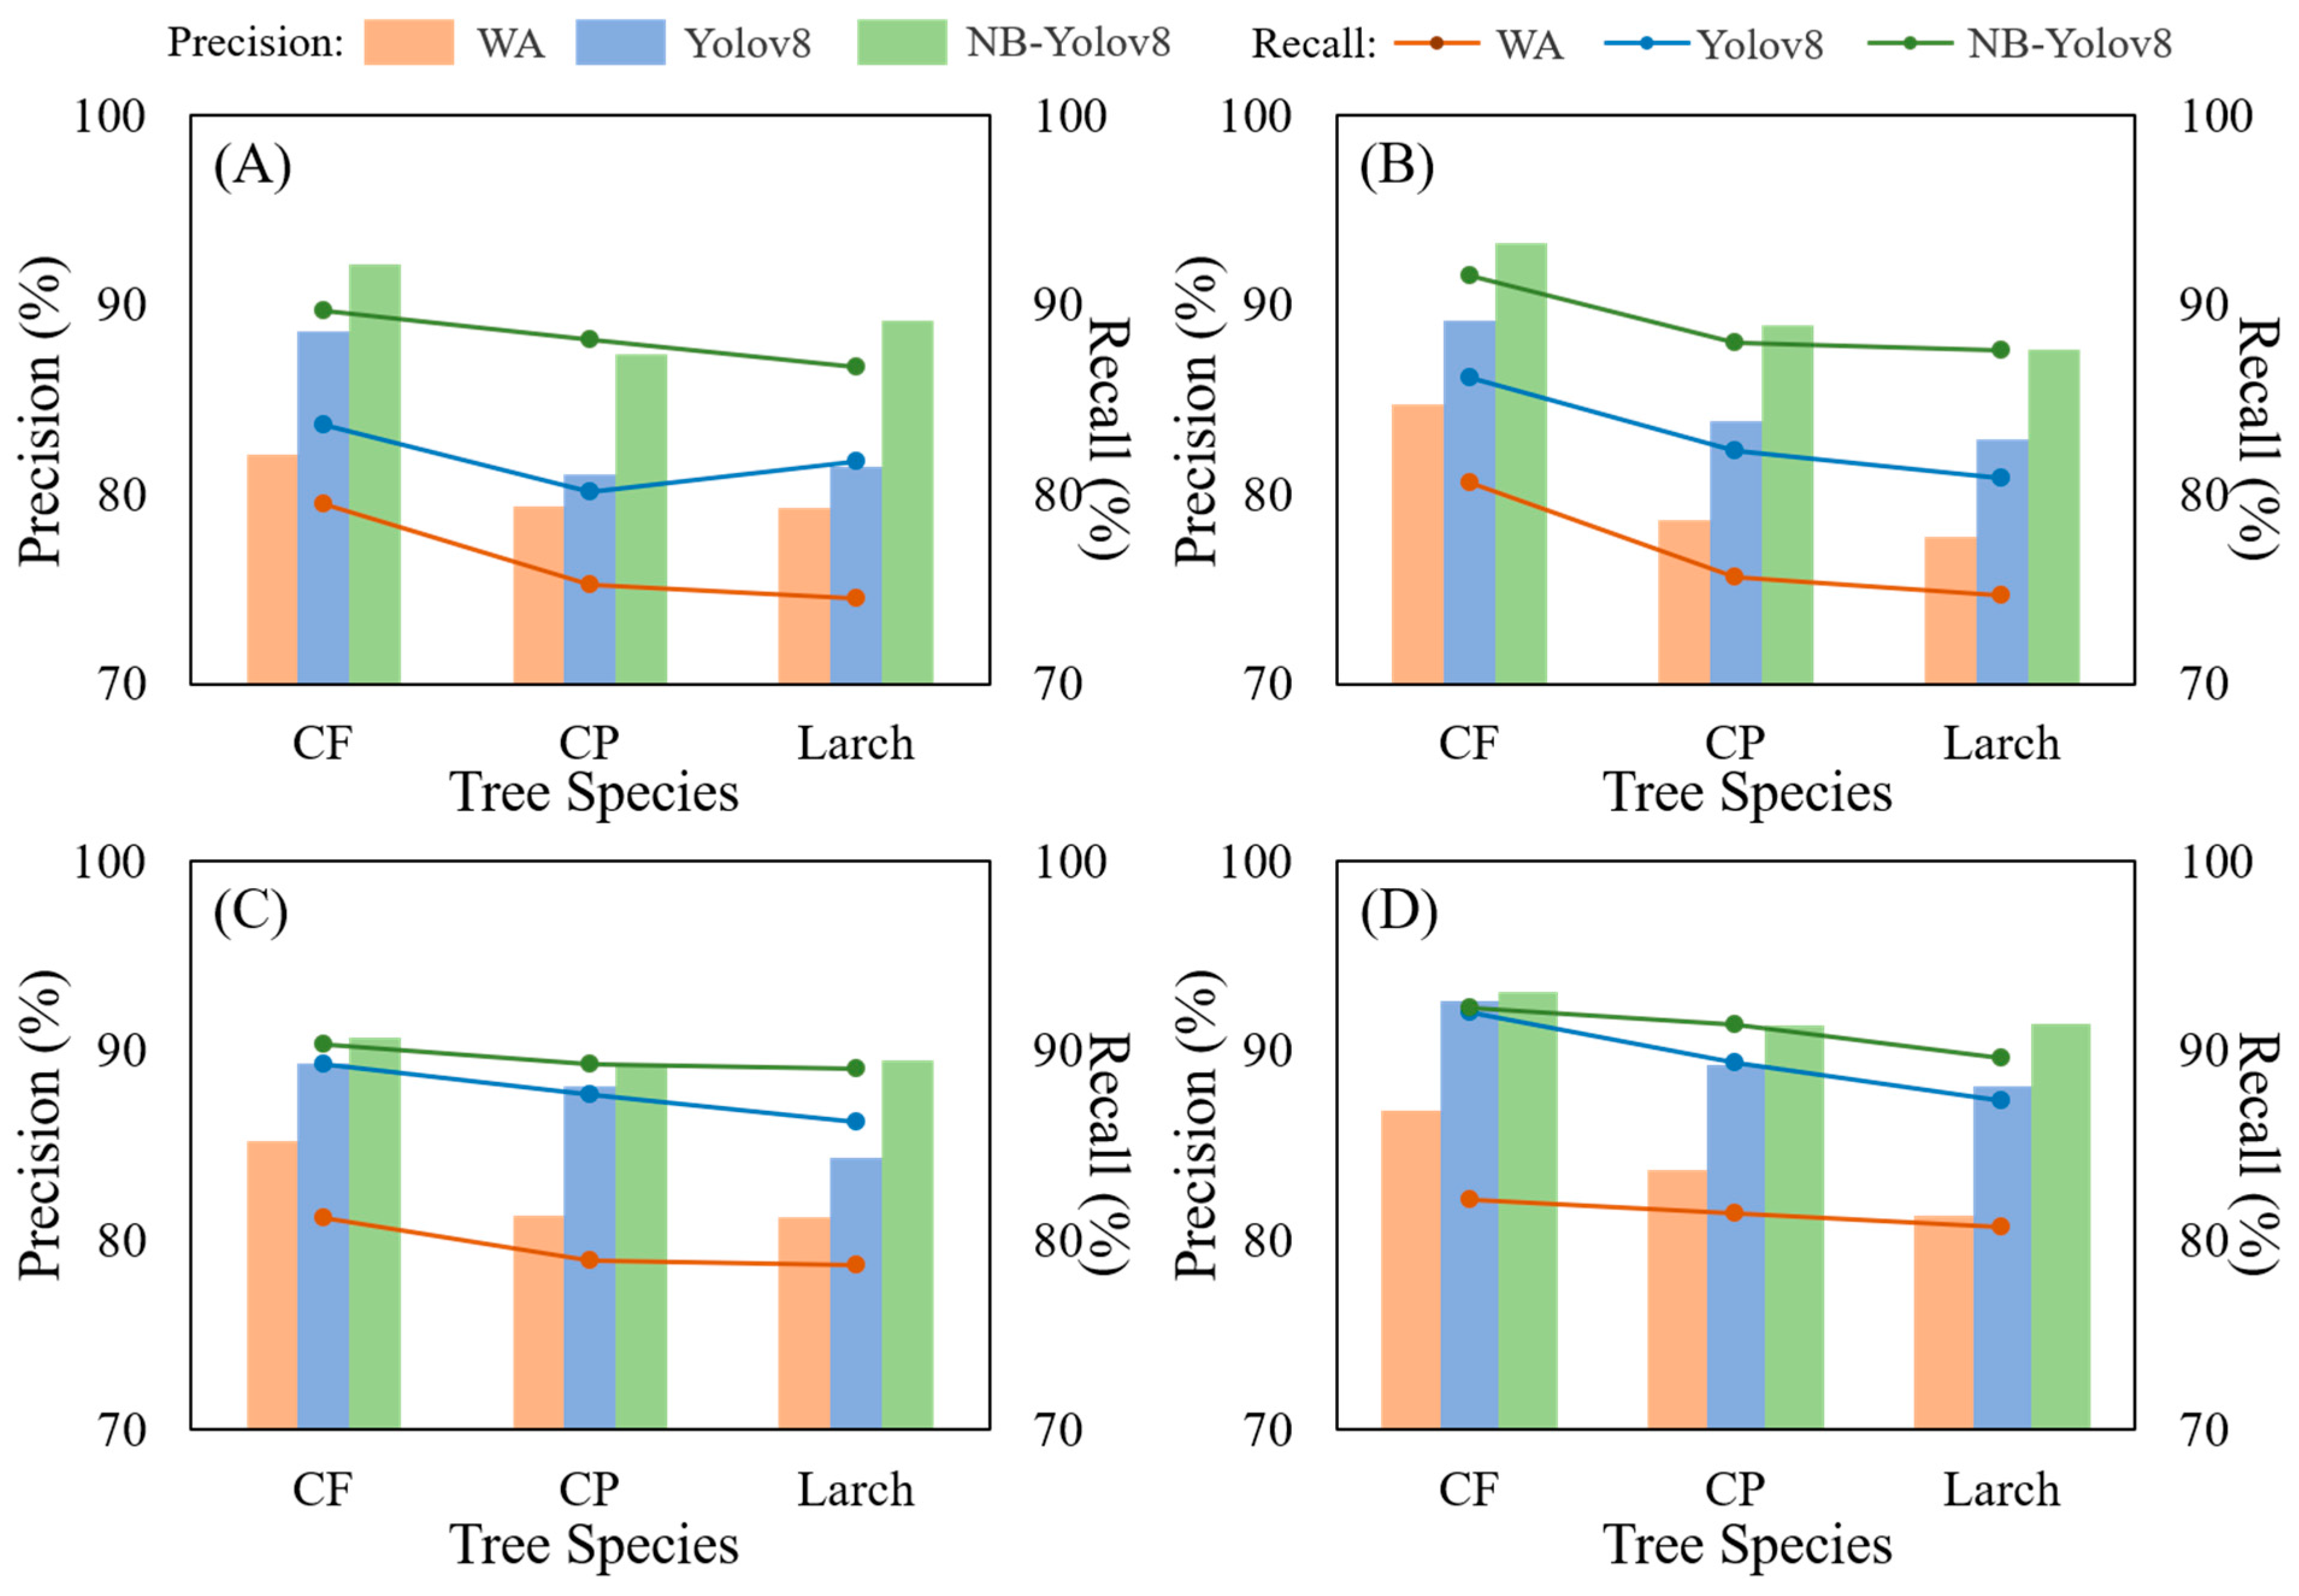
This study compares the performance of WA, YOLOv8, and NB-YOLOv8 model in detecting individual trees across different species (CF, CP, and Larch) and diameter classes (Figure 4). The results indicate that the NB-YOLOv8 model performs best across all diameter classes, with an average precision of 92.3% and recall of 90.6%, which represents an increase of 4.8% and 4.2%, respectively, compared to the original YOLOv8, and an increase of 12.4% and 11.7% compared to the watershed algorithm. Particularly in the small diameter class (5–10 cm), the advantages of the improved YOLOv8 model are even more pronounced. For example, in the case of Chinese pine, its precision and recall increased by 10.2% and 17.1%, respectively, compared to the watershed algorithm, and by 7.8% and 9.9% compared to the original YOLOv8. The results demonstrate that the NB-YOLOv8 model effectively suppresses background noise interference from low shrubs, enhances adaptability to complex canopy structures, and significantly reduces the missed detection rate of small diameter trees.
The detection accuracy for all diameter classes of the three tree species is summarized in Table 4. NB-YOLOv8 demonstrates the best performance in detecting CF, CP, and Larch, with an F1-Score ranging from 88.83% to 91.63%, showing an improvement of 2.79% to 4.69% compared to YOLOv8 and 8.89% to 10.5% compared to the WA. Moreover, the detection accuracy of the tree crowns varies among the three species. The accuracy of CF is the highest, with precision ranging from 84.74% to 92.31%, which is 3.09% to 5.73% higher than that of CP and larch. Notably, in the detection results from NB-YOLOv8, the Precision differences between the three species range from 0.18% to 3.06%, which is lower than that observed in WA and YOLOv8. The results suggest that NB-YOLOv8 not only improves the detection accuracy of tree species but also significantly reduces the differences between species, demonstrating its robustness and superiority across multiple species and diameter classes.

3.2. Estimation Results of Individual Tree AGB

RF models were established using four variable combinations to estimate individual tree biomass, with R2 and RMSE statistics provided in Table 5. When modeling with only SF, the model performed the worst, with R2 ranging from 0.14 to 0.37 and RMSE ranging from 68.17 kg to 141.86 kg. The accuracy when using TF modeling was significantly higher than that of SF, with R2 ranging from 0.25 to 0.65 and RMSE ranging from 57.34 kg to 106.90 kg. After combining SF and TF, the model showed a slight improvement, with R2 increasing by 0.02 to 0.04 compared to the model built using TF alone. For the three tree species, the best estimation accuracy was achieved when CHM was incorporated into the RF model, with R2 values reaching 0.65, 0.67, and 0.76, respectively, and RMSE values reduced to 56.91 kg, 105.03 kg, and 44.98 kg, respectively. The results indicate that compared to SF, CHM and high-resolution TF are more suitable for individual tree-level AGB mapping.
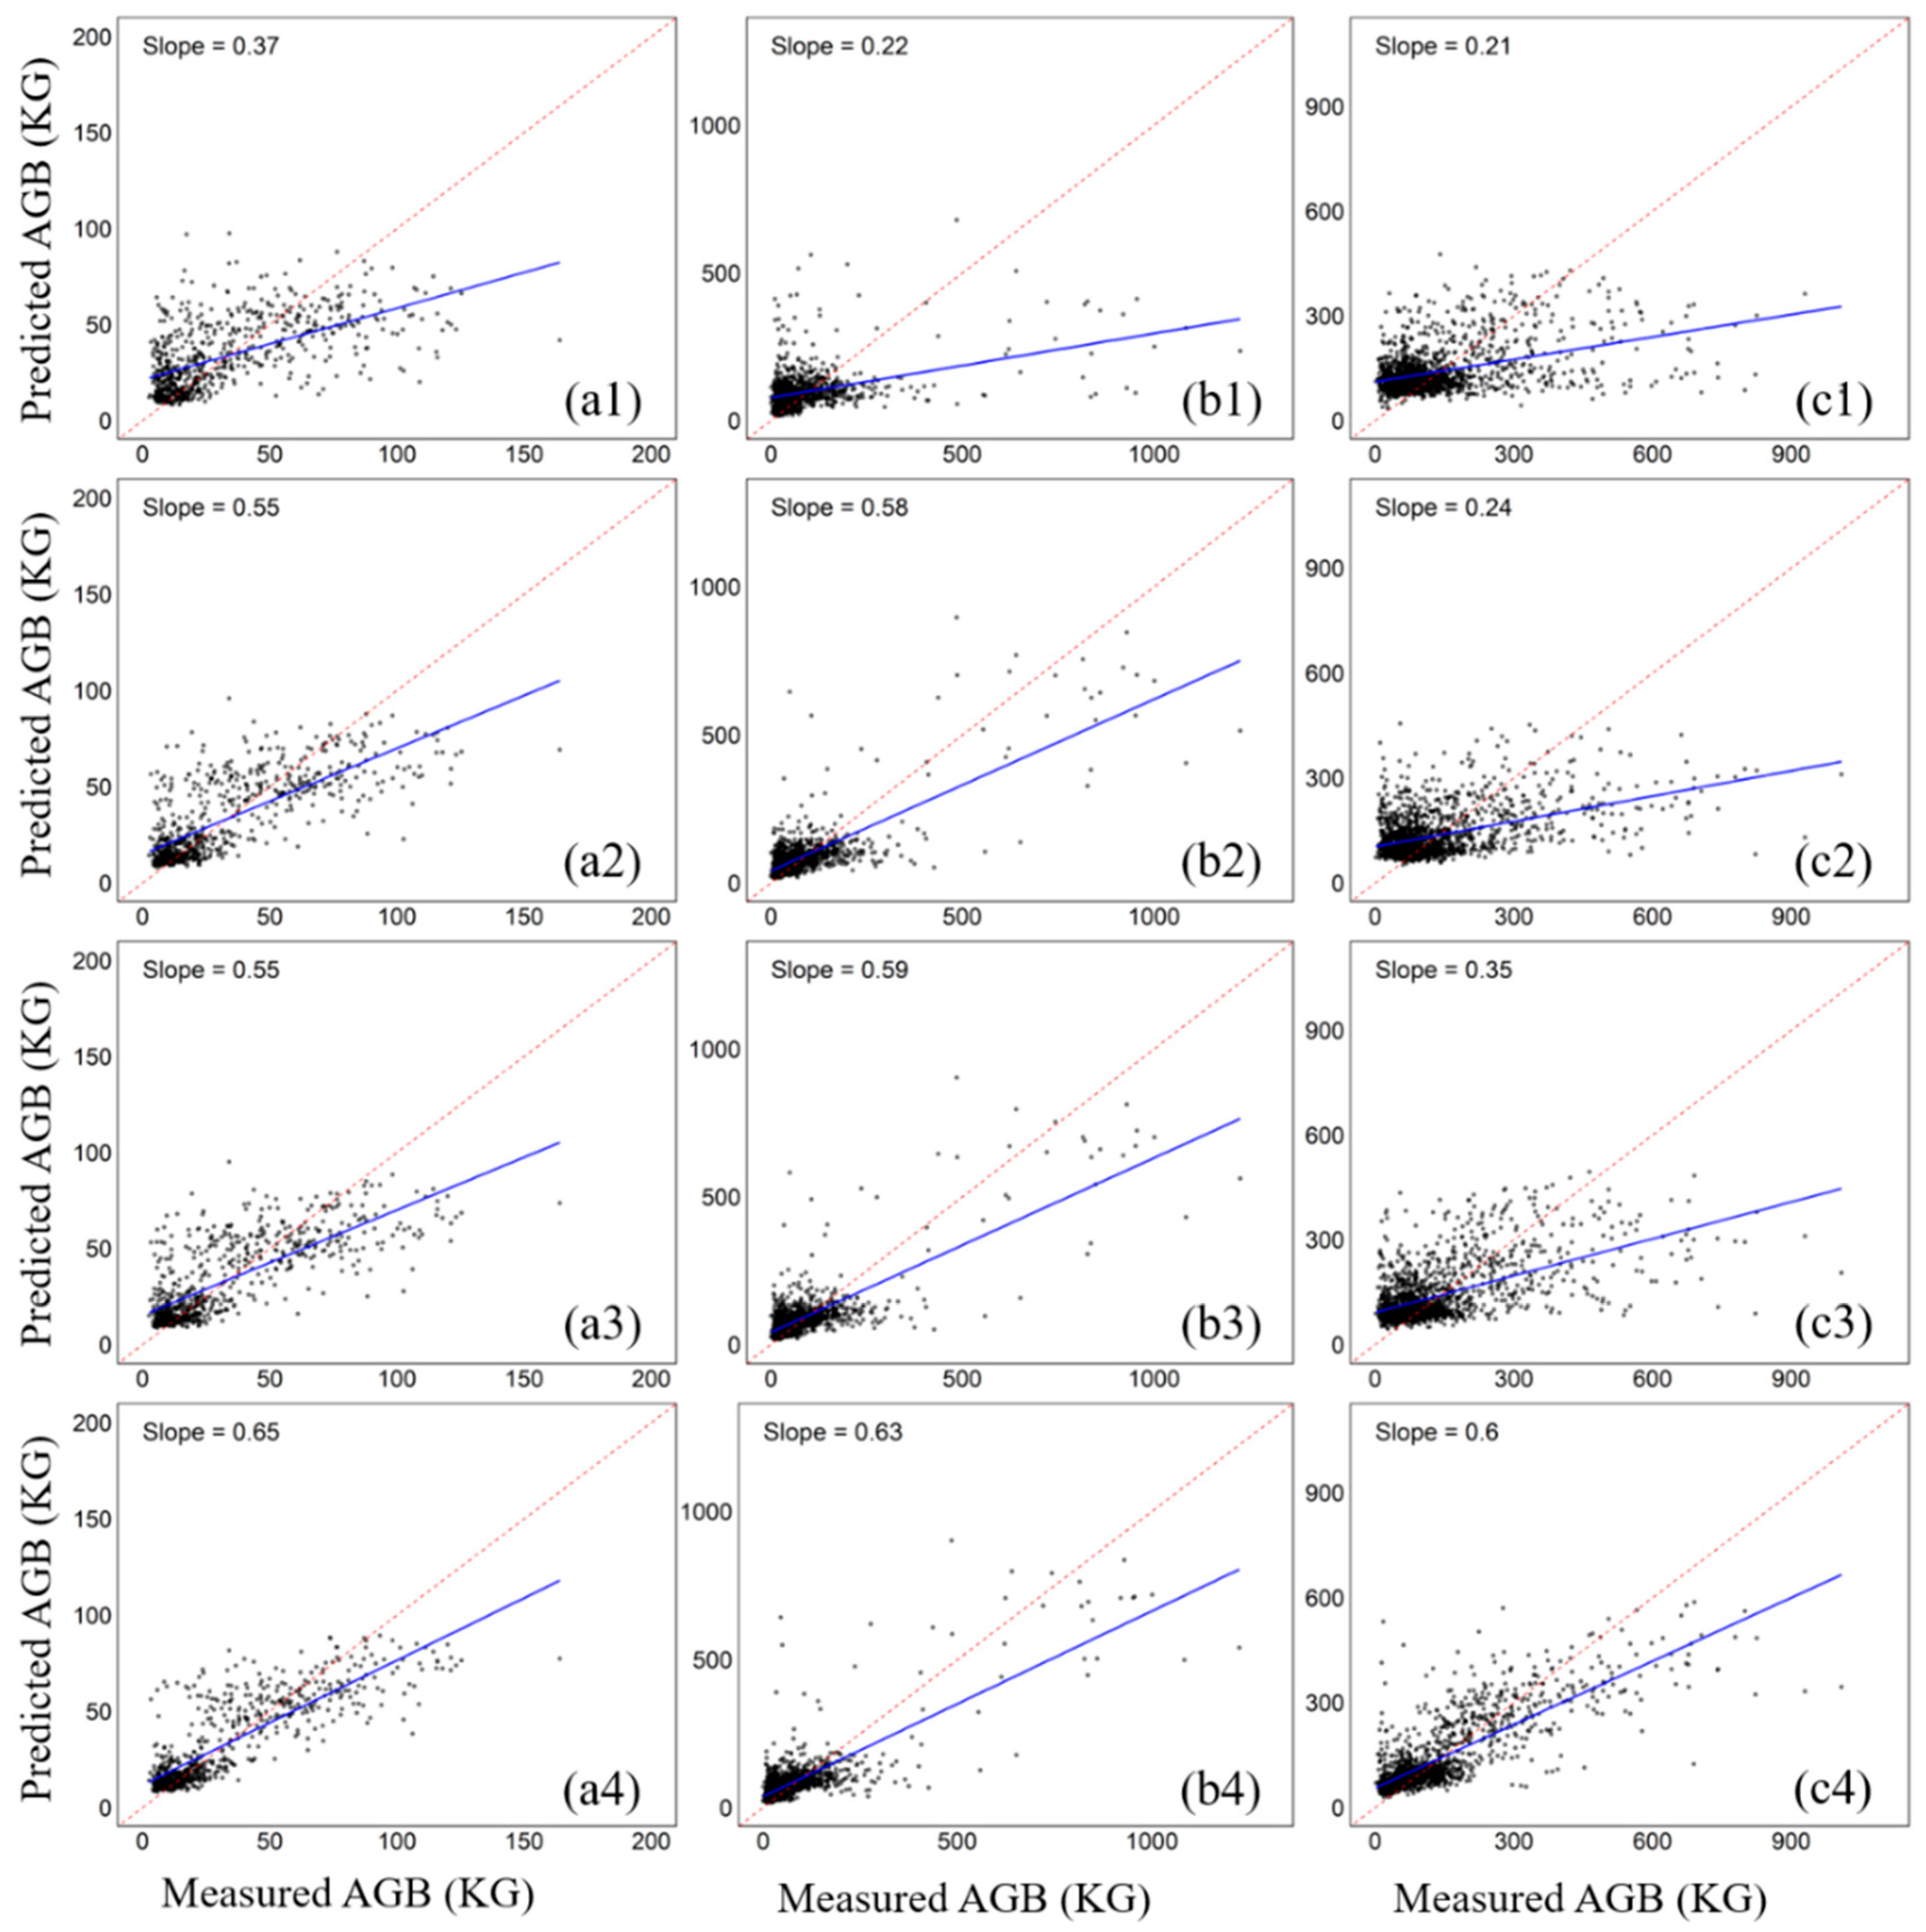
To further analyze the contribution of SF, TF, and CHM to the estimation of individual tree AGB, scatter plots of measured AGB and predicted AGB were plotted (Figure 5). As shown in Figure 5, all results were influenced by saturation, which led to the underestimation of AGB for higher samples. The slope of the fitted line was calculated to quantify the impact of saturation, with a larger slope indicating a smaller effect of saturation. When modeling with only SF, the slope ranged from 0.21 to 0.37. After adding TF to the model, the slope increased to between 0.35 and 0.59. For AGB estimation using the combination of SF, TF, and CHM, the slope significantly improved for all three tree species, with slopes increasing to 0.65 for Larch, 0.63 for CP, and 0.60 for CF. These results further confirm the potential of texture features from ultra-high resolution UAV images and CHM in mapping individual tree AGB.

3.3. Importance and SHAP Values of Variable

According to the RF model, IncNodePurity was outputted to indicate the importance of the three variables SF, TF, and CHM (Figure 6). For all three species, CHM was the most important of all variables, with a much larger IncNodePurity than SF and TF. In particular, for CF, the IncNodePurity of CHM was greater than 5 × 10⁶, compared to the second-ranked G_ME, which was less than 2 × 10⁶. In addition, TF from G and R was more important than SF. The results further confirmed the contribution of CHM and TF to AGB at the individual tree-level.
Figure 7 shows the sources and details of feature impacts that are SHAP values for features predicted by the AGB for each instance. The SHAP values of CHM are the highest in all three tree species and are distributed between 0 and 10 in almost all samples, indicating a positive effect of CHM on AGB estimation, which is consistent with the reality that higher CHM indicates greater AGB. It can also be observed that for C.P, R_ME has a large variation in SHAP values across samples, suggesting that its influence on the prediction results in different individuals varies greatly, and there may be interaction or nonlinear effects. In addition, it was found that features with higher importance may not have greater SHAP values. For example, in the larch sample, ND21 ranked 8th in importance, but the absolute value of its SHAP value was significantly larger than that of other features except CHM. This suggests that its effect was particularly significant in some samples, and that there may be interactions or conditional dependencies with other variables.

3.4. Individual Tree AGB Mapping in Sample Site

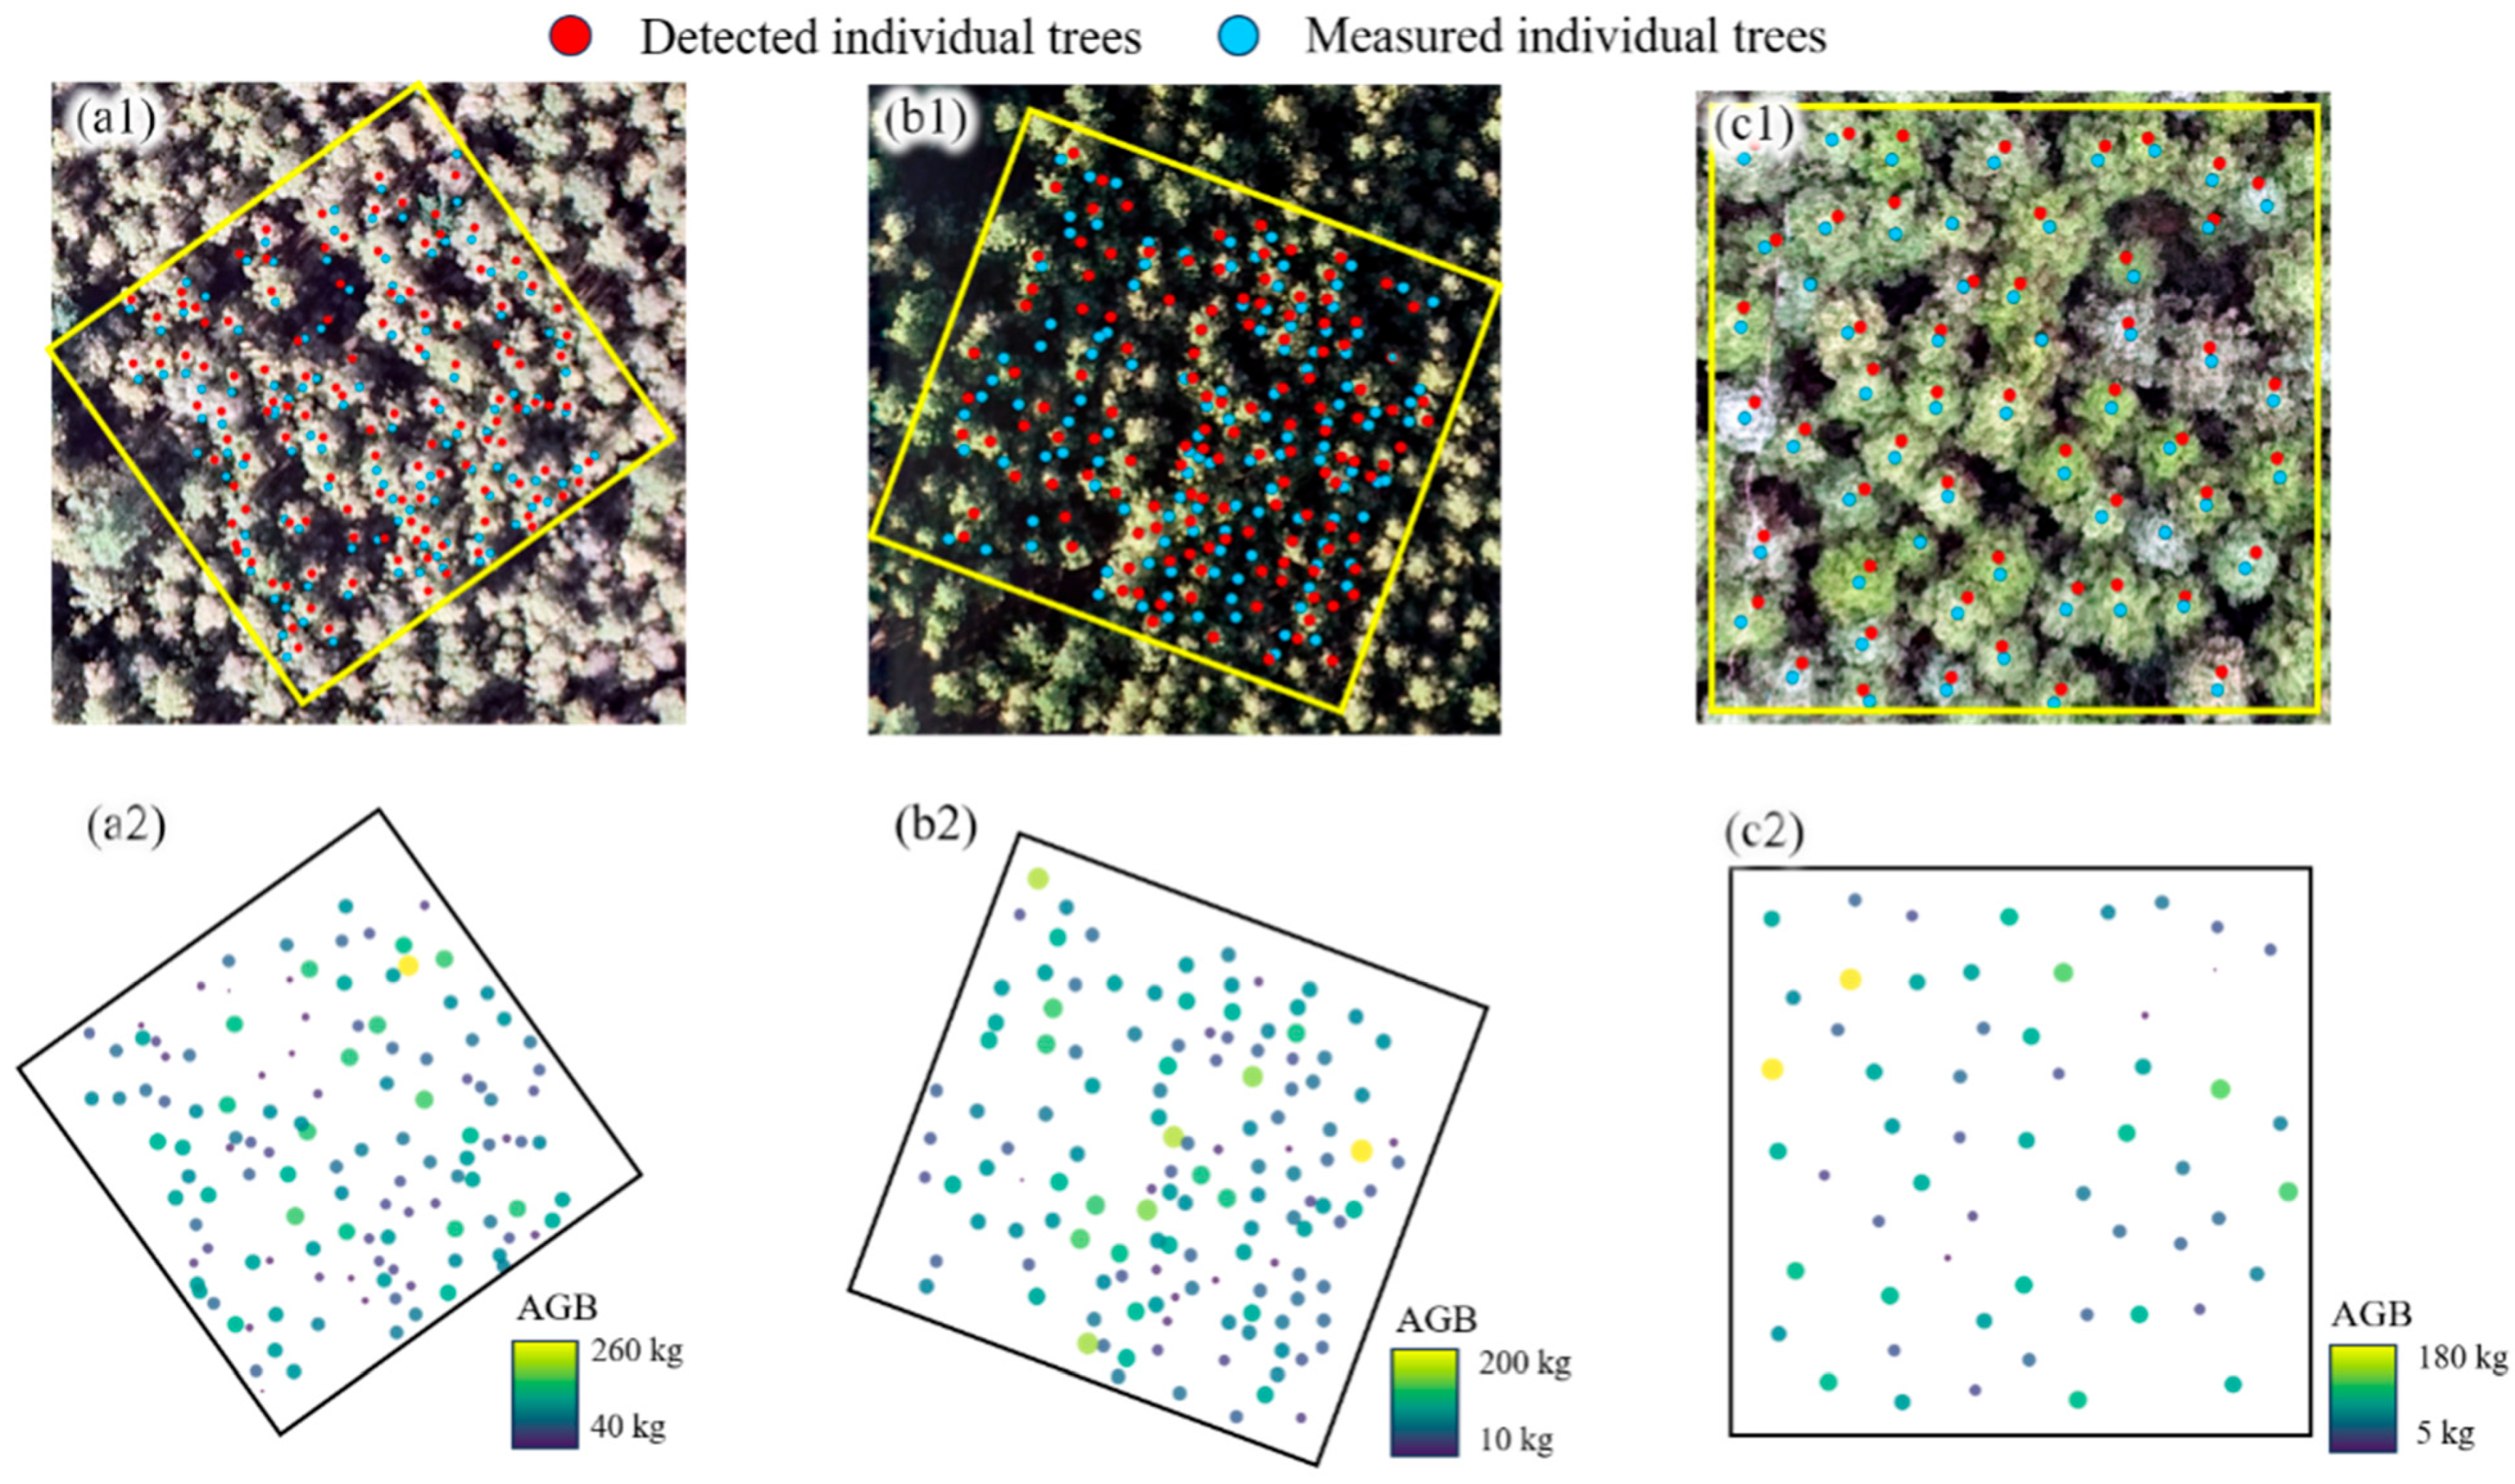
The results of detecting individual tree targets based on the NB_YOLOv8 model and estimating the spatial distribution of individual tree AGBs based on the RF model are shown in Figure 8, respectively (one sample site for each tree species is exemplified). Figure 8(a1,b1,c1) shows the high-resolution UAV images of Larch, CP, and CF sample plots, respectively, and the individual tree targets identified based on the NB-YOLOv8 model are superimposed on the images. The results show that the NB-YOLOv8 algorithm can achieve more accurate detection and localization of individual tree targets in different land types, and can also accurately detect individual small canopies in the shadows. Figure 8(a2,b2,c2) shows the spatial distribution of individual tree AGB estimated using the RF model. Each point corresponds to a detected tree, and its color indicates the estimated AGB of that tree, with a gradient from purple (low) to yellow (high), reflecting the spatial heterogeneity. It can be observed that the AGB shows a certain aggregation and change pattern in space, showing structural differences and species composition differences within the sample site.

4. Discussion

4.1. Attentional Multi-Scale Fusion Boosts Tree Detection in Dense Plantations

The NB-YOLOv8 proposed in this study demonstrated significant advantages in the individual tree detection task, with average precision (92.3%) and recall (90.6%) improved by 12.4% and 11.7% over the traditional watershed algorithm, which validates the potential of deep learning for individual tree detection in high-density plantation forests. This breakthrough is mainly attributed to two mechanisms. Firstly, the NAM attention mechanism effectively suppresses the interference of background noise on small-diameter trees by dynamically enhancing the weight allocation of canopy edge features [46,47]. Secondly, the BiFPN module strengthens the model’s ability to analyze complex canopy overlapping structures through the bidirectional fusion of multi-scale features [43]. Unlike traditional watershed algorithms that rely on the physical segmentation logic of local gradient extremes, NB-YOLOv8 is able to adapt to the morphological heterogeneity of different tree species and growth stages through data-driven feature learning, providing a new tool for accurate monitoring of heterogeneous stands.
In addition, the NB-YOLOv8 model effectively copes with the problem of complex backgrounds and canopy overlap by reducing the leakage rate of small-sized canopies, which further validates the potential of deep learning for application in fine forest stand mapping. It is worth noting that the choice of resolution of the input image directly affects the trade-off of segmentation performance. Although high resolution can enhance the details of small-diameter-order canopy edges, it significantly increases the computational cost and memory consumption, while too low resolution will lead to blurring of texture features and exacerbate the misjudgment of canopy overlapping [62,63,64]. Therefore, it is necessary to develop an adaptive resolution optimization framework in the future, such as dynamically adjusting the image sampling rate based on canopy density, or designing a lightweight feature pyramid network (Light-FPN) to balance accuracy and efficiency.

4.2. Global Versus Local Feature Contributions in Biomass Estimation Using SHAP Analysis

In this study, by introducing the SHAP interpretable analysis method, the heterogeneity of feature contributions in the individual tree AGB estimation model was deeply revealed, which effectively compensated for the limitations of the traditional global feature importance assessment at the interpretation level. In terms of global feature importance, CHM consistently dominated among tree species, and the distribution of its SHAP value further confirmed the significant positive correlation between CHM and biomass. However, the local interpretation results exposed the limitations of traditional global indicators. For example, the average SHAP value of ND21 in larch samples was as high as 0.4, which was significantly higher than its 8th position in the global ranking, suggesting that it has a more prominent contribution to biomass estimation in localized areas or specific growing environments.
This finding challenges the traditional paradigm of relying on global feature importance for variable screening and model construction, and emphasizes that feature weights should have the ability to be dynamically adjusted. The local interpretation of feature contributions using SHAP values reveals the unique role of certain features in specific tree species or samples [59]. This paper suggests constructing an analytical framework based on the coupling of SHAP and random forests to systematically quantify the interaction strengths and nonlinear influence pathways among features, which provides a theoretical basis for the development of adaptive modeling strategies with more ecological process constraints.

4.3. Individual Tree Biomass Mapping for Precision Silviculture and Carbon Management

The hybrid NB-YOLOv8 and random forest model achieved accurate biomass estimation for Chinese fir, Chinese pine, and larch (R2 = 0.65–0.76) by integrating spectral indices, textural metrics, and CHM-derived structural information. However, underestimation of high-biomass trees (fitting slopes < 0.65) revealed the saturation limitation of spectral and structural features, largely due to the attenuation of RGB signals under dense canopies [6,65]. Despite this, the framework demonstrated strong practical value. Spatial heterogeneity mapping enabled high-resolution identification of carbon sink hotspots, supporting differentiated thinning operations and informing the carbon trading market. The model also achieved recall rates above 88% for small-diameter trees, allowing early growth monitoring and providing quantitative indicators for evaluating afforestation project effectiveness.
In addition, the integration of multiple tree-level attributes such as location, crown width, and biomass enabled systematic quantification of stand structural parameters. These results can guide replanting or targeted fertilization in low-biomass areas and protective measures in high-biomass regions to minimize carbon leakage risks [66]. Collectively, these findings highlight the practical potential of tree-level biomass mapping to support both silvicultural decision-making and carbon accounting in plantation forests.
Beyond these application scenarios, the findings of this study also demonstrate broader operational relevance for forest management. The consistent dominance of CHM across species indicates that UAV–LiDAR–based structural metrics can serve as an efficient and cost-effective alternative to extensive ground surveys for routine biomass assessments. The use of the Boruta feature selection algorithm further reduces operational complexity by identifying a concise subset of meaningful predictors rather than relying on a large number of correlated variables. This streamlined workflow enables forestry practitioners to obtain rapid and repeatable stand-level biomass updates, supporting plantation growth monitoring, thinning prioritization, and early detection of productivity declines. Moreover, the framework’s ability to generate tree-level structural attributes enhances its applicability to practical tasks such as replanting decisions, fertilization planning, and carbon stock assessment in regions where satellite remote sensing is limited by cloud cover or insufficient resolution. Overall, these operational advantages highlight the potential of the proposed approach to transition from research applications toward practical forest resource monitoring and management.

4.4. Strengths, Limitations, and Future Prospects

This study demonstrates several strengths for tree-level biomass estimation in dense plantation forests. The integration of LiDAR-derived canopy height models with UAV RGB spectral and textural features enabled the capture of both vertical and horizontal canopy attributes, thereby enhancing predictive performance [2,8]. The advanced crown detection model improved delineation under canopy overlap [9,15], while interpretable analysis provided complementary insights into global and local feature contributions [60,61]. Together, these elements highlight the potential of combining multi-source data with machine learning to advance fine-scale forest monitoring [25]. Although the framework is currently research-oriented, ongoing advances in automated preprocessing, open-source modeling platforms, and cloud-based computing will make it increasingly practical and near-operational for forestry and ecological management.
At the same time, several limitations were identified. The framework was evaluated only in coniferous plantations, and its transferability to mixed or natural stands remains uncertain [7,53]. Reliance on UAV-LiDAR increases acquisition costs and computational demands, which may restrict scalability under resource-limited conditions [13]. Underestimation of high-biomass trees revealed a saturation effect in spectral and structural variables that is difficult to resolve with single-temporal datasets [65]. In addition, the limited number and spatial distribution of ground reference samples may affect model calibration and introduce uncertainties when extrapolating to larger areas [10].
Future research should therefore address these issues. Integrating multi-temporal LiDAR with hyperspectral imagery would help capture synergistic changes in canopy structure and physiology, alleviating the limitations of single-temporal data [3,33]. The transferability of the framework should be tested in more complex forest types, including mixed and natural secondary forests, to assess its generalizability [36]. Incorporating tree-level error propagation into uncertainty assessments is also essential for scaling biomass estimates to the stand level [1]. Finally, the development of lightweight detection architectures and adaptive-resolution strategies would improve computational efficiency and operational feasibility [44,48]. With these improvements, the framework has strong potential to support precision silviculture, forest quality enhancement, and carbon accounting, thereby promoting the transition from experimental studies to operational forestry applications.

5. Conclusions

In this study, we constructed a hybrid framework for individual tree canopy segmentation and biomass estimation in plantation coniferous forests by integrating the improved YOLOv8 model (NB-YOLOv8) with the random forest algorithm, and realized high-precision individual tree-level AGB extraction. The NB-YOLOv8 model improved the performance of canopy segmentation significantly by introducing the NAM attention mechanism and the BiFPN multi-scale feature fusion module, and its average precision (92.3%) and recall (90.6%) were 12.4% and 11.7% higher than the traditional watershed algorithm, especially in the detection of small-diameter-step stands. The random forest model constructed by combining LiDAR point cloud-derived CHM and high-resolution TF achieved high precision (R2 ranges from 0.65 to 076) in individual tree biomass estimation. SHAP analysis further showed that the contributions of remote sensing features in local samples differed significantly from their global importance ranking, challenging the reliability of the traditional feature selection strategy and emphasized the need for local interpretability in ecological models. The framework can provide a scientific basis for differential thinning and carbon sink hotspot management, and promote the in-depth integration of remote sensing technology and precision forestry.

Author Contributions

Y.W.: Writing—original draft, Visualization, Validation, Software, Methodology, Investigation, Formal analysis, Data curation, Conceptualization. Z.L.: Writing—review & editing, Supervision, Investigation, Funding acquisition. J.L. (Jiping Li): Writing—review & editing, Validation, Project administration. H.L.: Resources, Project administration. J.L. (Jiangping Long): Visualization, Software, Investigation. G.M.: Software, Investigation. S.L.: Software, Investigation. Y.L.: Visualization, Methodology, Investigation. All authors have read and agreed to the published version of the manuscript.

Funding

This study was funded by the National Natural Science Foundation of China-Youth Project (4250011621) and the National Natural Science Foundation of Jilin province (YDZJ202501ZYTS477).

Institutional Review Board Statement

Not applicable.

Informed Consent Statement

All authors have read and approved the final manuscript and consent to its publication.

Data Availability Statement

Data will be made available on request.

Conflicts of Interest

The authors declare that they have no known competing financial interests or personal relationships that could have appeared to influence the work reported in this paper.

References

  1. Kankare, V.; Holopainen, M.; Vastaranta, M.; Puttonen, E.; Yu, X.; Hyyppä, J.; Vaaja, M.; Hyyppä, H.; Alho, P. Individual tree biomass estimation using terrestrial laser scanning. ISPRS J. Photogramm. Remote Sens. 2013, 75, 64–75. [Google Scholar] [CrossRef]
  2. Lian, X.; Zhang, H.; Wang, L.; Gao, Y.; Shi, L.; Li, Y.; Chang, J. Combining multisource remote sensing data to calculate individual tree biomass in complex stands. J. Appl. Remote Sens. 2024, 18, 014515. [Google Scholar] [CrossRef]
  3. Qiao, Y.; Zheng, G.; Du, Z.; Ma, X.; Li, J.; Moskal, L.M. Tree-species classification and individual-tree-biomass model construction based on hyperspectral and LiDAR data. Remote Sens. 2023, 15, 1341. [Google Scholar] [CrossRef]
  4. Sarker, L.R.; Nichol, J.E. Improved forest biomass estimates using ALOS AVNIR-2 texture indices. Remote Sens. Environ. 2011, 115, 968–977. [Google Scholar] [CrossRef]
  5. Yang, J.; Cooper, D.J.; Li, Z.; Song, W.; Zhang, Y.; Zhao, B.; Han, S.; Wang, X. Differences in tree and shrub growth responses to climate change in a boreal forest in China. Dendrochronologia 2020, 63, 125744. [Google Scholar] [CrossRef]
  6. Liu, Z.; Ye, Z.; Xu, X.; Lin, H.; Zhang, T.; Long, J. Mapping forest stock volume based on growth characteristics of crown using multi-temporal Landsat 8 OLI and ZY-3 stereo images in planted eucalyptus forest. Remote Sens. 2022, 14, 5082. [Google Scholar] [CrossRef]
  7. Fraser, B.T.; Congalton, R.G.; Ducey, M.J. Quantifying the Accuracy of UAS-Lidar Individual Tree Detection Methods Across Height and Diameter at Breast Height Sizes in Complex Temperate Forests. Remote Sens. 2025, 17, 1010. [Google Scholar] [CrossRef]
  8. Cloutier, M.; Germain, M.; Laliberté, E. Influence of temperate forest autumn leaf phenology on segmentation of tree species from UAV imagery using deep learning. Remote Sens. Environ. 2024, 311, 114283. [Google Scholar] [CrossRef]
  9. Zhou, J.; Chen, X.; Li, S.; Dong, R.; Wang, X.; Zhang, C.; Zhang, L. Multispecies individual tree crown extraction and classification based on BlendMask and high-resolution UAV images. J. Appl. Remote Sens. 2023, 17, 016503. [Google Scholar] [CrossRef]
  10. Sun, Z.; Wang, Y.-F.; Ding, Z.-D.; Liang, R.-T.; Xie, Y.-H.; Li, R.; Li, H.-W.; Pan, L.; Sun, Y.-J. Individual tree segmentation and biomass estimation based on UAV Digital aerial photograph. J. Mt. Sci. 2023, 20, 724–737. [Google Scholar] [CrossRef]
  11. Chuang, H.-Y.; Kiang, J.-F. High-Resolution L-Band TomoSAR Imaging on Forest Canopies with UAV Swarm to Detect Dielectric Constant Anomaly. Sensors 2023, 23, 8335. [Google Scholar] [CrossRef] [PubMed]
  12. Grishin, I.A.; Krutov, T.Y.; Kanev, A.I.; Terekhov, V.I. Individual tree segmentation quality evaluation using deep learning models lidar based. Opt. Mem. Neural Netw. 2023, 32 (Suppl. 2), S270–S276. [Google Scholar] [CrossRef]
  13. Wallace, L.; Lucieer, A.; Watson, C.S. Evaluating tree detection and segmentation routines on very high resolution UAV LiDAR data. IEEE Trans. Geosci. Remote Sens. 2014, 52, 7619–7628. [Google Scholar] [CrossRef]
  14. Saeed, T.; Hussain, E.; Ullah, S.; Iqbal, J.; Atif, S.; Yousaf, M. Performance evaluation of individual tree detection and segmentation algorithms using ALS data in Chir Pine (Pinus roxburghii) forest. Remote Sens. Appl. Soc. Environ. 2024, 34, 101178. [Google Scholar] [CrossRef]
  15. Deng, S.; Jing, S.; Zhao, H. A hybrid method for individual tree detection in broadleaf forests based on UAV-LiDAR data and multistage 3D structure analysis. Forests 2024, 15, 1043. [Google Scholar] [CrossRef]
  16. de Oliveira, P.A.; Conti, L.A.; Neto, F.C.N.; Barcellos, R.L.; Cunha-Lignon, M. Mangrove individual tree detection based on the uncrewed aerial vehicle multispectral imagery. Remote Sens. Appl. Soc. Environ. 2024, 33, 101100. [Google Scholar] [CrossRef]
  17. Jiang, F.; Kutia, M.; Ma, K.; Chen, S.; Long, J.; Sun, H. Estimating the aboveground biomass of coniferous forest in Northeast China using spectral variables, land surface temperature and soil moisture. Sci. Total Environ. 2021, 785, 147335. [Google Scholar] [CrossRef]
  18. Kozniewski, M.; Kolendo, Ł.; Chmur, S.; Ksepko, M. Impact of Parameters and Tree Stand Features on Accuracy of Watershed-Based Individual Tree Crown Detection Method Using ALS Data in Coniferous Forests from North-Eastern Poland. Remote Sens. 2025, 17, 575. [Google Scholar] [CrossRef]
  19. Li, Y.; Xie, D.; Wang, Y.; Jin, S.; Zhou, K.; Zhang, Z.; Li, W.; Zhang, W.; Mu, X.; Yan, G. Individual tree segmentation of airborne and UAV LiDAR point clouds based on the watershed and optimized connection center evolution clustering. Ecol. Evol. 2023, 13, e10297. [Google Scholar] [CrossRef]
  20. Hu, X.; Hu, C.; Han, J.; Sun, H.; Wang, R. Point cloud segmentation for an individual tree combining improved point transformer and hierarchical clustering. J. Appl. Remote Sens. 2023, 17, 034505. [Google Scholar] [CrossRef]
  21. Zheng, J.; Yuan, S.; Li, W.; Fu, H.; Yu, L.; Huang, J. A Review of Individual Tree Crown Detection and Delineation From Optical Remote Sensing Images: Current progress and future. IEEE Geosci. Remote Sens. Mag. 2024, 13, 209–236. [Google Scholar] [CrossRef]
  22. Tolan, J.; Yang, H.-I.; Nosarzewski, B.; Couairon, G.; Vo, H.V.; Brandt, J.; Spore, J.; Majumdar, S.; Haziza, D.; Vamaraju, J.; et al. Very high resolution canopy height maps from RGB imagery using self-supervised vision transformer and convolutional decoder trained on aerial lidar. Remote Sens. Environ. 2024, 300, 113888. [Google Scholar] [CrossRef]
  23. Bolat, F. Assessing regional variation of individual-tree diameter increment of Crimean pine and investigating interactive effect of competition and climate on this species. Environ. Monit. Assess. 2025, 197, 24. [Google Scholar] [CrossRef]
  24. Zhou, M.; Liu, S.; Li, J. Multi-scale Forest Flame Detection Based on Improved and Optimized YOLOv5. Fire Technol. 2023, 59, 3689–3708. [Google Scholar] [CrossRef]
  25. Ferreira, M.P.; de Almeida, D.R.A.; Papa, D.D.A.; Minervino, J.B.S.; Veras, H.F.P.; Formighieri, A.; Santos, C.A.N.; Ferreira, M.A.D.; Figueiredo, E.O.; Ferreira, E.J.L. Individual tree detection and species classification of Amazonian palms using UAV images and deep learning. For. Ecol. Manag. 2020, 475, 118397. [Google Scholar] [CrossRef]
  26. Chen, W.; Guan, Z.; Gao, D. Att-Mask R-CNN: An individual tree crown instance segmentation method based on fused attention mechanism. Can. J. For. Res. 2024, 54, 825–838. [Google Scholar] [CrossRef]
  27. Mustafic, S.; Hirschmugl, M.; Perko, R.; Wimmer, A. Deep Learning for Improved Individual Tree Detection from Lidar Data. In Proceedings of the IGARSS 2022–2022 IEEE International Geoscience and Remote Sensing Symposium, Kuala Lumpur, Malaysia, 17–22 July 2022; IEEE: Piscataway, NJ, USA; pp. 3516–3519. [Google Scholar]
  28. Kwon, R.; Ryu, Y.; Yang, T.; Zhong, Z.; Im, J. Merging multiple sensing platforms and deep learning empowers individual tree mapping and species detection at the city scale. ISPRS J. Photogramm. Remote Sens. 2023, 206, 201–221. [Google Scholar] [CrossRef]
  29. Zhao, H.; Morgenroth, J.; Pearse, G.; Schindler, J. A systematic review of individual tree crown detection and delineation with convolutional neural networks (CNN). Curr. For. Rep. 2023, 9, 149–170. [Google Scholar] [CrossRef]
  30. Hao, Z.; Post, C.J.; Mikhailova, E.A.; Lin, L.; Liu, J.; Yu, K. How does sample labeling and distribution affect the accuracy and efficiency of a deep learning model for individual tree-crown detection and delineation. Remote Sens. 2022, 14, 1561. [Google Scholar] [CrossRef]
  31. Hayashi, Y.; Deng, S.; Katoh, M.; Nakamura, R. Individual tree canopy detection and species classification of conifers by deep learning. Jpn. Soc. For. Plan. 2021, 55, 3–22. [Google Scholar] [CrossRef] [PubMed]
  32. Xu, J.; Su, M.; Sun, Y.; Pan, W.; Cui, H.; Jin, S.; Zhang, L.; Wang, P. Tree Crown Segmentation and Diameter at Breast Height Prediction Based on BlendMask in Unmanned Aerial Vehicle Imagery. Remote Sens. 2024, 16, 368. [Google Scholar] [CrossRef]
  33. Xu, L.; Yu, J.; Shu, Q.; Luo, S.; Zhou, W.; Duan, D. Forest aboveground biomass estimation based on spaceborne LiDAR combining machine learning model and geostatistical method. Front. Plant Sci. 2024, 15, 1428268. [Google Scholar] [CrossRef]
  34. Zadbagher, E.; Marangoz, A.; Becek, K. Estimation of above-ground biomass using machine learning approaches with InSAR and LiDAR data in tropical peat swamp forest of Brunei Darussalam. iForest-Biogeosci. For. 2024, 17, 172–179. [Google Scholar] [CrossRef]
  35. Wu, C.; Pang, L.; Jiang, J.; An, M.; Yang, Y. Machine learning model for revealing the characteristics of soil nutrients and aboveground biomass of Northeast Forest, China. Nat. Environ. Pollut. Technol. 2020, 19, 481–492. [Google Scholar] [CrossRef]
  36. Ali, N.; Khati, U. Forest aboveground biomass and forest height estimation over a sub-tropical forest using machine learning algorithm and synthetic aperture radar data. J. Indian Soc. Remote Sens. 2024, 52, 771–786. [Google Scholar] [CrossRef]
  37. Singh, C.; Karan, S.K.; Sardar, P.; Samadder, S.R. Remote sensing-based biomass estimation of dry deciduous tropical forest using machine learning and ensemble analysis. J. Environ. Manag. 2022, 308, 114639. [Google Scholar] [CrossRef] [PubMed]
  38. Liu, Z.; Long, J.; Lin, H.; Du, K.; Xu, X.; Liu, H.; Yang, P.; Zhang, T.; Ye, Z. Interpretation and map** tree crown diameter using spatial heterogeneity in relation to the radiative transfer model extracted from GF-2 images in planted boreal forest ecosystems. Remote Sens. 2023, 15, 1806. [Google Scholar] [CrossRef]
  39. Liu, Z.; Long, J.; Lin, H.; Xu, X.; Liu, H.; Zhang, T.; Ye, Z.; Yang, P. Combination Strategies of Variables with Various Spatial Resolutions Derived from GF-2 Images for Mapping Forest Stock Volume. Forests 2023, 14, 1175. [Google Scholar] [CrossRef]
  40. Yang, Y.; Geng, S.; Cheng, C.; Yang, X.; Wu, P.; Han, X.; Zhang, H. An Edge Algorithm for Assessing the Severity of Insulator Discharges Using a Lightweight Improved YOLOv8. J. Electr. Eng. Technol. 2024, 20, 807–816. [Google Scholar] [CrossRef]
  41. Wang, X.; Liu, J. Vegetable disease detection using an improved YOLOv8 algorithm in the greenhouse plant environment. Sci. Rep. 2024, 14, 4261. [Google Scholar] [CrossRef]
  42. Zhang, Q.; Wang, C.; Li, H.; Shen, S.; Cao, W.; Li, X.; Wang, D. Improved YOLOv8-CR network for detecting defects of the automotive MEMS pressure sensors. IEEE Sens. J. 2024, 24, 26935–26945. [Google Scholar] [CrossRef]
  43. Liu, H.; Lu, G.; Li, M.; Su, W.; Liu, Z.; Dang, X.; Zang, D. High-precision real-time autonomous driving target detection based on YOLOv8. J. Real-Time Image Process. 2024, 21, 174. [Google Scholar] [CrossRef]
  44. Chu, Y.; Yu, X.; Rong, X. A Lightweight Strip Steel Surface Defect Detection Network Based on Improved YOLOv8. Sensors 2024, 24, 6495. [Google Scholar] [CrossRef] [PubMed]
  45. Xu, C.; Liao, Y.; Liu, Y.; Tian, R.; Guo, T. Lightweight rail surface defect detection algorithm based on an improved YOLOv8. Measurement 2025, 242, 115922. [Google Scholar] [CrossRef]
  46. Xu, X.; Chen, C.; Meng, K.; Lu, L.; Cheng, X.; Fan, H. NAMRTNet: Automatic classification of sleep stages based on improved ResNet-TCN network and attention mechanism. Appl. Sci. 2023, 13, 6788. [Google Scholar] [CrossRef]
  47. Tao, T.; Wei, X. STBNA-YOLOv5: An Improved YOLOv5 Network for Weed Detection in Rapeseed Field. Agriculture 2024, 15, 22. [Google Scholar] [CrossRef]
  48. Liu, Y.; Zheng, Y.; Wei, T.; Li, Y. Lightweight algorithm based on you only look once version 5 for multiple class defect detection on wind turbine blade surfaces. Eng. Appl. Artif. Intell. 2024, 138, 109422. [Google Scholar] [CrossRef]
  49. Shui, Y.; Yuan, K.; Wu, M.; Zhao, Z. Improved Multi-Size, Multi-Target and 3D Position Detection Network for Flowering Chinese Cabbage Based on YOLOv8. Plants 2024, 13, 2808. [Google Scholar] [CrossRef]
  50. Liu, Z.; Long, J.; Lin, H.; Sun, H.; Ye, Z.; Zhang, T.; Yang, P.; Ma, Y. Mapping and analyzing the spatiotemporal dynamics of forest aboveground biomass in the ChangZhuTan urban agglomeration using a time series of Landsat images and meteorological data from 2010 to 2020. Sci. Total Environ. 2024, 944, 173940. [Google Scholar] [CrossRef]
  51. Reitberger, J.; Krzystek, P.; Stilla, U. Analysis of full waveform LIDAR data for the classification of deciduous and coniferous trees. Int. J. Remote Sens. 2008, 29, 1407–1431. [Google Scholar] [CrossRef]
  52. Xu, X.; Lin, H.; Liu, Z.; Ye, Z.; Li, X.; Long, J. A combined strategy of improved variable selection and ensemble algorithm to map the growing stem volume of planted coniferous forest. Remote Sens. 2021, 13, 4631. [Google Scholar] [CrossRef]
  53. Atanasov, A.Z.; Evstatiev, B.I.; Vladut, V.N.; Biris, S.-S. A Novel Algorithm to Detect White Flowering Honey Trees in Mixed Forest Ecosystems Using UAV-Based RGB Imaging. Agriengineering 2024, 6, 95–112. [Google Scholar] [CrossRef]
  54. Haralick, R.M.; Shanmugam, K.; Dinstein, I. Textural features for image classification. IEEE Trans. Syst. Man Cybern. 1973, SMC-3, 610–621. [Google Scholar] [CrossRef]
  55. Huang, Z.-K.; Li, P.-W.; Hou, L.-Y. Segmentation of textures using PCA fusion based Gray-Level Co-Occurrence Matrix features. In Proceedings of the 2009 International Conference on Test and Measurement (ICTM), Hong Kong, China, 5–6 December 2009; IEEE: Piscataway, NJ, USA; pp. 103–105. [Google Scholar]
  56. Lyu, C.; Joehanes, R.; Huan, T.; Levy, D.; Li, Y.; Wang, M.; Liu, X.; Liu, C.; Ma, J. Enhancing selection of alcohol consumption-associated genes by random forest. Br. J. Nutr. 2024, 131, 2058–2067. [Google Scholar] [CrossRef] [PubMed]
  57. Breiman, L. Random forests. Mach. Learn. 2001, 45, 5–32. [Google Scholar] [CrossRef]
  58. Parsa, A.B.; Movahedi, A.; Taghipour, H.; Derrible, S.; Mohammadian, A. (Kouros) Toward safer highways, application of XGBoost and SHAP for real-time accident detection and feature analysis. Accid. Anal. Prev. 2020, 136, 105405. [Google Scholar] [CrossRef]
  59. Wang, D.; Thunéll, S.; Lindberg, U.; Jiang, L.; Trygg, J.; Tysklind, M. Towards better process management in wastewater treatment plants: Process analytics based on SHAP values for tree-based machine learning methods. J. Environ. Manag. 2022, 301, 113941. [Google Scholar] [CrossRef]
  60. Ekanayake, I.; Meddage, D.; Rathnayake, U. A novel approach to explain the black-box nature of machine learning in compressive strength predictions of concrete using Shapley additive explanations (SHAP). Case Stud. Constr. Mater. 2022, 16, e01059. [Google Scholar] [CrossRef]
  61. Chen, R.R.; Yin, S. The equivalence of uniform and Shapley value-based cost allocations in a specific game. Oper. Res. Lett. 2010, 38, 539–544. [Google Scholar] [CrossRef]
  62. Matsumoto, H.; Ohtani, M.; Washitani, I. Tree crown size estimated using image processing: A biodiversity index for sloping subtropical broad-leaved forests. Trop. Conserv. Sci. 2017, 10, 1940082917721787. [Google Scholar] [CrossRef]
  63. Ke, Y.; Quackenbush, L.J. A comparison of three methods for automatic tree crown detection and delineation from high spatial resolution imagery. Int. J. Remote Sens. 2011, 32, 3625–3647. [Google Scholar] [CrossRef]
  64. Ke, Y.; Quackenbush, L.J. A review of methods for automatic individual tree-crown detection and delineation from passive remote sensing. Int. J. Remote Sens. 2011, 32, 4725–4747. [Google Scholar] [CrossRef]
  65. Gao, S.; Zhong, R.; Yan, K.; Ma, X.; Chen, X.; Pu, J.; Gao, S.; Qi, J.; Yin, G.; Myneni, R.B. Evaluating the saturation effect of vegetation indices in forests using 3D radiative transfer simulations and satellite observations. Remote Sens. Environ. 2023, 295, 113665. [Google Scholar] [CrossRef]
  66. Gougeon, F.A.; Leckie, D.G. Forest Information Extraction from High Spatial Resolution Images Using an Individual Tree Crown Approach; No.BC-X-396; Pacific Forestry Centre, Canadian Forest Service: Victoria, BC, Canada, 2003.
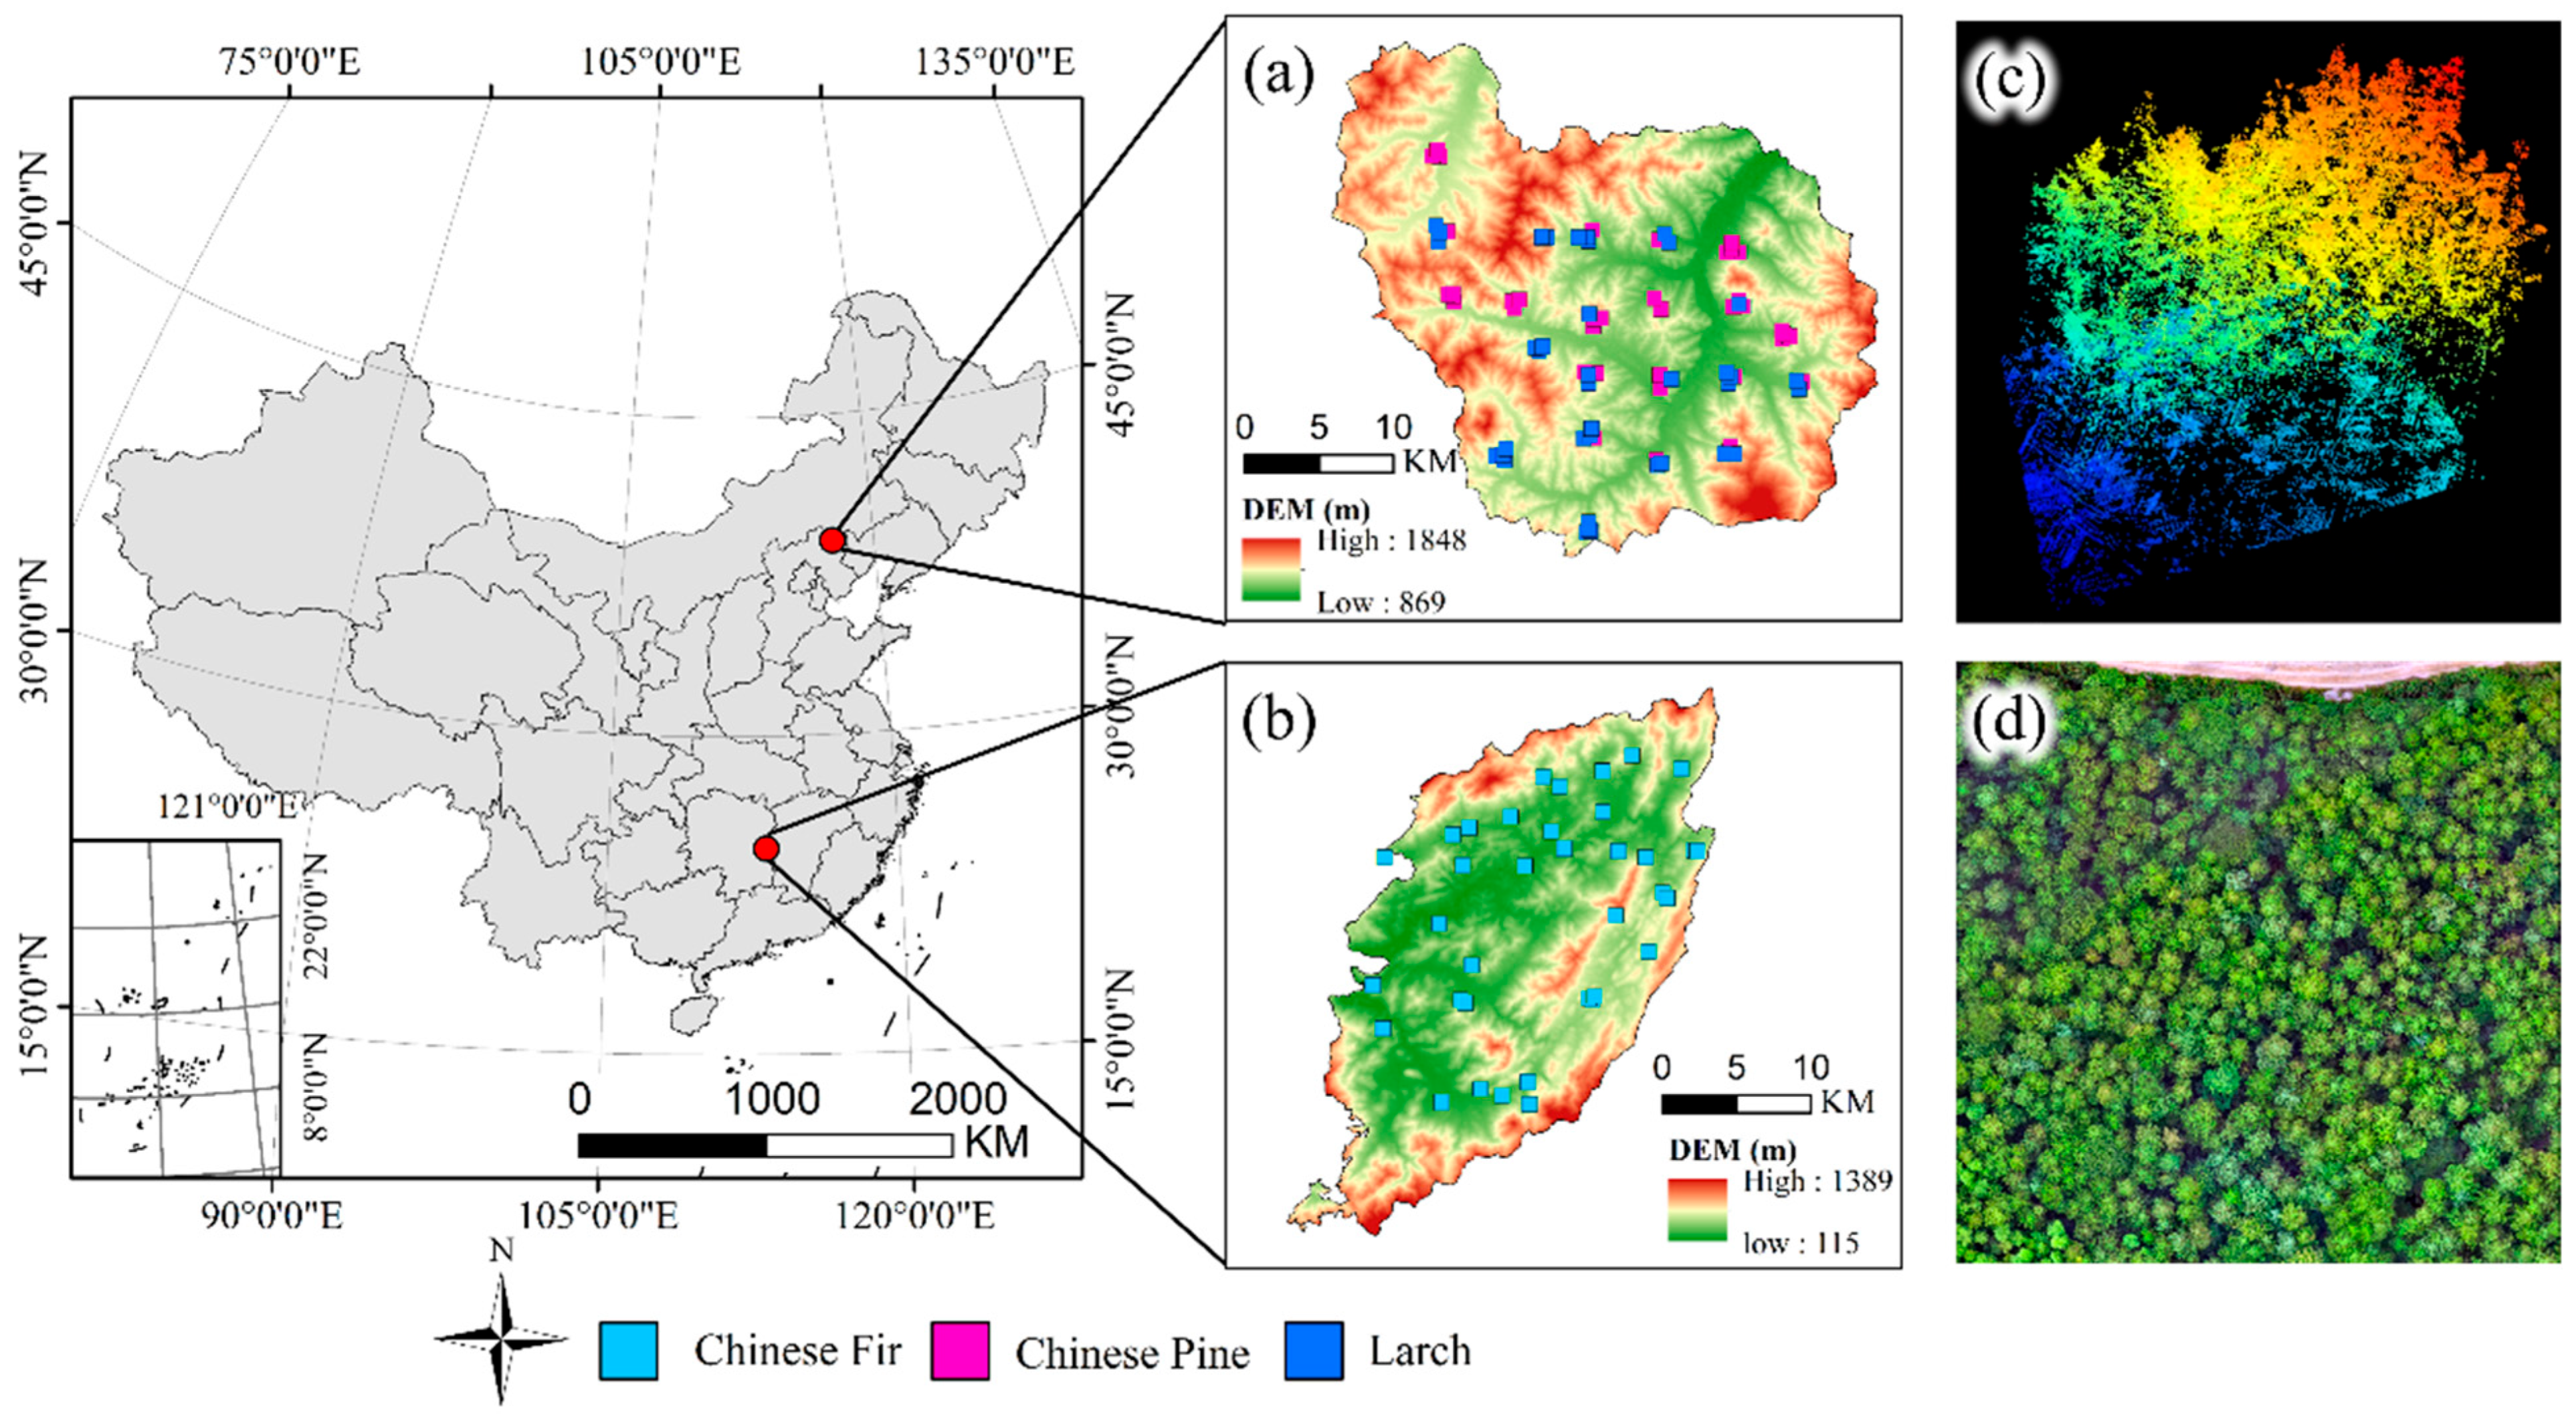
Figure 1. Illustrates the study areas, where (a) represents the Wangyedian Forest Farm, (b) the Huangfengqiao Forest Farm, (c) an example of LiDAR point cloud data, and (d) an example of UAV orthophoto imagery with a spatial resolution of 0.05 m.
Remotesensing 17 03830 g001
Figure 2. Workflow of this study.
Remotesensing 17 03830 g002
Figure 3. Structure diagram of NB-YOLOv8.
Remotesensing 17 03830 g003
Figure 4. Individual tree detection accuracy for different diameter classes, (A) 5–10 cm, (B) 10–20 cm, (C) 20–30 cm, (D) 30–40 cm.
Remotesensing 17 03830 g004
Figure 5. Scatterplot of measured AGB versus predicted AGB, with the red dashed line indicating a 1:1 straight line and the blue solid line indicating the fitted straight line, “slope” represents the slope of the fitting line. a, b, and c represent Larch, CP, and CF, respectively, 1, 2, 3 and 4 represent the SF, TF, SF + TF, and SF + TF + CHM four variable combinations.
Remotesensing 17 03830 g005
Figure 6. Importance ranking of SF, TF and CHM combined variable sets. (ac) represent Larch, Chinese pine, and Chinese fir.
Remotesensing 17 03830 g006
Figure 7. SHAP values of features. (ac) represent Larch, Chinese pine, and Chinese fir.
Remotesensing 17 03830 g007
Figure 8. Individual tree detection and AGB mapping based on hybrid deep-machine learning model, an example of a sample plot. (a1) represents the high-resolution image of Larch, (b1) represents the high-resolution image of Chinese pine, and (c1) represents the high-resolution image of Chinese fir. (a2) represents the spatial distribution of individual tree AGB of Larch, (b2) represents the spatial distribution of individual tree AGB of Chinese pine, and (c2) represents the spatial distribution of individual tree AGB of Chinese fir.
Remotesensing 17 03830 g008
Table 1. Ground survey data.
Tree SpeciesMean (kg)Range (kg)StdDev (kg)Number
CP94.871.76–1225.38134.63957
larch32.832.49–164.0828.51664
CF135.641.25–1008.02129.211658
Table 2. The allometric growth equation for biomass of different tree species.
Tree SpeciesAllometric Equation
CP0.027639(D2H)0.9905 + 0.0091313(D2H)0.982 + 0.0045755(D2H)0.9894
larch0.046238(D2H)0.905002
CF0.045D2.48H0.86
Table 3. Variables related to individual tree biomass.
Variables NameFormula
B, G, RBand1, Band2 and Band3
DVIijBandi – Bandj, i, j = 1, 2, 3, i ≠ j
RVIijBandi/Bandj, i, j = 1, 2, 3, i ≠ j
NDij(Bandi − Bandj)/(Bandi + Bandj), i, j = 1, 2, 3, i ≠ j
Table 4. Summary of individual tree detection accuracy of the three tree species.
ModelRecall (%)Precision (%)F1-Score (%)
CFCPLarchCFCPLarchCFCPLarch
WA80.8476.8177.1684.7480.7579.8982.7478.7378.50
Yolov887.7784.8684.0789.9485.5684.2188.8485.2184.14
NB-Yolov890.9689.2188.2492.3189.2589.4391.6389.2388.83
Table 5. Model performance of tree biomass estimation using different feature combinations.
Variable CombinationsLarchCPCF
RMSE (kg)R2MAE (kg)RMSE (kg)R2MAE (kg)RMSE (kg)R2MAE (kg)
SF68.170.3716.48141.860.1477.2386.750.1966.93
TF57.340.5813.09106.90.6574.6184.420.2549.58
SF + TF56.720.612.98103.550.6668.7681.820.2948.95
SF + TF + CHM44.980.7611.15105.030.6747.7056.910.6545.68
Disclaimer/Publisher’s Note: The statements, opinions and data contained in all publications are solely those of the individual author(s) and contributor(s) and not of MDPI and/or the editor(s). MDPI and/or the editor(s) disclaim responsibility for any injury to people or property resulting from any ideas, methods, instructions or products referred to in the content.