

A Novel Oil Spill Dataset Augmentation Framework Using Object Extraction and Image Blending Techniques

Abstract
1. Introduction
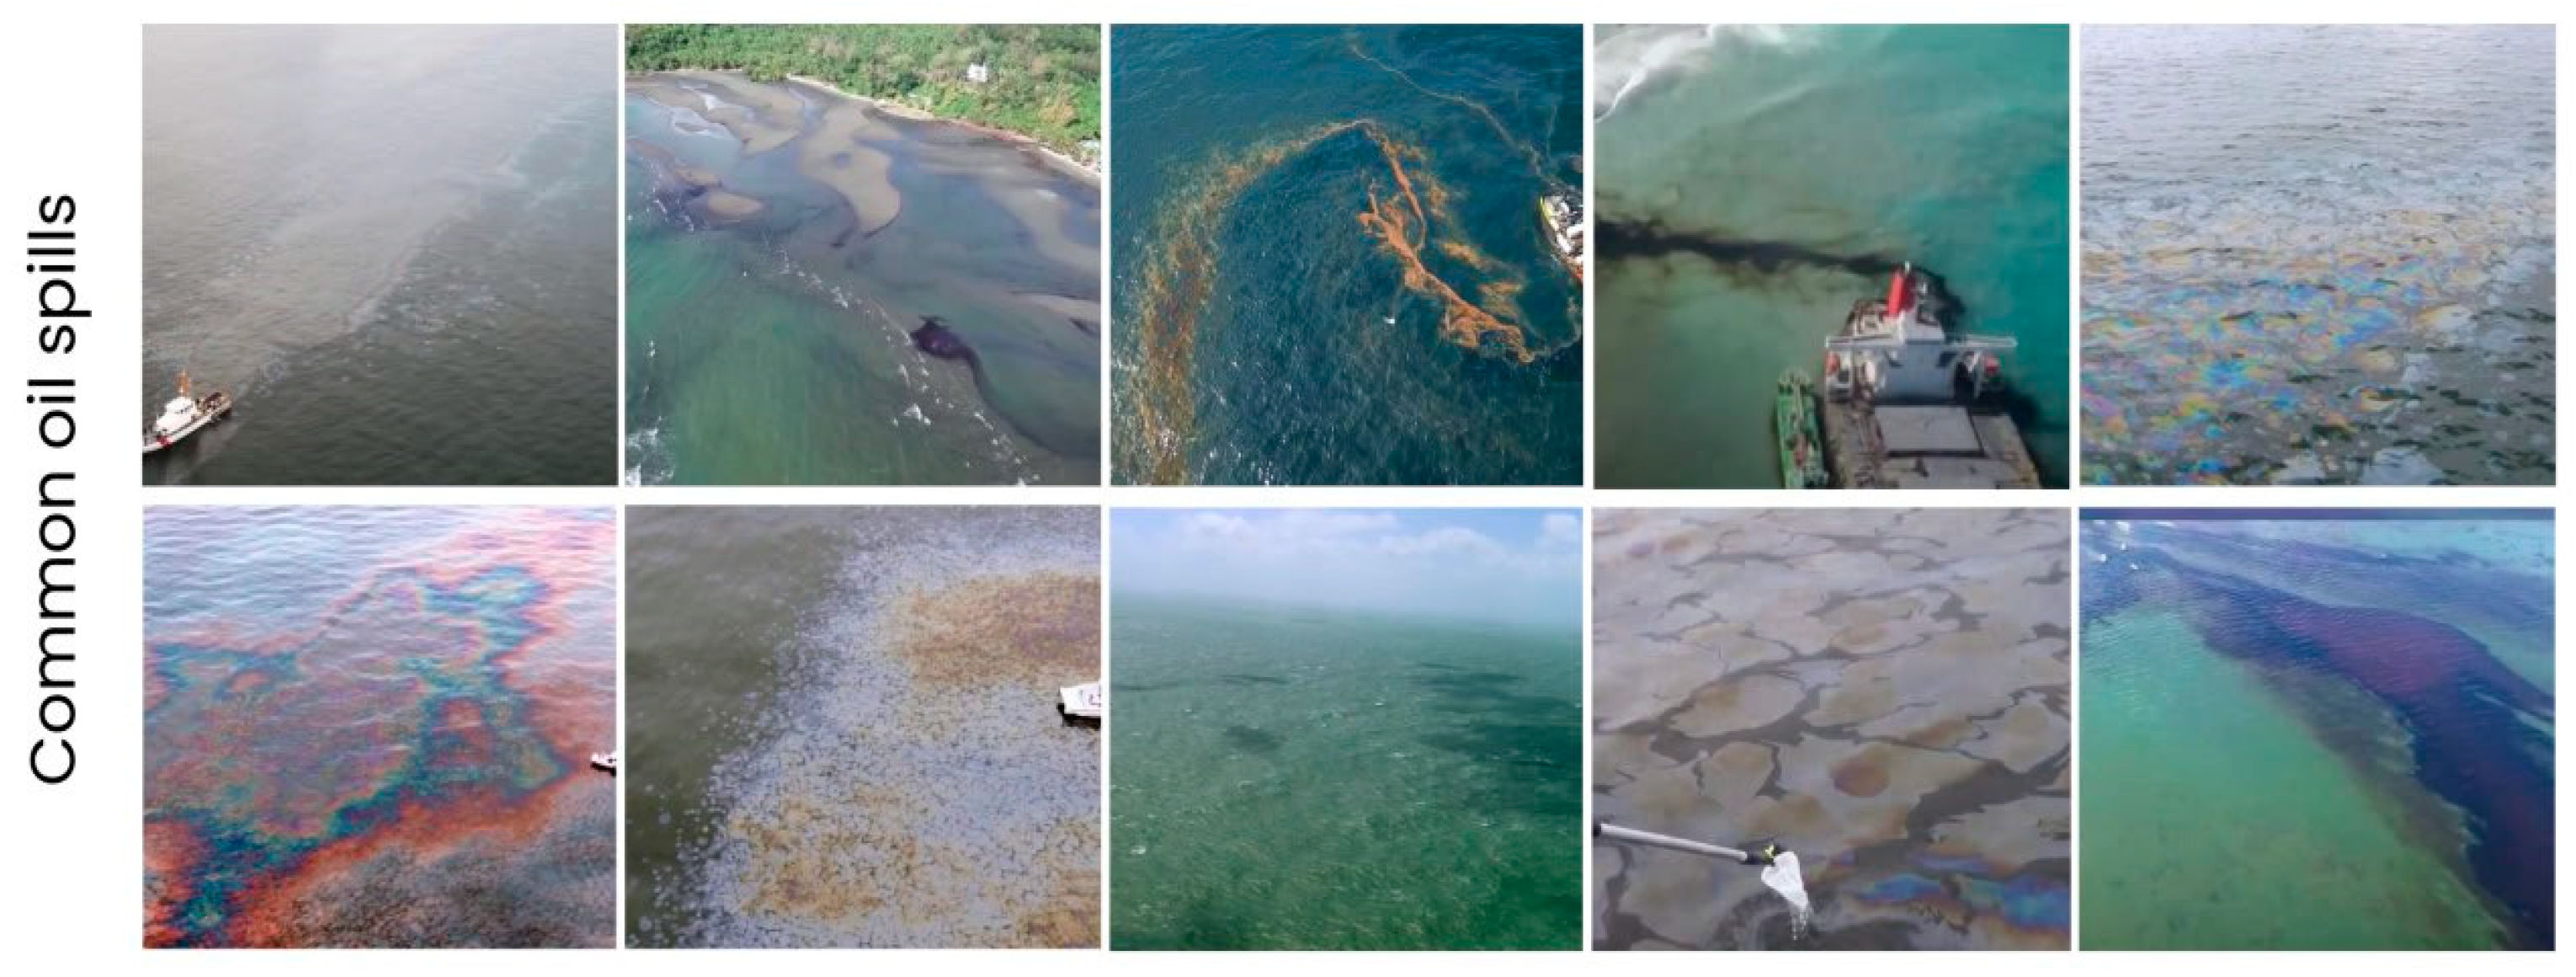
- Collecting oil spill represented images from internet sources because currently there are no open-source, colorful oil spill datasets.
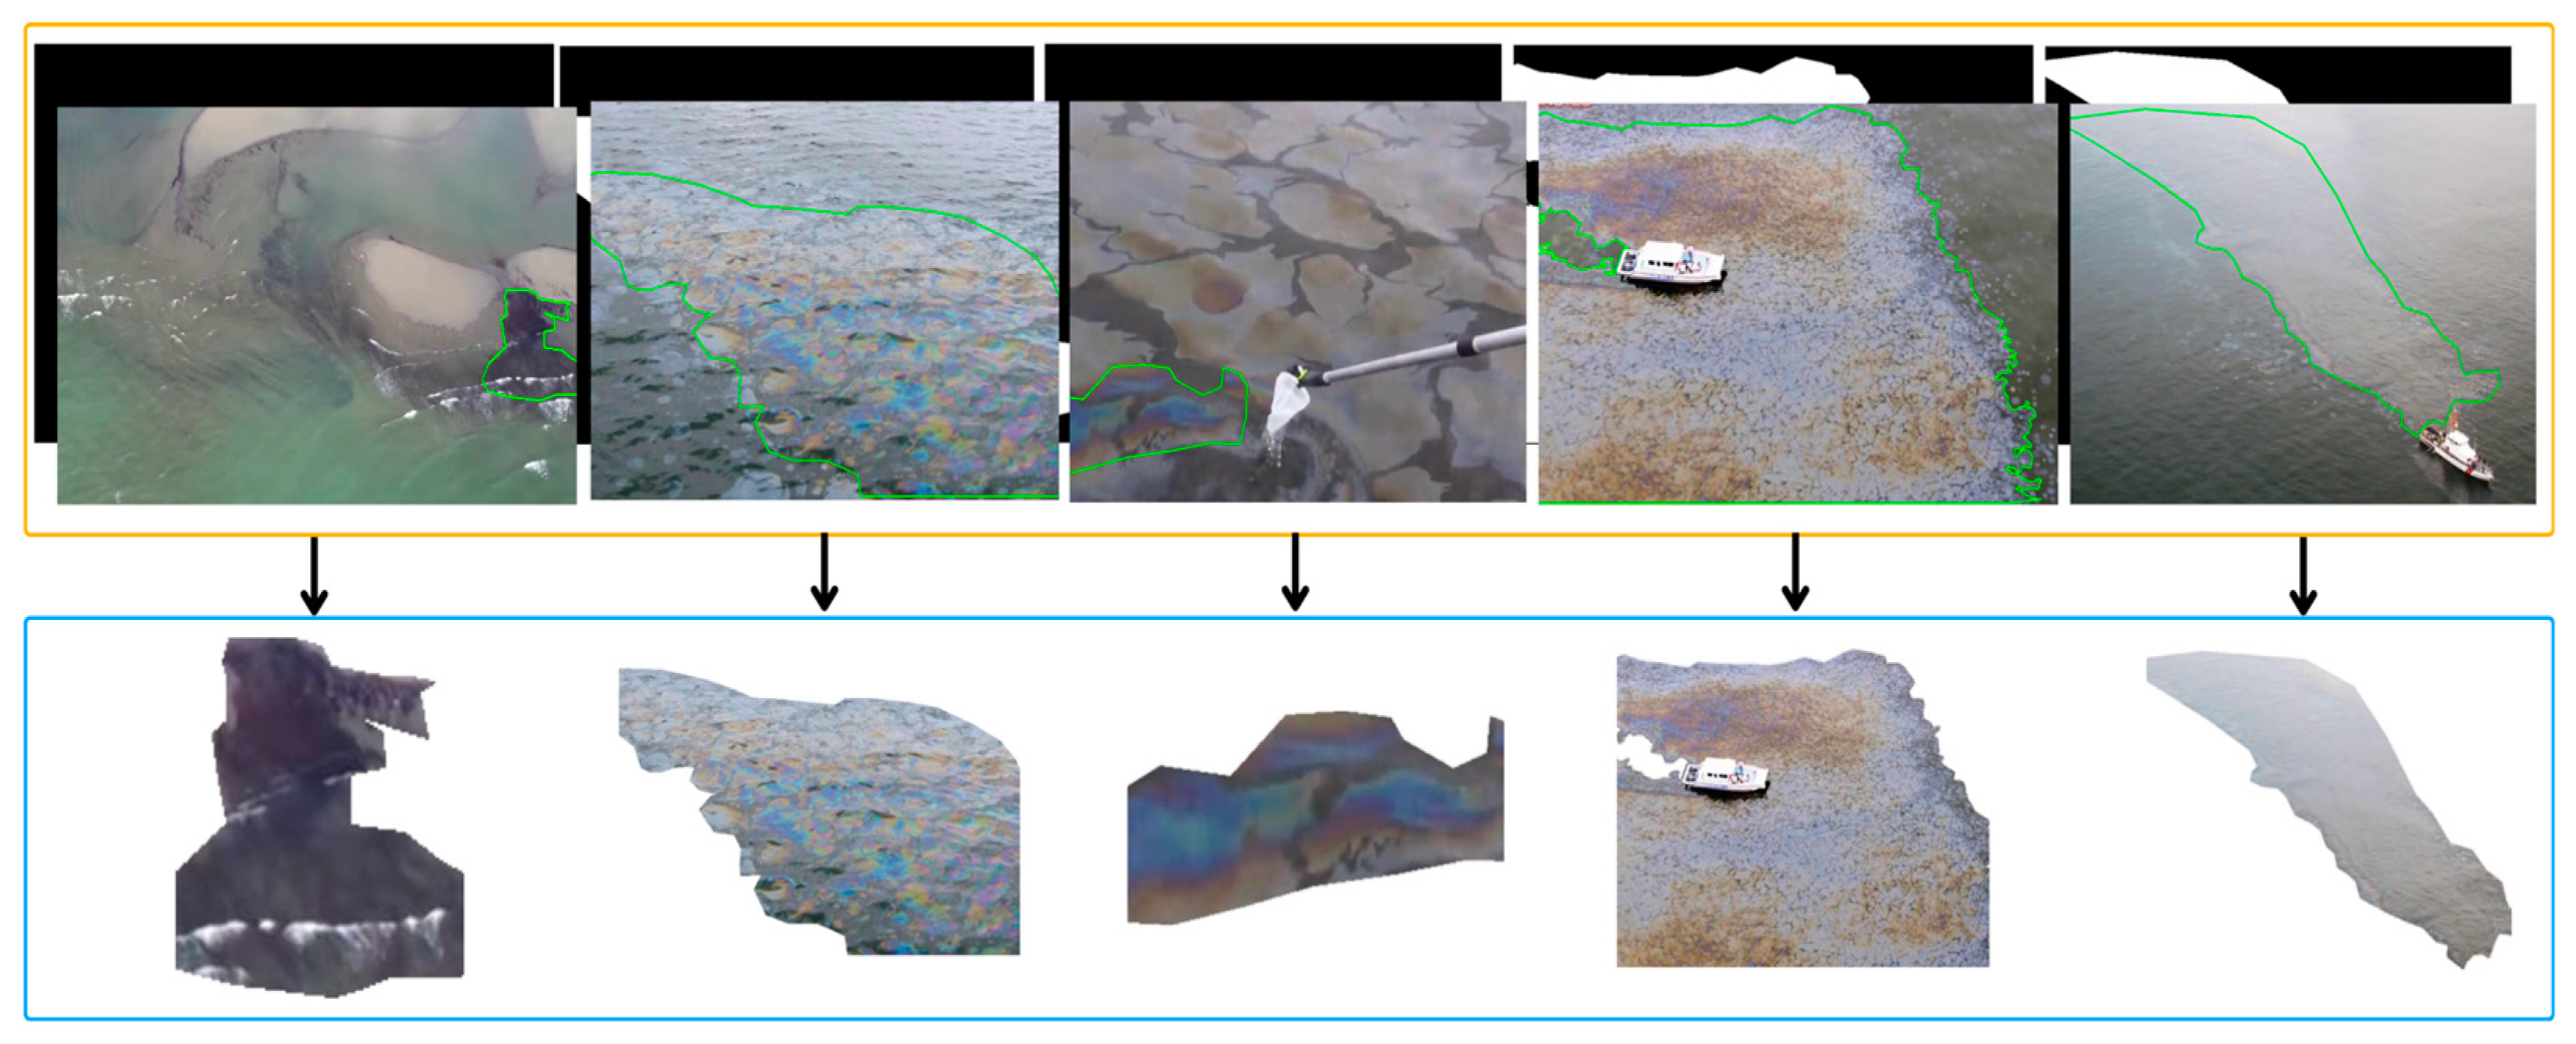
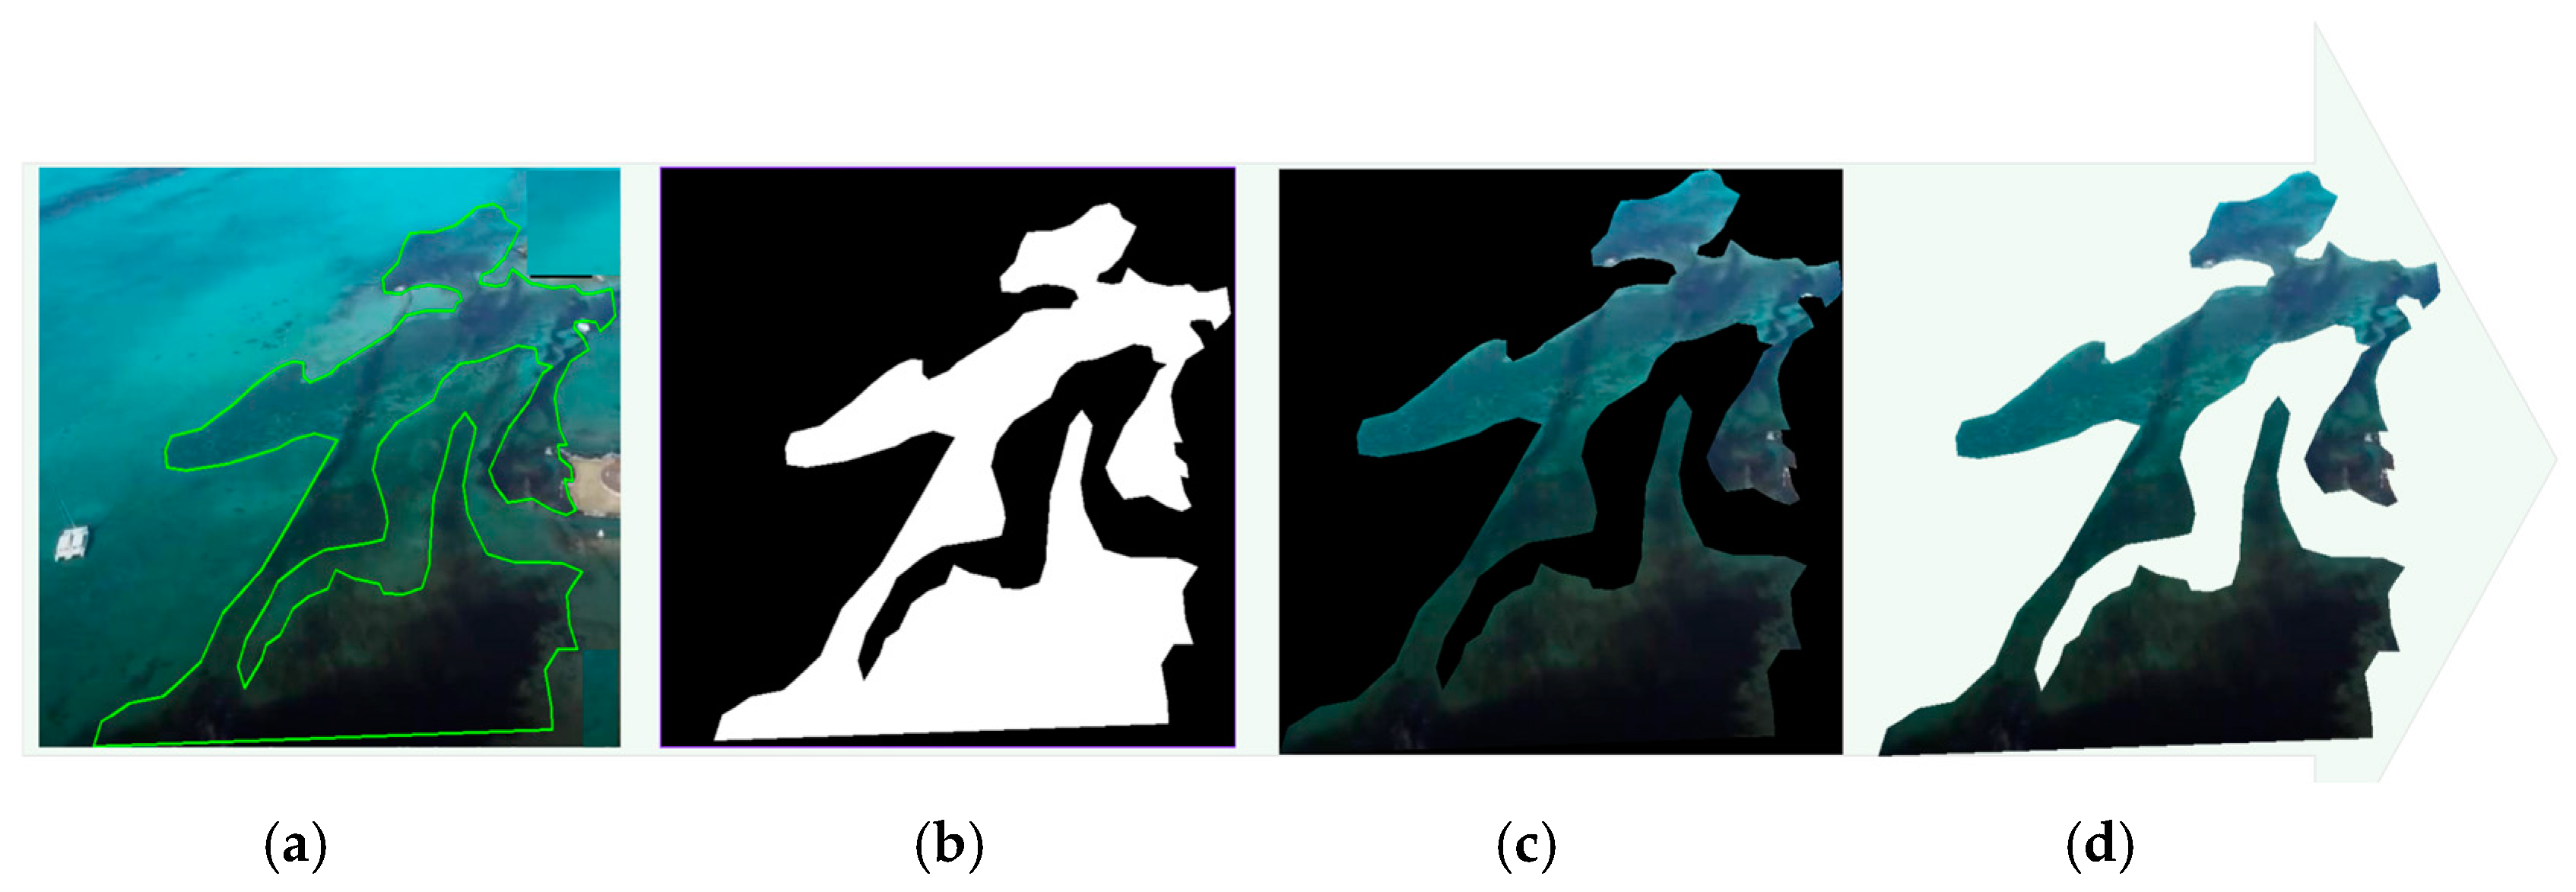
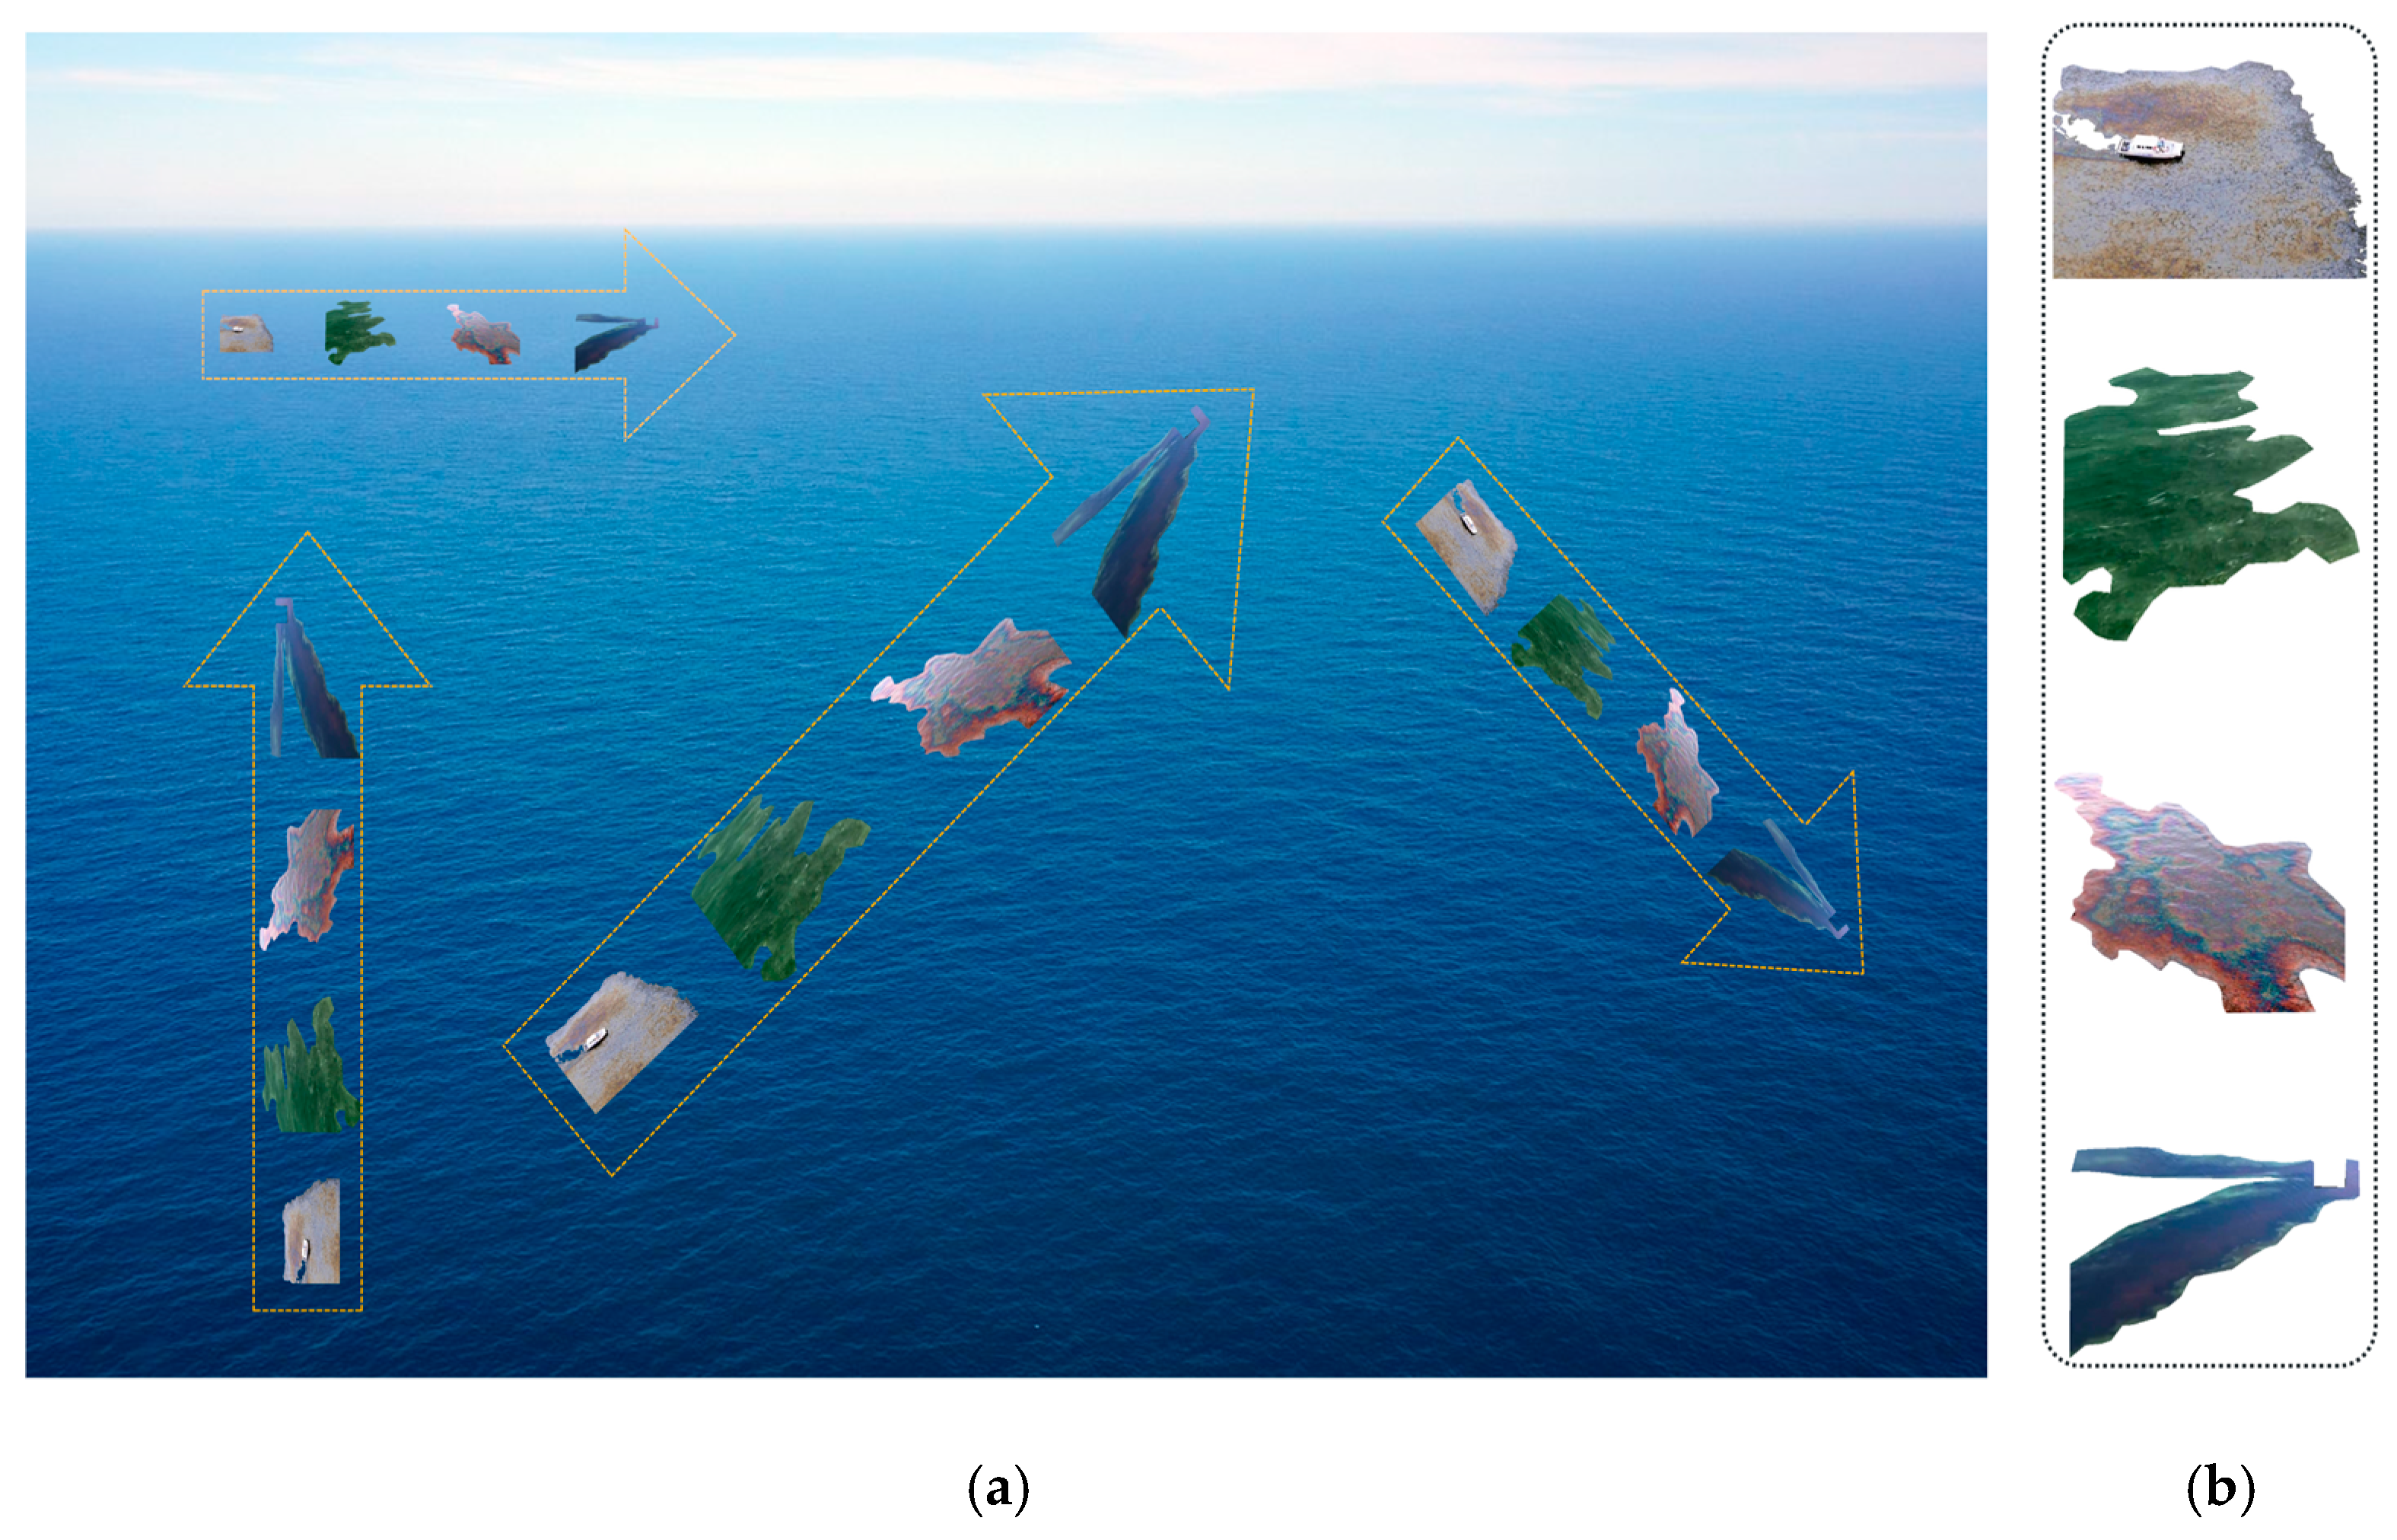
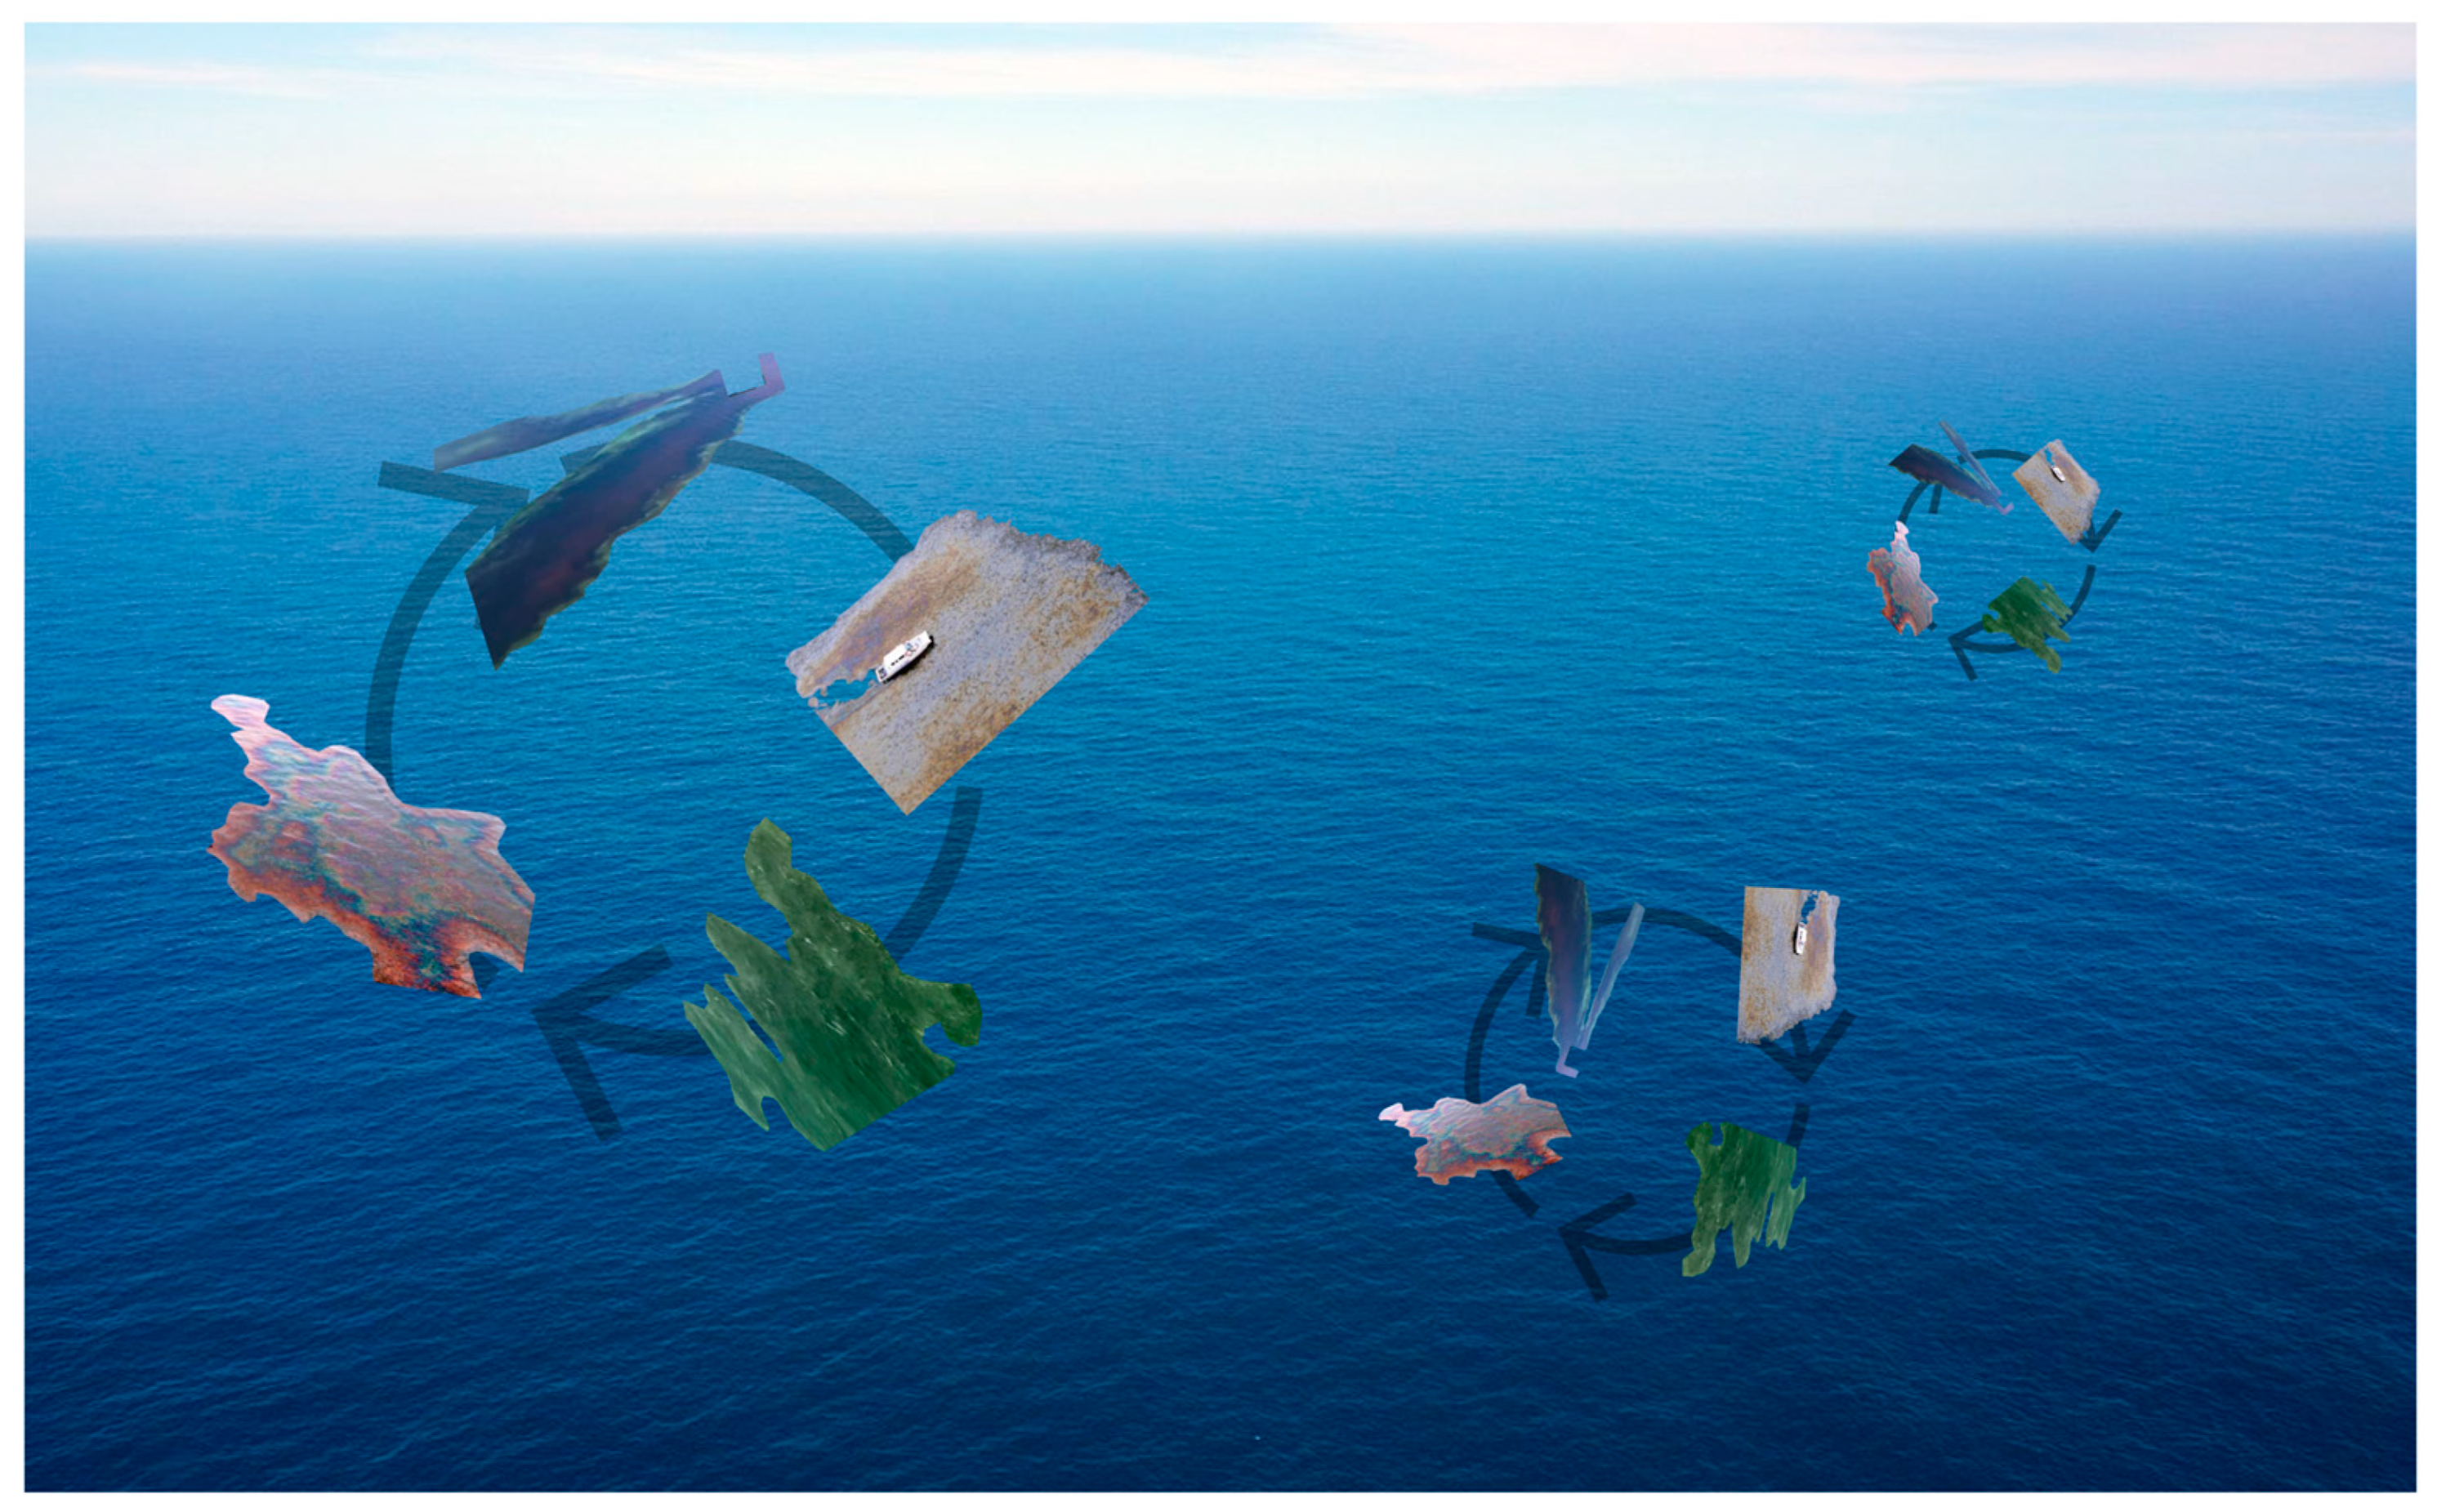
- Labeling and extracting oil spill regions from annotated images and blending them into ocean images.
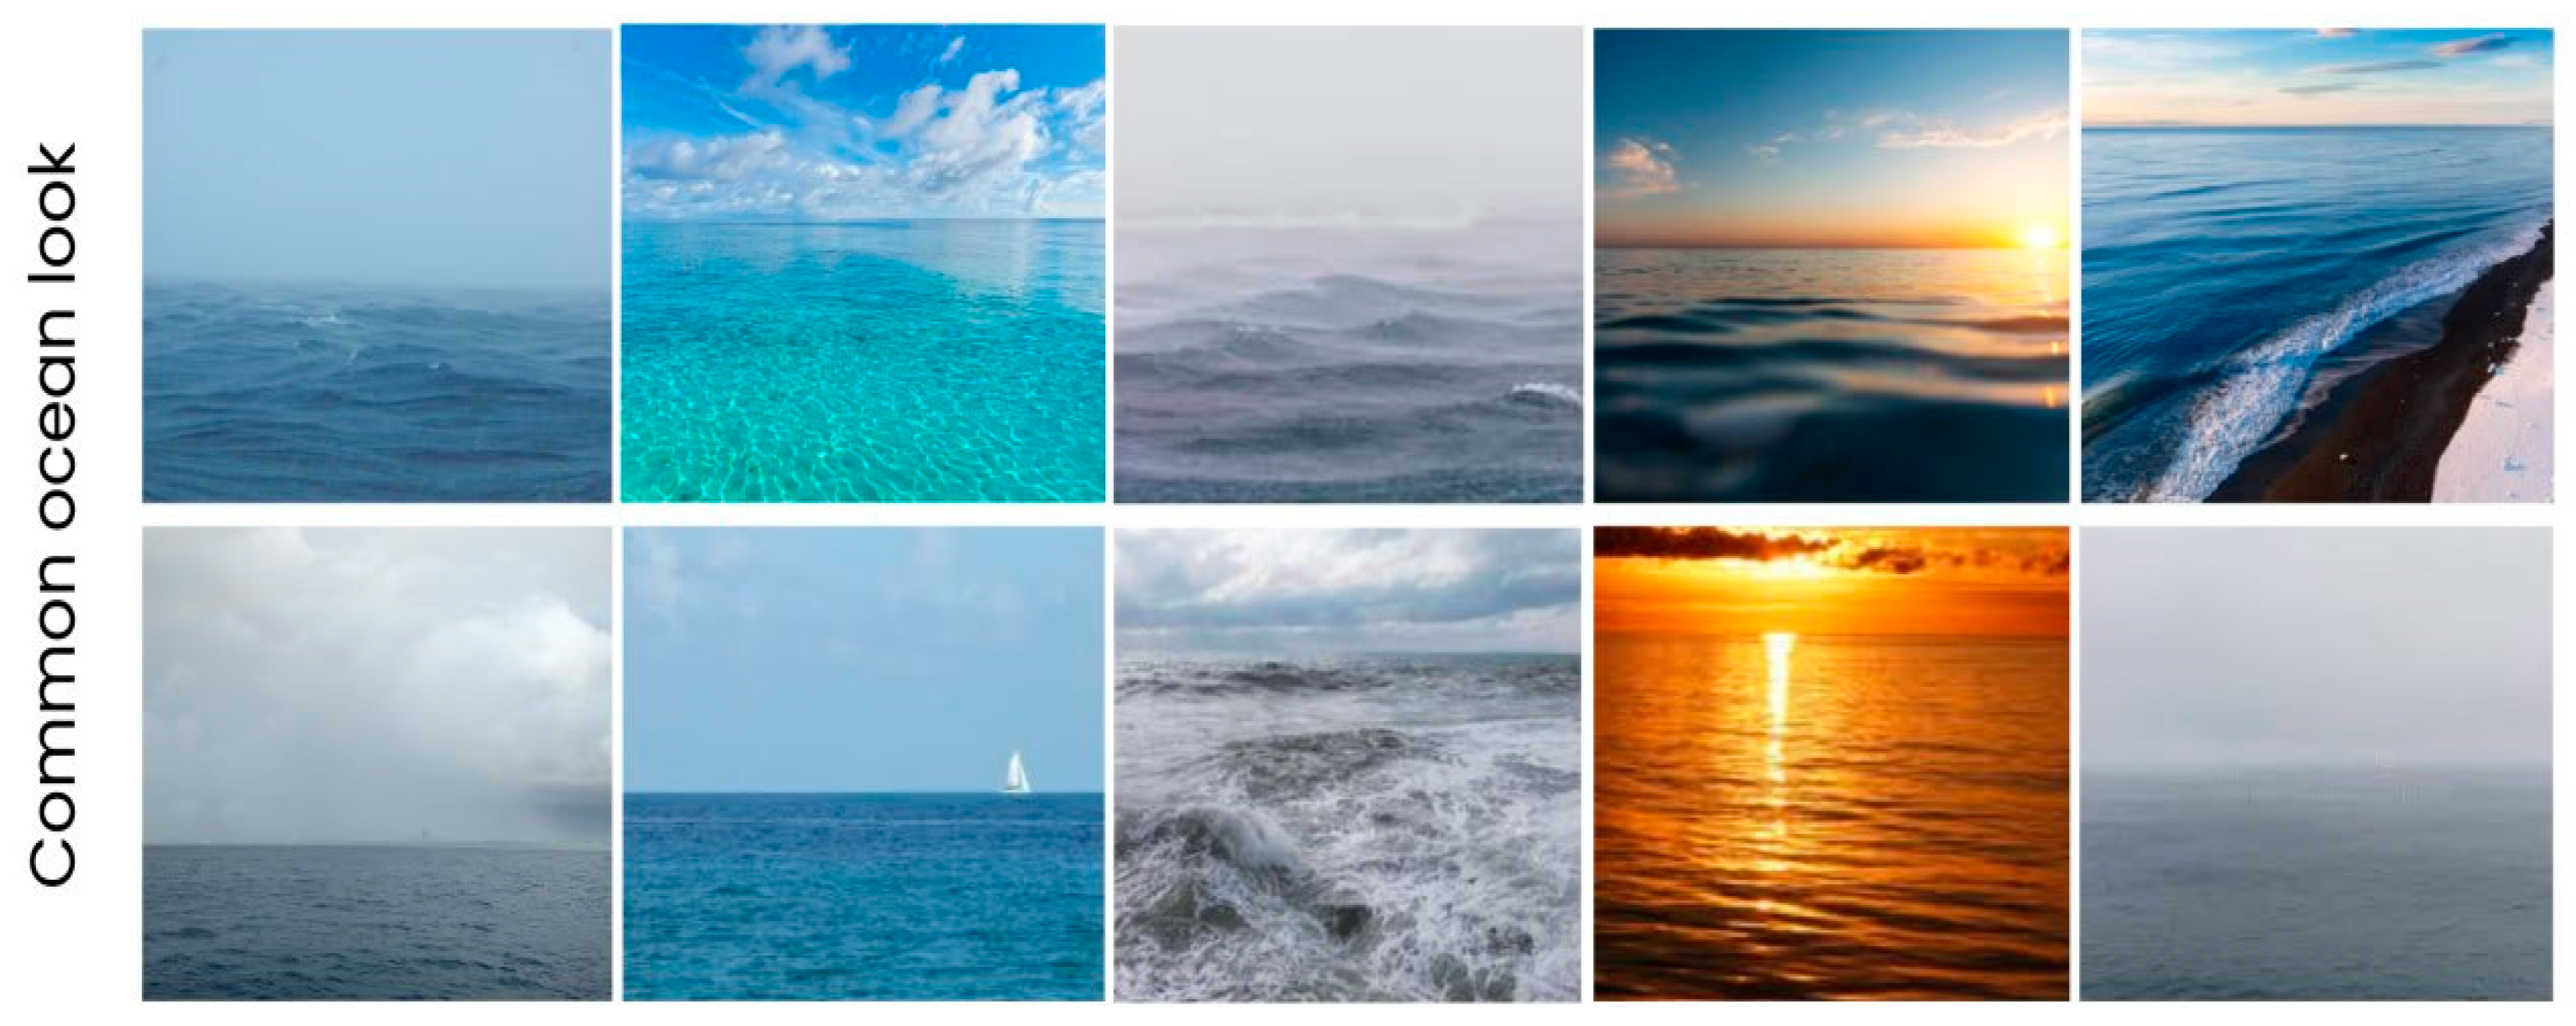
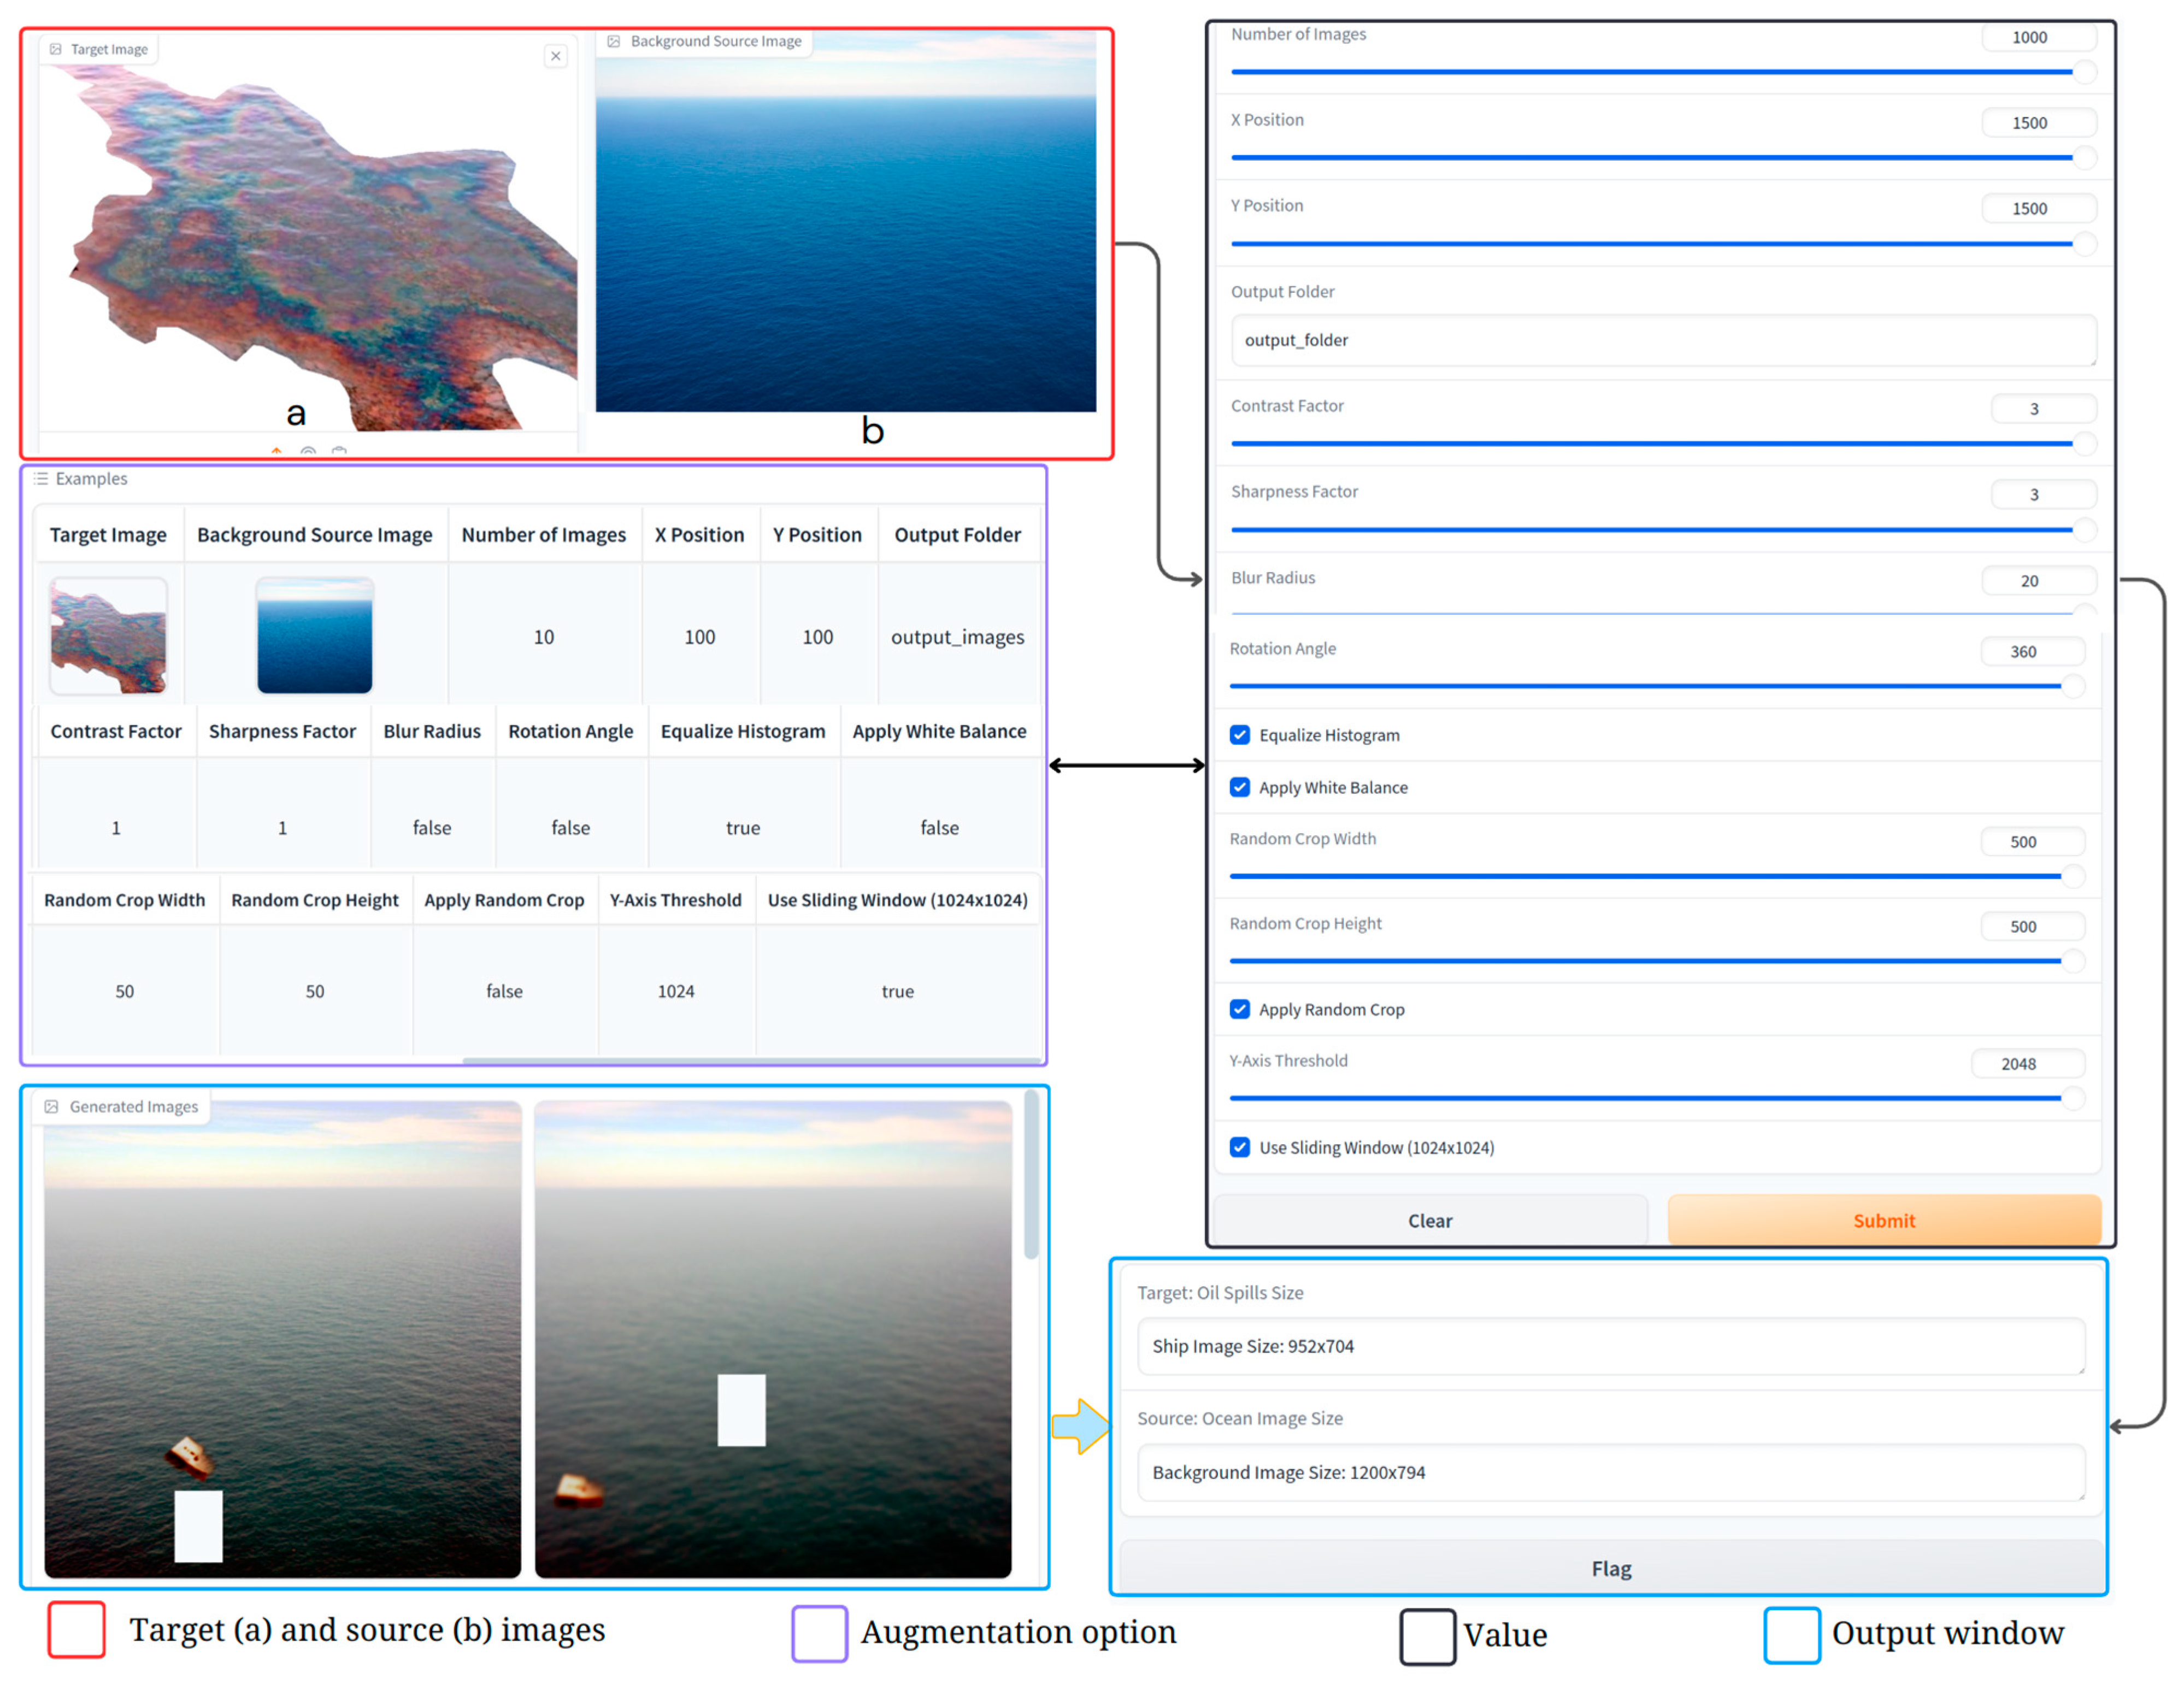
- Developing a user-friendly Gradio web application for blending extracted oil spill images (target image) with various ocean background images (source image).
2. Related Works
2.1. SAR-Imaging-Based Research and Its Limitations
2.2. Commonly Used Machine Learning Methods for Oil Spill Detection
2.3. State-of-the-Art Methods in Oil Spill Detection
3. Advances in Research, Materials and Proposed Methodology
3.1. Challenges in Oil Spill Detection
3.2. Proposed Methodology
3.3. Applied Data Augmentation Techniques
3.4. Target Image Resizing and Positioning in Blending to Source Image
3.5. Random Flip Application
3.6. Pyramid Blending of Oil Spill
3.7. Blur Effects Application in Augmentation
3.8. Changing Color Channels and White Balance Adjustment
3.9. Gradio Web Interface for Oil Spill Data Augmentation
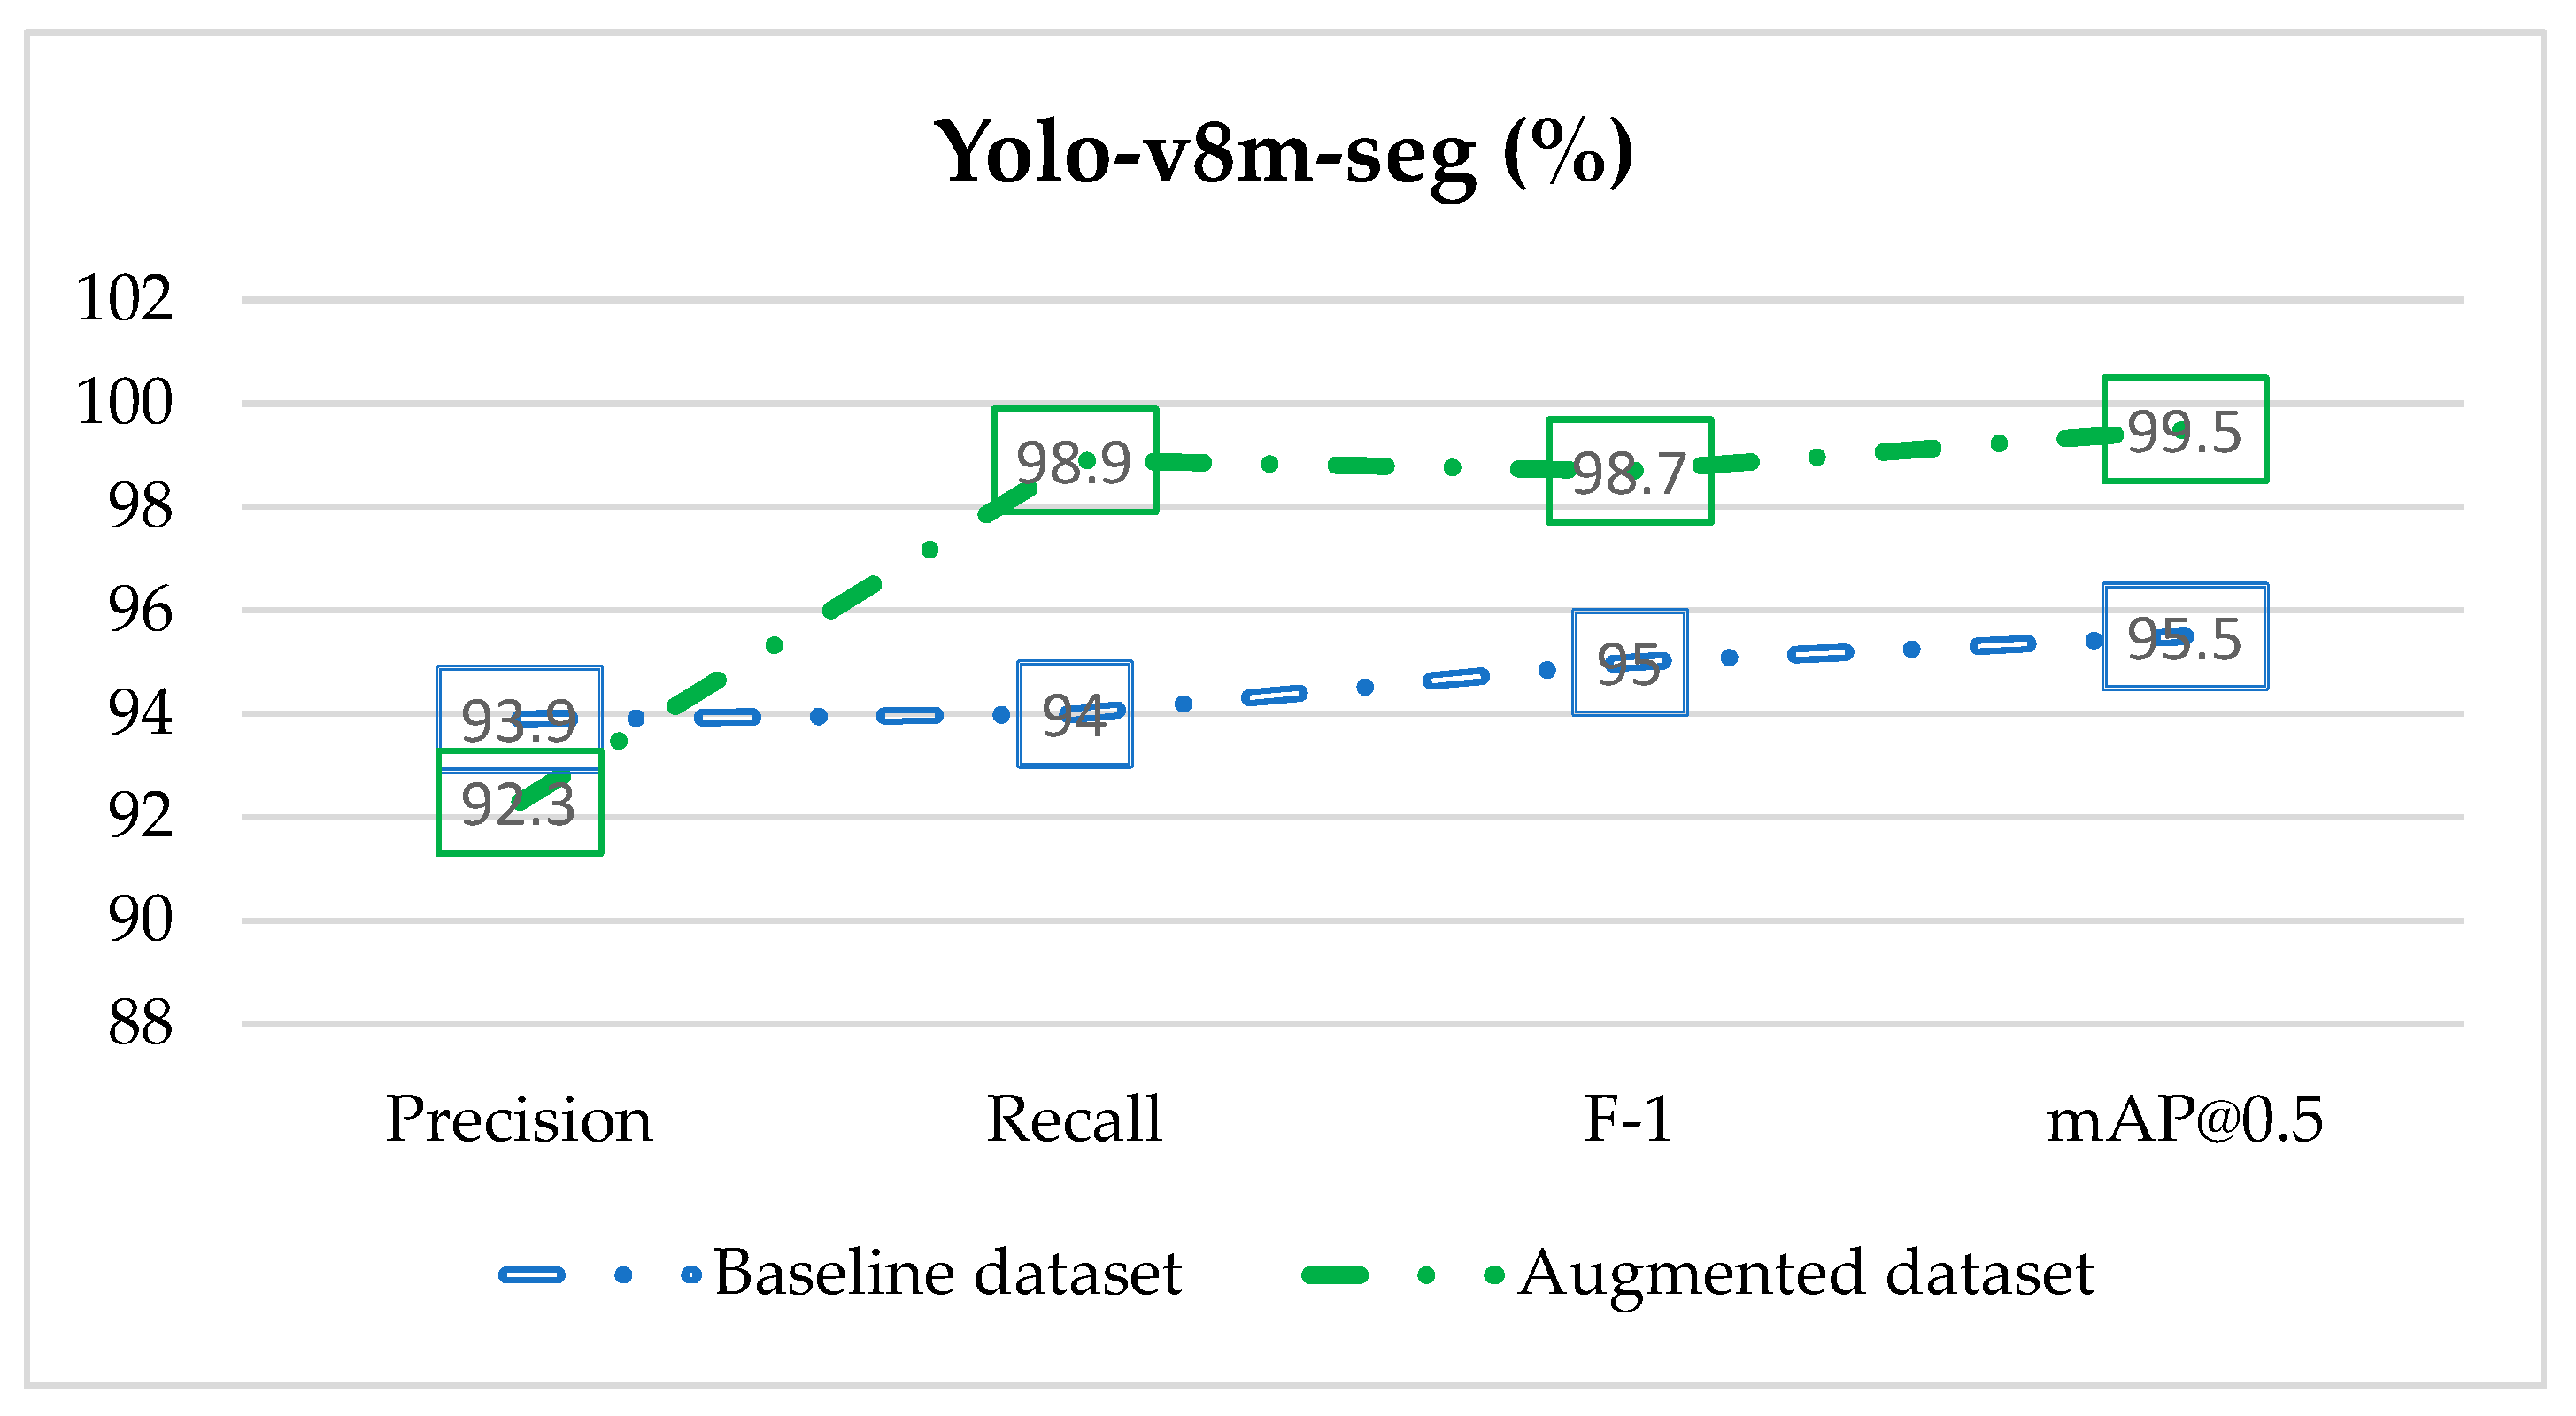
4. Quantitative Evaluation
5. Discussion
6. Conclusions
Author Contributions
Funding
Data Availability Statement
Acknowledgments
Conflicts of Interest
References
- Available online: https://www.itopf.org/knowledge-resources/data-statistics/statistics/ (accessed on 15 October 2024).
- Available online: https://www.noaa.gov/education/resource-collections/ocean-coasts/oil-spills (accessed on 16 October 2024).
- Yekeen, S.T.; Balogun, A.-L.; Yusof, K.B.W. A novel deep learning instance segmentation model for automated marine oil spill detection. ISPRS J. Photogramm. Remote Sens. 2020, 167, 190–200. [Google Scholar] [CrossRef]
- Grau, M.V.; Groves, T. The oil spill process: The effect of coast guard monitoring on oil spills. Environ. Resour. Econ. 1997, 10, 315–339. [Google Scholar] [CrossRef]
- Senga, H.; Kato, N.; Ito, A.; Niou, H.; Yoshie, M.; Fujita, I.; Igarashi, K.; Okuyama, E. Spilled oil tracking autonomous buoy system. Adv. Robot. 2009, 23, 1103–1129. [Google Scholar] [CrossRef]
- Griffo, G.; Piper, L.; Lay-Ekuakille, A.; Pellicanò, D. Design of buoy station for marine pollutant detection. Measurement 2014, 47, 1024–1029. [Google Scholar] [CrossRef]
- Al-Ruzouq, R.; Gibril, M.B.A.; Shanableh, A.; Kais, A.; Hamed, O.; Al-Mansoori, S.; Khalil, M.A. Sensors, features, and machine learning for oil spill detection and monitoring: A review. Remote Sens. 2020, 12, 3338. [Google Scholar] [CrossRef]
- Krestenitis, M.; Orfanidis, G.; Ioannidis, K.; Avgerinakis, K.; Vrochidis, S.; Kompatsiaris, I. Oil spill identification from satellite images using deep neural networks. Remote Sens. 2019, 11, 1762. [Google Scholar] [CrossRef]
- Fan, J.; Zhang, F.; Zhao, D.; Wang, J. Oil spill monitoring based on SAR remote sensing imagery. Aquat. Procedia 2015, 3, 112–118. [Google Scholar] [CrossRef]
- Singh, P.; Diwakar, M.; Shankar, A.; Shree, R.; Kumar, M. A Review on SAR Image and its Despeckling. Arch. Comput. Methods Eng. 2021, 28, 4633–4653. [Google Scholar] [CrossRef]
- Guo, H.; Wei, G.; An, J. Dark Spot Detection in SAR Images of Oil Spill Using Segnet. Appl. Sci. 2018, 8, 2670. [Google Scholar] [CrossRef]
- Xu, L.; Li, J.; Brenning, A. A comparative study of different classification techniques for marine oil spill identification using RADARSAT-1 imagery. Remote Sens. Environ. 2014, 141, 14–23. [Google Scholar] [CrossRef]
- Dabboor, M.; Singha, S.; Montpetit, B.; Deschamps, B.; Flett, D. Pre-Launch assessment of RADARSAT constellation mission medium resolution modes for sea oil slicks and lookalike discrimination. Can. J. Remote Sens. 2019, 45, 530–549. [Google Scholar] [CrossRef]
- Kim, T.S.; Park, K.A.; Li, X.; Lee, M.; Hong, S.; Lyu, S.J.; Nam, S. Detection of the hebei spirit oil spill on SAR imagery and its temporal evolution in a coastal region of the Yellow sea. Adv. Space Res. 2015, 56, 1079–1093. [Google Scholar] [CrossRef]
- Ozkan, C.; Osmanoglu, B.; Sunar, F.; Staples, G.; Kalkan, K.; Balık Sanlı, F. Testing the generalization efficiency of oil slick classification algorithm using multiple Sar data for deepwater horizon oil spill. ISPRS Int. Arch. Photogramm. Remote Sens. Spat. Inf. Sci. 2012, 39, 67–72. [Google Scholar] [CrossRef]
- Skrunes, S.; Brekke, C.; Eltoft, T. Characterization of marine surface slicks by radarsat-2 multipolarization features. IEEE Trans. Geosci. Remote Sens. 2014, 52, 5302–5319. [Google Scholar] [CrossRef]
- Marghany, M. Automatic Mexico gulf oil spill detection from Radarsat-2 SAR satellite data using genetic algorithm. Acta Geophys. 2016, 64, 1916–1941. [Google Scholar] [CrossRef]
- Yu, X.; Zhang, H.; Luo, C.; Qi, H.; Ren, P. Oil spill segmentation via adversarial f-divergence learning. IEEE Trans. Geosci. Remote Sens. 2018, 56, 4973–4988. [Google Scholar] [CrossRef]
- Song, D.; Ding, Y.; Li, X.; Zhang, B.; Xu, M. Ocean oil spill classification with RADARSAT-2 SAR based on an optimized wavelet neural network. Remote Sens. 2017, 9, 799. [Google Scholar] [CrossRef]
- El-Magd, I.A.; Zakzouk, M.; Abdulaziz, A.M.; Ali, E.M. The potentiality of operational mapping of oil pollution in the mediterranean sea near the entrance of the suez canal using sentinel-1 SAR data. Remote Sens. 2020, 12, 1352. [Google Scholar] [CrossRef]
- Pisano, A.; Bignami, F.; Santoleri, R. Oil Spill Detection in Glint-Contaminated Near-Infrared MODIS Imagery. Remote Sens. 2015, 7, 1112–1134. [Google Scholar] [CrossRef]
- Joseph, M.; Jayasri, P.V.; Dutta, S.; Kumari, E.V.S.S.; Prasad, A.V.V. Oil spill detection from RISAT-1 imagery using texture analysis. In Proceedings of the 2016 Asia-Pacific Microwave Conference (APMC), New Delhi, India, 5–9 December 2016. [Google Scholar]
- Chaudhary, V.; Kumar, S. Marine oil slicks detection using spaceborne and airborne SAR data. Adv. Space Res. 2020, 66, 854–872. [Google Scholar] [CrossRef]
- Bazine, R.; Wu, H.; Boukhechba, K. Semantic segmentation of SLAR imagery with convolutional LSTM selectional autoencoders. Remote Sens. 2019, 11, 1402. [Google Scholar] [CrossRef]
- Lin, Y.; Yu, J.; Zhang, Y.; Wang, P.; Ye, Z. Dynamic analysis of oil spill in Yangtze estuary with HJ-1 imagery. In Communications in Computer and Information Science; Springer: Berlin/Heidelberg, Germany, 2016; Volume 569, pp. 345–356. [Google Scholar]
- Tian, W.; Bian, X.; Shao, Y.; Zhang, Z. On the detection of oil spill with China’s HJ-1C SAR image. Aquat. Procedia 2015, 3, 144–150. [Google Scholar] [CrossRef]
- Prastyani, R.; Basith, A. Detecting Oil spill on Sentinel-1 imagery based on texture analysis and instantaneous wind speed estimation. In Proceedings of the 5th International Conference on Science and Technology, Yogyakarta, Indonesia, 30–31 July 2019; pp. 1–5. [Google Scholar]
- White, H.; Commy, R.; MacDonald, I.; Reddy, C. Methods of Oil Detection in Response to the Deepwater Horizon Oil Spill. Oceanography 2016, 29, 76–87. [Google Scholar] [CrossRef]
- Topouzelis, K.; Singha, S. Oil Spill Detection Using Space-Borne Sentinel-1 SAR Imagery; Elsevier: Amsterdam, The Netherlands, 2017; ISBN 9781856179430. [Google Scholar]
- Bayramov, E.; Kada, M.; Buchroithner, M. Monitoring oil spill hotspots, contamination probability modelling and assessment of coastal impacts in the Caspian Sea using SENTINEL-1, LANDSAT-8, RADARSAT, ENVISAT and ERS satellite sensors. J. Oper. Oceanogr. 2018, 11, 27–43. [Google Scholar] [CrossRef]
- Arslan, N. Assessment of oil spills using Sentinel 1 C-band SAR and Landsat 8 multispectral sensors. Environ. Monit. Assess. 2018, 190, 637. [Google Scholar] [CrossRef] [PubMed]
- Mera, D.; Bolon-Canedo, V.; Cotos, J.M.; Alonso-Betanzos, A. On the use of feature selection to improve the detection of sea oil spills in SAR images. Comput. Geosci. 2017, 100, 166–178. [Google Scholar] [CrossRef]
- Ma, L. Support Tucker machines based marine oil spill detection using SAR images. Indian J. Geo-Mar. Sci. 2016, 45, 1445–1449. [Google Scholar]
- Ozkan, C.; Ozturk, C.; Sunar, F.; Karaboga, D. The artificial bee colony algorithm in training artificial neural network for oil spill detection. Neural Netw. World 2011, 21, 473–492. [Google Scholar] [CrossRef]
- Hang, L.M.; Van Truong, V. A combination method of differential evolution algorithm and neural network for automatic identification oil spill at Vietnam East Sea. J. Geol. Resour. Eng. 2015, 4, 184–193. [Google Scholar]
- Holstein, A.; Kappas, M.; Propastin, P.; Renchin, T. Oil spill detection in the Kazakhstan sector of the Caspian sea with the help of ENVISAT ASAR data. Environ. Earth Sci. 2018, 77, 198. [Google Scholar] [CrossRef]
- Konik, M.; Bradtke, K. Object-oriented approach to oil spill detection using ENVISAT ASAR images. ISPRS J. Photogramm. Remote Sens. 2016, 118, 37–52. [Google Scholar] [CrossRef]
- Mihoub, Z.; Hassini, A. Monitoring and identification of marine oil spills using advanced synthetic aperture radar images. Opt. Appl. 2014, 44, 433–449. [Google Scholar]
- Su, T.F.; Li, H.Y.; Liu, T.X. Sea oil spill detection method using SAR imagery combined with object-Based image analysis and fuzzy logic. Adv. Mater. Res. 2014, 1065–1069, 3192–3200. [Google Scholar] [CrossRef]
- Akar, S.; Süzen, M.L.; Kaymakci, N. Detection and object-based classification of offshore oil slicks using ENVISAT-ASAR images. Environ. Monit. Assess. 2011, 183, 409–423. [Google Scholar] [CrossRef]
- Dabbiru, L.; Samiappan, S.; Nobrega, R.A.A.; Aanstoos, J.A.; Younan, N.H.; Moorhead, R.J. Fusion of synthetic aperture radar and hyperspectral imagery to detect impacts of oil spill in Gulf of Mexico. Int. Geosci. Remote Sens. Symp. 2015, 2015, 1901–1904. [Google Scholar]
- Liu, P.; Li, Y.; Liu, B.; Chen, P.; Xu, J. Semi-automatic oil spill detection on X-band marine radar images using texture analysis, machine learning, and adaptive thresholding. Remote Sens. 2019, 11, 756. [Google Scholar] [CrossRef]
- National Research Council. Oil in the Sea III: Inputs, Fates, and Effects; National Academies Press: Washington, DC, USA, 2003.
- Mitchell, T.M. Machine Learning; McGraw-Hill: New York, NY, USA, 1997. [Google Scholar]
- Alves, T.M.; Kokinou, E.; Zodiatis, G. A three-step model to assess shoreline and offshore susceptibility to oil spills: The South Aegean (Crete) as an analogue for confined marine basins. Mar. Pollut. Bull. 2014, 86, 443–457. [Google Scholar] [CrossRef] [PubMed]
- Singha, S.; Bellerby, T.J.; Trieschmann, O. Detection And Classification Of Oil Spill And Look-Alike Spots From Sar Imagery Using An Artificial Neural Network. In Proceedings of the 2012 IEEE International Geoscience and Remote Sensing Symposium, Munich, Germany, 22–27 July 2012; pp. 5630–5633. [Google Scholar]
- Topouzelis, K.; Psyllos, A. Oil spill feature selection and classification using decision tree forest on SAR image data. ISPRS J. Photogramm. Remote Sens. 2012, 68, 135–143. [Google Scholar] [CrossRef]
- Maianti, P.; Rusmini, M.; Tortini, R.; Dalla Via, G.; Frassy, F.; Marchesi, A.; Rota Nodari, F.; Gianinetto, M. Monitoring large oil slick dynamics with moderate resolution multispectral satellite data. Nat. Hazards 2014, 73, 473–492. [Google Scholar] [CrossRef]
- Tong, S.; Liu, X.; Chen, Q.; Zhang, Z.; Xie, G. Multi-feature based ocean oil spill detection for polarimetric SAR data using random forest and the self-similarity parameter. Remote Sens. 2019, 11, 451. [Google Scholar] [CrossRef]
- Chen, G.; Li, Y.; Sun, G.; Zhang, Y. Application of deep networks to oil spill detection using polarimetric synthetic aperture radar images. Appl. Sci. 2017, 7, 968. [Google Scholar] [CrossRef]
- Zhang, Y.; Li, Y.; Liang, X.S.; Tsou, J. Comparison of oil spill classifications using fully and compact polarimetric SAR images. Appl. Sci. 2017, 7, 193. [Google Scholar] [CrossRef]
- Mihoub, Z.; Hassini, A. Remote sensing of marine oil spills using Sea-viewing Wide Field-of-View Sensor images. Boll. Geofis. Teor. Appl. 2019, 60, 123–136. [Google Scholar]
- Akhmedov, F.; Nasimov, R.; Abdusalomov, A. Developing a Comprehensive Oil Spill Detection Model for Marine Environments. Remote Sens. 2024, 16, 3080. [Google Scholar] [CrossRef]
- Jiaoa, Z.; Jiaa, G.; Caib, Y. A new approach to oil spill detection that combines deep learning with unmanned aerial vehicles. Comput. Ind. Eng. 2018, 11, 1300–1311. [Google Scholar] [CrossRef]
- Kerf, T.D.; Gladines, J.; Sels, S.; Vanlanduit, S. Oil spill detection using machine learning and infrared images. Remote Sens. 2020, 12, 4090. [Google Scholar] [CrossRef]
- Gallego, A.-J.; Gil, P.; Pertusa, A.; Fisher, R. Segmentation of oil spills on side-looking airborne radar imagery with autoencoders. Sensors 2018, 18, 797. [Google Scholar] [CrossRef] [PubMed]
- Zhang, J.; Feng, H.; Luo, Q.; Li, Y.; Wei, J.; Li, J. Oil spill detection in quad-polarimetric SAR Images using an advanced convolutional neural network based on SuperPixel model. Remote Sens. 2020, 12, 944. [Google Scholar] [CrossRef]
- Wang, W.; Sheng, H.; Liu, S.; Chen, Y.; Wan, J.; Mao, J. An edge-preserving active contour model with bilateral filter based on hyperspectral image spectral information for oil spill segmentation. In Proceedings of the 2019 10th Workshop on Hyperspectral Imaging and Signal Processing: Evolution in Remote Sensing (WHISPERS), Amsterdam, The Netherlands, 24–26 September 2019. [Google Scholar]
- Chen, G.; Guo, H.; An, J. Research on SAR oil spill image classification based on DBN in small sample space. In Proceedings of the 2017 4th International Conference on Systems and Informatics (ICSAI), Hangzhou, China, 11–13 November 2017; Volume 2018, pp. 479–483. [Google Scholar]
- Nieto-Hidalgo, M.; Gallego, A.J.; Gil, P.; Pertusa, A. Two-stage convolutional neural network for ship and spill detection using SLAR images. IEEE Trans. Geosci. Remote Sens. 2018, 56, 5217–5230. [Google Scholar] [CrossRef]
- Huang, H.; Wang, C.; Liu, S.; Sun, Z.; Zhang, D.; Liu, C.; Jiang, Y.; Zhan, S.; Zhang, H.; Xu, R. Single spectral imagery and faster R-CNN to identify hazardous and noxious substances spills. Environ. Pollut. 2020, 258, 113688. [Google Scholar] [CrossRef]
- Cao, Y.; Xu, L.; Clausi, D. Exploring the potential of active learning for automatic identification of marine oil spills using 10-year (2004–2013) RADARSAT data. Remote Sens. 2017, 9, 41. [Google Scholar] [CrossRef]
- Makhmudov, F.; Kultimuratov, A.; Cho, Y.-I. Enhancing Multimodal Emotion Recognition through Attention Mechanisms in BERT and CNN Architectures. Appl. Sci. 2024, 14, 4199. [Google Scholar] [CrossRef]
- Umirzakova, S.; Ahmad, S.; Khan, L.U.; Whangbo, T. Medical image super-resolution for smart healthcare applications: A comprehensive survey. Inf. Fusion 2023, 103, 102075. [Google Scholar] [CrossRef]
- Tomohiko, K.; Michiaki, I. Icing on the cake: An easy and quick post-learning method you can try after deep learning. arXiv 2018, arXiv:1807.06540. [Google Scholar]
- Umirzakova, S.; Mardieva, S.; Muksimova, S.; Ahmad, S.; Whangbo, T. Enhancing the Super-Resolution of Medical Images: Introducing the Deep Residual Feature Distillation Channel Attention Network for Optimized Performance and Efficiency. Bioengineering 2023, 10, 1332. [Google Scholar] [CrossRef] [PubMed]
- Terrance, V.; Graham, W.T. Dataset augmentation in feature space. In Proceedings of the International Conference on Machine Learning (ICML), Workshop Track, 2017, Sydney, Australia, 6–11 August 2017. [Google Scholar]
- Akmalbek, A.; Djurayev, A. Robust shadow removal technique for improving image enhancement based on segmentation method. IOSR J. Electron. Commun. Eng. 2016, 11, 17–21. [Google Scholar]
- Halevy, A.; Norvig, P.; Pereira, F. The unreasonable effectiveness of data. IEEE Intell. Syst. 2009, 24, 8–12. [Google Scholar] [CrossRef]
- Umirzakova, S.; Whangbo, T.K. Detailed feature extraction network-based fine-grained face segmentation. Knowl. Based Syst. 2022, 250, 109036. [Google Scholar] [CrossRef]
- Farkhod, A.; Abdusalomov, A.B.; Mukhiddinov, M.; Cho, Y.-I. Development of Real-Time Landmark-Based Emotion Recognition CNN for Masked Faces. Sensors 2022, 22, 8704. [Google Scholar] [CrossRef]
- Bolikulov, F.; Nasimov, R.; Rashidov, A.; Akhmedov, F.; Cho, Y.-I. Effective Methods of Categorical Data Encoding for Artificial Intelligence Algorithms. Mathematics 2024, 12, 2553. [Google Scholar] [CrossRef]
- Chen, S.; Abhinav, S.; Saurabh, S.; Abhinav, G. Revisting unreasonable effectivness of data in deep learning era. In Proceedings of the 2017 IEEE International Conference on Computer Vision (ICCV 2017), Venice, Italy, 22–29 October 2017; pp. 843–852. [Google Scholar]
- Kuldashboy, A.; Umirzakova, S.; Allaberdiev, S.; Nasimov, R.; Abdusalomov, A.; Im Cho, Y. Efficient image classification through collaborative knowledge distillation: A novel AlexNet modification approach. Heliyon 2024, 10, e34376. [Google Scholar] [CrossRef] [PubMed]
- Umirzakova, S.; Ahmad, S.; Mardieva, S.; Muksimova, S.; Whangbo, T.K. Deep learning -driven diagnosis: A multi-task approach for segmenting stroke and Bell’s palsy. Pattern Recognit. 2023, 144, 109866. [Google Scholar] [CrossRef]
- Abdusalomov, A.B.; Nasimov, R.; Nasimova, N.; Muminov, B.; Whangbo, T.K. Evaluating Synthetic Medical Images Using Artificial Intelligence with the GAN Algorithm. Sensors 2023, 23, 3440. [Google Scholar] [CrossRef] [PubMed]
- Luis, P.; Wang, J. The effectiveness of data augmentation in image classification using deep learning. arXiv 2017, arXiv:1712.04621. [Google Scholar]
- Moayed, H.; Mansoori, E.G. Skipout: An Adaptive Layer-Level Regularization Framework for Deep Neural Networks. IEEE Access 2022, 10, 62391–62401. [Google Scholar] [CrossRef]
- Bacciu, D.; Crecchi, F. Augmenting Recurrent Neural Networks Resilience by Dropout. IEEE Trans. Neural Netw. Learn. Syst. 2020, 31, 345–351. [Google Scholar] [CrossRef] [PubMed]
- Buriboev, A.S.; Muhamediyeva, D.; Primova, H.; Sultanov, D.; Tashev, K.; Jeon, H.S. Concatenated CNN-Based Pneumonia Detection Using a Fuzzy-Enhanced Dataset. Sensors 2024, 24, 6750. [Google Scholar] [CrossRef] [PubMed]
- Qian, L.; Hu, L.; Zhao, L.; Wang, T.; Jiang, R. Sequence-Dropout Block for Reducing Overfitting Problem in Image Classification. IEEE Access 2020, 8, 62830–62840. [Google Scholar] [CrossRef]
- Fei, W.; Dai, W.; Li, C.; Zou, J.; Xiong, H. On Centralization and Unitization of Batch Normalization for Deep ReLU Neural Networks. IEEE Trans. Signal Process. 2024, 72, 2827–2841. [Google Scholar] [CrossRef]
- Zhijie, Y.; Lei, W.; Li, L.; Shiming, L.; Shasha, G.; Shuquan, W. Bactran: A Hardware Batch Normalization Implementation for CNN Training Engine. IEEE Embed. Syst. Lett. 2021, 13, 29–32. [Google Scholar] [CrossRef]
- Bentbib, A.H.; El Guide, M.; Jbilou, K.; Reichel, L. A global Lanczos method for image restoration. J. Comput. Appl. Math. 2016, 300, 233–244. [Google Scholar] [CrossRef]
- Muksimova, S.; Mardieva, S.; Cho, Y.-I. Deep encoder–decoder network-based wildfire segmentation using drone images in real-time. Remote Sens. 2022, 14, 6302. [Google Scholar] [CrossRef]
- Nie, L.; Li, C.; Marzani, F.; Wang, H.; Thibouw, F.; Grayeli, A.B. Classification of Wideband Tympanometry by Deep Transfer Learning With Data Augmentation for Automatic Diagnosis of Otosclerosis. IEEE J. Biomed. Health Inform. 2022, 26, 888–897. [Google Scholar] [CrossRef]
- Available online: https://github.com/gradio-app/gradio (accessed on 2 July 2024).
- Keun, K.T.; Paik, J.K.; Kang, B.S. Contrast enhancement system using spatially adaptive histogram equalization with temporal filtering. IEEE Trans. Consum. Electron. 1998, 44, 82–87. [Google Scholar]
- Available online: https://www.ultralytics.com/ (accessed on 4 June 2024).
- Shakhnoza, M.; Sabina, U.; Sevara, M.; Cho, Y.-I. Novel Video Surveillance-Based Fire and Smoke Classification Using Attentional Feature Map in Capsule Networks. Sensors 2021, 22, 98. [Google Scholar] [CrossRef] [PubMed]
- Zhang, R.; Yao, W.; Shi, Z.; Ai, X.; Tang, Y.; Wen, J. Towards Multi-Scenario Power System Stability Analysis: An Unsupervised Transfer Learning Method Combining DGAT and Data Augmentation. IEEE Trans. Power Syst. 2023, 38, 5367–5380. [Google Scholar] [CrossRef]
- Hussain, Z.; Gimenez, F.; Yi, D.; Rubin, D. Differential data augmentation techniques for medical imaging classification tasks. In AMIA Annual Symposium Proceedings; American Medical Informatics Association: Bethesda, MD, USA, 2017; Volume 2017. [Google Scholar]


| Satellite Name | Operator | Polarization | References |
|---|---|---|---|
| RADARSAT-1 | Canadian Space Agency (CSA) | Single-HH | [12,13,14,15] |
| RADARSAT-2 | Canadian Space Agency (CSA) | Quad | [16,17,18,19,20,21,22] |
| RISAT-1 | India | Quad | [23,24,25] |
| Kompsat-5 | Korea | Dual | [26,27,28] |
| Sentinel-1 | European Space Agency (ESA) | Dual | [28,29,30,31,32] |
| Feature Category | Feature | References |
|---|---|---|
| Geometric(Shape) | Area Perimeter Spreading Shape factor | [33,34,35,36,37] |
| Statistical | Object standard deviation Object mean value Max contrast Mean border gradient Max gradient | [38,39,40,41,42] |
| Texture | Contrast Homogeneity Entropy Correlation Dissimilarity | [13,15,39,43] |
| Application | DL Model | Data | Architecture | Data Size | Reference |
|---|---|---|---|---|---|
| Segmentation | AEs | SLAR | LSTM/Selectional AE | 256 × 256 | [24,56] |
| GANs | ERS-1/2, ENVISAR ASAR | Adversarial f-divergence | 256 × 256 | [18] | |
| CNN | Radarsat-1/2 | DeepLabv3+/SegNet | 321 × 321/256 × 256 | [8,20,57] | |
| Classification | AEs | AVIRIS/RADARSAT-2 | Stacked AE/DBN | 20 × 20 | [51,58] |
| DBN | Radarsat-2 | DBN with RBM | 32 × 32 | [59] | |
| RNN | SLAR | MLPs, LSTM, Vanilla-RNN, B-LSTM | 256 × 256 | [18] | |
| Detection | CNN | SLAR | Two-stage CNN | 28 or 50 per side | [60] |
| Unmanned aerial vehicle | Faster R-CNN | - | [61] | ||
| VV and VH | Res-Net 101 | 1024 × 1024 | [62] |
| Challenges | Overcome | |
|---|---|---|
| The process of preparing considerable amount of labeled data | yes | |
| Limitation or absence of accessible open-source annotated oil spill datasets | yes | |
| Hyper-parameter tuning | no | |
| Generalization across diverse datasets | yes | |
| Oil Spill (Source) Types | Tanker Spills | Pipeline Spills | Offshore Spills | Natural Spills |
|---|---|---|---|---|
| Oil spill types | Crude oils | Refined oils | Medium oils | Heavy oils |
| Environmental context | Marine | Fresh water | ||
| Spill characteristics | Surface oil | |||
| Total source images | 2417 | |||
| Different ocean scenes | Open sky | Cloudy | Rainy | Foggy (Hazy) |
| Total target images | 500 | |||
| Description | Values (Range) |
|---|---|
| Number of images | 1–1000 |
| Target image x-axis | 0–1500 |
| Target image y-axis | 0–1500 |
| Output folder | Specify |
| Contrast factor | 0.5–3 |
| Sharpness factor | 0.5–3 |
| Blur radius | 0–20 |
| Rotation angle | 0–360 |
| Equalize histogram | yes/no |
| Apply white balance | yes/no |
| Random crop width | 10–500 |
| Random crop height | 10–500 |
| Apply random crop | yes/no |
| Precision | Recall | F-1 | Precision-Recall mAP@0.5 | |||||
|---|---|---|---|---|---|---|---|---|
| 2419/14507 | Before | After | Before | After | Before | After | Before | After |
| Yolo-v8m-seg | 0.939 | 0.923 | 0.94 | 0.989 | 0.95 | 0.987 | 0.955 | 0.995 |
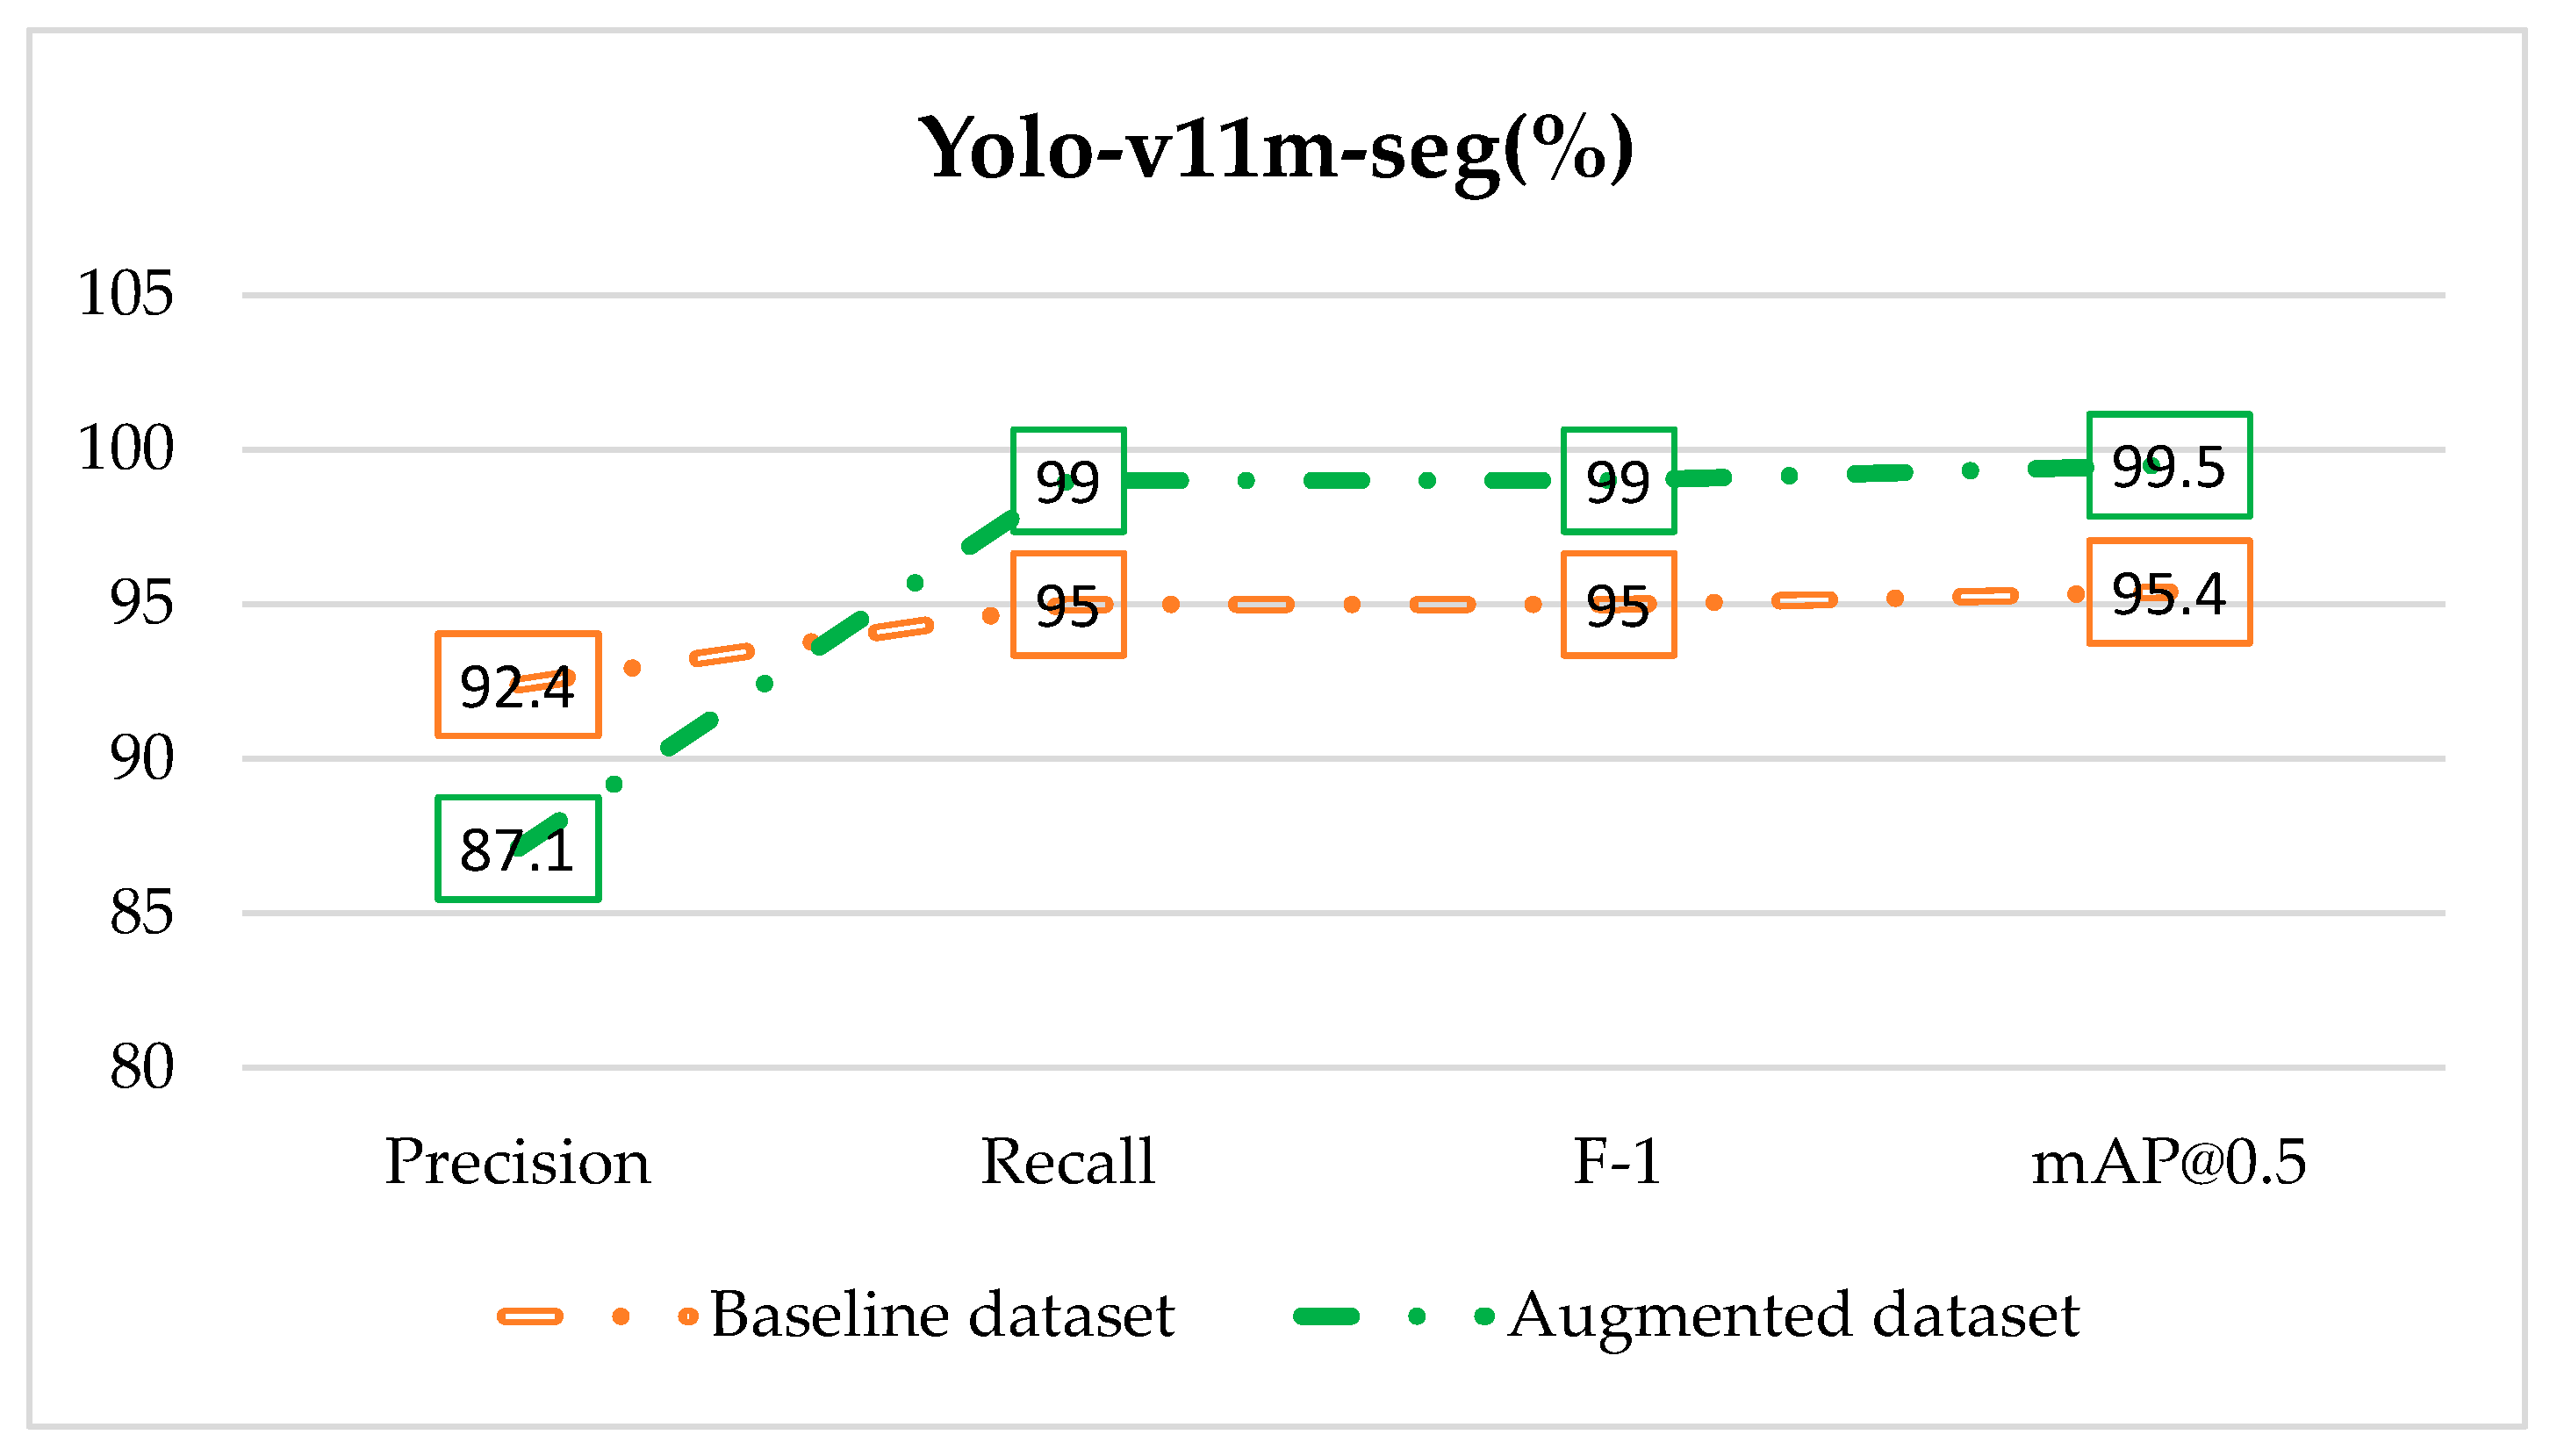
| Yolo-v11m-seg | 0.924 | 0.871 | 0.95 | 0.99 | 0.95 | 0.99 | 0.954 | 0.995 |
Disclaimer/Publisher’s Note: The statements, opinions and data contained in all publications are solely those of the individual author(s) and contributor(s) and not of MDPI and/or the editor(s). MDPI and/or the editor(s) disclaim responsibility for any injury to people or property resulting from any ideas, methods, instructions or products referred to in the content. |
© 2025 by the authors. Licensee MDPI, Basel, Switzerland. This article is an open access article distributed under the terms and conditions of the Creative Commons Attribution (CC BY) license (https://creativecommons.org/licenses/by/4.0/).
Share and Cite
Akhmedov, F.; Khujamatov, H.; Abdullaev, M.; Jeon, H.-S. A Novel Oil Spill Dataset Augmentation Framework Using Object Extraction and Image Blending Techniques. Remote Sens. 2025, 17, 336. https://doi.org/10.3390/rs17020336
Akhmedov F, Khujamatov H, Abdullaev M, Jeon H-S. A Novel Oil Spill Dataset Augmentation Framework Using Object Extraction and Image Blending Techniques. Remote Sensing. 2025; 17(2):336. https://doi.org/10.3390/rs17020336
Chicago/Turabian StyleAkhmedov, Farkhod, Halimjon Khujamatov, Mirjamol Abdullaev, and Heung-Seok Jeon. 2025. "A Novel Oil Spill Dataset Augmentation Framework Using Object Extraction and Image Blending Techniques" Remote Sensing 17, no. 2: 336. https://doi.org/10.3390/rs17020336
APA StyleAkhmedov, F., Khujamatov, H., Abdullaev, M., & Jeon, H.-S. (2025). A Novel Oil Spill Dataset Augmentation Framework Using Object Extraction and Image Blending Techniques. Remote Sensing, 17(2), 336. https://doi.org/10.3390/rs17020336