Abstract
As an effective geophysical tool, ground penetrating radar (GPR) is widely used for environmental and engineering detections. Numerous numerical simulation algorithms have been developed to improve the computational efficiency of GPR simulations, enabling the modeling of complex structures. The discontinuous Galerkin method is a high efficiency numerical simulation algorithm which can deal with complex geometry. This method uses numerical fluxes to ensure the continuity between elements, allowing Maxwell’s equations to be solved within each element without the need to assemble a global matrix or solve large systems of linear equations. As a result, memory consumption can be significantly reduced, and parallel solvers can be applied at the element level, facilitating the construction of high-order schemes to enhance computational accuracy. In this paper, we apply the discontinuous Galerkin (DG) method based on unstructured meshes to 3D GPR simulation. To verify the accuracy of our algorithm, we simulate a full-space vacuum and a cuboid in a homogeneous medium and compare results, respectively, with the analytical solutions and those from the finite-difference method. The results demonstrate that, for the same error level, the proposed DG method has significant advantages over the FDTD method, with less than 20% of the memory consumption and calculation time. Additionally, we evaluate the effectiveness of our method by simulating targets in an undulating subsurface, and further demonstrate its capability for simulating complex models.
1. Introduction
Ground penetrating radar (GPR), as an effective geophysical tool, is widely used in engineering detection, coal mining, underground pipeline detection, and tunnel inspection [1,2,3,4,5,6,7,8]. Currently, GPR data interpretation mainly focuses on relatively well-developed imaging techniques. The most commonly used numerical simulation algorithms in GPR include the finite-difference method in time domains (FDTD) [3,9,10,11], the finite-volume method (FV) [5], and the finite-element method (FE) [12,13,14]. Among these methods, the FDTD method uses differences to approximate spatial derivatives to obtain an explicit semi-discrete form, and then choose a flexible scheme for time discretization. The advantage of this method is that it can handle the discontinuity of the electromagnetic (EM) field inside the medium well and it is easy to program [5]. However, this method uses one-dimensional (1D) polynomials to approximate the EM field, so that it can only solve high-dimensional problems on 1D basis. Moreover, the structured grids make this method less suitable for models with complex structures. The FV method divides the computational domain into a series of non-overlapping control volumes and obtains the discrete equations by integrating the differential equations for the field over each control volume. The conservation of the field in the computational region is ensured by the conservation of the field in each control volume. However, the accuracy improvements of this method, achieved by constructing higher-order schemes, tend to make the equations extremely complex and unstable, which can undermine the flexibility of the algorithm. The FE method can flexibly choose hexahedral or unstructured tetrahedral grids that can well fit complex structures in the underground. The method can construct high-order schemes relatively easily by increasing the degree of freedom (DoF) or take different orders in different elements. Various adaptive FE methods are now available that can achieve adaptivity of the mesh or the order. However, the traditional FE method needs to assemble and solve large linear equation systems and takes a lot of resources, and thus, the computational efficiency is limited. Based on these methods, many tools and software have been developed that are widely used in GPR simulation, including GprMax, COMSOL Multiphysics, CST Studio Suite, E3D (Electromagnetic 3D) et al. Among these tools, GprMax and E3D are based on the FDTD method, COMSOL Multiphysics is mainly based on the FEM method, and the CST Studio Suite supports a variety of solution methods, including FEM and FDTD methods. In recent years, to obtain efficient high-accuracy numerical simulation methods, Feng et al. proposed an algorithm that combines the time-domain FD and FE methods to deal with the forward problem of irregular and complex tunnel models [15], they further used the wavelet FE for GPR simulation and solved complex problems with large gradients and singularities [16]. Li et al. applied the pseudo-spectral method based on GPU acceleration to 3D GPR forward modeling that improved computational efficiency [17].
To solve the steady-state neutron transport equation, Reed first proposed the discontinuous Galerkin (DG) method in 1973 [18]. The DG method splits the unknowns at grid interfaces into two independent elements and uses numerical fluxes to ensure continuity of fields between adjacent elements. The current DG methods are mainly divided into two levels: the element level and the subdomain level. The DG method at the element level discretizes the equations in space and time at each element, solves Maxwell’s equations, and shares information via the interfaces between adjacent elements. The DG method at the subdomain level shares information via the intersections between subdomains, each of which contains several elements, and computation in different subdomains can be performed in parallel [19]. These two approaches are essentially similar, especially when a subdomain has only one element, the subdomain-based DG equivalent to the element-based one. The most important feature of DG is that the basis functions are defined on local cells and are constructed in such a way that the residual in each cell is orthogonal to all test functions. This results in a strictly localized scheme [20] and facilitates the implementation of parallel computations. As a result, the method can use different grid types on different cells and can adaptively implement arbitrarily non-conformal grids for modeling complex structures [21]. In addition, the arbitrarily high-order nodal basis functions can be used for different cells, while the continuity of the tangential electric field is ensured by numerical fluxes without the need for divergence correction. The DG method has the following advantages: (1) the equations are solved inside each element, and one does not need to assemble large matrices, so the memory consumption is low and the parallel computation is easy to apply; (2) different meshes and orders of the basis functions can be used in different cells, which makes the method flexible for handling complex underground structures; (3) the construction of high-order schemes is easy, which can effectively improve the computational accuracy. The DG method combines the advantages of the FV method, which allows flexible selection of numerical fluxes, and those of the FE method in terms of grid flexibility.
In the field of geophysics, Lu et al. first used the DG method for two-dimensional (2D) GPR simulation [22], while Etienne et al. combined the DG method with the CPML (Convolutional Perfectly Matched Layer) absorbing boundary condition for 3D seismic wavefield simulation [23]. Mercerat and Glinsky used the high-order nodal DG method to solve the elastic wave equation in 2D arbitrary non-homogeneous media [24], He et al. conducted an in-depth study on the Runge–Kutta DG method for 2D acoustic wave equations [25], Zhang et al. extended their 2D DG method to simulate seismic waves field in complex media [26], and Feng et al. proposed a high-order 2D GPU-DGTD method for GPR simulation based on unstructured grids, which improved the efficiency of GPR simulation [27].
Although geophysicists have conducted relevant research on the application of the DG method to GPR, most studies focused on two-dimensional cases, and research on the application of the DG method to three-dimensional GPR forward modeling is relatively scarce. In this paper, we introduce the theory of the 3D DG method for GPR forward modeling systematically, and then we use the DG method to simulate a 3D GPR problem, in which we introduce the UPML boundary condition to attenuate the outward propagating EM waves to ensure that the outer boundary of the simulation domain meets the perfect electrical conductor (PEC) boundary condition. To verify the accuracy of the algorithm, we compare our model results with the analytical solutions and those from the FDTD method for a full-space vacuum model. Finally, to check the effectiveness of our DG method for complex models we simulate the EM wavefield for a half-space with multiple bodies embedded and an undulating surface.
2. Methods
2.1. Governing Equations
The propagation of EM waves in a lossy medium satisfies the time-domain Maxwell’s equations, i.e.,
where and are the electric and magnetic field, respectively, , and are the electrical conductivity, magnetic permeability, and electric permittivity, and is the source current.
Considering that an unstructured tetrahedral mesh can effectively fit the complex structures in the underground, we use unstructured tetrahedra in our spatial discretization. For this purpose, the entire computational domain Ω is discretized into non-overlapping tetrahedral cells . We further assume that the electrical conductivity , the magnetic permeability , and the electric permittivity are constant in each cell. To solve Equations (1) and (2), the weighted integral of the residual for each tetrahedral cell is assumed to be 0, i.e.,
where denotes the weighted/test functions. Using the vector identities and reformulating (3) and (4), we obtain the weak form of DG algorithm as follows:
where is the local outward-pointing normal unit vector at cell interfaces. According to the basic principle of the DG method, the numerical flux is used to exchange the information between adjacent cells. Replacing the surface integrals in the above equations by numerical fluxes, we obtain
In Equations (7) and (8), the numerical fluxes take the form given by Hesthaven and Warburton [20], namely,
where , are, respectively, the impedance and conductance of the current tetrahedral cell ,. , are the impedance and conductance of the adjacent cell that shares one common interface with , , are the electric and magnetic fields at the nodes of the cell adjacent to .
For numerical simulation, one needs to perform spatial discretization. In this study, we use the unstructured tetrahedra to spatially discretize the model domain and assign the DoFs to the nodes. Then, the EM fields in the , and directions at any position within a tetrahedral cell can be written as
where denotes the number of nodes in the cell, with its value related to the order of the interpolation functions. In (11) and (12), correspond to , and directions, respectively. and are the electric and magnetic field at the nodes. denotes the interpolation basis functions.
Substituting (11) and (12) into (7) and (8) and setting the interpolation basis functions as weighting functions , we obtain the following equations for the EM fields, i.e.,
where is the mass matrix, and , , and are the stiffness matrices corresponding to three coordinate axes. Their specific forms can be written as
and the source terms , , can be written as
while the numerical fluxes, , , , , , and , can be expressed as
where , , , , , and are the discrete forms of the numerical fluxes on the face in cell , which can be expressed as
In Equations(26)–(31), denotes the number of triangles in a tetrahedron, and are the surface mass matrices of the inner and outer sides of which can be written as
2.2. Nodal Basis Functions
Since the DG method provides flexibility in selecting the basis functions, in this study, we choose the hierarchical orthogonal basis functions defined on standard tetrahedra for our modeling. The hierarchical basis functions are backward-compatible, meaning that the higher-order basis functions contain the lower-order ones. As a result, the higher-order basis functions can be easily obtained after the lower-order basis functions have been constructed. In the GPR forward modeling, increasing the order of the basis function can increase the points per wavelength and improve the sampling rate, and thereby enhance the calculation accuracy.
In the following, we first define the order of Proriol–Koornwinder–Dubiner polynomials [20] on a standard tetrahedron as
where denotes the number of nodes. . is the Jacobi polynomial of order. When , becomes the Legendre polynomial. To explicitly construct the interpolation basis functions in the physical domain, we define the following Vandermonde matrix, , i.e.,
where are the coordinates of the interpolation nodes. Then, the interpolation basis function, , can be written as
where T represents the matrix transposition.
In the forward simulation, a reasonable distribution of interpolation nodes can help prevent oscillations in the numerical solution [28]. Zhu et al. have shown that the Gauss–Lobatto–Legendre (GLL) points are the optimal interpolation nodes for a regular hexahedral mesh (Figure 1a), however a simple mapping of these points to a tetrahedral cell results in large numbers of nodes overlapping at the vertices (Figure 1b). To obtain a point set with better interpolation properties, the equidistant nodes are stretched to the optimal positions, so that the nodes cluster toward the endpoints and the Warp & Blend (W&B) nodes can be obtained [29]. Figure 1c shows the distribution of 4th-order interpolation nodes.
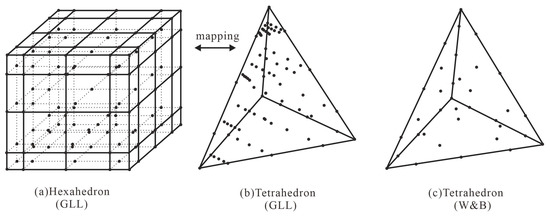
Figure 1.
Fourth-order of interpolation nodes. (a) GLL interpolation nodes on regular hexahedral mesh; (b) GLL nodes in (a) are mapped to a tetrahedral mesh; (c) W&B nodes.
Since the polynomial in (39) is constructed on the standard tetrahedron, in the actual calculation, a tetrahedral cell in the physical domain with , and can be mapped to the standard tetrahedral cell via the following Jacobi matrix through the affine transformation, i.e.,
Then, we can calculate the mass and stiffness matrices in Equations (19)–(25) for each cell in the physical domain using the integration operator . Similarly, the surface integral in Equation (32) can also be calculated using a 2D Jacobi matrix.
2.3. Time Discretization
Depending on the difference scheme, the time discretization can take explicit, implicit, or hybrid formats. The explicit time discretization can obtain conditionally stable explicit equations with direct time recurrence, which further facilitate parallel computations. In this study, we use the low-storage explicit 5th grade and 4th-order Runge–Kutta (LSERK) method [30,31]. For this purpose, the ordinary differential equations in Equations (13)–(18) are rewritten in standard form, i.e.,
with the solution being obtained recursively by
where denotes the EM field at the time step n, while denotes the field at the time step n + 1. is the time step, , , are the LSERK coefficients. To satisfy the convergence condition, the time step must satisfy the following condition, i.e.:
where α is an empirical parameter, is the minimum grid size, is the maximum propagation velocity of the EM field, and the parameter CFL generally takes a constant related to the order of the interpolation functions. In all numerical examples in this paper, for the N-order interpolating basis function, the CFL parameter is .
2.4. Application of UPML Absorbing Boundary
When numerically solving Maxwell’s equations, we generally assume the Dirichlet boundary condition at the outer boundary. To implement this, we need to set the model domain to a very large size. This will lead to a sharp increase in the number of grid points and unknowns. To mitigate this, we use an additional truncated boundary to absorb EM waves, allowing us to achieve high computational accuracy with a small computational domain.
The PML boundary is frequently used in GPR modeling; however, it requires the splitting of EM fields. This consumes a large amount of memory and increases the difficulty of numerical calculations [26]. To address these issues, Sacks et al. developed the uniaxial perfectly matched layer (UPML) [32]. Their method is similar to PML except that it does not require splitting the EM field.
In the following, we first add a dissipative layer outside the boundary of the computational domain, whose wave impedance perfectly matches that of the adjacent medium. We then introduce four auxiliary variables in the dissipative layer to construct the following control equations:
where , , , and are the auxiliary variables, and
Equations (52)–(57) can be solved in a manner similar to Equations(13)–(18). After solving these equations, we can exchange the information on the internal and external EM fields by calculating the numerical fluxes at boundaries between the model domain and the UPML and then proceed with the iteration for the next time step. Due to the rapid attenuation of EM waves in the UPML, the EM field at the outer boundary effectively disappears, satisfying the PEC condition for the EM field. In this way, we can maintain the modeling accuracy while significantly reducing the size of model domain.
2.5. Calculation Flow of the DG Method
The calculation process of the DG method is reorganized as shown in Figure 2, consisting of five main steps: (1) generating tetrahedral elements using mesh generation software; (2) setting the order of the interpolation basis function and calculating the corresponding time step length; (3) calculating the volume integrals and surface integrals for all elements based on the fundamental principles of the DG method; (4) obtaining the field values at the next time step through explicit time stepping; (5) interpolating to obtain the fields at the observation points.
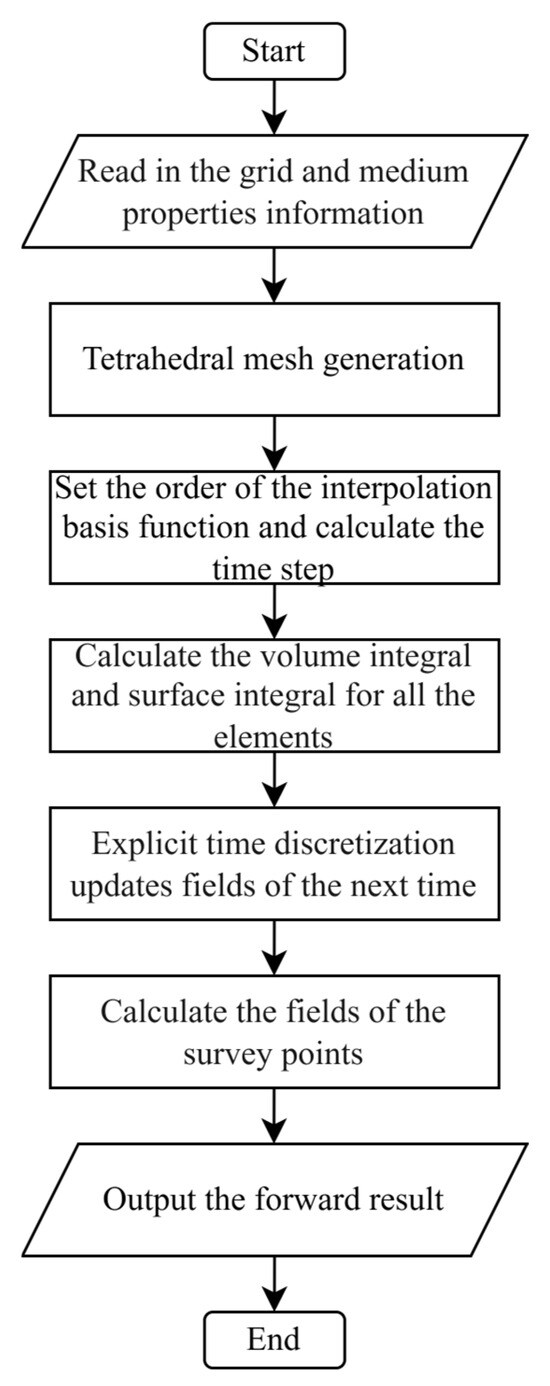
Figure 2.
Calculation flow chart of 3D DG method based on the unstructured tetrahedral mesh.
3. Numerical Experiments
3.1. Accuracy Analysis
To verify the accuracy of our DG method for 3D GPR forward modeling, we simulate the model of a full-space vacuum of 1 m × 1 m × 1 m and compare the results with analytical solutions. The transmitting source is a dipole located at the center of the model with a center frequency of 1 GHz. For our DG forward modeling, we discretize the computational domain into 17,251 tetrahedral cells, generating 414,024 unknowns. To more accurately describe the sharp changes in EM fields near the transmitting source and receivers, the grid is locally refined in the vicinity of the antenna and receiver sites. The time step is set to s, the time window is 9 ns. For FDTD algorithm, we set the grid sizes in three directions to m, creating a total of 100 × 100 × 100 grids. The time step and time window are the same as for the DG method.
Figure 3 shows the electric field at (0.1 m, 0 m, 0 m) and the relative errors with respect to 1D analytical solutions. It can be seen that the waveforms at the receiver location, calculated by both DG and FDTD methods, match well with the analytical solutions, with the maximum relative errors less than 5% except when the amplitude is close to 0. The oscillation of the relative error for the DG method is weaker than that of FDTD method. This implies that our DG method can achieve higher computational accuracy than the FDTD method.

Figure 3.
Accuracy verification for a full-space vacuum model. (a) Comparison of DG results from this paper with FDTD and analytical solutions; (b) relative errors in percentage of DG results; (c) relative errors of FDTD results.
3.2. Influence of the Order of Basis Functions on Modeling Accuracy
A distinguished advantage of the DG method is that its modeling accuracy can be easily improved by increasing the order of the basis function. To examine the influence of the order of basis functions on the computational accuracy, we perform the forward simulation again for the model in Figure 3 using the DG method at different orders and compare results with the analytical solutions. To evaluate the accuracy, we also calculate the error, defined as
where and denote the numerical and the analytical solutions, respectively. The summation is run over all time steps.
To perform the modeling using the DG method, we generate a total of 6988 tetrahedral grids and perform the simulation using the first, second, and third-orders of the basis functions, while for the FDTD modeling, we use three sets of grids. The first set of grids has a grid size of m, and the absorption layer has a thickness of 0.2 m, generating a total of 56 × 56 × 56 = 175,616 cells. The second set of grids has a grid size of m, the absorption layer has a thickness of 0.2 m, generating a total of 70 × 70 × 70 = 343,000 grids. The third set of grids has a grid size of m, and the absorption layer has a thickness of 0.2 m, generating a total of 140 × 140 × 140 = 2,744,000 grids. For simplicity, we denote the three grid models as FDTD-1, FDTD-2, and FDTD-3. The transmitting source is a Ricker wavelet excited by an electric dipole source in the z-direction with a center frequency of 1 GHz. The transmitter is placed at the center of the model, while the receiver is located 0.1 m from the transmitter.
The single-channel signal curves at the receiver obtained by the DG method using different orders and the 3D FDTD method with three sets of grids are shown in Figure 4. From Figure 4a,c,e, we can see that the result from the first order of the DG method and FDTD-1, the result of the second order of the DG method and FDTD-2, and the result of the third order of the DG method and FDTD-3 all agree well with the analytical solutions. Moreover, from a closer look at the waveform in the later time (7–9 ns), it is evident that the oscillation of the later time signal from the DG method is much weaker than that from the FDTD method.
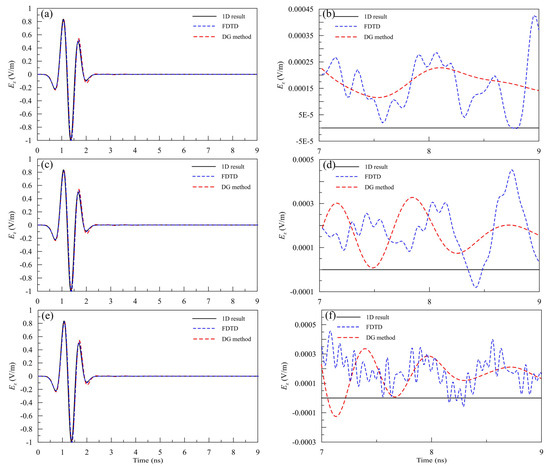
Figure 4.
Comparison of DG results for different orders of basis functions, the FDTD results for different grids, and the analytical solutions for the model in Figure 4. (a,c,e) are for 1st-, 2nd-, and 3rd-orders of basis functions in the DG method, and for grid models FDTD-1, FDTD-2, and FDTD-3 in the FDTD method, while (b,d,f) are the local view of the signal between 7 and 9 ns.
Table 1 shows the computational parameters for the DG method with different orders and the FDTD method with different meshes. It is seen that for the same set of grids, increasing the order of the interpolation basis functions in the DG method can achieve the same effect as grid refinement in the FDTD method. Meanwhile, for a similar error level, the number of grids and the degrees of freedom (DoFs) in the DG method are significantly fewer than those in the FDTD method. This implies that our DG method can well reduce memory consumption. By comparing (b,d,f) in Figure 4, we can see that for the DG method, as the order increases from the first-order to third-order, the amplitude error gradually decreases and the precision gradually improves. For the FDTD method, the amplitude error gradually decreases with the decrease in the mesh scale; this is because the smaller cell size can obtain higher calculation accuracy.

Table 1.
Computational pamameters.
3.3. Experiments with Anomalous Body Model
To further verify the effectiveness of our DG algorithm, we designed a model with four anomalous bodies. As shown in Figure 5, the length, width, and height of the simulation area are set to be m, m, m, respectively. The first layer below the air layer has a relative permittivity of 6.0, a conductivity of 0.0005 S/m, and a thickness of 0.2 m. There are three cuboid cavities embedded, with sizes set to 0.1 m × 0.2 m × 0.1 m, and the center coordinates of the three bodies from left to right are (−0.3 m, 0 m, 0.45 m), (0 m, 0 m, 0.45 m), and (0.3 m, 0 m, 0.45 m), respectively. The second layer below the air layer has a relative permittivity of 12.0, a conductivity of 0.001 S/m, and a thickness of 0.4 m. There is a cuboid cavity with the dimensions of 0.2 m × 0.2 m × 0.1 m embedded. The center of the cuboid cavity is located at (0 m, 0 m, 0.75 m).
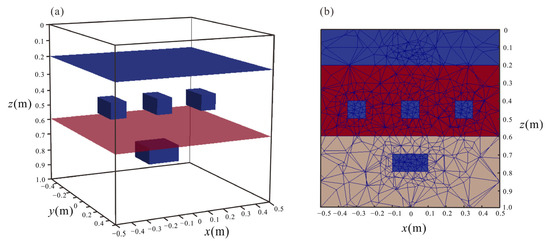
Figure 5.
(a) Four cuboid cavities embedded in a layered medium model; (b) mesh for the model at profile y = 0 m.
The transmitting source is a dipole source in the y direction, with a central frequency of 600 MHz, the time window is set to be 18 ns. The transmitter and the receiver are located, respectively, at (−0.05 m, 0 m, 0.15 m) and (0.05 m, 0 m, 0.15 m). The FDTD method with different grid scales is also used to simulate the model to further verify the superiority of the DG method proposed in this paper. In the FDTD simulation with coarse mesh, the step size is 0.0025 m, generating a total of 400 × 400 × 400 = 64,000,000 grids, the time step is 0.004 ns. In the FDTD simulation with fine mesh, the step size is 0.01 m, generating a total of 100 × 100 × 100 = 1,000,000 grids, the time step is 0.004 ns. In the DG simulation, we generate a total of 15,098 tetrahedral grids and perform the simulation using the third-order basis function, with a time step of 0.004 ns.
Figure 6 shows the single-channel signal at the receiver obtained by DGTD and FDTD of two mesh sizes. The black solid line, the blue dashed line, and the red dashed line represent the results of DGTD, the coarse-mesh FDTD, and fine-mesh FDTD, respectively. It is seen that the results obtained by the three methods fit well with each other.

Figure 6.
Modeling results for the model in Figure 7.
Table 2 shows the DoFs generated by the three methods and the time and memory consumed for the forward modeling. As seen from the table, the DoF generated by coarse-mesh FDTD is similar to that generated by DGTD using the third-order basis function. The DoF generated by fine-mesh FDTD is much larger than that of coarse-mesh FDTD and DGTD. In this case, the calculation time and memory consumption of DGTD are much smaller than those of both coarse-mesh and fine-mesh FDTD, while its calculation result is similar to those of FDTD of two mesh sizes. Thus, we believe that the DGTD method presented in this paper can achieve high-efficiency and high-precision calculation results while saving memory and time.

Table 2.
Computational pamameters.
3.4. Experiments with Undulating Surface Model
In this section, we design a more complex model with anomalous bodies under an undulating interface. The numerical results in Section 3.1, Section 3.2 and Section 3.3 demonstrate that, for the same grid, the third-order basis function not only achieves relatively high precision but also significantly reduces computational time. Therefore, to fully leverage the advantages of the DG method, we employ the third-order interpolating basis function in this model for forward simulations. As shown in Figure 7, the model domain has a size of 1.2 m × 1.2 m × 1.0 m. The top layer is the air layer, and the layer under the air has a relative permittivity of 5.0 and a conductivity of 0.002 S/m. The underlying half-space has a relative permittivity of 9.0 and a conductivity of 0.005 S/m. Between the top layer and the underlying half-space, there exists an undulating interface. Two air-filled bodies are embedded in the half-space. The radius of the cylinder is 0.05 m, and the length is 0.2 m. The size of the cuboid body is 0.1 m × 0.2 m × 0.1 m. Their centers are located at (−0.35 m, −0.35 m, 0.3 m) and (0.35 m, 0.35 m, 0.3 m), respectively.
We discretize the model into 265,152 tetrahedral grids. The transmitting source uses a Ricker wavelet with a center frequency of 1 GHz. The time step is s, and the time window is 9 ns. The transmitting antenna is located at the air–earth interface. The offset between the transmitter and receiver antennas is 0.1 m.
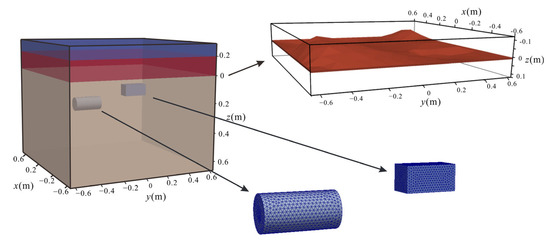
Figure 7.
Two bodies buried under an undulating surface.
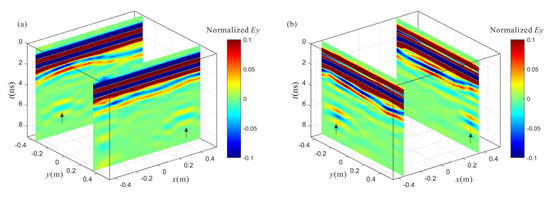
Figure 8 shows the model profile of the model in Figure 7. Figure 8a shows the model profile at y = −0.35 m, 0.35 m. Figure 8b shows the model profile at x = −0.35 m, 0.35 m.
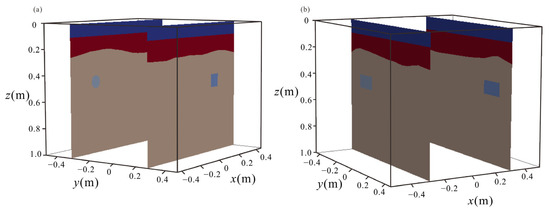
Figure 9a,b shows the profile of the normalized electric field at the survey lines y = −0.35 m and 0.35 m, and x = −0.35 m and 0.35 m. From these figures, one can clearly see the reflections from both the undulating interface and the anomalous bodies in addition to the direct waves at the time less than 3 ns. This proves that, in addition to the simple target bodies, our DG algorithm can effectively simulate the undulating interface. This capability will aid in the interpretation of GPR data for more complex underground structures.
4. Discussion
The DG method is a high-order numerical simulation method. Increasing the order of the basis function improves computational accuracy without the need to increase the number of elements. Additionally, since the method uses numerical fluxes to exchange information between elements, it facilitates parallel computation at the element level. The explicit time discretization approach eliminates the need to assemble large sparse matrices, and thus significantly reduces memory usage. The DG method, developed based on the tetrahedral mesh, can effectively accommodate irregular undulating interfaces, thereby improving the accuracy of forward simulations for complex models that better reflect real-world scenarios.
The time step of our method is highly dependent on the size of the elements. When the computational domain contains fine structures, the element size in the model becomes very small, which necessitates the use of very small time steps and leads to an increase in computational time. To address this issue, we will try to combine implicit and explicit time discretization methods in our future research. In regions with fine meshes, we will use explicit time discretization, while in areas with coarser meshes, we will employ an unconditionally stable implicit time discretization method. This approach will further improve computational efficiency.
5. Conclusions
Based on the discontinuous Galerkin finite-element method and the UPML absorption layer we have successfully developed a 3D algorithm for GPR modeling. The locality of the algorithm results in the memory consumption very limited and parallel computation very easy. The accuracy check against the analytical solutions showed that our DG method has high accuracy. Moreover, the comparison with the FDTD method for different grids showed that our DG method either achieves higher accuracy or generates much less cells/unknowns. This greatly reduces memory consumption and enables the simulation of complex models. The UPML absorption layer effectively suppresses reflection waves, making it possible to simulate GPR responses within a small model domain. Numerical experiments for a half-space with anomalous bodies and an undulating surface in the underground showed that our DG method can simulate complex underground structures and identify underground targets. The calculation results further demonstrated that, for the same error level, the proposed DG method has significant advantages over the FDTD method, with less than 20% of the memory consumption and calculation time. This will help GPR in detecting complex underground structures via high-accuracy 3D imaging and interpretation.
Author Contributions
Conceptualization, S.X., C.Y. and J.L.; methodology, S.X., C.Y. and J.L.; software, S.X.; formal analysis, S.X.; investigation, S.X., C.Y., J.L., J.Z. and W.L.; writing—original draft preparation, S.X.; writing—review and editing, S.X., C.Y. and W.L.; visualization, S.X., C.Y. and J.L.; funding acquisition, C.Y. and J.L. All authors have read and agreed to the published version of the manuscript.
Funding
This paper is financially supported by the Major Research Project on Scientific Instrument Development, China National Natural Science Foundation (recommended via department) (42327901), the National Natural Science Foundation of China (42030806).
Data Availability Statement
Data associated with this research are available and can be obtained by contacting the corresponding author.
Conflicts of Interest
The authors declare no conflicts of interest.
References
- Gurel, L.; Oguz, U. Three-dimensional FDTD modeling of a ground-penetrating radar. IEEE Trans. Geosci. Remote Sens. 2000, 38, 1513–1521. [Google Scholar] [CrossRef]
- Baradello, L.; Carcione, J.M.; Gei, D. Fast monostatic GPR modeling. Geophysics 2004, 69, 466–471. [Google Scholar] [CrossRef][Green Version]
- Roberts, R.L.; Daniels, J.J. Modeling near-field GPR in three dimensions using the FDTD method. Geophysics 1997, 62, 1114–1126. [Google Scholar] [CrossRef]
- Irving, J.; Knight, R. Numerical modeling of ground-penetrating radar in 2-D using MATLAB. Comput. Geosci. 2006, 32, 1247–1258. [Google Scholar] [CrossRef]
- Shankar, V.; Mohammadian, A.H.; Hall, W.F. A time-domain, finite-volume treatment for the Maxwell equations. Electromagnetics 1990, 10, 127–145. [Google Scholar] [CrossRef]
- Liu, H.; Dai, D.; Zou, L.; He, Q.; Meng, X.; Chen, J. Refined Modeling of Heterogeneous Medium for Ground-Penetrating Radar Simulation. Remote Sens. 2024, 16, 3010. [Google Scholar] [CrossRef]
- Chi, Y.; Pang, S.; Mao, L.; Zhou, Q.; Chi, Y. Research on Airborne Ground-Penetrating Radar Imaging Technology in Complex Terrain. Remote Sens. 2024, 16, 4174. [Google Scholar] [CrossRef]
- Xu, J.; Lai, Q.; Wei, D.; Ji, X.; Shen, G.; Yuan, H. The Ground-Penetrating Radar Image Matching Method Based on Central Dense Structure Context Features. Remote Sens. 2024, 16, 4291. [Google Scholar] [CrossRef]
- Bourgeois, J.M.; Smith, G.S. A fully three-dimensional simulation of a ground-penetrating radar: FDTD theory compared with experiment. IEEE Trans. Geosci. Remote Sens. 1996, 34, 36–44. [Google Scholar] [CrossRef]
- Ge, D.; Yan, Y. Finite-Difference Time-Domain Method for Electromagnetic Waves; Xi’an Electronic and Science University Press: Xi’an, China, 2005. [Google Scholar]
- Zhang, B.; Dai, Q.; Yin, X.; Feng, D. A new approach of rotated staggered grid FD method with unsplit convolutional PML for GPR. IEEE J. Sel. Top. Appl. Earth Obs. Remote Sens. 2015, 9, 52–59. [Google Scholar] [CrossRef]
- Wang, X.; Yu, T.; Feng, D.; Ding, S.; Li, B.; Liu, Y.; Feng, Z. A high-efficiency spectral element method based on CFS-PML for GPR numerical simulation and reverse time migration. IEEE J. Sel. Top. Appl. Earth Obs. Remote Sens. 2023, 16, 1232–1243. [Google Scholar] [CrossRef]
- Teixeira, F.L. FDTD/FETD methods: A review on some recent advances and selected applications. J. Microw. Optoelectron. Electromagn. Appl. (JMOe) 2007, 6, 83–95. [Google Scholar]
- Liu, H.; Xing, B.; Wang, H.; Cui, J.; Spencer, B.F. Simulation of ground penetrating radar on dispersive media by a finite element time domain algorithm. J. Appl. Geophys. 2019, 170, 103821. [Google Scholar] [CrossRef]
- Feng, D.; Wang, X.; Zhang, B. Specific evaluation of tunnel lining multi-defects by all-refined GPR simulation method using hybrid algorithm of FETD and FDTD. Constr. Build. Mater. 2018, 185, 220–229. [Google Scholar] [CrossRef]
- Feng, D.; Zhang, H.; Wang, X. Second-generation wavelet finite element based on the lifting scheme for GPR simulation. Appl. Geophys. 2020, 17, 143–153. [Google Scholar] [CrossRef]
- Li, Z.; Cao, X.; Zhu, Z. 3D forward simulation of ground penetrating radar pseudo-spectral method based on GPU parallel acceleration. J. Eng. Geophys. 2021, 18, 67–74. [Google Scholar] [CrossRef]
- Reed, W.H.; Hill, T.R. Triangular Mesh Methods for the Neutron Transport Equation; Los Alamos Scientific Lab.: Los Alamos, NM, USA, 1973. [Google Scholar]
- Ren, Q.; Sun, Q.; Tobón, L.; Zhan, Q.; Liu, Q.H. EB scheme-based hybrid SE-FE DGTD method for multiscale EM simulations. IEEE Trans. Antennas Propag. 2016, 64, 4088–4091. [Google Scholar] [CrossRef]
- Hesthaven, J.S.; Warburton, T. Nodal Discontinuous Galerkin Methods: Algorithms, Analysis, and Applications; Springer Science & Business Media: New York, NY, USA, 2007. [Google Scholar] [CrossRef]
- Zhan, Q.; Fang, Y.; Zhuang, M.; Yuan, M.; Liu, Q.H. Stabilized DG-PSTD method with nonconformal meshes for electromagnetic waves. IEEE Trans. Antennas Propag. 2020, 68, 4714–4726. [Google Scholar] [CrossRef]
- Lu, T.; Cai, W.; Zhang, P. Discontinuous Galerkin time-domain method for GPR simulation in dispersive media. IEEE Trans. Geosci. Remote Sens. 2005, 43, 72–80. [Google Scholar] [CrossRef]
- Etienne, V.; Chaljub, E.; Virieux, J.; Glinsky, N. An hp-adaptive discontinuous Galerkin finite-element method for 3-D elastic wave modelling. Geophys. J. Int. 2010, 183, 941–962. [Google Scholar] [CrossRef]
- Mercerat, E.D.; Glinsky, N. A nodal high-order discontinuous Galerkin method for elastic wave propagation in arbitrary heterogeneous media. Geophys. J. Int. 2015, 201, 1101–1118. [Google Scholar] [CrossRef]
- He, X.; Yang, D.; Wu, H. Numerical dispersion and wave-field simulation of the Runge-Kutta discontinuous Galerkin method. Chin. J. Geophys. 2014, 57, 906–917. [Google Scholar] [CrossRef]
- Zhang, J.; Yang, D.; He, X.; Ma, X. Discontinuous Galerkin method for solving wave equations in two-phase and viscoelastic media. Chin. J. Geophys. 2018, 61, 926–937. [Google Scholar] [CrossRef]
- Feng, D.; Liu, S.; Wang, X.; Wang, X.; Li, G. High-order GPU-DGTD method based on unstructured grids for GPR simulation. J. Appl. Geophys. 2022, 202, 104666. [Google Scholar] [CrossRef]
- Zhu, J.; Yin, C.; Ren, X.; Liu, Y.; Hui, Z.; Gu, Y. DC resistivity forward modelling for arbitrarily anisotropic media using the unstructured spectral element method. Chin. J. Geophys. 2021, 64, 4644–4657. [Google Scholar] [CrossRef]
- Warburton, T. An explicit construction of interpolation nodes on the simplex. J. Eng. Math. 2006, 56, 247–262. [Google Scholar] [CrossRef]
- Sun, Q.; Zhan, Q.; Ren, Q.; Liu, Q.H. Wave equation-based implicit subdomain DGTD method for modeling of electrically small problems. IEEE Trans. Microw. Theory Tech. 2017, 65, 1111–1119. [Google Scholar] [CrossRef]
- Zhan, Q.; Ren, Q.; Sun, Q.; Chen, H.; Liu, Q.H. Isotropic Riemann solver for a nonconformal discontinuous Galerkin pseudospectral time-domain algorithm. IEEE Trans. Geosci. Remote Sens. 2016, 55, 1254–1261. [Google Scholar] [CrossRef]
- Sacks, Z.S.; Kingsland, D.M.; Lee, R.; Lee, J.-F. A perfectly matched anisotropic absorber for use as an absorbing boundary condition. IEEE Trans. Antennas Propag. 1995, 43, 1460–1463. [Google Scholar] [CrossRef]
Disclaimer/Publisher’s Note: The statements, opinions and data contained in all publications are solely those of the individual author(s) and contributor(s) and not of MDPI and/or the editor(s). MDPI and/or the editor(s) disclaim responsibility for any injury to people or property resulting from any ideas, methods, instructions or products referred to in the content. |
© 2025 by the authors. Licensee MDPI, Basel, Switzerland. This article is an open access article distributed under the terms and conditions of the Creative Commons Attribution (CC BY) license (https://creativecommons.org/licenses/by/4.0/).
