Article

An Enhanced SAR-Based ISW Detection Method Using YOLOv8 with an Anti-Interference Strategy and Repair Module and Its Applications

College of Meteorology and Oceanography, National University of Defense Technology, Changsha 410073, China
*
Author to whom correspondence should be addressed.
Remote Sens. 2025, 17(19), 3390; https://doi.org/10.3390/rs17193390
Submission received: 18 September 2025 / Revised: 24 September 2025 / Accepted: 28 September 2025 / Published: 9 October 2025
(This article belongs to the Section Ocean Remote Sensing)

Abstract

Highlights

What are the main findings?
  • This study proposes a robust, lightweight detection method built upon the YOLOv8 framework, integrating an anti-interference strategy and a post-processing repair module. This approach significantly enhances detection accuracy by reducing the false detection rate from 50.20% in the baseline model to 6.00% (a reduction of 44.20 percentage points) and effectively reconstructs 85.2% of broken wave crest lines.
  • The application of this method to extensive SAR imagery reveals distinct spatio-temporal patterns of ISW activities in the Andaman Sea, Sulu Sea, and Celebes Sea, and identifies core activity areas in each region.
What is the implication of the main finding?
  • At the technical application level, this study proposes an automatic detection method for internal solitary waves. This method, by introducing an anti-interference strategy and a post-processing repair module, enhances the recognition accuracy of identifying internal solitary waves from massive satellite remote sensing images, providing a new technical means for nearshore engineering safety, underwater navigation support, and marine physics research.
  • At the level of marine science cognition, this method is utilized to conduct detailed observations on the spatio-temporal distribution of internal solitary waves in typical sea areas. Based on a systematic analysis of over four thousand satellite images, the study confirms some known active regions of internal solitary waves and reveals the characteristics of internal wave activities in different sea areas. These results enhance the understanding of the internal wave patterns in the relevant sea areas and provide support for subsequent research.

Abstract

The detection of internal solitary waves (ISWs) in the ocean using Synthetic Aperture Radar (SAR) images is important for the safety of marine engineering structures. Based on 4120 Sentinel SAR images obtained from 2014 to 2024, an ISW dataset covering the Andaman Sea (AS), the South China Sea (SCS), the Sulu Sea (SS), and the Celebes Sea (CS) is constructed, and a deep learning dataset containing 3495 detection samples and 2476 segmentation samples is also established. Based on the YOLOv8 lightweight model, combined with an anti-interference strategy, a multi-size block detection strategy, and a post-processing repair module, an ISW detection method is proposed. This method reduces the false detection rate by 44.20 percentage points in terms of anti-interference performance. In terms of repair performance, the repair rate reaches 85.2%, and the error connection rate is less than 3.1%. The detection results of applying this method to Sentinel images in multiple sea areas show that there are significant regional differences in ISW activities in different sea areas: in the AS, ISW activities peak in the dry season of March and are mainly concentrated in the eastern and southern regions; the western part of the SS and the southern part of the CS are also the core areas of ISW activities. From the perspective of temporal characteristics, the SS maintains a relatively high ISW activity level throughout the dry season, while the CS exhibits more complex seasonal dynamic features. The lightweight detection method proposed in this study has good applicability and can provide support for marine disaster prevention work.

1. Introduction

Internal solitary waves (ISWs) are a type of nonlinear fluctuation phenomenon characterized by large amplitude, long wavelength, and strong currents in the density-stratified ocean, which pose a serious threat to the safe operation of offshore oil and gas platforms, marine risers, and various types of navigation vehicles. At present, monitoring hazardous ISWs and issuing warnings for them are important for preventing ISW damage in the production and operation of offshore engineering structures [1]. The monitoring of ISWs is mainly based on in situ measurements and remote-sensing observations. By deploying sensors in specific sea areas to directly measure temperature and salinity fluctuations, the time evolution and propagation characteristics of ISWs in local sea areas can be obtained. Although the in situ measurements method provides abundant basic information for ISW scientific research, it also has the disadvantages of high cost, difficult deployment, and limited data coverage. Remote-sensing observation methods such as Synthetic Aperture Radar (SAR) [2,3,4] and optical remote sensing provide a wide-area, non-contact detection means for ISW monitoring, effectively overcoming the limitations of the direct detection method. Remote-sensing observations provide crucial technical support for research in areas such as the safe operation of marine engineering structures and ocean dynamic processes [5].
Research on methods for detecting ISWs in remote-sensing images began with breakthroughs in imaging mechanisms. Since Apel [6] laid the foundation for the remote-sensing imaging mechanism of ISWs in 1985, scholars have gradually developed ISW detection methods based on traditional image processing algorithms. In early studies, Hogan et al. [7] attempted to extract the crest lines using the Hough transform. However, as this method is only applicable to linear features, it cannot effectively match the typical curve morphology of ISWs, resulting in poor detection performance. In contrast, wavelet analysis shows stronger adaptability. Rodenas et al. [8,9] successfully achieved the extraction of ISW features based on wavelet analysis. Dokken et al. [10] effectively identified ISWs in remote-sensing images of the Norwegian coast by combining the wavelet transform and the Fourier transform. Surampudi et al. [11] further verified the regional applicability of this method in the Andaman Sea and the Mozambique Channel. Edge detection methods are also used for detection. Xu et al. [12] adopted the Canny operator to identify multiple clusters of ISW packets and achieved wave packet separation through hierarchical clustering. Zheng et al. [13] proposed a strategy combining column-separated neighborhood processing with Canny edge detection, supplemented by cosine function fitting, which significantly improved the accuracy of crest line positioning. Such methods are widely applied in the study of ISWs in typical sea areas such as the South China Sea [14], the Japan Sea [15], the Andaman Sea [16,17], the Sulu Sea [18,19], and the Celebes Sea [18]. The development and application of intelligent algorithms, particularly deep learning, have revolutionized the paradigm of ISW detection in remote-sensing imagery. Cai et al. [20] achieved efficient ISW detection using the You Only Look Once (YOLO) model, reporting an F1-score of 91.3% and mean average precision at 50% intersection over union (mAP50) of 94.3%. Bao et al. [21] applied the Faster Region-based Convolutional Neural Network (Faster R-CNN) model to samples from the South China Sea and attained an accuracy of 94.78%. Sun et al. [22] also employed Faster R-CNN on South China Sea samples, achieving 95.7% accuracy and 92.3% recall. Jiang et al. [23] significantly enhanced WaveNet’s recognition accuracy through Deep Convolutional Generative Adversarial Network (DCGAN)-based data augmentation. Ma et al. [24] developed a detection framework based on the Transformer architecture for global Sentinel-1 SAR datasets. Duan et al. [25] utilized a Partial Convolutional Generative Adversarial Network (PCGAN) to achieve precise wave crest segmentation under constraints of only four samples. Zheng et al. [26] located brightness–darkness transition points of ISW stripes using Mask Region-based Convolutional Neural Network (Mask R-CNN), combined with sector-based analysis to quantify stripe width and direction angle. Zhang et al. [27] automated the analysis of Moderate Resolution Imaging Spectroradiometer (MODIS) imagery in the northern South China Sea using the integrated weakly supervised Internal Solitary Wave Extraction Network (IWE-Net), successfully mapping spatio-temporal patterns and identifying a “silent zone” of ISW activity. However, both traditional image processing methods and deep learning methods have obvious deficiencies. Traditional methods rely heavily on manually designed features and prior knowledge in the detection stage, while deep learning methods are limited by the construction quality of training datasets and complex post-processing procedures. Especially in real marine remote-sensing scenarios, complex and variable environmental features and background interference make the robustness of existing methods generally insufficient. These defects severely limit the ability to efficiently extract ISWs from a large number of satellite images, thereby hindering a deeper understanding of the mechanism of ISWs.
In view of the above, this paper utilizes 4120 Sentinel SAR images obtained between 2014 and 2024, covering the South China Sea (SCS), the Andaman Sea (AS), the Sulu Sea (SS), and the Celebes Sea (CS), to construct an ISW dataset for deep learning, which includes 3495 detection samples and 2476 segmentation samples. Based on this, combined with the lightweight YOLOv8 architecture, an automatic detection method that integrates an anti-interference strategy, a multi-size block detection strategy, and a post-processing repair module is proposed. By applying this method, the crest line features of multiple sea areas are extracted, and the temporal and spatial distribution characteristics of ISW activities are preliminarily analyzed. The remainder of this paper is structured as follows: Section 2 introduces SAR data and deep learning datasets. Section 3 elaborates on the ISW detection method in detail. Section 4 presents the results and discusses the research findings. Section 5 is the conclusion.

2. Materials

This study establishes a sample database of ISWs covering the Andaman Sea (AS), the South China Sea (SCS), the Sulu Sea (SS), and the Celebes Sea (CS), based on 4120 Sentinel SAR images obtained between 2014 and 2024. The study area includes two major regions: the AS region (91.1°E–101.6°E, 0.5°N–17.7°N), which contains 1899 images; and the Southeast Asian marginal sea region (101.4°E–127.8°E, 0.5°S–26.7°N), which contains 2221 images. All images underwent standardized pre-processing, including geometric correction, land masking, and image enhancement. Figure 1 shows the spatial coverage of the images: the left column presents two typical SAR images in the AS; the middle and right columns display the image coverage of the AS region and the Southeast Asian marginal sea region, respectively. Due to limitations in satellite orbit planning and imaging capabilities, the spatial distribution of the images exhibits dense coverage near the coast and relatively sparse coverage in the open sea.
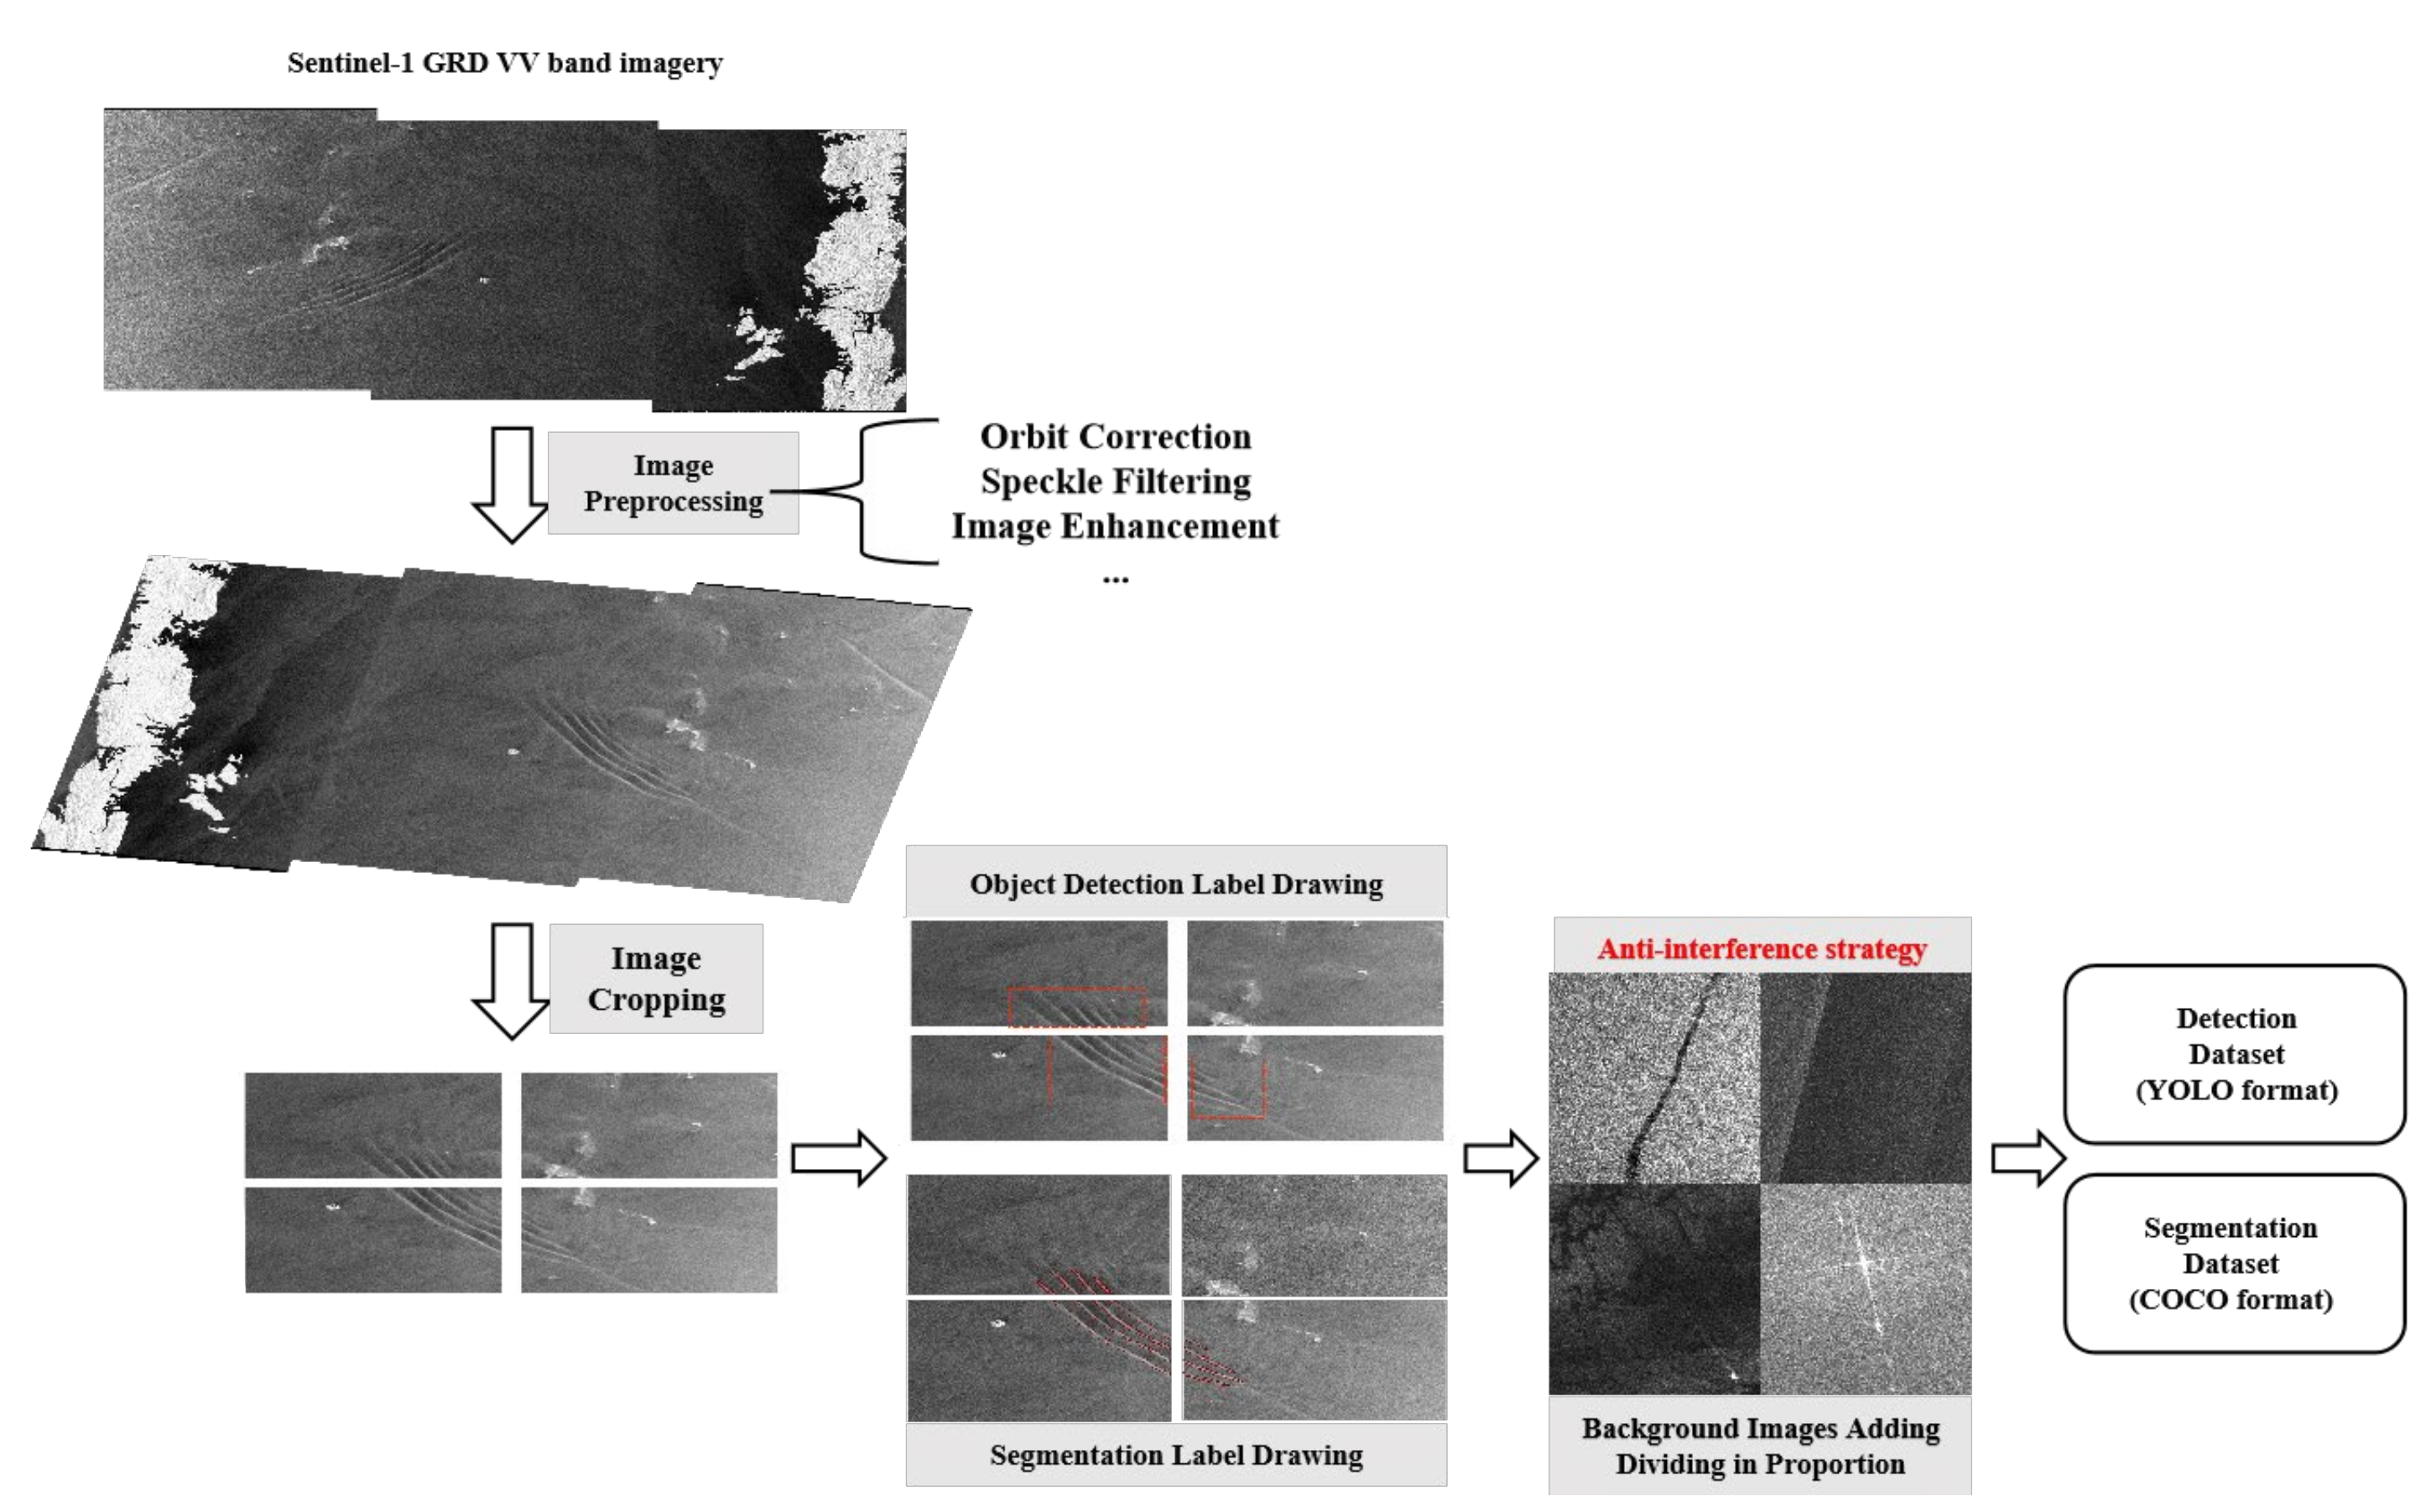
To address the distinct requirements of ISW localization and fine segmentation, this study constructed two dedicated datasets for ISW detection and segmentation. Figure 2 shows the standardized pipeline for dataset construction: preprocessed SAR images are cropped into sub-images using a sliding window, followed by manual filtering and selection of samples containing ISWs. For the detection task, rectangular bounding boxes are used to annotate the locations of ISWs, whereas for the segmentation task, polygonal contours are employed to delineate the crest lines. The final dataset comprises 3495 samples for detection and 2476 for segmentation. These samples are uniformly divided into training, validation, and test sets in a 6:2:2 ratio. To enhance the model’s robustness against complex marine disturbances, various typical interference samples are intentionally collected and added to the training set.

3. Methods

This study addresses the issue of automatic detection of ISW in SAR images and proposes a detection method based on the YOLOv8 architecture. By introducing an anti-interference training strategy, a multi-size block detection strategy, and a post-processing repair module, this study attempts to address the challenges posed by complex marine background interference and large-scale SAR images in detection technology. The process of this method is shown in Figure 3, mainly including the following steps. During the training phase, this study adopts an anti-interference strategy: by introducing various types of noisy background images (such as ship wakes, oil slicks, vortices, and fronts) into the datasets and combining Mosaic data augmentation and background fusion techniques, the labeled ISW samples are embedded into diverse backgrounds to reduce the model’s tendency to overfit specific context patterns. Meanwhile, the background image serves as a negative sample source. Combined with difficult sample mining and the Focal Loss function, this enhances the model’s ability to discriminate against interfering factors and improves its robustness in real and complex scenarios.
In the detection stage, to meet the processing requirements of ultra-large-sized SAR images, a multi-size detection mechanism based on block processing is designed. The entire image is cropped into sub-image blocks of multiple sizes, and the object detection model is used to quickly obtain the candidate bounding boxes of ISWs. Subsequently, the precise position of ISWs is determined through bounding box fusion and redundancy removal strategies. If it is necessary to extract the fine morphology of ISWs, the method will call the segmentation model for candidate sub-image blocks of different sizes to achieve mask extraction. Through the fusion strategy of multi-size segmentation results, the prediction information from different resolutions is integrated to enhance the structural integrity and boundary accuracy of the crest lines. Compared with the strategy of directly delineating candidate regions on the complete image and then performing segmentation in general methods, the “block division—segmentation (detection)—fusion” process proposed in this paper can reduce the computational complexity and enhance the adaptability to ISWs of different scales. Then, a post-processing repair module is designed to address the possible breakage problem of the ISW crest lines. This module repairs the extracted crest lines based on morphological operations and context-aware connection algorithms, reconstructing the continuous crest line structure.

3.1. Model and Training Parameter Configuration

In the field of object detection, the single-stage architecture YOLOv8 model is widely applied in scenarios such as ship [28] and earthquake-induced landslide identification [29]. Its architecture adopts CSP-Darknet as the backbone network, combines the PAN-FPN neck structure, and uses C3 modules and SPPF for multi-scale feature extraction. This model adopts an anchor-free mechanism and a decoupled head design, directly regains the parameters of the target bounding box, and simultaneously optimizes the post-processing efficiency through DIoU-NMS. In terms of training strategies, this model employs multiple data augmentation techniques, including Mosaic-4, MixUp, and adaptive HSV perturbation [30]. In addition, YOLOv8 also offers an extended version of its features—YOLOv8-SEG. This version integrates instance segmentation functionality based on object detection, capable of simultaneously outputting the target bounding box and its pixel-level, precise mask. Figure 4 shows the network architecture of the YOLOv8 model.
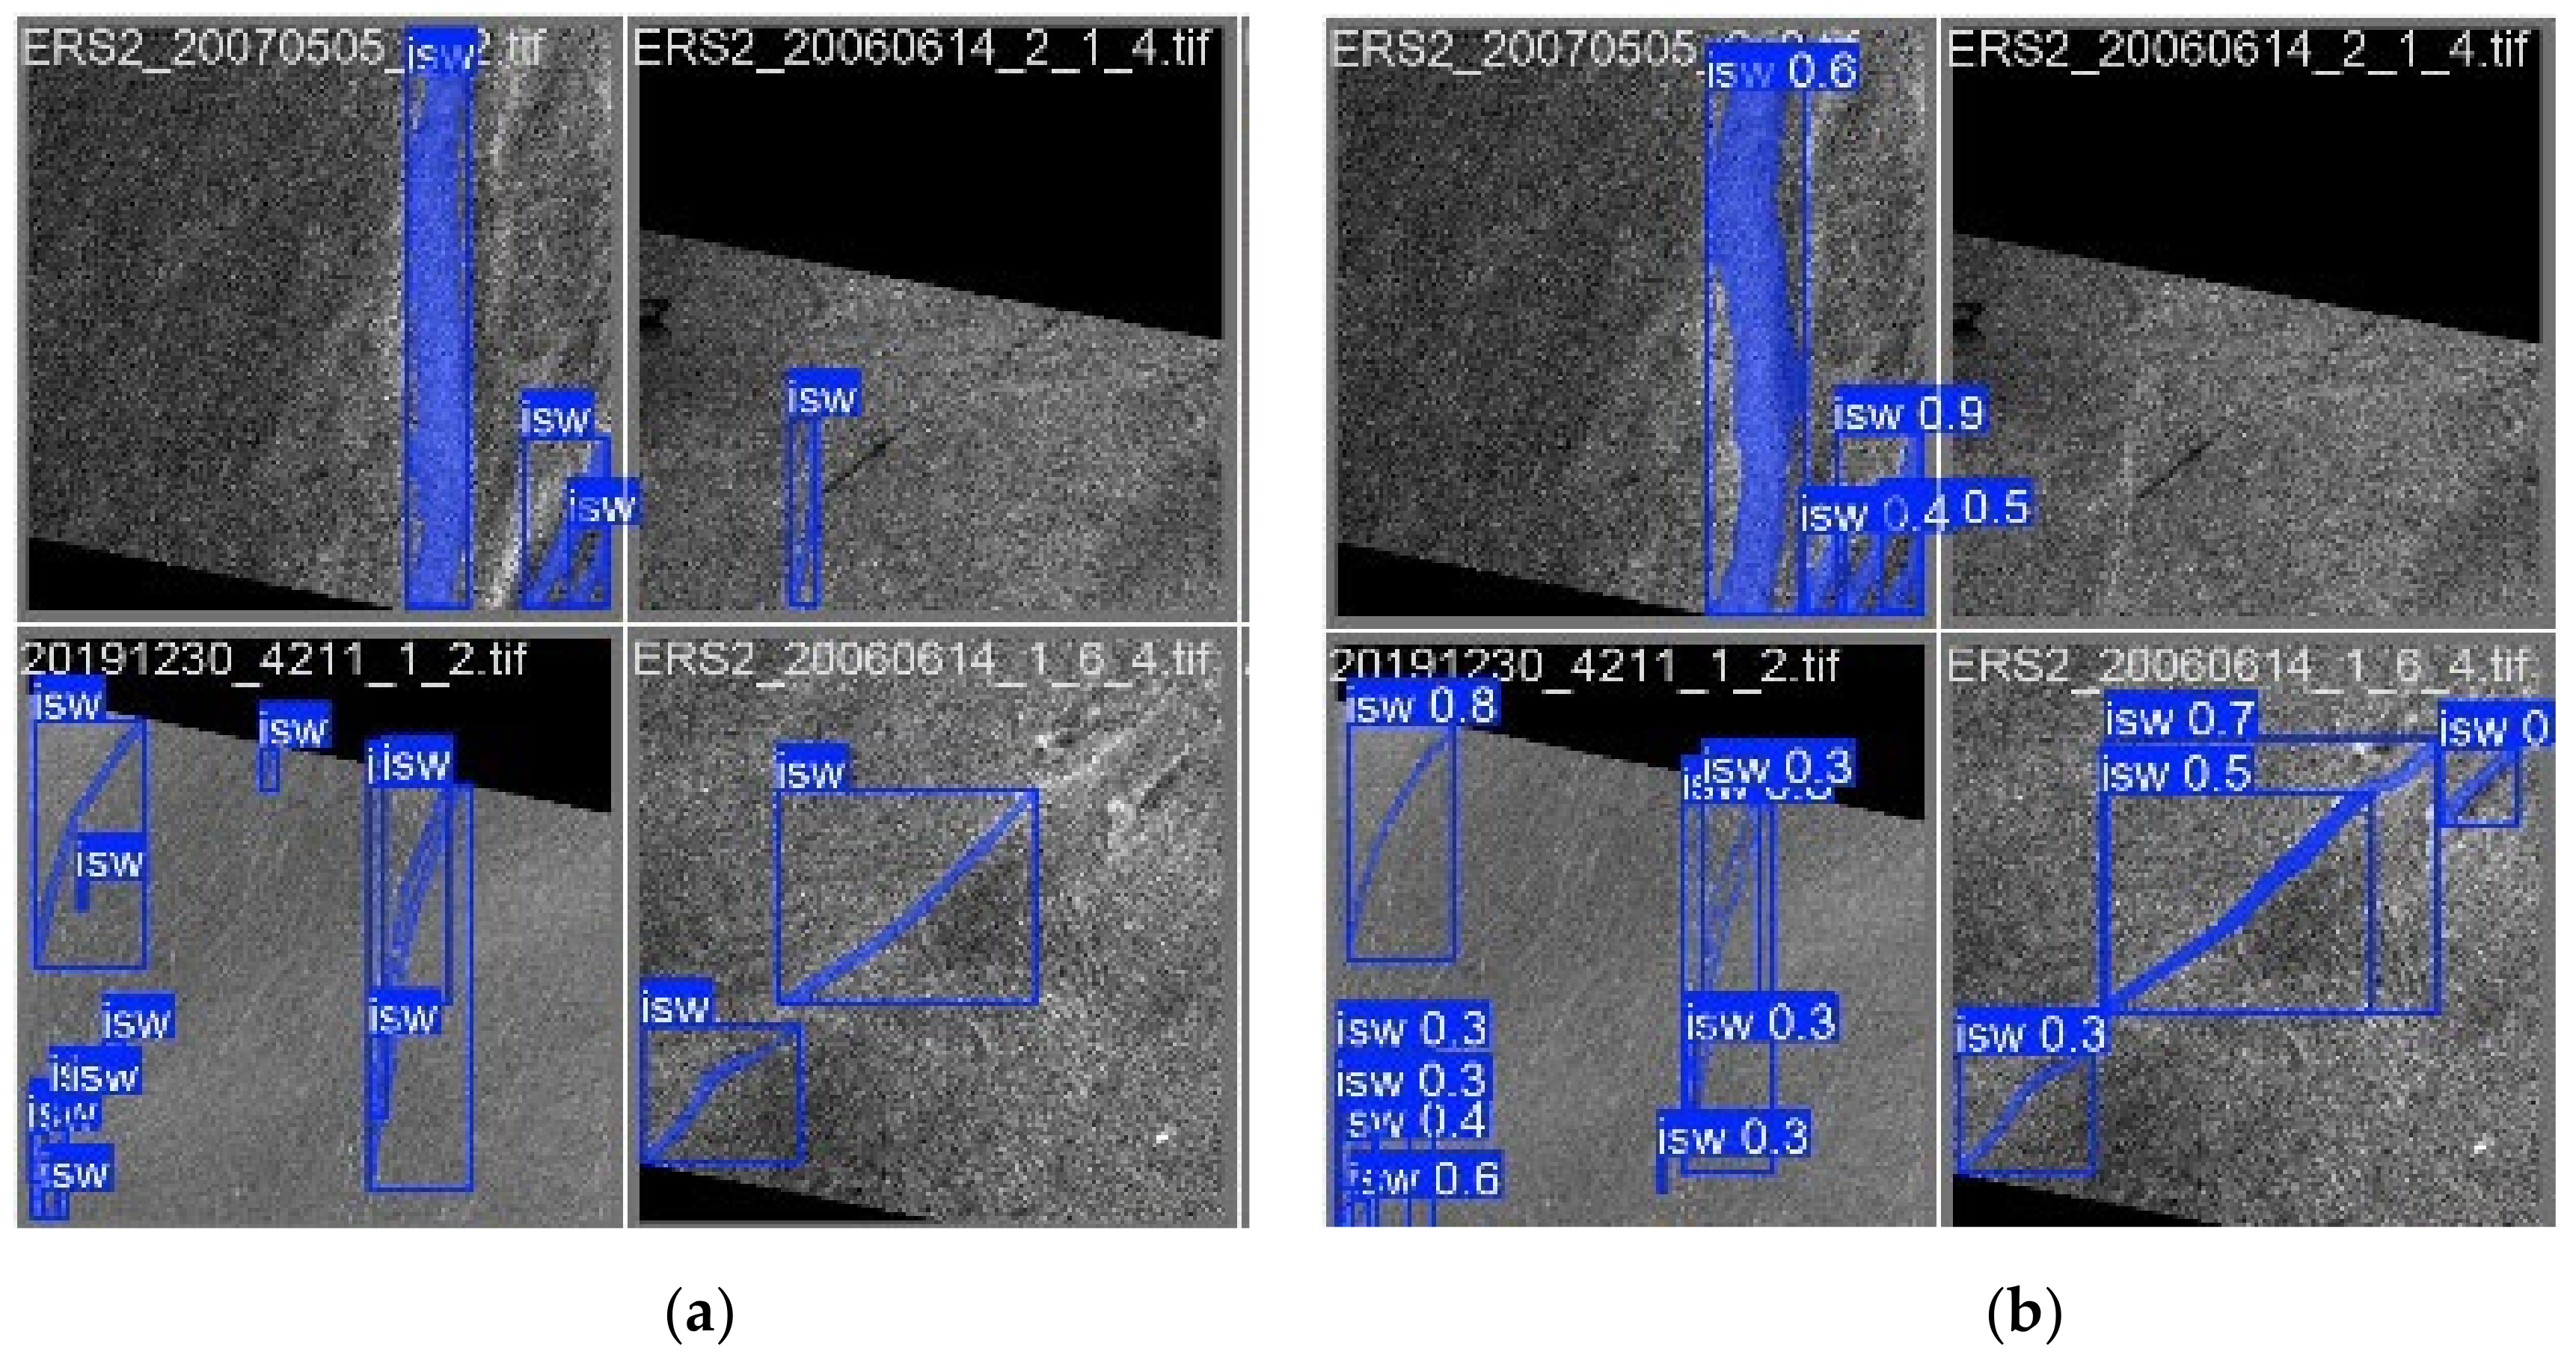
This study conducts transfer learning based on the YOLOv8n and YOLOv8N-SEG lightweight models and adopts a unified training configuration: 200 training epochs (with an early stop mechanism), batch size of 8, SGD optimizer (momentum of 0.9, weight decay of 5 × 10 4 , and data augmentation strategies such as horizontal flipping and random erasing. In the model, we adopt precision and recall as core metrics, which, respectively, reflect the reliability of the model’s positive predictions and its coverage ability for real samples. Figure 5 shows the visualization results on the test set. The detection target is clearly marked with a blue border, the segmentation mask is outlined with polygons, and the confidence score is visually displayed above the detection box, verifying the effectiveness of the model in practical applications.

3.2. Post-Processing Repair Module

The breaking phenomenon of ISWs in SAR images is mainly attributed to two factors: one is the inherent defects of the original image, such as low resolution, low signal-to-noise ratio, and marine environmental interference; the second is the error introduced in the image processing process, such as denoising and filtering, excessively high detection thresholds, or cropping operations. To address this issue, this method introduces a repair module, whose processing flow is as follows: first, the discrete crest line segments are transformed into skeleton curves by using a scanning centerline extraction algorithm; second, based on three key criteria—the distance field of the curve endpoint, the direction of the endpoint tangent, and the connectivity constraint—an adaptive segment matching mechanism was constructed, namely the distance–angle–competition optimization strategy; finally, multiple fracture segments are connected into complete and coherent crest lines. This module only requires setting a relatively loose threshold for distance and angle difference (the threshold is basically fixed for similar images), and it can automatically connect the crest line of the broken wave without the need for manual selection of candidate connection pairs. The pseudo-code of the entire process algorithm is shown in Algorithm 1.
Algorithm 1: Adaptive ISW Crest Line Reconstruction
Input: Disconnected crest segments P, distance threshold τ d , angle threshold τ θ
Output: Reconstructed crest lines C
1for each segment P i P do
2 R i M i n A r e a R e c t P i ;    // Minimum bounding rectangle
3 θ P r i n c i p a l A x i s A n g l e R i ;  // Spindle direction
4 χ i θ 45 , 135 ? Y S c a n P i : X s c a n P i ;  // Skeleton line
5 Ω ;           // Initialize connection graph
6for each pair χ i , χ j where min χ i a χ j b 2 , χ i b χ j a 2 < τ d do
7 ϕ arccos χ i 2 χ i 0 χ j 1 χ j 3 ;
8  if ϕ τ θ then
9   Ω . a d d e d g e i , j with w e i g h t = α χ i b χ j a 2 + B ϕ ;
10 C ;          // Initialize reconstructed lines
11while Ω do
12 i , j a r g m i n i , j Ω e d g e w e i g h t i , j ;
13 C k B F S m e r g e χ i , χ j ;
14  for each χ i C k do
15   Ω . r e m o v e n o d e i ;
16 C . a d d O r d e r B y G e o d e s i c C k ;
17Return C i s o l a t e d χ i Ω ;
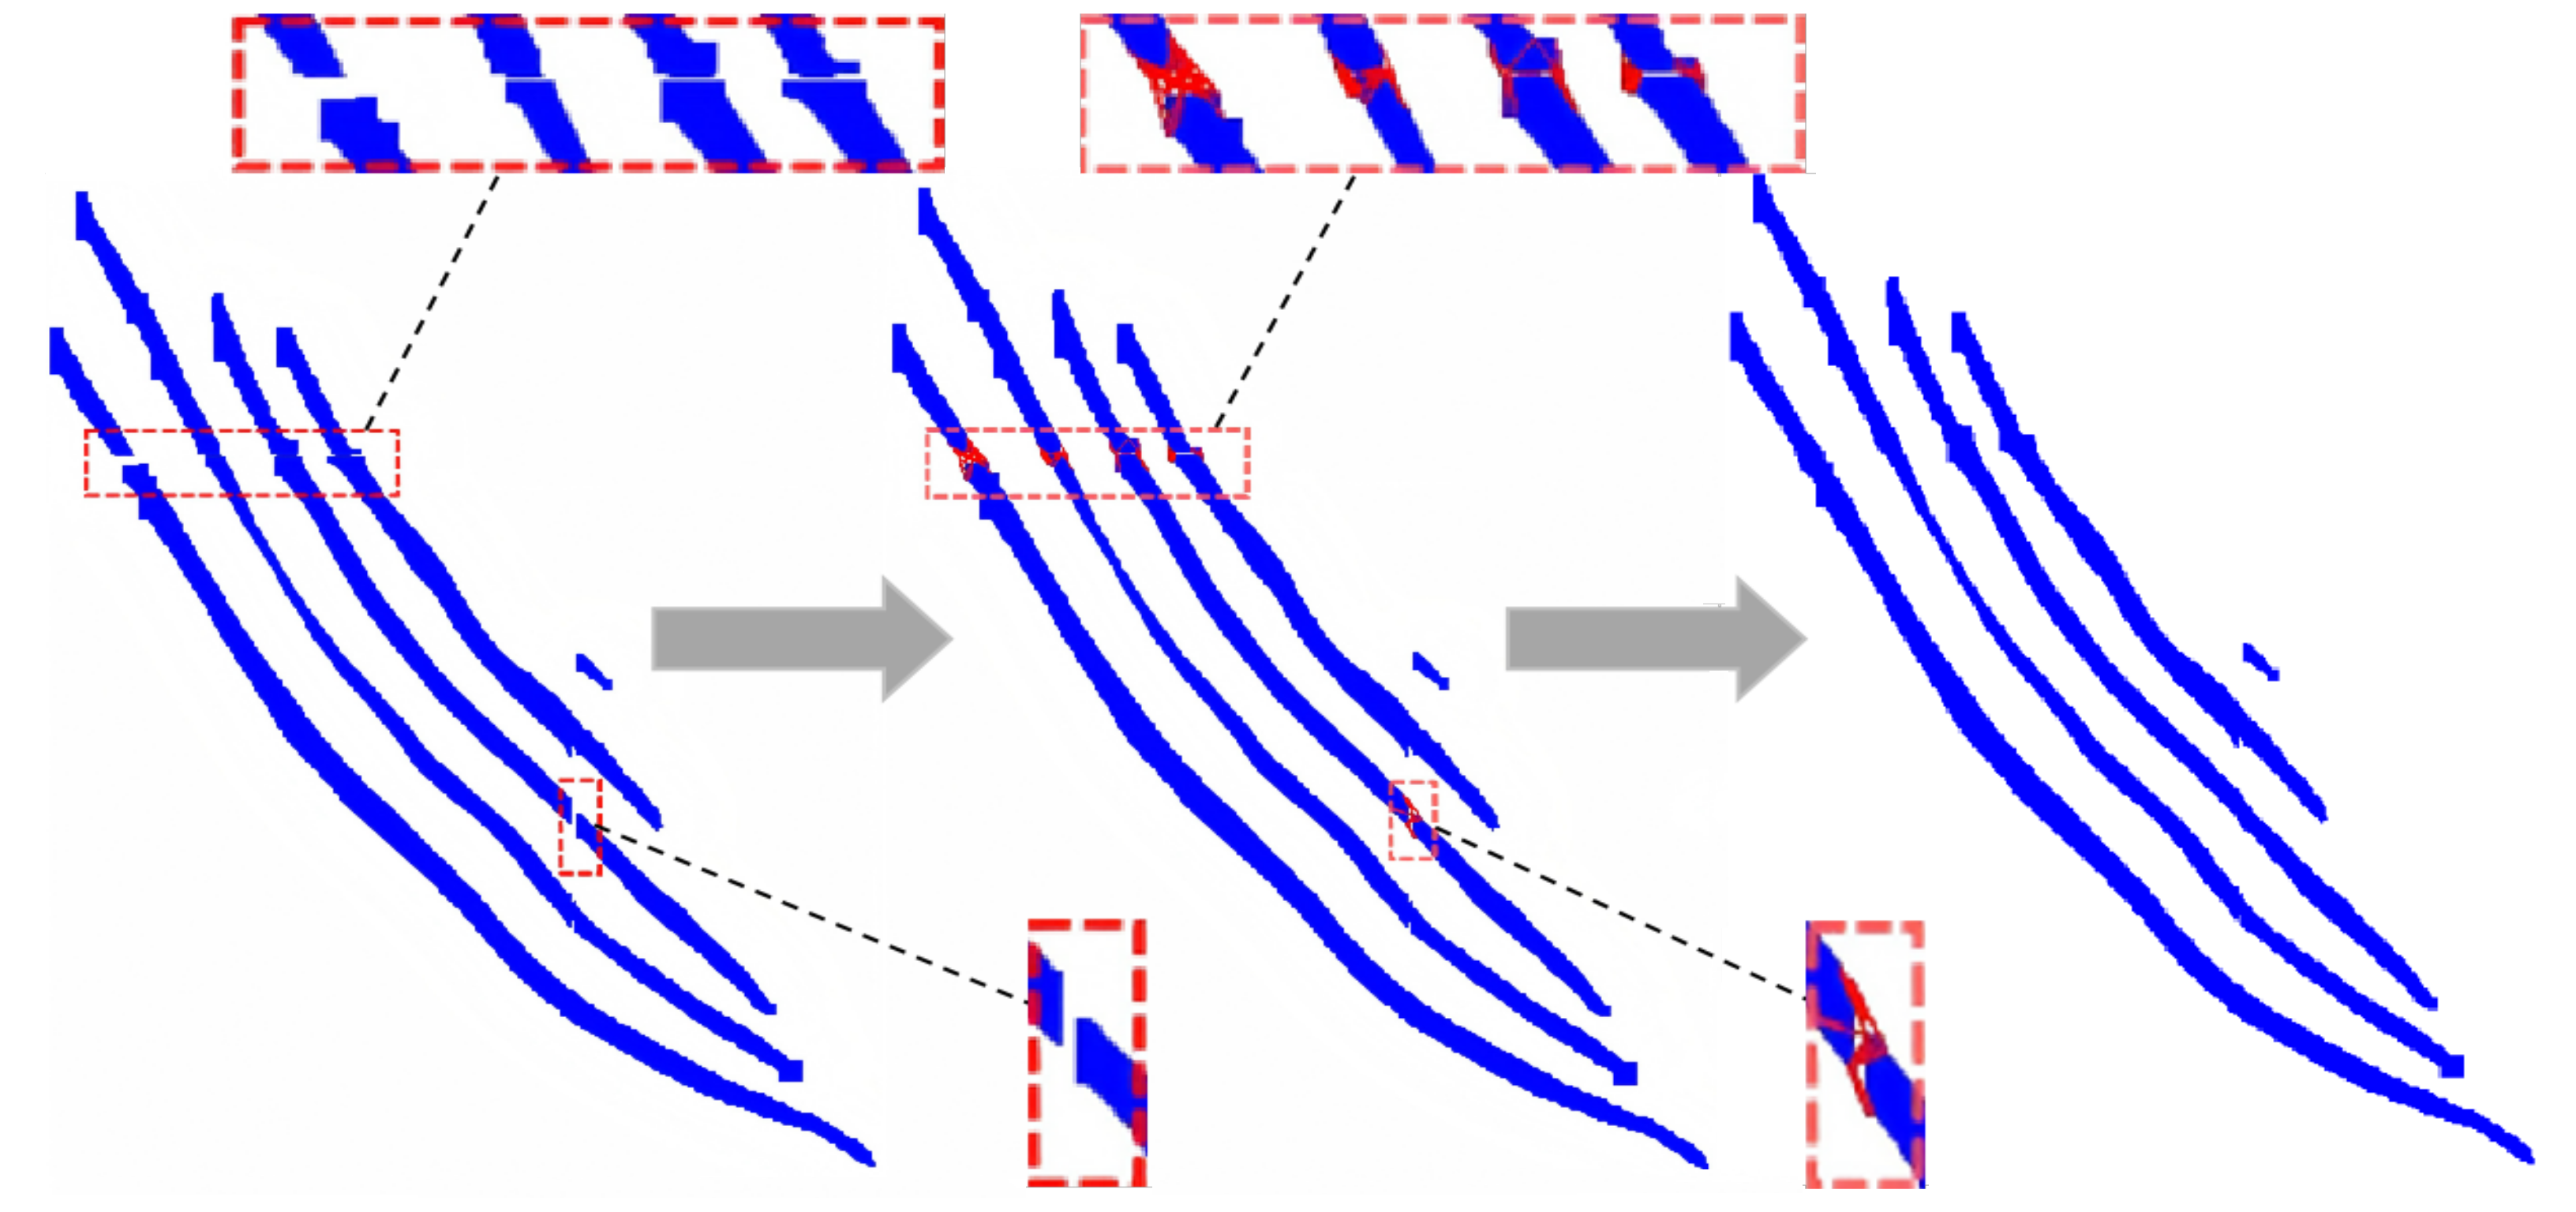
The time complexity of this repair algorithm is dominated by O n 2 . Regarding space complexity, the connection graph requires O n 2 storage in the worst case, while the output occupies O n k space. To reconstruct the crest line (e.g., for area calculation), the system reconnects matched broken segments. This is achieved by calculating the Euclidean distance matrix between adjacent point sets, identifying the closest point pairs, and sequentially connecting them. Figure 6 illustrates the repair of the fractured crest line within the red box. The procedure involves connecting the break with straight lines followed by area filling, resulting in a continuous crest line represented as a polygon rather than a simple skeleton.

4. Results and Discussion

4.1. Anti-Interference Performance of the Model

In the ablation experiment, we evaluate the impact of the anti-interference strategy on the detection performance of the model. The experimental setup takes the original YOLOv8 model without the introduction of the anti-interference strategy as the baseline, and in contrast, it is the enhanced model with the integration of anti-interference strategies. As shown in Figure 7, the real ISW is marked by a solid blue line. Targets 1 to 5 display typical marine interference samples, including ocean fronts, oil slicks, ship wakes, and vortex edges. Land interference objects, such as Target 6 (river) and Target 7 (mountain), have been excluded through land masking in the image pre-processing stage and do not participate in this experimental evaluation. Table 1 shows the quantitative analysis using a validation sub-image set containing five types of interference patterns (100 samples for each type). The experimental results show that the baseline model had a total of 251 false detections, with a false detection rate of 50.20%. The improved model adopting the anti-interference strategy only had 30 false detections, and the false detection rate dropped to 6%, a relative decrease of 44.20 percentage points. The decline in false detection rates for different types of interference is as follows: 44% for ocean fronts, 50% for oil slicks, 42% for ship wakes, 36% for vortex edges, and 49% for others. The above results verify the significant effect of the proposed anti-interference strategy in enhancing the robustness of the model. However, for interfering targets with scarce training samples and texture features highly similar to ISWs, the current model still has certain limitations in false detection.

4.2. The Performance of the Post-Processing Repair Module

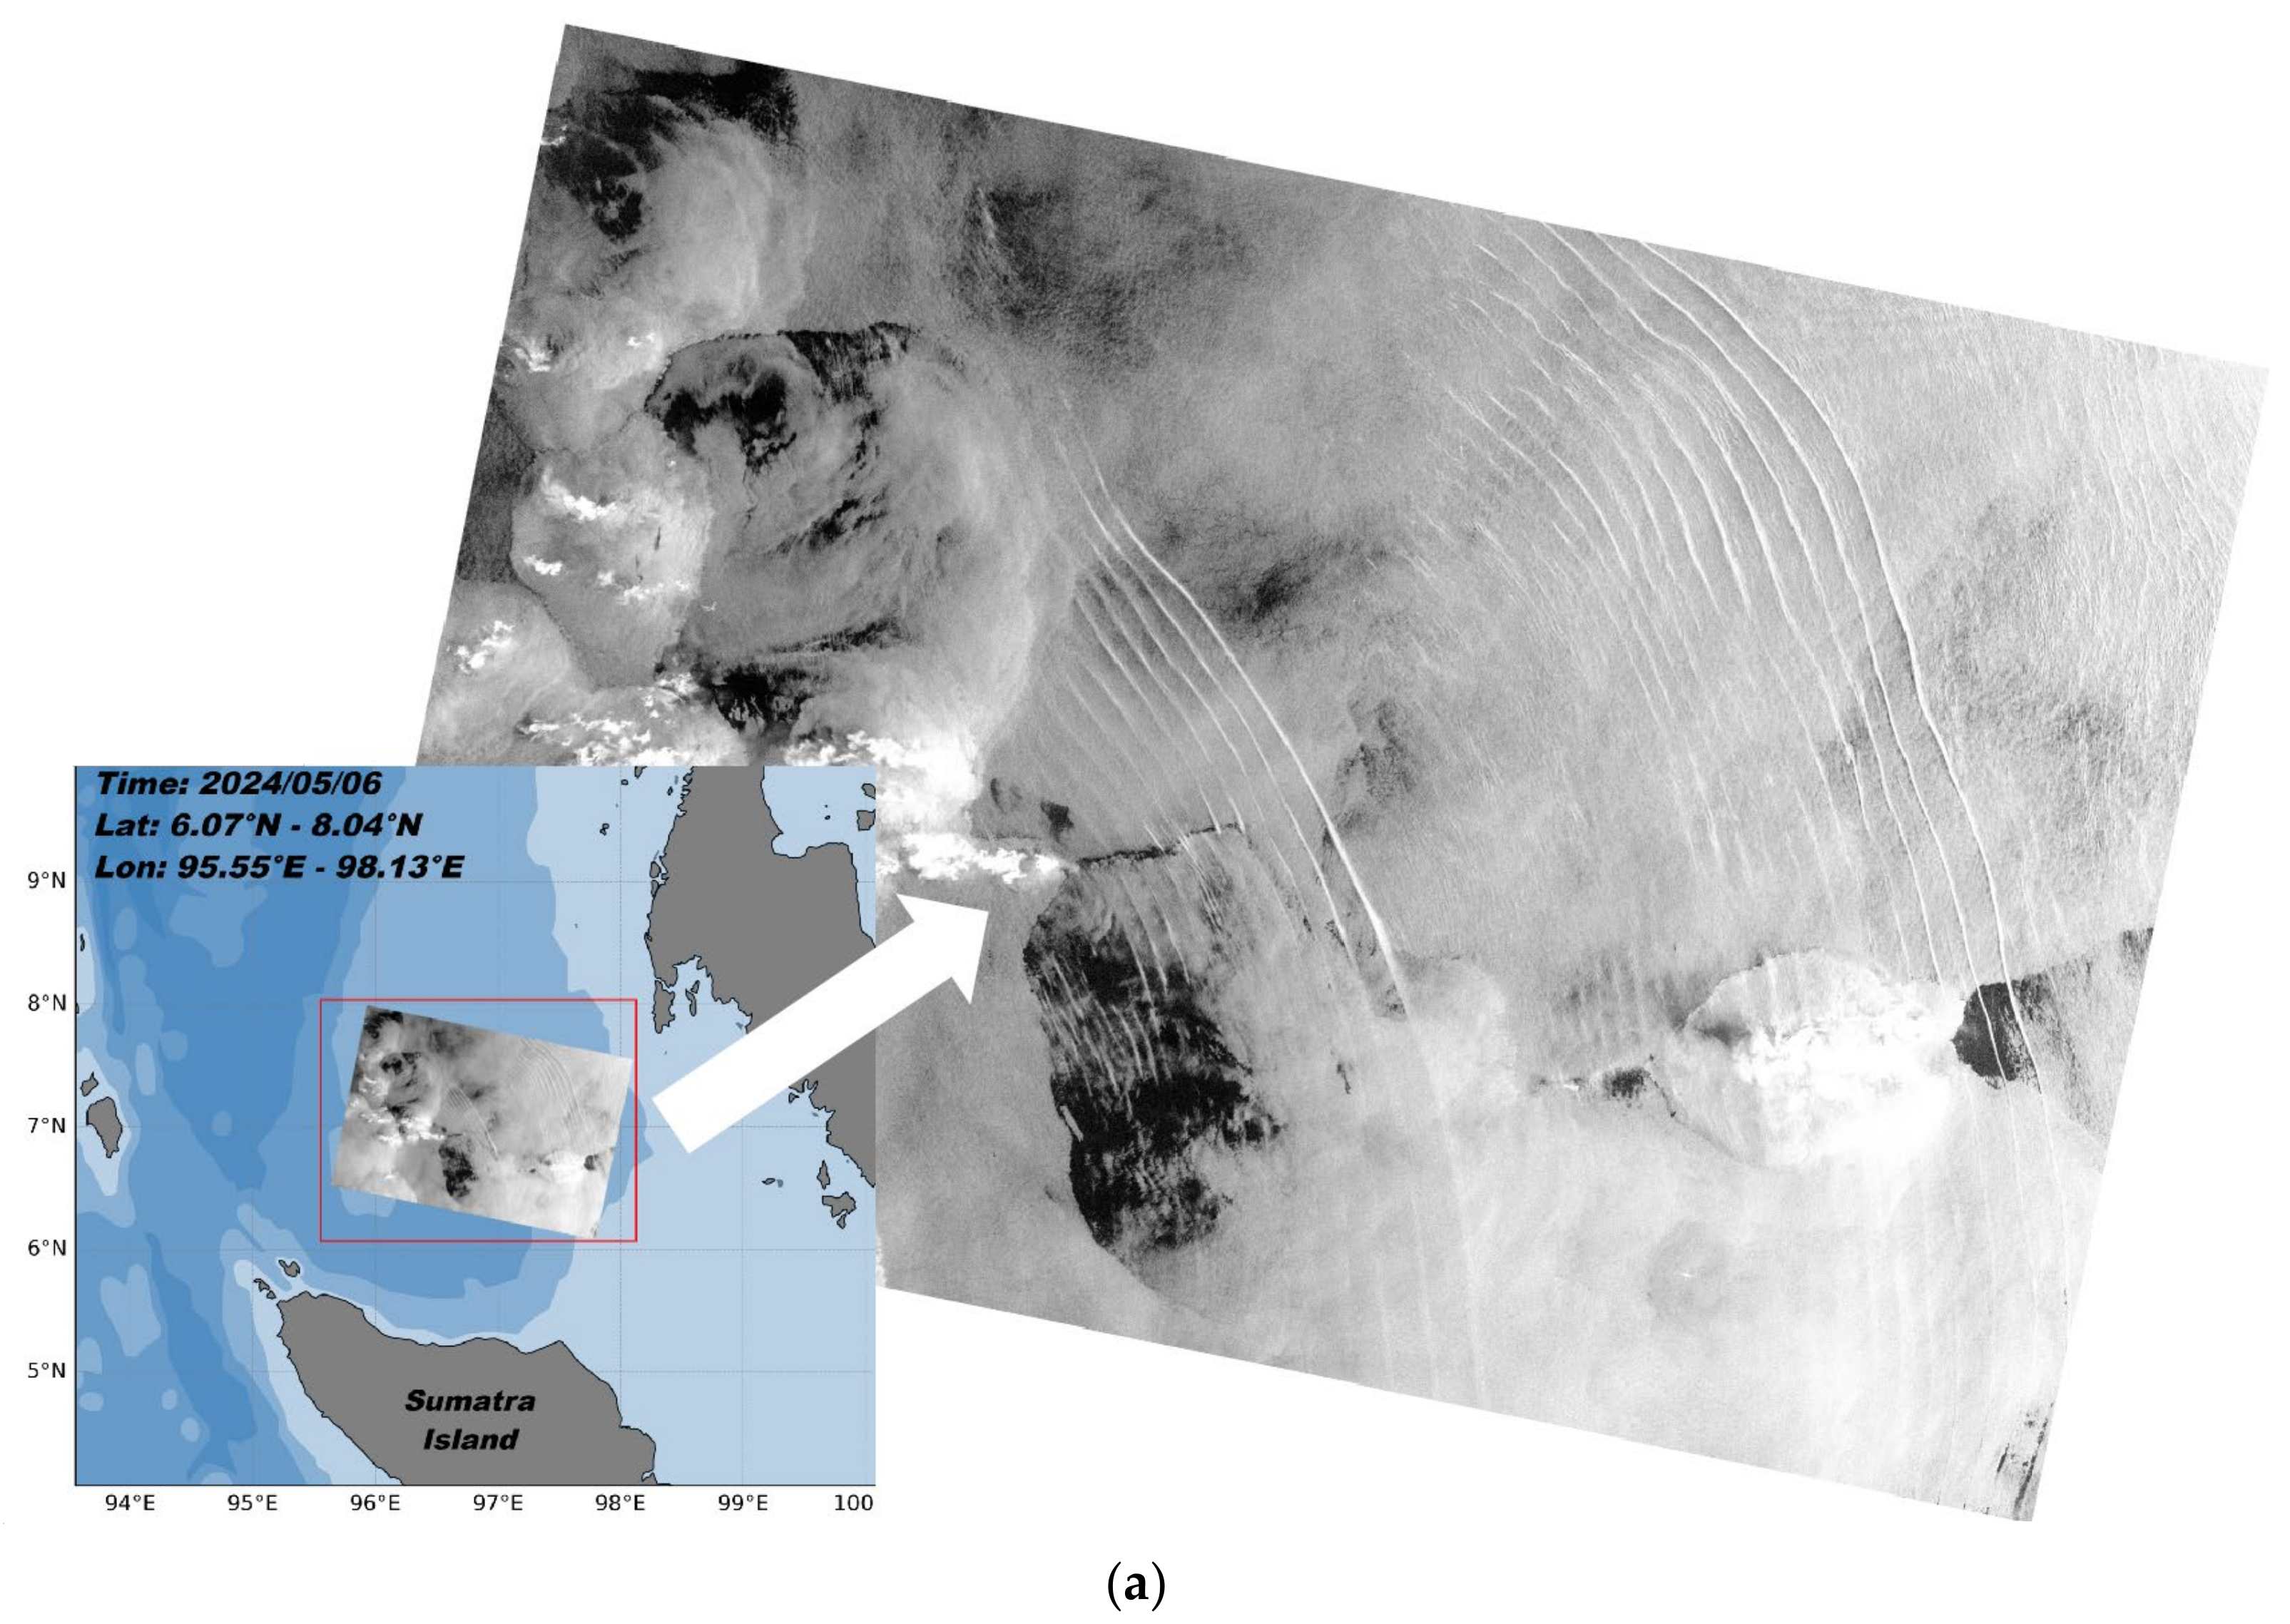
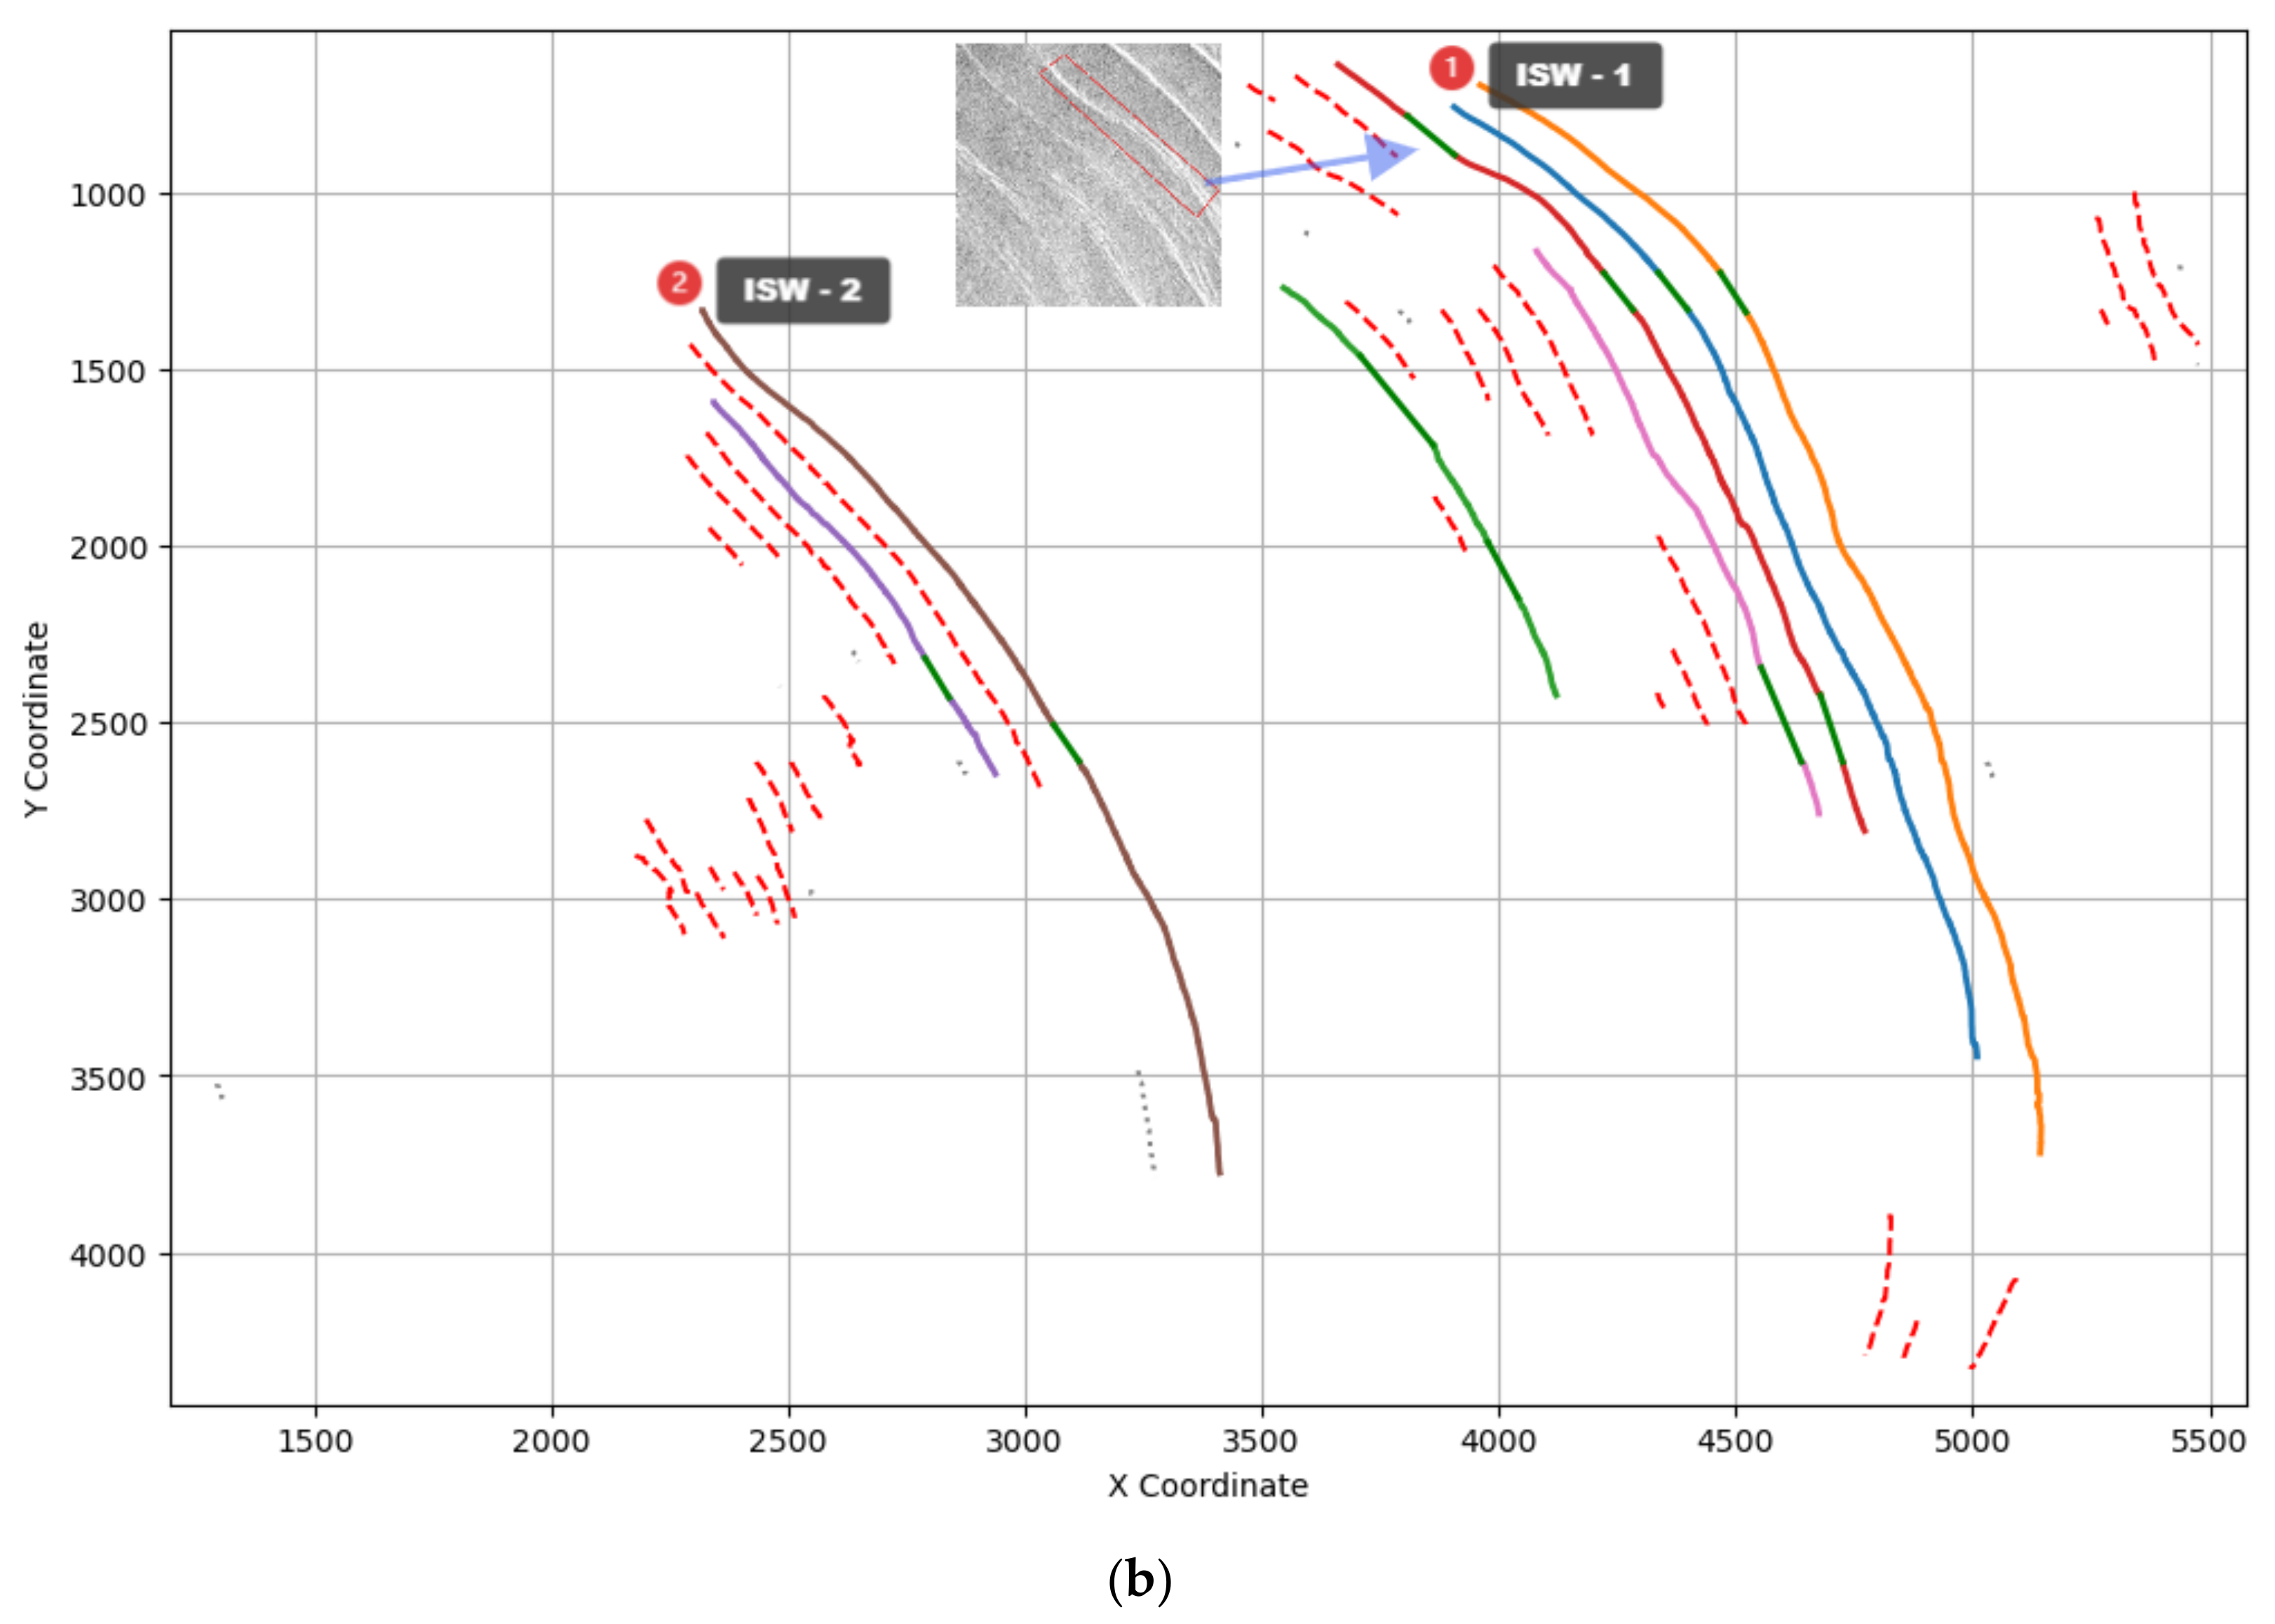
We further evaluate the performance of this post-processing repair module. The test results on the dataset of this study show that the repair rate of the broken crest line of this module reaches 85.2%, and the misconnection rate is controlled below 3.1%. Figure 8 shows the repair of ISW crest lines (represented as skeletons) on SAR imagery. The results demonstrate an improvement in their structural integrity. Taking the SAR image obtained in the northern part of Sumatra Island in the Andaman Sea on 6 May 2024, as an example, the broken crest lines (in the form of skeleton lines) in the image have been connected by solid green lines. The main crest lines of the two wave packets remain intact and have good continuity, enhancing the continuity of the crest line structure and the reliability of quantitative analysis.

4.3. Application of the Detection Method

The proposed ISW detection method was further applied to the Sentinel-1 SAR image dataset covering the AS, SS, and CS, achieving the automatic identification of ISWs in multiple sea areas. The test results clearly indicate that the ISWs in the above-mentioned sea area have significant characteristics and regular changes in their spatial and temporal distribution.

4.3.1. Spatial and Temporal Distribution Characteristics of ISWs in the Andaman Sea

The spatial and temporal distribution characteristics of ISWs in the AS are analyzed based on 1899 Sentinel-1 SAR images from 2014 to 2024. Figure 9 illustrates the spatial distribution of ISWs across this sea area. ISWs are widespread throughout the entire AS, with significant regional differences in the number of detected events. Specifically, the southern and eastern regions of the AS show a high number of ISW occurrences. Statistical analysis indicates that between 2014 and 2024, a prominent ISW activity hotspot was identified in the northeastern waters off Sumatra Island (6.95°N, 98.25°E), where more than 120 ISW events are recorded. However, due to observational gaps caused by the orbital constraints of the Sentinel-1 satellite, the number of observed ISW events in the central AS is relatively low. Integrating optical or other SAR satellite data in the future could help mitigate these observational discrepancies.
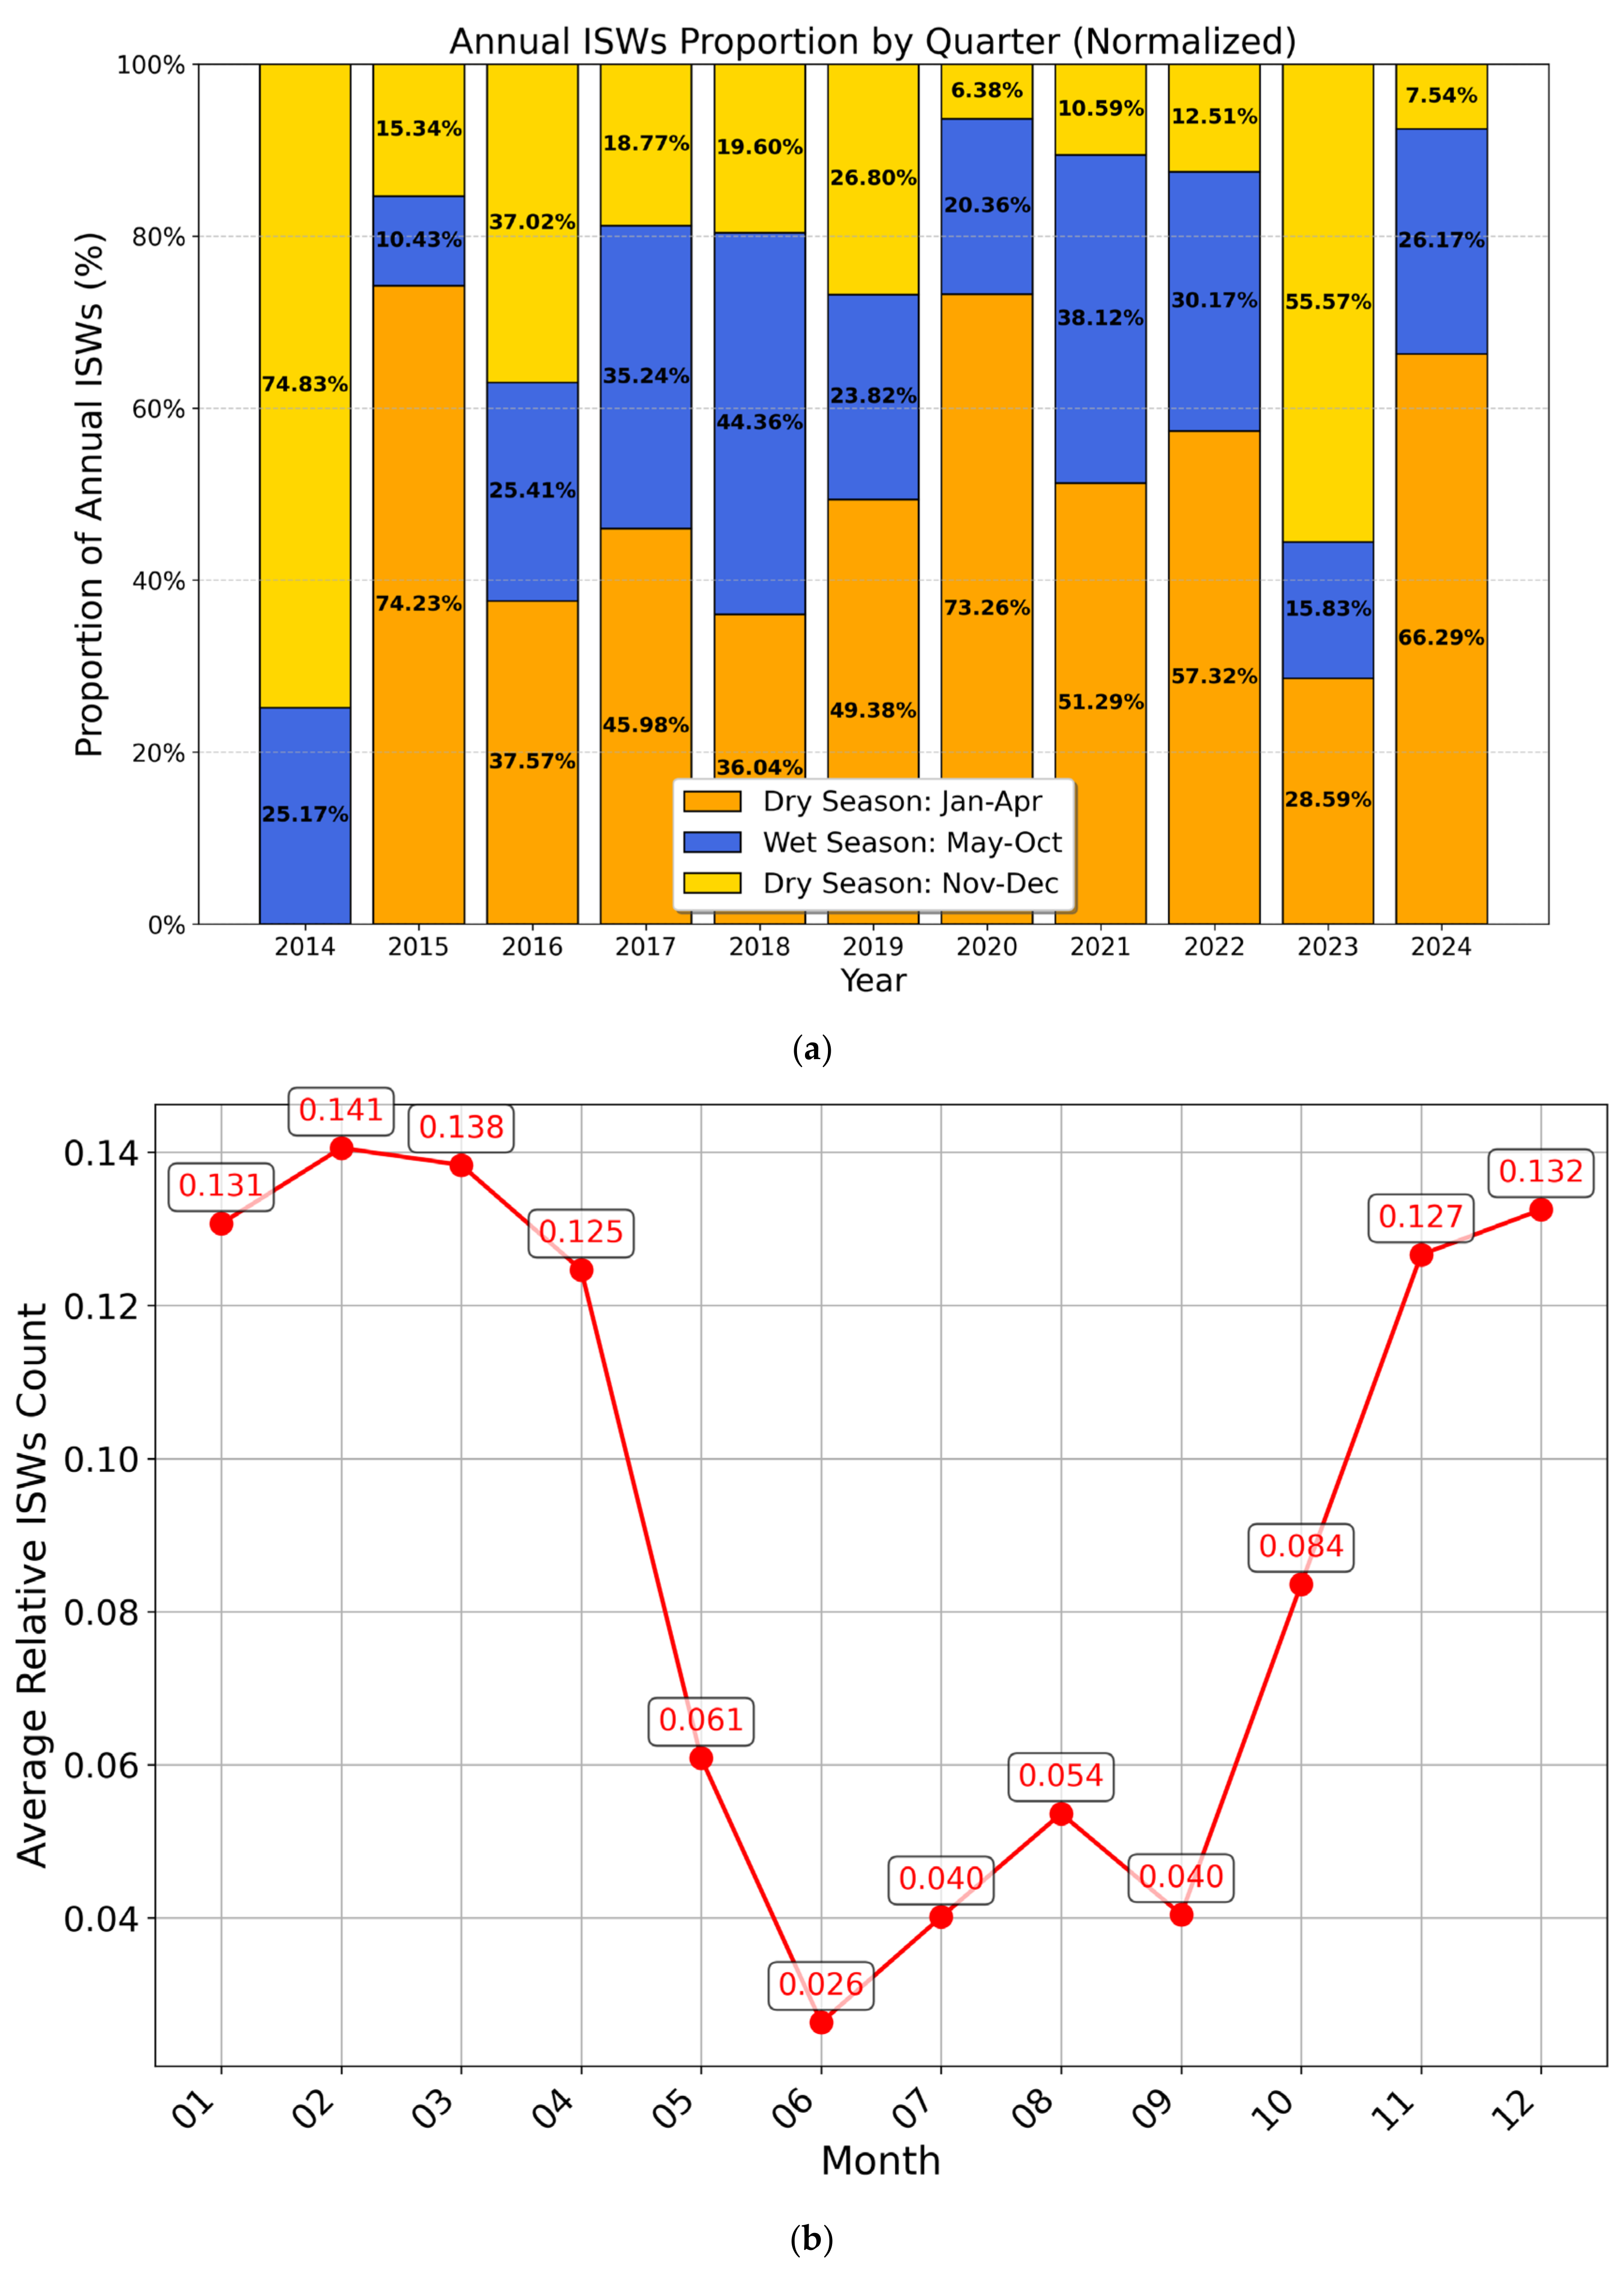
Figure 10 shows the temporal characteristics of ISWs from 2014 to 2024, with significant differences in the number of available images in different years. Figure 10a shows the annual ISW ratios by quarter from 2014 to 2024, and the data has been normalized, with each quarter’s ISW quantity represented by a different color. This indicates that, except for 2023, the peak of activity in most years occurs in the first quarter. Figure 10b shows the monthly variation pattern of the relative quantity of ISWs. Statistical analysis indicates that ISW activities within the AS exhibit significant seasonal variations. Activity intensifies during the dry season (from November to April), reaching its peak in March, and weakens during the rainy season (from May to October). This model is closely related to the hydrological conditions driven by the monsoon.

4.3.2. Spatial and Temporal Distribution Characteristics of ISWs in the Sulu Sea and the Celebes Sea

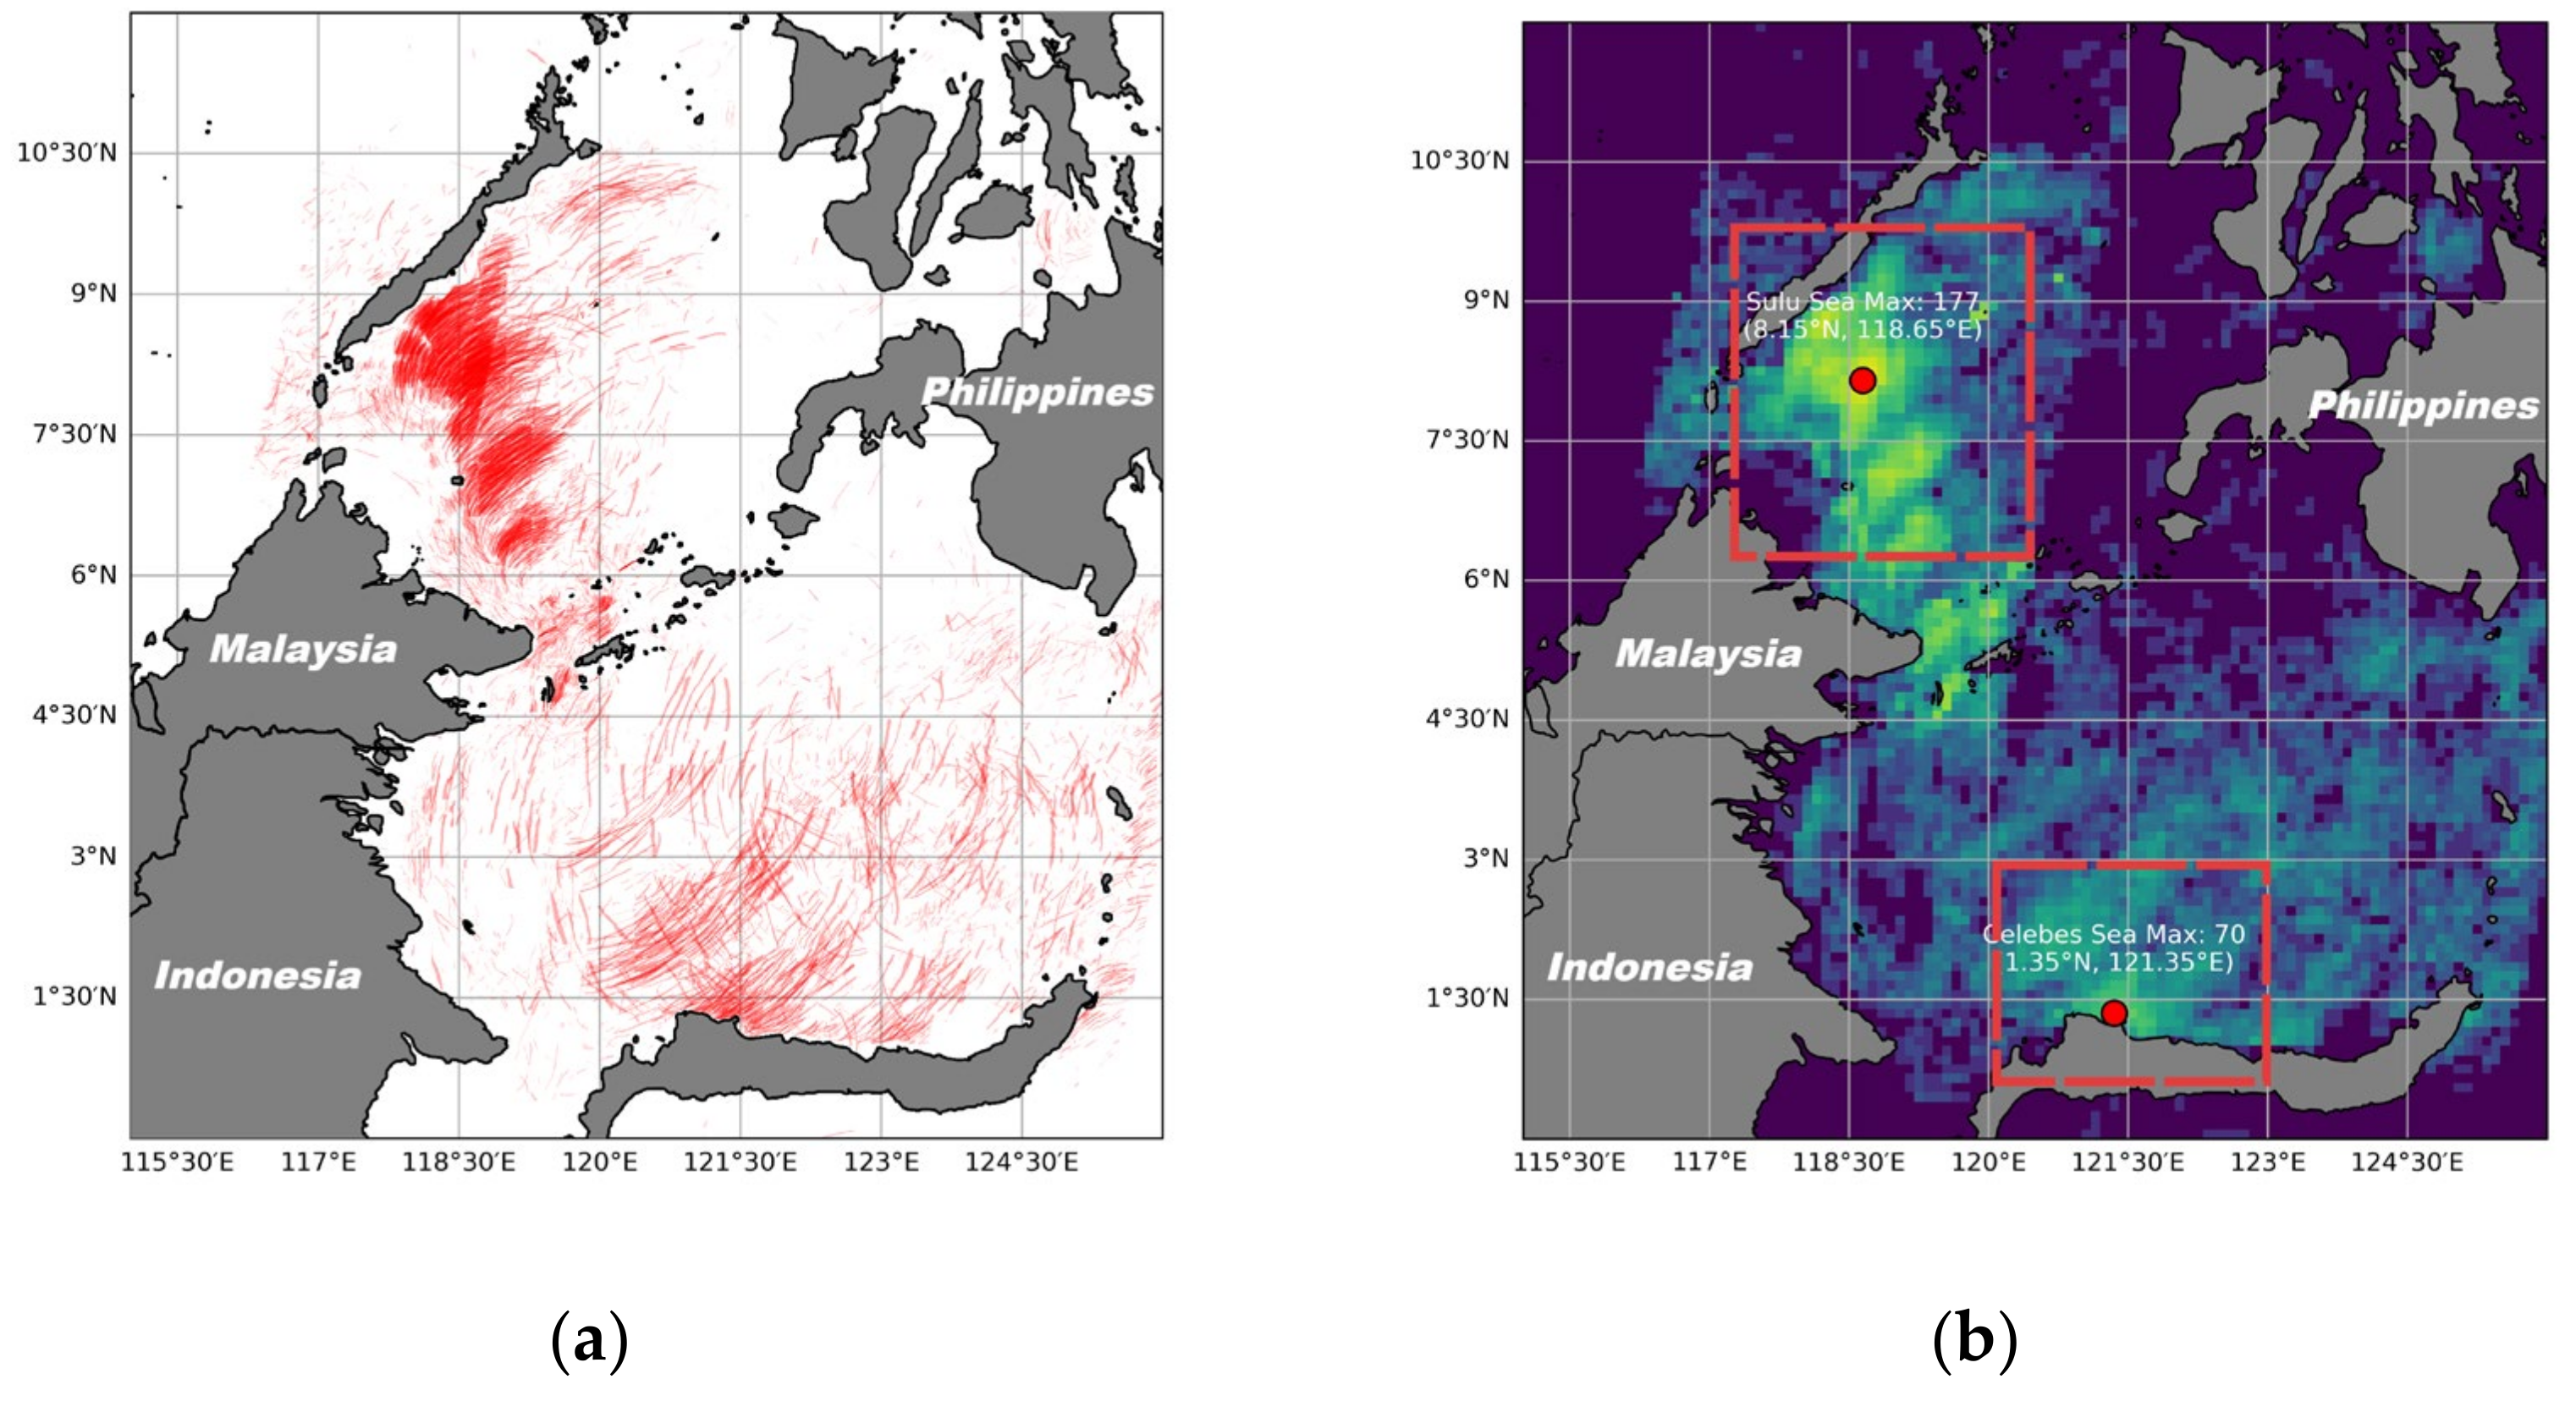
Based on Sentinel-1 SAR images covering the SS and CS from 2015 to 2024, the spatial distribution characteristics of ISWs in these regions are shown in Figure 11. ISWs in the SS are primarily concentrated in the western part, with 177 recorded occurrences at the location (8.15°N, 118.65°E). Meanwhile, the southwestern CS shows a notably high level of ISW activity, with 70 observed cases at (1.35°N, 121.35°E).
Figure 12 shows the monthly variation characteristics of the relative quantity of ISWs in the SS and the CS, where blue and red correspond to the SS and the CS, respectively. The number of ISW activities in the SS peaks during the dry season from December to April of the following year, reaching its maximum in February, and then drops to its lowest point around May. Compared with the AS and the SS, the temporal distribution of ISW activities in the CS is more complex, and its relative quantity shows a bimodal structure, occurring in January and September, respectively (with more in September). The subsequent verification work requires the support of more SAR and optical remote-sensing image data.

5. Conclusions

Based on 4120 SAR images collected from 2014 to 2024, an ISW sample database covering the AS, SCS, SS, and CS was established. Based on the YOLOv8 framework, it integrates an anti-interference strategy, a block processing strategy, and a post-processing repair module to achieve intelligent detection, repair, and reconstruction of ISWs.
In marine SAR images, the strip-like interference caused by complex marine interference, such as ocean fronts, oil slicks, ship wakes, and vortex edges, poses a great challenge to the detection of ISWs. The improved method has significantly enhanced the interference suppression capability, reducing the overall false detection rate from 50.20% (251 false detections) of the baseline model (basic YOLOv8 architecture) to 6% (30 false detections), with a reduction of 44.20 percentage points in the error rate. Consistent improvements were observed in all types of interference samples: a 44% reduction in ocean fronts, a 50% reduction in oil slicks, a 42% reduction in ship wakes, and a 36% reduction in vortex edges. In addition, based on the post-processing repair module, the repair rate of the broken wave crest line reached 85.2%, and the false connection rate was controlled below 3.1%.
Using the automatic detection method, the spatial and temporal distribution characteristics of ISWs in the AS, SS, and CS are obtained. ISW activities in the AS reach their peak during the dry season in March, with spatial concentration mainly concentrated in its eastern and southern sea areas. The western part of the SS and the southwestern part of CS are also the activity centers of ISWs. The SS maintains a high level of ISW activity throughout the dry season, while the CS exhibits more complex seasonal dynamic characteristics.
Future research work will mainly focus on two directions: Firstly, more detailed ablation experiments will be conducted, and the method proposed in this study will be systematically compared with existing advanced methods and models in terms of effect; Secondly, efforts will be made to explore a deeper integration of the detection framework and marine physical models, with the aim of further enhancing the robustness, practical value, and interpretability of the physical mechanisms of the method.

Author Contributions

Z.L.: Investigation, Methodology, Software, Writing—original draft. H.D.: Writing—original draft, Supervision, Software, Funding acquisition. S.W.: Validation, Formal analysis, Visualization, Software. J.W.: Writing—review and editing, Data curation. P.P.: Software, Formal analysis, Conceptualization. All authors have read and agreed to the published version of the manuscript.

Funding

This research was funded by the National Natural Science Foundation of China (Grant No. 12472247), the Science and Technology Innovation Program of Hunan Province (Grant No. 2023RC3005), the Natural Science Foundation of Hunan Province (Grant No. 2025JJ60027), and the Youth Independent Innovation Science Foundation (Grant No. ZK24-51).

Data Availability Statement

The Sentinel-1 images are available at https://search.asf.alaska.edu (accessed on 30 June 2025). The data that supports the findings of this study is available from the corresponding author upon reasonable request.

Conflicts of Interest

The authors declare that they have no known competing financial interests or personal relationships that could have appeared to influence the work reported in this paper.

References

  1. Meng, J.; Long, R.; Sun, L.; Zhang, H.; Cao, Z. Review of Research on Remote Sensing Detection of Internal Solitary Waves Based on Machine Learning. Digit. Ocean. Underw. Warf. 2024, 7, 2–8. [Google Scholar] [CrossRef]
  2. Yang, X.; Li, Z.; Zhao, Y.; Chong, J. Spatiotemporal Variation of Internal Solitary Waves in the Northern Bay of Biscay Based on Sequential SAR Images. IEEE Trans. Geosci. Remote Sens. 2025, 63, 5207014. [Google Scholar] [CrossRef]
  3. Yang, Z.; Wang, J.; Li, Z.; Lu, Y.; Huang, S.; Sun, L. Study on the Characteristics of Internal Solitary Waves in Arctic Kara Sea Based on SAR Images. IEEE Trans. Geosci. Remote Sens. 2024, 62, 4207113. [Google Scholar] [CrossRef]
  4. Li, Z.; Wang, J.; Chen, X.; Lu, K.; Chang, Z.; Lu, Y.; Wang, X. Observation of Mode-2 Internal Solitary Waves in the Northern South China Sea Based on Optical Remote Sensing. IEEE J. Sel. Top. Appl. Earth Obs. Remote Sens. 2024, 17, 11550–11562. [Google Scholar] [CrossRef]
  5. Zhong, J.; Zhou, X. Survey of Study on Internal Waves Detection in Synthetic Aperture Radar Image. J. Radars 2013, 2, 406–421. [Google Scholar] [CrossRef]
  6. Alpers, W. Theory of radar imaging of internal waves. Nature 1985, 314, 245–247. [Google Scholar] [CrossRef]
  7. Hogan, G.G.; Marsden, J.B.; Henry, J.C. On the Detection of Internal Waves in High-Resolution SAR Imagery Using the Rough Transform. In Proceedings of the OCEANS 91, Honolulu, HI, USA, 1–3 October 1991; pp. 1363–1369. [Google Scholar] [CrossRef]
  8. Rodenas, J.A.; Garello, R. Wavelet Analysis in SAR Ocean Image Profiles for Internal Wave Detection and Wavelength Estimation. IEEE Trans. Geosci. Remote Sens. 1997, 35, 933–945. [Google Scholar] [CrossRef]
  9. Rodenas, J.A.; Garello, R. Internal Wave Detection and Location in SAR Images Using Wavelet Transform. IEEE Trans. Geosci. Remote Sens. 1998, 36, 1494–1507. [Google Scholar] [CrossRef]
  10. Dokken, S.T.; Olsen, R.; Wahl, T.; Tantillo, M.V. Identification and Characterization of Internal Waves in SAR Images along the Coast of Norway. Geophys. Res. Lett. 2001, 28, 2803–2806. [Google Scholar] [CrossRef]
  11. Surampudi, S.; Sasanka, S. Internal Wave Detection and Characterization with SAR Data. In Proceedings of the 2019 IEEE Recent Advances in Geoscience and Remote Sensing: Technologies, Standards and Applications (TENGARSS), Kochi, India, 17–20 October 2019; pp. 104–108. [Google Scholar] [CrossRef]
  12. Xu, S.; Chen, J.; Li, T.; Tao, R. Automatic Feature Detection of Ocean Internal Wave SAR Image Based on Hierarchical Clustering. Comput. Sci. Appl. 2019, 9, 1118–1125. [Google Scholar] [CrossRef]
  13. Zheng, Y.; Zhang, H.; Li, X.; Zhang, Z. Detection Algorithm of Internal Waves in the South China Sea Based on Boundary Characteristics of Remote Sensing Image. J. Trop. Oceanogr. 2020, 39, 41–56. [Google Scholar]
  14. Sun, L.; Zhang, J.; Meng, J. Propagation Speed of Internal Waves in the Northern South China Sea Based on Remote Sensing and In Situ Observation Data. Oceanol. Limnol. Sin. 2018, 49, 471–480. [Google Scholar]
  15. Sun, L.; Zhang, J.; Meng, J.; Wang, J.; Zhang, X. Analysis of Internal Waves in the Japan Sea with Multi-Sensors Remote Data. Acta Oceanol. Sin. 2018, 40, 102–111. [Google Scholar] [CrossRef]
  16. Wang, J.; Yang, J.; Zhou, L.; He, S.; He, Z.; Xiao, Q.; Liu, A.; Xu, M. Distribution of Internal Waves in the Andaman Sea and Its Adjacent Waters Based on Multi-Satellite Remote Sensing Data. J. Mar. Sci. 2019, 37, 1–11. [Google Scholar] [CrossRef]
  17. Zhang, H.; Meng, J.; Sun, L. Research on Characteristic Parameter Distribution and Generation Period of Internal Waves in the Andaman Sea with MODIS. Acta Oceanol. Sin. 2020, 42, 110–118. [Google Scholar]
  18. Zhang, T.; Zhang, X. Characteristics on internal solitary waves in the Sulu-Celebes Sea based on MODIS and VIIRS remote sensing images. Oceanol. Limnol. Sin. 2020, 51, 991–1000. [Google Scholar] [CrossRef]
  19. Zhang, X.; Li, X.; Zhang, T. Characteristics and generations of internal wave in the Sulu Sea inferred from optical satellite images. J. Oceanol. Limnol. 2020, 38, 1435–1444. [Google Scholar] [CrossRef]
  20. Cai, L.; Zha, G.; Lin, M.; Wang, X.; Zhang, H. Ocean Internal Wave Detection in SAR Images Based on Improved YOLOv7. IEEE Access 2024, 12, 146852–146865. [Google Scholar] [CrossRef]
  21. Bao, S.; Meng, J.; Sun, L.; Liu, Y. Detection of ocean internal waves based on Faster R-CNN in SAR images. J. Oceanol. Limnol. 2020, 38, 55–63. [Google Scholar] [CrossRef]
  22. Sun, H.; Wang, Y.; Jia, T.; Shi, Y.; Li, X. Faster R-CNN based oceanic internal wave detection from SAR images in the South China Sea. Natl. Remote Sens. Bull. 2023, 27, 905–918. [Google Scholar] [CrossRef]
  23. Jiang, Z.; Gao, X.; Shi, L.; Li, N.; Zou, L. Detection of Ocean Internal Waves Based on Modified Deep Convolutional Generative Adversarial Network and WaveNet in Moderate Resolution Imaging Spectroradiometer Images. Appl. Sci. 2023, 13, 11235. [Google Scholar] [CrossRef]
  24. Ma, Z.; Huang, L.; Yang, J.; Ren, L.; Li, X.; He, S.; Liu, B.; Liu, A.K. Transformer-Based Hierarchical Multiscale Feature Fusion Internal Wave Detection and Dataset. Ocean-Land-Atmos. Res. 2024, 3, 0325. [Google Scholar] [CrossRef]
  25. Duan, B.; Barintag, S.; Meng, J.; Gong, M. Stripe Extraction of Oceanic Internal Waves Using PCGAN with Small-Data Training. Remote Sens. 2024, 16, 787. [Google Scholar] [CrossRef]
  26. Zheng, Y.; Qi, K.; Zhang, H. Stripe segmentation of oceanic internal waves in synthetic aperture radar images based on Mask R-CNN. Geocarto Int. 2022, 37, 14480–14494. [Google Scholar] [CrossRef]
  27. Zhang, X.; Li, X. Constructing a 22-year internal wave dataset for the northern South China Sea: Spatiotemporal analysis using MODIS imagery and deep learning. Earth Syst. Sci. Data 2024, 16, 5131–5144. [Google Scholar] [CrossRef]
  28. Meng, S.; Shi, Z.; Pirasteh, S.; Ullo, S.L.; Peng, M.; Zhou, C. TLSTMF-YOLO: Transfer Learning and Feature Fusion Network for Earthquake-Induced Landslide Detection in Remote Sensing Images. IEEE Trans. Geosci. Remote Sens. 2025, 63, 1–12. [Google Scholar] [CrossRef]
  29. Selvam, P.; Sundari, P.S.; Tamilselvi, M.; Suresh, T.; Murugappan, M.; Chowdhury, M.E.H. YOLO-SAIL: Attention-Enhanced YOLOv5 with Optimized Bi-FPN for Ship Target Detection in SAR Images. IEEE Access 2025, 13, 29523–29540. [Google Scholar] [CrossRef]
  30. Varghese, R.; Sambath, M. YOLOv8: A Novel Object Detection Algorithm with Enhanced Performance and Robustness. In Proceedings of the 2024 International Conference on Advances in Data Engineering and Intelligent Computing Systems (ADICS), Chennai, India, 18–19 April 2024; pp. 1–6. [Google Scholar] [CrossRef]
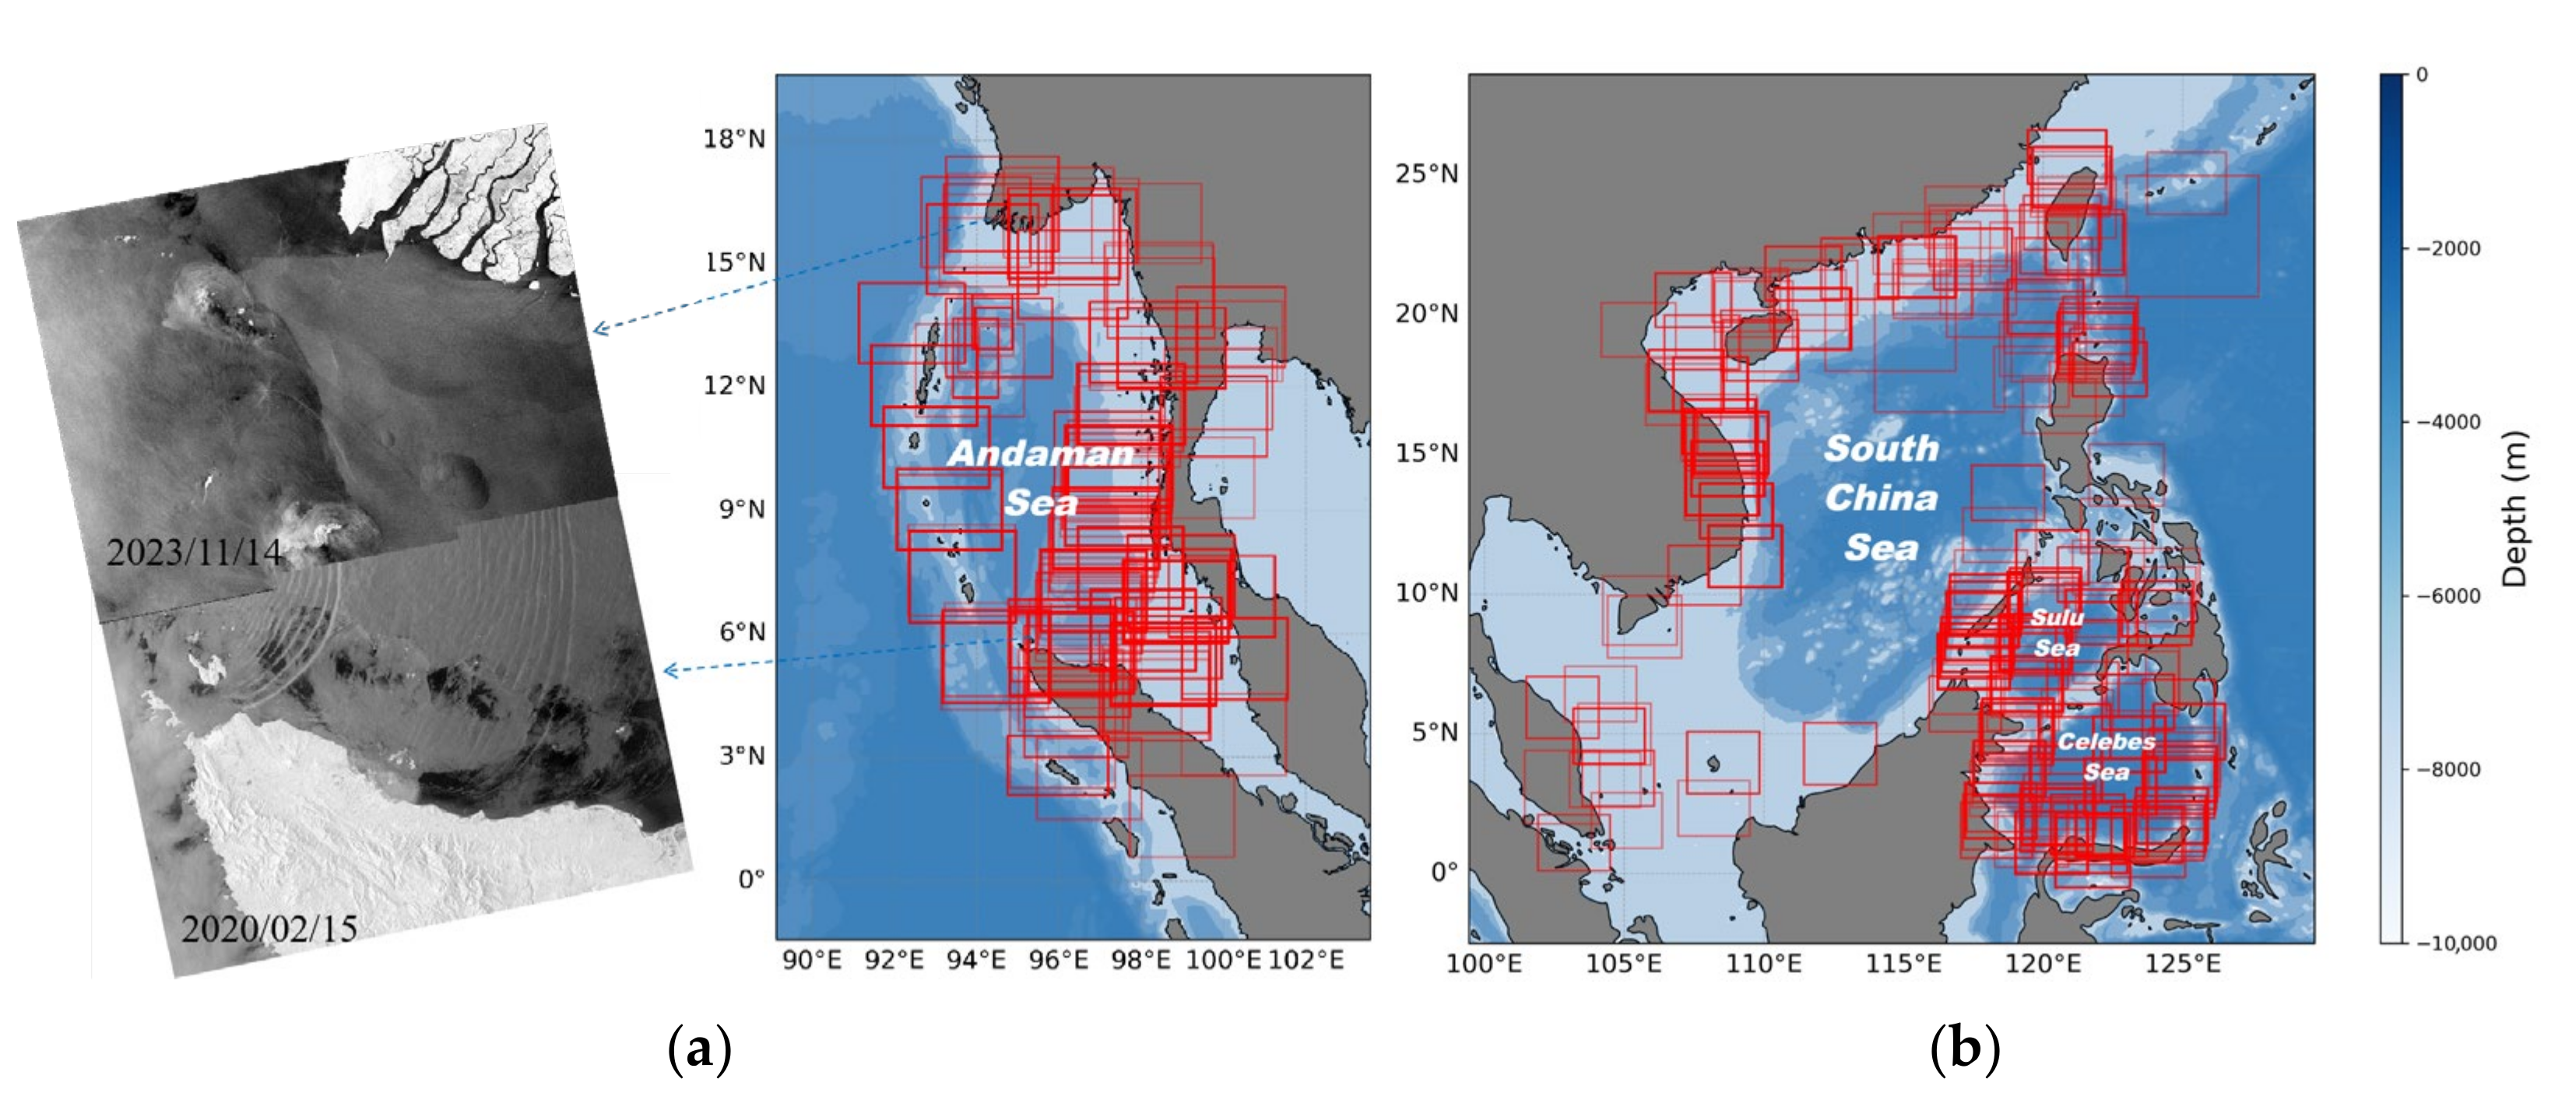
Figure 1. Spatial coverage of SAR images containing ISWs: (a) AS region; (b) Southeast Asia region: SCS, SS, and CS.
Remotesensing 17 03390 g001
Figure 2. Schematic diagram of the process for building deep learning datasets. The red dashed box indicates the location of the ISW, and the red dashed line delineates the precise shape of the wave crest line.
Remotesensing 17 03390 g002
Figure 3. Schematic diagram of the detection process.
Remotesensing 17 03390 g003
Figure 4. The network architecture diagram of the YOLOv8 model for object detection and segmentation.
Remotesensing 17 03390 g004
Figure 5. The performance of the trained model on test instances: (a) annotation examples; (b) detection results.
Remotesensing 17 03390 g005
Figure 6. The reconstruction of the ISW crest lines.
Remotesensing 17 03390 g006
Figure 7. ISW detection under complex background interference. Targets 1–7 represent interference sources, among which the river (6) and mountain (7) are removed by land masking. The remaining targets (1–5) continue to challenge the detection. The blue line indicates the actual extracted wave crest line.
Remotesensing 17 03390 g007
Figure 8. Schematic diagram of the repair of ISW crest lines in the form of skeleton lines on SAR images: (a) a SAR image obtained in the northern part of Sumatra Island in the AS on 6 May 2024; (b) skeleton line pairing and simple connection, where skeleton lines of the same color belong to the same paired group and are connected by green segments.
Remotesensing 17 03390 g008aRemotesensing 17 03390 g008b
Figure 9. Spatial characteristics of ISWs in the AS: (a) spatial distribution of ISW crest lines in 2019; (b) thermogram of the number of detected ISWs.
Remotesensing 17 03390 g009
Figure 10. Temporal characteristics of ISWs in the AS: (a) annual ISW ratios by quarter from 2014 to 2024; (b) monthly variation in the number of detected ISWs. Note: Sums may show 99.99% due to floating-point precision in calculations.
Remotesensing 17 03390 g010
Figure 11. Spatial characteristics of ISWs in the SS and CS: (a) spatial distribution of ISW crest lines from 2015 to 2024; (b) thermogram of ISW activity frequency.
Remotesensing 17 03390 g011
Figure 12. The monthly variation characteristics in the relative quantity of ISWs in the SS and the CS.
Remotesensing 17 03390 g012
Table 1. Statistics of detection results under complex background interference.
TypesSample Size
(Cases)
False Detections (Cases)Error
Reduction Rate (%)
Model Without the Anti-Interference Strategy Model with the Anti-Interference Strategy
oceanic fronts10047344.00
oil slicks10054450.00
ship wakes10048642.00
vortex edges10040436.00
others100621349.00
Total5002513044.20
Disclaimer/Publisher’s Note: The statements, opinions and data contained in all publications are solely those of the individual author(s) and contributor(s) and not of MDPI and/or the editor(s). MDPI and/or the editor(s) disclaim responsibility for any injury to people or property resulting from any ideas, methods, instructions or products referred to in the content.