Highlights
What are the main findings?
- A novel DETR-based framework (GM-DETR) is proposed for the infrared detection of small UAV swarms, effectively addressing challenges like weak features, dense distribution, and motion blur.
- The GM-DETR is mainly improved in three aspects: feature fusion, query selection, and geometric position embedding, which enhances the detection effect on small targets.
- Our model also incorporates a long-term memory mechanism, boosting its robustness against scale variations in dynamic scenarios.
What are the implications of the main findings?
- Extensive experiments on a self-constructed dataset (USD) and the publicly available Drone Vehicle dataset show the state-of-the-art performance of the GM-DETR, which demonstrates the effectiveness and robustness of our model.
- The superiority of the GM-DETR in infrared small target detection proves the effectiveness of the query selection, multi-scale feature fusion, and memory mechanism methods, providing new ideas for the DETR in small target detection tasks.
Abstract
Infrared object detection is an important prerequisite for small unmanned aerial vehicle (UAV) swarm countermeasures. Owing to the limited imaging area and texture features of small UAV targets, accurate infrared detection of UAV swarm targets is challenging. In this paper, the GM-DETR is proposed for the detection of densely distributed small UAV swarm targets in infrared scenarios. Specifically, high-level and low-level features are fused by the Fine-Grained Context-Aware Fusion module, which augments texture features in the fused feature map. Furthermore, a Supervised Sampling and Sparsification module is proposed as an explicit guiding mechanism, which assists the GM-DETR to focus on high-quality queries according to the confidence value. The Geometric Relation Encoder is introduced to encode geometric relation among queries, which makes up for the information loss caused by query serialization. In the second stage of the GM-DETR, a long-term memory mechanism is introduced to make UAV detection more stable and distinguishable in motion blur scenes. In the decoder, the self-attention mechanism is improved by introducing memory blocks as additional decoding information, which enhances the robustness of the GM-DETR. In addition, we constructed a small UAV swarm dataset, UAV Swarm Dataset (USD), which comprises 7000 infrared images of low-altitude UAV swarms, as another contribution. The experimental results on the USD show that the GM-DETR outperforms other state-of-the-arts detectors and obtains the best scores (90.6 on and 63.8 on ), which demonstrates the effectiveness of the GM-DETR in detecting small UAV targets. The good performance of the GM-DETR on the Drone Vehicle dataset also demonstrates the superiority of the proposed modules in detecting small targets.
1. Introduction
In the past few years, unmanned aerial vehicle (UAV) swarms have witnessed significant proliferation across both military and civilian domains [1,2,3], offering the potential to liberate people from repetitive work and reducing the probability of accidents. However, with the frequent occurrence of illegal modifications and flight violations, the challenge of countering malicious low-altitude UAV swarms grows increasingly urgent. Accurate detection of UAV swarms constitutes a critical first step in implementing anti-UAV countermeasures and has thus emerged as a prominent research focus. Among the traditional detection methods, the imaging effect of visible image detection is significantly influenced by external factors such as inclement weather and light intensity, which often lead to unreliable performance. Therefore, it is challenging to achieve continuous and reliable monitoring under some conditions, including stormy weather and long-distance scenarios. Radar-based detection, which relies on echoes reflected by the target, suffers from low-altitude and close-range blind zones, making it susceptible to losing low-altitude targets within UAV swarms. Coupled with the limited reflective area of small UAVs, this method is inadequate for precise and efficient continuous surveillance. Conversely, infrared target detection is not subject to limitations imposed by light intensity, limited reflective area, or inclement weather, which makes continuous surveillance at extended range of low-altitude targets possible. As a result, infrared target detection presents a more suitable alternative for anti-UAV applications.
According to the standard COCO (Common Objects in Context) definition [4], small objects are typically defined as detection targets with a resolution of less than 32 × 32 pixels. In existing datasets [5,6,7], the size of UAV targets generally falls below this established threshold (32 × 32 pixels). Furthermore, in infrared imagery, the pixel area of a typical UAV target is often less than 100 pixels; in extreme cases, it may be as low as approximately 10 pixels. This characteristic categorizes UAV target detection as a typical small target detection problem, rendering most conventional object detection methods unsuitable for UAV detection tasks. The challenges arise primarily because as the depth of the detection network increases and feature processing techniques become more complex and layered, the inherent features of small UAV targets tend to become sparser. Additionally, during continuous downsampling and processing stages, these features are more likely to be obscured by background. Consequently, this leads to a reduction in detection effectiveness. In this case, Zeng et al. [8] proposed a drone detection network based on multi-scale feature fusion, which improves detection performance from the feature extraction and fusion. In Ref. [9], a UAV detector integrated with SSD and YOLOv3 was proposed. The detector achieves good detection performance on RGB images even in motion blur conditions, but the detection speed is decreased. To achieve practical applications, Daniel et al. [10] implemented the YOLOv3 algorithm on the Jetson TX2 device, which is developed by NVIDIA, a US-based technology corporation. However, they did not make improvements to or innovate with the algorithm, and the performance in complex scenarios still needs to be enhanced. In Ref. [11], a learnable NQSA network was proposed which integrates the traditional local contrast extraction method for grayscale features into the semantic dimension. Although the model achieves high detection accuracy by leveraging spatial-channel interactions through priori models, its performance degrades significantly under fluctuating environmental conditions in operational scenarios. In addition to the above methods, there are some other methods [12,13,14,15] that achieve good performance in remote sensing detection tasks.
Although the above methods achieved good results in UAV detection, these methods are mostly focused on scattered UAV targets that do not have swarm attributes. For the infrared target detection of small UAV swarms, there are four significant challenges as follows: (1) Target feature perception challenge. Because of the compact size and extended imaging distances, UAVs usually manifest as small targets in aerial images. The consequent motion-induced edge blurring effect during high-speed flight operations further compromises detection capabilities by distorting edge gradient information and degrading critical texture features. This dual challenge of limited target resolution and dynamic image degradation significantly impedes reliable feature perception in UAV detection scenarios. (2) Similar target classification challenge. Due to the lack of target texture and color features in infrared images, detectors have poor performance in classification tasks, especially when facing small UAV targets. (3) Target feature degradation challenge. The low signal-to-noise ratio makes it challenging to distinguish UAV targets and background. In feature processing, target features are prone to degradation, which may lead to false alarms. (4) Dense distribution challenge. Due to the limitation of communication distance, small UAVs in a swarm are usually distributed in a dense manner. When a swarm conducts formation transformation, mutual occlusion often occurs among UAVs, which increases the complexity of detection. Consequently, it is a significant challenge to maintain high accuracy in the infrared target detection of small UAV swarms.
In this paper, we propose the GM-DETR (Geometric relation embedding and Memory DETR) to tackle these challenges and improve the detection performance mainly from the feature representation, the query sparsification, and the attention mechanism. To enhance the texture and semantic feature representation of infrared images, we propose a Fine-Grained Context-Aware Fusion (FCAF) module, which reduces the loss of semantic features. By analyzing the target characteristics of small UAVs in infrared detection, we propose a supervised sampling method to take the center and boundary points into account, which improves the detection and localization accuracy. Finally, the detection accuracy for mutually occluded and motion blur targets is improved by explicitly encoding the geometric relations among queries and establishing the long-term memory mechanism. The main contributions of our work are summarized as follows:
- 1.
- We propose a Fine-grained Context-Aware Fusion module that enhances small object detection by integrating both semantic and texture features while enlarging the receptive field.
- 2.
- We present a Supervised Sampling and Sparsification method, which consists of a Center Adaptive Supervision (CAS) module and a Boundary–Center Balance Sampling (BBS) module. CAS can adaptively learn the central area of the learning object and provide supervision for subsequent query selection. By balancing the queries of the central and the boundary query area, BBS provides more localization information for the decoding stage and improves the detection accuracy.
- 3.
- To avoid leak detection, we propose a Geometric Relation Encoder to improve the detection performance for mutually obstructed UAVs by encoding the spatial information among queries.
- 4.
- In order to improve the robustness of the GM-DETR, we propose a Memory Updater model and a Memory-Augmented Decoder to establish a long-term memory mechanism in the DETR, which improves the detection ability of scale change and motion blur scenes.
The rest of this paper is organized as follows. Section 2 briefly reviews the development and challenges of infrared target detection. Section 3 gives the overall architecture of the GM-DETR and introduces proposed modules in detail. In Section 4, the extensive experiments are detailed, and it is shown that the GM-DETR has excellent performance in detecting UAV swarms and other small targets. In Section 5, the conclusions of this paper are summarized.
2. Related Work
2.1. Infrared Target Detection
Infrared target detection methods can be broadly categorized into model-driven and deep learning-based approaches. The efficacy of model-driven methods stems from the distinct thermodynamic characteristics that differentiate targets from backgrounds, as discussed in [16,17,18,19,20,21,22,23,24,25]. Specifically, biological organisms or artificial objects typically exhibit abrupt variations in temperature due to their material properties and internal energy. In contrast, background elements such as slopes, skies, and oceans generally display minimal temperature fluctuations characterized by continuous and gradual spatial changes. This disparity allows for a certain degree of feasibility when estimating potential targets within an image based on prior assumptions. Li et al. [16] proposed a saliency detection framework based on spectrum scale-space analysis, which can detect targets by highlighting salient regions and inhibiting repeated regions. In Refs. [17,18], a detection method based on frequency domain transformation was proposed which transforms spatial domain information into the frequency domain one and detects targets by filtering low-frequency signals. Tom et al. [19] propose a detection filter based on morphological background estimation, which exhibits spatial high-pass characteristics emphasizing target-like peaks in the data and suppressing all other clutters. In Ref. [20], a seven-layer deep convolutional neural network is designed to automatically extract small target features and suppress clutters in an end-to-end manner. The method has more powerful target detection performance and improves the signal clutter ratio gain. Cao et al. [21] proposed a derivative dissimilarity measure for the infrared detection of small targets, which suppresses complex background clutters and locate weak and dim targets precisely with a high detection ratio. However, it is important to note that the thermal imaging characteristics of both the target and its surrounding environment are influenced by geographical location, time of day, and seasonal variations. These factors can significantly undermine the effectiveness of model-driven approaches in infrared target detection. This is why the modules or hyperparameters of their methods are required to be adjusted according to different scenarios and targets.
Compared to the above methods, deep learning-based methods have better accuracy, robustness, and generalization capability in visible-light detection, and the texture features and weight parameters are obtained through extensive training. Deep learning-based methods can be broadly divided into one-stage and two-stage detection methods. One-stage detection methods perform the regression and classification tasks in a single forward propagation, which can improve the real-time detection capability, as discussed in [26,27,28]. In comparison with one-stage methods, two-stage detection methods usually have higher detection accuracy under the same conditions due to the fine-grained process of generating candidate regions, as revealed in [29,30,31,32]. Specifically, the first stage is to generate candidate regions from an image. The second stage is to extract features of candidate regions, which are used to perform classification and regression. When the two types of methods are applied to the infrared target detection, the detection performance may tend to decrease due to the lack of texture features and low resolution. Therefore, some modifications were made to improve the detection performance. Ju et al. [33] proposed a filtering module to obtain the confidence map. This method aims to predict the category and position of small infrared targets. In Ref. [34], a single shot multi-box detector was proposed to improve the detection performance on small infrared targets.
2.2. Detection Transformer and Its Variants
With the in-depth study of Transformer methods with attention mechanisms, Transformer-based methods have emerged from the deep learning-based methods. Carion et al. [35] first proposed the Detection Transformer (DETR), which transforms the object detection task into the set prediction task of pixel sequences. The DETR realizes the end-to-end training by eliminating handcrafted components such as anchor boxes and non-maximum suppression. Many methods based on the Transformer have been referred to as the DETR family. These approaches have consistently set new records for the COCO challenge, as discussed in [36,37,38,39,40,41,42,43,44,45,46,47,48,49,50,51]. In Ref. [36], it was proved that competitive performance can be achieved by the Efficient DETR, which has only three encoder layers and one decoder layer. Zhu et al. [37] proposed the deformable attention mechanism, which transforms the computational complexity into a linear correlation with the image size and improves the detection accuracy. Meng et al. [38] proposed the conditional cross-attention mechanism to narrow down the spatial range for localizing the distinct regions, which relaxes the dependence on the content embeddings. In Ref. [39], the anchor box was introduced into DETR, which improves the query interpretability and speeds up the training convergence. There are also many other modifications, such as architecture design [40,41,50,51], query sparsification [42,43,44], and training techniques [45,46,47,48,49].
3. Proposed Method
3.1. Overall Architecture
As shown in Figure 1, the GM-DETR, which adopts the two-stage pipeline, consists of five parts, that is, a backbone, a Fine-Grained Context-Aware Fusion module, an encoder, a Query Refinement module and a decoder. We utilize ResNet50 as the backbone network to extract multi-scale features , whose structure is presented in [52]. The fused feature map has the same scale as and is fed into the encoder, where C, H and W represent the channel, height, and width of the feature map. The Supervised Sampling and Sparsification method is proposed to make the GM-DETR focus on high-quality queries with supervised confidence values and reduce computational costs. In the Geometric Relation Encoder, the loss of the spatial information is mitigated by the Geometric Relation Embedding (GRE) module and relation-embedded self-attention. In the Query Refinement and the Decoder, the Memory Updater module and Memory-Augmented Self-Attention are proposed to improve the adaptive detection ability of UAVs.

Figure 1.
Architecture of GM-DETR.
3.2. Fine-Grained Context-Aware Fusion
In the multi-level features, high-level features are imperative for classification tasks due to their rich semantic information. Concurrently, low-level features, characterized by their high spatial resolution, can retain fine local textures and geometric details, and this process plays a key role in target localization. However, in the task of small target detection, the downsampling operation results in a progressive decline in the resolution of the feature map. Consequently, the representation of small targets in the high-level feature map is susceptible to feature degradation or even loss. At this point, its semantic advantages are transformed into misleading problems due to the absence of target features. In this case, we propose a Fine-Grained Context-Aware Fusion (FCAF) module, which utilizes cascaded dilated convolution to enhance the visual receptive field, capture the detailed target features and context information. Its architecture is shown in Figure 2. For the adjacent high-level feature and low-level feature , is expanded to the same scale as the by the bilinear interpolation. After concatenating the and in the channel dimension, 1 × 1 convolution is used to reduce the computational costs, which can be represented as follows:
where , , , and represent the convolution, concatenation, bilinear interpolate operation, and the input of first fusion block, respectively.
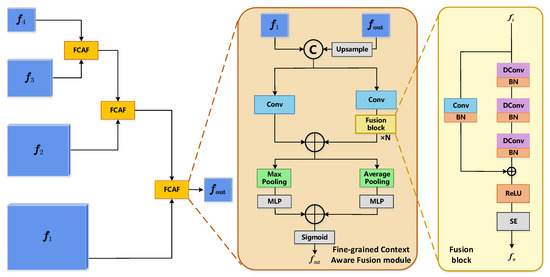
Figure 2.
Fine-Grained Context-Aware Fusion module.
In the fusion block, we leverage convolution layers with different dilated rates to expand the receptive field, which can avoid target lost. Subsequently, Squeeze-and-Excitation is employed to adjust the channel weights and enhance the representation of small target features, which can be formulated by
where represents the convolution with a dilated rate i, denotes the output of the first fusion block, and SE is the Squeeze-and-Excitation block.
To ensure the richness and robustness of feature expression, a parallel and complementary pooling strategy is designed. Combined with the Fine-Grained Context-Aware Fusion module, a channel-space dual attention mechanism is formed to achieve fine-grained feature enhancement and dynamic weight allocation, which can be formulated by
where MaxP and AverP represent the Max Pooling and Average Pooling, respectively; denotes the output of the last fusion block; is the sigmoid function; and represent the output of the Max Pooling branch and Average Pooling branch, respectively; represents the final output; and N denotes the number of the fusion block.
Through the FCAF module, high-level features rich in semantic information can be progressively integrated into low-level features. By employing cascaded dilated convolution and a residual connection path, the local receptive field is expanded, thereby enhancing context information and the contrast between the target features and background. Furthermore, it also effectively mitigates the issue of feature degradation that arises from continuous downsampling, which is further explained in the ablation study.
3.3. Supervised Sampling and Sparsification
Query filtering aims to select queries containing more target information by setting certain quantization rules, achieving comparable performance while reducing the computational load of the model, as revealed in [42,44]. In order to better differentiate the queries in the foreground, Euclidean distance is utilized in the Salience DETR to replace discrete labels 0, 1. While it provides empirical guidance for query selection by concentrating queries in the target centroid, it introduces two critical limitations. First, boundary queries and context information are ignored, resulting in inaccurate localization. Second, it induces directional inconsistencies in prediction that contradict the intrinsic characteristics of infrared UAV targets, which are generally characterized by central symmetry with no significant directional variation, as shown in Figure 3a,b. In order to solve these problems, we propose a Supervised Sampling and Sparsification (SS) method to sparsify input queries and improve the quality of selected queries. This method consists of a Center Adaptive Supervision module and a Boundary–Center Balance Sampling module.
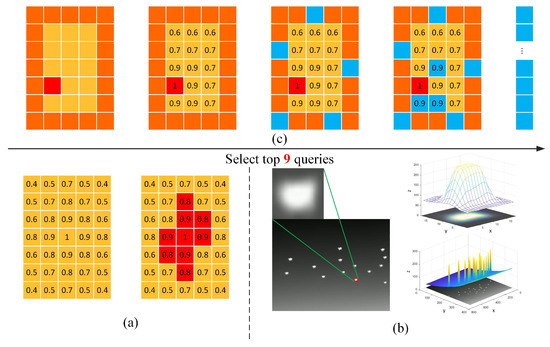
Figure 3.
Diagram of Supervised Sampling and Sparsification module. (a) represents the sampling method used in the Salience DETR. (b) includes an infrared UAV image and grayscale images of a UAV target and a whole image in the top right and bottom right, respectively. (c) represents the sampling flow of the BBS method. The boundary points are marked in orange, while the center points are indicated in yellow. Red represents the visual focus, and blue represents the selected queries.
Center Adaptive Supervision. Any object has distinctive features that serve as unique identifiers, which are not necessarily concentrated in the central area. For instance, in the Drone Vehicle dataset, the distinguishing characteristics of different vehicles are not located in the body (center) but rather in the front or rear of the vehicle. Therefore, we utilize a three-layer Multilayer Perceptron (MLP) to predict the center point of a target in order to achieve category adaptive supervision.
In order to improve the problem of direction differences, we use the Chebyshev distance to calculate the confidence of a foreground query, which can be formulated by
where p represents the center point generalized by MLP in a ground truth box , and w and h denote the width and height of a ground truth box, respectively. and denote the distance from queries to the center point in x and y direction, respectively.
In the Center Adaptive Supervision module, the detection accuracy is improved by restricting sampled queries around the center region of UAV targets, where the effect of boundary points on detection was ignored. In this case, we propose the Boundary–Center Balance Sampling (BBS) module to add the proportion of boundary points, which could provide localization information for the decoding stage.
Boundary–Center Balance Sampling. For a ground truth box with a height h and a width w, due to the refinement of foreground points, the confidence level decreases from the central region of to the boundary, which results in the final sampled queries being clustered in the central region and losing the localization and context information of boundary points. In this case, we propose a boundary–center balance sampling approach. During the sampling process, BBS determines the target visual focus based on the MLP prediction results and divides queries into two categories: center and boundary. It adaptively selects a certain number of queries based on the proportion of the two types of queries. The sampling process is shown in Figure 3c. The queries selected by the BBS module are filtered by 0.1 per encoder layer, which makes the GM-DETR further focus on high-quality queries and reduces computational costs.
Through iterative training, the CAS module facilitates the GM-DETR in identifying focal centers for diverse targets within complex scenarios (e.g., feature degradation and motion blur), which mitigates directional inconsistencies in prediction. Concurrently, the BBS module achieves a balanced selection of boundary queries, which collectively enhance localization accuracy. This approach effectively mitigates the inherent difficulties in feature perception of weak small targets in infrared imagery.
3.4. Geometric Relation Encoder
The Geometric Relation Encoder consists of the Geometric Relation Embedding module and six encoder layers. In the GRE module, the two-dimensional geometric relation between queries is constructed by encoding the explicit position relation at the pixel level, and the prior position matrix is obtained as the prior position knowledge. In the encoder layer, relation-embedded self-attention is proposed to fuse prior position information into encoded image features, which helps improve the detection accuracy for dense distributed UAVs.
Geometric Relation Embedding. DETR class methods flatten a two-dimensional feature map into a one-dimensional sequence of queries, which destroys the spatial relation among queries and results in the loss of scale information. In a dense distributed small UAV swarm, UAVs are often obscured from one another. If a feature map is flattened directly, the characteristics of UAVs become intertwined; obscured UAVs may be mistakenly identified as a single, unified target. In this case, we propose the GRE module to encode the geometric relation among queries, which are fed to the decoder as supplementary spatial information.
Let and denote the maximum value and the minimum value of the x-coordinate in a ground truth box, respectively. Let and denote the maximum value and the minimum value of the y-coordinate in a ground truth box, respectively. Let the pair denote the coordinates of the center query. Let w and h denote the width and the height of a feature map, respectively. Then, one can obtain that
Thus, we compute the geometric relation for queries in the feature map, which can be represented by
where represents the relative position between query i and query j, and , when .
The first two items in (12) calibrate the relative position of query i and query j. The last two items embed the scale information of a UAV target. Specifically, the denominator acts as a scale factor and calibrates the distance from query i to the center query. When this distance is 0, the last two items are symmetric. In addition to the numerical stability consideration, in the denominator is used to ensure that the last two terms are zero only if . Then, is mapped to a high-dimensional embedding vector through a fully connected layer, which can be represented as follows:
where is a matrix with , which includes information about the relative position among queries; FC represents a fully connected layer with a activation function; and is the geometric relation matrix.
Relation-Embedded Self-Attention. In order to better integrate geometric relation information and reduce the impact on computational complexity, we improve the deformable attention mechanism. Given the feature map and a geometric relation matrix R, the relation-embedded self-attention calculation process is shown in Figure 4 and can be represented as follows:
where denotes selected queries; are reference points; h indexes attention heads; k indexes reference points; and represent the global attention weight and the geometric relation attention weight of the k-th sampling point in the h-th attention head, respectively; is a learnable matrix; is an identity matrix; denotes the sampling offsets, which are real numbers with unconstrained range; and are both 1, and their sum divided by 2 is normalized, so that the total attention weight remains 1; and and both represent the fully connected layers, whose parameters are independent.
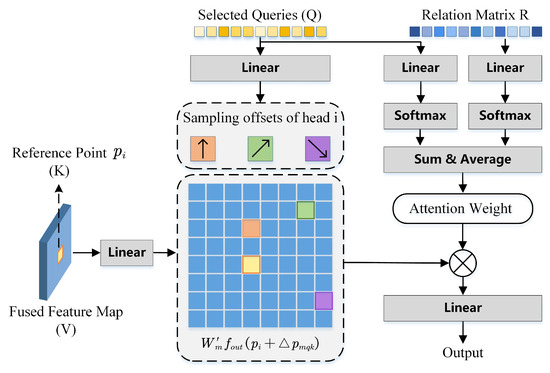
Figure 4.
Illustration of relation-embedded self-attention.
3.5. Memory Update
Memory Updater. By default, the training set is presented in a disordered manner, with no inherent connection between any two consecutive images. Even objects belonging to the same class may exhibit variations in scale and shape. Most detectors do not possess long-term memory capabilities during learning like humans do; thus, the target detection relies solely on model parameters without leveraging any prior knowledge. Nevertheless, we contend that it is feasible to establish a learning mechanism for detecting similar objects, which can enhance the detection accuracy. In this case, we propose the Memory Updater module, which is designed to facilitate long-term memory retention for detection. Specifically, memory blocks are learnable high-dimensional vectors, where the denotes the number of memory blocks. They are created using the Embedding function from the torch library during model initialization. The update process can be represented as follows:
where the denotes the memory block of class i, which is selected to update according to the classification probability of the encoder, and U and represent the output of the encoder and the new memory block of the current target, respectively.
Then, we concatenate and the using a two-layer MLP to fuse memory blocks. It should be pointed out that memory blocks are only updated during the training stage.
3.6. Memory-Augmented Decoder
Memory-Augmented Self-Attention. In a decoder of the DETR, object queries are learnable vectors that assist the model in understanding the position and feature representation of targets within an image. Self-attention is employed to facilitate attention through pairwise similarity. However, in certain scenarios, such as those involving scale variations or motion blur, the size and appearance of a target may significantly change, leading to a reduction in detection accuracy. In this case, we propose Memory-Augmented Self-Attention (MASA) to address these challenges. In particular, the updated memory block is passed to the decoder as supplementary decoding information, which encompasses prior knowledge and assists the GM-DETR to better detect objects with scale variations or limited texture features. Memory-Augmented Self-Attention can be represented as follows:
where Q represents the query object, and FC represents the fully connected layer, which is used to compress the dimension of to 64. , , , and are learnable matrices.
3.7. Training Details
The GM-DETR is trained with a multi-task loss function, which is defined as follows:
where is the loss for pair-wise matching based on the Hungarian algorithm; denotes the Supervised Sampling and Sparsification loss function; is the loss for auxiliary optimization through the output of the last encoder layer; is the loss for denoising models; and , , , and are scaling parameters.
Loss items are specifically formulated by
where denotes the indicator function, is the prediction index, denotes the prediction probability that is the class label , denotes the loss between the prediction box and the ground truth box , and are focal parameters, is the foreground probability, and represents the confidence value, which is proposed in (7).
4. Experiments and Discussion
4.1. Experimental Setup
Datasets. We conducted extensive experiments on the self-constructed UAV Swarm Dataset (USD) and the publicly available Drone Vehicle dataset. The USD contains 7000 infrared images of low-altitude UAV swarms with a resolution of 720 × 540, capturing low-altitude UAV swarms against urban backgrounds. The data was acquired using mid-wave infrared cameras mounted on a ground-based platform, simulating real-world drone swarm operations. Data collection covered varied conditions, including time of day (day and night) and weather (clear and cloudy). To ensure diverse behavioral representation, the UAV swarms were programmed to execute multiple formations—such as linear, circular, and random patterns—along with maneuvers, including hovering, cruising, and crossing. The original video clips were converted into image sequences at 25 frames per second, with frames sampled at three-frame intervals for annotation in COCO format. The resulting infrared images encompass a wide range of scenarios, such as swarm cruising, cross-flights, and dynamic formation changes. Each image contains an average of 20–30 UAV targets. The images in the USD can suitably reflect the three challenges associated with the infrared UAV swarm detection mentioned in the first section; an example image and related statistical analysis are shown in Figure 5a and Table 1. The allocation of target areas and the statistical analysis of targets categorized by size are illustrated in Figure 5b,c, respectively. The distribution of UAV targets in the USD are shown in Figure 5d. The heat map indicates the number of UAV sightings in the same area, and each blue point indicates an UAV target.
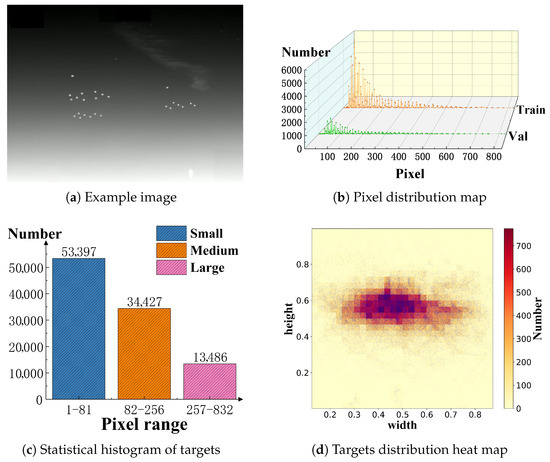
Figure 5.
Example image and statistical results for USD. (a) is an image of small UAVs in multiple formations. (b) is the target pixel distribution for train and test sets. (c) is a statistical histogram of small, medium, and large targets according to our definition. (d) is the target distribution heat map.

Table 1.
Statistics of USD.
In order to make the comparison more robust, we also compared the GM-DETR with other detectors on Drone Vehicle, which is a large-scale, drone-based, RGB–infrared vehicle detection dataset. It includes 28,439 vision–infrared image pairs. Its detection challenges lie not only in accurately locating small-scale targets from an aerial perspective but also in overcoming the fine-grained feature deficiency caused by shooting height, complex background, and cross-modal differences, so as to accurately distinguish the types of vehicles. Here, we only used infrared images to evaluate the existing methods.
Evaluation Metrics. This study used the standard evaluation protocol, Average Precision (AP) and Average Recall (AR) metrics, as revealed in [4]. These metrics reflect the area under the precision–recall curve, and the formulation can be represented by
where the denotes the detection accuracy, r represents the recall, TP is true positives, FP denotes false positives, and FN represents false negatives.
The criterion for determining a true positive is that the C-IoU of the prediction bounding box and the ground truth should be greater than the threshold of 0.5. The average AP for each class is given as mAP, while the average accuracy mAP is obtained from thresholds in the range 0.5:0.95. In addition, the computational and real-time performance are evaluated based on the number of giga-floating-point operations per second (GFLOPs) and frames processed per second (FPS).
As shown in Figure 5b,c, all the target areas in the USD are smaller than the definition of small targets in coco (32 × 32 pixels), which leads to the evaluation metrics, such as and , being −1 in the final evaluation. Such results provide no meaningful information for the task of infrared detection of small UAVs and allow for no meaningful comparison among different models. In this case, we adopted 81 and 256 pixels as thresholds to redefine the pixel area ranges for large, medium, and small objects, mapping the original pixel area ranges from (96 × 96, +∞), (32 × 32, 96 × 96], and (0, 32 × 32] to (16 × 16, +∞), (9 × 9, 16 × 16], and (0, 9 × 9], respectively. This classification aligns with the definition of small infrared targets established by the Society of Photo-Optical Instrumentation Engineers [53,54].
Implementation details. In terms of the hyperparameter settings and training details, we set and for deformable attention. The number of fusion block was set to 6. As for object queries, DETR class methods conducted query selection layer by layer on multi-scale features, and the number of object queries was set to 300 to avoid the deviation of detection performance caused by inconsistent object queries. The effect of object queries on the detection performance of the GM-DETR is discussed in detail in the ablation study. The memory slots are designed to update and store prior knowledge for each object category. Therefore, was set to the total number of object categories plus one to include the background class. For instance, in the Drone Vehicle dataset, was set to 6, while for the USD with a single foreground category, took the value 2. We trained the GM-DETR using the AdamW optimizer [55] with a weight decay of on NVIDIA RTX 4090 GPUs (24 GB), which is developed by NVIDIA, a US-based technology corporation. For the initial learning rate, the backbone part was set to , and other parts were set to . The learning rate was decreased by 0.1 at later stages. The batch of per GPU was set to 4 and 10 for the USD and Drone Vehicle, respectively. The training epoch was set to 120 and 12 for the USD and Drone Vehicle, respectively. All methods adjusted the input size according to the image to ensure the validity of the experimental results.
4.2. Comparison with State-of-the-Art Methods
To better validate the effectiveness of the GM-DETR, we compared the performance of the GM-DETR model with models that have achieved the cutting-edge performance in recent years under the same experimental settings, namely, Faster R-CNN [29], RetinaNet [56], YOLOv5 [57], YOLOv6 [58], YOLOv7 [26], YOLOv8 [27], YOLOv10 [28], Deformable DETR [37], Conditional DETR [38], Anchor DETR [59], DAB-DETR [39], Dn-DETR [45], Dino [40], Dino-eva-01 [60], Focus-DETR [32], Co-DETR [49], and Salience DETR [44]. The evaluation results on the USD and Drone Vehicle are shown in Table 2 and Table 3. The GM-DETR achieves good performance on both datasets.

Table 2.
Quantitative comparison on USD. The best and second-best results are marked in red and blue, respectively. , , and represent the average accuracy of large, medium, and small infrared targets, respectively, which are defined as (256, +∞), (81, 256], and (0, 81] pixels.

Table 3.
Quantitative comparison on Drone Vehicle. The best and second-best results are marked in red and blue, respectively.
Comparison on USD. As shown in Table 2, except for , , and , the GM-DETR outperforms reference methods on all metrics. It is worth noting that the GM-DETR is the only method to score above 90 on , and the GM-DETR surpasses the second-best method, the Focus-DETR, with a large margin of 1.9% on . In addition, we focus more on the performance in detecting small targets, i.e., , as it reflects the response speed and detection distance of a model. It is clear that the GM-DETR improves by 1.1% on compared to the second-best method, the Salience DETR, which demonstrates the effectiveness of the GM-DETR in the infrared detection of small UAV targets. All methods were trained for 120 epochs. All employ ResNet50 as the backbone, except for Dino-eva-01, which uses EVA [60] as backbone.
Comparison on Drone Vehicle. Table 3 shows the comparison results on Drone Vehicle. Drone Vehicle is also a highly challenging detection dataset because of the similar appearance of air-ground targets. Detectors are required to capture sufficient appearance feature and context information to distinguish different type vehicles. The GM-DETR achieves the best performance in terms of the AP and AR metrics. To evaluate the proposed methods against the baseline Salience DETR, the ablation study is conducted using AP, , , and FPS metrics by removing specific components and testing on the USD.
As shown in Table 4, the ablation study demonstrates that the FCAF, SS, and GRE modules contribute significantly to the detection performance. In contrast, the Memory Updater and Memory-Augmented Decoder increases the but declines in other metrics. All in all, the GM-DETR achieves the best results (73.7 on AP and 90.6 on ), confirming the effectiveness of each proposed component. The convergence graphs of the ablation study are shown in Figure 6.

Table 4.
Ablation results on USD. FCAF, SS, GRE, and Memory stand for the Feature Fusion, Supervised Sampling and Sparsification, Geometric Relation Encoder, Memory Updater, and Memory-Augmented Self-Attention, respectively. CAS and BBS are the sub-modules of Supervised sampling and Sparsification.
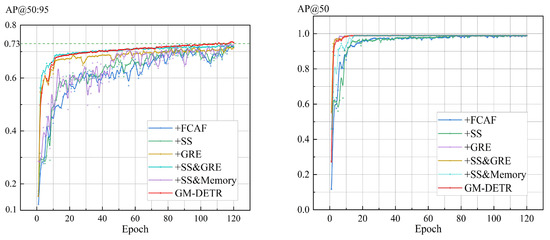
Figure 6.
Convergence graphs of ablation study on USD.
4.3. Ablation Study
Effect of Fine-Grained Context-Aware Fusion. To validate the fusion effect of the Fine-Grained Context-Aware Fusion module, we performed a controlled experiment with the Salience DETR and the GM-DETR, as shown in Table 5. Compared to the GM-DETR, the GM-DETR with FPN declines on all metrics, except . In another control group, the Salience DETR with the Fine-Grained Context-Aware Fusion module gains +0.6 improvement on AP and +0.1 improvement on , which shows that the Fine-Grained Context-Aware Fusion module can improve the fusion effect of multi-scale features and the detection performance. In Figure 7, we show the convergence process of detection accuracy and loss terms during training.

Table 5.
Quantitative comparison of Fine-Grained Context-Aware Fusion module.
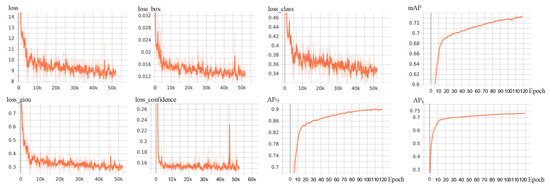
Figure 7.
Convergence graphs of different loss items and critical evaluation metrics on USD.
The loss curve, which denotes the total training loss, exhibits a consistent decline from approximately 15 to 8 over the course of training, demonstrating stable optimization and effective learning. The loss box, representing the regression loss for bounding box localization, decreases significantly from 0.032 to around 0.012, indicating the model’s enhanced capability in accurately locating small infrared UAV targets. Similarly, the loss class curve, which corresponds to classification error, declines from 0.46 to 0.34, reflecting improved discrimination between target and background under challenging infrared conditions. The synchronized convergence of decreasing losses and increasing mAP attests to the robustness and stability of the training process and validates effectiveness of the GM-DETR for the infrared detection of small UAVs.
Ablation study of Memory Updater. In order to ascertain the enhancement of the Memory Updater module and different compression values of on the detection effect, we conducted experiments on the Drone Vehicle dataset. The results are displayed in Table 6. It is evident that increasing the compression value results in an enhancement of detection accuracy, albeit to a certain extent. Specifically, expanding the prior experience space is demonstrated to enhance the detection precision for different vehicles such as vans and freight cars, which are hard to recognize. No memory group proves the effectiveness of the proposed Memory Updater module. The 64 (Mix) group represents the Memory Updater as set a single memory block and compresses it into 64 in MASA, which is iteratively updated for each target and image. The result demonstrates the the effectiveness of the proposed method in setting the memory update mechanism for each class.

Table 6.
Ablation results of Memory Updater and compressed value .
Collectively, the results presented in Table 6 indicate that for infrared images characterized by the absence of discriminative texture and color features, the Memory Updater module enhances the performance of the GM-DETR on the classification task for similar targets.
Ablation study of object queries. The query sparsification of DETR class methods aims to reduce training costs by decreasing the number of queries while maintaining comparable detection performance. To investigate the impact of varying the number of object queries on detection performance, we conducted extensive experiments on Drone Vehicle, and the results are presented in Table 7. The research results show that within a certain range, the detection performance of the GM-DETR demonstrates a positive correlation with the number of queries. However, as the number of queries continues to grow, the decoding effect will decline after the introduction of too many low-quality queries. Considering both training costs and the validity of comparisons, we standardized the number of queries to 300 across all our experiments.

Table 7.
Ablation results on object queries of GM-DETR on Drone Vehicle.
Ablation study of the boundary points ratio. To evaluate the influence of the boundary points ratio, a hyperparameter, on the model performance, we designed a detailed ablation experiment. This parameter plays a critical role in the model’s capacity to perceive and leverage edge features of faint and small targets. We performed extensive comparative experiments on the USD across different values of this ratio, with results illustrated in Figure 8. As shown in the figure, detection accuracy begins to decrease gradually once the number of boundary points surpasses that of center points. Furthermore, as the proportion of boundary points continues to rise, the rate of performance degradation becomes increasingly pronounced.
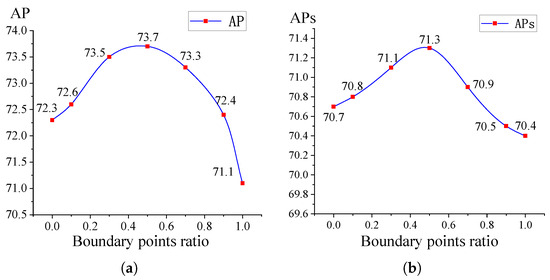
Figure 8.
Ablation study results of the boundary points ratio. (a) Sensitivity curve of boundary points ratio on AP; (b) sensitivity curve of boundary points ratio on APs.
4.4. Visualization
Visualization results for USD. We selected six representative images from the test set to visualize the detection performance covering formation changes, dense distribution, mutual occlusion, multi-cluster flights, motion blur, and different formation shape scenes. In Figure 9, we visualize the attention results of the GM-DETR and find that it can effectively locate the foreground area and distinguish targets from background. Although the GM-DETR is also affected by watermarks and the smoke, the GM-DETR is able to eliminate their interference in the query refinement and decoding stages from the final detection results, which are shown in Figure 10. In Figure 11, we visualize the confidence values of the queries selected by the BBS module. Since only queries with high confidence were selected, there are red dots but no blue dots in the subgraphs. The visualization results demonstrate that the Boundary–Center Balance Sampling module enhances the relevance of the selected query to the target by guiding the selection of queries, which makes the GM-DETR focus on the boundary and center regions.
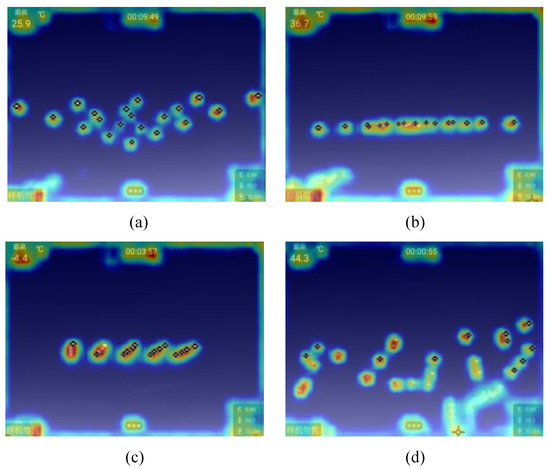
Figure 9.
(a–d) Attention visualization of GM-DETR on USD. Red, blue, and other colors denote 1, 0, and the values between them, respectively.
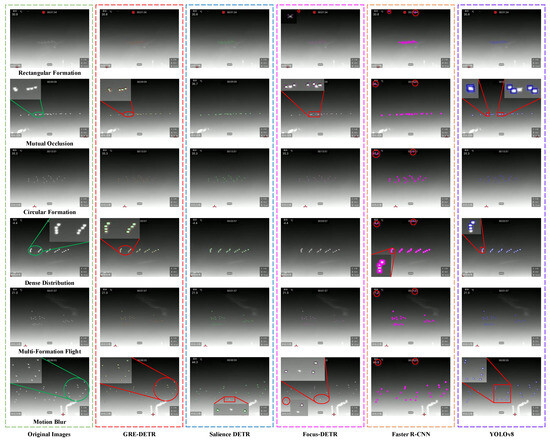
Figure 10.
Visualization results of different methods on USD.
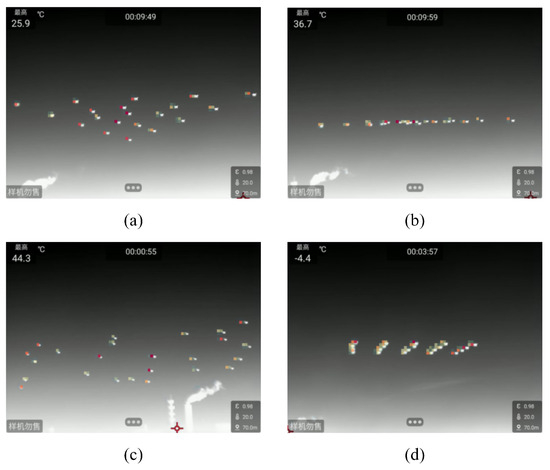
Figure 11.
(a–d) Visualization results of Center Adaptive Supervision and Boundary–Center Balance Sampling module. Red, blue, and other colors denote 1, 0, and the values between them, respectively.
In Figure 10, YOLOv8 suffers from leak detection and poor accuracy. Faster R-CNN suffers from severe leak detection and misdetection. The Focus-DETR suffers from misdetection in the first image and suffers from leak detection in the second and last images. The Salience DETR is the best among the comparison methods and only suffers from leak detection in the motion blur image. In contrast, the GM-DETR performs well in all cases, especially in the mutual occlusion, dense distribution, and motion blur images.
Visualization results for Drone Vehicle. Vehicle targets in the Drone Vehicle dataset have a relatively large target scale and rich diversity of appearance features, which makes it easier to understand the differences in how different detection models respond to features. Based on the above characteristics, we selected several images to conduct a visual analysis of the baseline and GM-DETR, and corresponding attention heat maps were generated, as shown in Figure 12. Comparative analysis revealed that the GM-DETR model exhibits more focused attention distribution for distinguishable parts, such as the front or rear of the vehicle, depending on the vehicle type. This phenomenon demonstrates the effectiveness of our CAS module and BBS module. In contrast, the baseline model exhibits a more focused attention response pattern relative to the target center area.
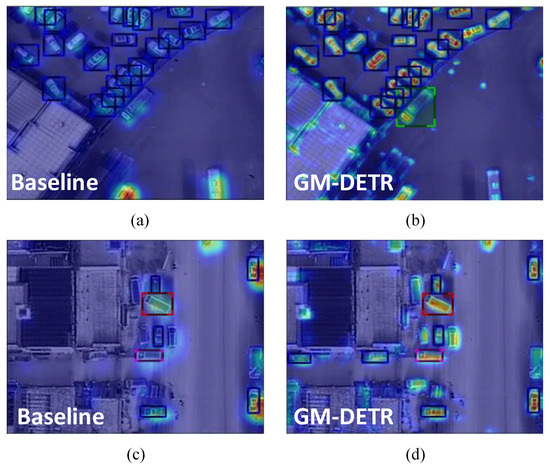
Figure 12.
(a–d) Attention heat maps of GM-DETR and baseline. Baseline model indicates the Salience DETR.
The differences in the visual perception mechanism between the GM-DETR and the baseline model were effectively verified by visual comparison analysis. As shown in Figure 13, the confidence values of the baseline model show a significant central aggregation phenomenon. Its attention area is limited to the central region of the annotation box, and there are obvious shortcomings in its ability to capture the boundary and global contextual information of a target. In contrast, the GM-DETR leverages its CAS and BBS modules to dynamically shift focus across target types while balancing attention between central target regions and contextual boundaries. The visualization results of different methods on Drone Vehicle can be found in Figure 14.
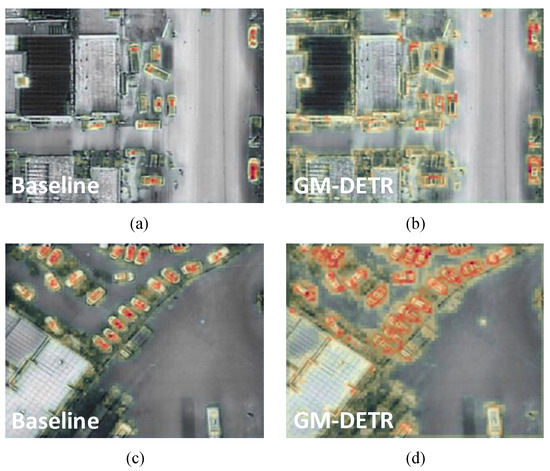
Figure 13.
(a–d) Visualization results of Center Adaptive Supervision module and Boundary–Center Balance Sampling module on Drone Vehicle.
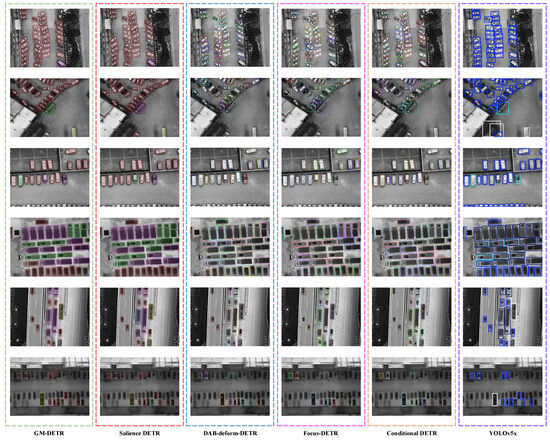
Figure 14.
Visualization results of different methods on Drone Vehicle.
5. Conclusions
In this paper, we propose a Transformer-based detector, the GM-DETR, to detect low-altitude small UAV targets. Specifically, we propose a Fine-Grained Context-Aware Fusion module to enhance semantic and texture features of infrared targets. To improve the quality of selected queries, we propose a Supervised Sampling and Sparsification method, which consists of a Center Adaptive Supervision module based on Chebyshev distance and a Boundary–Center Balance Sampling module. By conducting geometric relation embedding, the GM-DETR effectively tackles the missed detection of mutually obstructed small UAV targets. In the second-stage, we introduce a long-term memory mechanism to improve the robustness of the GM-DETR, which improves the detection accuracy of the multi-category Drone Vehicle dataset. In the decoder, we improve the self-attention mechanism in decoder layers by incorporating memory blocks as additional decoding information. Finally, we demonstrate that the GM-DETR achieves state-of-the-art performance by comparing it with competitive methods on the USD and Drone Vehicle. The contributions of different modules are further analyzed through the ablation study. We believe that our work provides a good case for the application of the DETR in the infrared target detection of small UAV swarms.
Owing to constraints in data collection time and airspace authorization, the current USD exhibits limitations in weather and geographical diversity. Furthermore, the use of identically appearing quadcopters during data acquisition also restricted variation in target appearance. As a result, models trained on this dataset may generalize poorly to UAV swarm detection under different environmental conditions. To address these issues, we plan to enhance model generalization by collecting data across more diverse geographic and weather conditions and by leveraging data augmentation and generative algorithms to synthesize UAV imagery under varied scenarios. In the future, our research will focus on multi-modal UAV swarm detection, with an emphasis on investigating cross-modal feature alignment and interaction fusion issues. We will also expand the categories of UAV targets and incorporate RGB-T image data into the USD to support multi-modal detection research.
Author Contributions
Conceptualization, methodology, investigation, C.Z. and X.X.; validation, C.Z.; writing—original draft preparation, C.Z.; writing—review and editing, C.Z., X.X., J.X. and X.Y.; visualization, C.Z. and X.X.; funding acquisition, X.X. and J.X. All authors have read and agreed to the published version of the manuscript.
Funding
This work was supported by the National Natural Science Foundation of China under Grants U23B2064, 62176263, and 62103434; the Shaanxi Natural Science Basic Research Program-Youth Project 2025JC-YBQN-824.
Data Availability Statement
The original contributions presented in this study are included in the article. Further inquiries can be directed to the corresponding author.
Conflicts of Interest
The authors declare no conflicts of interest.
References
- Weng, S.; Wang, H.; Wang, J.; Xu, C.; Zhang, E. YOLO-SRMX: A Lightweight Model for Real-Time Object Detection on Unmanned Aerial Vehicles. Remote Sens. 2025, 17, 2313. [Google Scholar] [CrossRef]
- Di, X.; Cui, K.; Wang, R.-F. Toward Efficient UAV-Based Small Object Detection: A Lightweight Network with Enhanced Feature Fusion. Remote Sens. 2025, 17, 2235. [Google Scholar] [CrossRef]
- Bi, X.; Qie, R.; Tao, C.; Zhang, Z.; Xu, Y. Unsupervised Multimodal UAV Image Registration via Style Transfer and Cascade Network. Remote Sens. 2025, 17, 2160. [Google Scholar] [CrossRef]
- Lin, T.-Y.; Maire, M.; Belongie, S.; Hays, J.; Perona, P.; Ramanan, D.; Dollár, P.; Zitnick, C.L. Microsoft COCO: Common Objects in Context. In Proceedings of the Computer Vision—ECCV 2014, Zurich, Switzerland, 6–12 September 2014; pp. 740–755. [Google Scholar]
- AlDosari, K.; Osman, A.; Elharrouss, O.; Al-Maadeed, S.; Chaari, M.Z. Drone-type-Set: Drone types detection benchmark for drone detection and tracking. In Proceedings of the 2024 International Conference on Intelligent Systems and Computer Vision (ISCV), Fez, Morocco, 8–10 May 2024; pp. 1–7. [Google Scholar]
- Jiang, N.; Wang, K.; Peng, X.; Yu, X.; Wang, Q.; Xing, J.; Li, G.; Zhao, J.; Guo, G.; Han, Z. Anti-UAV: A Large Multi-Modal Benchmark for UAV Tracking. arXiv 2021, arXiv:2101.08466. [Google Scholar]
- Svanström, F.; Alonso-Fernandez, F.; Englund, C. A dataset for multi-sensor drone detection. Data Brief 2021, 39, 107521. [Google Scholar] [CrossRef] [PubMed]
- Zeng, Z.; Wang, Z.; Qin, L.; Li, H. Drone Detection Based on Multi-scale Feature Fusion. In Proceedings of the 2021 International Conference on UK-China Emerging Technologies (UCET), Chengdu, China, 4–6 November 2021; pp. 194–198. [Google Scholar]
- Hao, Y.J.; Teck, L.K.; Xiang, C.Y.; Jeevanraj, E.; Srigrarom, S. Fast Drone Detection using SSD and YoloV3. In Proceedings of the 2021 21st International Conference on Control, Automation and Systems (ICCAS), Jeju, Republic of Korea, 12–15 October 2021; pp. 1172–1179. [Google Scholar]
- Xun, D.T.W.; Lim, Y.L.; Srigrarom, S. Drone detection using YOLOv3 with transfer learning on NVIDIA Jetson TX2. In Proceedings of the 2021 Second International Symposium on Instrumentation, Control, Artificial Intelligence, and Robotics (ICA-SYMP), Bangkok, Thailand, 20–22 January 2021; pp. 1–6. [Google Scholar]
- Zhang, Y.; Zhang, Y.; Fu, R.; Shi, Z.; Zhang, J.; Liu, D.; Du, J. Learning Nonlocal Quadrature Contrast for Detection and Recognition of Infrared Rotary-Wing UAV Targets in Complex Background. IEEE Trans. Geosci. Remote Sens. 2022, 60, 5629919. [Google Scholar] [CrossRef]
- Gao, F.; Liu, S.; Gong, C.; Zhou, X.; Wang, J.; Dong, J. Prototype-Based Information Compensation Network for Multisource Remote Sensing Data Classification. IEEE Trans. Geosci. Remote Sens. 2025, 63, 5513615. [Google Scholar] [CrossRef]
- Gao, F.; Jin, X.; Zhou, X.; Dong, J.; Du, Q. MSFMamba: Multiscale Feature Fusion State Space Model for Multisource Remote Sensing Image Classification. IEEE Trans. Geosci. Remote Sens. 2025, 63, 5504116. [Google Scholar] [CrossRef]
- Lin, J.; Gao, F.; Shi, X.; Dong, J.; Du, Q. SS-MAE: Spatial–Spectral Masked Autoencoder for Multisource Remote Sensing Image Classification. IEEE Trans. Geosci. Remote Sens. 2023, 61, 5531614. [Google Scholar] [CrossRef]
- Wang, M.; Gao, F.; Dong, J.; Li, H.-C.; Du, Q. Nearest Neighbor-Based Contrastive Learning for Hyperspectral and LiDAR Data Classification. IEEE Trans. Geosci. Remote Sens. 2023, 61, 5501816. [Google Scholar] [CrossRef]
- Li, J.; Levine, M.D.; An, X.; Xu, X.; He, H. Visual Saliency Based on Scale-Space Analysis in the Frequency Domain. IEEE Trans. Pattern Anal. Mach. Intell. 2013, 35, 996–1010. [Google Scholar] [CrossRef]
- Hou, X.; Zhang, L. Saliency Detection: A Spectral Residual Approach. In Proceedings of the 2007 IEEE Conference on Computer Vision and Pattern Recognition, Minneapolis, MN, USA, 17–22 June 2007; pp. 1–8. [Google Scholar]
- Chenlei, G.; Qi, M.; Liming, Z. Spatio-temporal Saliency detection using phase spectrum of quaternion fourier transform. In Proceedings of the 2008 IEEE Conference on Computer Vision and Pattern Recognition, Anchorage, AK, USA, 23–28 June 2008; pp. 1–8. [Google Scholar]
- Victor, T.T.; Tamar, P.; May, L.; Joseph, E.B. Morphology-based algorithm for point target detection in infrared backgrounds. In Proceedings of the SPIE Symposium on Optical Engineering and Photonics in Aerospace Sensing, Orlando, FL, USA, 11–16 April 1993; pp. 2–11. [Google Scholar]
- Lin, L.; Wang, S.; Tang, Z. Using deep learning to detect small targets in infrared oversampling images. J. Syst. Eng. Electron. 2018, 29, 947–952. [Google Scholar] [CrossRef]
- Cao, X.; Rong, C.; Bai, X. Infrared Small Target Detection Based on Derivative Dissimilarity Measure. IEEE J. Sel. Top. Appl. Earth Obs. Remote Sens. 2019, 12, 3101–3116. [Google Scholar] [CrossRef]
- Qin, Y.; Bruzzone, L.; Gao, C.; Li, B. Infrared Small Target Detection Based on Facet Kernel and Random Walker. IEEE Trans. Geosci. Remote Sens. 2019, 57, 7104–7118. [Google Scholar] [CrossRef]
- Wang, B.; Benli, E.; Motai, Y.; Dong, L.; Xu, W. Robust Detection of Infrared Maritime Targets for Autonomous Navigation. IEEE Trans. Intell. Veh. 2020, 5, 635–648. [Google Scholar] [CrossRef]
- McIntosh, B.; Venkataramanan, S.; Mahalanobis, A. Infrared Target Detection in Cluttered Environments by Maximization of a Target to Clutter Ratio (TCR) Metric Using a Convolutional Neural Network. IEEE Trans. Aerosp. Electron. Syst. 2021, 57, 485–496. [Google Scholar] [CrossRef]
- Kong, X.; Yang, C.; Cao, S.; Li, C.; Peng, Z. Infrared Small Target Detection via Nonconvex Tensor Fibered Rank Approximation. IEEE Trans. Geosci. Remote Sens. 2022, 60, 5000321. [Google Scholar] [CrossRef]
- Wang, C.Y.; Bochkovskiy, A.; Liao, H.Y.M. YOLOv7: Trainable Bag-of-Freebies Sets New State-of-the-Art for Real-Time Object Detectors. In Proceedings of the 2023 IEEE/CVF Conference on Computer Vision and Pattern Recognition (CVPR), Vancouver, BC, Canada, 17–24 June 2023; pp. 7464–7475. [Google Scholar]
- Varghese, R.; Sambath, M. YOLOv8: A Novel Object Detection Algorithm with Enhanced Performance and Robustness. In Proceedings of the 2024 International Conference on Advances in Data Engineering and Intelligent Computing Systems (ADICS), Chennai, India, 18–19 April 2024; pp. 1–6. [Google Scholar]
- Wang, A.; Chen, H.; Liu, L.; Chen, K.; Lin, Z.; Han, J.; Ding, G. YOLOv10: Real-Time End-to-End Object Detection. arXiv 2024, arXiv:2405.14458. [Google Scholar]
- Ren, S.; He, K.; Girshick, R.; Sun, J. Faster R-CNN: Towards Real-Time Object Detection with Region Proposal Networks. IEEE Trans. Pattern Anal. Mach. Intell. 2017, 39, 1137–1149. [Google Scholar] [CrossRef]
- Girshick, R.; Donahue, J.; Darrell, T.; Malik, J. Rich Feature Hierarchies for Accurate Object Detection and Semantic Segmentation. In Proceedings of the 2014 IEEE Conference on Computer Vision and Pattern Recognition, Columbus, OH, USA, 23–28 June 2014; pp. 580–587. [Google Scholar]
- Cai, Z.; Vasconcelos, N. Cascade R-CNN: Delving Into High Quality Object Detection. In Proceedings of the 2018 IEEE/CVF Conference on Computer Vision and Pattern Recognition, Salt Lake City, UT, USA, 18–23 June 2018; pp. 6154–6162. [Google Scholar]
- He, K.; Gkioxari, G.; Dollár, P.; Girshick, R. Mask R-CNN. arXiv 2017, arXiv:1703.06870. [Google Scholar]
- Ju, M.; Luo, J.; Liu, G.; Luo, H. ISTDet: An efficient end-to-end neural network for infrared small target detection. Infrared Phys. Technol. 2021, 114, 103659. [Google Scholar] [CrossRef]
- Zhao, X.; Xia, Y.; Xu, M.; Zhang, W.; Niu, J.; Zhang, Z. An infrared small vehicle target detection method based on deep learning. In Proceedings of the Third International Seminar on Artificial Intelligence, Networking, and Information Technology (AINIT 2022), Shanghai, China, 23–25 September 2022; p. 125871Y. [Google Scholar]
- Carion, N.; Massa, F.; Synnaeve, G.; Usunier, N.; Kirillov, A.; Zagoruyko, S. End-to-End Object Detection with Transformers. In Proceedings of the Computer Vision—ECCV 2020, Glasgow, UK, 23–28 August 2020; pp. 213–229. [Google Scholar]
- Yao, Z.; Ai, J.; Li, B.; Zhang, C. Efficient DETR: Improving End-to-End Object Detector with Dense Prior. arXiv 2021, arXiv:2104.01318. [Google Scholar]
- Zhu, X.; Su, W.; Lu, L.; Li, B.; Wang, X.; Dai, J. Deformable DETR: Deformable Transformers for End-to-End Object Detection. arXiv 2020, arXiv:2010.04159. [Google Scholar]
- Meng, D.; Chen, X.; Fan, Z.; Zeng, G.; Li, H.; Yuan, Y.; Sun, L.; Wang, J. Conditional DETR for Fast Training Convergence. arXiv 2021, arXiv:2108.06152. [Google Scholar]
- Liu, S.; Li, F.; Zhang, H.; Yang, X.; Qi, X.; Su, H.; Zhu, J.; Zhang, L. DAB-DETR: Dynamic Anchor Boxes are Better Queries for DETR. arXiv 2022, arXiv:2201.12329. [Google Scholar] [CrossRef]
- Zhang, H.; Li, F.; Liu, S.; Zhang, L.; Su, H.; Zhu, J.; Ni, L.M.; Shum, H.-Y. DINO: DETR with Improved DeNoising Anchor Boxes for End-to-End Object Detection. arXiv 2022, arXiv:2203.03605. [Google Scholar]
- Gao, Z.; Wang, L.; Han, B.; Guo, S. AdaMixer: A Fast-Converging Query-Based Object Detector. In Proceedings of the 2022 IEEE/CVF Conference on Computer Vision and Pattern Recognition (CVPR), New Orleans, LA, USA, 18–24 June 2022; pp. 5354–5363. [Google Scholar]
- Zheng, D.; Dong, W.; Hu, H.; Chen, X.; Wang, Y. Less is More: Focus Attention for Efficient DETR. In Proceedings of the 2023 IEEE/CVF International Conference on Computer Vision (ICCV), Paris, France, 1–6 October 2023; pp. 6651–6660. [Google Scholar]
- Roh, B.; Shin, J.; Shin, W.; Kim, S. Sparse DETR: Efficient End-to-End Object Detection with Learnable Sparsity. arXiv 2021, arXiv:2111.14330. [Google Scholar]
- Hou, X.; Liu, M.; Zhang, S.; Wei, P.; Chen, B. Salience DETR: Enhancing Detection Transformer with Hierarchical Salience Filtering Refinement. In Proceedings of the 2024 IEEE/CVF Conference on Computer Vision and Pattern Recognition (CVPR), Seattle, WA, USA, 16–22 June 2024; pp. 17574–17583. [Google Scholar]
- Li, F.; Zhang, H.; Liu, S.; Guo, J.; Ni, L.M.; Zhang, L. DN-DETR: Accelerate DETR Training by Introducing Query DeNoising. IEEE Trans. Pattern Anal. Mach. Intell. 2024, 46, 2239–2251. [Google Scholar] [CrossRef] [PubMed]
- Chen, Q.; Chen, X.; Wang, J.; Zhang, S.; Yao, K.; Feng, H.; Han, J.; Ding, E.; Zeng, G.; Wang, J. Group DETR: Fast DETR Training with Group-Wise One-to-Many Assignment. In Proceedings of the 2023 IEEE/CVF International Conference on Computer Vision (ICCV), Paris, France, 1–6 October 2023; pp. 6610–6619. [Google Scholar]
- Jia, D.; Yuan, Y.; He, H.; Wu, X.; Yu, H.; Lin, W.; Sun, L.; Zhang, C.; Hu, H. DETRs with Hybrid Matching. In Proceedings of the 2023 IEEE/CVF Conference on Computer Vision and Pattern Recognition (CVPR), Vancouver, BC, Canada, 17–24 June 2023; pp. 19702–19712. [Google Scholar]
- Ouyang-Zhang, J.; Cho, J.H.; Zhou, X.; Krähenbühl, P. NMS Strikes Back. arXiv 2022, arXiv:2212.06137. [Google Scholar] [CrossRef]
- Zong, Z.; Song, G.; Liu, Y. DETRs with Collaborative Hybrid Assignments Training. In Proceedings of the 2023 IEEE/CVF International Conference on Computer Vision (ICCV), Paris, France, 1–6 October 2023; pp. 6725–6735. [Google Scholar]
- Xu, F.; Chen, C.; Shang, Z.; Ma, K.K.; Wu, Q.; Lin, Z.; Zhan, J.; Shi, Y. Deep Multi-Modal Ship Detection and Classification Network. IEEE Trans. Circuits Syst. Video Technol. 2025, 35, 4256–4270. [Google Scholar] [CrossRef]
- Dai, L.; Liu, H.; Tang, H.; Wu, Z.; Song, P. AO2-DETR: Arbitrary-Oriented Object Detection Transformer. IEEE Trans. Circuits Syst. Video Technol. 2023, 33, 2342–2356. [Google Scholar] [CrossRef]
- He, K.; Zhang, X.; Ren, S.; Sun, J. Deep Residual Learning for Image Recognition. In Proceedings of the 2016 IEEE Conference on Computer Vision and Pattern Recognition (CVPR), Las Vegas, NV, USA, 27–30 June 2016; pp. 770–778. [Google Scholar]
- Tartakovsky, A.G.; Kligys, S.; Petrov, A. Adaptive sequential algorithms for detecting targets in a heavy IR clutter. In Signal and Data Processing of Small Targets 1999, Proceedings of the SPIE’s International Symposium on Optical Science, Engineering, and Instrumentation, Denver, CO, USA, 18–23 July 1999; SPIE: Bellingham, WA USA, 1999; Volume 3809, pp. 231–242. [Google Scholar]
- Tartakovsky, A.G.; Blazek, R.B. Effective adaptive spatial-temporal technique for clutter rejection in IRST. In Signal and Data Processing of Small Targets 2000, Proceedings of the AeroSense 2000, Orlando, FL, USA, 24–28 April 2000; SPIE: Bellingham, WA, USA, 2000; Volume 4048, pp. 566–576. [Google Scholar]
- Kingma, D.; Ba, J. Adam: A Method for Stochastic Optimization. In Proceedings of the International Conference on Learning Representations, San Diego, CA, USA, 7–9 May 2015. [Google Scholar]
- Lin, T.Y.; Goyal, P.; Girshick, R.; He, K.; Dollár, P. Focal Loss for Dense Object Detection. IEEE Trans. Pattern Anal. Mach. Intell. 2020, 42, 318–327. [Google Scholar] [CrossRef] [PubMed]
- Jocher, G.; Stoken, A.; Chaurasia, A.; Borovec, J.; Kwon, Y.; Michael, K.; Liu, C.; Fang, J. Ultralytics/YOLOv5: V6.0—YOLOv5n ‘Nano’ Models, Roboflow Integration, TensorFlow Export, OpenCV DNN Support. 2021. Available online: https://zenodo.org/record/5563715 (accessed on 15 December 2023).
- Li, C.; Li, L.; Jiang, H.; Weng, K.; Geng, Y.; Li, L.; Ke, Z.; Li, Q.; Cheng, M.; Nie, W.; et al. YOLOv6: A Single-Stage Object Detection Framework for Industrial Applications. arXiv 2022, arXiv:2209.02976. [Google Scholar] [CrossRef]
- Wang, Y.; Zhang, X.; Yang, T.; Sun, J. Anchor DETR: Query Design for Transformer-Based Detector. In Proceedings of the AAAI Conference on Artificial Intelligence, Virtual, 22 February–1 March 2022; Volume 36, pp. 2567–2575. [Google Scholar]
- Fang, Y.; Wang, W.; Xie, B.; Sun, Q.; Wu, L.; Wang, X.; Huang, T.; Wang, X.; Cao, Y. EVA: Exploring the Limits of Masked Visual Representation Learning at Scale. In Proceedings of the 2023 IEEE/CVF Conference on Computer Vision and Pattern Recognition, Vancouver, BC, Canada, 17–24 June 2023; pp. 19358–19369. [Google Scholar]
Disclaimer/Publisher’s Note: The statements, opinions and data contained in all publications are solely those of the individual author(s) and contributor(s) and not of MDPI and/or the editor(s). MDPI and/or the editor(s) disclaim responsibility for any injury to people or property resulting from any ideas, methods, instructions or products referred to in the content. |
© 2025 by the authors. Licensee MDPI, Basel, Switzerland. This article is an open access article distributed under the terms and conditions of the Creative Commons Attribution (CC BY) license (https://creativecommons.org/licenses/by/4.0/).