Article

UAV-PPK Photogrammetry, GIS, and Soil Analysis to Estimate Long-Term Slip Rates on Active Faults in a Seismic Gap of Northern Calabria (Southern Italy)

by
Daniele Cirillo
1,2,3,†,
Anna Chiara Tangari
2,*,†,
Fabio Scarciglia
4,
Giusy Lavecchia
2,3 and
Francesco Brozzetti
1,2,3
1
Laboratory of Structural Geology, 3D Digital Cartography and Geomatics, University of Chieti-Pescara, 66100 Chieti, Italy
2
Science Department, University G. d’Annunzio Chieti-Pescara, 66100 Chieti, Italy
3
CRUST—Interuniversity Center for 3D Seismotectonics with Territorial Applications, 66100 Chieti, Italy
4
Biology, Ecology and Earth Sciences Department (DiBEST), University of Calabria, 87036 Arcavacata di Rende, Italy
*
Author to whom correspondence should be addressed.
These authors contributed equally to this work.
Remote Sens. 2025, 17(19), 3366; https://doi.org/10.3390/rs17193366
Submission received: 15 July 2025 / Revised: 24 September 2025 / Accepted: 1 October 2025 / Published: 5 October 2025

Abstract

Highlights

What are the main findings?
  • High-resolution UAV-PPK photogrammetry, DEM analysis, and soil profile char-acterization enabled precise mapping of fault scarps and related geomorphic features.
  • The study provides a comprehensive evaluation of fault activity and the relative chronology of fault movements.
What is the implication of the main finding?
  • The results contribute to a better understanding of fault kinematics and regional tectonic evolution.
  • The integrated approach offers a reproducible framework for slip-rate estimation and seismic hazard assessment in similar tectonic settings.

Abstract

The study of faults in seismic gap areas is essential for assessing the potential for future seismic activity and developing strategies to mitigate its impact. In this research, we employed a combination of geomorphological analysis, aerophotogrammetry, high-resolution topography, and soil analysis to estimate the age of tectonically exposed fault surfaces in a seismic gap area. Our focus was on the Piano delle Rose Fault in the northern Calabria region, (southern Italy), which is a significant regional tectonic structure associated with seismic hazards. We conducted a field survey to carry out structural and pedological observations and collect soil samples from the fault surface. These samples were analyzed to estimate the fault’s age based on their features and degree of pedogenic development. Additionally, we used high-resolution topography and aerophotogrammetry to create a detailed 3D model of the fault surface, allowing us to identify features such as fault scarps and offsets. Our results indicate recent activity on the fault surface, suggesting that the Piano delle Rose Fault may pose a significant seismic hazard. Soil analysis suggests that the onset of the fault surface is relatively young, estimated in an interval time from 450,000 to ~ 300,000 years old. Considering these age constraints, the long-term slip rates are estimated to range between ~0.12 mm/yr and ~0.33 mm/yr, which are values comparable with those of many other well-known active faults of the Apennines extensional belt. Analyses of key fault exposures document cumulative displacements up to 21 m. These values yield long-term slip rates ranging from ~0.2 mm/yr (100,000 years) to ~1.0 mm/yr (~20,000 years LGM), indicating persistent Late Quaternary activity. A second exposure records ~0.6 m of displacement in very young soils, confirming surface faulting during recent times and suggesting that the fault is potentially capable of generating ground-rupturing earthquakes. High-resolution topography and aerophotogrammetry analyses show evidence of ongoing tectonic deformation, indicating that the area is susceptible to future seismic activity and corresponding risk. Our study highlights the importance of integrating multiple techniques for examining fault surfaces in seismic gap areas. By combining geomorphological analysis, aerophotogrammetry, high-resolution topography, and soil analysis, we gain a comprehensive understanding of the structure and behavior of faults. This approach can help assess the potential for future seismic activity and develop strategies for mitigating its impact.

1. Introduction

The Calabria region is characterized by high seismic risk due to the active tectonics associated with the convergence of the African and Eurasian plates [1,2,3]. This tectonic setting results in significant and ongoing crustal deformation, as evidenced by several active fault systems that cross the region (Figure 1a,b) [4,5,6,7,8,9,10,11]. A crucial aspect of seismic hazard assessment in Calabria involves a detailed mapping and analysis of Quaternary active faults [5,12,13,14,15,16,17]. Understanding the behavior and recent activity of these tectonic structures is essential for evaluating the frequency and magnitude of potential seismic events [18,19,20,21,22]. In this regard, exposed fault surfaces offer valuable insights into the tectonic evolution and seismic potential of the area.
This study applies geomorphological mapping, UAV-based photogrammetry, high-resolution topography, and pedological analysis to estimate the age and assess the activity of fault scarps located within a recognized seismic gap in northern Calabria (Figure 1c). Seismic gap areas are regions that have not experienced significant earthquakes in recent history [23,24], but geological and geophysical data indicate the possibility of future seismic activity [13,25,26,27]. Northern Calabria, serves as an intriguing case study for seismologists [28,29,30,31,32,33] and geologists [4,10], as it contains an important seismic gap (Figure 1c), and is known for its tectonic complexity and elevated seismic hazard [4,10,34]. The identified seismic gap (Figure 1c) stretches approximately 25 km in a north–south direction, with no earthquakes of Mw 5.0 recorded by instrumental networks or documented in historical sources such as the CPTI15 v4.0 catalogue by INGV (https://emidius.mi.ingv.it/CPTI15-DBMI15/ accessed on 22 February 2025). This catalogue provides comprehensive parametric data, both macroseismic and instrumental, for earthquakes with a maximum intensity ≥ V or a magnitude ≥ 4.0, covering the period from 1000 to 2020 [35,36]. Since this catalogue covers only the last millennium, historical data are likely incomplete, particularly for events in sparsely populated areas.
Despite the lack of large historical events in the gap, the region is one of the most seismically active areas of the Italian peninsula. Instrumental records include the Mw 5.6 Mercure earthquake of 9 September 1998 [37] and the Mw 5.2 Mormanno earthquake of 26 October 2012 [13,28,29,38]. Historical sources report significant earthquakes near the study area: Tertulliani and Cucci [39] and Guidoboni Et Al. [40] attributed the 1693 earthquake to the Castrovillari area, estimating magnitudes of Mw 5.3 and Mw 5.6, respectively. Further south, in the Crati Valley, stronger earthquakes are documented in the CPTI15 v4.0 catalogue [35,36], including events on 24 May 1184 (Mw 6.7), 12 February 1854 (Mw 6.2), 4 October 1870 (Mw 6.1), and the devastating 27 March 1638 earthquake (Mw ≥ 7.0) [40]. These records underscore the seismic potential of the broader region.
Within this framework, the Piano delle Rose Fault emerges as a potentially significant but poorly documented structure. Its lack of associated historical or instrumental seismicity suggests that it has not ruptured recently, even though it may have been active during the late Quaternary. This highlights the need for further investigation, as such faults could still pose a seismic risk. The fault extends for approximately 16 km, with the largest observed displacements in its northern sector, making it a candidate for focused paleoseismological studies. This work aims to investigate the age of fault-scarp exposure and the tectonic significance of the Firmo area through an integrated geomorphological, photogrammetric, topographic, geomatic, and pedological approach. Although UAV photogrammetry, DEM analysis, and soil-profile comparison are established techniques, their combined application in this seismic gap, together with a novel qualitative dating methodology, enables precise fault mapping and slip-rate estimation. This provides new insights into fault kinematics and the relative timing of movements in an area lacking detailed seismological and geomorphic data.
Figure 1. Location map of the Calabria region within the Italian peninsula. (a) Tectonic framework of Italy showing extensional domains (highlighted in yellow, red and blue lines indicating west and east dipping normal faults, respectively) and compressional domains (indicated by grey-rimmed purple lines) from Lavecchia Et Al. [41]. (b) Map of Calabria displaying main faults and the extensional tectonic domain. (c) Historical seismicity with epicenters classified by magnitude: orange circles for earthquakes between Mw 5.0 and 6.0, red circles for those between Mw 6.0 and 7.0, and black circles for major events exceeding Mw 7.0. The orange-shaded area represents a seismic gap, where no major earthquakes have been recorded over the past millennium.
Remotesensing 17 03366 g001

2. Geological Framework

2.1. Regional Tectonic Setting
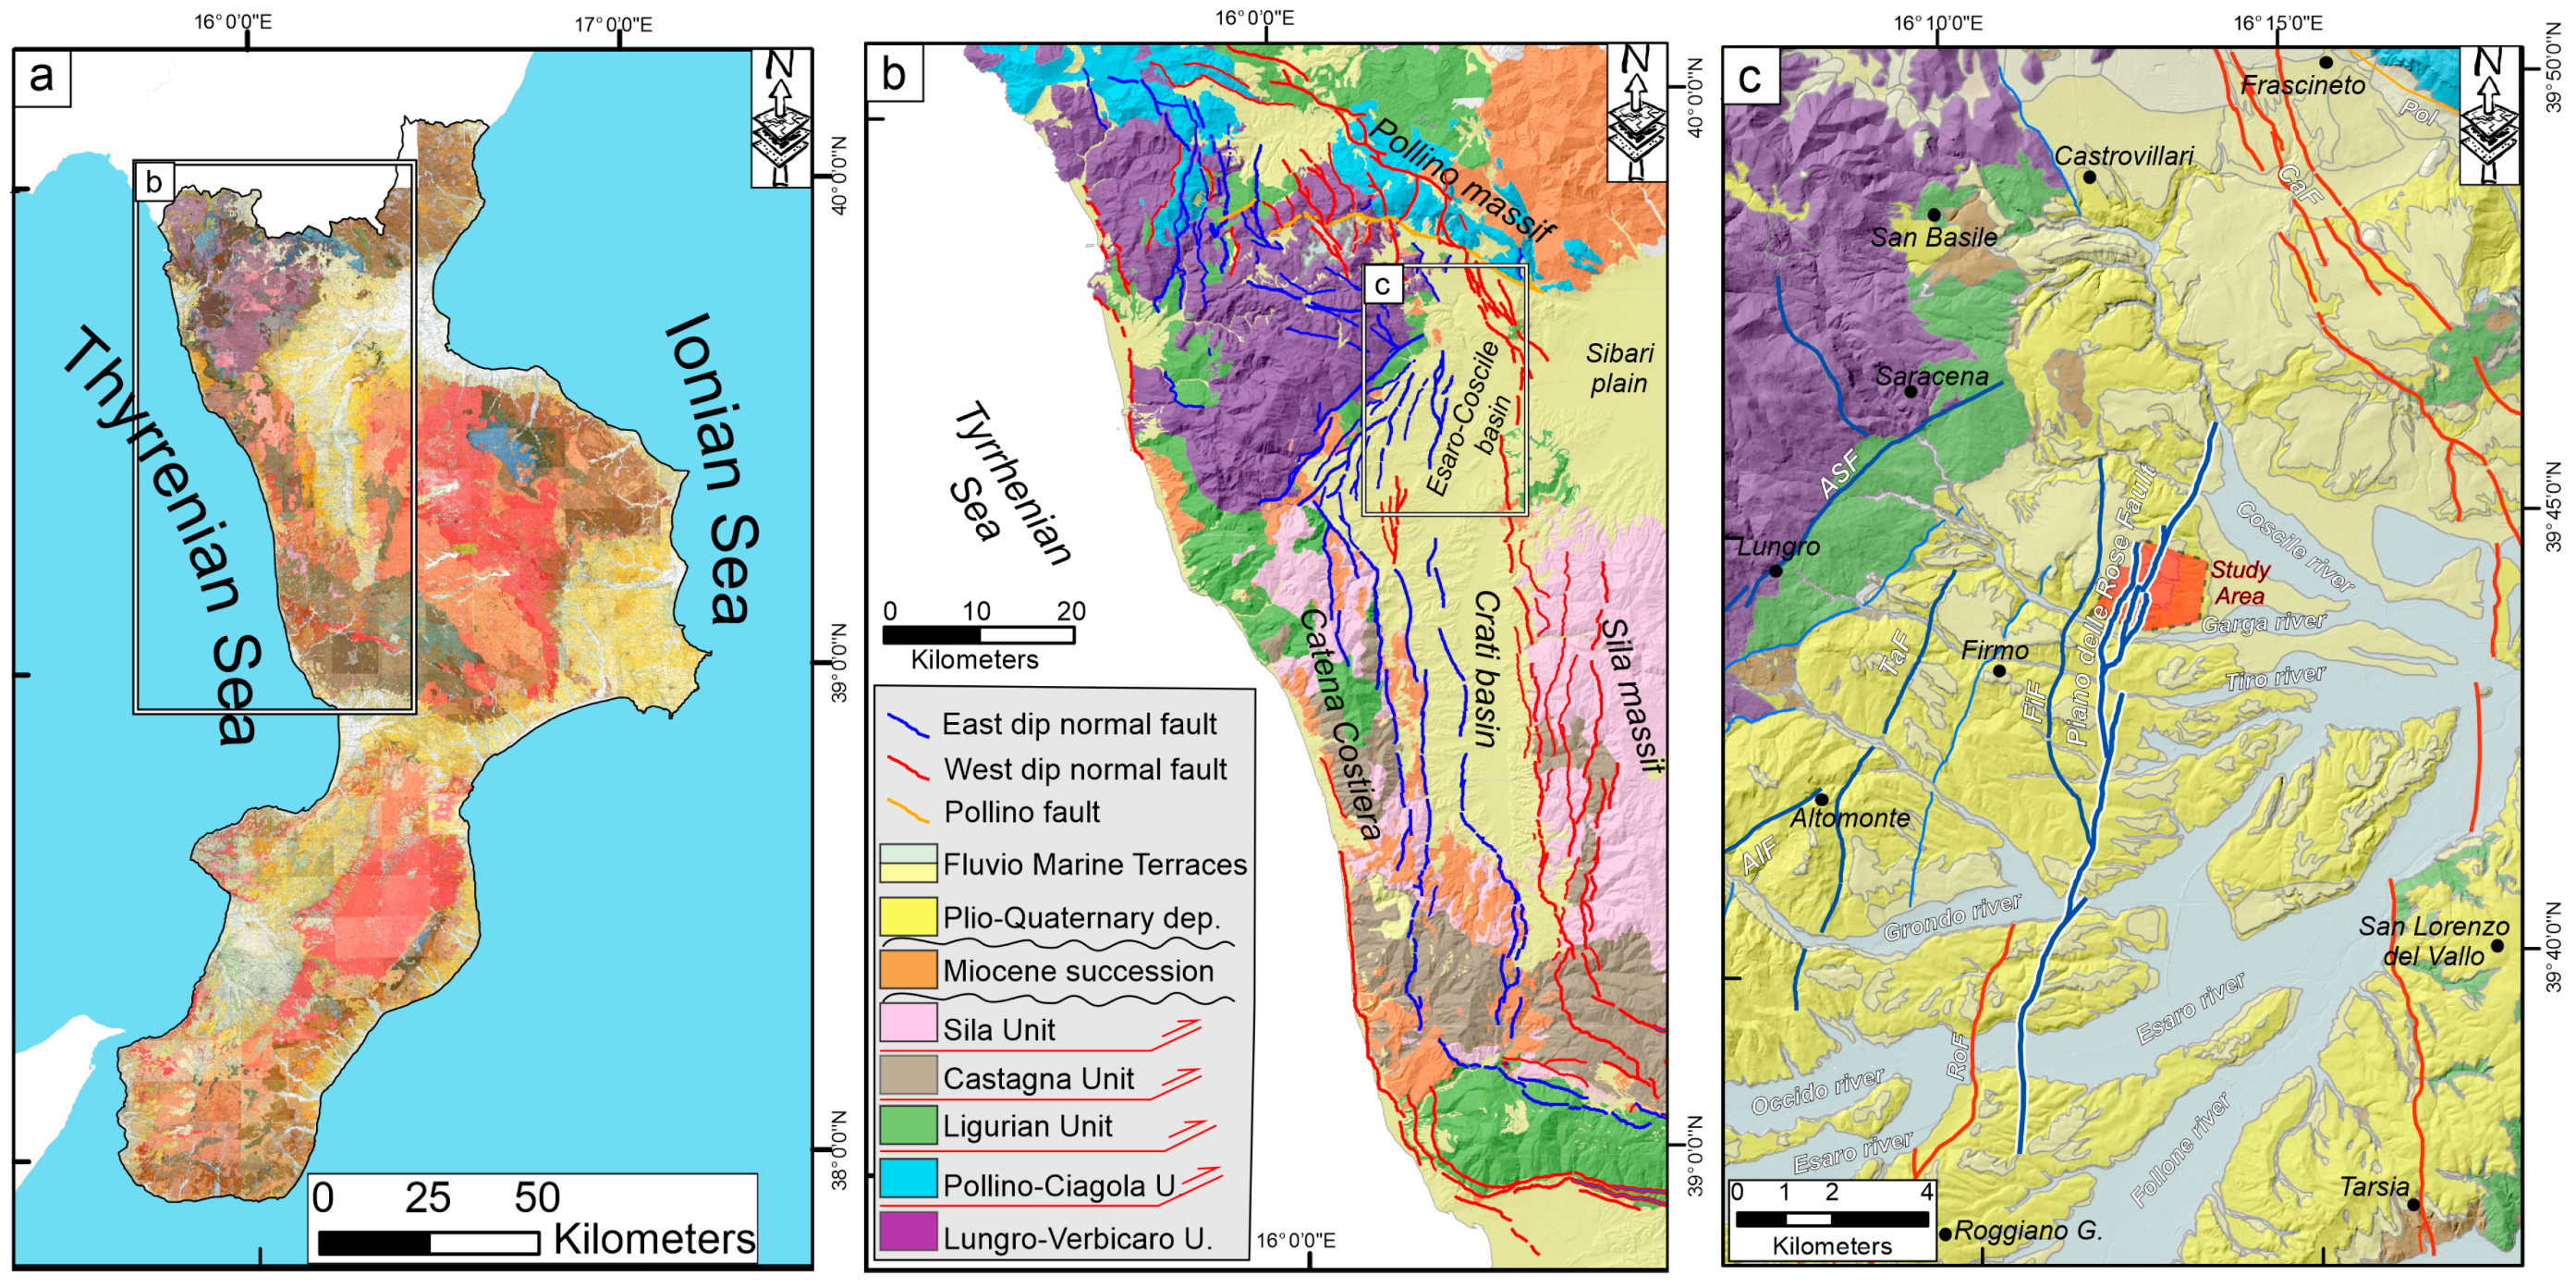
The study area is located in the northwestern sector of the Calabrian Arc, between the towns of Firmo, Saracena, and Castrovillari (Figure 2). Structural and geomorphic evidence in this region suggests Quaternary fault activity.
The Calabria region represents an Alpine chain fragment drifted apart from the Corsica-Sardinia block during the opening of the Tyrrhenian Sea, a process that resulted from Ionian subduction and its retreat toward the SE [2,42,43]. This subduction-related complex consists of HP-LT continental and oceanic-derived units that are tectonically overlaid by Variscan crystalline rocks, forming the uppermost nappe in the contractional stack [44,45,46,47]. Since the Early Miocene, the crystalline units have overthrust the carbonate shelf units, known as the Apennine platform (external domain units). These platform units are considered the most internal thrust sheets of the chain and are derived from the continental Adriatic and Ionian margins [48,49,50,51,52].
The Calabrian Arc registered the onset of narrow basins, where a clastic marine succession has been deposited, showing an eastward-younging trend since the Middle Miocene. However, there is currently no consensus on the tectonic context in which these successions were sedimented. Different interpretations propose a regional wrenching regime, Tyrrhenian back-arc extension, or a mixed model. Evidence supporting the persistence of an active extensional stress field includes borehole breakouts and focal mechanisms [53]. The resulting least horizontal stress is nearly orthogonal to the chain axis-oriented ENE-WSW to nearly EW-oriented in northern Calabria. This area also highlights active, nearly NE-SW-directed, extension which is corroborated by recent GPS data from both permanent and temporary stations, as well as new field observations in the neighboring Pollino region [4,54,55]. In recent decades, northern Calabria has been the focus of numerous geological and structural studies. This portion of the Calabrian Arc is particularly important, as it represents one of the areas with the highest seismic hazard and risk in the Italian peninsula. Several extensional faults have been mapped in the northernmost sector, corresponding to the Pollino Massif area (e.g., [4,10,13,16,17,34,56,57,58]. In the study area, significant contributions include works from the CARG Cassano allo Ionio 543 sheet CARG Project [59] and the Calabria 1:25,000 Geological Map of Cassa per il Mezzogiorno [60], together with relevant studies by Tortorici Et Al. [6], Cifelli Et Al. [61], Brozzetti Et Al. [5]. In the southern Crati Basin, important studies include Brozzetti Et Al. [5,62] Spina Et Al. [10], Lanzafame Et Al. [63], Tansi Et Al. [9].
Figure 2. (a) Geological map of Calabria at a scale of 1:25,000 from the Cassa per il Mezzogiorno project [60]. (b) Tectono-stratigraphic units and Quaternary faults of northern Calabria, modified after Lavecchia Et Al. [12]. (c) Fault traces of the Piano delle Rose Fault; the area investigated using UAV-PPK photogrammetry is highlighted in red.
Remotesensing 17 03366 g002
The extensional faults in this region remain debated with respect to their timing and activity. Absolute dating is frequently unavailable, and only a few studies provide constraints on fault ages and activity interval, improving understanding of their geological and seismic significance. Paleoseismological trenching represents a particularly important tool in this context, as it can provide high-resolution chronological constraints and more detailed dating of past faulting events (e.g., [20,64,65]) techniques also useful to assess time-span of the next earthquakes [22,66]. Also studies based on rare earth element analyses and high-resolution topography along fault scarps open new research perspective to investigate past earthquakes, but they have not been widely applied in the Calabrian area (e.g., [18]).

2.2. Sedimentary Stratigraphy of the Crati Graben

The Crati Basin represents a ~60 km-long graben, bounded to the west by the Catena Costiera ridge, to the east by the Sila Massif and to the north by Pollino massif (Figure 2b). These structural highs consist of a crystalline basement complex and by tectonic slices made of the Apennine platform sequence. Along the basin margins, post-orogenic Upper Miocene to Lower Pliocene marine clastic deposits rest unconformably on the basement units.
The Crati Graben trends predominantly N–S progressively rotate to a NE–SW orientation toward north, connecting with the Castrovillari Basin. This change in orientation mirrors the progressive variation in the strike of the bounding normal faults from south to north. Therefore, this basin can be subdivided into the N–S trending Crati sub-basin and the NNE–SSW Esaro-Coscile sub-basin.
The post-orogenic sedimentary fill of the entire graben has been extensively investigated from a stratigraphic and sedimentological perspective (e.g., [10,67,68,69,70]).
Brozzetti Et Al. [5] suggested, based on subsurface seismic-reflection data, that the graben fill can be broadly subdivided into two main packages. The lower package consists of Upper Miocene–Pliocene marine conglomerates, sandstones, and clays, interpreted as the products of the early stages of Tyrrhenian rifting, predating the development of the Crati Graben [61]. The upper package, which constitutes the main infill of the Graben, includes two transgressive depositional cycles of Early Pleistocene age, with an overall thickness of up to 1.5 km. These cycles are characterized at the base by fanglomerates and sands, followed upward by thick marine clay deposits [6,67,69,70]. The youngest deposits consist of Middle–Late Pleistocene terraced sands (5–20 m thick), conglomerates, and Holocene alluvial sediments that form the modern floodplain. From the Middle Pleistocene onward, regional uplift led to the deformation of these deposits.
The long-term uplift of northern Calabria is also recorded by a staircase of marine terraces cut into the Pleistocene deposits both north of the study area and along the Ionian coastal sector, providing important constraints on regional tectonic activity and landscape evolution.

2.3. Stratigraphy of the Study Area

The Crati and Esaro basins contain a sedimentary succession transitioning from marine to continental environments, characterized by the deposition of Gilbert-type fan deltas [70,71,72]. In this system, the bottomset consists of clay and silt, with rare sandy bodies. The foreset is dominated by sand(stone) intercalated with clay, while the topset consists of sand(stone) and conglomerates (Figure 3a–d). These deposits exhibit the typical architecture of a Gilbert delta. In para-concordance, on the higher exposed portions of the basin deposits, red and reddish-brown paleosols to brown soils mantle the present sub-planar topographic surfaces. These soils indicate prolonged periods of exposure and weathering, reflecting the stabilization of the landscape during specific intervals in the basin’s infilling history.

3. Materials and Methods

The investigation in the study area employed a multidisciplinary approach, combining geomorphological analysis, UAV-based aerophotogrammetry, high-resolution topographic data, and soil studies to assess both the surface expression and the potential recent activity of the fault. A detailed geological field survey was conducted alongside the entire fault trace, with particular focus on the northern segment, where the most prominent fault scarps are exposed. In addition to structural observations, benchmark soil profiles were chosen in selected locations, from which soil samples were collected to characterize their pedogenic evolution through integrated chemical, physical and micromorphological analyses and estimate their ages.

3.1. PPK UAV Photogrammetry

Aerophotogrammetric surveys employ aerial imagery and photogrammetric techniques to create precise maps, models, and measurements of the Earth’s surface. This method is widely applied across various fields, including cartography, geology, geography, forestry, urban planning, and civil engineering. It is especially useful for surveying large or inaccessible areas where traditional ground-based techniques are challenging or unfeasible. Aerophotogrammetry provides high-resolution images and data that can be used to generate detailed topographic maps, digital elevation models (DEMs), and 3D models of terrain features.
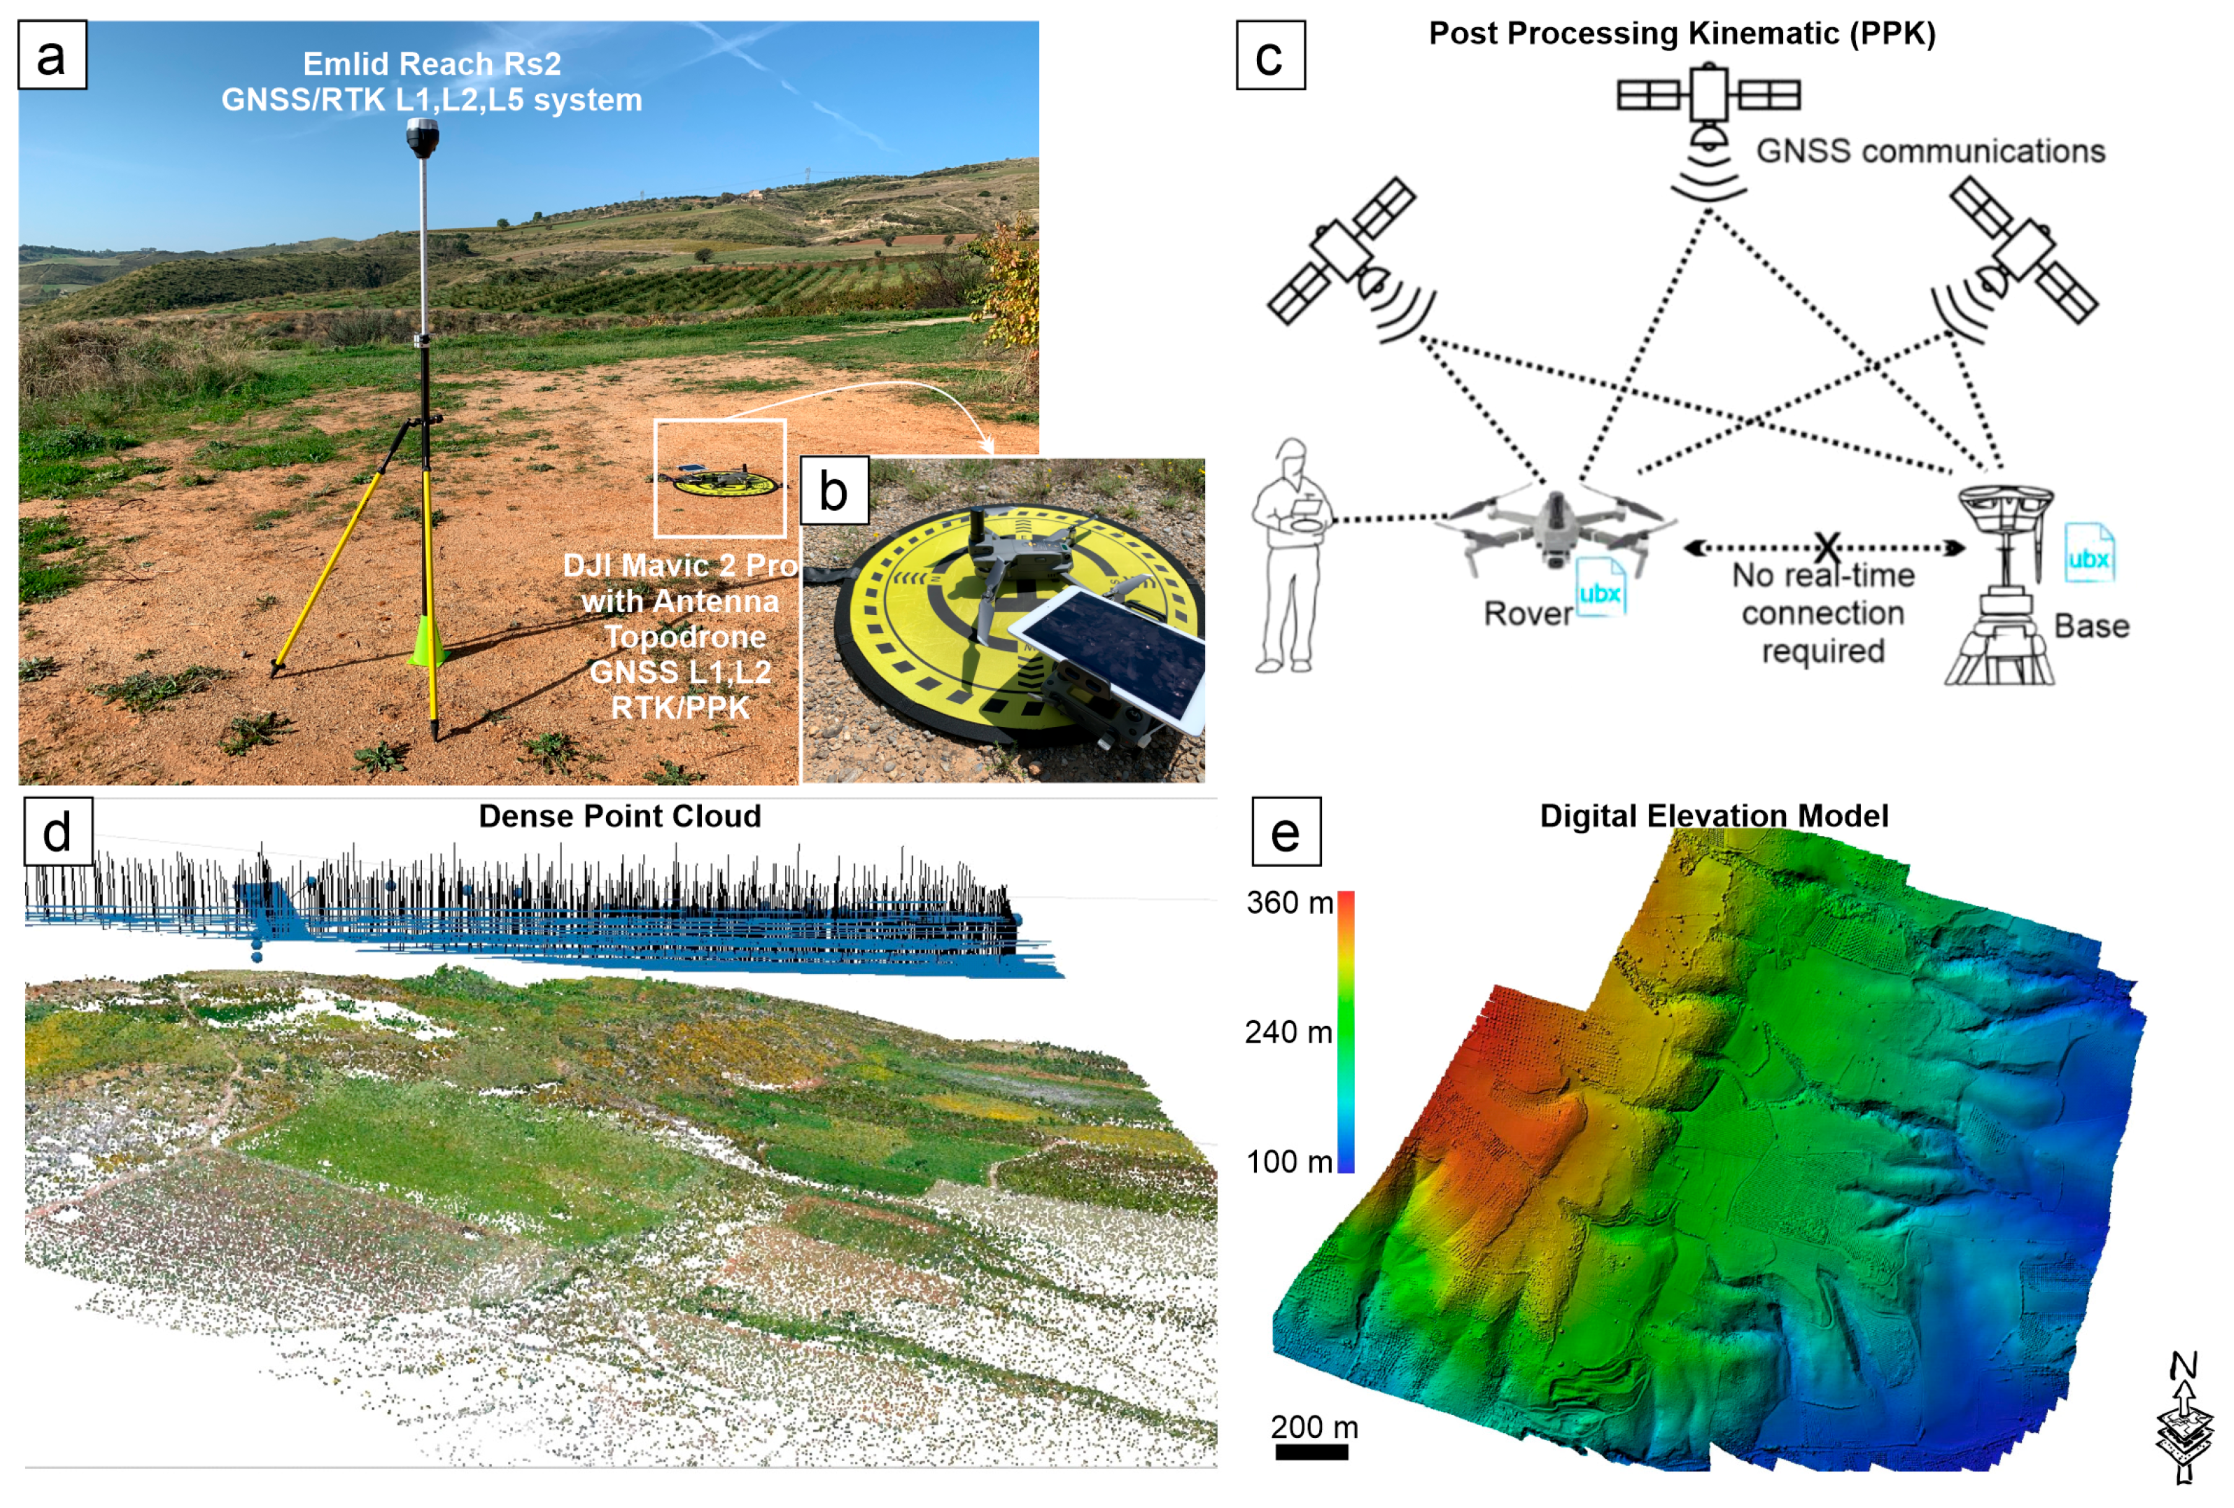
An alternative to traditional photogrammetric surveys is the PPK (Post-Processed Kinematic) technique, which can reduce or even eliminate the need for ground control points (GCPs) by georeferencing images with high positional accuracy [73,74]. However, the achievable accuracy strongly depends on GNSS conditions, including the number of satellite visibility, baseline length, and correction quality. For this survey, an Emlid Reach RS2 GNSS/RTK L1, L2, L5 system was used as the base station within the surveyed area (Figure 4a). The Emlid Reach RS2 receiver simultaneously acquired data from 20 to 26 satellites and received corrections transmitted from a baseline located approximately 6 km from the survey area, receiving data at intervals of 0.5–0.8 s, enabling precise triangulation and minimizing positioning errors. The rover antenna (L1/L2 RTK/PPK) was mounted on a DJI Mavic 2 Pro drone (DJI, Shenzhen, China) (Figure 4b). During each flight, the drone recorded raw GNSS logs and RINEX files, which were subsequently post-processed under favorable satellite geometry and low baseline error conditions to achieve centimeter-level positional accuracy. Flight missions were pre-programmed using the Pix4D app (Pix4D S.A., Prilly, Switzerland) on an Apple iPad Air 2 (Apple Inc., Cupertino, CA, USA) (Figure 4b), organizing the surveys into multiple automated flight paths at a constant altitude of 120 m above ground level.
During the automated image acquisition, the camera was oriented perpendicularly to the flight direction, with an azimuthal alignment and an incidence angle of 90° to the ground (Figure 4d). This setup captured a series of 2252 images, with a front-lap and side-lap overlap of 60%, ensuring comprehensive coverage and optimal image quality for subsequent analysis. To ensure precise georeferencing of the acquired images, we employed the Post-Processing Kinematic (PPK) method (Figure 4c) using the Topodrone PPK Post-Processing software (version 1.0.10.0, available at https://topodrone.com/ accessed on 22 February 2025). The PPK processing yielded mean error values of 0.026 m for longitude, 0.019 m for latitude, and 0.070 m for altitude. In the field, additional measurements using Ground Control Points (GCPs) and Check Points confirmed a horizontal error between 2 and 3 cm. During data acquisition, the Emlid Reach RS2 GNSS receiver was connected to a local baseline transmitting real-time corrections every 0.5 s. The triangulation with approximately 25 satellites, combined with the post-processing of Rinex raw data files, allowed us to achieve final PPK accuracies well below 3 cm.

3.2. High-Resolution Topography

We used Agisoft Metashape Professional v. 1.8.5 (http://www.agisoft.com, accessed on 22 February 2025), a software program for photogrammetric processing of digital images to obtain high-resolution topography images and DEMs (Figure 4e). It allows users to create 3D models, orthomosaics, and terrain models from 2D photographs taken from different angles.
Agisoft Metashape Pro uses algorithms to analyze the patterns in the photographs and then combines them to create a 3D model.
The software is commonly used in archaeology, architecture, surveying, and geology, among others, to create accurate and detailed models from photographs taken using a drone, camera, or other image-capturing devices.
A high-resolution digital elevation model (DEM) was reconstructed using 2252 aligned images. The DEM has a ground resolution of 3.63 cm/pix and a point density of 758 points/m2. Camera positions were estimated with associated errors (X = 2.61 cm, Y = 1.96 cm, Z = 7.01 cm). The initial point cloud consisted of 1,381,205 points, with an RMS reprojection error of 0.72 (4.31 pix), while the final dense point cloud contains 3,904,934,727 points with RGB color information. Depth maps were generated at ultra-high quality, and the reconstruction was performed in the WGS 84 coordinate system.

3.3. Field Survey

A digital field survey [75] was conducted to collect structural data on the exposed fault plane and soil samples from both the hanging wall and footwall of the fault. Fault planes were mapped using traditional surveying techniques in combination with the digital mapping application “Fieldmove” (https://www.petex.com/pe-geology/move-suite/digital-field-mapping/ accessed on 22 February 2025). The app, installed on iOS devices, utilized GPS/GLONASS/GNSS systems to measure azimuth and dip angles accurately. A total of nine measurement stations were established along the main exposed fault planes, and for each station, a stereonet was created using the “Stereonet” software v.11.1.3 (https://www.rickallmendinger.net/stereonet accessed on 22 February 2025) by R.W. Allmendinger and R. Cardoso [76,77]. This approach enhanced our understanding of the overall kinematics of the examined area. The collected data was organized into a GIS-managed dataset for further analysis. High-resolution images were used as base maps within Fieldmove to improve accuracy and precision of the survey. The integration of traditional survey methods with digital mapping tools enabled high-resolution fault plane mapping and provided precise and reliable measurements. Additionally, the stereonets generated with specialized software offered deeper insights into the geometry and kinematics of the fault system.

3.4. GIS Geomorphological Analysis

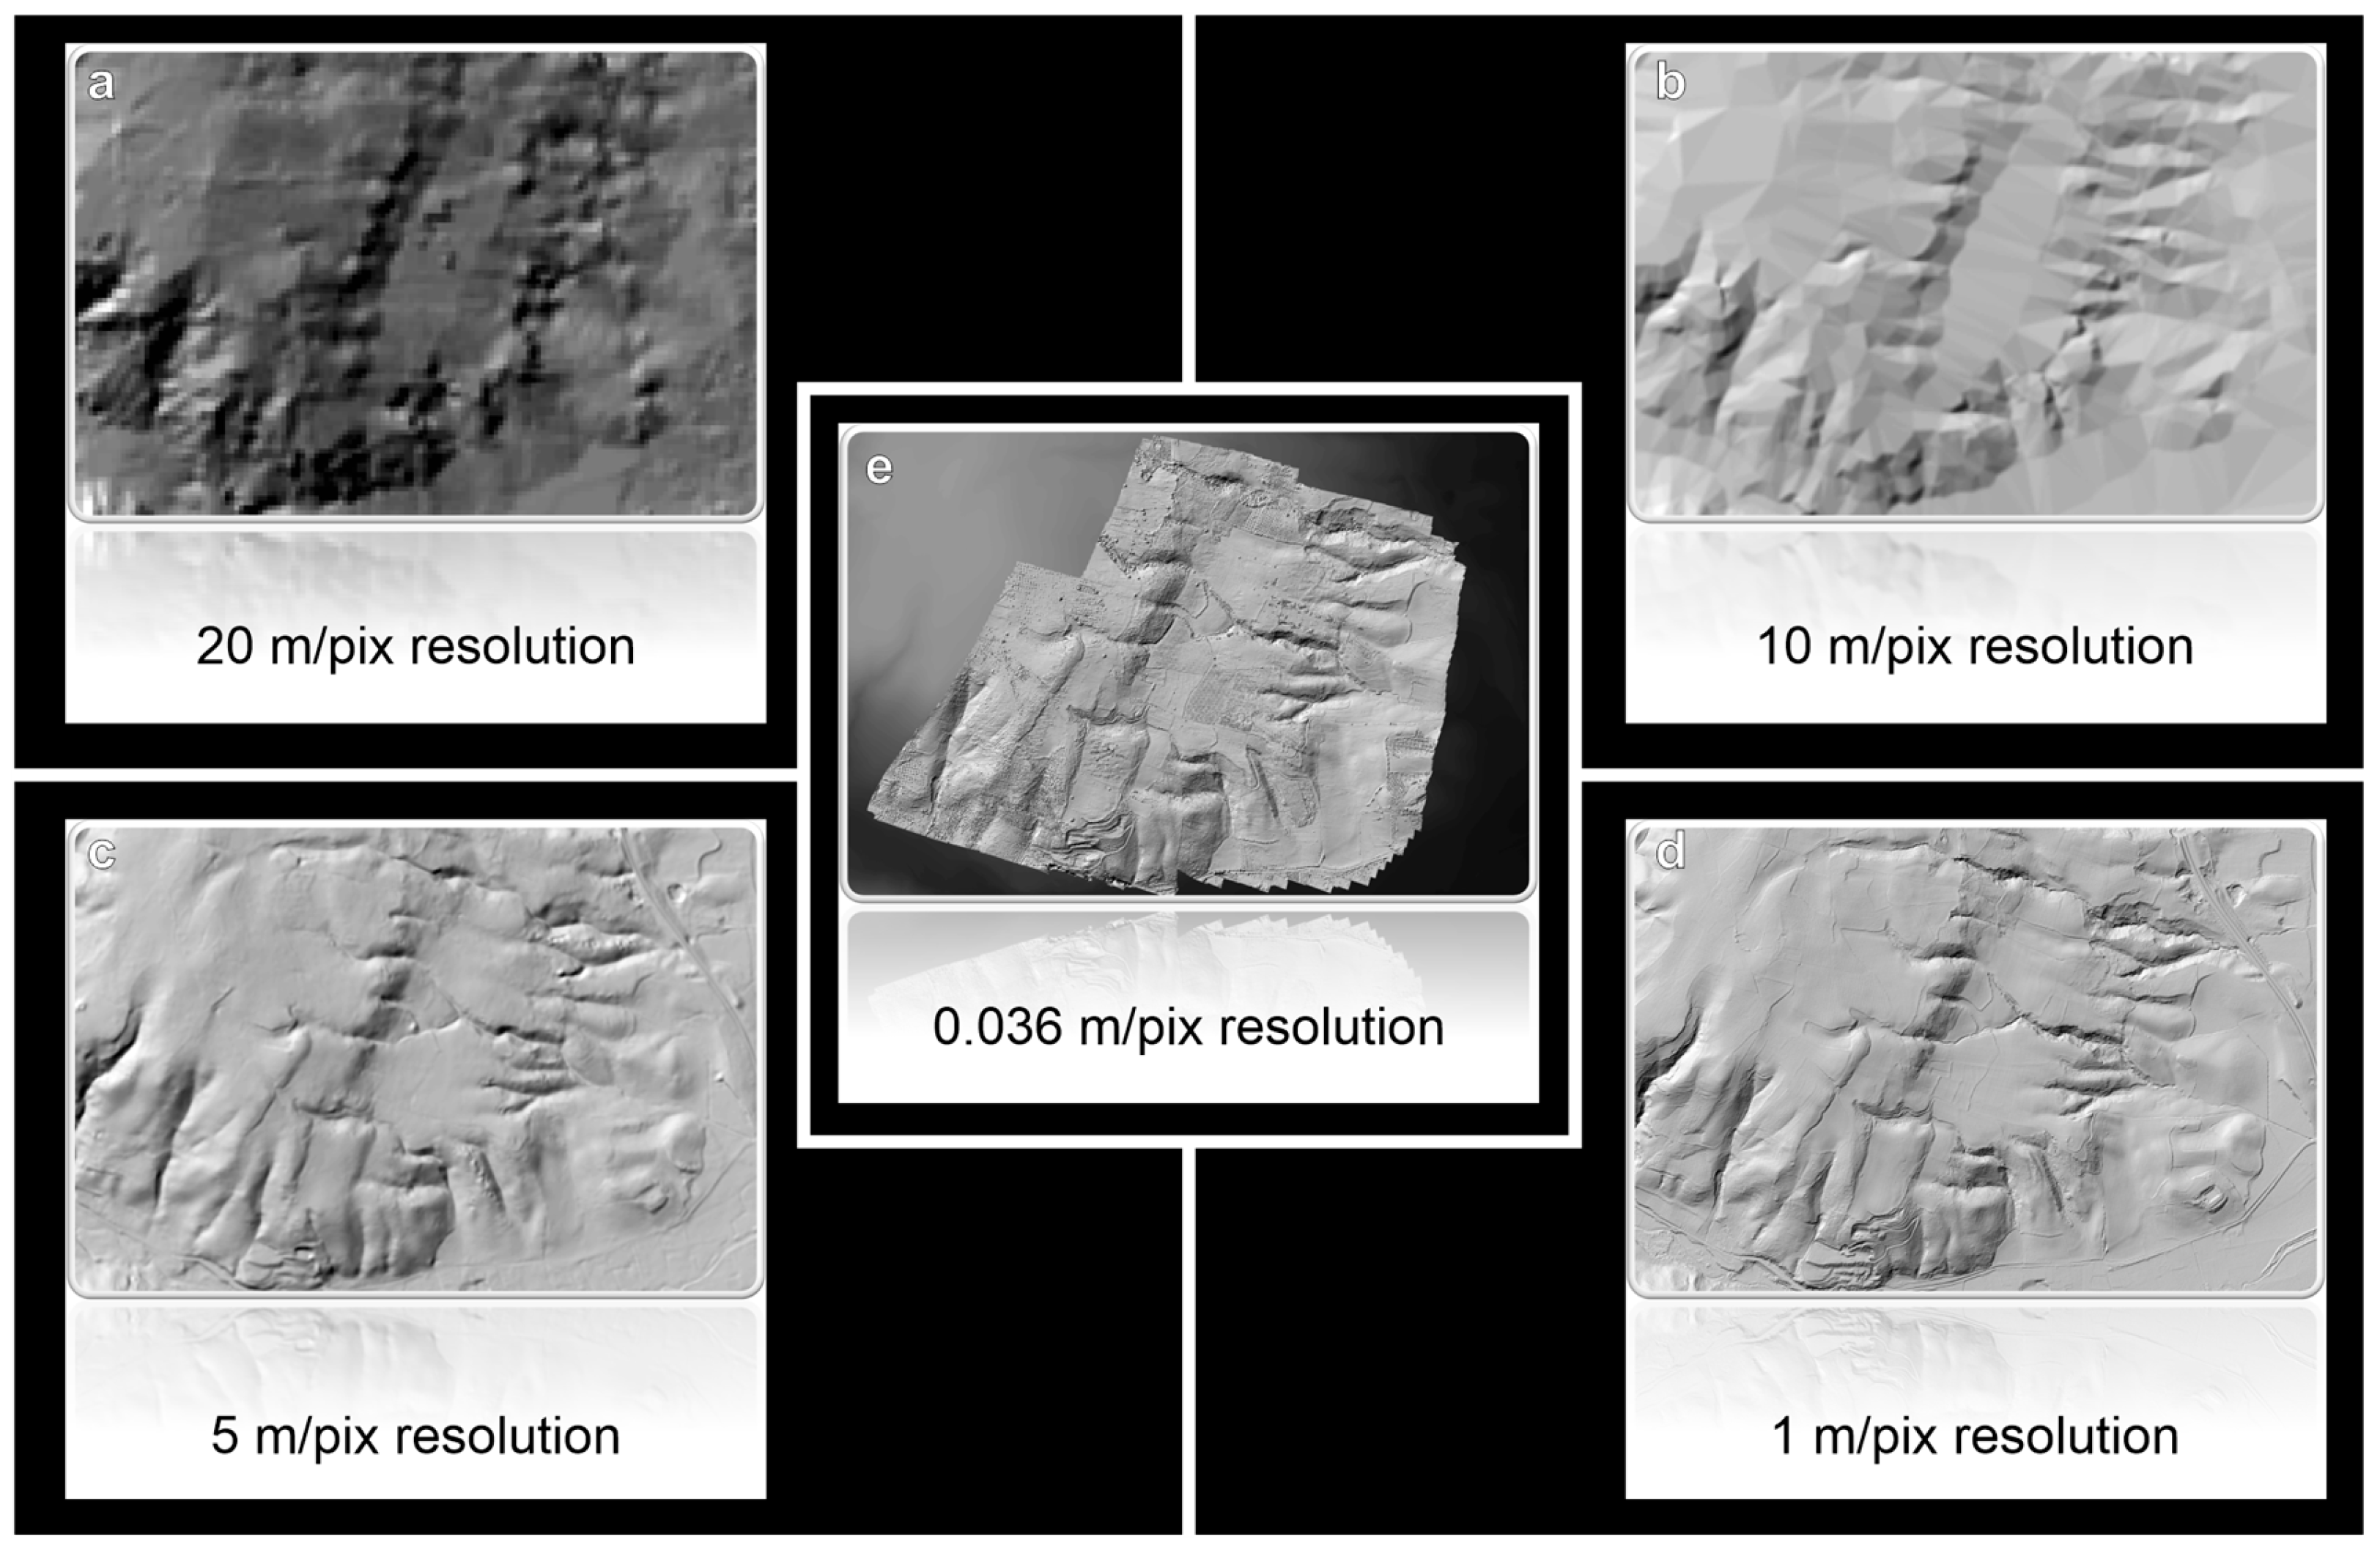
Geomorphological analysis is crucial for understanding the earth’s surface features and the processes that shape them. This analysis involves examining topography, landforms, soils, rocks, and other geological characteristics to determine their formation and potential changes over time. Using DEM analysis, geomorphological research identified key features such as fault scarps and surface offsets. Multiple DEMs were employed at various resolutions: 20 m, 10 m (TinItaly [78]: https://tinitaly.pi.ingv.it/ accessed on 22 February 2025), 5 m (CTR 1:5000: https://dati.regione.calabria.it/ accessed on 22 February 2025), and 1 m (LiDAR data from PCN MinAmbiente: https://sim.mase.gov.it/portalediaccesso/mappe/#/viewer/new accessed on 22 February 2025). This comparison highlighted the advantages of aerophotogrammetric methods and, where necessary, relied on available LiDAR data (Figure 5a–e).
This geomorphological approach enabled the assessment of fault exposure concerning past seismic activity. Measurements of the fault scarps’ height and length enabled estimations of the magnitudes of the earthquakes that have generated them. The analysis also aimed to detect signs of recent activity on the fault surface
Topographic profiles were generated for each DEM using ESRI’s ArcGIS Pro software v.3.3.0 (https://www.esri.com/en-us/arcgis/products/arcgis-pro accessed on 22 February 2025). This allowed for a detailed comparison of the topographic features across different resolutions, enhancing the accuracy of the geomorphological analysis and providing deeper insights into the fault scarp characteristics.

3.5. Soils Analysis

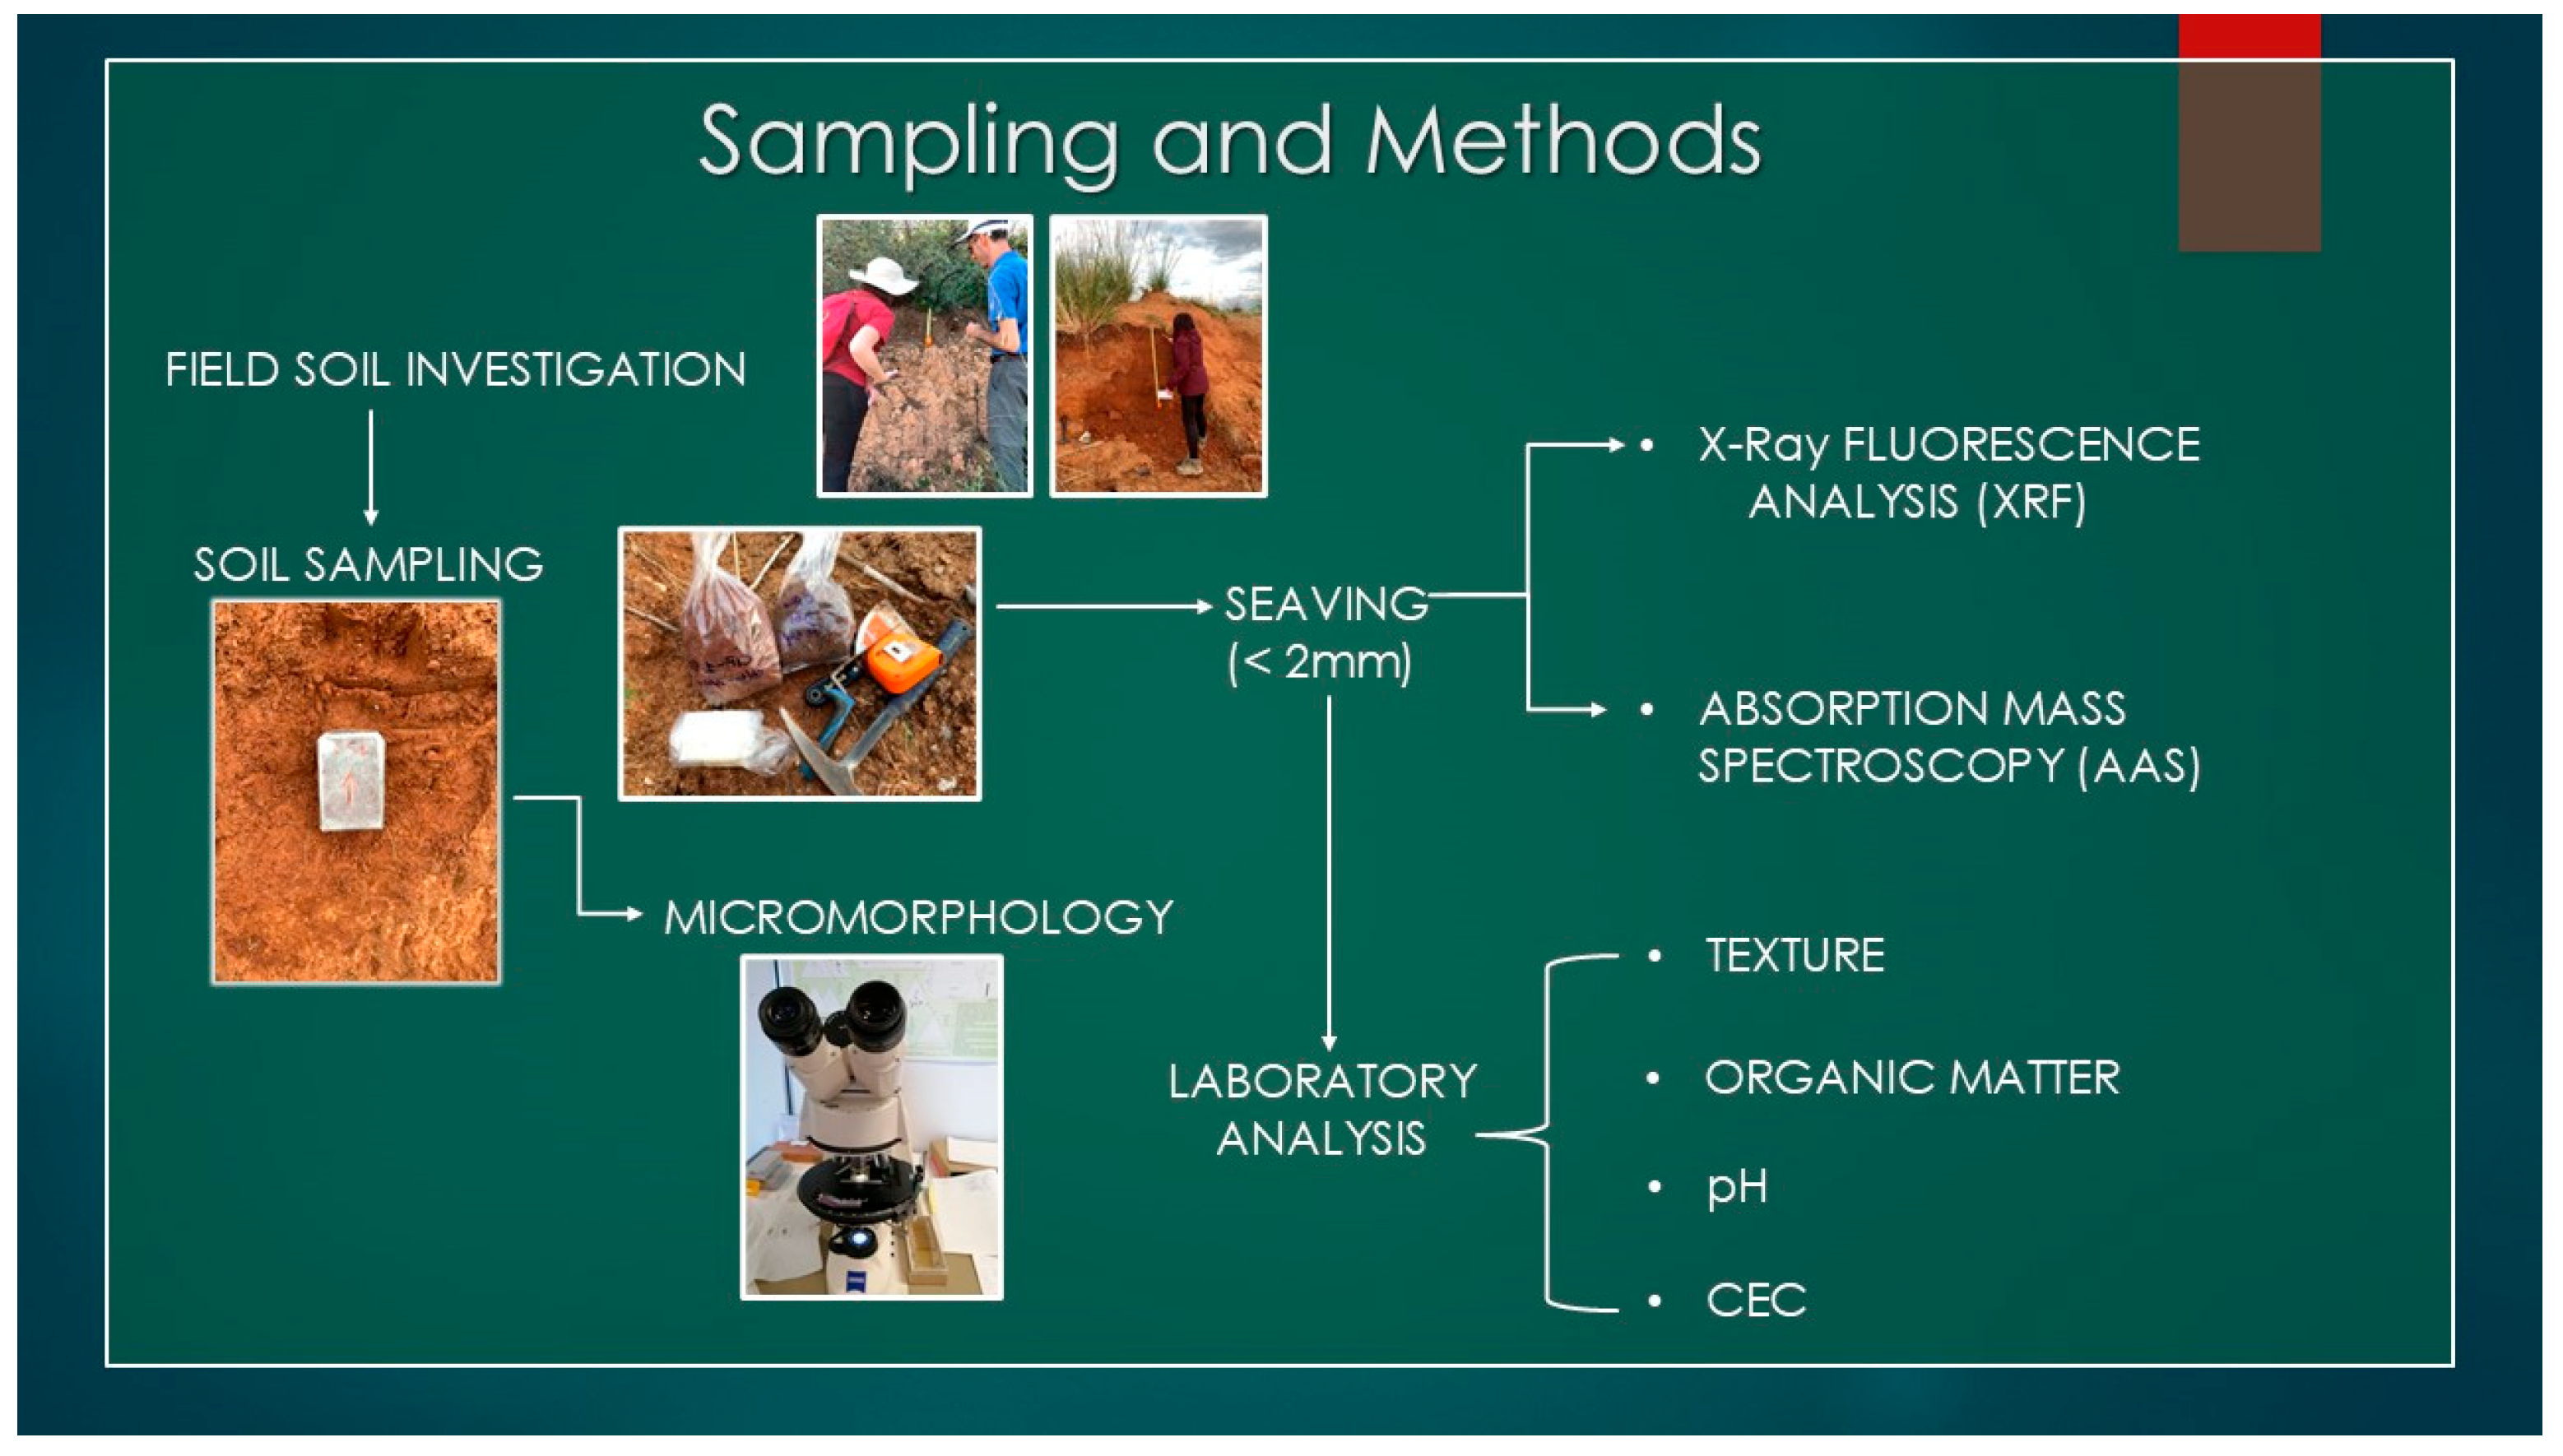
We selected five soil profiles located on different segments of the Piano delle Rose fault which displaced terraced surfaces ranging at different elevations from 352 to 116 m a.s.l. (Figure 6). These soil profiles, developed above fan delta deposits characterized by conglomerates, sand(stone) and clay, were described in the field according to FAO’s guidelines [82]. Their major morphological features were assessed, such as depth, horizon boundaries, pedogenic structure, consistence, color, texture, skeletal fraction and any other pedogenic features (coatings, concretions, etc.). Bulk soil samples from each pedogenic horizon were collected and analyzed from the chemical-physical, geochemical and micromorphological point of view to define its main pedogenic features and estimate the potential age of the corresponding soils.
Physical and chemical analyses (particle size distribution, pH (H2O), organic matter content, and cation exchange capacity (CEC) were performed on an air-dried and sieved fine earth (<2 mm) fraction [83,84].
Micromorphological observations were performed on thin sections (10 cm × 5 cm × 30 µm) prepared from undisturbed soil samples collected with aluminum Kubiena boxes, after air-drying, impregnation with a polyester crystic resin and air-hardening. The main micromorphological features were described using a Zeiss optical polarizing microscope (Carl Zeiss Microscopy GmbH, Jena, Germany) according to FitzPatrick [85].
Selective extraction techniques were used to determine different forms of Fe, such as acid ammonium oxalate extractable, Feo [86], and dithionite-citrate-bicarbonate extractable iron pool, Fed [87]. Their amount was measured using atomic absorption spectroscopy (AAS) on the fine earth fraction. The total iron content, Fet, was analyzed using a Rigaku Supermini X-ray fluorescence (XRF) spectrometer. These data were used to calculate some iron-based pedogenic indices, such as the active iron ratio Feo/Fed, crystallinity ratios Fed/Fet, (Fed−Feo)/Fet and the difference Fet−Fed. These indices are reliable indicators of the degree of soil maturity and can be used them to compare the different soil profiles (e.g., [19,88,89,90]). In order to minimize the effect of soil truncation by erosion, commonly observed in the soils of the study area, we calculated the weighted mean value of (Fed−Feo)/Fet for each soil profile considering the thickness. Specifically, this value was calculated using original values recorded for each individual horizon, multiplied by its thickness (h), and then normalized dividing it by the total thickness of the soil profile (H), as follows: ∑((Fed−Feo)/Fet)*h/H [89,91].

4. Results

4.1. Topographic Profile

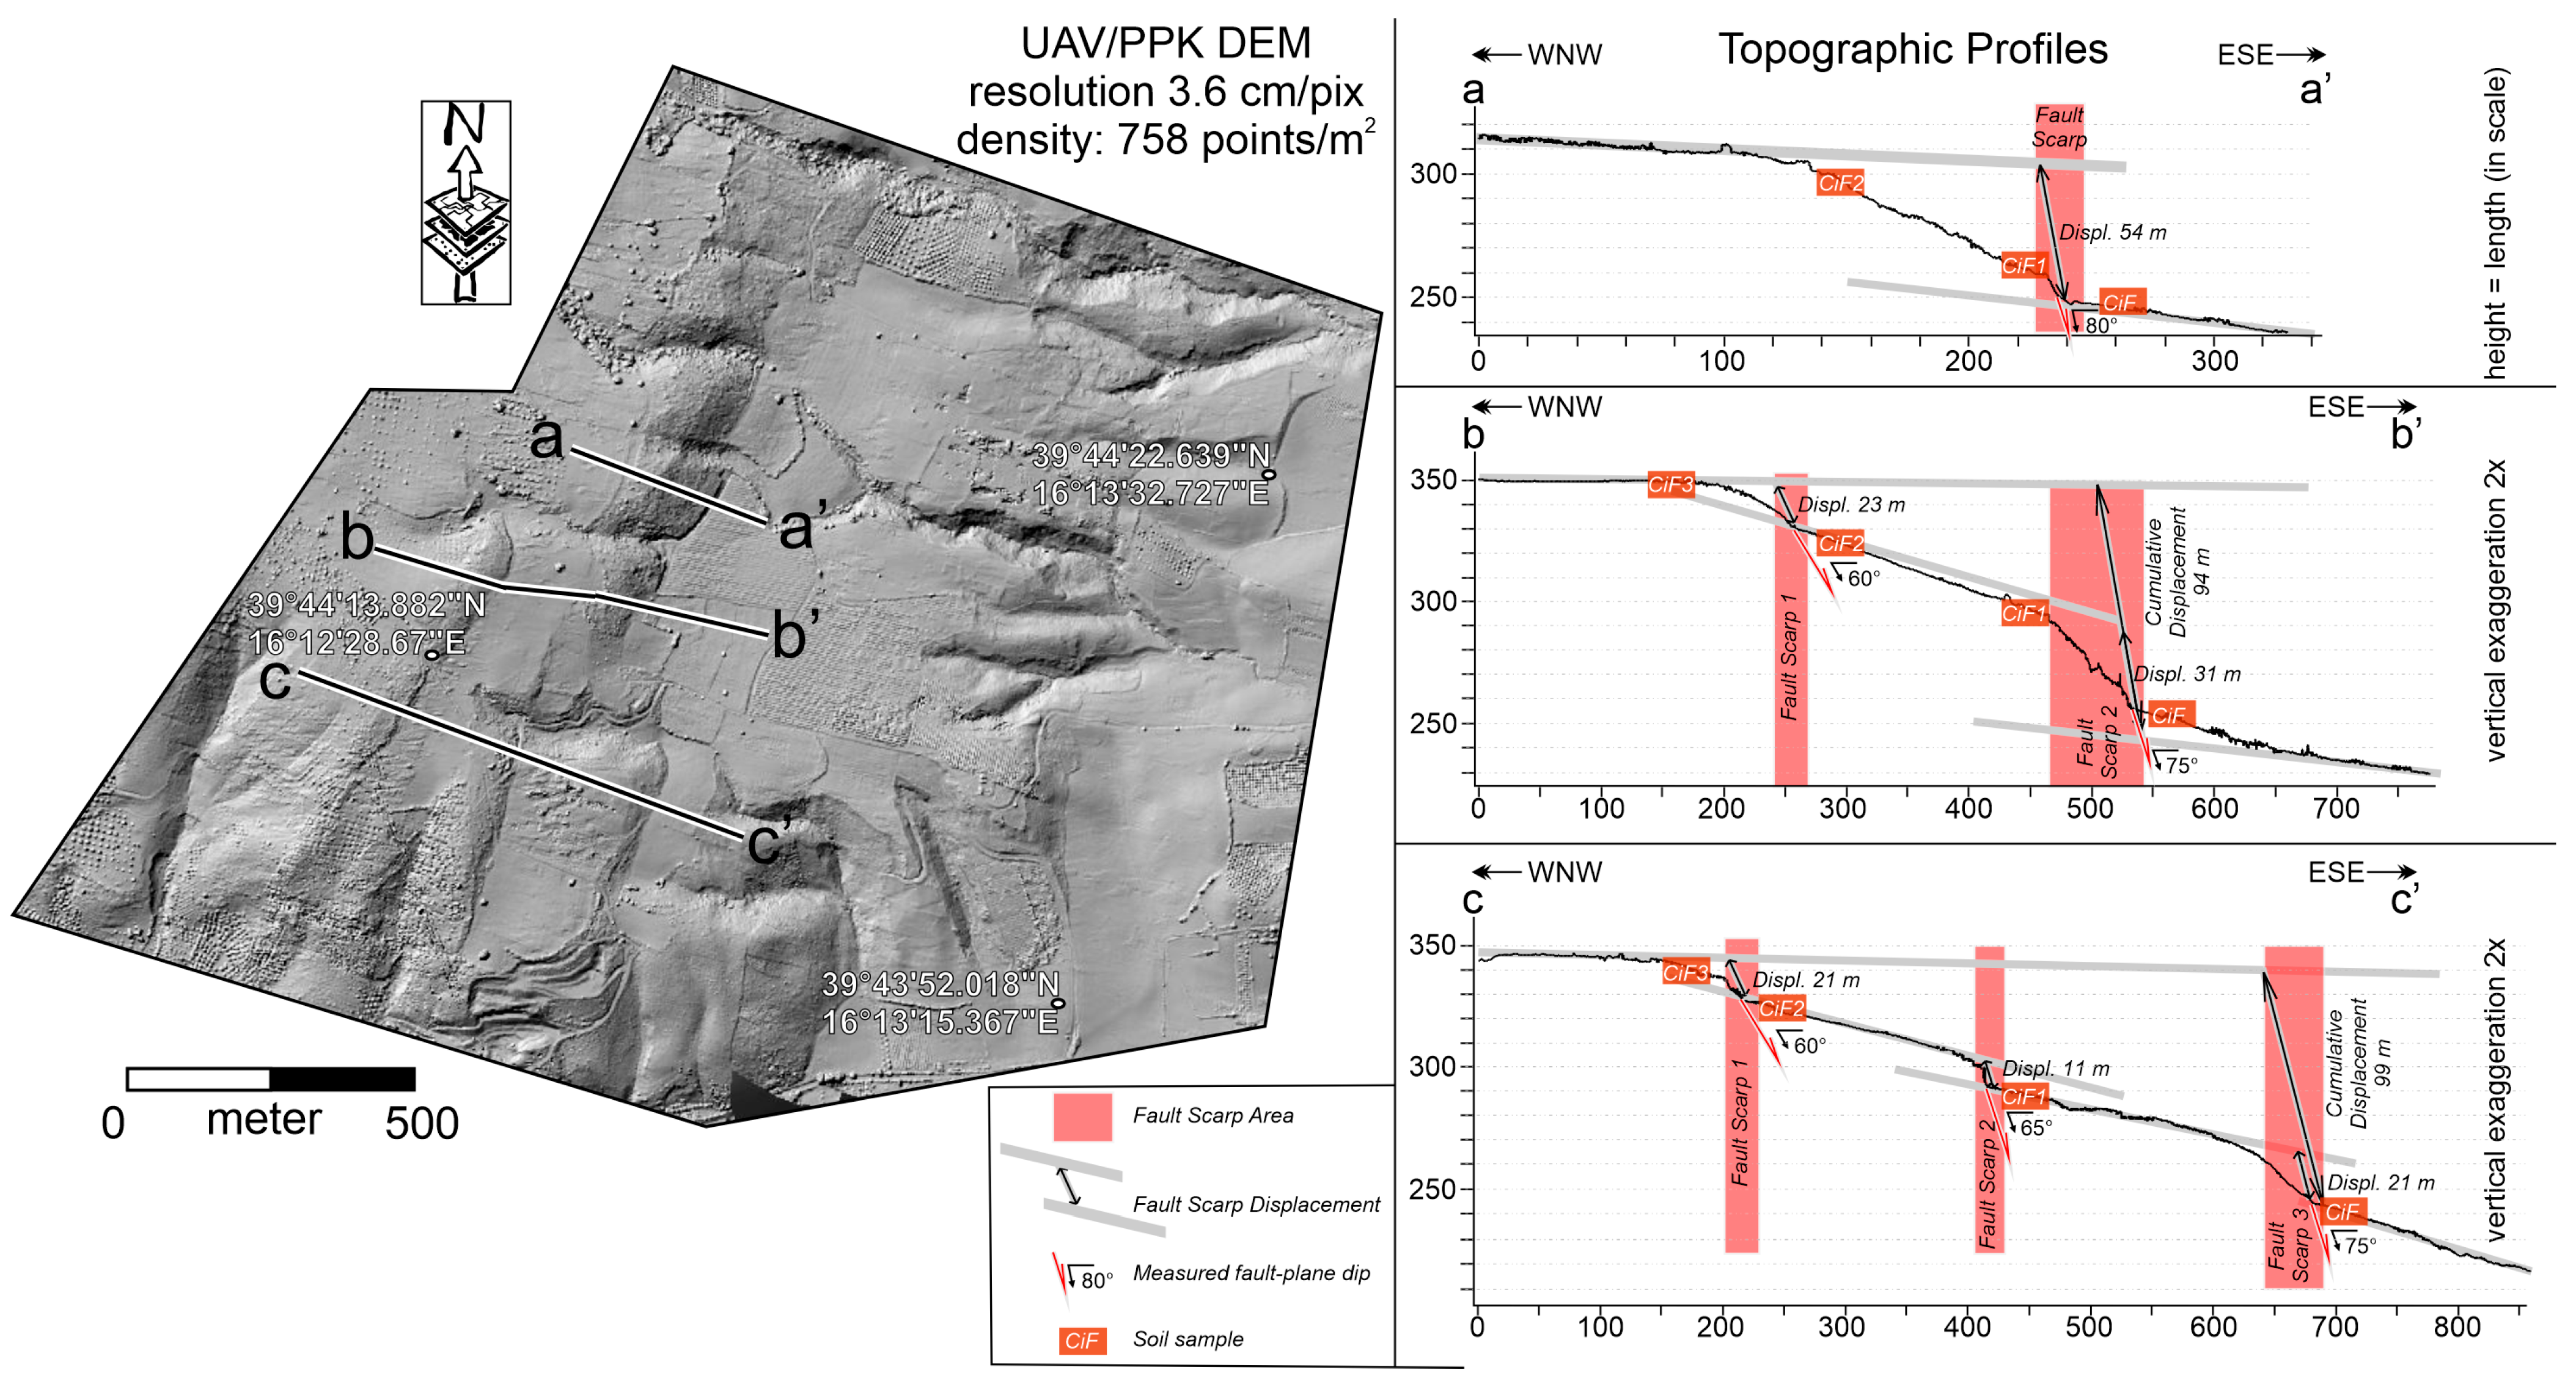
Several topographic profiles were generated using DEMs of variable resolutions: 20 m, 10 m, 5 m, 1 m, and a high-resolution UAV-derived DEM with 3.63 cm/pixel resolution (Figure 7). To ensure comparability, all profiles were traced along with the same alignments across the different DEM. Topographic displacements exceeding 5 m were clearly identifiable in DEMs with resolutions ≥ 5 m, whereas displacements between 5 m and 1 m were detectable only in the 1-m LiDAR DEM. The UAV-derived DEM provided superior detail, enabling the identification of minor displacements as well as a refined characterization of overall fault scarp morphology.
Figure 7 presents three representative west–east-oriented topographic profiles, starting from the highest elevations in the west and descending eastward. Each profile was drawn perpendicular to the main scarps identified in the DEM, aligned with fault planes exposed in the field. For every profile and associated fault scarp, throw, displacement, and heave were systematically measured, taking into account the dip of well-preserved, uneroded fault planes. The resulting measurements are summarized in Table 1.
The study area was subdivided into two sectors, southern and northern. In the southern sector, three distinct scarps are visible (Figure 7, profile c–c’). The westernmost part of the profile exhibits flat to gently sloping topography, whereas the central and eastern portions are slightly steeper. The three scarps are spaced approximately 250 m apart along profile c–c’, from west to east. Displacement measurements along the main scarps yield values of ~21 m for the western scarp (lowering topography from 350 m to 320 m), ~11 m for the central scarp (300 m to 290 m), and ~21 m for the eastern scarp (250 m to 230 m). The sum of individual scarp displacements is 53 m; however, assuming that the originally faulted surface was a single, continuous geomorphic surface, the cumulative displacement between the westernmost and easternmost scarps amounts to ~99 m. This observation suggests that these sub-parallel and closely spaced scarps (<250 m) represent synthetic splays of the same fault at depth.
Moving northward, the three scarps progressively diminish until merging into a single, well-defined scarp (Figure 7, profile a–a’), located slightly farther north.
Profile analysis shows that the western scarp (350–320 m) gradually tapers northward (Figure 7, profile b–b’), whereas the eastern scarp (300–250 m) becomes more prominent and continuous. Displacement measurements derived from topographic profile b–b’ (Figure 7) provides ~23 m for the western scarp and ~31 m for the eastern scarp, for a combined displacement of ~54 m. Assuming the original geomorphic surface was continuous, the cumulative displacement between the highest sub-planar surface (~350 m) and the lowest (~240 m) amounts to ~94 m. In the northernmost profile (a–a’ in Figure 7), the single scarp records a displacement of ~54 m.

4.2. Fault Displacement Analysis/Field Survey Sites/Kinematic

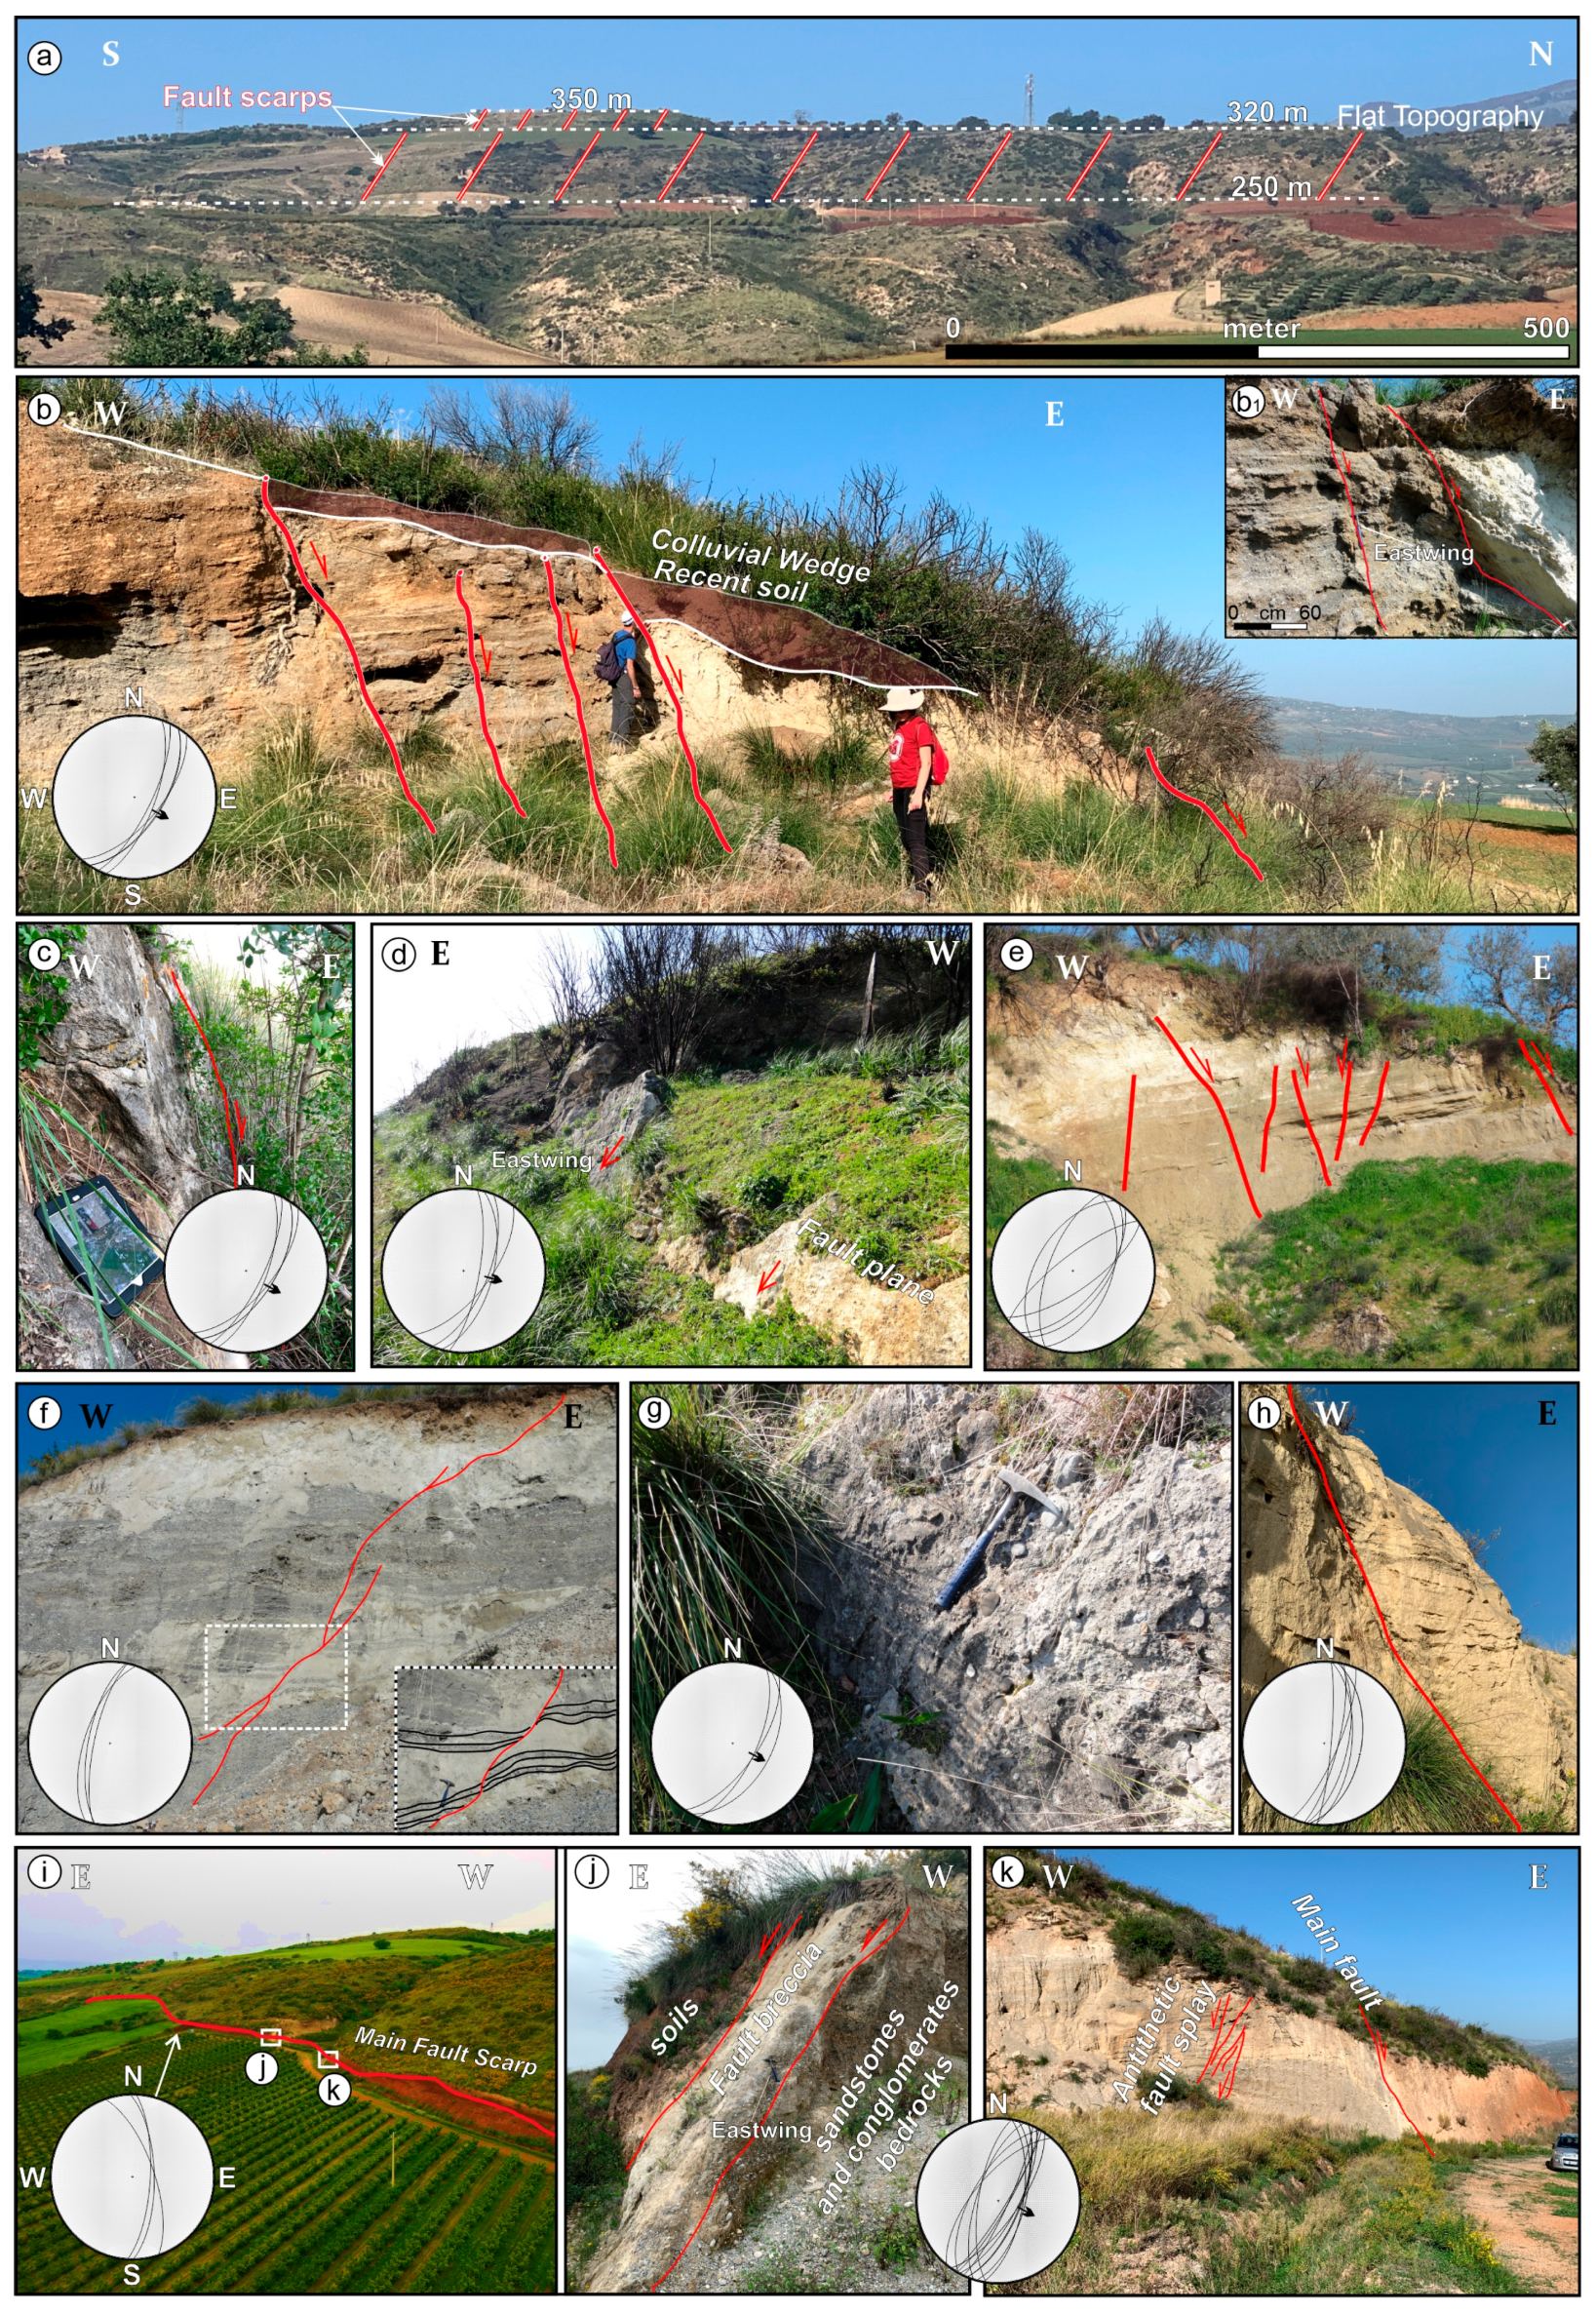
The geological survey conducted in the study area revealed multiple well-preserved fault planes exhibiting fresh morphological features. Nine different sites were mapped (Figure 8 and Figure 9), where fault planes are clearly exposed. Notably, the striae were exceptionally well-preserved at sites labelled as b, c, d, g, j, and i, as the faults cut through well-cemented conglomerates. Conversely, areas with sandy and clayey deposits showed little to no preservation of striae, likely due to the highly erodible nature of these lithologies and their susceptibility to atmospheric weathering.
Significant morphological evidence was observed from two panoramic viewpoints, particularly the noticeable eastward offset of two sub-planar surfaces that form a prominent scarp (Figure 8 and Figure 9a,i). The geological-structural survey across the study area indicated that near the main scarp, to the west, a significant deformation zone affected the uppermost deposits of the entire siliciclastic sandy-conglomeratic succession. In some cases, even the more recent Holocene soils were deformed, resulting in the formation of colluvial wedges.
The faults dissecting this area (Figure 9b,b1) exhibit a NE-SW trend and dip towards the southeast with an average dip-angle of 60°. Well-preserved dip-slip striae were observed, trending approximately N120°E, indicating predominantly extensional kinematics. Continuing southward along the same fault system (Figure 8 and Figure 9c,d), a single fault plane was identified cutting through well-cemented sandy-conglomeratic rocks. It maintains the NE-SW orientation, a dip angle of 60°, and shows striae trending N125°E.
A closely spaced set of faults defines a deformation zone within the sandier succession several hundred meters further south along the western scarp. These faults exhibit a more dispersed trend from NNE-SSW to NE-SW, with planes dipping both eastward and westward (antithetic), and displaying dip angles ranging between 60° and 70°. No striae were preserved in this area (Figure 8 and Figure 9e).
An important scarp, located approximately 250 m east of the previous one (Figure 8), shows evidence of faults with predominantly extensional kinematics. These faults trend NNE-SSW, mainly dipping eastward with an average dip angle of 65° (Figure 9g) and is accompanied by antithetic structures (Figure 9f). A significant structure situated on a third scarp, about 300 m from the last described, reveals a fault-oriented N-S, predominantly dipping eastward with a dip angle of 75°. Striae are not evident here due to the predominantly sandy lithology, which does not favour their preservation (Figure 9h).
A very prominent scarp hosts faults affecting sandy and sandy-conglomeratic lithotypes as well as brown-reddish-colored soils just north of these described outcrops. This scarp is characterized by closely spaced faults forming a significant deformation zone characterized by a fault breccia, predominantly oriented NE-SW and dipping eastward with dip angles of up to 80°. Associated antithetic structures dip westward. In some cases, preserved striae indicate a trend of N110°E, confirming a purely extensional kinematics (Figure 8 and Figure 9i–k).

4.3. Field Soil Features

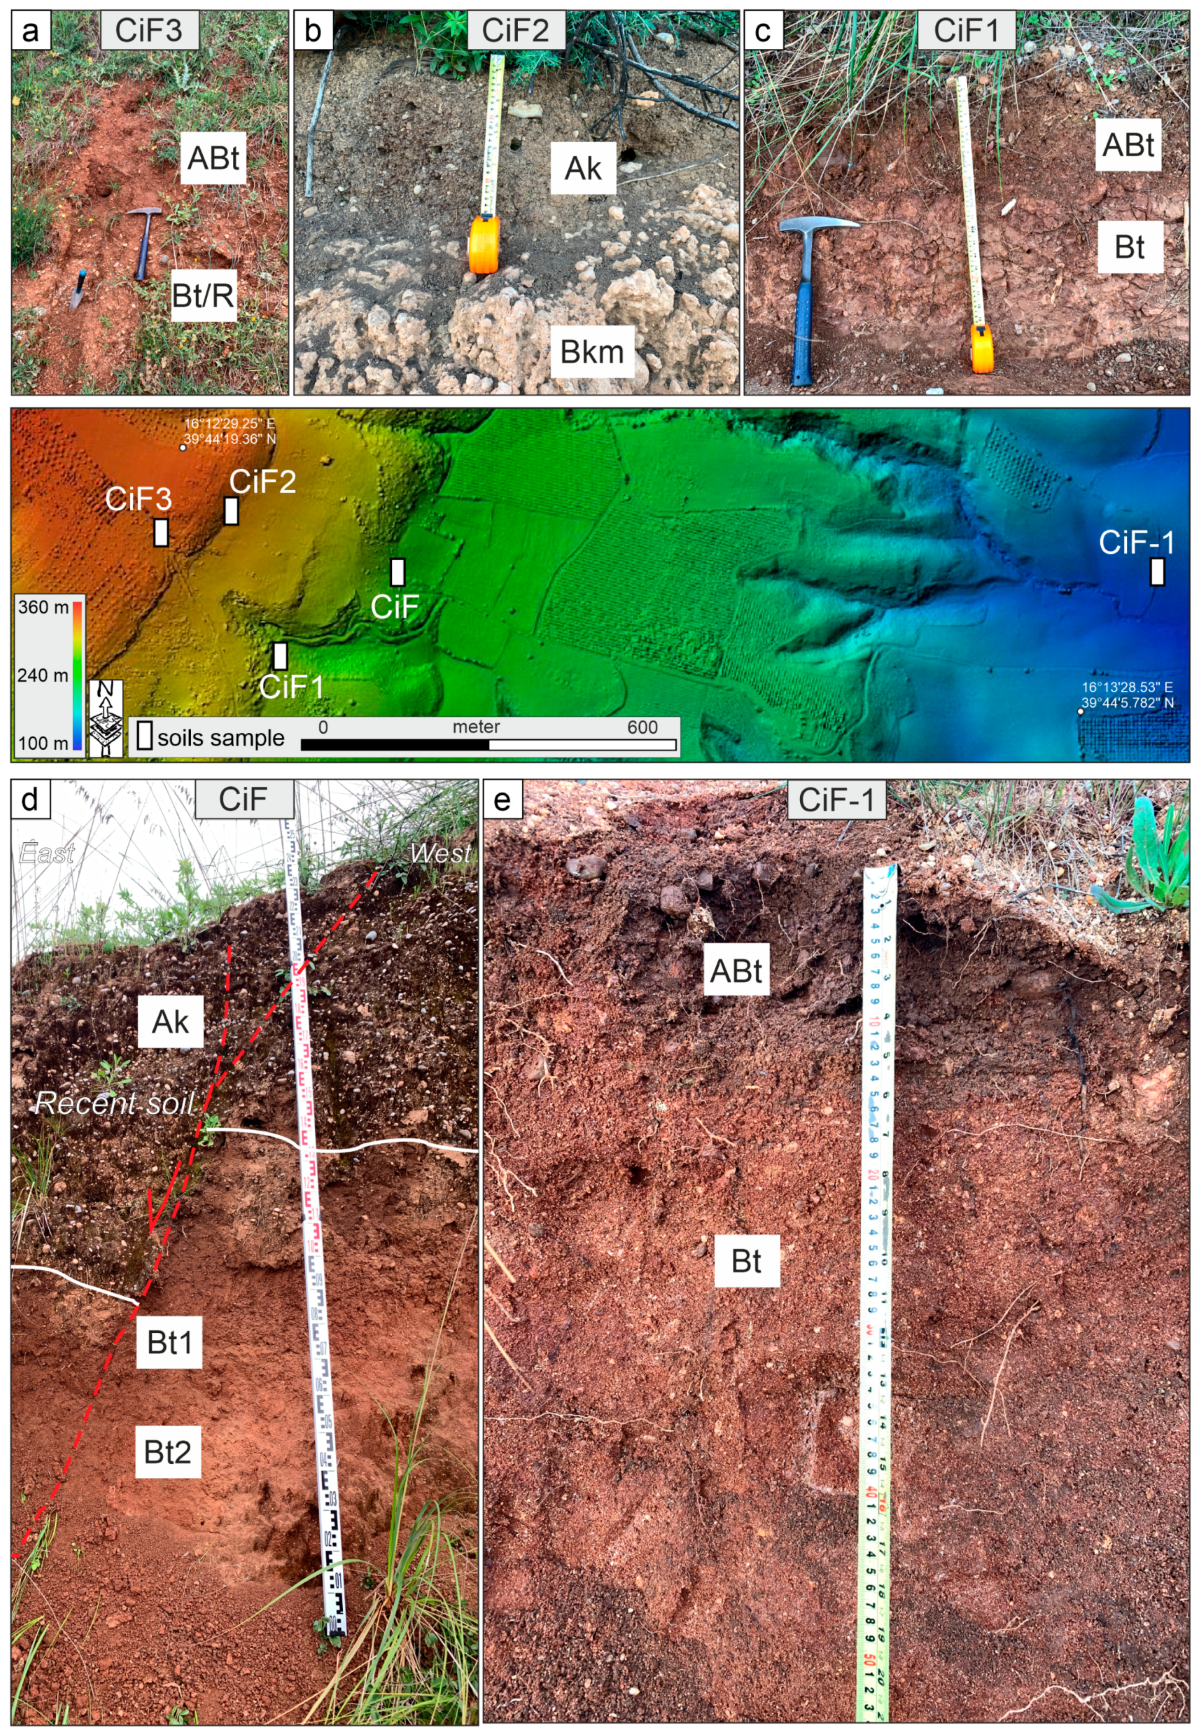
The main morphological features of the selected soil profiles are shown in Table 2. All of them exhibit a weak to moderate differentiation in the pedogenic horizons (Figure 10a–e) with shallow topsoils, which consist of brownish, organic-rich (humified) A horizons, always combined with other pedogenic features: Ak horizons include secondary carbonate precipitations, whereas ABt horizons show the coexistence of organic matter accumulation in a typical argic horizon (see below). Only soil profile CiF 2, characterized by an Ak topsoil overlying a Bkm horizon (Figure 10b) and the Ak horizon of profile CIF (Figure 10d) display carbonate concretions and/or soft concentrations and differ significantly from the other soil profiles. These predominantly consist of one or more argic, i.e., clay-illuviated (Bt) horizons, enriched in clay particles translocated downprofile by water percolating wihin pores, underlying transitional ABt horizons (Figure 10a,c,e). The depth of the soil profiles ranges from about 100 to 360 cm with mainly shallow topsoils that conversely are deeper in the CiF and CiF3 soil profiles (Figure 10a,d). Topsoils mainly display a crumby and sub-angular blocky pedogenic structure, while the subsoils are characterized by sub-angular to angular blocky structure except in the Bt horizon of soil profile CiF1, where a prismatic pedogenic structure is also observed. In some soil profiles, horizon boundaries between the humus-rich topsoil and the underlying argic horizon(s) display sharp and/or irregular patterns, possibly separating younger soils from paleosols. The redness rating proposed by Torrent Et Al. [92] indicates a more pronounced soil rubification (reddening), controlled by diffuse iron oxides in the pedogenic matrix, in the Bt horizons, where also iron-manganese pedofeatures occur in the range of about 8–10 to 10–15%. Clay coatings generally range from 8 to 20% with highest values of 30–35% in the Bt horizon belonging to soil profile CiF1.

4.4. Chemical and Physical Data

The results of the chemical and physical analyses are listed in Table 3. On the whole, particle size distribution is mainly coarse, from sandy loam to loamy texture. Sand-sized particles reach up to more than 90% in the Bt horizon of soil profile CiF-1, while the silt sized-particles exceed 70% in the ABt horizon of soil profile CiF3. Moderately alkaline pH conditions characterize all soil horizons except soil profile CiF-1 which is neutral. The organic matter amount is low (≤2.3%) with higher values in the ABt and Ak topsoils (between 2.2 and 1.8%) except soil profile CiF where the Ak soil horizon shows contents slightly lesser than the Bt horizon. Cation exchange capacity exhibits mainly medium to low valus except for the Ak horizon of soil profile CiF2 where it reaches 36.3 cmol(+)kg−1.

4.5. Micromorphology

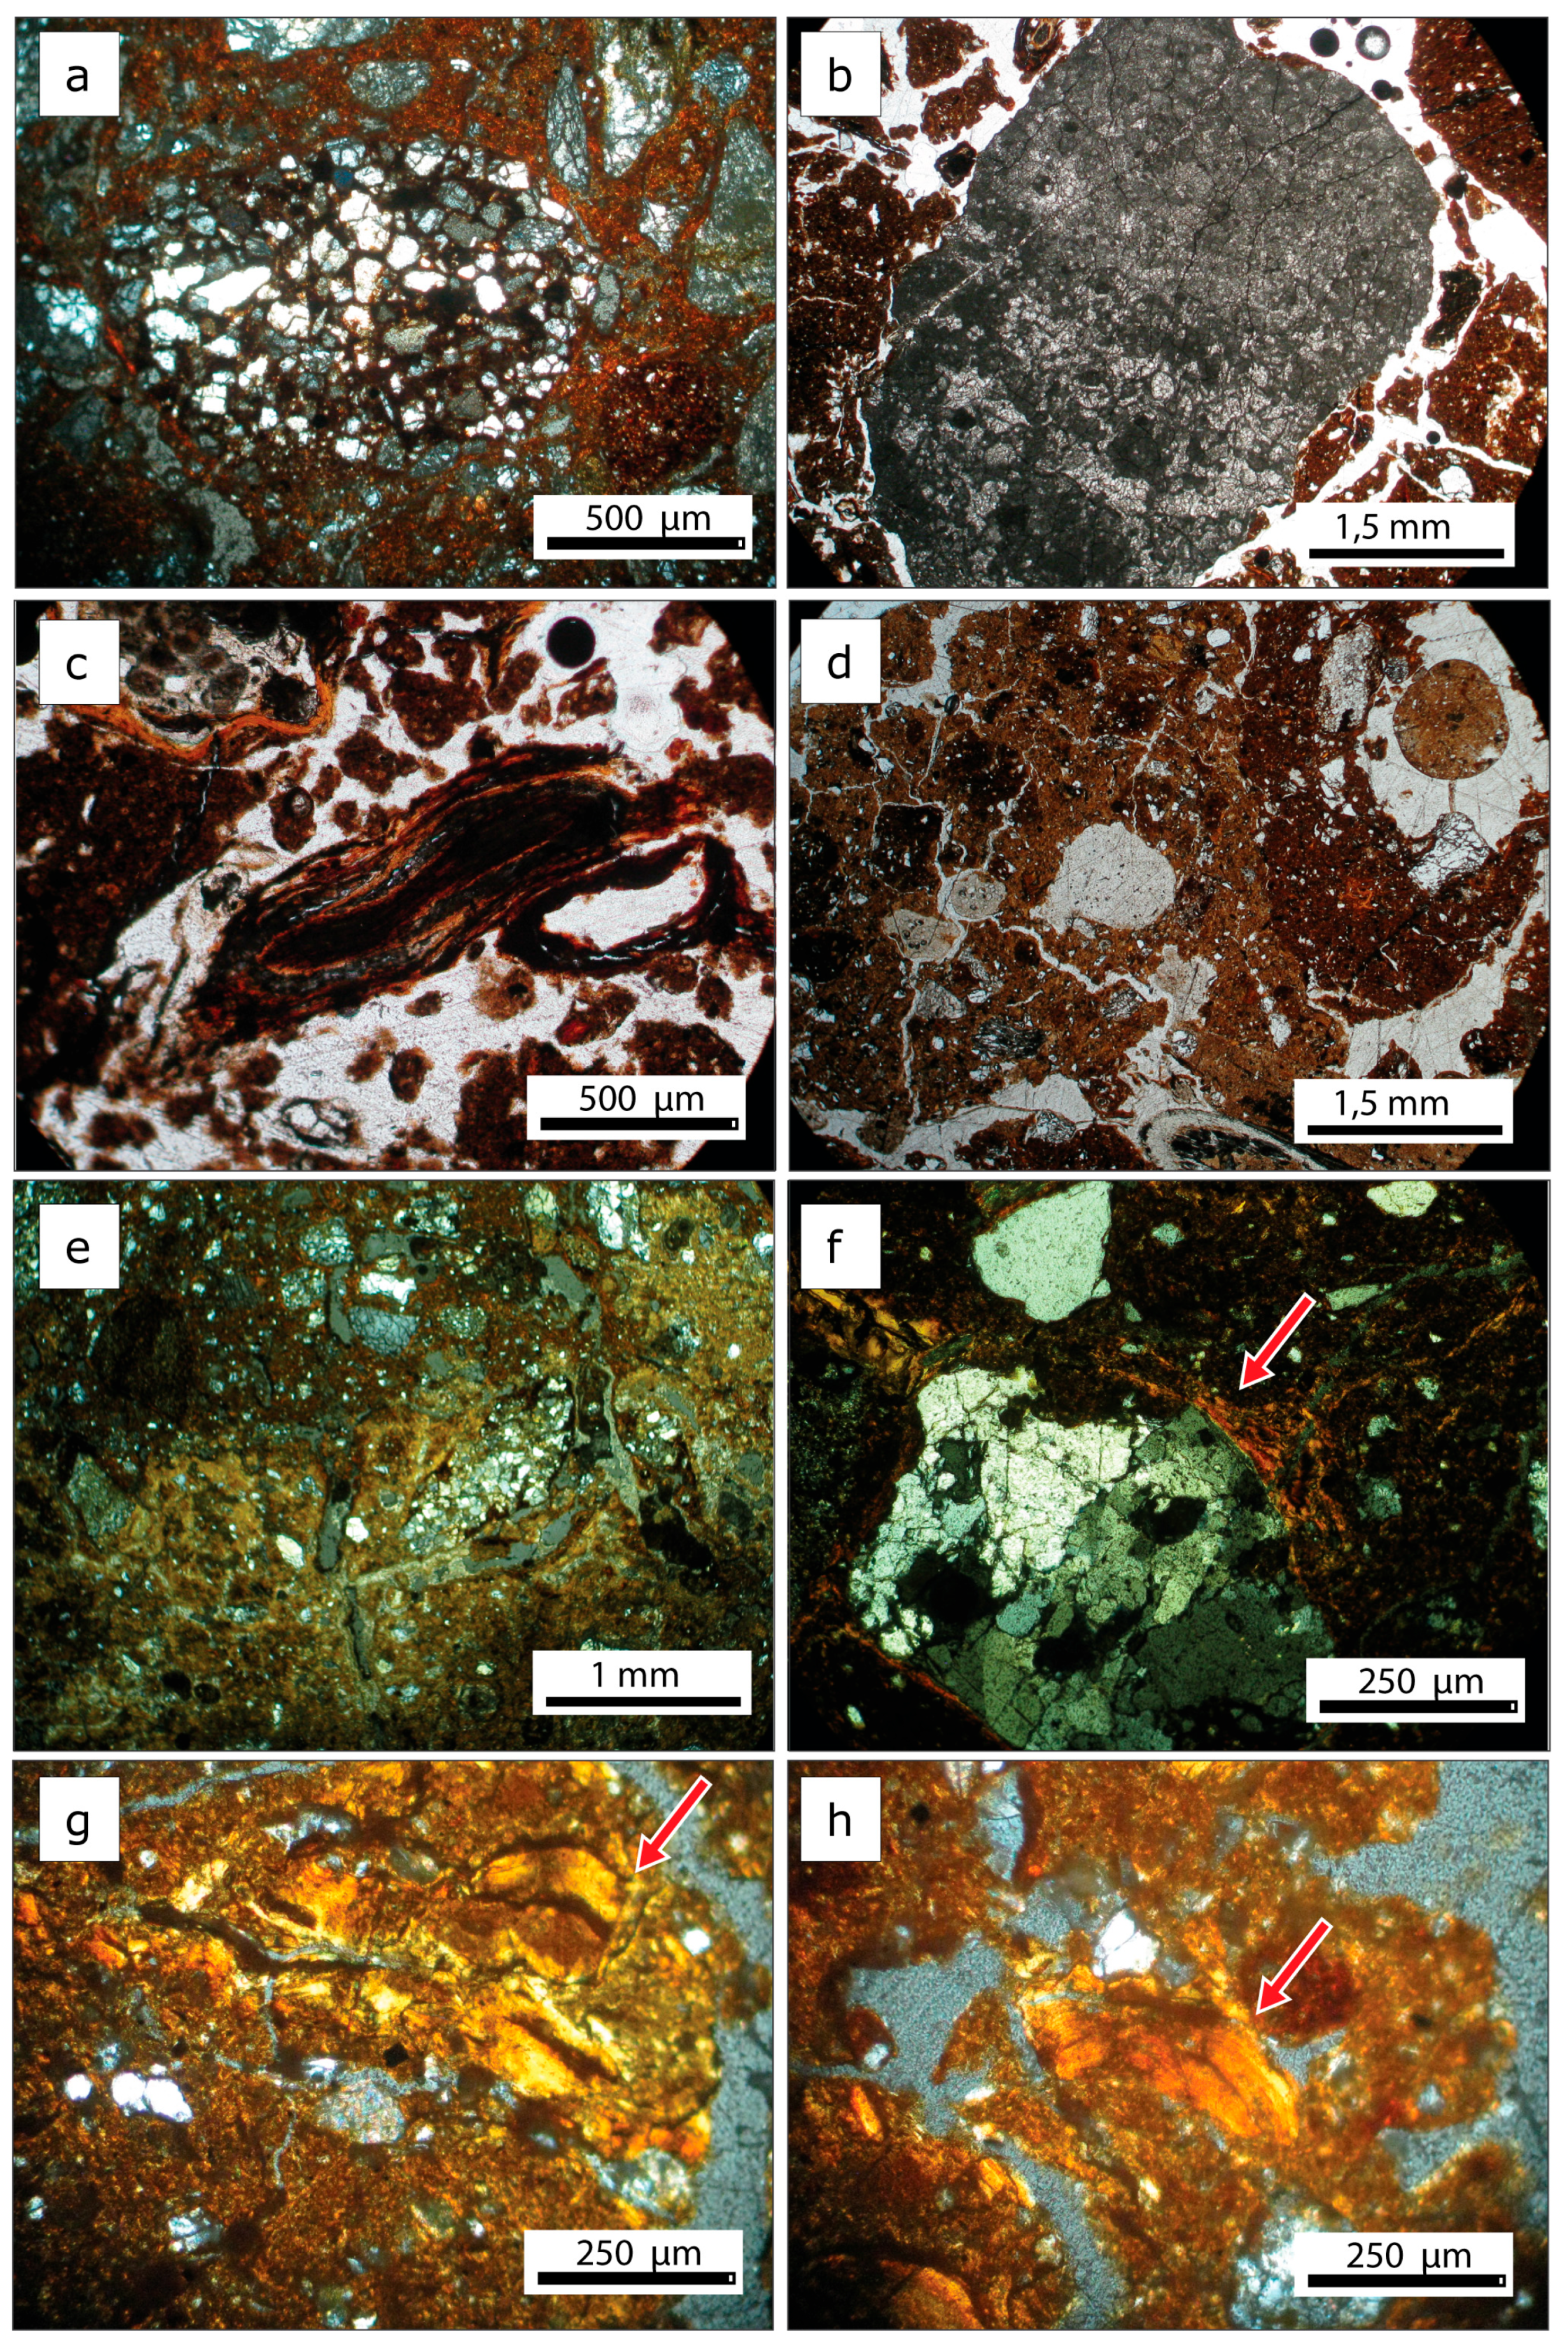
The micromorphological analysis shows that skeletal grains mainly consist of quartz, feldspar, calcite, sedimentary and metamorphic rock fragments. Sedimentary rock fragments include sand(stone) (Figure 11a), siltstone, chert, and carbonate rock types as biomicritic (Figure 11b), micritic, microsparitic and sparitic limestone, while the metamorphic rock fragments are characterized by schists and gneiss. Moreover, the soil horizons include fresh to moderately decomposed vegetal tissues (Figure 11c). The primary porosity is characterized by numerous faunal voids and sporadic planar pores. On the whole, the ABt and Bt horizons generally show an optically anisotropic matrix in crossed-polarized light, which ranges in color from yellowish-brown to reddish (Figure 11d,e). Illuvial clay and silt coatings within pores and surrounding mineral grains were observed (Figure 11f). Clay coatings are often laminated (due to polycyclical stacking of clays from water suspensions) and fragmented, with smooth-banded to grainy extinction patterns between crossed polarizers (Figure 11g,h), as a consequence of a limited to extensive loss of the original parallel iso-orientation of clay platelets during their emplacement. In soil profile CiF, old, largely degenerated clay coatings, often assimilated into the surrounding matrix, are mainly observed in the Bt1 horizon. Clay coatings are yellowish to reddish in colour (Figure 11g,h), with redder hues in the soil horizons of soil profiles CiF1, CiF2 and the Bt/R horizon of CiF3. In contrast, in the ABt horizon of soil profile CiF3, the clay coatings are less evident and show pale yellow to orange color with smooth to grainy extinction patterns between crossed polarizers. Precipitations of secondary CaCO3 are observed mainly in soil profiles CiF and CiF2. Occasionally Fe/Mn segregations ranging from reddish brown to dark brownish-black colors, are identified, which are more abundant in the Bt1 horizon of soil profile CiF.

4.6. Selective Estraction and Pedogenic Iron Indices

Selective extractions and the associated pedogenic iron indices are presented in Table 4. The crystallinity ratio (Fed/Fet) and the pedogenic iron index ((Fed−Feo)/Fet) exhibit similar values, ranging between approximately 0.2 and 0.5, with minor variations within and between the soil profiles. Specifically, higher values characterize soil profile CiF3, with weighted mean values reaching 0.46. In contrast, all the other soil profiles show weighted mean values ranging between 0.30 and 0.38. A gradual decrease in the values of pedogenic iron indices, from 0.41 in the Bt2 horizon to 0.22 in the Ak horizon, is observed from the bottom to the topsoil in soil profile CiF. Conversely, in soil profile CiF1, an increase is shown, with values rising from 0.30 at the bottom to 0.41 in the topsoil. The active iron ratio (Feo/Fed) generally shows lower values, ranging from a minimum of 0.03 to a maximum of 0.08in the topsoil of soil profile CiF-1. On the whole, the total iron content (Fet) shows a discontinuous trend from the bottom to the topsoil across the profiles, with mean values of approximately 3.75%. In soil profile CiF1, this value increases from the topsoil to the bottom, where it reaches a maximum of 5.41%.

5. Discussion

This study demonstrates the effectiveness of a multidisciplinary approach combining stratigraphic, structural, and geomorphological field data with laboratory-based soil and paleosol analyses and high-resolution UAV-derived photogrammetric models to improve our understanding of fault surface activity and evaluate seismic hazard. The integration of these diverse datasets enabled a robust reconstruction of the fault network affecting the study area, with a particular focus on the Piano delle Rose Fault. UAV surveys and digital elevation models provided detailed morphotectonic data, while GIS-based analysis supported the mapping and interpretation of displaced surfaces. The stratigraphic and soil chronologies, integrated with fault scarp geometries, facilitated a more precise definition of fault kinematics and temporal evolution.
This approach allowed us to identify fault segments and their geometric properties and constrain the chronology of the deformation history. Specifically, identifying displaced paleo-surfaces and applying pedological and physico-chemical analytical methods provided relative ages for the terraces offset by tectonic activity. This has significantly increased our understanding of the tectonic processes shaping the northern Calabria region.

5.1. Correlation of Marine and Fluvio-Lacustrine Terraces

A comparative analysis with other studies from nearby areas provided critical contextual support for interpreting the terrace sequences observed in the field. In particular, Lucà Et Al. [93] in the Cassano Ionio area, located approximately 10 km to the northeast, documented nine sub-horizontal marine terraces attributed to Marine Isotope Stages MIS 11 (~400 ka) to MIS 5.1 (~80 ka), which are currently located between 350 and 60 m a.s.l., respectively. The terraces studied in our area, located at 350 m, 320 m, and 250 m a.s.l., fall within this elevation range, suggesting a potential chronological correspondence with the terraces reported by Lucà Et Al. [93]. This correlation is supported not only by elevation but also by the observed facies, which closely resemble those described in their study. In particular, Lucà Et Al. [93] document outcrops with the same facies associations of “Fluvial and Alluvial Fan Conglomerates” overlain by reddish soils, analogous to those of the terraces analyzed in the present work, with comparable thicknesses. Similarly, studies by Robustelli Et Al. [91], Carobene Et Al. [94], and Molin Et Al. [95] along the Ionian coastal sector, approximately 35 km east of our study area, identified several alluvial and marine terraces corresponding to various MIS, where chronological constraints are based on some radiometric datings [96,97], biocronology of marker species from marine fauna, and morphostratigraphic correlations. Robustelli Et Al. [91] recognized terraces ranging from 218–154 m (MIS 11–9, ~300 ka) to 90 m a.s.l. (MIS 7, ~200 ka), and lower surfaces associated with MIS 5 (120–75 ka). Carobene [94] and Molin Et Al. [95] described similar elevations, reinforcing the regional recurrence of these terrace levels. Additional chronological data from other researchers are available for the northeastern sectors of Calabria, where similar Middle to Late Pleistocene staircases of terraces are dated based on correlations to MIS and varying numerical dating techniques applied to marine fossils [98,99,100,101].
The consistency in terrace elevation, in the facies stratigraphy and inferred ages among these studies and our observations supports the hypothesis that the terraces analyzed in our work belong to the same climatic-eustatic cycles. This correlation also helps define the temporal framework within which the tectonic displacement occurred.
Therefore, considering a terraced surface located at the highest elevation of approximately 350 m a.s.l. (representing the original elevation at its formation time), and taking into account that the identified faults have subsequently displaced this surface, it is reasonable to infer that the terrace’s age corresponds to marine eustatic oscillation cycles, specifically associated with the Interglacial Marine Isotope Stage (MIS 11) around 400–350 ka.

5.2. Soil and Paleosol Chronology

The subsoil horizons of the studied soil profiles consist of rubified, clay-illuviated Bt horizons, where clay coatings are often fragmented, with a varying degree of degeneration of the internal fabric, and/or appear assimilated into the surrounding pedogenic matrix. Such a combination of pedogenic features indicates relict properties, which allow considering the subsoils as paleosols, mainly formed under paleoclimatic conditions different from today. In Mediterranean environments, the coexistence of these features (extensive matrix rubification and abundant clay illuviation, and, when present, the relict character of clay coatings) are very diagnostic of a major soil development during Pleistocene interglacials [91,102,103,104,105,106,107]. Similar results are provided from other peri-Mediterranean [108,109] and mid-latitude areas [110,111] as widely reported in a recent review on paleosols from Italy [112]. Also by comparing soil chronosequences from different areas in Europe and California under Mediterranean climate conditions, Sauer [113] showed that matrix rubification only occurs in soils >100,000 years, in agreement with findings by Cremaschi and Trombino [109] in other circum-Mediterranean sites, where rubification is currently inactive. Therefore, the subsoil Bt horizons clearly point to ages equal or older than the last interglacial (MIS 5e, about 125–130 ka BP), i.e., ranging from Late to Middle Pleistocene times, at least. Conversely, the overlying brownish topsoil horizons, often separated by sharp lower boundaries, represent more recent soils which are not rubified and lack of illuvial clay coatings, therefore clearly indicating ages younger than ~100 ka. In addition, they display soil properties consistent with latest Pleistocene (glacial to late glacial) or Holocene climatic conditions, as recorded in several Italian soils postdating the last interglacial [112]. Among these are the following: (i) a brown pedogenic matrix due to accumulation of organic compounds, which are competitors against rubification [114] and thus permit a clear distinction from the underlying red paleosols; soil organic matter results from bacteria-mediated soil formation processes under a vegetation cover, which likely developed since the post-glacial, Holocene climate amelioration, given its surface (pedo)stratigraphic position, and also records recent to modern pedogenesis; (ii) secondary carbonate accumulations (observed in the Ak topsoils), which are caused by leaching and reprecipitation, but often do not occur along with clay coatings until decarbonation processes are advanced or alternate with clay illuviation under increasing seasonal contrast; they mostly denote dry and cold to subhumid climatic conditions, namely during proper glacial phases [112].
The similarity of most macro- and micromorphological pedogenic features and chemical-physical data does not show a clear trend of soil development from higher (and older) to lower (and younger) terraces. On the other hand, the overall similar soil features, characterizing the investigated soil profiles (soil/horizons depth, degree of preservation/degeneration of clay pedofeatures, absence/presence of primary and secondary carbonates) may suggest a possible displacement of an originally unique terrace by fault activity. The polygenetic nature of the soils due to a long time of exposure to pedogenesis, together with erosive processes, that alternated to soil formation processes and truncated the soil profiles in different times, can explain these findings. Clear evidence of past and recent to modern erosion is recorded by: (i) the closeness of clay-illuviated subsoil horizons to the topographic surface, even including transitional topsoil horizons ABt, where accumulation of organic matter is superimposed to a typical argic horizon, (ii) their sharp/irregular boundaries towards the overlying topsoils, and (iii) the shallow depth of the latter, all of them expressed to a different extent.
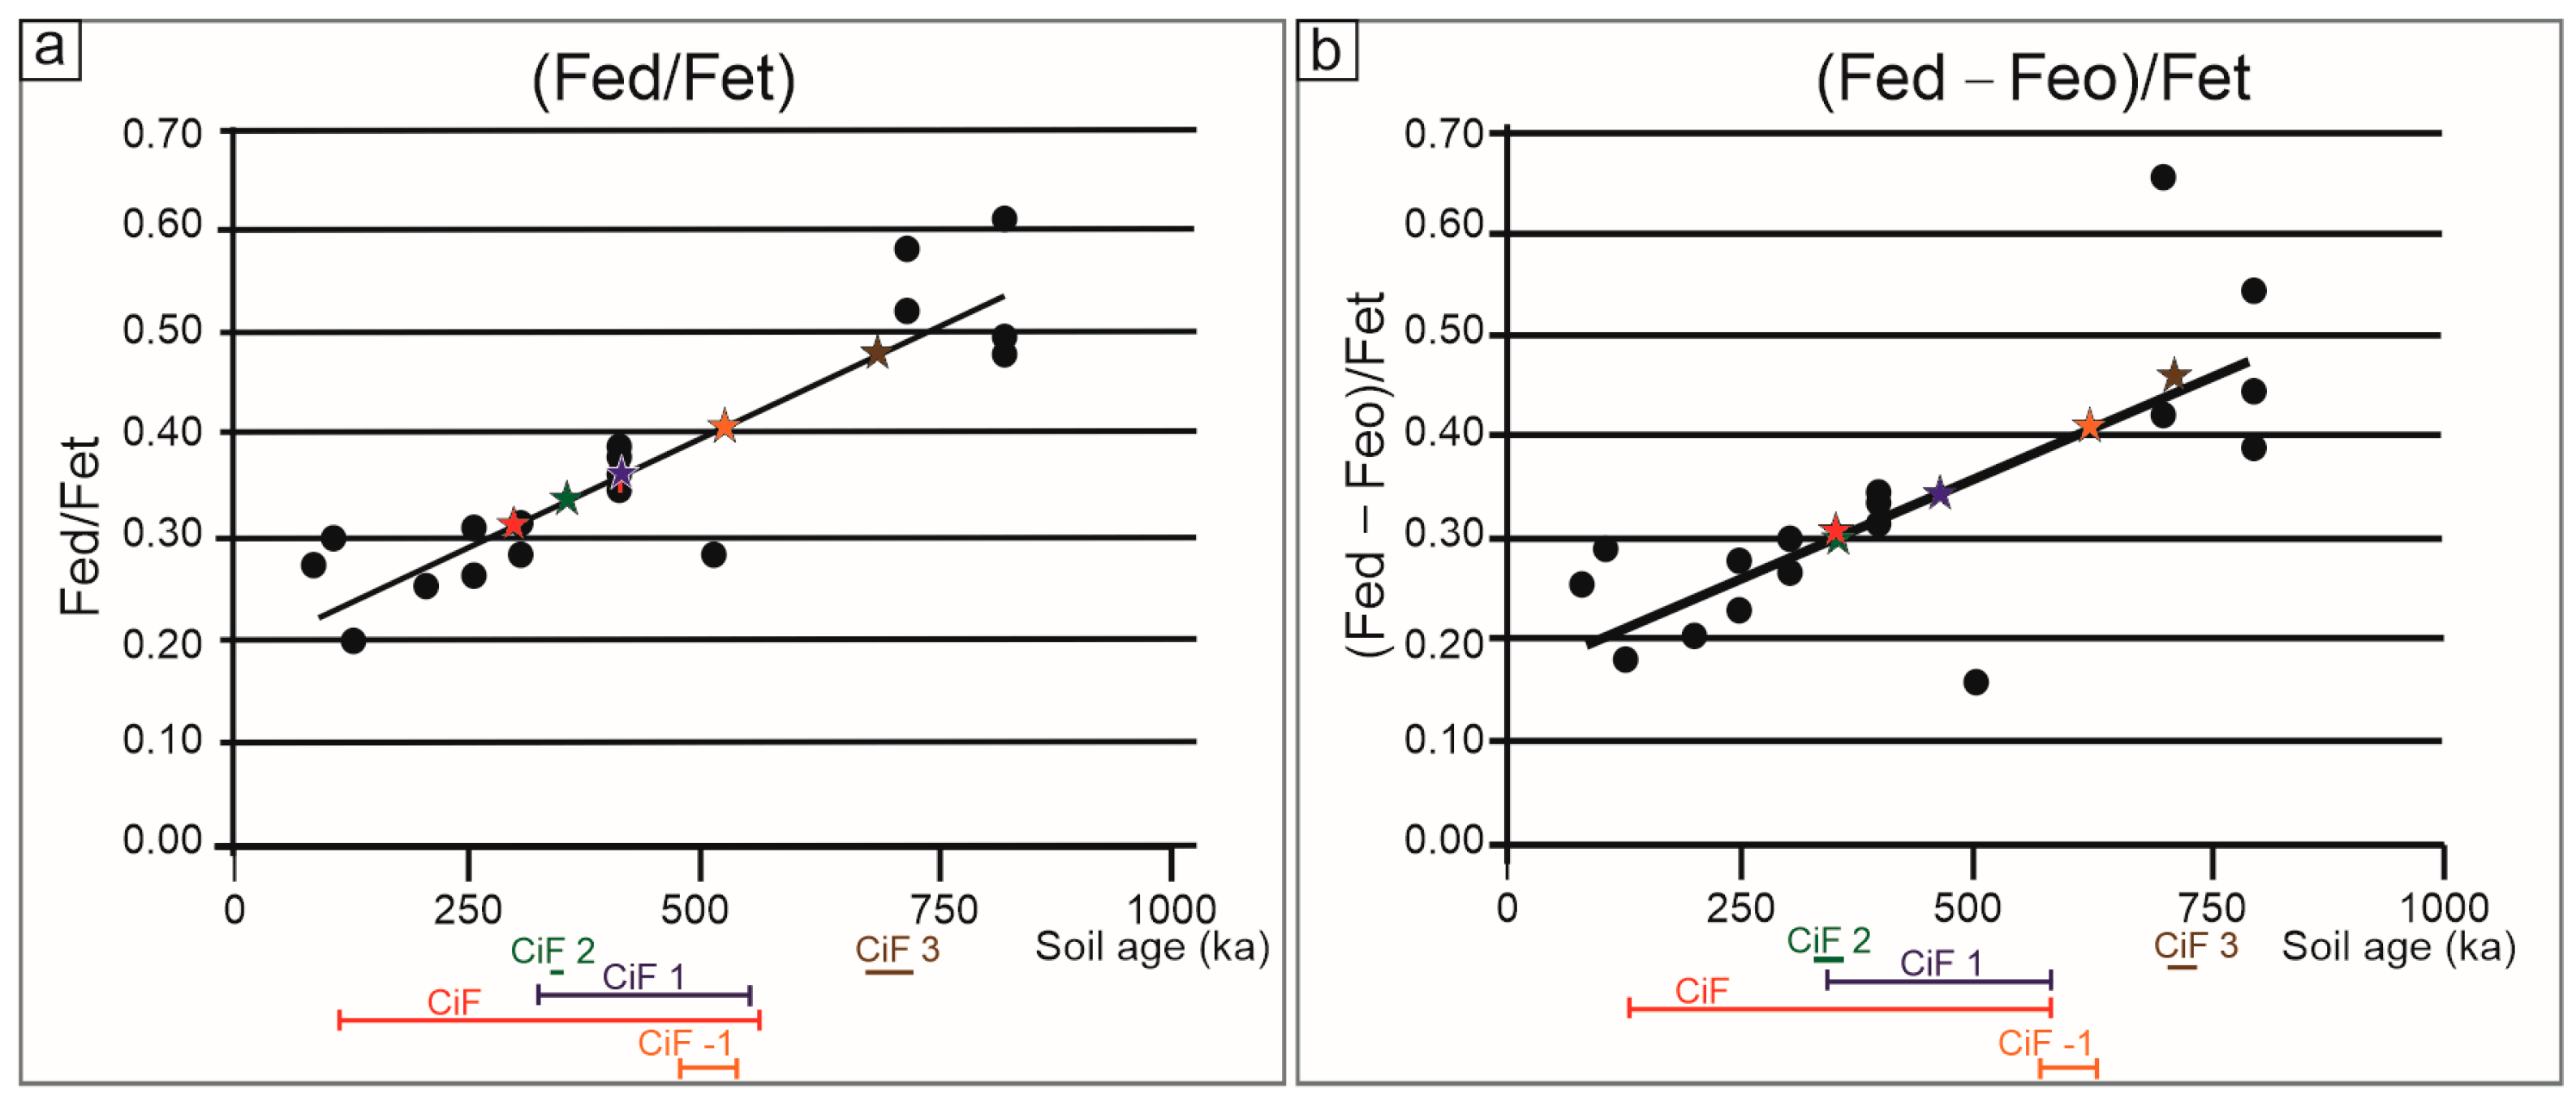
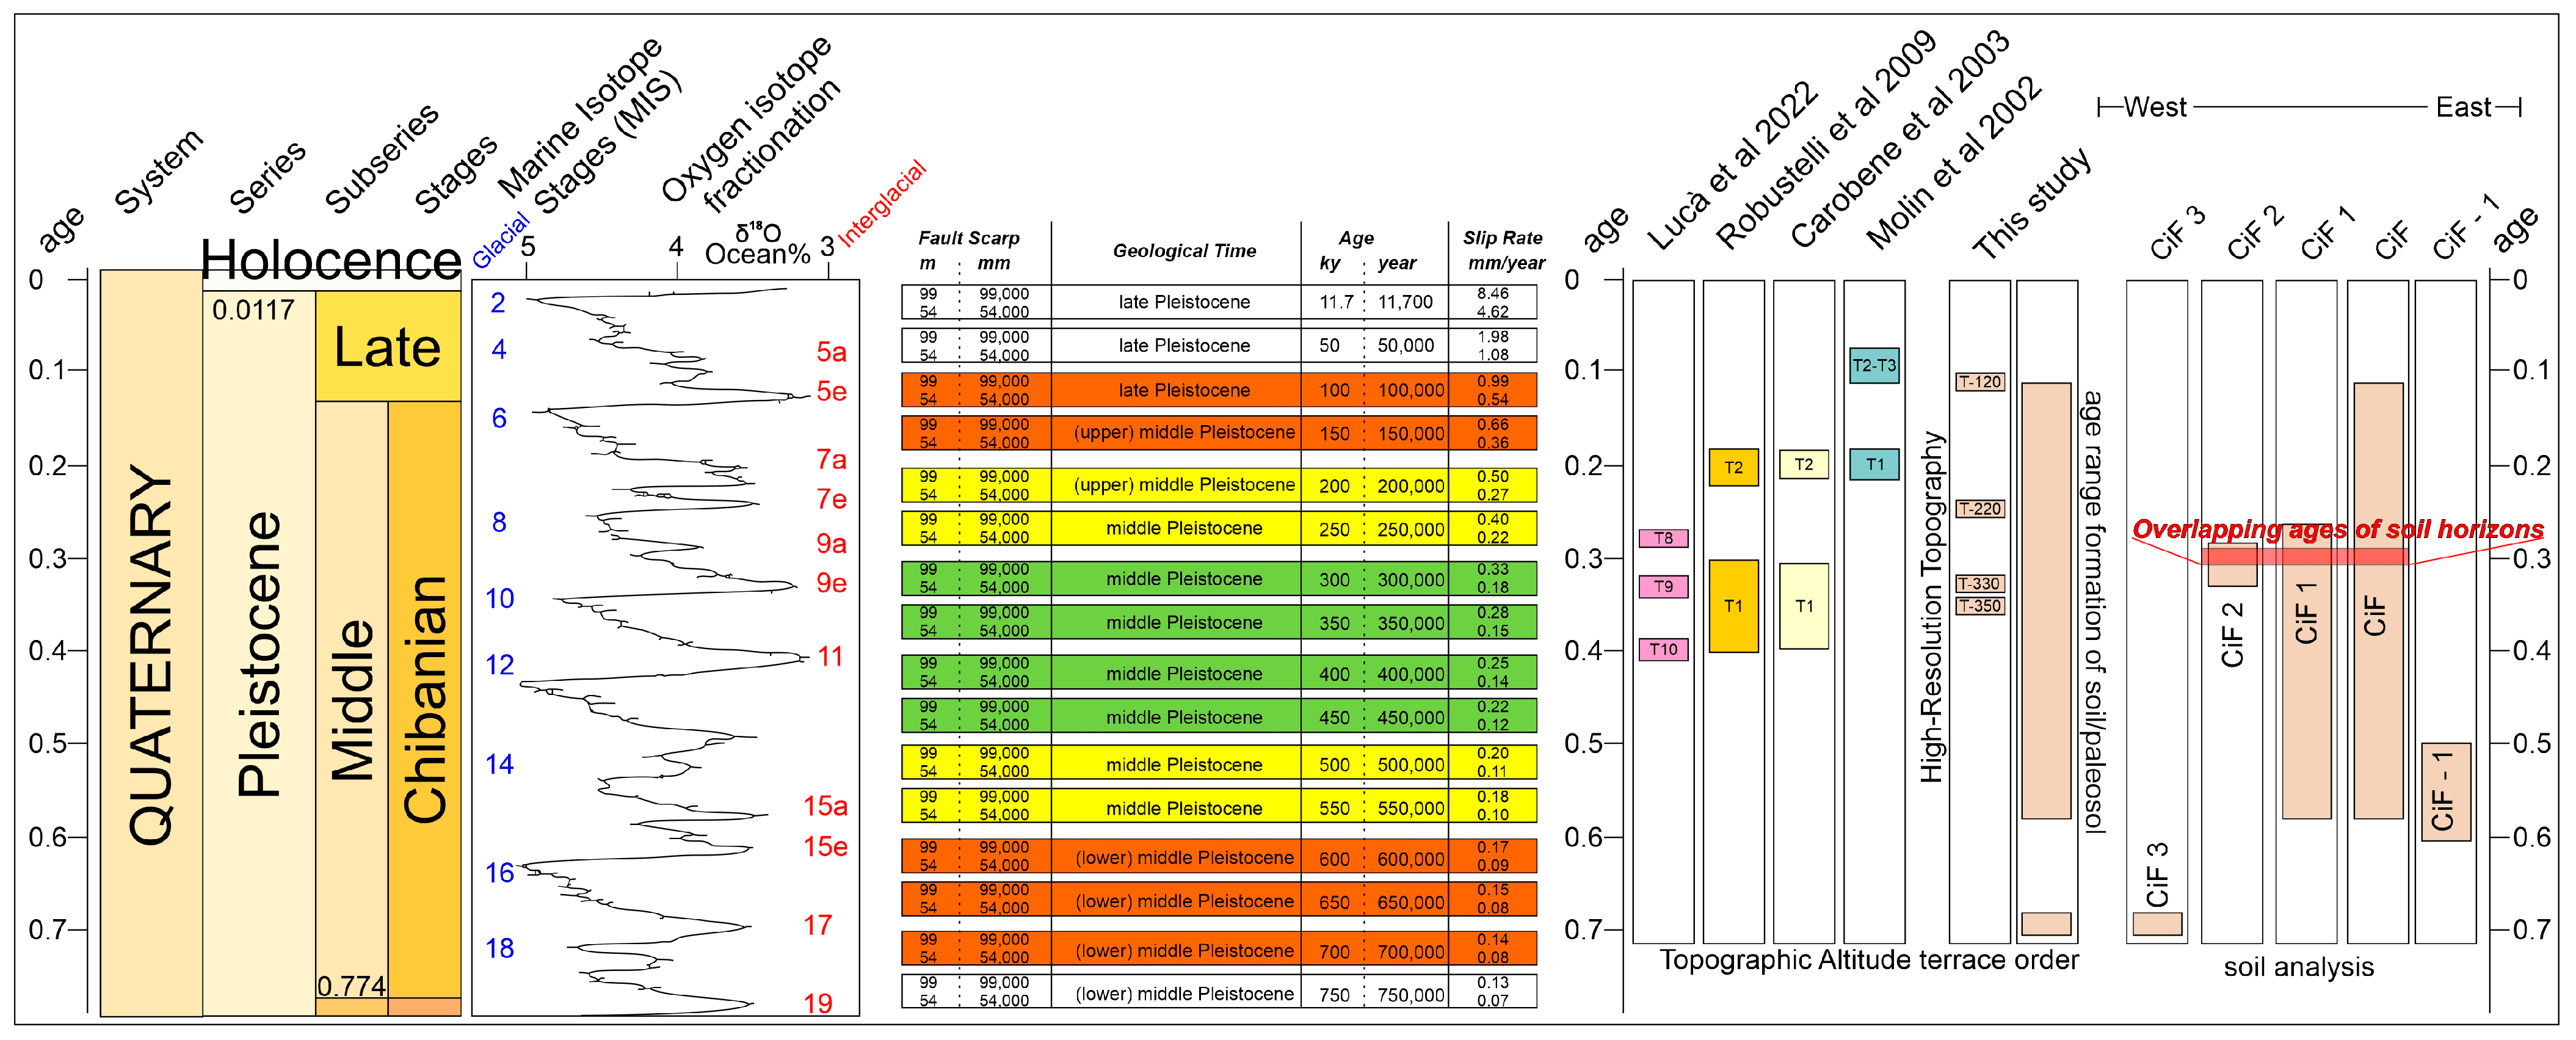
Nonetheless, chronostratigraphic information obtained from pedogenic iron forms of the soils and paleosols provided additional constraints for an approximate dating of the terraced surfaces. The measured Fe-based pedogenic indices were compared with those obtained from three Pleistocene soil chronosequences (genetically related sequences of soils with different ages, where time plays a major role in respect of the other soil forming factors) located at similar latitude in the west and east coast of Calabria [89]. In particular, we plotted the values of the mean weighted ratios Fed/Fet and (Fed−Feo)/Fet calculated for our soil profiles on the regression lines from binary diagrams where the aforementioned authors correlated such pedogenic indices with soil ages, thus estimating the corresponding ages of our soils (Figure 12).
The comparison of the single values of the pedogenic index (Fed−Feo)/Fet for each soil horizon, ranging from 0.22 and 0.47, suggest soil ages comparable from about 100 to 700 ka, with uncertainties in the range of a few thousand to hundred thousand years (marked by colored bars in Figure 12). In particular, on the higher terraces at 350 m and 320 m a.s.l., the pedogenetic iron index of CiF3, CiF2, and CiF1 ranges between 0.30 and 0.47, suggesting an age of approximately 700 to 280 ka, consistent with an attribution to the Middle Pleistocene (MIS 11–9).
On the 260 m terrace, the pedogenetic iron index of CiF ranges between 0.22 and 0.41, indicating an age between ~550 and ~125–130 ka, corresponding to MIS 15a to MIS 5e.
Nevertheless, most of the samples from the soil horizons overlap at around 300 ka (Figure 12, Figure 13 and Figure 14), in accordance with MIS documented by Cucci [98], Santoro Et Al. [99] Lucà et al. [93], and Alfonsi et al. [100], thus suggesting this age as the most reliable.
Field evidence of erosion and soil reworking recorded in the studied soil profiles may affect the estimate of their degree of pedogenic development and may thus potentially lead to underestimating their ages. However, it is worth mentioning that our soils still preserve a reliable record of their major soil formation processes, some of them better detected at the microscale in thin sections. This permits us to fix some rough constraints in terms of interglacials or other (paleo)climatic conditions, which are consistent with an approximate chronology discussed above.
Indeed, the two weighted pedogenic-iron indices improve the accuracy obtained from those measured in individual horizons, providing a low standard deviation always ≤0.03 for soil profiles CiF2, CiF3 and CiF-1, which correspond to estimated age errors between about ±20 and ±60 ka. In contrast, soil profiles CiF1 and CiF displayed errors of ±0.05/±0.06 and ±0.12/±0.11, leading to age ranges of ±250 ka and ±130 ka, respectively. Soil properties combined with soil thickness (using weighted means) is a well-established approach designed for quantifying the degree of soil profile development, especially applied to soil chronosequences [115,116]. Moreover, the weighted pedogenic-Fe indices intrinsically minimize the effects of erosive and reworking processes [89,91]. In fact, they recalculate a unique value after taking into account the different weight that each horizon has within the entire soil profile, based on the actual thickness of each horizon and the total thickness of the profile itself (see Section 3.5). Soils affected by erosion are rejuvenated and thus deprived of their initially upper horizon(s), possibly most organic-rich: A topsoils and/or eluvial, leached and depleted E horizons, which are respectively shallow and completely lacking in our soil profiles. These types of pedogenic horizons have poor Fed content, because the crystallinity of iron commonly increases in (typically deeper) subsoil B horizons, where Fe-oxides accumulate as far as their degree of development progresses. In contrast, it rather decreases in organic matter bearing or in leached horizons, which have conversely high Feo content, due to an increase in the amorphous Fe pool or simple removal of iron. Therefore, we can expect that, even assuming severe erosion, the ratios between the aliquots of different pedogenic iron forms lost by truncation of some soil horizons (or part of them), would not affect significantly the Fe-based weathering indices. The high coefficients of determination of the linear regression models obtained for these indices by Scarciglia Et Al. [89], even with soils affected by erosion processes, strongly support this issue. This can be explained by the fact that the soil properties Fed/Fet and (Fed-Feo)/Fet used by these authors for age correlations among different chronosequences show systematic trends that appear substantially independent of other soil forming factors, such as parent material and climate [115,116].
Scarciglia Et Al. [89] also showed that in their study areas (and likely in our study area that is substantially close in-between those) the rates of soil development did not change significantly over about 100 to 800 ka, despite the alternation of Quaternary climate conditions. What is more, the regression equations provided by these authors were calculated for soil profiles displaying major pedogenic features similar to ours (rubification and clay illuviation). On such bases, by comparing mean values (stars in Figure 12b) for our weighted Fe indices with the regression models obtained by Scarciglia Et Al. [89] (where terrace staircase and associated soil ages rely on morphostratigraphic and biocronological constraints, radiometric dating, and correlations to MIS with surrounding study areas), more appropriate and reliable interpretations can be drawn. It is relevant to remark that individual values of the indices Fed/Fet and (Fed− Feo)/Fet obtained for each pedogenic horizon cannot be used to estimate approximate ages of the corresponding entire soil profiles, because the soil profile consists of an assemblage of different horizons evolving over time as a whole interconnected body, where mass fluxes occur throughout it. Similarly, varying values of such ratios within any single soil profile cannot correspond tout court to different ages of the corresponding pedogenic horizons. Correlation of pedogenic-Fe development indices with soils of known ages must be tested for the entire soil profiles, and one of the simplest way is weighting their properties with reference to horizon thickness and total soil depth [115,116], as shown above. Three out of five soil profiles overlap in a shorter time interval around 300 ka, apart from CiF-1 and CiF3 that point to ca. 500–600 ka and 700 ka. Therefore, an age close to 300 ka appears the most likely, despite the error ranges, and is consistent with data from adjacent areas available in the literature, as discussed above (see this section and Section 5.1). Nonetheless, we cannot completely rule out older ages for the investigated soils. The oldest age of ~700 ka may be explained by the greatest depth of soil profile CiF3. The apparently contrasting age of 500–600 ka of soil profile CiF-1, located at the lowest elevation, could be related to an ageing process caused by a higher amount of soil sediments eroded from all the terraces at higher elevations. However, the presence of terraces at elevations of around 350 m in several neighboring areas, dated and correlated by other authors to approximately 300–450 ka, strongly supports that the most probable age for this surface is consistent with those correlations. This interpretation is further reinforced by the terrace order relationships observed in adjacent areas (see Section 5.1).
These results support its attribution to a time interval within the Middle Pleistocene. The eastern edge of this surface is bounded by a system of dip-slip faults exhibiting extensional kinematics, which caused an evident eastward displacement. Similar soil/paleosol profiles on the hanging wall and footwall support the hypothesis that these surfaces were originally part of a single depositional unit, later displaced by fault movement.
Although there is some uncertainty in the use of pedogenic Fe-based soil development indices, this simple, cheap and relatively fast method can be used when any other age control is lacking, including numerical dating by radiometric analyses, which are conversely expensive and time-consuming. This is one of the key points of using soil chronosequences for estimation of surface ages and potential correlations [117,118]. In any case, our results show that they can give approximate ages of soils and associated landforms, which allow the proposal of different scenarios with different potential ages, different slip rates and corresponding different seismotectonic implications (see next sections). Moreover, we remark that our hypotheses do not rely only on the indices at issue, but are consistent with the major pedogenic features and related soil-formation processes that point to certain (paleo)climate conditions constrained to specific time intervals (especially predating and postdating the last interglacial), and clearly separate paleosols form recent soils. The estimated soil ages are in turn corroborated by chronological constraints available in scientific literature for analogous terraces from different adjacent study areas, with which they correlate (see above).

5.3. Fault Activity and Slip Rate Estimation

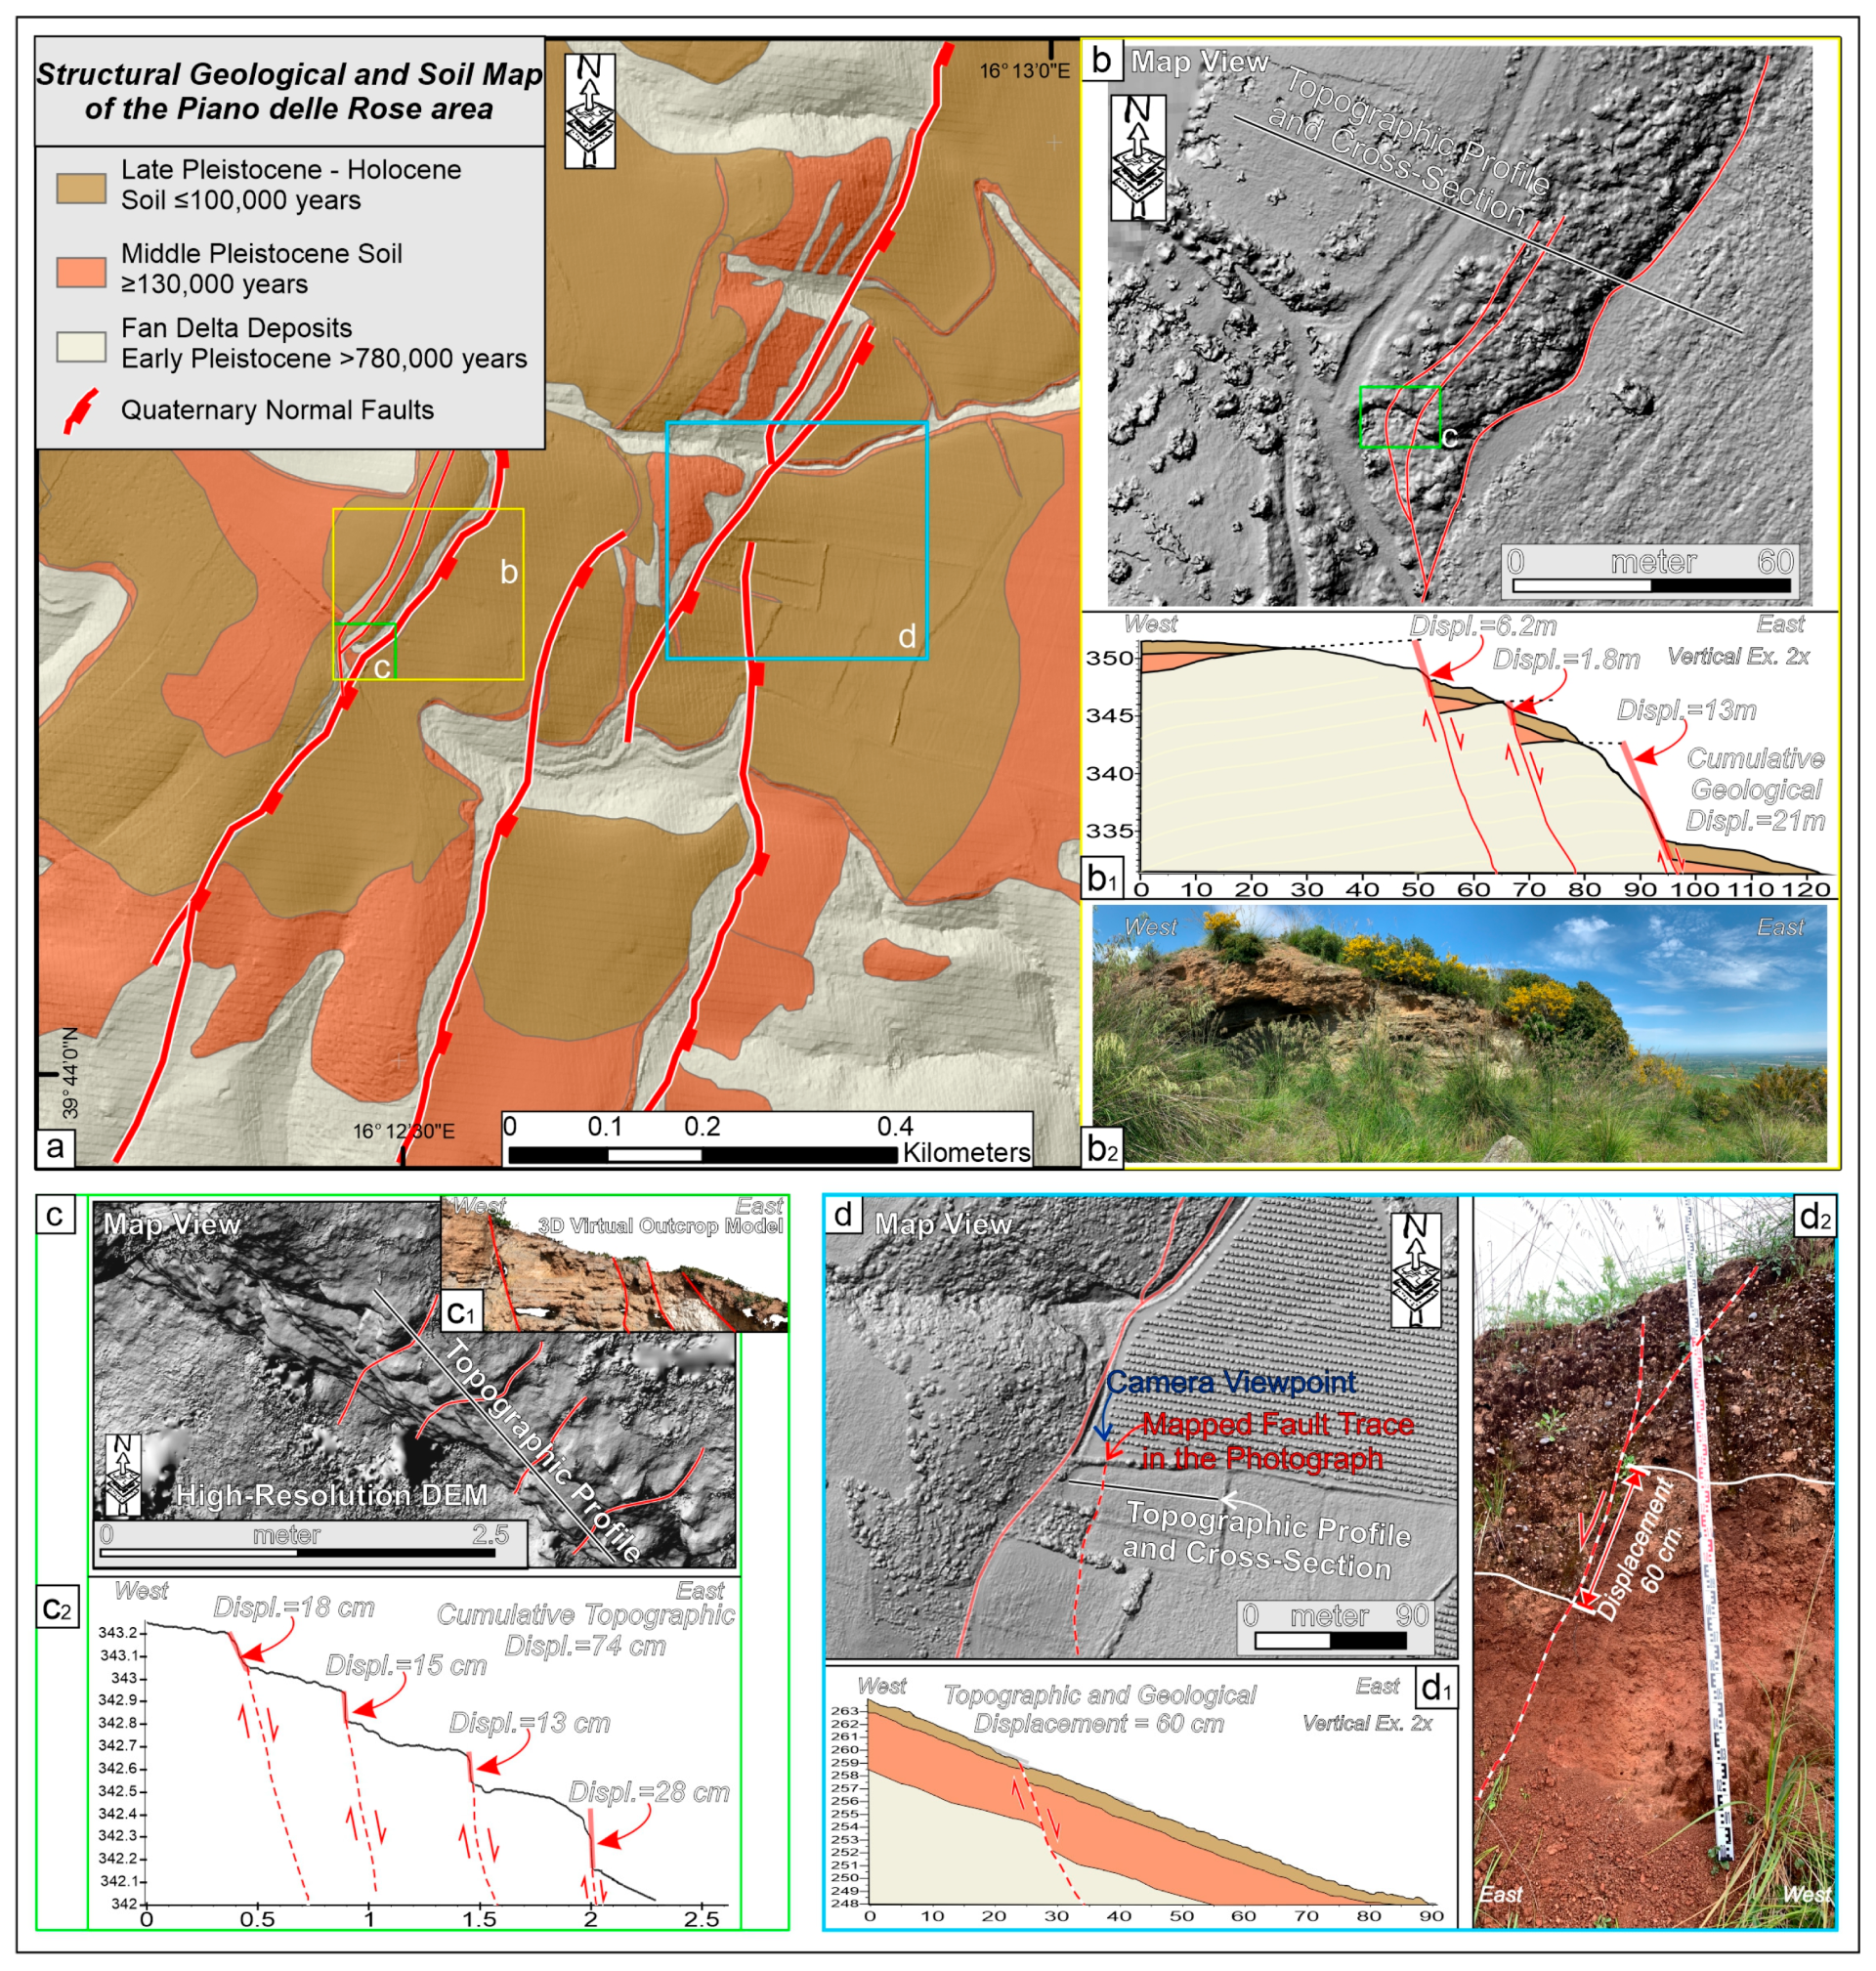
The Structural Geological and Soil Map (Figure 13a) was reconstructed to determine the magnitude of both long-term and late Quaternary displacements along the studied faults. The map shows the distribution of two main pedogenetic units: the lower unit, attributed to the Middle Pleistocene (≥130,000 and <780,000 years), and the upper unit, referred to the Late Pleistocene–Holocene (≤100,000 years, see Section 5.2), both overlying a Lower Pleistocene fan-delta sequence (Calabrian >780,000 years).
The area highlighted by the yellow box was investigated in greater detail using UAV-based microtopographic analysis to generate displacement profiles orthogonal to the mapped structures (Figure 13b,b1 geological section). The results indicate that the cumulative geological displacement affecting the upper unit reaches 21 m (the details of measurements on individual splays are reported in Figure 13c). This value is obtained by summing the offsets across the three synthetic splays of the fault.
Finally, the analysis presented in Figure 13d highlights a subtle topographic warp of approximately 60 cm across the easternmost fault. Despite the relatively low amplitude of the deformation, it was reliably detected by our methodology. At the same location, the upper pedogenetic unit shows a vertical offset of about 60 cm (Figure 13(d1,d2)), consistent with the measured topographic scarp. This evidence suggests very recent activity of this structure, as neither ongoing morphogenetic processes nor recent anthropogenic modifications have regraded the topographic profile, affected by faulting, during recent times.
Two key outcrops showing the most recent tectonic activity were analyzed to estimate slip rates and search evidence of surface faulting. These outcrops displace the youngest soil units, providing critical evidence of ongoing faulting.
The first outcrop, illustrated in Figure 9b and Figure 13a–c, displays a cumulative displacement of 21 m. Assuming two different temporal constraints, the associated long-term slip rates are calculated as follows: for a time interval of 100,000 years, the slip rate is approximately 0.21 mm/yr, while for a shorter interval of ~20,000 years (average LGM age in southern Italy), it increases to about 1.05 mm/yr. The variability reflects the uncertainty in the precise timing of displacement, but both estimates indicate significant tectonic activity during the Late Quaternary, consistent with the deformation observed in the upper pedogenetic units and topographic scarps documented in the high-resolution UAV data.
The second outcrop, shown in Figure 10d and Figure 13a,d, records a smaller displacement of 0.6 m. which is only a small fraction of the whole Late Quaternary offset. However, this evidence, besides confirming the activity of the fault on very recent times, suggests that it is potentially a capable fault, i.e., susceptible of causing coseismic rupturing at least during the associated strongest earthquakes.
Regarding the overall structure, the displacement measured along the main scarps of the Piano delle Rose Fault ranges between a minimum of 54 m and a maximum of 99 m. This deformation affects Middle Pleistocene terraces, indicating persistent tectonic activity over long timescales. Average slip rates were estimated using both the minimum and maximum displacement values and considering different potential initiation ages of fault activity, ranging in a interval geological time from 450 to 350–300 ka.
The observed displacement may have occurred through episodic slip events rather than continuous motion, which could affect the interpretation of the long-term slip rates. Considering the highest topographic surface of the study area at 350 m a.s.l. and assuming an older initiation age of fault activity around 450 ka (cf. [93]), the calculated long-term slip rate is ~0.22 mm/yr for the displacement of 99 m and ~0.12 mm/yr considering 54 m. Using a more conservative age of 300 ka, which is common to all the studied soil profiles, the slip rate increases to ~0.33 mm/yr for 99 m and ~0.18 mm/yr for 54 m. These values are consistent with long-term slip rates documented for active faults in the central and southern Apennines [119]. Additional slip-rate calculations were performed considering different geological periods of potential fault activation, and all results are summarized in Figure 14.

5.4. Seismotectonic Implications

The concept of fault activity is fundamentally linked to the cumulative displacement produced during the current seismotectonic regime and the probability of future movement. However, no universally accepted chronological threshold exists for defining when a fault should be considered active, as recurrence intervals vary widely among tectonic settings.
Several authors and institutions have proposed different temporal criteria. Early works [120,121] associated fault activity with displacement occurring under the present stress regime. Muir Wood and Mallard [122] emphasized that activity should be defined based on recurrence intervals and knowledge of the prevailing stress field, rather than arbitrary temporal windows.
For seismic hazard assessment, Boschi Et Al. [123] proposed a practical criterion: faults that have moved during the Late Pleistocene (last 125 ka) and are capable of generating major earthquakes should be considered active. In slowly deforming regions, longer intervals are adopted. The WSSPC [124] classifies faults as Holocene (<10 ka), Late Quaternary (<130 ka), or Quaternary (<1.6–1.8 Ma), recognizing that long recurrence times necessitate including older structures. Similarly, NRC [125] and Machette [126] recommend considering faults that record repeated deformation within the last 500 ka or that encompass several earthquake cycles.
More recent guidelines, such as those from the IAEA [127], distinguish between interplate and intraplate settings, using shorter (Upper Pleistocene–Holocene) and longer (Pliocene–Quaternary) reference intervals, respectively. In central Italy, the present extensional regime is thought to have been active since the Middle Quaternary (~700 ka [128]), and faults with displacement within this period are generally classified as active. Lavecchia Et Al. [12,129] further argue that, in regions such as Italy, structural data for seismogenic purposes can be meaningfully extended to the entire Quaternary (last 2.58 Ma), as long-term slip data are crucial to constraining present-day deformation patterns and the regional stress field.
In the Calabria region, normal faults within the Italian extensional domain [41] suggest that the present tectonic regime has been active since the beginning of the Middle Pleistocene [5]. Furthermore, the faults in the Calabrian region are considered active and capable if they exhibit evidence of movement during the last 800 ka, unless they are overlain by deposits younger than the Last Glacial Maximum [130].
Furthermore, the definitions and classifications of active faults differ among countries and regions according to their tectonic setting and practical applications, as comprehensively reviewed by Zhonghai Wu and Mengmeng Hu [131].
The slip rates that we calculated for the Piano delle Rose Fault suggest that it is an active Quaternary tectonic structure with a significant seismotectonic potential.
Our data suggest that the fault was definitively active during the late Middle Pleistocene and at the beginning of Late Pleistocene, as indicated by the displacement of soils attributed to MIS 5. Although direct constraints on more recent time intervals are lacking, fault activity during the Holocene can be reasonably hypothesized. In fact, recent soils (brownish in color and lacking rubification; see Section 5.2) are affected by faulting, with clear evidence of these displacements shown in Figure 9b and Figure 10d. In Figure 9b, a colluvial wedge of recent soils is visibly thickened against the fault plane, and the associated fault scarp is well preserved, clearly offsetting the present-day topography. In contrast, Figure 10d displays a fault-related displacement within the Ak horizon, which also shows local thickening along the fault despite the fault scarp is no longer preserved at the surface, likely due to erosion and/or anthropogenic levelling. These features collectively provide compelling evidence of tectonic activity during the Late Quaternary.
The Piano delle Rose fault is located in an area flanked to the north and south by Quaternary active normal faults that have historically produced strong earthquakes with magnitudes ranging between 5 and 7 (Figure 1c). This structural setting suggests that the Piano delle Rose fault may also be active. However, no significant earthquakes have been recorded along this fault over the last 1000 years, as historical sources do not document major seismic events in its immediate vicinity. It is noteworthy that Calabria, within the Italian peninsula, is the region with the highest seismic hazard, emphasizing the importance of understanding the activity of all local faults, including those without recent historical seismicity.
Given the fault’s length, geometry, and slip rate, it could be capable of generating moderate to strong earthquakes. The presence of Middle Pleistocene terraces displaced by this fault further provides evidence of a long history of tectonic activity, which may still be ongoing.
Considering the entire length of the Piano delle Rose Fault, which extends for approximately 16 km, and assuming a seismic rupture along its full extent, we can estimate the expected earthquake magnitude for this extensional fault system. The calculations are based on established empirical scaling relationships that relate fault dimensions to earthquake magnitude in extensional tectonic settings. In particular, we selected the empirical laws which use fault rupture length, displacement, and geometry to predict moment magnitude (Mw). Using established empirical scaling relationships from Wells and Coppersmith [132], Wesnousky [133], and Stirling Et Al. [134], the estimated moment magnitudes (Mw) are Mw 6.48, Mw 6.69, and Mw 6.84, respectively (Table 5).
The final geomorphological interpretation, illustrated in Figure 15a, reveals significant vertical displacement of marine-fluvial terraces at distinct elevations, specifically between 350–320 m and 260–220 m a.s.l., caused by tectonic activity along the Piano delle Rose Fault. This fault generates prominent fault scarps, with the highest displacements observed in the studied sector. Although the terrace arrangement appears complex due to repeated offset, the observed deformation can be attributed to a single fault system, the Piano delle Rose Fault.
Notably, the presence of a three-terrace order in the central portion of the study area does not indicate three separate depositional or erosional events. Instead, the intermediate terraces are interpreted as plains belonging to the same original geomorphological surface that has been differentially displaced across a relay ramp zone, a result of fault branching in this specific location.
The oldest terrace surface, which formed around interval time ranging from 450 to 300 ka ago, represents the pre-deformation geomorphic state (Figure 15a). Based on the cumulative displacement of about 99 m affecting this surface, a maximum and minimum slip rate from 0.22 to 0.33 mm/yr (99 m) and from 0.12 to 0.18 mm/yr (54 m) have been calculated for the Piano delle Rose Fault. These rates are conservative estimates and the real values may actually be higher.
If the lower terrace level, observed at 160–120 m, a.s.l. is considered to be tectonically displaced by the same fault system, this would suggest a significantly greater cumulative displacement offset. As a result, the estimated slip rate would increase. This possibility raises the important question of whether the lowest terrace is also linked to the activity of the Piano delle Rose Fault as well. Clarifying this association would provide further insights into the fault’s long-term slip history and seismic potential.
The current landscape configuration, illustrated in the final Figure 15, is the result of a cumulative fault activity that has progressively reshaped the area.
The 3D sketch reconstruction of the depositional and tectonic evolution of the study area (Figure 15b) provides a chronological framework for understanding the interplay between sedimentation, soil development, and tectonic activity from the Middle Pleistocene to the present. Six main evolutionary phases have been identified.
Phase (1) documents the deposition and progradation of the fan-delta system, which constitutes the pre-tectonic stratigraphic framework of the area.
Phase (2) marks the onset of pedogenesis and the development of the lower pedogenetic unit between ~700 and 450 ka, representing the first major subaerial exposure event preserved in the stratigraphic record.
Phase (3) corresponds to the first tectonic events affecting the pedogenetic lower units, dated to 450–300 ka. These displacements represent the earliest evidence of Quaternary extensional faulting.
During Phase (4), additional fault splays were activated, displacing the lower units soils and producing cumulative offsets between 300 and 130 ka. These tectonic phases were accompanied by localized erosion events, which partially removed the stratigraphic record and contributed to the present-day complexity of the fault scarps and sedimentary contacts.
Phase (5) is characterized by the formation of the upper pedogenetic unit, which represents the youngest preserved soil horizon in the area. Although its age is <100 ka, its formation may be even more recent. The displacement of this unit by the main faults and its synthetic splays provides compelling evidence for Late Quaternary activity, confirming that the fault system remained active after its deposition.
Finally, Phase (6) represents the present-day configuration, characterized by well-preserved scarps and cumulative displacements that are clearly documented through high-resolution UAV-based topography and field-based structural analysis.
This evolutionary reconstruction demonstrates the persistence of tectonic activity throughout the Quaternary, with surface-faulting events that progressively shaped the landscape. The convergence of geomorphological, pedological, and structural evidence supports the interpretation of a long-lived, still-active fault system with significant implications for seismic hazard assessment in this sector of northern Calabria.

6. Conclusions

This study provides a comprehensive analysis and characterization of fault systems in a sector of northern Calabria through a multidisciplinary approach. The integration of structural geology, pedology, and geomatic techniques, including UAV-based surveys and GIS analyses, allowed for the chronological assessment of previously undocumented and poorly investigated terraced surfaces. For the first time, pedogenic iron indices and field morphological soil features were successfully combined with traditional geoscientific methods to estimate the relative ages of fault-displaced surfaces, enabling the reconstruction of the onset of Quaternary extensional tectonics, which is here constrained to a period of ~450 to 350–300 ka.
The data collected have refined the mapping of fault structures previously identified by Brozzetti et al. [5], improving the understanding of fault kinematics, timing of surface displacements, and long-term slip rates. Considering age constraints between 450 to 300 ka, the long-term slip rates for the investigated fault are estimated to range between ~0.12 ± 0.03 mm/yr and ~0.33 ± 0.05 mm/yr, providing robust quantitative parameters for assessing its seismogenic potential. These results highlight how chronological uncertainty directly affects the estimated fault activity rates: adopting an older age, slightly lower slip rate values are obtained, without excluding significant seismogenic potential. The key outcrops offer the strongest evidence of recent tectonic activity, displacing the youngest soil units and unequivocally confirming surface faulting. An outcrop documents a cumulative displacement of 21 m, yielding slip rates between ~0.21 mm/yr (100 ka) and ~1.05 mm/yr (~20 ka LGM). The other outcrop preserves a 0.6 m offset of very recent deposits, further attesting very recent fault motion and suggesting that the structure can generate surface-rupturing earthquakes.
Empirical relationships, which relate surface rupture length and magnitude, suggest that such a fault could generate events with magnitudes ranging between 6.4 and 6.8, potentially contributing to closing the seismic gap of northern Calabria.
The methodological framework adopted here, combining the use of soil development indices, structural-geomorphological observations, and geomatic data, represents a cost-effective and replicable approach that can be applied to other tectonically active regions worldwide, thus contributing to more robust geological knowledge and seismic hazard assessment.

Author Contributions

Conceptualization, D.C. and A.C.T.; methodology, D.C., A.C.T., F.S. and F.B.; software, D.C. and A.C.T.; validation, D.C., A.C.T., F.S. and F.B.; formal analysis, D.C. and A.C.T.; investigation, D.C. and A.C.T.; resources, F.S., F.B. and G.L.; data curation, D.C., A.C.T., F.S. and F.B.; writing—original draft preparation, D.C. and A.C.T.; writing—review and editing, F.S., F.B. and G.L.; visualization, D.C., A.C.T., F.S., F.B. and G.L.; supervision, F.S. and F.B.; project administration, G.L.; funding acquisition, G.L. All authors have read and agreed to the published version of the manuscript.

Funding

This research was funded by PRIN 2017 (grant number 2017KT2MKE) of the Italian Ministry of Education, University and Research (Ministero dell’Università e della Ricerca), granted to the principal investigator Giusy Lavecchia, at the Università degli Studi "G. d’Annunzio" Chieti-Pescara.

Data Availability Statement

Data are contained within the article. UAV high-resolution image data are available upon request from the corresponding authors.

Acknowledgments

The authors thank Topodrone Company for generously providing us with the Topodrone PPK Post Processing software and a perpetual license. The authors thank the University of Chieti-Pescara for providing the license of ESRI’s ArcGIS Pro software. The authors are also grateful to L. Marinangeli, for the use of the laboratory for soil analyses. The authors would like to sincerely thank the three anonymous reviewers for their constructive comments and valuable suggestions, which significantly helped in improving the quality and clarity of this manuscript.

Conflicts of Interest

The authors declare no conflicts of interest.

References

  1. Casula, G. Geodynamics of the Calabrian Arc area (Italy) inferred from a dense GNSS network observations. Geod. Geodyn. 2016, 7, 76–86. [Google Scholar] [CrossRef]
  2. Faccenna, C.; Becker, T.W.; Lucente, F.P.; Jolivet, L.; Rossetti, F. History of subduction and back-arc extension in the Central Mediterranean. Geophys. J. Int. 2001, 145, 809–820. [Google Scholar] [CrossRef]
  3. Filice, F.; Seeber, L. The Culmination of an Oblique Time-Transgressive Arc Continent Collision: The Pollino Massif Between Calabria and the Southern Apennines, Italy. Tectonics 2019, 38, 3261–3280. [Google Scholar] [CrossRef]
  4. Brozzetti, F.; Cirillo, D.; de Nardis, R.; Cardinali, M.; Lavecchia, G.; Orecchio, B.; Presti, D.; Totaro, C. Newly identified active faults in the Pollino seismic gap, southern Italy, and their seismotectonic significance. J. Struct. Geol. 2017, 94, 13–31. [Google Scholar] [CrossRef]
  5. Brozzetti, F.; Cirillo, D.; Liberi, F.; Piluso, E.; Faraca, E.; De Nardis, R.; Lavecchia, G. Structural style of Quaternary extension in the Crati Valley (Calabrian Arc): Evidence in support of an east-dipping detachment fault. Ital. J. Geosci. 2017, 136, 434–453. [Google Scholar] [CrossRef]
  6. Tortorici, L.; Monaco, C.; Tansi, C.; Cocina, O. Recent and active tectonics in the Calabrian arc (Southern Italy). Tectonophysics 1995, 243, 37–55. [Google Scholar] [CrossRef]
  7. Tansi, C.; Iovine, G.; Folino Gallo, M. Tettonica attiva e recente, e manifestazioni gravitative profonde, lungo il bordo orientale del graben del Fiume Crati (Calabria settentrionale). Boll. Soc. Geol. It. 2005, 124, 563–578. [Google Scholar]
  8. Tansi, C.; Tallarico, A.; Iovine, G.; Folino Gallo, M.; Falcone, G. Interpretation of radon anomalies in seismotectonic and tectonic-gravitational settings: The south-eastern Crati graben (Northern Calabria, Italy). Tectonophysics 2005, 396, 181–193. [Google Scholar] [CrossRef]
  9. Tansi, C.; Muto, F.; Critelli, S.; Iovine, G. Neogene-Quaternary strike-slip tectonics in the central Calabrian Arc (southern Italy). J. Geodyn. 2007, 43, 393–414. [Google Scholar] [CrossRef]
  10. Spina, V.; Tondi, E.; Galli, P.; Mazzoli, S. Fault propagation in a seismic gap area (northern Calabria, Italy): Implications for seismic hazard. Tectonophysics 2009, 476, 357–369. [Google Scholar] [CrossRef]
  11. Meschis, M.; Teza, G.; Serpelloni, E.; Elia, L.; Lattanzi, G.; Di Donato, M.; Castellaro, S. Refining Rates of Active Crustal Deformation in the Upper Plate of Subduction Zones, Implied by Geological and Geodetic Data: The E-Dipping West Crati Fault, Southern Italy. Remote Sens. 2022, 14, 5303. [Google Scholar] [CrossRef]
  12. Lavecchia, G.; Bello, S.; Andrenacci, C.; Cirillo, D.; Pietrolungo, F.; Talone, D.; Ferrarini, F.; de Nardis, R.; Galli, P.; Faure Walker, J.; et al. QUIN 2.0—New release of the QUaternary fault strain INdicators database from the Southern Apennines of Italy. Sci Data 2024, 11, 189. [Google Scholar] [CrossRef]
  13. Cirillo, D.; Totaro, C.; Lavecchia, G.; Orecchio, B.; de Nardis, R.; Presti, D.; Ferrarini, F.; Bello, S.; Brozzetti, F. Structural complexities and tectonic barriers controlling recent seismic activity in the Pollino area (Calabria–Lucania, southern Italy)—Constraints from stress inversion and 3D fault model building. Solid Earth 2022, 13, 205–228. [Google Scholar] [CrossRef]
  14. Galli, P.; Bosi, V. Catastrophic 1638 earthquakes in Calabria (southern Italy): New insights from paleoseismological investigation: Paleoseismology of Lakes Fault (1638 Earthquake, Italy). J. Geophys. Res. Solid Earth 2003, 108, ETG 1-1–ETG 1-20. [Google Scholar] [CrossRef]
  15. Galli, P.; Scionti, V. Two unknown M > 6 historical earthquakes revealed by palaeoseismological and archival researches in eastern Calabria (southern Italy). Seismotectonic implications. Terra Nova 2006, 18, 44–49. [Google Scholar] [CrossRef]
  16. Schiattarella, M. Quaternary tectonics of the Pollino Ridge, Calabria-Lucania boundary, southern Italy. Geol. Soc. Lond. Spec. Publ. 1998, 135, 341–354. [Google Scholar] [CrossRef]
  17. Ercoli, M.; Cirillo, D.; Pauselli, C.; Jol, H.M.; Brozzetti, F. Ground-penetrating radar signature of Quaternary faulting: A study from the Mt. Pollino region, southern Apennines, Italy. Solid Earth 2021, 12, 2573–2596. [Google Scholar] [CrossRef]
  18. Bello, S.; Perna, M.G.; Consalvo, A.; Brozzetti, F.; Galli, P.; Cirillo, D.; Andrenacci, C.; Tangari, A.C.; Carducci, A.; Menichetti, M.; et al. Coupling rare earth element analyses and high-resolution topography along fault scarps to investigate past earthquakes: A case study from the Southern Apennines (Italy). Geosphere 2023, 19, 1348–1371. [Google Scholar] [CrossRef]
  19. Boncio, P.; Auciello, E.; Amato, V.; Aucelli, P.; Petrosino, P.; Tangari, A.C.; Jicha, B.R. Late Quaternary faulting in the southern Matese (Italy): Implications for earthquake potential and slip rate variability in the southern Apennines. Solid Earth 2022, 13, 553–582. [Google Scholar] [CrossRef]
  20. Galli, P.A.C.; Peronace, E. Low slip rates and multimillennial return times for Mw 7 earthquake faults in southern Calabria (Italy). Geophys. Res. Lett. 2015, 42, 5258–5265. [Google Scholar] [CrossRef]
  21. Battistelli, M.; Ferrarini, F.; Bucci, F.; Santangelo, M.; Cardinali, M.; Boncori, J.P.M.; Cirillo, D.; Carafa, M.M.C.; Brozzetti, F. Bridging the Gap Between Active Faulting and Deformation Across Normal-Fault Systems in the Central-Southern Apennines (Italy): Multi-Scale and Multi-Source Data Analysis. Remote Sens. 2025, 17, 2491. [Google Scholar] [CrossRef]
  22. Galli, P. Recurrence times of central-southern Apennine faults (Italy): Hints from palaeoseismology. Terra Nova 2020, 32, 399–407. [Google Scholar] [CrossRef]
  23. Gilbert, G.K. Earthquake Forecasts Introduction. Science 1909, 29, 121–138. [Google Scholar] [CrossRef] [PubMed]
  24. Gupta, H.K. Himalayan Seismic Belt, Seismic Gaps and Related Issues. J. Geol. Soc. India 2023, 99, 1187–1190. [Google Scholar] [CrossRef]
  25. Napolitano, F.; Gabrielli, S.; De Siena, L.; Amoroso, O.; Capuano, P. Imaging overpressurised fracture networks and geological barriers hindering fluid migrations across a slow-deformation seismic gap. Sci. Rep. 2023, 13, 19680. [Google Scholar] [CrossRef]
  26. Totaro, C.; Presti, D.; Billi, A.; Gervasi, A.; Orecchio, B.; Guerra, I.; Neri, G. The Ongoing Seismic Sequence at the Pollino Mountains, Italy. Seismol. Res. Lett. 2013, 84, 955–962. [Google Scholar] [CrossRef]
  27. Passarelli, L.; Hainzl, S.; Cesca, S.; Maccaferri, F.; Mucciarelli, M.; Roessler, D.; Corbi, F.; Dahm, T.; Rivalta, E. Aseismic transient driving the swarm-like seismic sequence in the Pollino range, Southern Italy. Geophys. J. Int. 2015, 201, 1553–1567. [Google Scholar] [CrossRef]
  28. Napolitano, F.; Galluzzo, D.; Gervasi, A.; Scarpa, R.; La Rocca, M. Fault imaging at Mt Pollino (Italy) from relative location of microearthquakes. Geophys. J. Int. 2020, 224, 637–648. [Google Scholar] [CrossRef]
  29. Napolitano, F.; Amoroso, O.; La Rocca, M.; Gervasi, A.; Gabrielli, S.; Capuano, P. Crustal Structure of the Seismogenic Volume of the 2010–2014 Pollino (Italy) Seismic Sequence From 3D P- and S-Wave Tomographic Images. Front. Earth Sci. 2021, 9, 735340. [Google Scholar] [CrossRef]
  30. Sketsiou, P.; De Siena, L.; Gabrielli, S.; Napolitano, F. 3-D attenuation image of fluid storage and tectonic interactions across the Pollino fault network. Geophys. J. Int. 2021, 226, 536–547. [Google Scholar] [CrossRef]
  31. Guerra, I.; Harabaglia, P.; Gervasi, A.; Rosa, A.B. The 1998-1999 Pollino (Southern Apennines, Italy) seismic crisis: Tomography of a sequence. Ann. Geophys. 2009, 48, 995–1007. [Google Scholar] [CrossRef]
  32. Chiarabba, C.; Agostinetti, N.P.; Bianchi, I. Lithospheric fault and kinematic decoupling of the Apennines system across the Pollino range. Geophys. Res. Lett. 2016, 43, 3201–3207. [Google Scholar] [CrossRef]
  33. Pastori, M.; Margheriti, L.; De Gori, P.; Govoni, A.; Lucente, F.P.; Moretti, M.; Marchetti, A.; Di Giovambattista, R.; Anselmi, M.; De Luca, P.; et al. The 2011–2014 Pollino Seismic Swarm: Complex Fault Systems Imaged by 1D Refined Location and Shear Wave Splitting Analysis at the Apennines–Calabrian Arc Boundary. Front. Earth Sci. 2021, 9, 618293. [Google Scholar] [CrossRef]
  34. Cinti, F.R.; Moro, M.; Pantosti, D.; Cucci, L.; D’Addezio, G. New constraints on the seismic history of the Castrovillari fault in the Pollino gap (Calabria, southern Italy). journal of seismology 2002, 6, 199–217. [Google Scholar] [CrossRef]
  35. Rovida, A.; Locati, M.; Camassi, R.; Lolli, B.; Gasperini, P. The Italian earthquake catalogue CPTI15. Bull. Earthq. Eng. 2020, 18, 2953–2984. [Google Scholar] [CrossRef]
  36. Rovida, A.; Locati, M.; Camassi, R.; Lolli, B.; Gasperini, P.; Antonucci, A. Catalogo Parametrico dei Terremoti Italiani (CPTI15), versione 4.0. Istituto Nazionale di Geofisica e Vulcanologia (INGV): Rome, Italy, 2022. [Google Scholar] [CrossRef]
  37. Brozzetti, F.; Lavecchia, G.; Mancini, G.; Milana, G.; Cardinali, M. Analysis of the 9 September 1998 Mw 5.6 Mercure earthquake sequence (Southern Apennines, Italy): A multidisciplinary approach. Tectonophysics 2009, 476, 210–225. [Google Scholar] [CrossRef]
  38. Calderoni, G.; Ponte, M.; La Rocca, M.; Di Giovambattista, R. Influence of Fluids and Geological Setting on Source Parameters of the 2010-2014 Pollino (Italy) Seismic Swarm. Terra Nova 2025, 37, 324–341. [Google Scholar] [CrossRef]
  39. Tertulliani, A.; Cucci, L. New Insights on the Strongest Historical Earthquake in the Pollino Region (Southern Italy). Seismol. Res. Lett. 2014, 85, 743–751. [Google Scholar] [CrossRef]
  40. Guidoboni, E.; Ferrari, G.; Tarabusi, G.; Sgattoni, G.; Comastri, A.; Mariotti, D.; Ciuccarelli, C.; Bianchi, M.G.; Valensise, G. CFTI5Med, the new release of the catalogue of strong earthquakes in Italy and in the Mediterranean area. Sci. Data 2019, 6, 80. [Google Scholar] [CrossRef] [PubMed]
  41. Lavecchia, G.; de Nardis, R.; Ferrarini, F.; Cirillo, D.; Bello, S.; Brozzetti, F. Regional seismotectonic zonation of hydrocarbon fields in active thrust belts: A case study from Italy. In Building Knowledge for Geohazard Assessment and Management in the Caucasus and Other Orogenic Regions; Bonali, F.L., Mariotto, F.P., Tsereteli, N., Eds.; Springer: Dordrecht, The Netherlands, 2021; pp. 89–128. [Google Scholar] [CrossRef]
  42. Rossetti, F.; Goffé, B.; Monié, P.; Faccenna, C.; Vignaroli, G. Alpine orogenic P-T-t-deformation history of the Catena Costiera area and surrounding regions (Calabrian Arc, southern Italy): The nappe edifice of north Calabria revised with insights on the Tyrrhenian-Apennine system formation: Alpine tectonics in north Calabria. Tectonics 2004, 23, 1–26. [Google Scholar] [CrossRef]
  43. Malinverno, A.; Ryan, W.B.F. Extension in the Tyrrhenian Sea and shortening in the Apennines as result of arc migration driven by sinking of the lithosphere. Tectonics 1986, 5, 227–245. [Google Scholar] [CrossRef]
  44. Vitale, S.; Ciarcia, S. Tectono-stratigraphic and kinematic evolution of the southern Apennines/Calabria–Peloritani Terrane system (Italy). Tectonophysics 2013, 583, 164–182. [Google Scholar] [CrossRef]
  45. Rosolino, C.; Eugenio, F.; Patrizia, F.; Gaetano, O.; Antonino, P.; Rosalda, P. The Calabria-Peloritani Orogen, a composite terrane in Central Mediterranean; its overall architecture and geodynamic significance for a pre-Alpine scenario around the Tethyan basin. Period. Di Mineral. 2015, 84, 701–749. [Google Scholar] [CrossRef]
  46. Amodio-Morelli, L.; Bonardi, G.; Colonna, V.; Dietrich, D.; Giunta, G.; Ippolito, F.; Liguori, V.; Lorenzoni, F.; Paglionico, A.; Perrone, V.; et al. L’arco calabro-peloritano nell’orogene appenninico-maghrebide Translated Title: The Calabro-Peloritani Arc during the Apennine-Maghrebide Orogeny. Mem. Soc. Geol. Ital. 1976, 17, 1–60. [Google Scholar]
  47. Filice, F.; Liberi, F.; Cirillo, D.; Pandolfi, L.; Marroni, M.; Piluso, E. Geology map of the central area of Catena Costiera: Insights into the tectono-metamorphic evolution of the Alpine belt in Northern Calabria. J. Maps 2015, 11, 114–125. [Google Scholar] [CrossRef]
  48. Cesarano, M.; Turco, E. Folding within Upper Miocene deposits of the Calabrian Coast Range (Southern Italy). Boll. Soc. Geol. Ital. Vol Spec 2002, 1, 677–685. [Google Scholar]
  49. Scrocca, D.; Doglioni, C.; Innocenti, F. Contraints for an interpretation of the italian geodynamics: A review. Mem. Descr. Della Carta Geol. D’Italia 2003, 62, 1–32. [Google Scholar]
  50. Bonardi, G. Oligocene-to-Early Miocene depositional and structural evolution of the Calabria–Peloritani Arc southern terrane (Italy) and geodynamic correlations with the Spain Betics and Morocco Rif. Geodin. Acta 2003, 16, 149–169. [Google Scholar] [CrossRef]
  51. Patacca, E.; Scandone, P. Geology of the Southern Apennines. Boll. Della Soc. Geol. Ital. 2007, 7, 75–119. [Google Scholar]
  52. Cifelli, F.; Mattei, M.; Rossetti, F. Tectonic evolution of arcuate mountain belts on top of a retreating subduction slab: The example of the Calabrian Arc. J. Geophys. Res. 2007, 112, B09101. [Google Scholar] [CrossRef]
  53. Montone, P.; Mariucci, M.T. The new release of the Italian contemporary stress map. Geophys. J. Int. 2016, 205, 1525–1531. [Google Scholar] [CrossRef]
  54. D’Agostino, N.; D’Anastasio, E.; Gervasi, A.; Guerra, I.; Nedimovic, M.R.; Seeber, L.; Steckler, M. Forearc extension and slow rollback of the Calabrian Arc from GPS measurements. Geophys. Res. Lett. 2011, 38, L17304. [Google Scholar] [CrossRef]
  55. Carafa, M.M.C.; Kastelic, V.; Bird, P.; Maesano, F.E.; Valensise, G. A “Geodetic Gap” in the Calabrian Arc: Evidence for a Locked Subduction Megathrust? Geophys. Res. Lett. 2018, 45, 1794–1804. [Google Scholar] [CrossRef]
  56. Ghisetti, F.; Vezzani, L. Structural Map of Mt. Pollino (Southern Italy). 1:50.000 Scale; SELCA: Florence, Italy, 1983. [Google Scholar]
  57. Monaco, C.; Tortorici, L.; Morten, L.; Critelli, S.; Tansi, C. Geologia del versante nord-orientale del Massiccio del Pollino (confine calabro-lucano); nota illustrativa sintetica della carta geologica alla scala 1: 50.000. Boll. Della Soc. Geol. Ital. 1995, 114, 277–291. [Google Scholar]
  58. Nazzareni, S.; Mantovani, L.; Pizzati, M.; Bersani, D.; Boschetti, T.; Palmucci, A.; Cirillo, D.; Brozzetti, F. Characterisation of Fault-Related Mn-Fe Striae on the Timpa Della Manca Fault (Mercure Basin, Southern Apennines, Italy). Geosciences 2024, 14, 299. [Google Scholar] [CrossRef]
  59. Ietto, A.; Ietto, F. Carta Geologica d’Italia, Foglio 543—Cassano allo Ionio. 2011. Available online: http://www.isprambiente.gov.it/Media/carg/543_CASSANO_ALLO_IONIO/Foglio.html (accessed on 14 July 2025).
  60. Servizio Geologico d’Italia. Carta geologica della Calabria alla scala 1:25.000— Geological Map of Calabria at 1:25.000 scale. In Cassa per il Mezzogiorno—CASMEZ; Servizio Geologico d’Italia: Poligrafica & Cartevalori Ercolano (Napoli): Napoly, Italy, 1971. [Google Scholar]
  61. Cifelli, F.; Rossetti, F.; Mattei, M. The architecture of brittle postorogenic extension: Results from an integrated structural and paleomagnetic study in north Calabria (southern Italy). Geol. Soc. Am. Bull. 2007, 119, 221–239. [Google Scholar] [CrossRef]
  62. Brozzetti, F.; Cirillo, D.; Liberi, F.; Piluso, E. The Crati valley extensional system: Field and subsurface evidences. Rend. Onl. Soc. Geol. It. 2012, 21, 159–161. [Google Scholar]
  63. Lanzafame, G.; Zuffa, G.; Frazzetta, G.; Sorriso, M. Carta geologica del Bacino del Crati. Foglio. Litografia Artistica Cartografica: Florence, Italy, 1975. [Google Scholar]
  64. Galli, P.; Galadini, F.; Pantosti, D. Twenty years of paleoseismology in Italy. Earth-Sci. Rev. 2008, 88, 89–117. [Google Scholar] [CrossRef]
  65. Galli, P.; Giaccio, B.; Messina, P.; Peronace, E. Three magnitude 7 earthquakes on a single fault in central Italy in 1400 years, evidenced by new palaeoseismic results. Terra Nova 2016, 28, 146–154. [Google Scholar] [CrossRef]
  66. Galli, P.; Messina, P.; Peronace, E.; Galderisi, A.; Ilardo, I.; Polpetta, F. Paleoseismic evidence of five magnitude 7 earthquakes on the Norcia fault system in the past 8,000 years (Central Italy). Front. Earth Sci. 2023, 11, 1188602. [Google Scholar] [CrossRef]
  67. Lanzafame, G.; Zuffa, G. Geologia e petrografia del Foglio Bisignano (Bacino del Crati, Calabria). Geol. Romana 1976, 15, 223–270. [Google Scholar]
  68. Romeo, M.; Tortorici, L. Stratigrafia dei depositi miocenici della Catena Costiera calabra meridionale e della media Valle del F. Crati (Calabria). Boll. Soc. Geol. It 1980, 99, 303–318. [Google Scholar]
  69. Colella, A.; De Boer, P.L.; Nio, S.D. Sedimentology of a marine intermontane Pleistocene Gilbert-type fan-delta complex in the Crati Basin, Calabria, southern Italy. Sedimentology 1987, 34, 721–736. [Google Scholar] [CrossRef]
  70. Colella, A. Fault-controlled marine Gilbert-type fan deltas. Geology 1988, 16, 1031. [Google Scholar] [CrossRef]
  71. Fabbricatore, D.; Robustelli, G.; Muto, F. Facies analysis and depositional architecture of shelf-type deltas in the Crati Basin (Calabrian Arc, south Italy). Ital. J. Geosci. 2014, 133, 131–148. [Google Scholar] [CrossRef]
  72. Robustelli, G.; Muto, F. The Crati River Basin: Geomorphological and stratigraphical data for the Plio-Quaternary evolution of northern Calabria, South Apennines, Italy. Geol. Carpathica 2017, 68, 68–79. [Google Scholar] [CrossRef]
  73. Cirillo, D.; Cerritelli, F.; Agostini, S.; Bello, S.; Lavecchia, G.; Brozzetti, F. Integrating Post-Processing Kinematic (PPK)–Structure-from-Motion (SfM) with Unmanned Aerial Vehicle (UAV) Photogrammetry and Digital Field Mapping for Structural Geological Analysis. ISPRS Int. J. Geo-Inf. 2022, 11, 437. [Google Scholar] [CrossRef]
  74. Cirillo, D.; Zappa, M.; Tangari, A.C.; Brozzetti, F.; Ietto, F. Rockfall Analysis from UAV-Based Photogrammetry and 3D Models of a Cliff Area. Drones 2024, 8, 31. [Google Scholar] [CrossRef]
  75. Cirillo, D. Digital Field Mapping and Drone-Aided Survey for Structural Geological Data Collection and Seismic Hazard Assessment: Case of the 2016 Central Italy Earthquakes. Appl. Sci. 2020, 10, 5233. [Google Scholar] [CrossRef]
  76. Cardozo, N.; Allmendinger, R.W. Spherical projections with OSXStereonet. Comput. Geosci. 2013, 51, 193–205. [Google Scholar] [CrossRef]
  77. Allmendinger, R.W.; Cardozo, N.; Fisher, D.M. Structural Geology Algorithms: Vectors & Tensors. Cambridge, Ed.; Cambridge University Press: Cambridge, UK, 2013; p. 289. [Google Scholar]
  78. Tarquini, S.; Nannipieri, L. The 10 m-resolution TINITALY DEM as a trans-disciplinary basis for the analysis of the Italian territory: Current trends and new perspectives. Geomorphology 2017, 281, 108–115. [Google Scholar] [CrossRef]
  79. Tarquini, S.; Isola, I.; Favalli, M.; Battistini, A.; Dotta, G. TINITALY, a digital elevation model of Italy with a 10 meters cell size (Version 1.1). Istituto Nazionale di Geofisica e Vulcanologia (INGV): Rome, Italy, 2023. [Google Scholar] [CrossRef]
  80. Regione Calabria—Carta Tecnica Regionale in Scala 1:5.000. Available online: https://geoportale.regione.calabria.it/dataset (accessed on 22 February 2025).
  81. Geoportale Nazionale. Available online: http://www.pcn.minambiente.it/viewer/ (accessed on 22 February 2025).
  82. FAO. Food and Agriculture Organization—Guidelines for Soil Profile Description, 4th ed.; FAO: Rome, Italy, 2006; p. 97. [Google Scholar]
  83. Van Reeuwijk, L. Procedures for Soil Analysis; International Soil Reference and Information Centre: Wageningen, The Netherlands, 2002; Volume 9, pp. 1–101. [Google Scholar]
  84. Burt, R. Soil survey laboratory methods manual. In Soil Survey Investigations Report; Burt, R., Ed.; Usda, NRCS: United States Department of Agriculture–National Resources Conservation Service (USDA–NRSC): Lincoln, NE, USA, 2004; Vol. 42. [Google Scholar]
  85. Simpson, K. Micromorphology of Soils; Cambridge University Press: London; Chapman and Hall: New York, NY, USA, 1984. [Google Scholar]
  86. Schwertmann, U. Differenzierung der eisenoxide des bodens durch extraktion mit ammoniumoxalat-Lösung. Z. Für Pflanzenernährung Düngung Bodenkd. 1964, 105, 194–202. [Google Scholar] [CrossRef]
  87. Mehra, O.; Jackson, M. Iron oxide removal from soils and clays by a dithionite–citrate system buffered with sodium bicarbonate. In Clays and Clay Minerals; Elsevier: Amsterdam, The Netherlands, 2013; pp. 317–327. [Google Scholar]
  88. Arduino, E.; Barberis, E.; Carraro, F.; Forno, M.G. Estimating relative ages from iron-oxide/total-iron ratios of soils in the western Po Valley, Italy. Geoderma 1984, 33, 39–52. [Google Scholar] [CrossRef]
  89. Scarciglia, F.; Pelle, T.; Pulice, I.; Robustelli, G. A comparison of Quaternary soil chronosequences from the Ionian and Tyrrhenian coasts of Calabria, southern Italy: Rates of soil development and geomorphic dynamics. Quat. Int. 2015, 376, 146–162. [Google Scholar] [CrossRef]
  90. Scarciglia, F.; Mercatante, G.; Fondevilla, V.; Anadón, P.; Oms, O.; Donato, P.; Agnini, C.; Papini, M.; Rook, L.; Ghinassi, M. Pleistocene paleosol development and paleoenvironmental dynamics in East Africa: A multiproxy record from the -bearing Aalat pedostratigraphic succession, Dandiero basin (Eritrea). Quat. Sci. Rev. 2018, 191, 275–298. [Google Scholar] [CrossRef]
  91. Robustelli, G.; Lucà, F.; Corbi, F.; Pelle, T.; Dramis, F.; Fubelli, G.; Scarciglia, F.; Muto, F.; Cugliari, D. Alluvial terraces on the Ionian coast of northern Calabria, southern Italy: Implications for tectonic and sea level controls. Geomorphology 2009, 106, 165–179. [Google Scholar] [CrossRef]
  92. Torrent, J.; Schwertmann, U.; Schulze, D. Iron oxide mineralogy of some soils of two river terrace sequences in Spain. Geoderma 1980, 23, 191–208. [Google Scholar] [CrossRef]
  93. Lucà, F.; Brogno, A.; Tripodi, V.; Robustelli, G. Terrace morpho-sedimentary sequences on the sibari plain (Calabria, Southern Italy): Implication for Sea level and tectonic controls. Geosciences 2022, 12, 211. [Google Scholar] [CrossRef]
  94. Carobene, L. Genesi, età, sollevamento ed erosione dei terrazzi marini di Crosia-Calopezzati (Costa ionica della Calabria-Italia). Alp. Mediterr. Quat. 2003, 16, 43–90. [Google Scholar]
  95. Molin, P.; Dramis, F.; Lupia Palmieri, E. The Pliocene-Quaternary uplift of the Ionian northern Calabria coastal belt between Corigliano Calabro and Capo Trionto. Studi Geol. Camerti Vol. Spec. 2002, 1, 135–145. [Google Scholar]
  96. Carobene, L.; Dai-Pra, G.; Gewelt, M. Niveaux marins du Pléistocène moyen-supérieur de la côte tyrrhénienne de la Calabre (Italie méridionale) Datations 230Th/234U et tectonique récente. Z. Für Geomorphologie. Suppl. 1986, 62, 141–158. [Google Scholar]
  97. Carobene, L.; Dai Pra, G. Genesis, chronology and tectonics of the Quaternary marine terraces of the Tyrrhenian coast of Northern Calabria (Italy). Their correlation with climatic variations. Alp. Mediterr. Quat. 1990, 3, 75–94. [Google Scholar]
  98. Cucci, L. Raised marine terraces in the Northern Calabrian Arc (Southern Italy): A ∼ 600 kyr-long geological record of regional uplift. Ann. Geophys. 2004, 47, 1391–1406. [Google Scholar]
  99. Santoro, E.; Mazzella, M.E.; Ferranti, L.; Randisi, A.; Napolitano, E.; Rittner, S.; Radtke, U. Raised coastal terraces along the Ionian Sea coast of northern Calabria, Italy, suggest space and time variability of tectonic uplift rates. Quat. Int. 2009, 206, 78–101. [Google Scholar] [CrossRef]
  100. Alfonsi, L.; Brunori, C.A.; Cucci, L. Mapping and chronological classification of marine terraces along the southern side of the Sibari Plain (northern Calabria, Italy) by means of digital and analogue tools. J. Maps 2023, 19, 2243983. [Google Scholar] [CrossRef]
  101. Cinti, F.; Alfonsi, L.; Cucci, L.; Pantosti, D.; Pauselli, C.; Ercoli, M.; Brunori, C.; Cianflone, G.; Dominici, R. The NE-SW Sibari fault zone: A seismic hazard source in Ionian northern Calabria (Italy). Tectonophysics 2024, 873, 230214. [Google Scholar] [CrossRef]
  102. Carboni, S.; Palomba, M.; Vacca, A.; Carboni, G. Paleosols provide sedimentation, relative age, and climatic information about the alluvial fan of the River Tirso (Central-Western Sardinia, Italy). Quat. Int. 2006, 156, 79–96. [Google Scholar] [CrossRef]
  103. Coltorti, M.; Pieruccini, P. The last interglacial pedocomplexes in the litho- and morpho-stratigraphical framework of the central-northern Apennines (Central Italy). Quat. Int. 2006, 156, 118–132. [Google Scholar] [CrossRef]
  104. Scarciglia, F.; Tuccimei, P.; Vacca, A.; Barca, D.; Pulice, I.; Salzano, R.; Soligo, M. Soil genesis, morphodynamic processes and chronological implications in two soil transects of SE Sardinia, Italy: Traditional pedological study coupled with laser ablation ICP-MS and radionuclide analyses. Geoderma 2011, 162, 39–64. [Google Scholar] [CrossRef]
  105. Di Celma, C.; Pieruccini, P.; Farabollini, P. Major controls on architecture, sequence stratigraphy and paleosols of middle Pleistocene continental sediments ("Qc Unit"), eastern central Italy. Quat. Res. 2015, 83, 565–581. [Google Scholar] [CrossRef]
  106. Tangari, A.C.; Scarciglia, F.; Piluso, E.; Marinangeli, L.; Pompilio, L. Role of weathering of pillow basalt, pyroclastic input and geomorphic processes on the genesis of the Monte Cerviero upland soils (Calabria, Italy). CATENA 2018, 171, 299–315. [Google Scholar] [CrossRef]
  107. Bracone, V.; Amorosi, A.; Aucelli, P.P.C.; Rosskopf, C.M.; Scarciglia, F.; Di Donato, V.; Esposito, P. The Pleistocene tectono-sedimentary evolution of the Apenninic foreland basin between Trigno and Fortore rivers (Southern Italy) through a sequence stratigraphic perspective. Basin Res. 2012, 24, 213–233. [Google Scholar] [CrossRef]
  108. Fedoroff, N. Clay illuviation in Red Mediterranean soils. Catena 1997, 28, 171–189. [Google Scholar] [CrossRef]
  109. Cremaschi, M.; Trombino, L. The palaeoclimatic significance of paleosols in Southern Fezzan (Libyan Sahara): Morphological and micromorphological aspects. Catena 1998, 34, 131–156. [Google Scholar] [CrossRef]
  110. Catt, J.A. Report from working group on definitions used in paleopedology. Quat. Int. 1998, 51-52, 84. [Google Scholar] [CrossRef]
  111. Bronger, A.; Sedov, S.N. Vetusols and paleosols: Natural versus man-induced environmental change in the Atlantic coastal region of Morocco. Quat. Int. 2003, 106, 33–60. [Google Scholar] [CrossRef]
  112. Scarciglia, F.; Sauer, D.; Zerboni, A. Pleistocene paleosols of Italy: Pedostratigraphy, genesis, paleoclimate and geoarchaeology. Alp. Mediterr. Quat. 2023, 36, 1–35. [Google Scholar] [CrossRef]
  113. Sauer, D. Approaches to quantify progressive soil development with time in Mediterranean climate-I. Use of field criteria. J Plant Nutr Soil Sc 2010, 173, 822–842. [Google Scholar] [CrossRef]
  114. Schwertmann, U.; Taylor, R.M. Iron oxides. Miner. Soil Environ. 1989, 1, 379–438. [Google Scholar]
  115. Harden, J.W. A quantitative index of soil development from field descriptions: Examples from a chronosequence in central California. Geoderma 1982, 28, 1–28. [Google Scholar] [CrossRef]
  116. Vidic, N.J. Soil-age relationships and correlations: Comparison of chronosequences in the Ljubljana Basin, Slovenia and USA. Catena 1998, 34, 113–129. [Google Scholar] [CrossRef]
  117. Harden, J.W.; Taylor, E.M. A quantitative comparison of soil development in four climatic regimes. Quat. Res. 1983, 20, 342–359. [Google Scholar] [CrossRef]
  118. Kendrick, K.J.; McFadden, L.D. Comparison and contrast of processes of soil formation in the San Timoteo Badlands with chronosequences in California. Quat. Res. 1996, 46, 149–160. [Google Scholar] [CrossRef]
  119. Carafa, M.M.C.; Di Naccio, D.; Di Lorenzo, C.; Kastelic, V.; Bird, P. A Meta-Analysis of Fault Slip Rates Across the Central Apennines. J Geophys Res-Sol Ea 2022, 127, e2021JB023252. [Google Scholar] [CrossRef]
  120. Wood, H.O. The earthquake problem in the western United States. Bull. Seismol. Soc. Am. 1916, 6, 197–217. [Google Scholar] [CrossRef]
  121. Slemmons, D.B.; McKinney, R. Definition of "active Fault"; Department of Defense, Department of the Army, Corps of Engineers, Waterways Experiment Station, Soils and Pavements Laboratory: Vicksburg, MS, USA, 1977. [Google Scholar]
  122. Wood, R.M.; Mallard, D.J. When Is a Fault Extinct. J. Geol. Soc. 1992, 149, 251–255. [Google Scholar] [CrossRef]
  123. Boschi, E. New trends in active faulting studies for seismic hazard assessment. Ann. Geophys. 1996, 39. [Google Scholar] [CrossRef]
  124. WSSPC. Active fault definition for the Basin and Range Province; WSSPC (Western States Seismic Policy Council): San Francisco, CA, USA, 1997; p. 3. [Google Scholar]
  125. NRC US Nuclear Regulatory Commission. Identification and Characterization of Seismic Sources and Determination of Safe Shutdown Earthquake Ground Motion; NRC US Nuclear Regulatory Commission: Rockville, MD, USA, 1997; Vol. 1. [Google Scholar]
  126. Machette, M.N. Active, capable, and potentially active faults—A paleoseismic perspective. J. Geodyn. 2000, 29, 387–392. [Google Scholar] [CrossRef]
  127. IAEA-Safety-Standard. Seismic hazards in site evaluation for nuclear installations. Specif. Saf. Guide 2010, 60. [Google Scholar]
  128. Tondi, E.; Michetti, M.A. The resolution of geological analysis and models for earthquake faulting studies. J. Geodyn. 1998, 145–580. Available online: https://pubblicazioni.unicam.it/handle/11581/250294 (accessed on 22 February 2025).
  129. Lavecchia, G.; Bello, S.; Andrenacci, C.; Cirillo, D.; Ferrarini, F.; Vicentini, N.; de Nardis, R.; Roberts, G.; Brozzetti, F. Quaternary fault strain Indicators database—QUIN 1.0—first release from the Apennines of central Italy. Sci. Data 2022, 9, 204. [Google Scholar] [CrossRef] [PubMed]
  130. Galadini, F.; Falcucci, E.; Galli, P.; Giaccio, B.; Gori, S.; Messina, P.; Moro, M.; Saroli, M.; Scardia, G.; Sposato, A. Time intervals to assess active and capable faults for engineering practices in Italy. Eng. Geol. 2012, 139, 50–65. [Google Scholar] [CrossRef]
  131. Wu, Z.H.; Hu, M.M. Definitions, Classification Schemes for Active Faults, and Their Application. Geosciences 2024, 14, 68. [Google Scholar] [CrossRef]
  132. Wells, D.L.; Coppersmith, K.J. New Empirical Relationships among Magnitude, Rupture Length, Rupture Width, Rupture Area, and Surface Displacement. Bull. Seismol. Soc. Am. 1994, 84, 974–1002. [Google Scholar] [CrossRef]
  133. Wesnousky, S.G. Displacement and Geometrical Characteristics of Earthquake Surface Ruptures: Issues and Implications for Seismic-Hazard Analysis and the Process of Earthquake Rupture. Bull. Seismol. Soc. Am. 2008, 98, 1609–1632. [Google Scholar] [CrossRef]
  134. Stirling, M.; Goded, T.; Berryman, K.; Litchfield, N. Selection of Earthquake Scaling Relationships for Seismic-Hazard Analysis. Bull. Seismol. Soc. Am. 2013, 103, 2993–3011. [Google Scholar] [CrossRef]
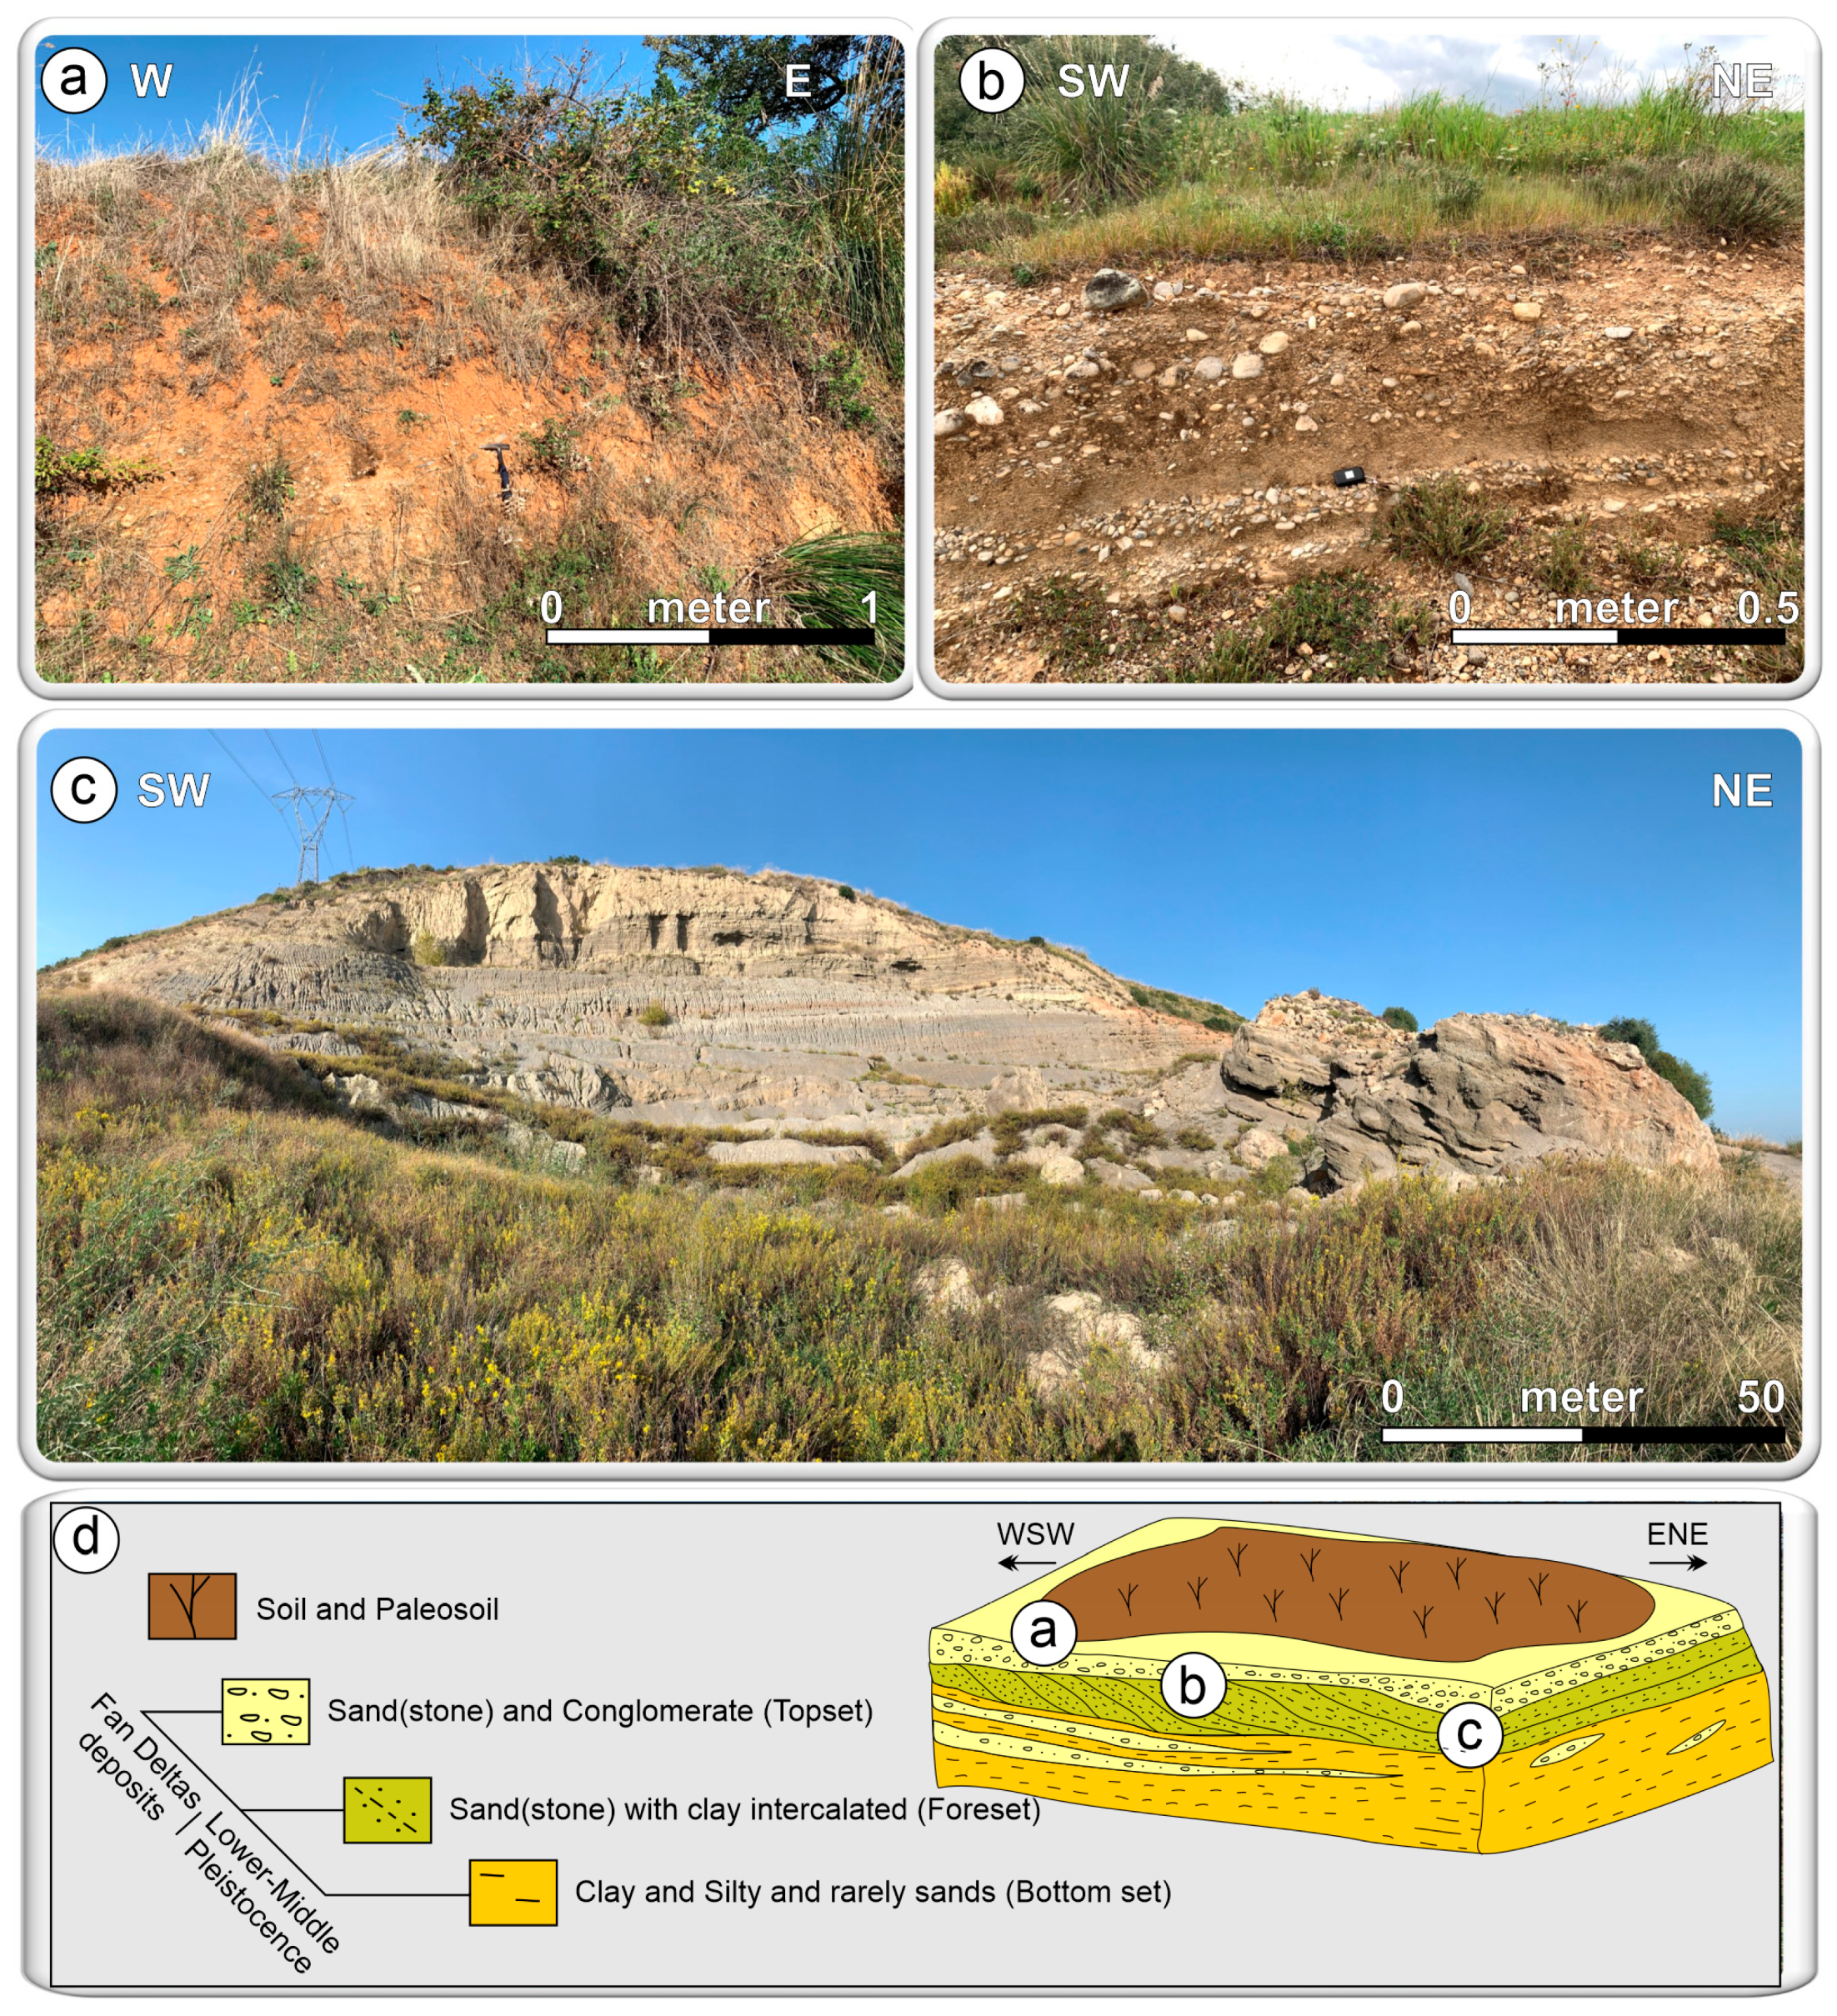
Figure 3. Stratigraphy of the study area. (a) Soil horizon developed during the emergence of the paleosurface. (b) topset Sand(stones) and conglomerates. (c) Panoramic view of a quarry exposing the deltaic foreset-bottomset beds, consisting of sand(stones) interbedded with clays and silts. (d) Schematic representation of a portion of a Gilbert-type fan delta, indicating the possible locations of the facies shown in images (ac).
Remotesensing 17 03366 g003
Figure 4. Working methodology and instruments employed for the aerophotogrammetric survey. (a) Emlid Reach RS2 GNSS/RTK system (L1, L2, L5), serving as a base station for acquiring high-precision satellite positioning data. (b) DJI Mavic 2 Pro drone equipped with a Topodrone GNSS RTK/PPK (L1, L2) antenna, operated via a remote controller with an Apple iPad. (c) Post-Processing Kinematic (PPK) workflow used to georeference aerial images with high accuracy. (d) Dense point cloud and 3D Digital Outcrop Model (DOM) generated from UAV imagery acquired during flight missions over the Piano delle Rose area (see location in Figure 2c). Blue squares indicate individual image acquisition points. (e) Digital Elevation Model (DEM) and hillshade relief maps generated through Agisoft Metashape Professional software, representing the final photogrammetric products.
Remotesensing 17 03366 g004
Figure 5. Comparison of Digital Elevation Models (DEMs) with different spatial resolutions: (a) 20 m; (b) 10 m (from the TinItaly project [79]); (c) 5 m (from the Regional Technical Map at 1:5000 scale [80]); (d) 1 m (LiDAR data from the National Cartographic Portal Ministry of Environment [81], Calabria Region); and (e) 0.036 m/pixel (derived from UAV PPK photogrammetric survey).
Remotesensing 17 03366 g005
Figure 6. Workflow illustrating the methodological sequence from soil sampling to micromorphological examination and chemical-physical analyses.
Remotesensing 17 03366 g006
Figure 7. Digital Elevation Model (DEM) with a spatial resolution of 3.6 cm/pixel, generated from a UAV-PPK photogrammetric survey. Profiles a–a’, b–b’, and c–c’ correspond to the topographic transects used to quantify fault scarp throw, displacement, and heave. Red and black arrows with numerical annotations indicate the dip direction and measured dip angle of the fault planes. Brown rectangles show the projected positions of soil sampling sites along each profile, providing their spatial relation to the fault scarp. Red-shaded areas highlight the slope associated with the fault scarp, including both preserved and eroded portions of the fault plane.
Remotesensing 17 03366 g007
Figure 8. Digital Elevation Model (DEM) with hillshade representation of the Piano delle Rose area. The labelled circles (a to k) indicate the locations of observation and survey sites, with corresponding photographs shown in the panels of Figure 9. White rectangles with black borders mark the sampling sites of soil profiles, labelled from CiF3, located at the highest elevation in the westernmost part—progressively decreasing number (e.g., CiF3 to Cif2–CiF1–CiF–CiF-1) and with decreasing elevation towards the east.
Remotesensing 17 03366 g008
Figure 9. (a) Panoramic frontal view of the major scarp of the Piano delle Rose Fault; (bk): geological and structural survey sites. For the location of each panel, refer to Figure 8; The stereonets display fault plane attitudes, with vectors indicating the direction of striae. The structural measurements were collected using the Fieldmove app installed on an Apple tablet. A traditional manual compass was also used to verify and control the correct functioning of the virtual compass readings during structural analysis.
Remotesensing 17 03366 g009
Figure 10. Soil profiles with their location map at different altitudes: (a) soil profile CiF3 showing, from top to bottom, a transitional ABt horizon (organic-mineral material with minor concentration of illuviated clays) and a Bt/R horizon (argic horizon with local bedrock occurrence); (b) soil profile CiF2 consisting of an Ak horizon (organic-mineral horizon with accumulation of secondary calcium carbonate) overlying a Bkm (petrocalcic, indurated horizon with brecciation); (c) soil profile CiF1; (d) soil profile CiF characterized by an Ak horizon overlying two argic horizons (Bt1 and Bt2) with clay illuviation); (e) soil profile CiF-1. The soil profiles CIF1 (d) and CIF-1, white lines indicate the limit of the two pedogenic units, a red dashed line indicates the evidence of fault displacement, and the arrow indicates the hanging wall; (e) consist of an ABt horizon (organic–mineral material with minor concentration of clay illuviation) and a Bt (argic) horizon.
Remotesensing 17 03366 g010
Figure 11. Microphotographs of: (a) sand(stone) lithic fragment and (b) biomicritic limestone in the Ak horizon of soil profile CiF2; (c) fragments of plant tissues; (d) yellowish-brown to reddish pedogenic matrix in the ABt horizon of soil profile CiF1 in plane polarized light (PPL); (e) yellowish-brown to reddish pedogenic matrix in the Bt horizon of soil profile CiF1 between cross polarizers (XPL); (f) laminated clay coatings (red arrow) surrounding a polycrystalline quartz fragment (XPL); (g) yellowish to reddish clay coatings in the Bt1 horizon of soil profile CiF (XPL) (red arrow); (h) Degenerated microlaminated clay coatings in the Bt2 horizon of soil profile CiF (XPL).
Remotesensing 17 03366 g011
Figure 12. Binary plots showing the iron-based pedogenetic indices (Fed−Feo)/Fet (a) and Fed/Fet (b) versus soil age. Black dots represent data from Scarciglia Et Al. [89], while the coloured stars indicate the weighted mean values ∑((Fed−Feo)/Fet)*h/H. The labels “CiF” in different colors indicate distinct soil profiles, and the bars below each sample denote the estimated time intervals of soil formation.
Remotesensing 17 03366 g012
Figure 13. (a) Structural Geological and Soil Map of the Piano delle Rose area. (b) Map view of the area highlighted in yellow in panel (a), showing high-resolution topography at 3.6 cm/pixel, with faults in red; (b1) geological section showing the displacement of the two pedogenetic units along the Piano delle Rose Fault and its various splays. Displacement was calculated for each individual splay, with a cumulative geological displacement of 21 m; (b2) photo of the outcrop along the fault scarp; the structural geological data of the faults are represented in the stereonet of Figure 9b; (c) Map view showing high-resolution topography of the key sector highlighted by the green square, located as indicated in panels (b) and (a); (c1) 3D virtual outcrop model obtained using Agisoft Metashape Pro; (c2) topographic profile (see trace in panel (c)) showing topographic scarps and displacement measurements on individual splays, with cumulative topographic displacement. (d) Map view of the high-resolution topography, with the location highlighted by the light-blue square in panel (a); (d1) geological section along the profile trace shown in panel (d); (d2) photo of the outcrop showing faulting in recent soils; the structural geological data of the fault are represented in the stereonet of Figure 9i.
Remotesensing 17 03366 g013
Figure 14. Synoptic schematic diagram summarising the relationship between the fault scarp, characterised by a maximum and minimum cumulative displacement of 99 and 54 m respectively, and its evolution considering different geological time intervals, with corresponding slip rates. The diagram also compares topographic elevation data derived from morphological analysis with results from previous studies on marine terraces in nearby areas [91,93,94,95]. Additionally, pedological analysis data are incorporated and all information is correlated with the geological chronology and associated Marine Isotope Stages (MIS).
Remotesensing 17 03366 g014
Figure 15. (a) Schematic paleogeographic reconstruction of the Piano delle Rose area from Middle Pleistocene to present. The sketches illustrate the progressive tectonic deformation associated with fault activity and the displacement of an originally continuous paleosurface, within a regional extensional regime-oriented WNW–ESE. The eastward migration of the paleo-shoreline delimiting the marine areas (colored in blue) is also shown. The brown shaded areas indicate the exposed paleo-terraced surfaces. Red dotted lines show the inferred paleo-fault activity, while the solid red lines depict the mapped fault traces. (b) 3D synthetic sketch illustrating the depositional and tectonic evolution of the study area from the Early Pleistocene to the present. Six main evolutionary phases are identified: (1) deposition and progradation of the fan-delta deposits (yellow background), (2) onset of lower pedogenetic unit formation at ~700 ka (red-brownish colour indicates a lower pedogenetic unit), (3) activation of the first tectonic events affecting the lower pedogenetic units (highlighted as red 3D extensional fault surfaces), (4) development of additional fault splays displacing the lower soils, accompanied by successive erosion phases, (5) development of the upper pedogenetic unit (brown color), and (6) schematic representation of the present-day structural and geomorphological setting.
Remotesensing 17 03366 g015
Table 1. Measured throw, calculated displacement, and heave for each analyzed topographic profile and fault scarp (F.S.), considering the dip of well-preserved and uneroded fault planes.
Topographic Profile and
Fault Scarp (F.S.)
Dip (°)Throw (m)Displacement (m)Heave (m)
a-a’8053549
b-b’–F.S. 160202312
b-b’–F.S. 27530318
b-b’–cumulative F.S.70889432
c-c’–F.S. 160182110
c-c’–F.S. 26510115
c-c’–F.S. 37520215
c-c’–cumulative F.S.65909942
Table 2. Morphological features of the studied soil profiles.
Soil ProfileElevation (m asl)CoordinatesHorizonDepth (cm)Color (Dry)Redness RatingStructureConsistenceClay Coatings (%)Fe-Mn Features (%)
CiF335239°44′15.80″N 16° 12′27.00"EABt 0−2107.5 YR 5/84CR-SBm-s8−15-
Bt/R210−360+10 YR 5/8−7.5 YR 5/60−3 CR-SBm-s10−15-
CiF233939°44′15.55″N 16° 12′31.68″EAk0−287.5 YR 6/4−10YR 5/41.7−0CR-SBw-s--
Bkm28−56+
CiF130039°44′08.00"N 16°12′35.24″EABt0−20/237.5 YR 5/6−5YR 5/63−6SB-ABw15−208−10
Bt20/23−557.5 YR 5/8−5YR 5/84−8AB-Pm-s30−3510−15
CiF26339°44′17.11"N 16°12′46.22″EAk0−1607.5 YR 6/41.7SB-ABs-vs--
Bt1160−1832.5 YR 5/6−5YR 6/69−5SB-ABw-m8−15-
Bt2183−300+2.5 YR 5/6−5YR 5/69−6SB-ABw-m8−158−10
CiF-111639°44′07.54″N 16°13′52.74″EABt0−8/107.5 YR 5/6−10YR 5/83-0CR-SBw-m8−15-
Bt8/10−100+2.5 YR 6/6−7.5YR 6/67.5−2.5SB-ABw-m15−208−10
Structure CR= Crumby; SB= subangular blocky; AB= angular blocky; P=prismatic; Consistence s= strong; vs= very strong; w= weak; m= moderate.
Table 3. Main chemical-physical properties of soil profiles.
Particle Size Distribution
Soil ProfileHorizonSand %Silt %Clay %pH (H2O)O.M %CSC (cmol(+)/Kg)
CiF3ABt11.372.716.08.12.119.6
Bt/R43.438.718.08.11.816.8
CiF2Ak48.839.212.07.92.236.3
CiF1ABt44.941.114.08.02.322.7
Bt42.441.616.08.00.524.0
CiFAk71.722.36.08.10.66.3
Bt150.531.518.08.10.817.5
Bt262.423.614.08.10.213.8
CiF-1ABt69.422.68.06.81.813.8
Bt91.80.208.07.10.310.1
Table 4. Data of selective extraction and related geochemical indices in the soil profiles. Feo, Fed and Fet indicate the acid ammonium oxalate extractable iron, dithionite-citrate-bicarbonate extractable iron pool and total iron, respectively.
Soil ProfileHorizonFeo%Fed%Fet%Feo/Fed Fed/FetFet−Fed(Fed−Feo)/Fet∑ ((Fed/Fet)*h/H ∑ ((Fed−Feo)/Fet)*h/H
CiF3ABt0.062.284.690.030.492.410.470.48(±0.01)0.46 (±0.01)
Bt/R0.081.883.990.040.472.110.45
CiF2Ak0.091.594.680.060.343.090.320.34(±0.00)0.32(±0.00)
CiF1ABt0.061.824.260.030.432.440.410.37(±0.05)0.35(±0.06)
Bt0.141.795.410.080.333.620.30
CiFAk0.020.472.070.040.231.600.220.31(±0.12)0.30(±0.11)
Bt10.061.474.110.040.362.640.34
Bt20.061.533.590.040.432.060.41
CiF-1ABt0.101.202.690.080.451.490.410.41(±0.03)0.38(±0.03)
Bt0.040.791.970.050.401.180.38
Table 5. Expected magnitude values for the investigated fault were estimated using fault-length-based scaling relationships, according to the empirical laws proposed by Wells and Coppersmith [132], Wesnousky [133], and Stirling et al. [134]. The calculations are based on a total fault length (L) of 16 km (Figure 2c).
ReferenceEmpirical Scaling LawMw
Wells and Coppersmith [132]Mw = 5.08 + 1.16 log L6.48
Wesnousky [133]Mw = 6.12 + 0.47 log L6.69
Stirling Et Al. [134]Mw = 5.88 + 0.088 log L6.84
Disclaimer/Publisher’s Note: The statements, opinions and data contained in all publications are solely those of the individual author(s) and contributor(s) and not of MDPI and/or the editor(s). MDPI and/or the editor(s) disclaim responsibility for any injury to people or property resulting from any ideas, methods, instructions or products referred to in the content.