Article

Robust and Transferable Elevation-Aware Multi-Resolution Network for Semantic Segmentation of LiDAR Point Clouds in Powerline Corridors

1
Electric Power Research Institute, Yunnan Power Grid Company Ltd., Kunming 650217, China
2
State Key Laboratory of Information Engineering in Surveying Mapping and Remote Sensing, Wuhan University, Wuhan 430079, China
*
Author to whom correspondence should be addressed.
Remote Sens. 2025, 17(19), 3318; https://doi.org/10.3390/rs17193318
Submission received: 31 August 2025 / Revised: 22 September 2025 / Accepted: 26 September 2025 / Published: 27 September 2025
(This article belongs to the Special Issue Urban Land Use Mapping Using Deep Learning)

Abstract

Highlights

What are the main findings?
  • We propose EMPower-Net, a novel LiDAR point cloud segmentation network tailored for powerline corridors, which integrates an elevation-aware embedding and multi-resolution contextual learning.
  • EMPower-Net achieves state-of-the-art performance in powerline corridor datasets and shows strong generalization ability across different geographic regions.
What is the implication of the main finding?
  • The elevation-aware design substantially improves the recognition of critical vertical structures such as power lines and towers, ensuring more reliable safety analysis of transmission corridors.
  • The demonstrated transferability highlights EMPower-Net’s potential for large-scale deployment in real-world corridor inspection.

Abstract

Semantic segmentation of LiDAR point clouds in powerline corridor environments is crucial for the intelligent inspection and maintenance of power infrastructure. However, existing deep learning methods often underperform in such scenarios due to severe class imbalance, sparse and long-range structures, and complex elevation variations. We propose EMPower-Net, an Elevation-Aware Multi-Resolution Network, which integrates an Elevation Distribution (ED) module to enhance vertical geometric awareness and a Multi-Resolution (MR) module to enhance segmentation accuracy for corridor structures with varying object scales. Experiments on real-world datasets from Yunnan and Guangdong show that EMPower-Net outperforms state-of-the-art baselines, especially in recognizing power lines and towers with high structural fidelity under occlusion and dense vegetation. Ablation studies confirm the complementary effects of the MR and ED modules, while transfer learning results reveal strong generalization with minimal performance degradation across different powerline regions. Additional tests on urban datasets indicate that the proposed elevation features are also effective for vertical structure recognition beyond powerline scenarios.

1. Introduction

With the continuous expansion of power grid infrastructure, ensuring the safety and efficiency of powerline corridor inspections has become a pressing challenge. Traditional manual methods are time-consuming, labor-intensive, and prone to safety risks [1], while Aerial photogrammetry is constrained by limited spatial resolution, making it difficult to accurately extract fine structures such as power lines and towers [2,3]. In contrast, airborne LiDAR provides high-resolution three-dimensional data with strong penetration and spatial accuracy, enabling detailed modeling of power lines, towers, and surrounding vegetation, thereby offering a reliable foundation for automated inspection and analysis.
Semantic classification of point clouds is a critical step in the safety analysis and intelligent asset management of powerline corridors. Existing classification methods can be broadly divided into traditional, machine learning-based, and deep learning-based approaches. Traditional and classical machine learning methods often rely on handcrafted features, which struggle to adapt to the complex and diverse environments of powerline corridors. Deep learning methods, by contrast, learn discriminative features directly from data, significantly improving classification accuracy and generalization [4].
Among deep learning approaches, point cloud classification is typically implemented through multi-view projection, voxelization, or point-based methods. Multi-view and voxel-based methods convert 3D point clouds into 2D images [5] or 3D voxels [6], enabling the use of convolutional neural networks (CNNs). However, these transformations often cause loss of geometric details and incur high computational costs, particularly as voxel resolution increases. In contrast, point-based methods operate directly on raw point clouds, better preserving spatial structure. For instance, PointNet++ [7] extracts features hierarchically with adaptive density-aware sampling; DGCNN [8] introduces dynamic graph convolutions for local geometry learning; RandLA-Net [9] enables large-scale segmentation through random sampling and local feature aggregation; and Transformer-based methods [10,11,12,13] improve contextual reasoning via attention mechanisms
However, existing deep learning methods [13,14,15,16] are predominantly designed and benchmarked on indoor [17,18] or urban datasets [19,20,21], and often fail to generalize to the unique characteristics of powerline corridor point clouds. These data exhibit high intra-class elevation differences, uneven point densities, and extreme class imbalance, especially between ground, vegetation, and the relatively sparse yet critical power lines and towers. Moreover, powerline corridor point clouds are characterized by long-range structures and significant vertical variation, which are not well captured by generic neighborhood definitions. As a result, features learned by generic models often lack semantic sensitivity to elevation and spatial structure, leading to poor segmentation performance in this domain.
To overcome these challenges, we propose the Elevation-Aware Multi-Resolution Network (EMPower-Net), a novel architecture tailored for LiDAR point cloud semantic segmentation in powerline corridors. EMPower-Net explicitly models both vertical and multi-scale spatial characteristics of point clouds, with its design directly motivated by the unique data features: the Elevation Distribution (ED) module captures the substantial vertical differences to distinguish towers and suspended power lines from ground and vegetation, while the Multi-Resolution (MR) module employs multi-scale neighborhood sampling to effectively handle sparse, long-range structures and varying point densities. By incorporating these targeted modules, EMPower-Net achieves robust semantic segmentation in powerline corridor environments. The main contributions of this paper are as follows:
  • Elevation-Aware Embedding: We design a histogram-based elevation distribution module that directly models vertical structural differences. This targeted embedding substantially improves the discrimination of towers and suspended power lines from ground and vegetation.
  • Multi-Resolution Contextual Learning: We introduce a multi-scale strategy that simultaneously captures fine-grained local details and long-range sparse structures. This design effectively enhances segmentation accuracy for complex transmission corridor structures with varying object scales, addressing challenges that standard single-scale approaches struggle to handle.
  • Transferable Feature Learning: We demonstrate that the proposed method not only achieves state-of-the-art performance on the training region (Yunnan dataset) but also exhibits strong generalization when transferred to a different region (Guangdong dataset) with diverse vegetation and occlusion conditions.
  • Urban Generalization Validation: Beyond powerline corridors, we validate the elevation-aware features on the WHU3D and Paris-Lille-3D urban dataset, showing improved segmentation for buildings and other vertical structures.

2. Related Work

2.1. Multi-View-Based Methods

Inspired by convolutional neural networks (CNNs), researchers proposed multi-view-based methods, which project 3D point clouds onto multiple 2D views, extract features using CNNs, and then aggregate the information for classification. The MVCNN network proposed by Su et al. [22] was a pioneering study in this domain, using max pooling to aggregate multi-view features but suffering from significant feature loss. To address this issue, SnapNet [23] combined RGB and depth views for pixel-wise labeling before reprojecting the results into 3D space. Chen et al. [24] introduced MV3D, which employed multi-modal fusion to further improve classification performance. Multi-view methods offer ease of deployment using standard CNNs, but they suffer from projection-induced information loss and limited spatial expressiveness in 3D.

2.2. Voxel-Based Methods

Voxel-based methods partition point clouds into structured voxel grids and extract features using 3D convolutional networks. Early works like VoxNet [25] and 3DShapeNet [26] demonstrated the effectiveness of voxelization but suffered from high computational costs and information loss. To mitigate these issues, researchers introduced data structures such as octrees. O-CNN [27] and Oct-Net [28] leveraged sparse voxel storage to reduce computational burden, while PointGrid [29] integrated point sampling to enhance local feature extraction. PVCFormer [30] extracts features from both point-based and voxel-based representations, simultaneously expanding the receptive field while enhancing the segmentation capability for small-scale features. To reduce the accuracy loss caused by voxelization, Zhu [31] proposed a cylindrical voxel partitioning method combined with asymmetric convolution to better capture geometric patterns in point clouds. Additionally, a point-wise refinement module was introduced to mitigate the loss of local features induced by voxelization. Zhang [32] introduced a Transformer architecture based on voxels to capture long-range contextual information, while incorporating a relative attention module to encode point cloud positions, thereby improving both the speed and accuracy of point cloud classification. Voxel-based methods provide a structured and computationally tractable representation for 3D data, enabling the use of 3D convolutions and Transformer-based architectures. While they effectively capture local context and allow for scalable processing, these methods inevitably introduce quantization artifacts and may lose fine-grained geometric details—particularly problematic for small or long-range objects such as power lines.

2.3. Point-Based Methods

Point-based methods directly process raw point clouds, preserving geometric structures without requiring regularization. PointNet [33] was the first end-to-end framework for point cloud classification, utilizing multilayer perceptrons (MLPs) and max pooling to extract global features but lacking local geometric modeling. PointNet++ [7] introduced hierarchical feature aggregation, learning multi-scale features through layered sampling, thereby enhancing sensitivity to local structures. RandLa-Net [9] further improved scalability to large-scale point clouds by introducing a random sampling strategy combined with efficient local feature aggregation.
To further enhance classification accuracy and generalization, researchers explored graph- and attention-based approaches. DGCNN [8] dynamically constructed graphs in feature space and leveraged the EdgeConv module for local feature extraction. PointConv [34] proposed density-normalized convolution to achieve translation and permutation invariance. More recently, Transformer-based approaches have gained attention in point cloud processing. PCT [10] incorporated farthest point sampling and nearest neighbor search to improve local feature extraction. To address computational and memory efficiency, improved versions such as PCTv2 [12] and PCTv3 [11] have been proposed. Meanwhile, SPT [13,35] introduced a hybrid approach by combining graph neural networks and attention mechanisms, using super-points to build graphs and thereby reducing memory overhead. To mitigate the dependency on labeled data, Point-BERT [36] applied a BERT-style pretraining paradigm to learn global representations from unlabeled point clouds.
In summary, point-based methods have demonstrated strong performance in semantic segmentation tasks due to their ability to directly operate on raw point clouds, preserving geometric fidelity without the need for intermediate representations. The integration of dynamic graph structures and attention mechanisms has further improved their capacity to capture local and global spatial dependencies. However, most existing methods are primarily developed and benchmarked on urban or indoor datasets (e.g., S3DIS [18], SemanticKITTI [37]), where point distributions are relatively uniform and class structures are well-separated. In contrast, powerline corridor data exhibit highly unbalanced class distributions, severe point sparsity in critical structures (e.g., wires), and complex elevation variations, which pose significant challenges to generalization. Furthermore, few point-based methods incorporate domain-specific priors, such as elevation context or structure-aware feature design, which are essential for accurate segmentation in this application domain.

3. Methodology

In this study, we propose an Elevation-aware Multi-Resolution Network for LiDAR point cloud classification in powerline corridors. The overall architecture of EMPower-Net is depicted in Figure 1. Built upon the Point Transformer backbone [10], EMPower-Net introduces two key modules: the Elevation Distribution module and the Multi-Resolution module. The Elevation Distribution module enhances the network’s ability to model vertical structures by integrating elevation information with the original point coordinates and intensity values. These enriched features are concatenated and used as the input to the network. The Multi-Resolution module captures geometric patterns at various spatial scales, enabling the extraction of both local and global contextual features. A final linear classification layer maps the learned representations to point-wise category probabilities.

3.1. Backbone

We adopt Point Transformer [11] as the backbone due to its superior ability to model complex local dependencies and its demonstrated performance on various semantic segmentation benchmarks. Unlike traditional convolution-based or MLP-based methods, Point Transformer uses self-attention mechanisms tailored for unordered point clouds, which are essential for capturing context in powerline scenes. Given an input point cloud P R N × 3 , where each of the N points is defined by its 3D coordinates (x, y, z) and additional attributes such as intensity and color, Point Transformer applies a self-attention mechanism specifically designed for point cloud data. It encodes local geometric relationships using relative positional encodings and aggregates features adaptively. For each point, a local neighborhood is constructed using k-nearest neighbors (k-NN), and attention is applied over these neighbors to update the point features. The output is a refined feature matrix F R N × 3 , which captures both fine-grained geometric structures and broader contextual information. In our implementation, we set the number of nearest neighbors k to 20, and the feature dimension is progressively increased to 128 through three attention layers.

3.2. Elevation Distribution Module

Powerline corridors present complex vertical structures, including overhead wires, tall transmission towers, and varying vegetation heights. These structures exhibit distinct elevation characteristics that are critical for accurate semantic classification. However, traditional point-wise features such as raw 3D coordinates and intensity are often insufficient to capture the vertical distribution patterns surrounding a point, especially in sparsely annotated or noisy LiDAR datasets. To address this limitation, we design an Elevation Distribution Module that explicitly encodes the vertical spatial distribution of neighboring points using histogram-based elevation profiles.
The core idea behind this module is to model the local vertical geometry around each point p by computing a histogram of relative elevations. Specifically, for each point, we collect its neighboring points within a fixed vertical range r. The vertical range is then partitioned into H1 fixed-size bins (set to 1 m per bin in our experiments), both above and below the reference point. Each bin accumulates the number of neighboring points whose vertical displacement from p falls within the bin’s interval. This results in a histogram vector h R H 1 that characterizes the local elevation profile centered at p.
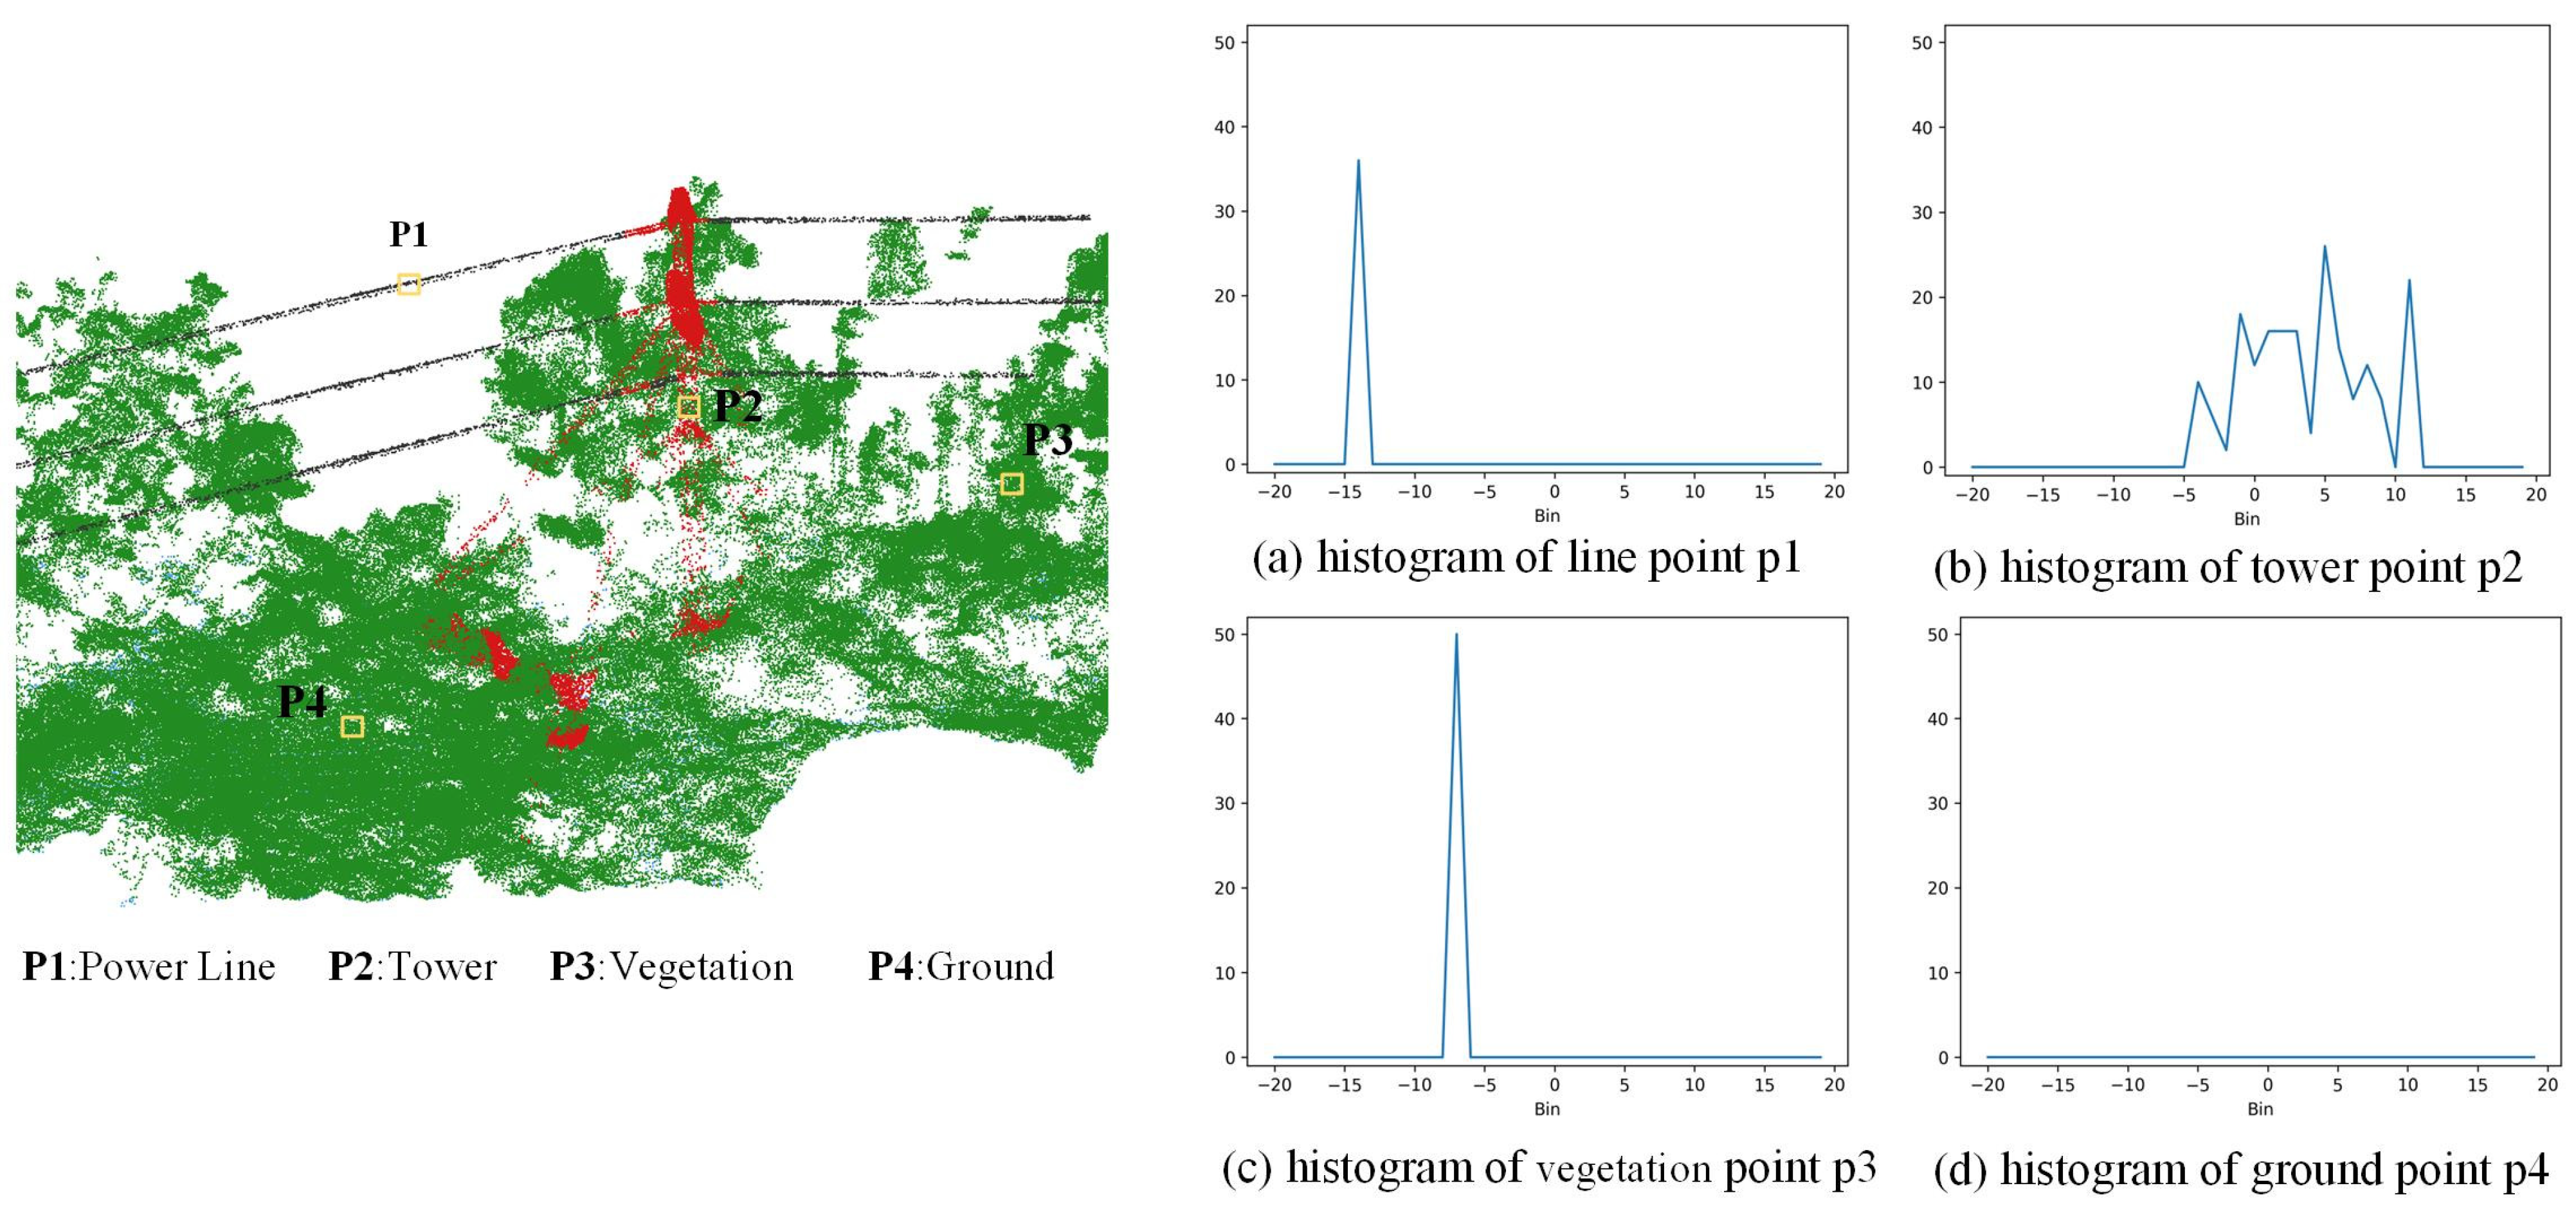
This histogram serves as a statistical representation of vertical structure, providing rich information for distinguishing classes with similar geometry but differing heights—e.g., wires versus low vegetation. For example, as illustrated in Figure 2, ground points typically yield flat histograms with zero counts, reflecting the absence of vertical neighbors. In contrast, tower points generate compact high-value bins centered around the reference height, due to their vertically stacked nature. Powerline and vegetation points tend to produce skewed distributions, with higher bin counts below the reference point, corresponding to their suspended or canopy positions.
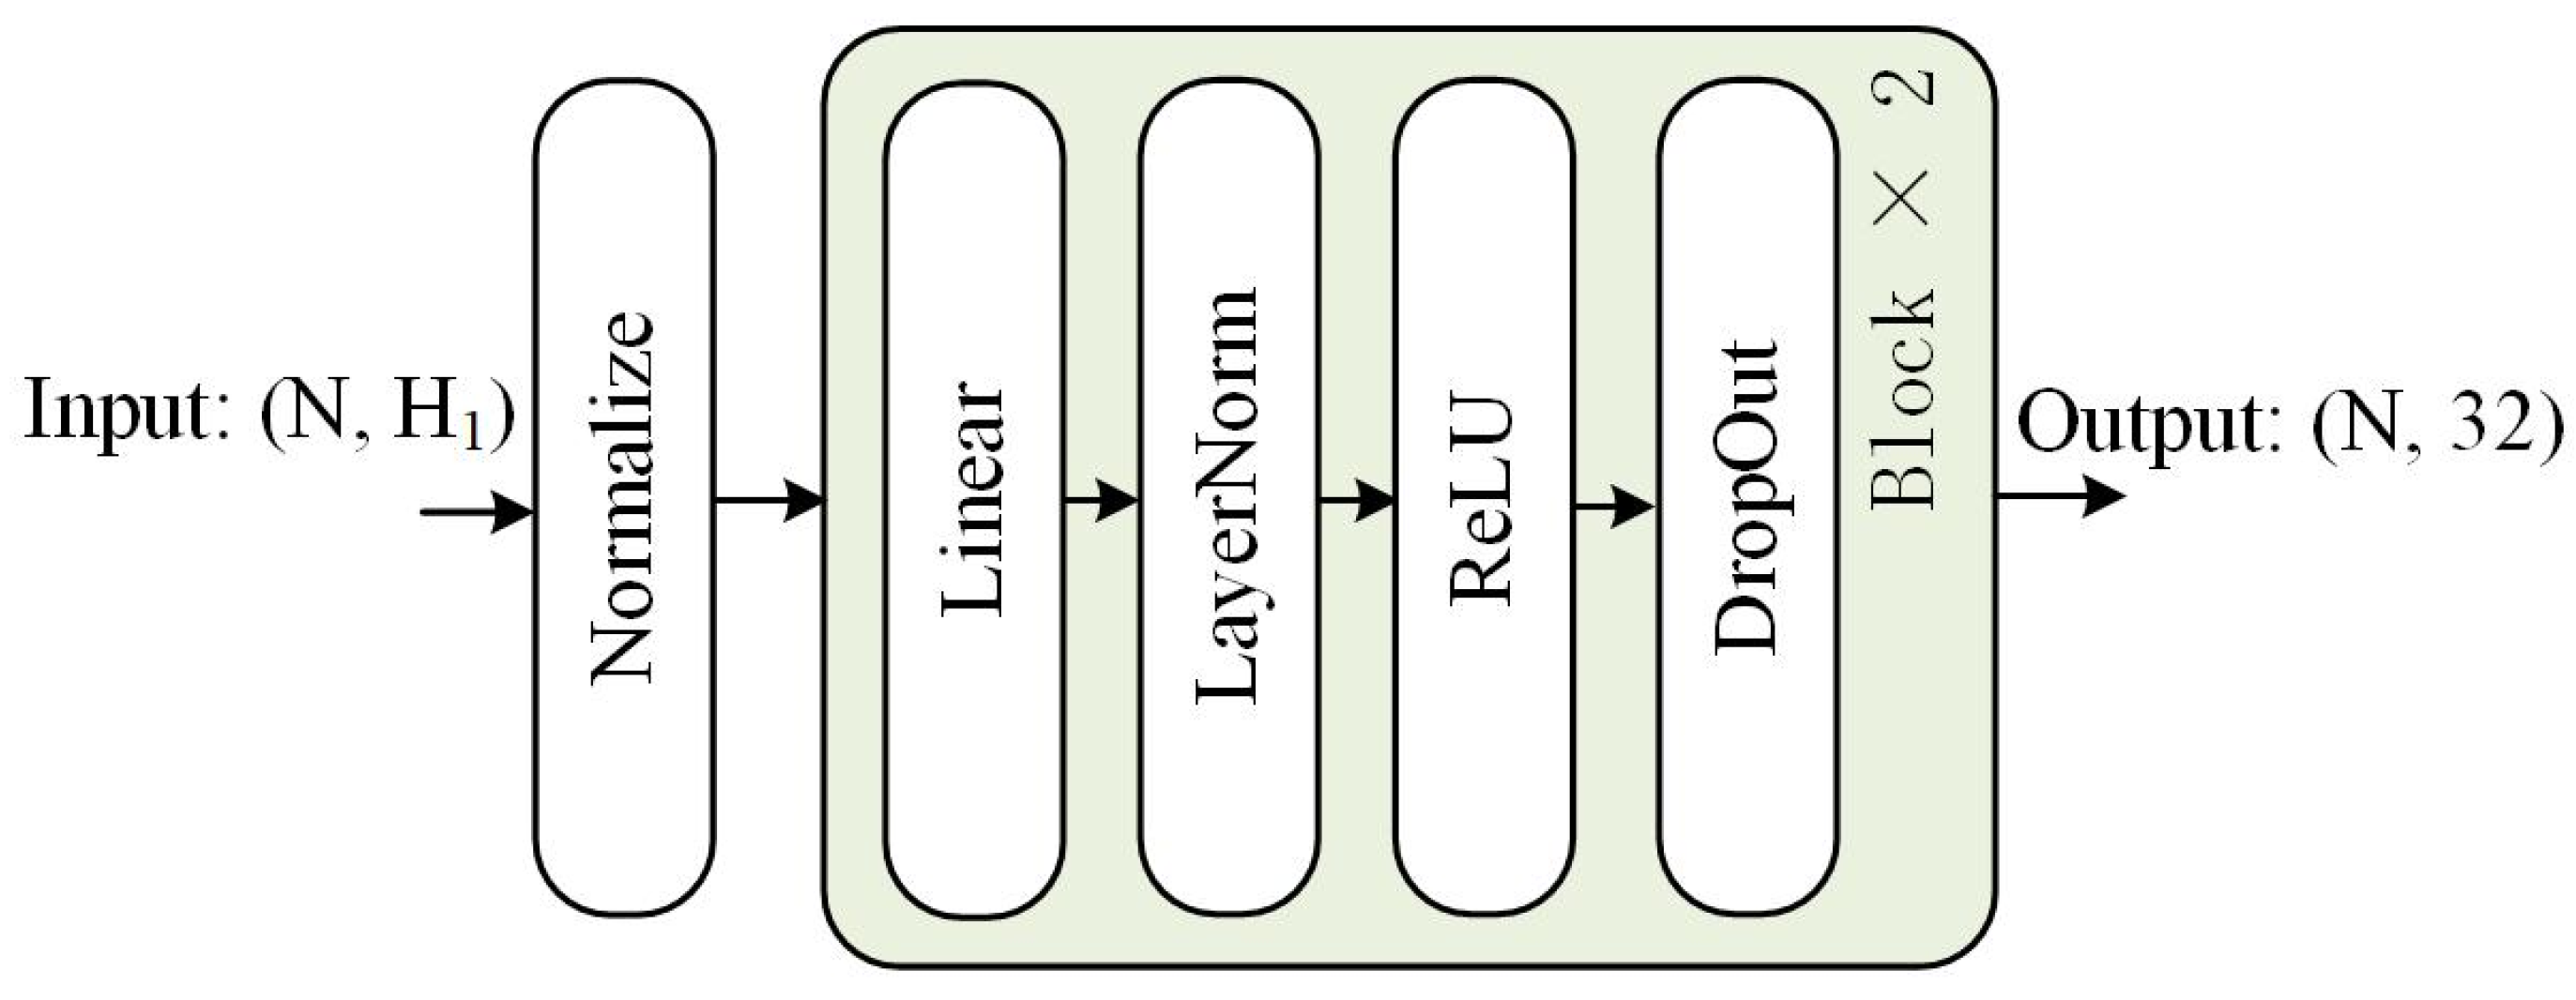
To incorporate these elevation histograms into the learning framework, we pass them through a lightweight embedding network (Figure 3). This consists of a multi-layer perceptron (MLP) with a hidden dimension sequence of [H1, 128, 64, 32], where H1 is the input histogram length. Each layer is followed by Layer Normalization, ReLU activation, and a Dropout layer (dropout rate set to 0.2) for regularization. This block is repeated twice using independent parameters to improve feature abstraction and generalization. Prior to inputting into the MLP, all histograms are normalized to unit scale, ensuring scale invariance and enhancing training stability.
The resulting feature vector, encoding height-aware contextual information, is concatenated with the raw input features—including 3D coordinate, normalized elevation, and intensity—to form the final input representation for the main network. This fusion allows the model to jointly leverage absolute location, point-wise properties, and local elevation distributions in a unified feature space.

3.3. Multiple Resolutions Module

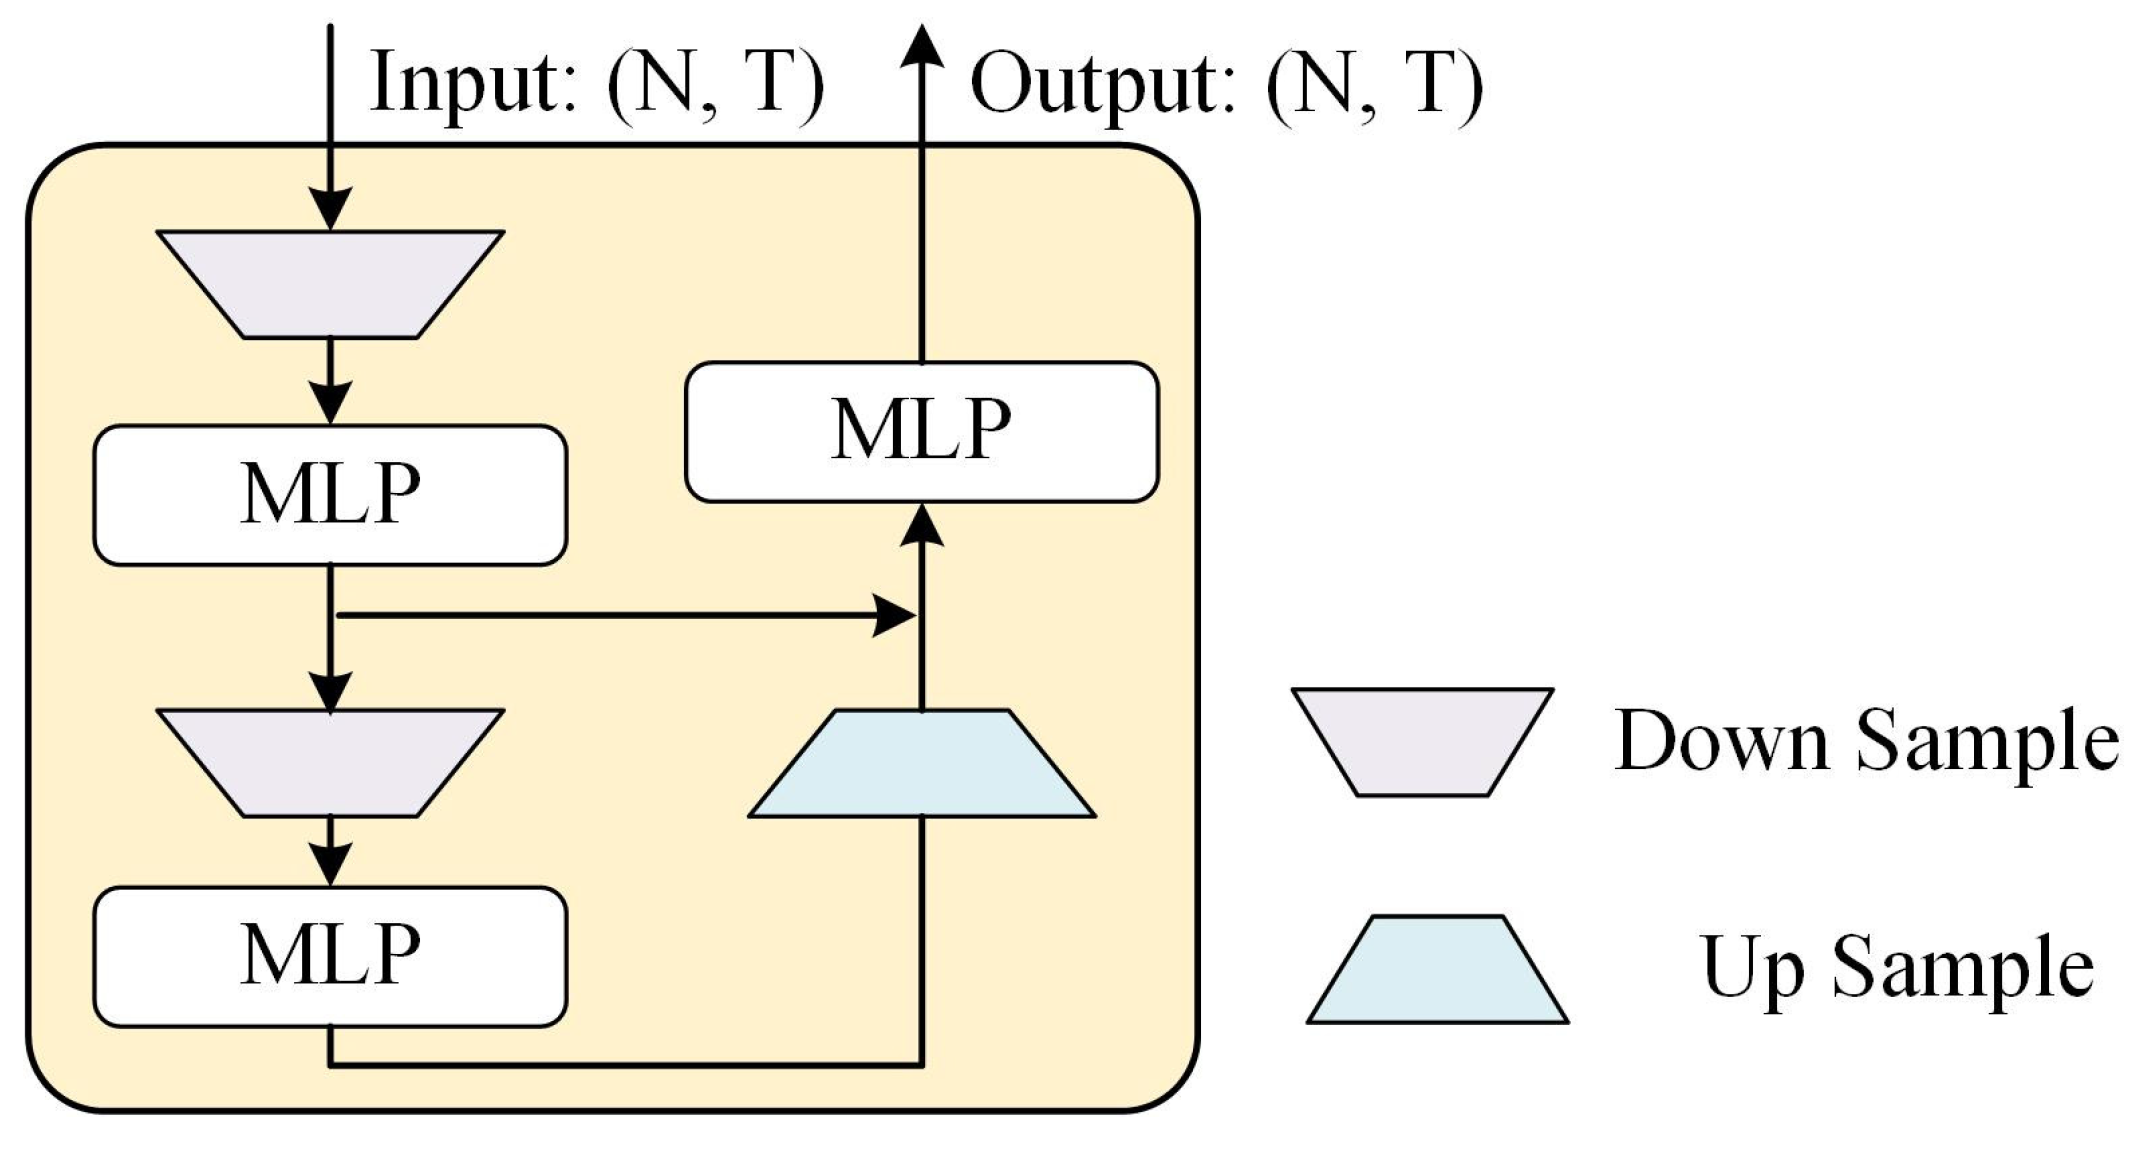
To effectively capture both fine-grained local geometry and broader contextual semantics, we propose a Multiple Resolutions Module (Figure 4) that extracts hierarchical representations from point clouds by encoding and fusing features across multiple spatial scales.
The core of this module is a multi-resolution feature hierarchy, inspired by encoder–decoder architectures such as U-Net, yet tailored specifically for unordered and irregular point cloud data. Given the initial point features F 0 R N × T extracted from the Point Transformer backbone—where T the feature dimension—we perform progressive spatial downsampling using Farthest Point Sampling (FPS). FPS selects a representative subset of points that are spatially well distributed, ensuring that the structural integrity of the scene is preserved even at lower resolutions.
In our implementation, we first reduce the point count from N to N/2, and then further downsample to N/4, forming a three-level hierarchy. At each level, the selected points retain their feature vectors from the previous layer. To increase the network’s capacity to learn abstract representations at coarser levels, we apply multi-layer perceptrons (MLPs) to the downsampled features, expanding their dimensionality (e.g., from 64 to 128 and 256). This enables the network to encode higher-order spatial context that may not be visible at the original resolution.
After encoding, we perform upsampling via interpolation to reconstruct the high-resolution feature maps. For each point in the higher-resolution level, we identify its k = 10 nearest neighbors in the lower-resolution set and apply inverse-distance weighted interpolation of the corresponding features. This interpolation scheme not only ensures smooth transitions between levels but also preserves local geometric fidelity. The interpolated features are then concatenated with the features at the higher-resolution level, forming a fused representation that integrates multi-scale context. To avoid feature explosion and retain computational efficiency, the concatenated features are passed through a compression MLP that reduces the feature dimensionality back to a target size (e.g., 64 or 128). This compressed output serves as the input to the subsequent classification head.
Additionally, to preserve information flow and gradient stability during training, we introduce residual skip connections between corresponding encoder and decoder levels. These connections help retain fine spatial details that may otherwise be lost during downsampling, which is especially important for detecting thin structures like powerlines.

4. Experiments

To validate the effectiveness of EMPower-Net, we conducted comparative experiments using RandLA-Net [9], DGCNN [8], CAC [38], OctFormer [39], SPT [13], OACNN [40], PCTv3 [11], BFANet [16] and CDSegNet [15] on Power Line corridor point clouds.

4.1. Experimental Dataset

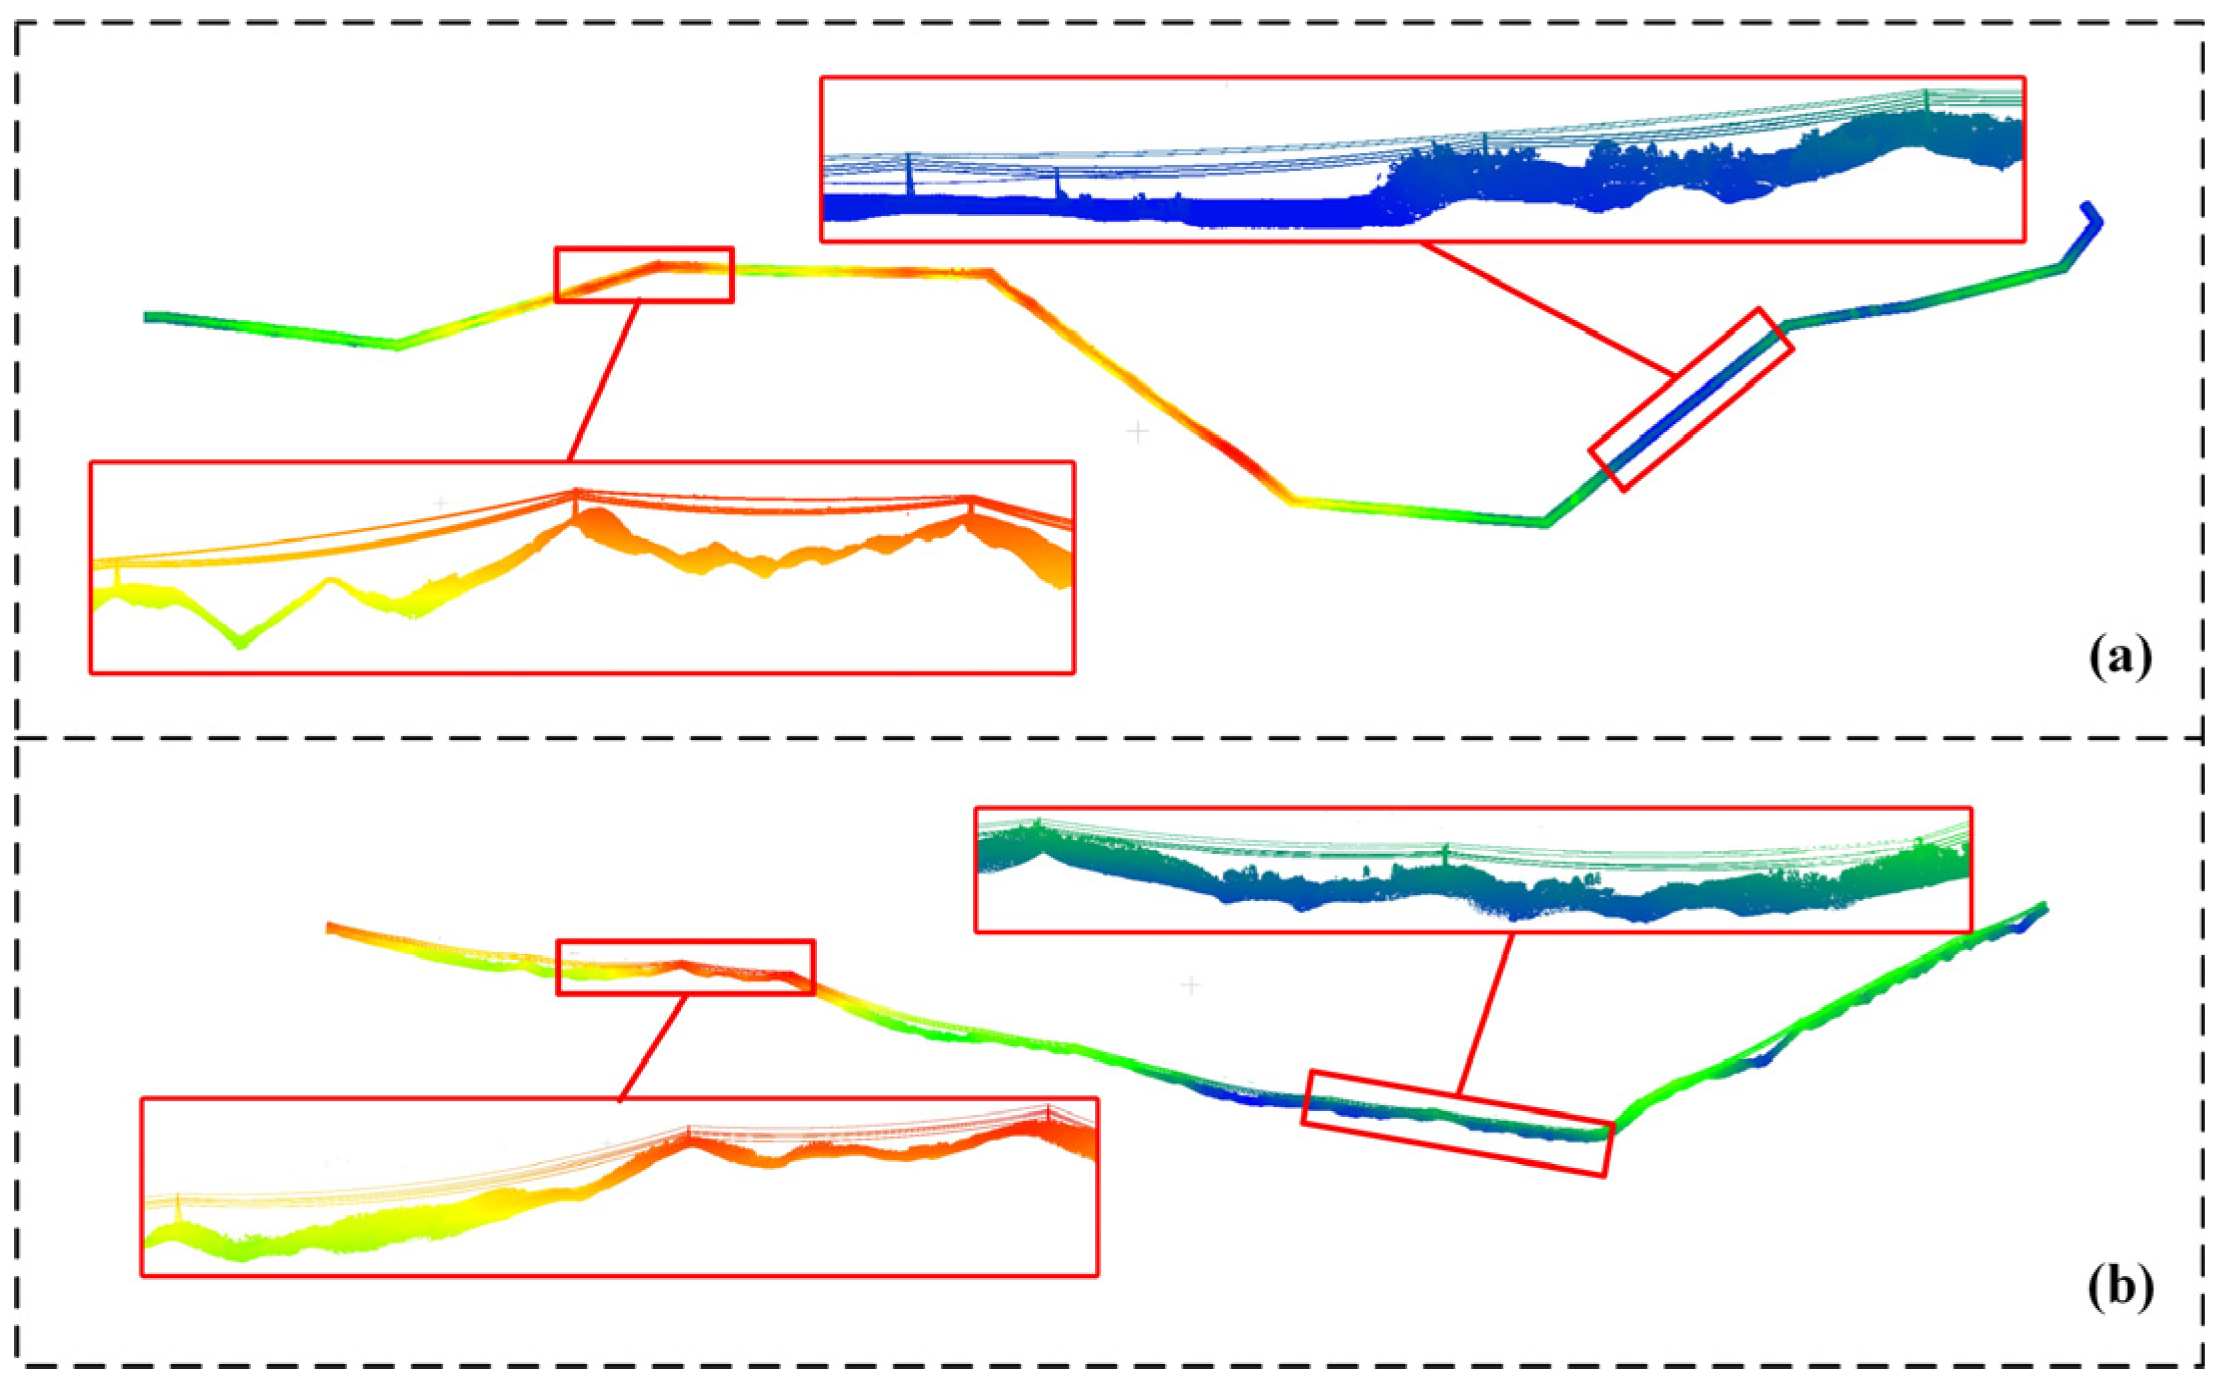
The dataset was collected from powerline corridors in Yunnan Province and Guangdong Province, China, using DJI M350 with DJI Zenmuse L2 (Made in Shenzhen, China) (Figure 5). The Yunnan dataset spans approximately 16.2 km of powerline corridors and contains 52 power towers, comprising a total of ~290 million points with an average point density of 89 points/m2. In contrast, the Guangdong dataset covers ~9.9 km, includes 19 towers, and contains approximately 48 million points with a lower average density of 11 points/m2. Importantly, the Yunnan dataset encompasses multiple powerline routes across diverse terrain and vegetation conditions, making it more complex and variable than the Guangdong dataset. In comparison, the Guangdong dataset consists of a single-line corridor, offering a more consistent spatial structure. All collected data underwent denoising preprocessing, resulting in a residual noise density of less than 1 × 10⁻⁵ pt/m2 in the point clouds.
Each point was manually labeled into one of four semantic categories: ground surface, vegetation, powerlines, and towers. Both datasets were independently divided into training, validation, and test sets using a 5:1:1 split ratio, ensuring robust and unbiased model evaluation under varying environmental conditions.
For performance assessment, we adopted four widely used classification metrics: Precision, Recall, F1-score, and Intersection over Union (IoU). Precision measures the proportion of correctly predicted points among all points predicted as a specific class, defined as follows:
P r e c = T P T P + F P
where TP and FP denote the numbers of true positive and false positive predictions, respectively. Recall reflects the proportion of correctly predicted points within all ground truth points of a given class, defined as follows:
R e c a l l = T P T P + F N
where FN represents false negatives. F1-score is the harmonic mean of precision and recall, serving as a balanced measure of both. It is calculated as
F 1 = 2 × P r e c × R e c a l l P r e c + R e c a l l
This metric is particularly effective in assessing performance on imbalanced classes, as it penalizes both over- and under-predictions. Intersection over Union (IoU) quantifies the overlap between the predicted and ground truth sets for each class. It is defined as follows:
IoU   = T P T P + F N + F N
representing the ratio of the intersection to the union of the predicted and actual point sets. All metrics are computed on a per-class basis and averaged across all semantic classes to obtain the overall performance.

4.2. Implementation Details

EMPower-Net was implemented in Python 3.8 using PyTorch 2.1, and all experiments were conducted on a workstation running Ubuntu 24.04. The hardware configuration includes an AMD Ryzen 5 3600 6-core processor (Made in Taiwan, China), 32 GB of RAM, and an NVIDIA RTX 3090 GPU with 24 GB of VRAM. The model was trained by Adam optimizer with a momentum of 0.9, an initial learning rate (lr) of 0.001, and a batch size of 4.
The attention mechanism follows the attention module of Point Transformer [11] with identical parameter settings, and the vertical range r and neighborhood size in the ED module were set to 60 and 1, respectively. Due to the limitations of GPU memory, it is not feasible to input the entire point cloud into the model for training. To address this, we perform voxel-based downsampling with a resolution of 1 m. For each voxel, the coordinate of the downsampled point is computed as the average of all point coordinates within the voxel, i.e., p = 1 n i = 1 n p i . Similarly, the color and intensity attributes of each downsampled point are obtained by averaging the corresponding attributes of all points within the voxel.
Considering that Power lines in our dataset are generally located within 30 m above the ground, we construct a vertical histogram for each point by collecting neighboring points within ±30 m along the vertical axis. The histogram is divided into 60 bins to represent the vertical distribution of surrounding points.
All models were trained on the same dataset using the same hardware environment. For fair comparison, the comparison models adopt their default parameter setting. Table 1 lists the default training parameters for each method. Minor adjustments, such as adapting the input size or batch size to our method, were made to ensure fair comparison and stable training. Due to the significant class imbalance across the four semantic categories, all methods adopted Weighted Cross-Entropy as the loss function to emphasize learning from minority classes. Specifically, the weight for each class w i was computed as follows:
w i = 1 C i N
where C i denotes the number of points in class i, and N is the total number of points across all classes.

4.3. Qualitative Comparison

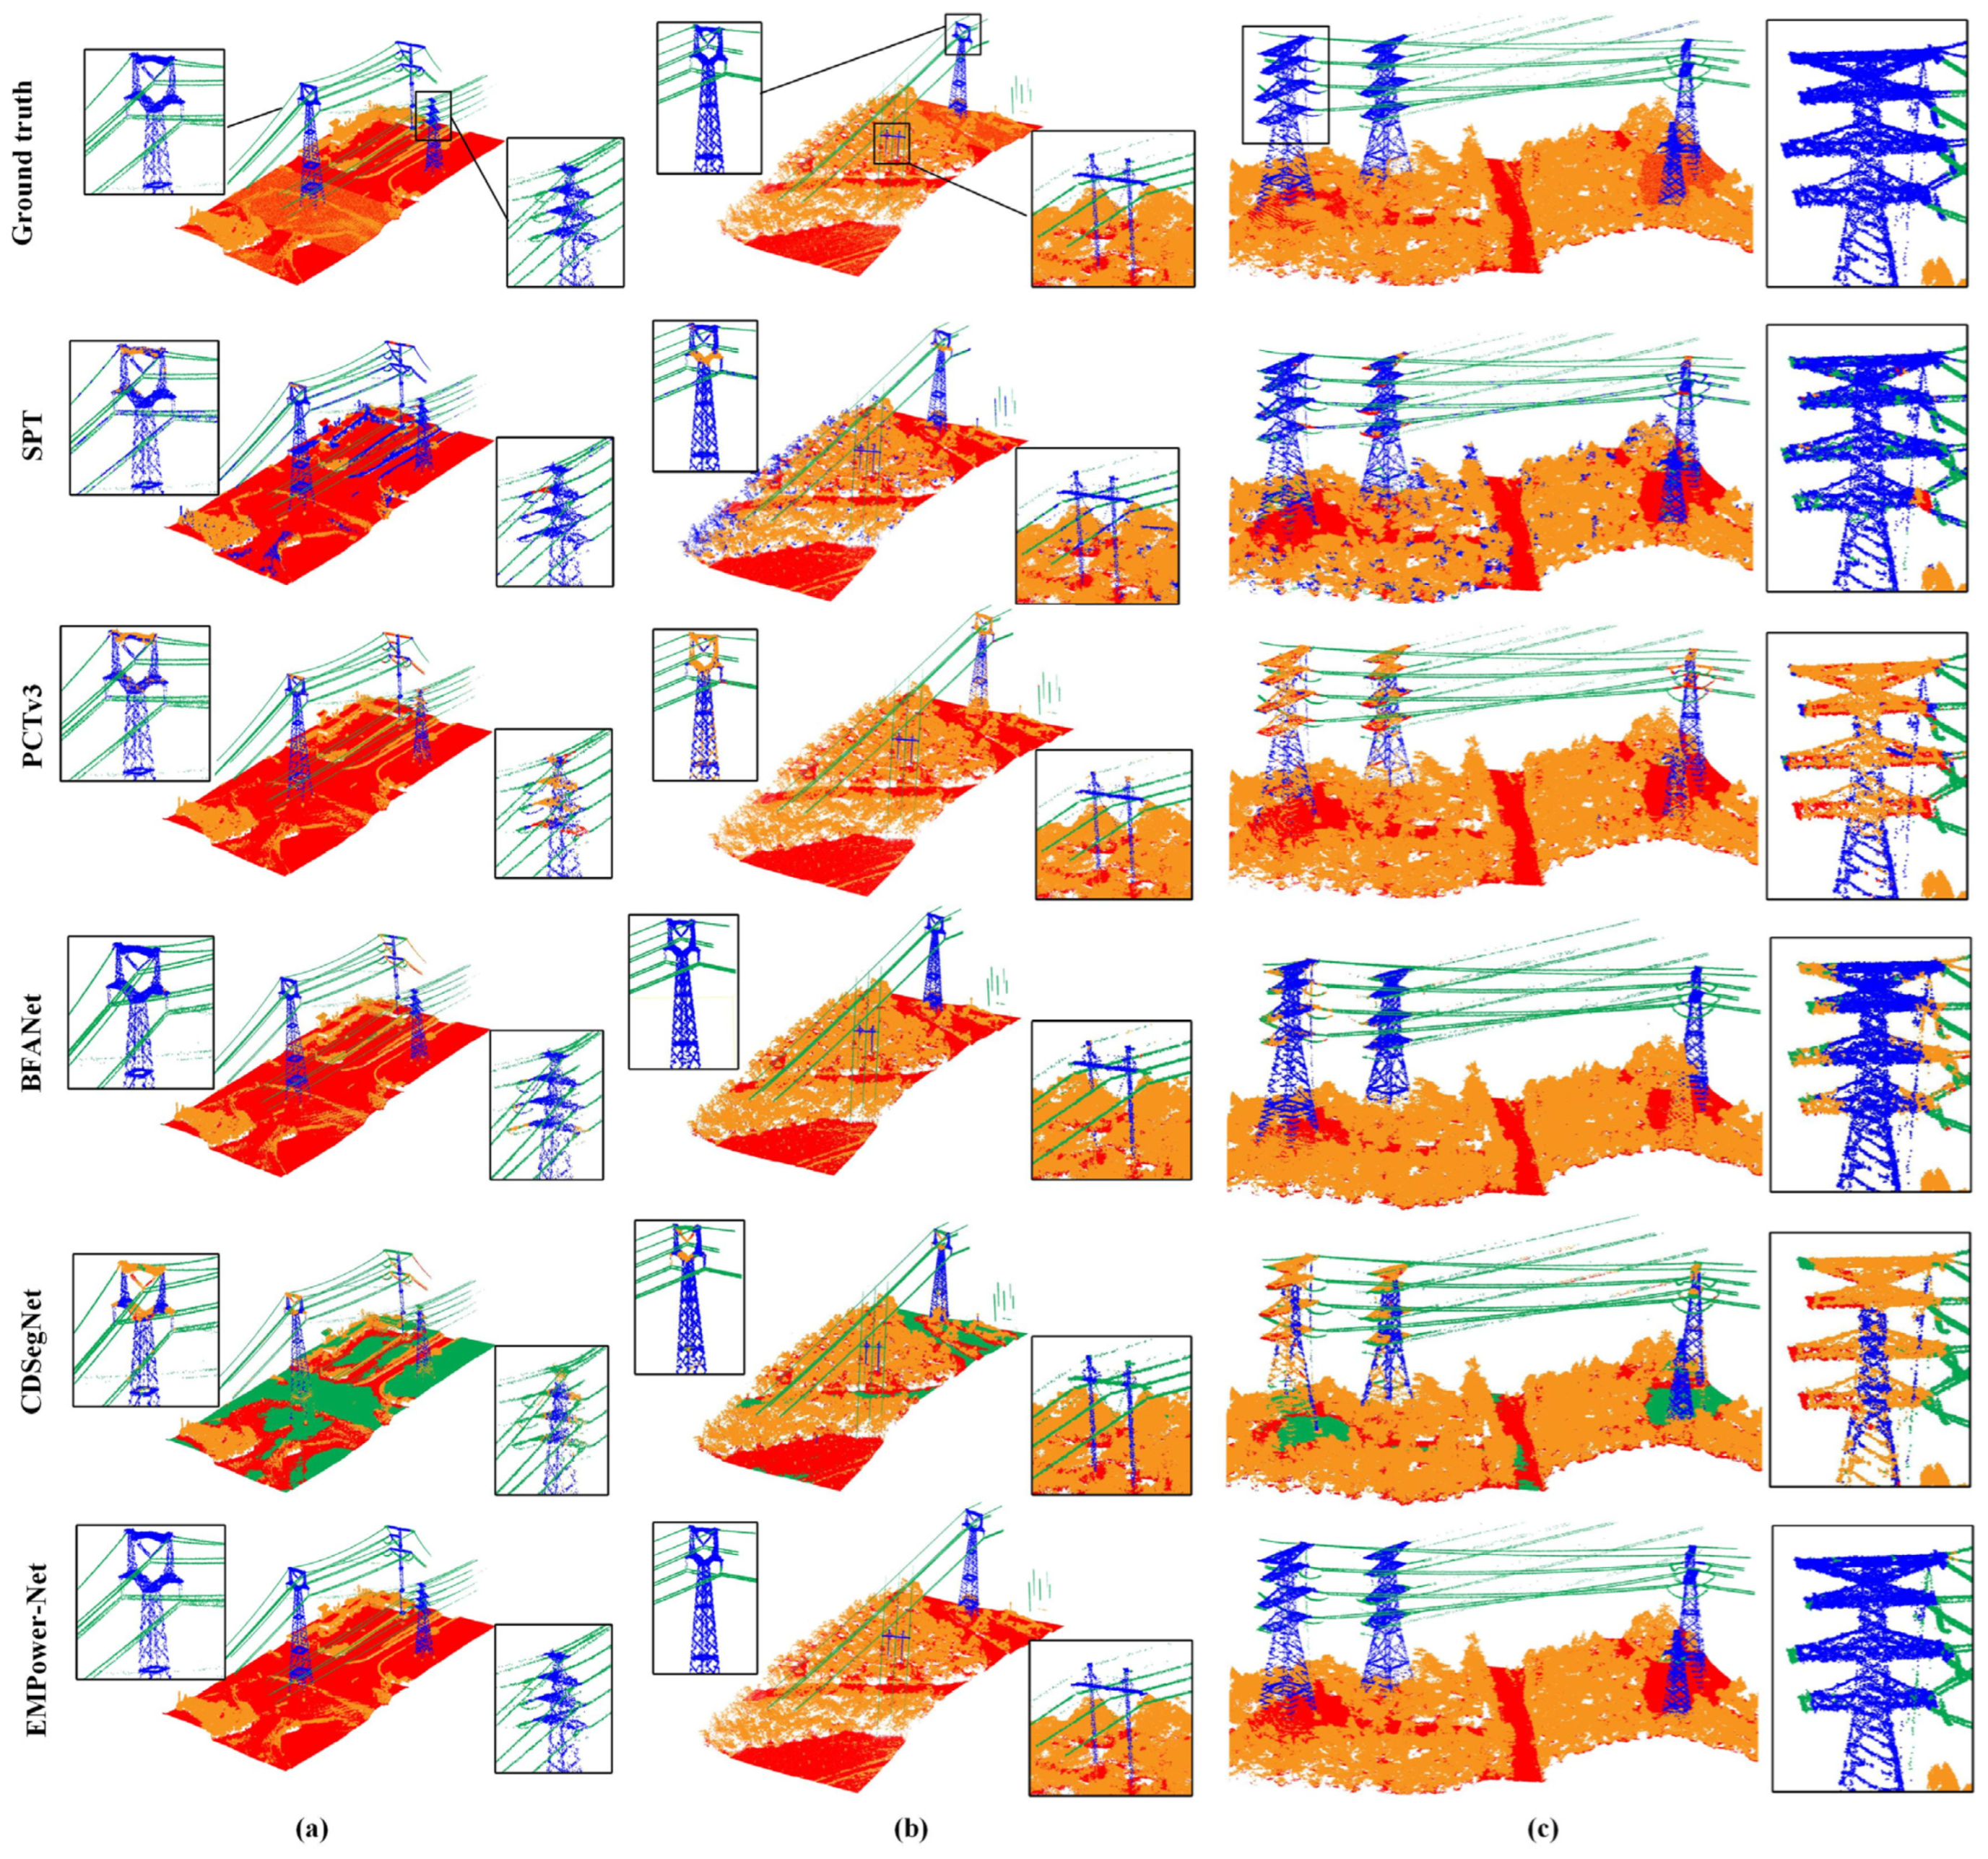
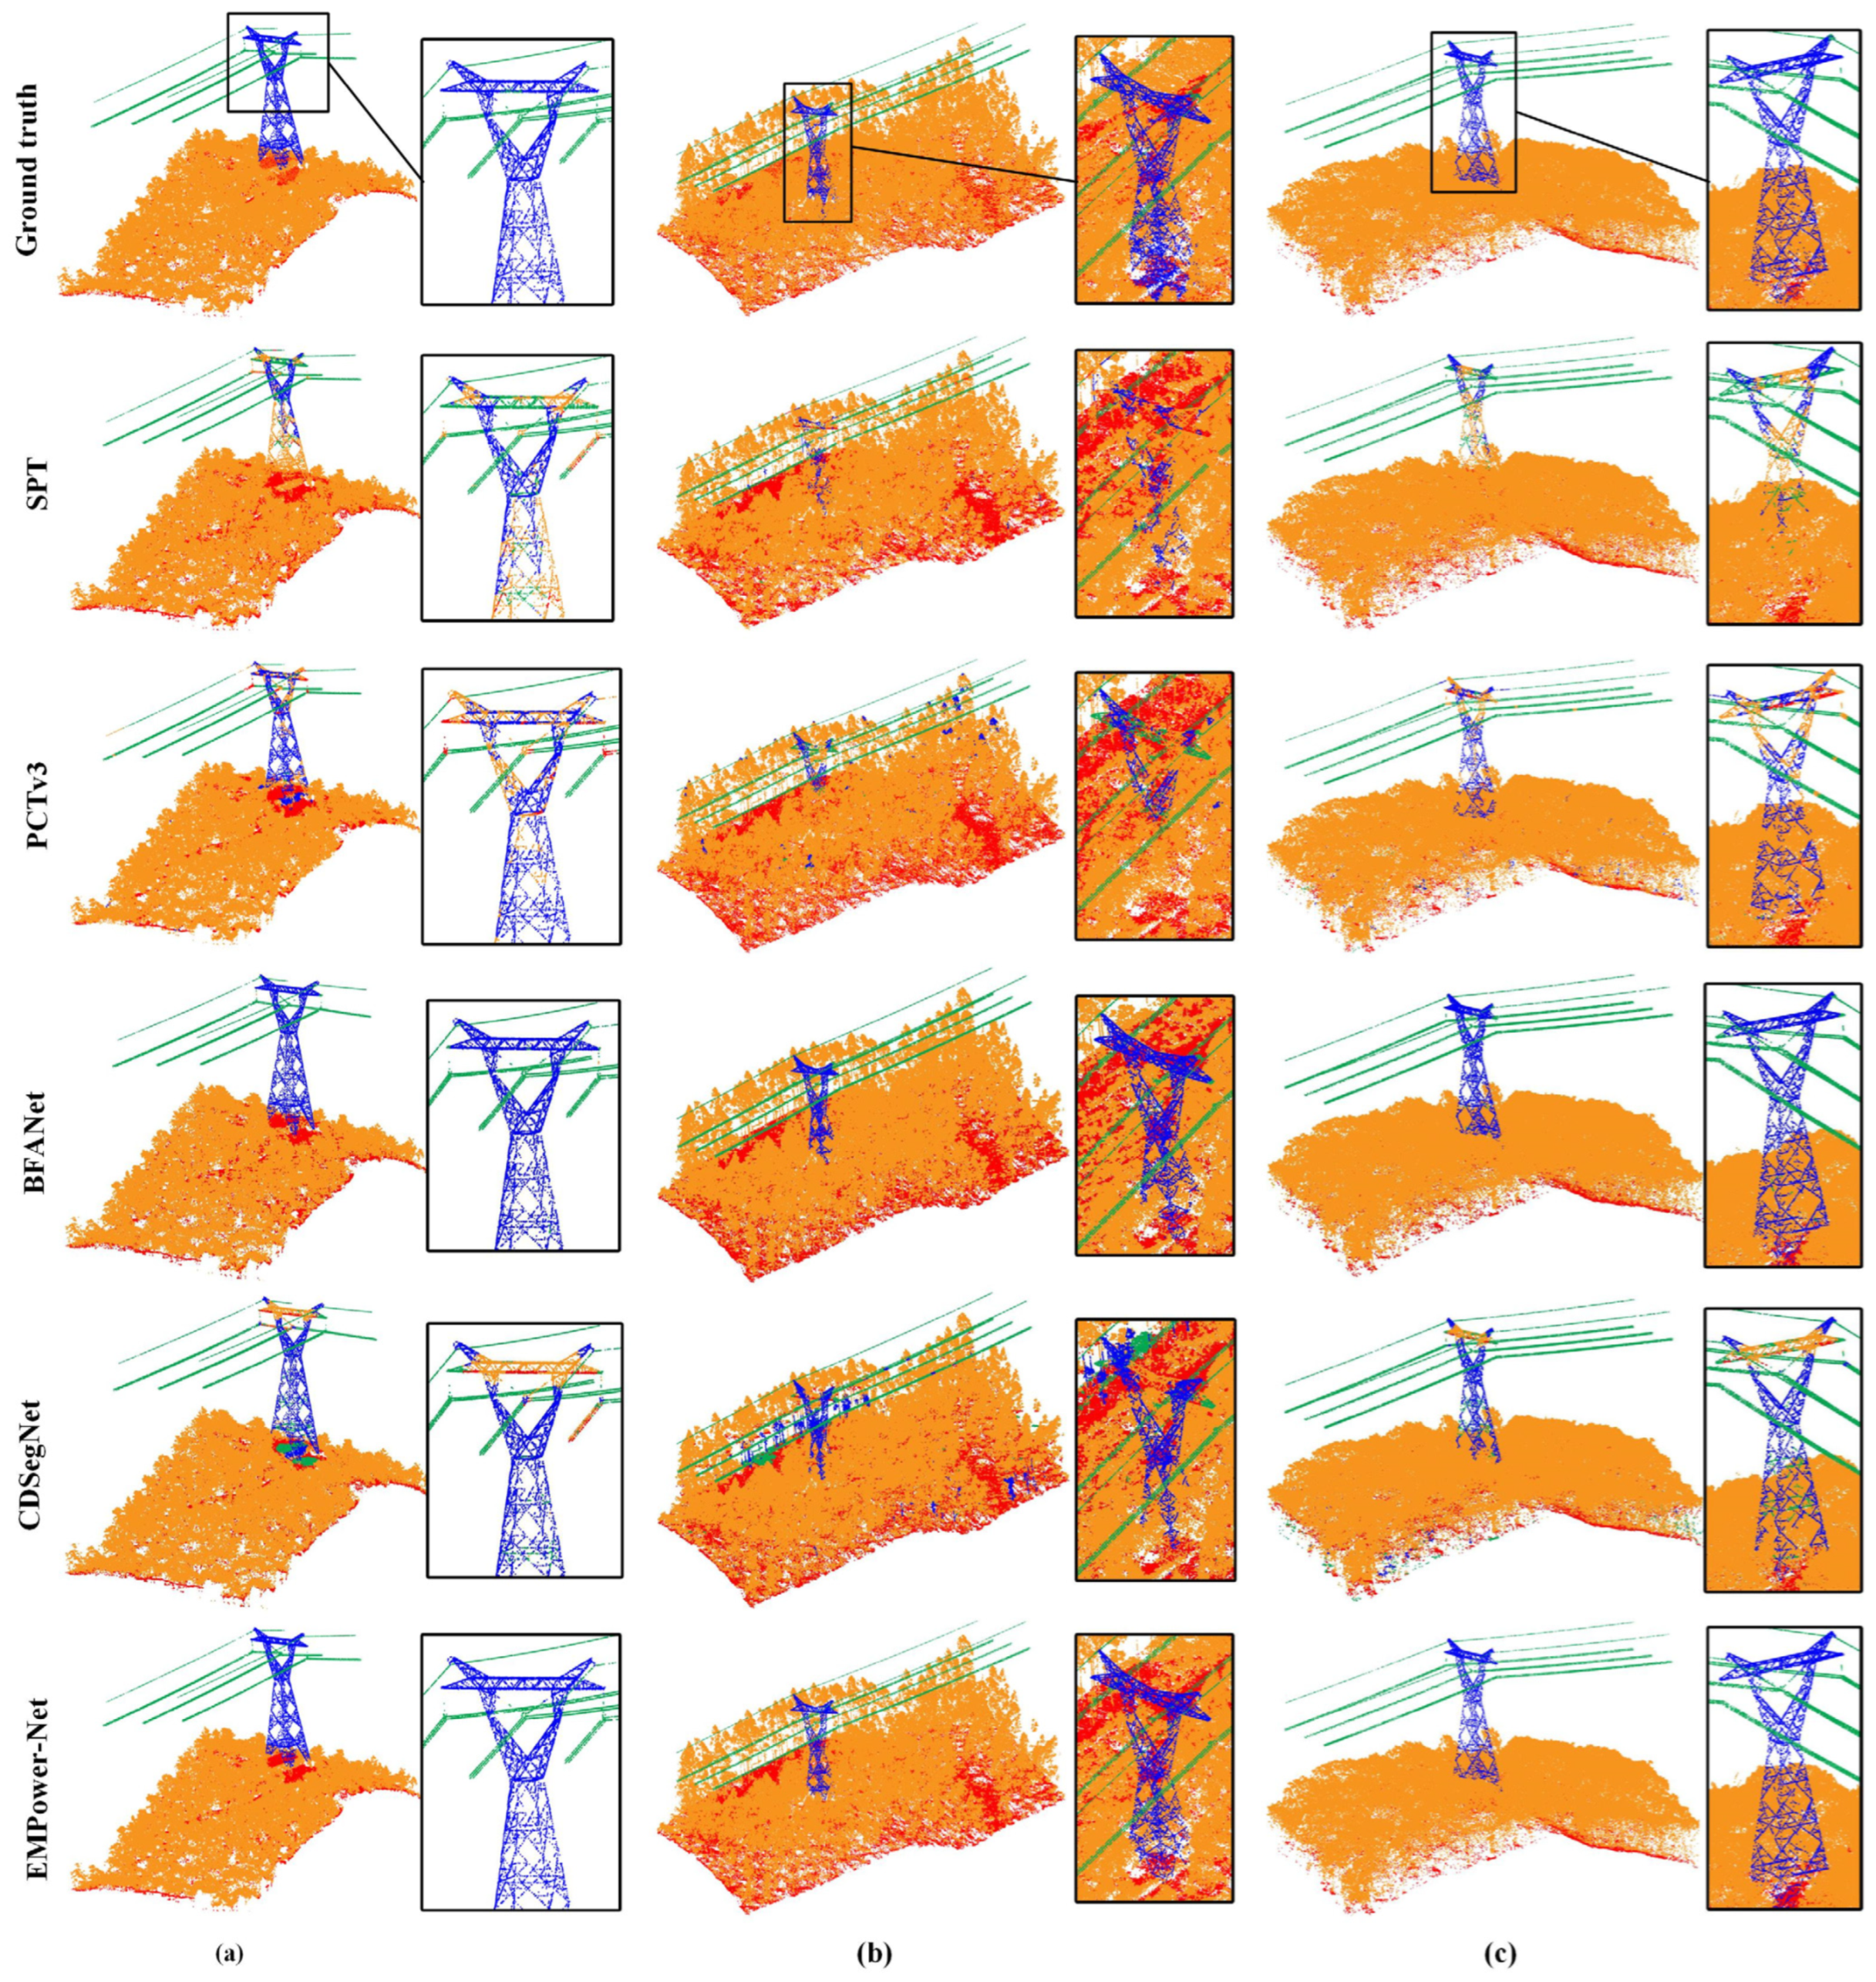
Figure 6 and Figure 7 present the qualitative results of different point cloud semantic segmentation methods on the Yunnan and Guangdong datasets, respectively. The semantic labels are color-coded as follows: red for ground, orange for vegetation, green for power lines, and blue for towers. We can observe several key advantages of our proposed EMPower-Net compared to other baseline methods.
Improved Tower Segmentation: EMPower-Net achieves more accurate identification of towers and poles, a notable improvement over other methods. Specifically, when compared to the PCTv3 backbone method, EMPower-Net segments the base of these structures with greater precision, minimizing the misclassification of surrounding ground or vegetation. This shows that our model is highly effective at utilizing both spatial context and height features to accurately distinguish these vertical structures from their immediate environment. In contrast, other methods consistently show a certain degree of segmentation errors, with PCTv3 and CDSegNet exhibiting particularly severe misclassifications.
Accuracy in Complex Regions: EMPower-Net produces significantly cleaner and more accurate segmentation, particularly in complex regions characterized by dense vegetation or overlapping objects. In contrast, other methods, such as CDSegNet, tend to misclassify parts of the vegetation as poles or towers. For example, as shown in Figure 6c, where the scene contains multiple towers, some of which are not connected by power lines, BFANet incorrectly classifies these isolated towers as power lines. EMPower-Net effectively reduces such misclassification errors, leading to a more precise segmentation of the entire scene.
Consistency Across Varying Terrain: EMPower-Net demonstrates stable and consistent segmentation performance across diverse conditions, including varying ground elevations, slope changes, and different types of towers. For instance, when tested on the Guangdong datasets (Figure 7b), EMPower-Net accurately segments relatively short towers. In the comparative methods, all but BFANet exhibit significant misclassification errors on the main body of these towers. A similar issue is observed in the Yunnan datasets (Figure 7b), where other methods fail to properly segment small towers located directly beneath the power lines.
These results highlight that by integrating multi-resolution spatial context with height-aware feature encoding, EMPower-Net delivers robust and generalizable segmentation performance. Even under challenging conditions such as dense vegetation or occluded tower components, it preserves clear class boundaries and structural integrity, underscoring the effectiveness of combining broad spatial context with vertical geometric cues for powerline corridor scenes.

4.4. Quantitative Comparison

To further validate the effectiveness of our proposed method, we compare its performance with several representative point cloud classification networks, on the Yunnan and Guangdong datasets. The quantitative results are summarized in Table 2 and Table 3.
Across both datasets, EMPower-Net consistently achieves the highest scores in all evaluation metrics for all semantic categories. Specifically, on the Yunnan dataset, EMPower-Net achieves a mean F1-score of 94.73% and a mean IoU of 90.33%, outperforming the second-best model (BFANet), by +1.22% in F1 and +2.17% in IoU. Notably, EMPower-Net shows outstanding performance in detecting power lines and towers, with an F1-score of 99.01% and 96.43%, respectively, demonstrating its superior capability in segmenting fine-grained and critical infrastructure components.
On the Guangdong dataset, which contains dense vegetation and more occlusions, EMPower-Net also maintains robust performance with a mean F1-score of 94.88% and mean IoU of 90.71%, higher than all baselines. In contrast, other methods such as RandLA-Net and DGCNN show degraded performance, especially in identifying power lines and towers, with F1-scores below 30% in some cases. This demonstrates the generalization ability and robustness of our model in complex real-world environments. These results validate that our approach is not only effective in accurate semantic segmentation but also more reliable across diverse transmission corridor scenes.
The “PowerLine IoU” in Table 2 and Table 3 provides a more detailed view of our model’s performance on this crucial, fine-grained class. For the Yunnan dataset, our model achieves a power line IoU of 98.04%, while on the Guangdong dataset, it reaches an even higher 99.66%. These exceptional values demonstrate EMPower-Net’s ability to precisely delineate the thin and complex structures of power lines with near-perfect accuracy, which is vital for practical inspection applications. A closer examination of the per-class precision and recall further reveals the robustness of our method. Our per-class results show that the model’s high precision for both the “Vegetation” (96.82% on Yunnan, 98.75% on Guangdong) and “Tower” (97.67% on Yunnan, 97.25% on Guangdong) classes indicates that false positives are not clustering on these specific categories. This demonstrates that our model effectively distinguishes between vegetation, towers, and power lines, avoiding common classification errors and ensuring the reliability of the segmentation results.
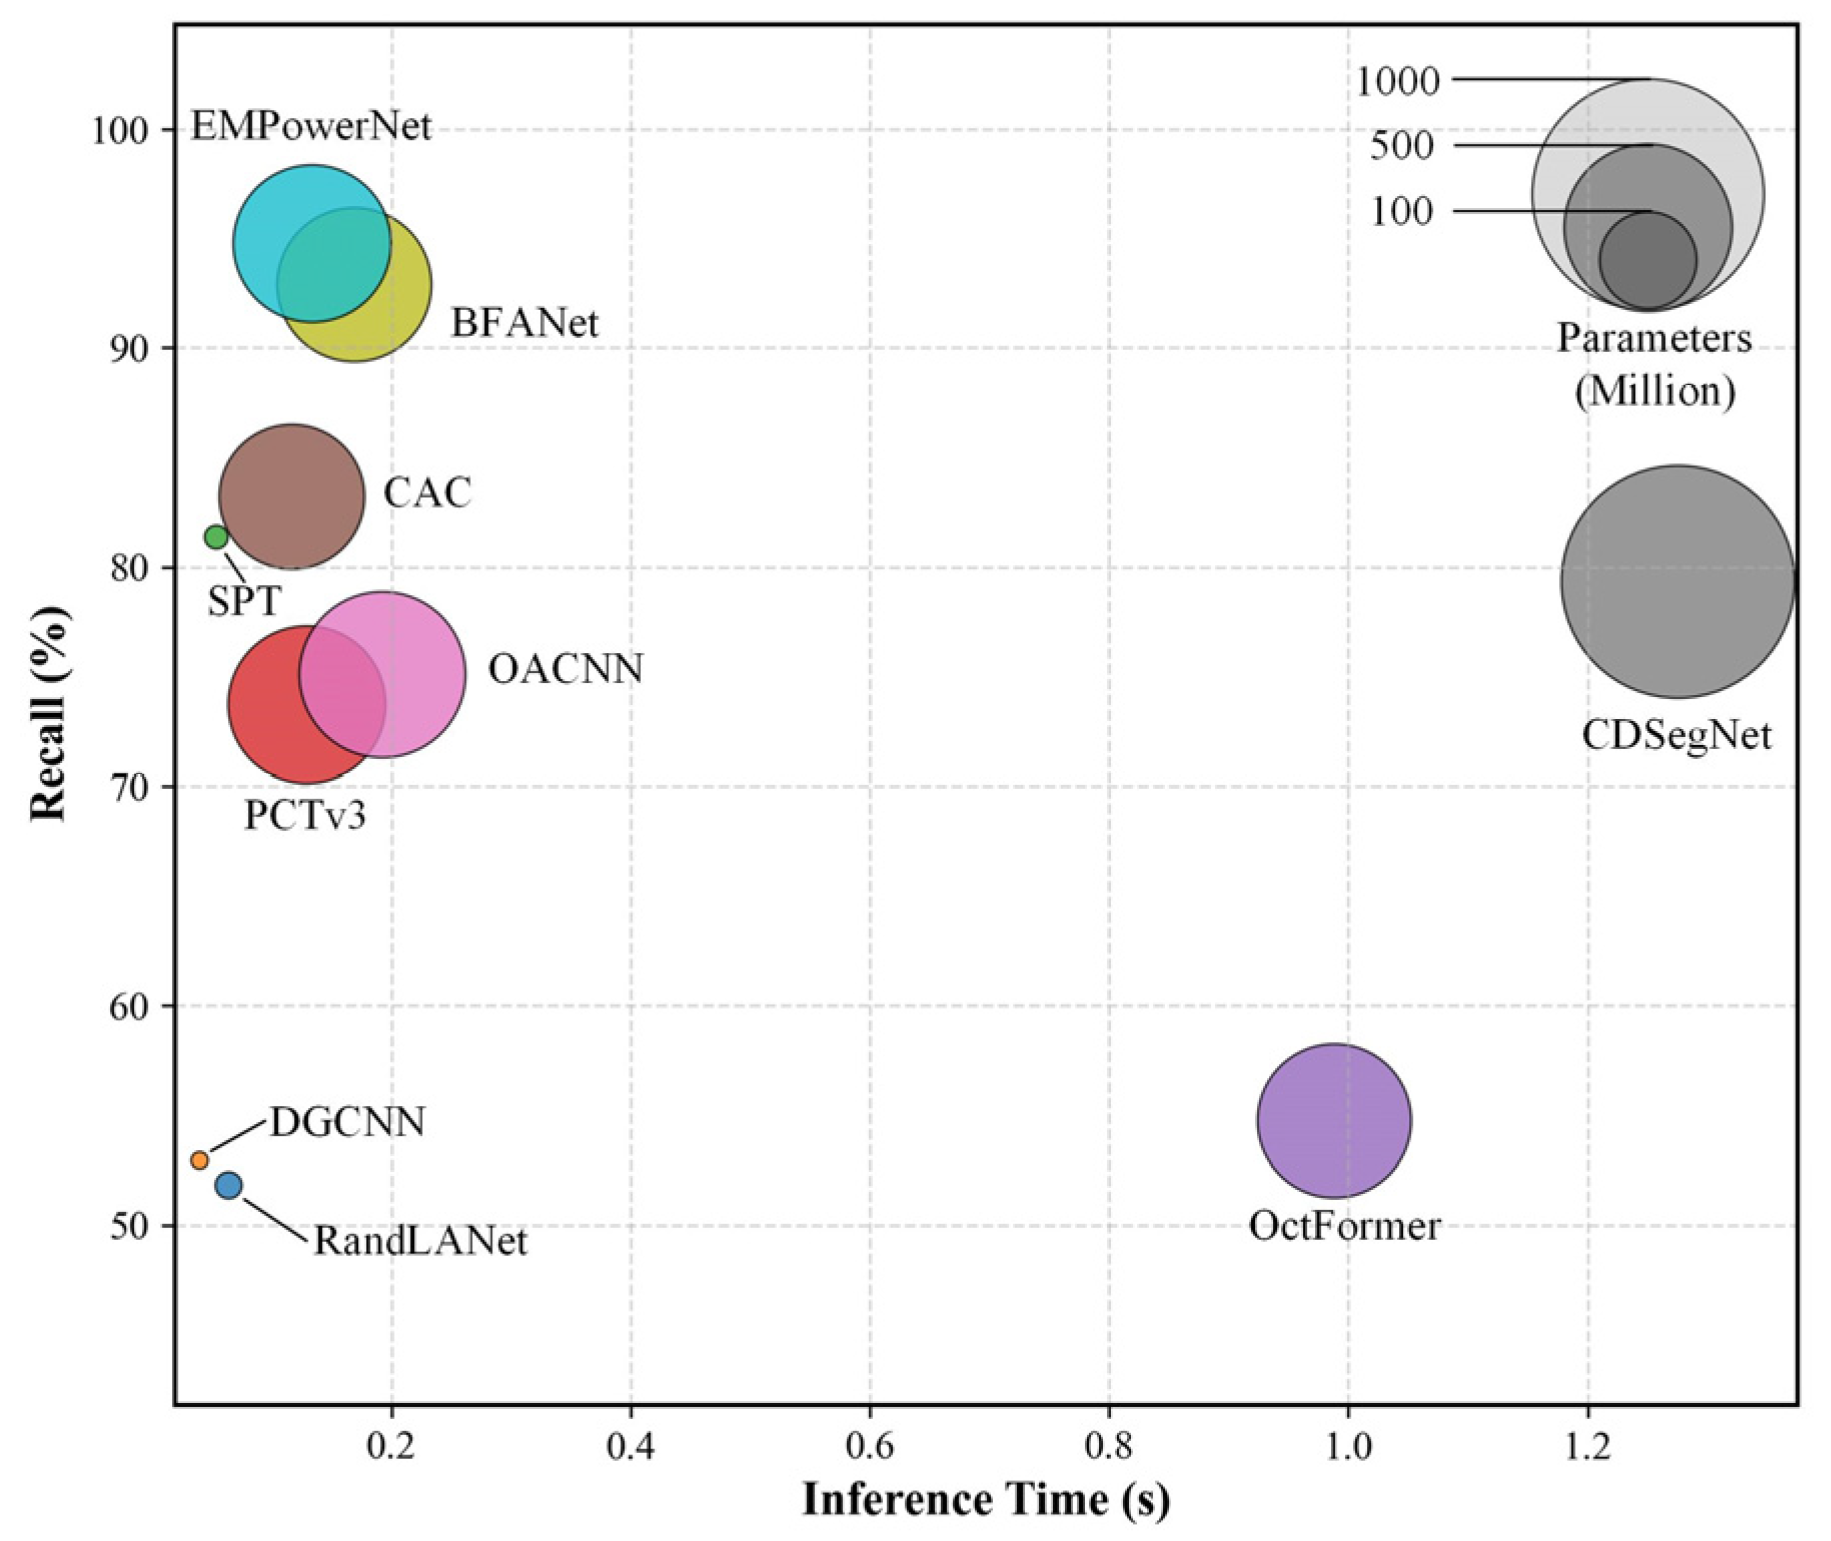
Figure 8 illustrates the relationship between the number of model parameters and inference time for various point cloud segmentation networks. Each bubble represents a specific model, where the bubble size is proportional to the number of parameters. Models located toward the lower-left region are generally faster and have higher recall, while those toward the upper-right corner are slower and have lower recall. Our EMPower-Net achieves a balance between model size and inference speed, maintaining competitive efficiency while reducing computational cost compared to other high-parameter models such as OA-CNNs, CDSegNet, and BFANet.

4.5. Ablation Study

Figure 9 illustrates the visual comparison of segmentation results under different module configurations, including (a) Ground Truth, (b) Only with Multi-resolution (MR) Module, (c) Only with Elevation Distribution (ED) Module, and (d) Our result incorporating both MR and ED modules.
The MR module alone improves segmentation of long-range structures such as power lines due to enhanced spatial context, benefiting from the enhanced receptive field and contextual aggregation. However, it struggles to segment fine-grained structural details of towers, leading to fragmented or inaccurate predictions in these regions. This suggests that while the MR module effectively captures large-scale spatial context, it lacks sufficient sensitivity to vertical variation critical for tower segmentation.
In contrast, applying only the ED module significantly enhances the segmentation accuracy of tower structures. By explicitly encoding elevation distribution, the model becomes more sensitive to vertical geometry, allowing it to better preserve the hierarchical and skeletal features of towers. However, lacking spatial context from MR, the ED-only model struggles with long-range structures such as power lines, which are thin, long-range, and span across wide areas.
Our full model, which integrates both MR and ED modules, achieves the most accurate and coherent segmentation across all classes. It successfully delineates both the thin, horizontal power lines and the complex vertical structures of towers, showing that the combination of multi-scale spatial context and height-aware feature encoding is critical for handling the diverse geometric characteristics present in powerline corridor scenes.
The quantitative results (Table 4) further confirm the complementary roles of the MR and ED modules in semantic segmentation of powerline corridor point clouds.
Using only the MR module, the model achieves high precision and F1 scores for power lines (Precision: 95.77%, F1: 95.57%) and vegetation (Precision: 95.61%, F1: 94.04%), benefiting from the broader receptive field that facilitates better global context aggregation. However, the recall and IoU for towers are significantly lower (Recall: 54.34%, IoU: 51.16%), indicating that while MR helps in recognizing long-range structures, it struggles with complex vertical geometries like towers, often leading to under-segmentation in these areas.
Conversely, with only the ED module, the model shows clear improvements in tower segmentation, achieving a higher tower F1 score of 79.14% and IoU of 65.48%. This improvement can be attributed to the elevation-aware encoding, which enhances the model’s ability to distinguish vertically structured components. However, the performance on power lines slightly declines compared to the MR-only setting (F1 drops from 95.57% to 92.56%, IoU from 91.51% to 86.14%), suggesting that ED alone lacks sufficient spatial context for accurately segmenting widely distributed long-range objects.
In addition, to further verify whether the performance gain originates from the statistical encoding of histograms rather than simply from an additional z-channel, we conducted an ablation study by replacing the histogram encoding with two simplified alternatives: (1) using only the raw z value (Z), and (2) using z plus a single scalar (Z+), defined as the mean height within a 1 m radius cylinder. The results are summarized in Table 5. It can be observed that both Z and Z+ improve the performance compared with the baseline method (PCTv3) on the power-line and tower classes, but they remain inferior to our histogram encoding. The difference is particularly evident in the tower class. These findings demonstrate that the histogram captures richer local height distributions, which play a crucial role in enhancing segmentation performance.

4.6. Transferability Evaluation on Different Powerline Regions

To evaluate the generalization capability of our model on unseen powerline corridor data, we transferred the model trained on the Yunnan dataset to perform inference on the Guangdong dataset. As shown in Figure 10, the quantitative results demonstrate that EMPower-Net consistently outperforms the baselines. In contrast, other approaches exhibit varying degrees of performance degradation, with BFANet performing relatively well by correctly identifying most tower points. In regions with sparse vegetation, all methods except SPT can detect the majority of tower points. However, in areas with dense vegetation or where vegetation overlaps with tower structures, all comparison methods suffer from pronounced segmentation errors due to the similar geometric characteristics of these objects.
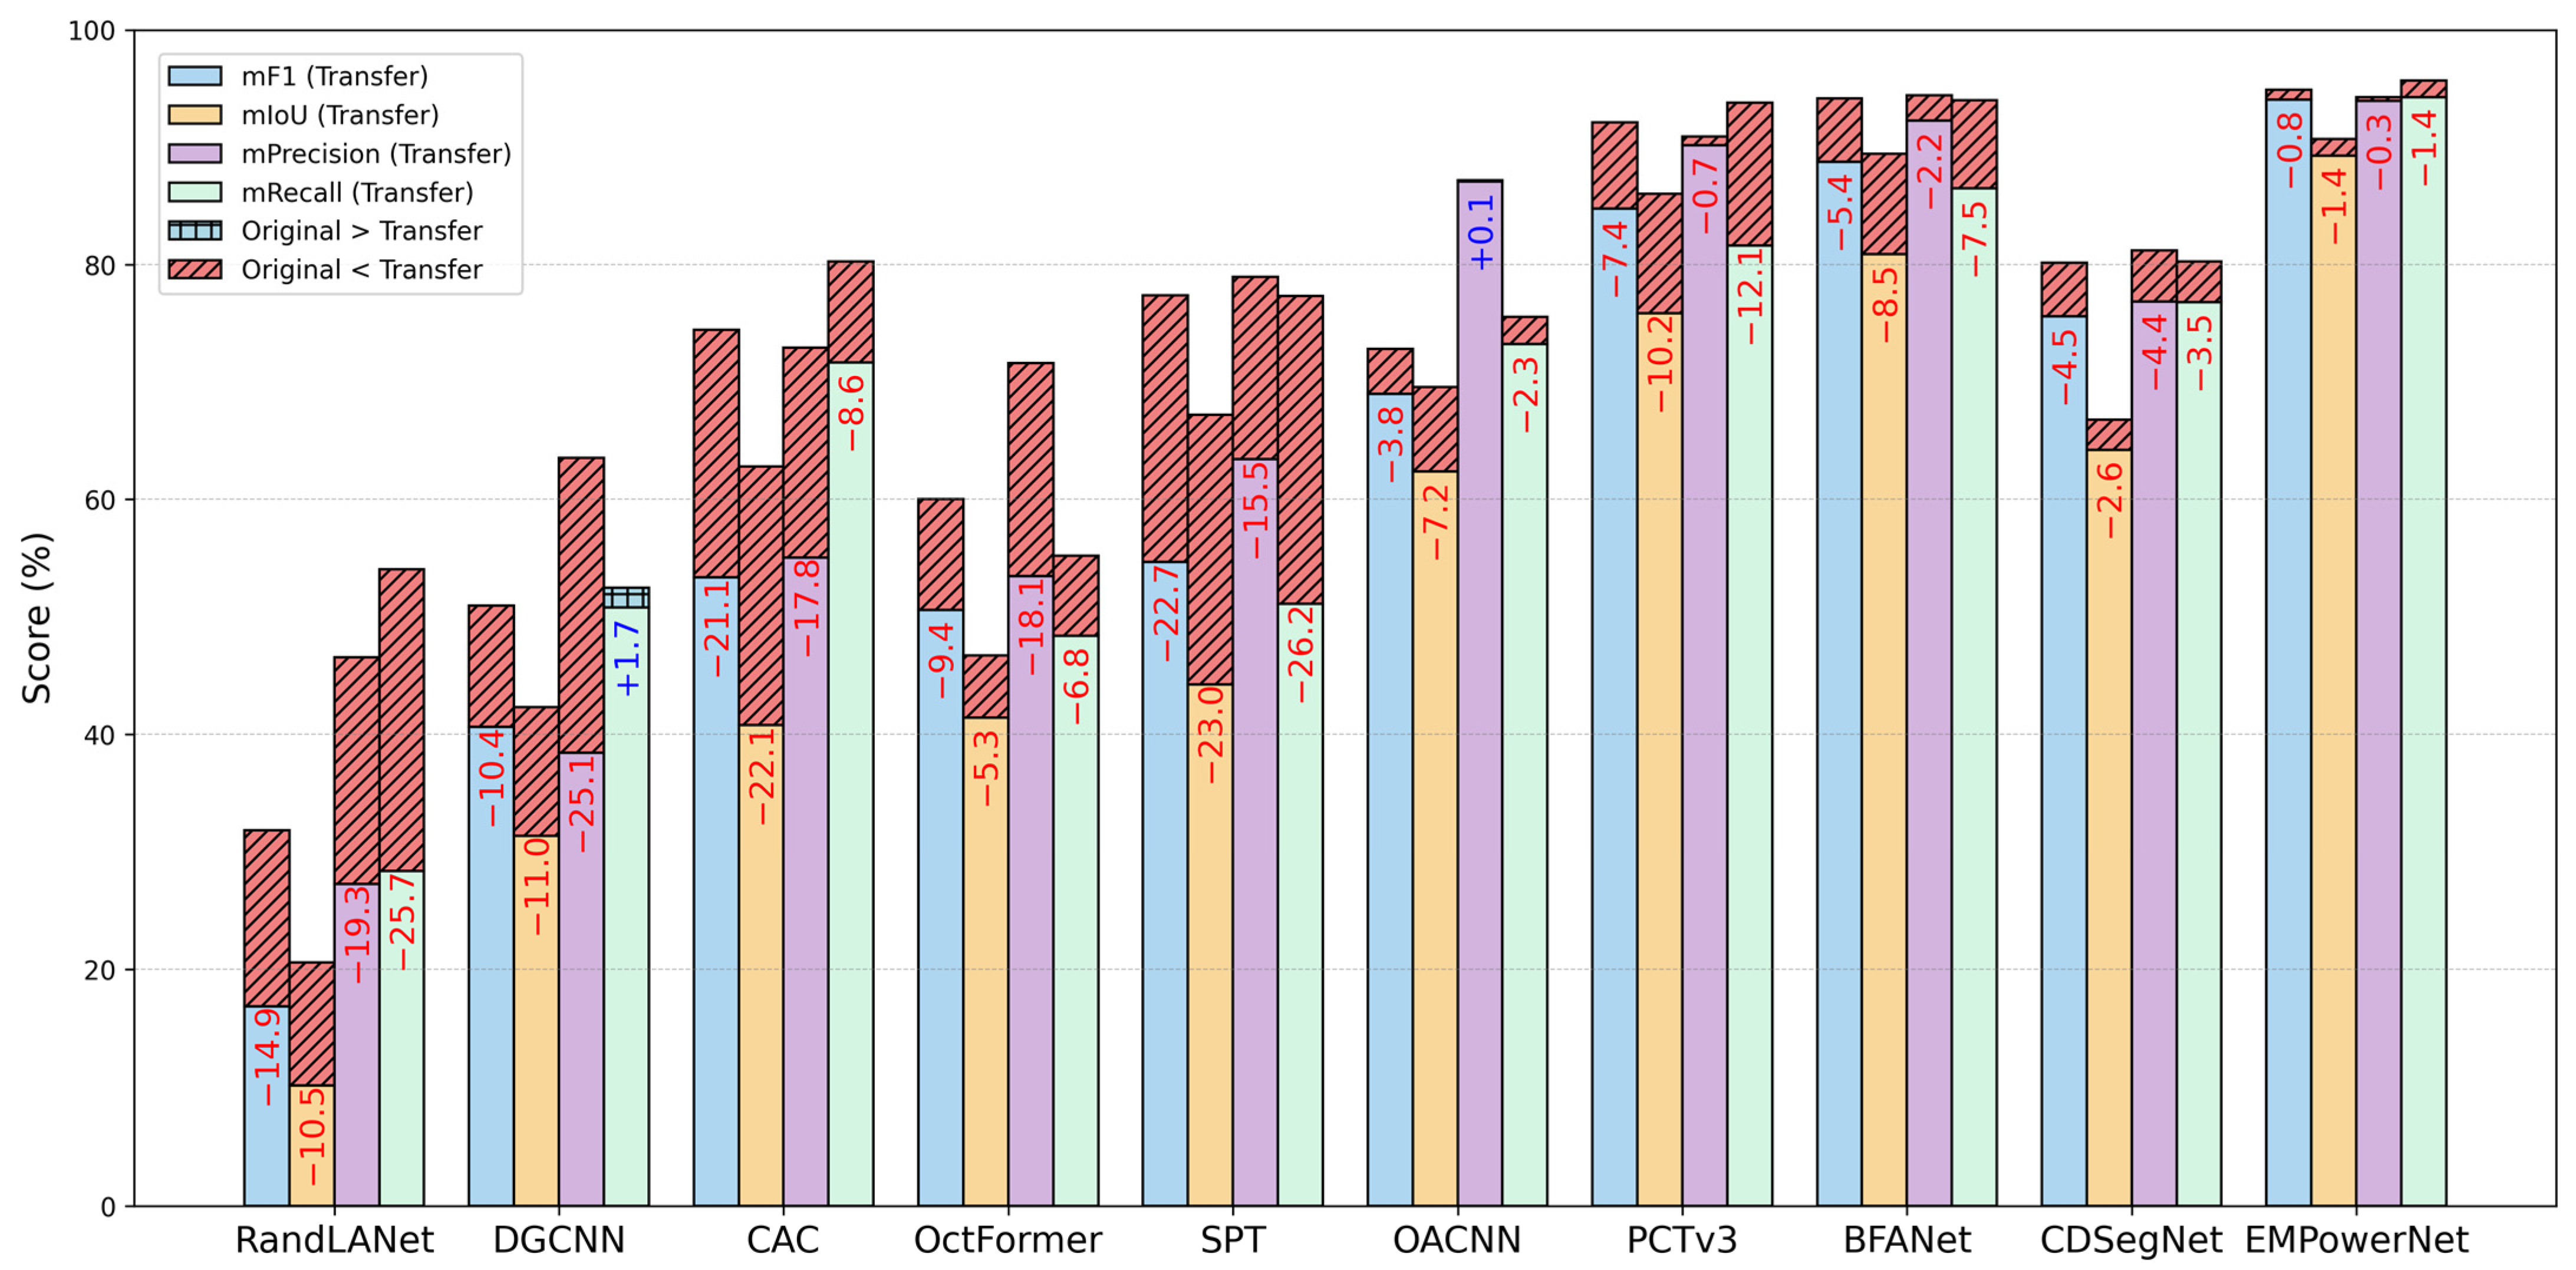
Figure 11 compares the prediction performance between the model trained on the Yunnan dataset and the transfer model tested on the Guangdong dataset. While all methods exhibit performance degradation, EMPower-Net stands out with the smallest drops across all metrics—mPrec (−0.34%), mRecall (−1.42%), mF1 (−0.81%), and mIoU (−1.43%)—indicating exceptional robustness and generalization capability. This minimal decline contrasts sharply with the substantial drops observed in most competing methods, underscoring EMPower-Net’s ability to maintain fine-grained structural segmentation accuracy under different environmental conditions. BFANet achieves the next-best robustness, but still shows noticeably larger declines (mPrec −2.16%, mRecall −7.51%, mF1 −5.40%, mIoU −8.54%) compared to EMPower-Net. CDSegNet performs moderately well with smaller losses in certain metrics (e.g., mIoU −2.55%), yet its F1-score drop (−4.45%) is more than five times greater than that of EMPower-Net.
In contrast, SPT suffers severe degradation, with mRecall plunging by −26.23% and mF1 by −22.74%, while PCTv3 experiences moderate but notable decreases (mF1 −7.35%, mIoU −10.20%). These comparisons make clear that EMPower-Net not only leads in absolute performance on the target dataset but also preserves its advantage under cross-domain conditions, outperforming the second-best method by a substantial margin in both precision and recall stability.

4.7. Validating the Generalization of Elevation Features in Urban Scenes

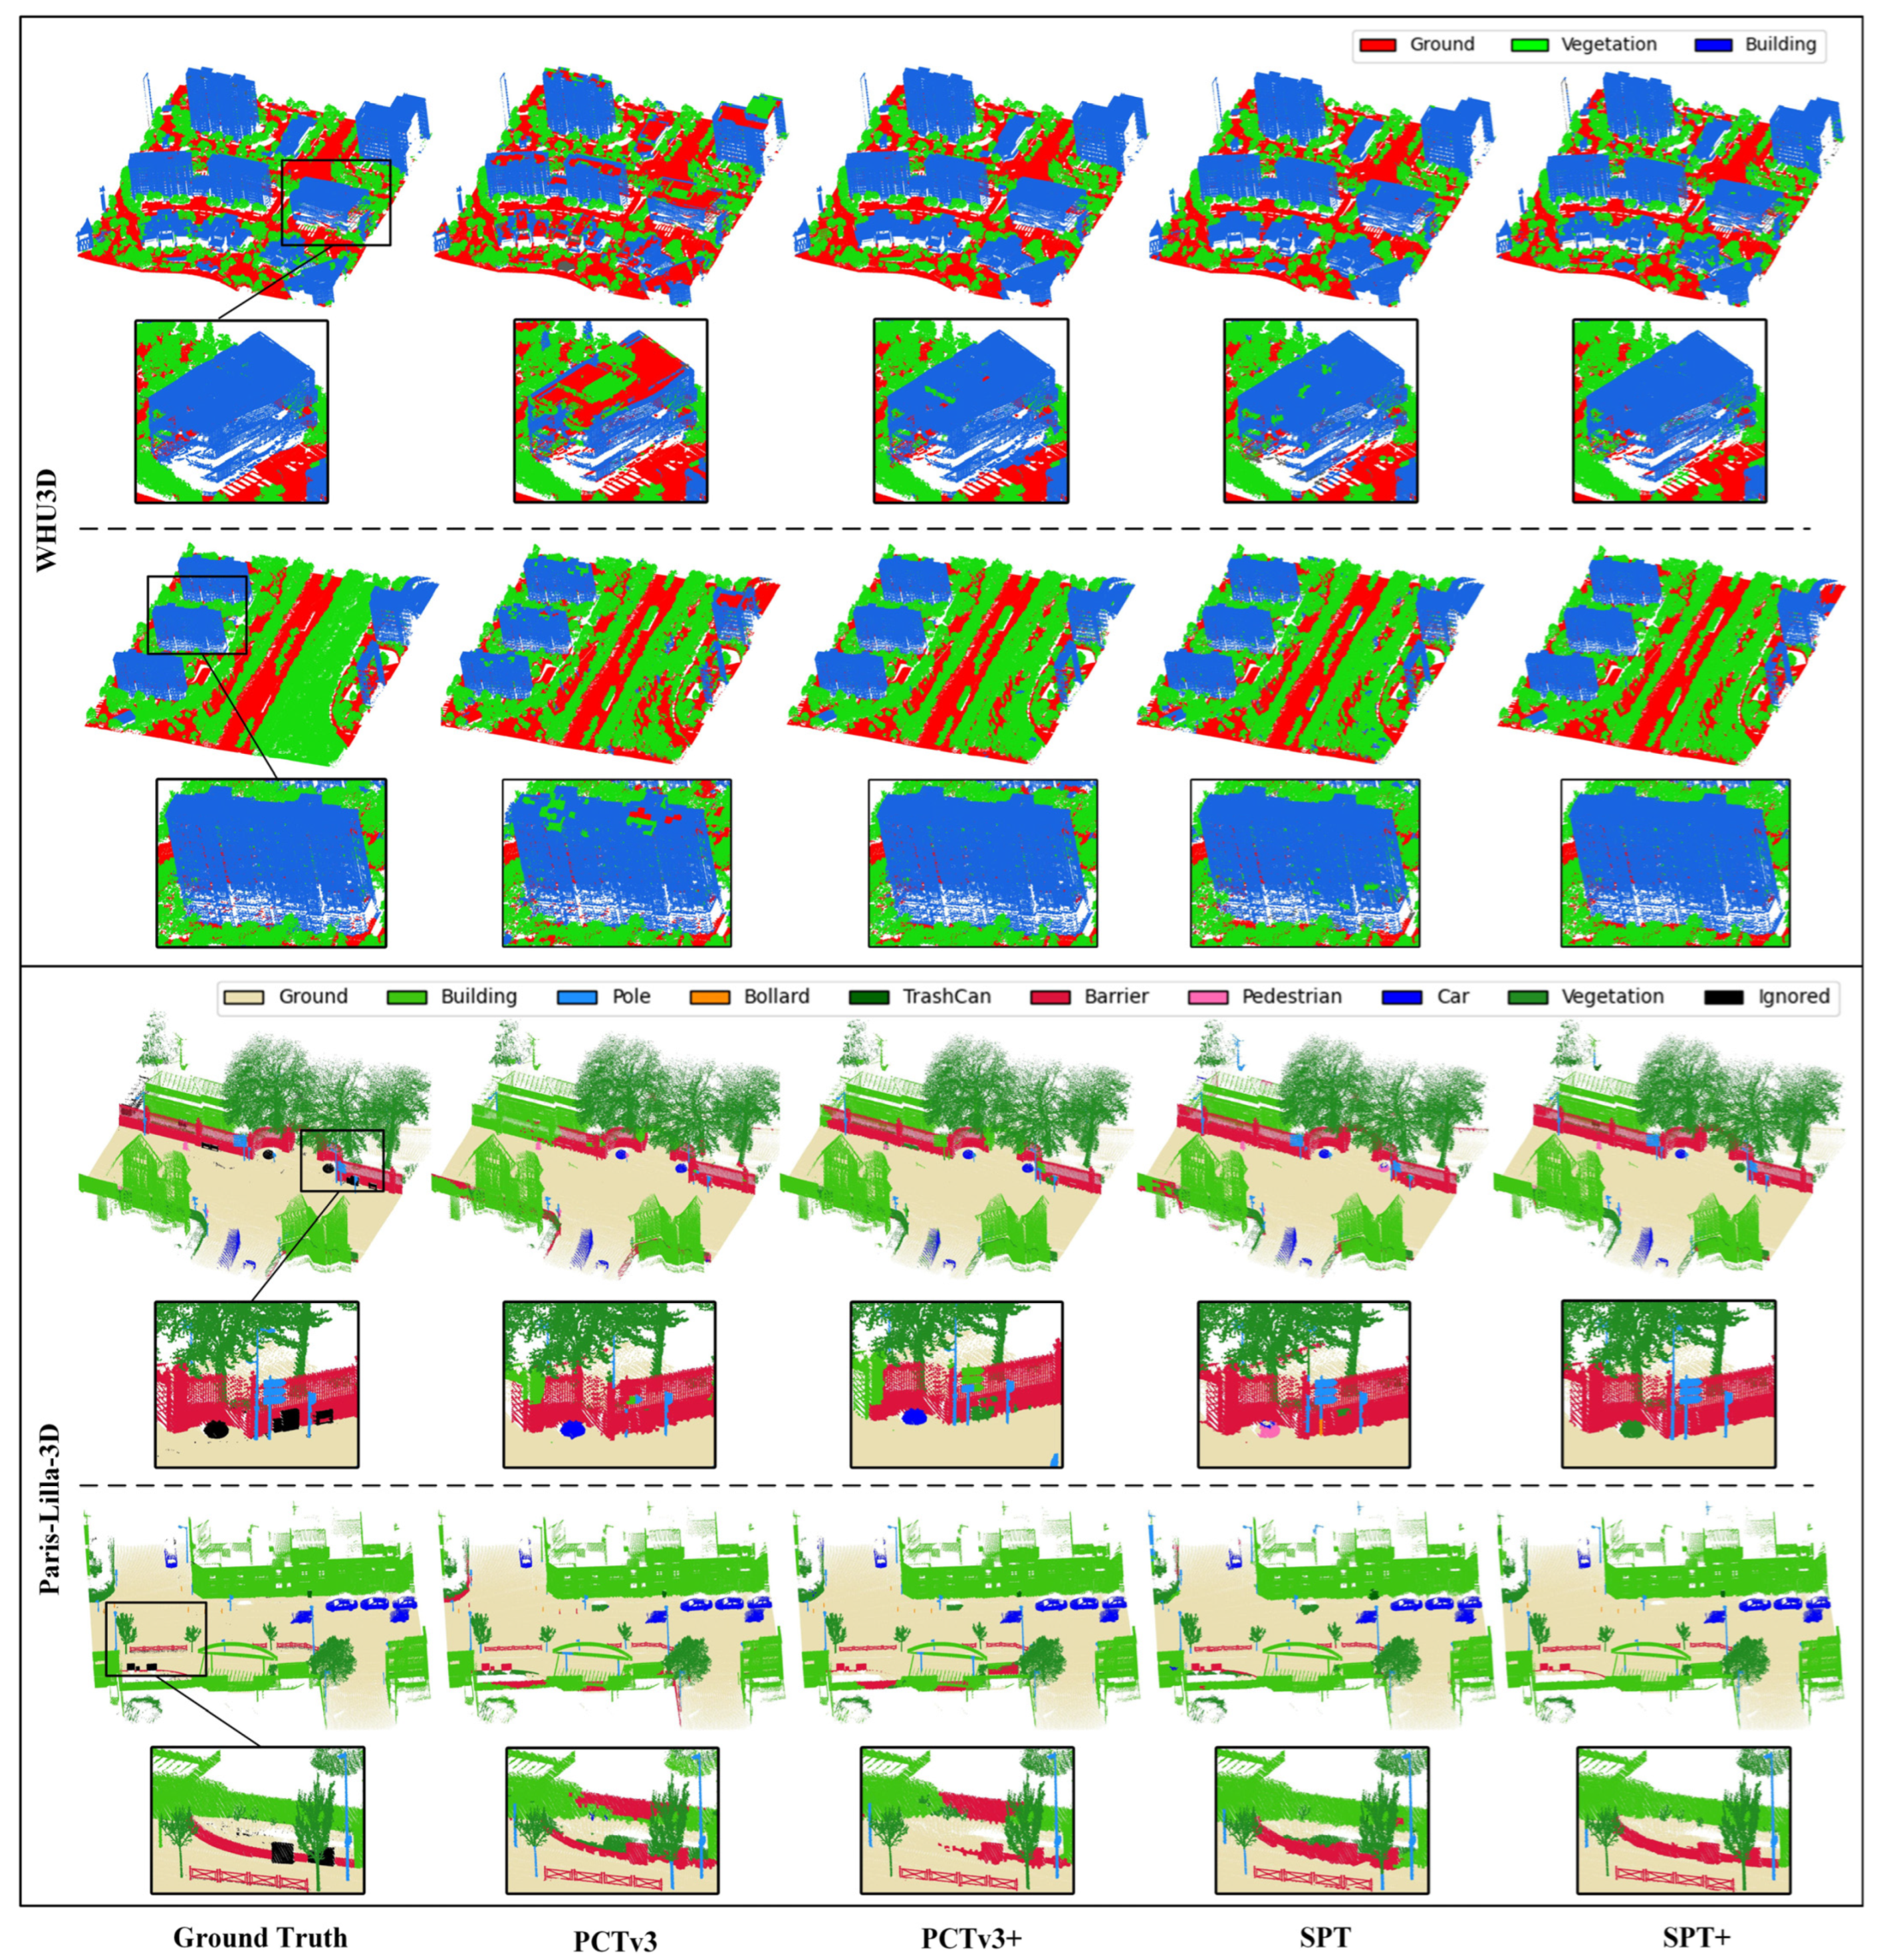
To assess the generalization capability of the proposed elevation features beyond powerline corridor environments, we conducted additional experiments on the WHU3D [21] and Paris-Lille-3D [19] urban scene dataset. We evaluated the performance of two segmentation models—with and without the incorporation of elevation histogram features—under these diverse urban conditions.
We evaluate two representative baselines, SPT and PCTv3, both in their original forms and with the integration of elevation-based histogram features (denoted as SPT+ and PCTv3+). As shown in Figure 12, both models exhibit notable performance improvements when elevation features are included. Specifically, on the WHU3D dataset, PCTv3+ substantially reduces misclassification on building rooftops, while SPT+ achieves more accurate separation between building facades and adjacent vegetation compared to their original versions. On the Paris-Lille-3D dataset, both PCTv3+ and SPT+ also show improved segmentation of pole-like objects.
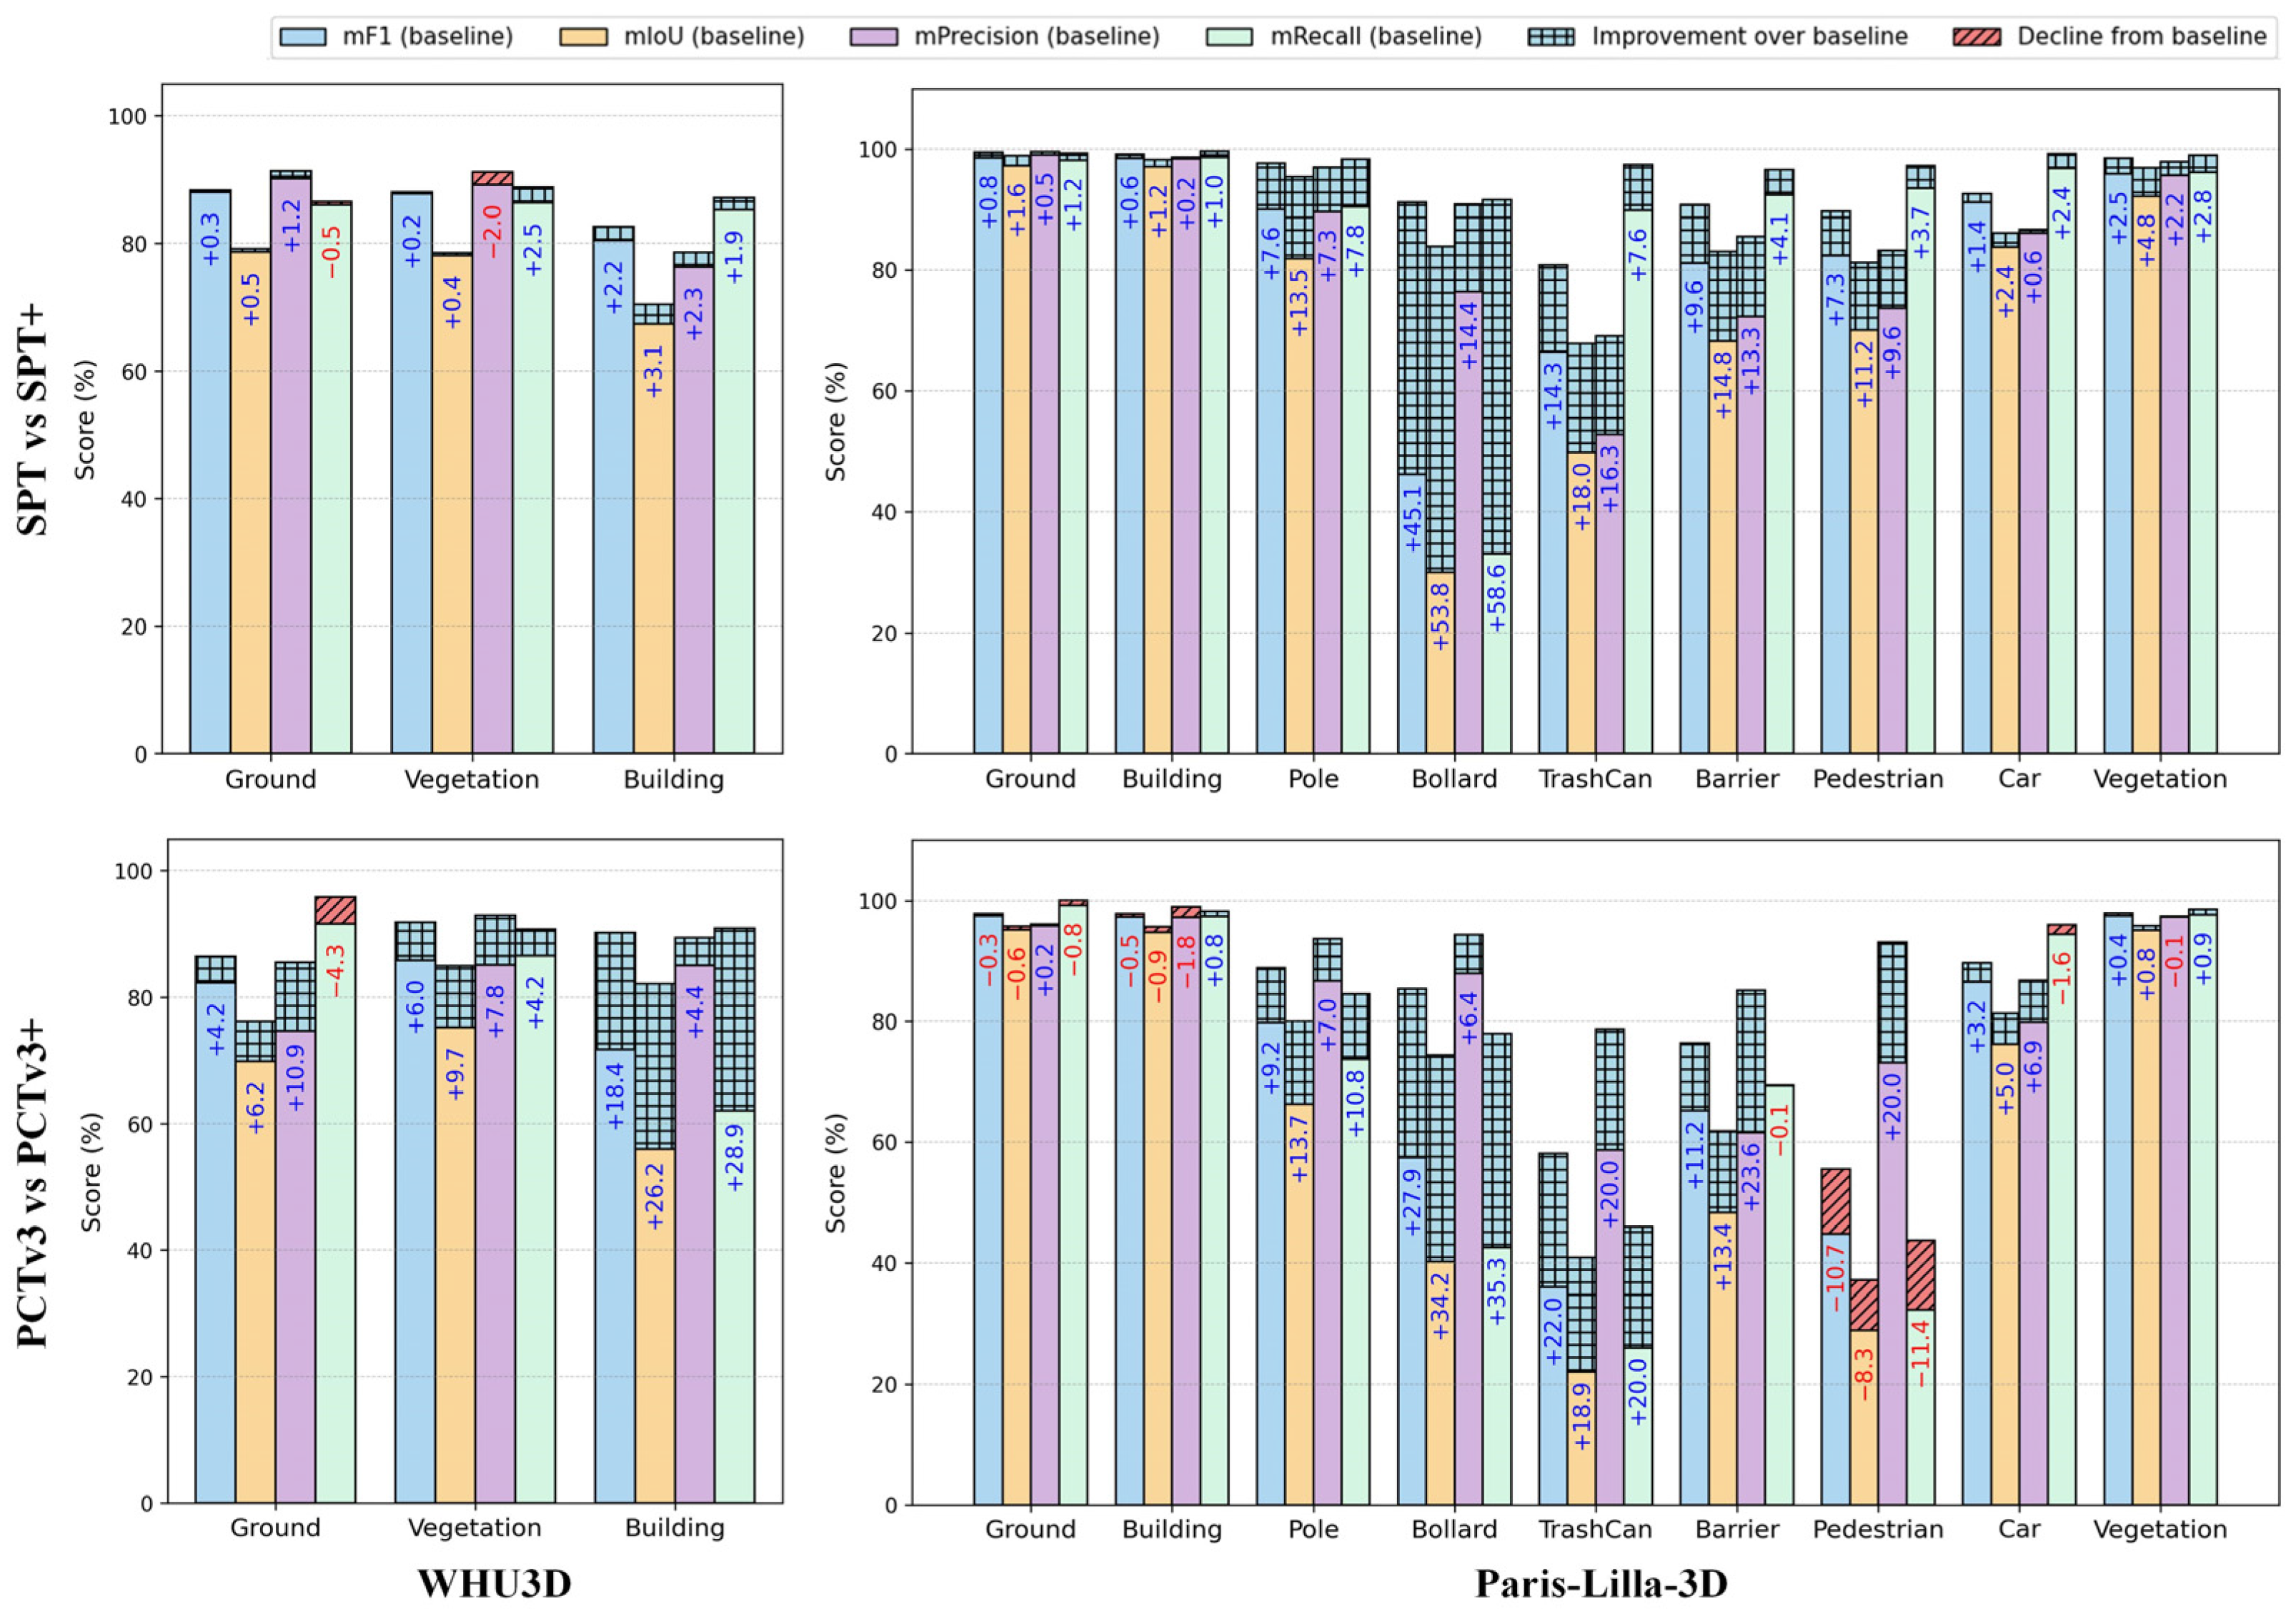
Quantitative results, as presented in Figure 13, further confirm the effectiveness of the proposed elevation features in urban scene segmentation. For the SPT model, on the WHU3D dataset, integrating elevation features (SPT+) leads to consistent performance gains. Notably, the F1-score for the building category improves by 2.15%, accompanied by a 3.07% increase in mean IoU. Meanwhile, performance on Ground and Vegetation classes remains largely stable, resulting in overall gains in mean F1-score (+0.9%) and mean IoU (+1.31%). On the Paris-Lille-3D dataset, the largest gains are observed in the Pole, Bollard, TrashCan, and Barrier categories, with mean F1 and IoU improvements of 12.8% and 18.0%, respectively.
The integration of elevation features also boosted the performance of the PCTv3 model. The PCTv3+ model showed a significant improvement in the building category on the WHU3D dataset, with the F1 score increasing by 18.44% and IoU by 26.18%. Most other classes also saw gains in precision and recall. Overall, the mean IoU improved by 14.04%, demonstrating the effectiveness of elevation-based features for enhancing segmentation accuracy, especially for complex structures like buildings. On the Paris-Lille-3D dataset, the main improvements were in the Pole, Bollard, TrashCan, and Barrier categories, with F1 and mean IoU both increasing by 14.3% and 16.5%, respectively. The accuracy of buildings, which are primarily represented by their side facades, experienced a slight decrease.
These results indicate that the proposed elevation feature not only enhances fine-grained semantic recognition in powerline scenes but also generalizes effectively to complex urban structures, particularly those with strong vertical geometry such as buildings.

4.8. Parameter Sensitivity Analysis

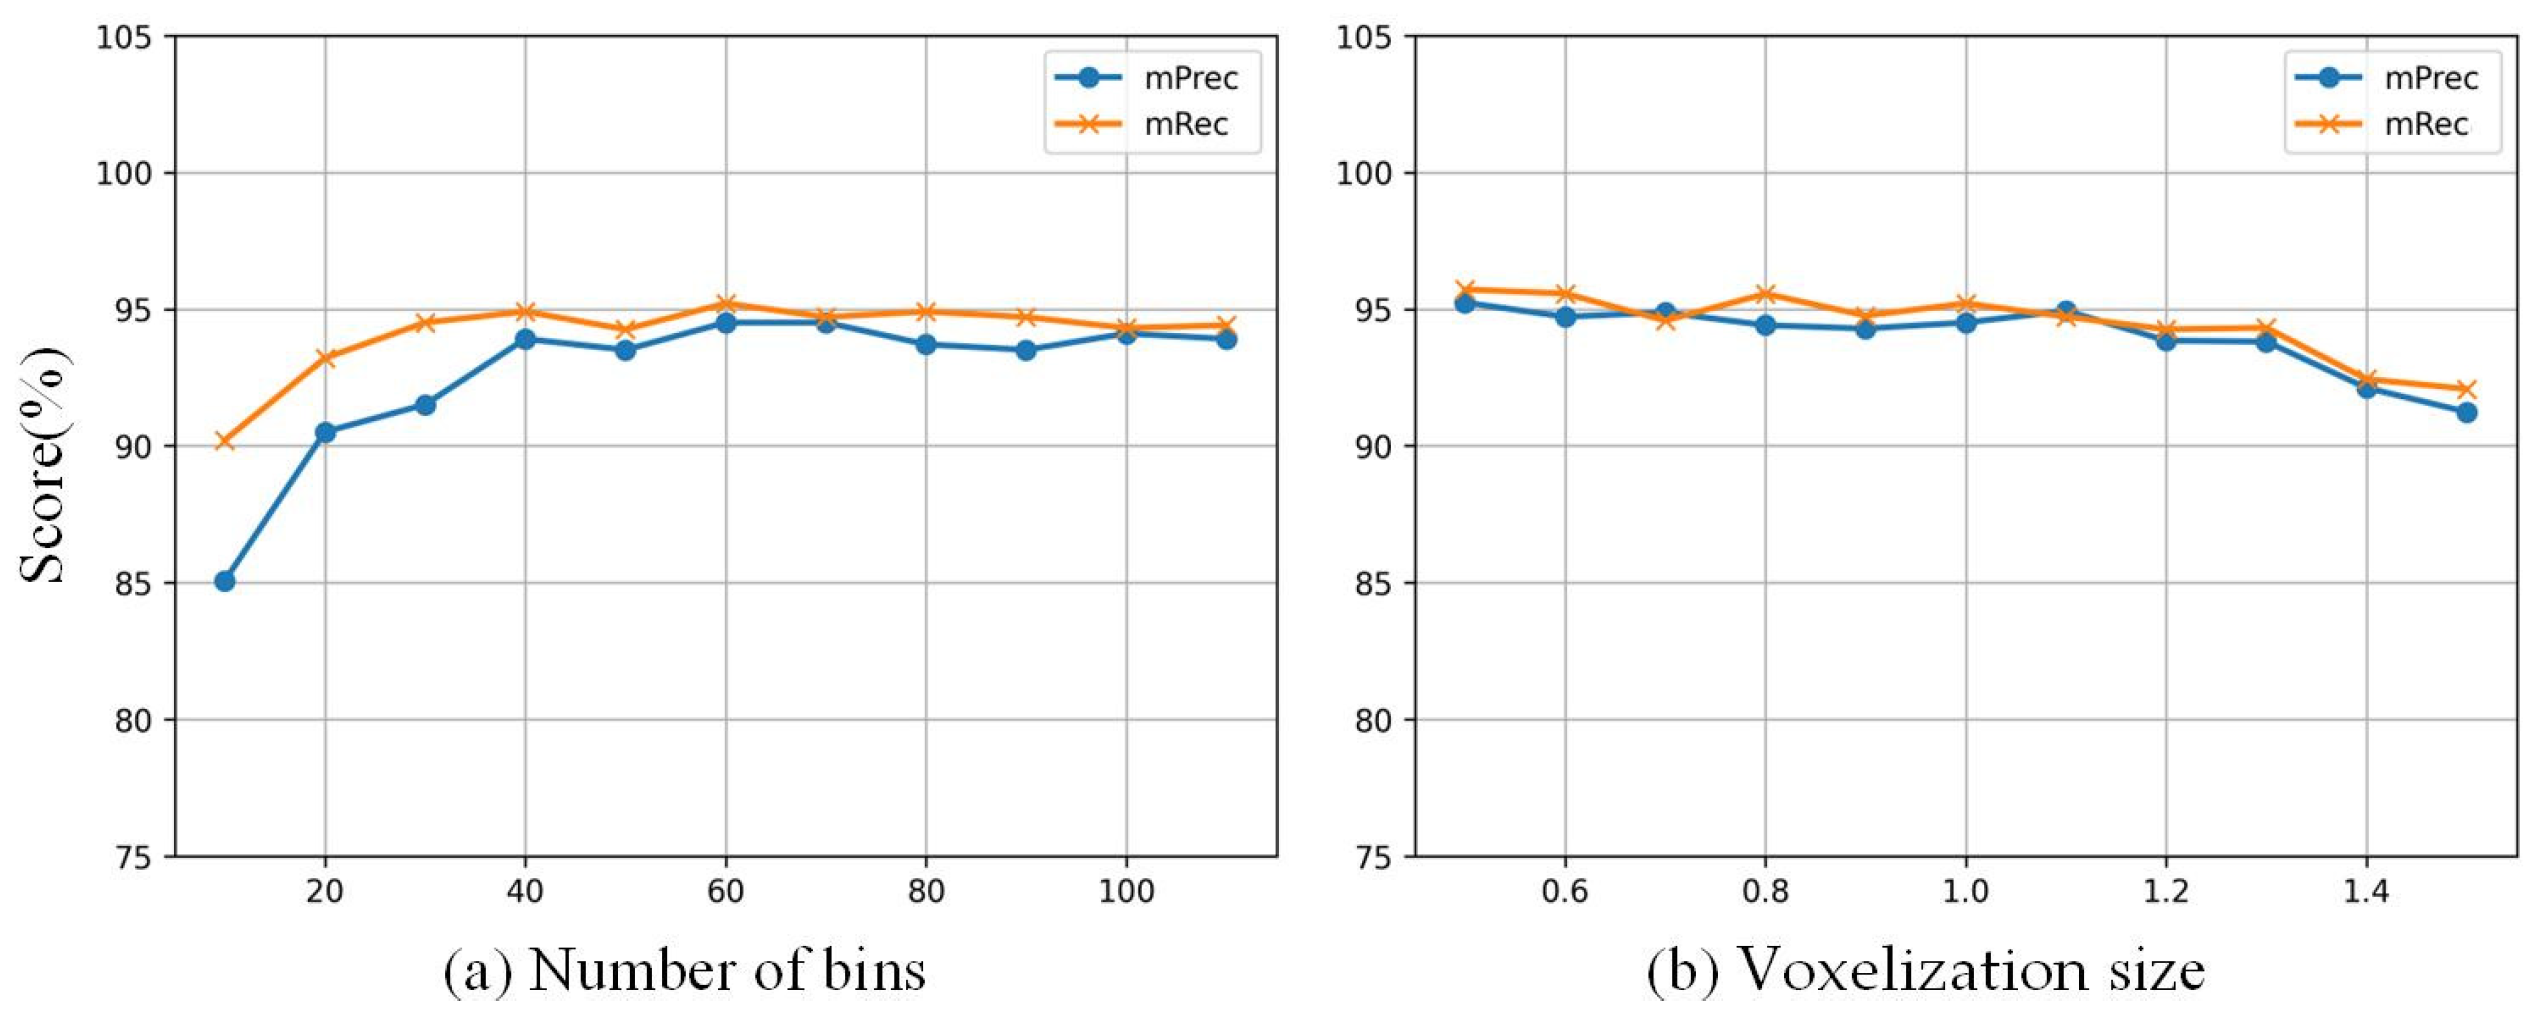
We conducted a parameter sensitivity analysis on both the number of histogram bins and the voxelization size to evaluate their impact on model performance. As illustrated in Figure 14, We varied the number of bins from 10 to 110, with each bin having a fixed size of 1m. This allowed us to evaluate performance across different total range coverages, and we recorded the corresponding mean precision (mPrec) and mean recall (mRec) values under each setting. The results show a clear upward trend in performance as the bin number increases, particularly from 10 to 60, where the mPrec improves from 85.07% to 94.51% and the mRec increases from 90.02% to 95.21%. This indicates that a higher resolution in the histogram contributes to capturing more fine-grained structural information in the point cloud. However, further increasing the bin number beyond 60 leads to performance saturation and slight fluctuations, indicating that overly fine binning may introduce redundant or noisy features, which potentially degrade the model’s generalization capability. Similarly, voxel size plays a critical role. Testing voxel sizes from 0.5 m to 1.5 m (using a 3D grid) reveals that performance remains relatively stable up to 1.0 m but declines more noticeably when the voxel size exceeds 1.3 m. Based on these findings, we adopt 60 histogram bins and a 1.0 m voxel size as default settings to achieve a balance between segmentation accuracy and computational efficiency.

4.9. Evaluation of Model Robustness Under Varying Density

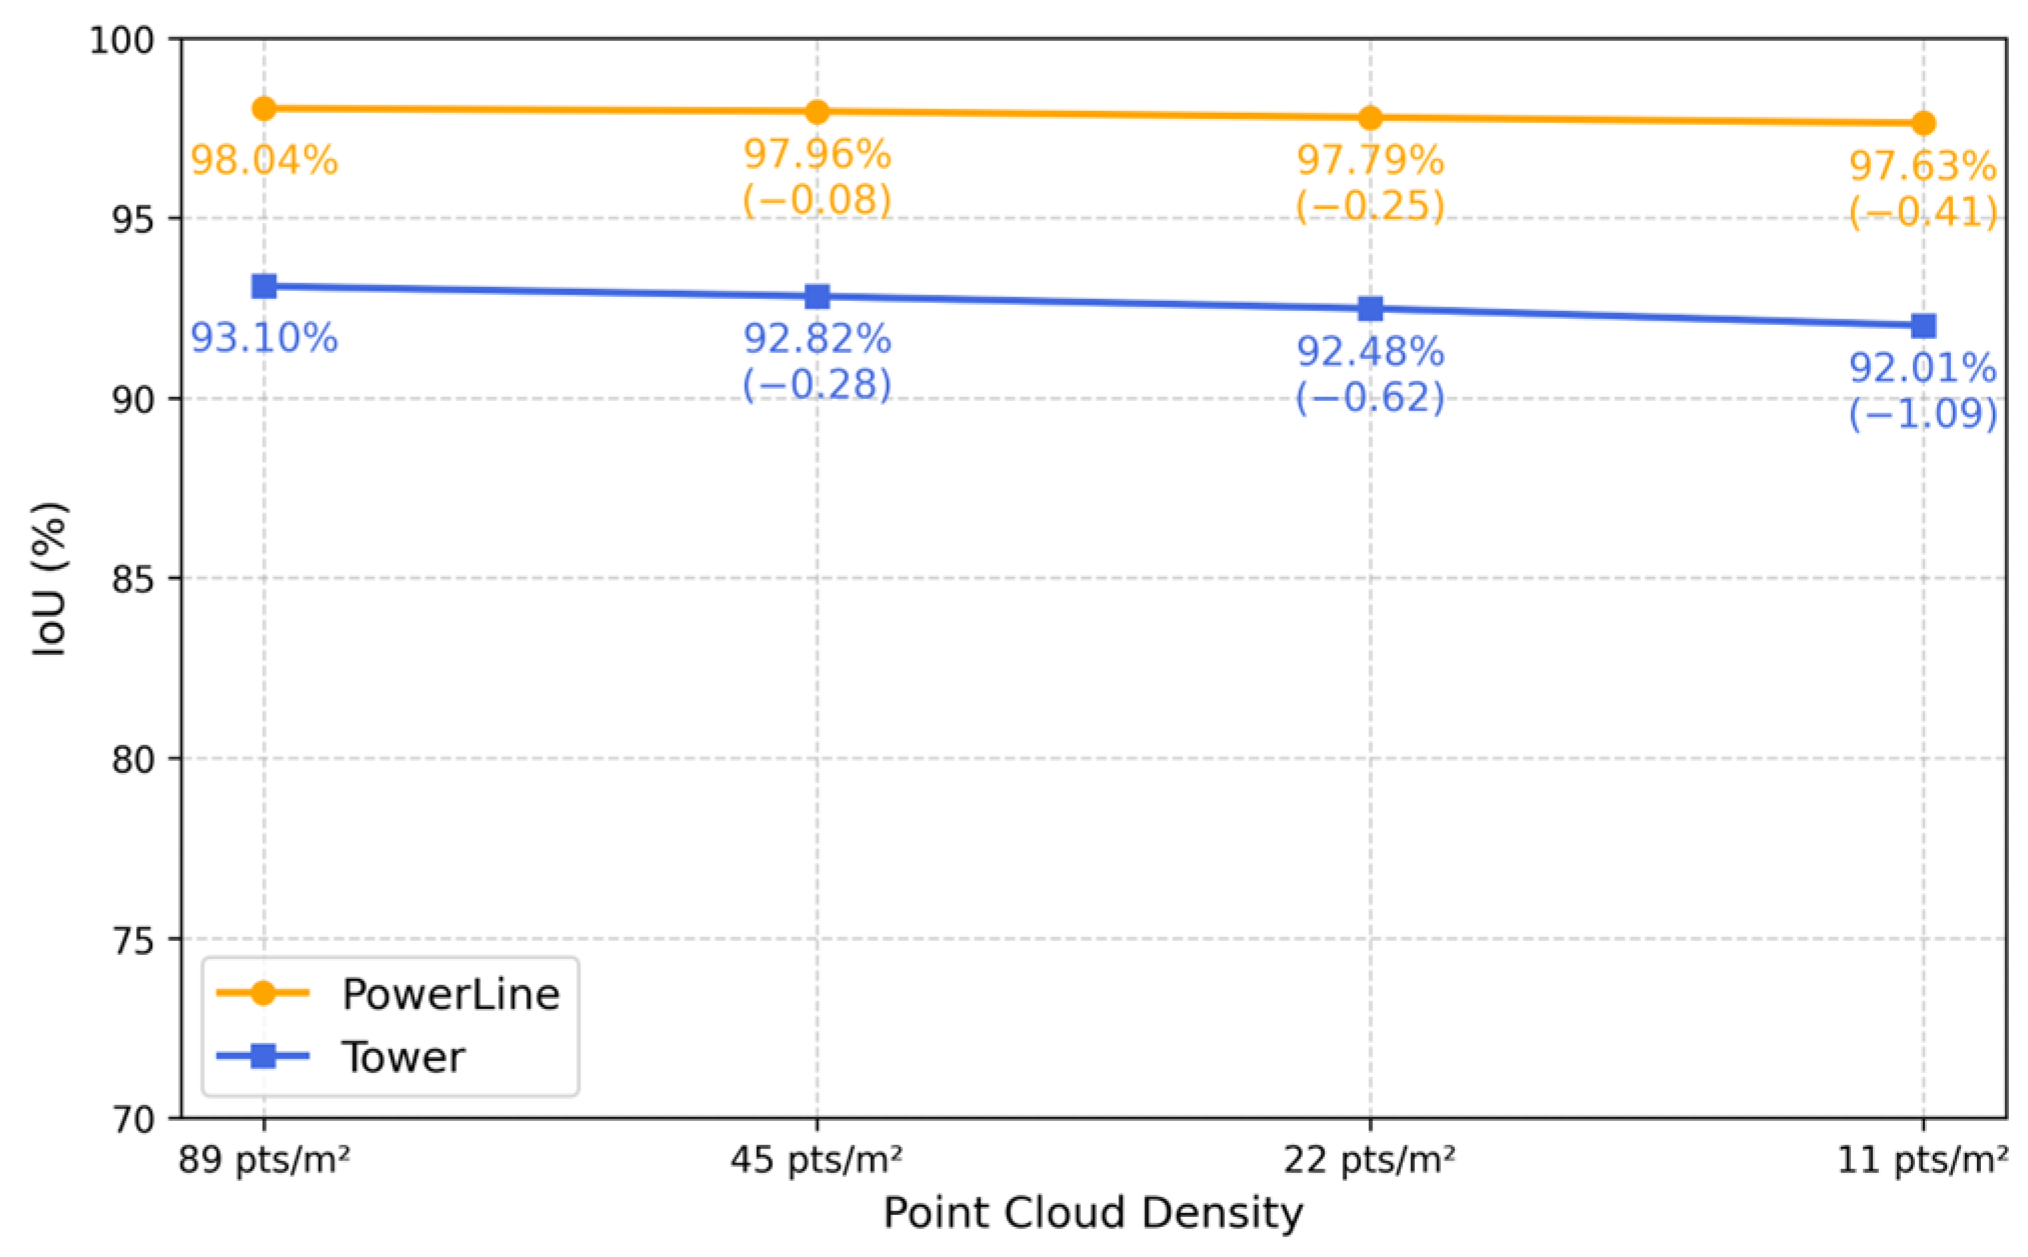
To further evaluate the robustness of EMPower-Net under varying point cloud densities, we conducted random downsampling experiments on the Yunnan dataset at three different densities (45, 22, and 11 pts/m2), and compared the results with the original density (89 pts/m2). As shown in Figure 15, the IoU values of both key categories, power line and Tower, exhibit only a slight decline as the density decreases. Specifically, the IoU of power line remains highly stable, dropping marginally from 98.04% to 97.73%, with a total decrease of only 0.31 percentage points. This demonstrates that the recognition of power line is insensitive to point cloud sparsification. In contrast, the IoU of Tower decreases more noticeably, from 93.10% to 92.10%, with a reduction of approximately 1 percentage point, indicating that Tower instances are more vulnerable to density reduction due to their smaller size and more complex structures. Overall, EMPower-Net maintains stable recognition performance even at low point cloud densities, highlighting its robustness in real-world applications.

5. Discussion

This study demonstrates that EMPower-Net effectively addresses the challenges of powerline corridor segmentation, particularly under dense vegetation and structural occlusion. The elevation distribution (ED) module enhances recognition of vertically complex structures like towers, while the multi-resolution (MR) module enhances segmentation accuracy for complex transmission corridor structures with varying object scales. These modules contribute to robust performance across diverse powerline corridor environments. Transfer learning experiments further indicate that the network generalizes well to new regions, and additional evaluations on urban datasets confirm that elevation-aware features are broadly applicable beyond corridor scenes.
Nevertheless, several limitations remain. First, as a fully supervised framework, EMPower-Net relies on extensive manual annotation, which is costly and time-consuming. Second, real-world transmission networks include diverse tower types not fully represented in the current datasets, potentially constraining model adaptability in unseen regions. Future work will therefore focus on semi-supervised or weakly supervised strategies to alleviate labeling demands, as well as incorporating more diverse infrastructure data to improve generalization.

6. Conclusions

In summary, EMPower-Net advances semantic segmentation of LiDAR point clouds for transmission corridors by integrating multi-resolution context aggregation with elevation-aware encoding. The method achieves state-of-the-art accuracy on large-scale corridor datasets while preserving fine structural details and shows strong transferability to new regions. These results highlight its potential as a practical tool for powerline inspection and monitoring, and its design principles also benefit broader 3D scene understanding tasks.

Author Contributions

Methodology, S.L. and W.J.; Visualization, Y.Y.; Writing—original draft, Y.W., S.L. and G.W.; Writing—review and editing, W.J. and J.S. All authors have read and agreed to the published version of the manuscript.

Funding

This work was supported in part by the Research on Wide Area Identification Technology of Potential External Force Damage Hazards in Transmission Lines by Satellite Earth Alliance (056200KK52222193).

Data Availability Statement

The LiDAR point cloud data of transmission corridors constitutes a critical infrastructure resource. It is not only part of the company’s core assets but also closely linked to national energy security and the safe operation of the power grid. Therefore, this data is strictly protected and not publicly available. If access is required for research or engineering purposes, please contact authors and submit a formal application. Access will only be granted upon review and approval through the appropriate channels.

Conflicts of Interest

Author Yifan Wang, Guofang Wang, Yijun Yan and Jianwen Sun were employed by the company Electric Power Research Institute, Yunnan Power Grid Company Ltd., China. The remaining authors declare that the research was conducted in the absence of any commercial or financial relationships that could be construed as a potential conflict of interest.

References

  1. Yang, L.; Fan, J.; Xu, S.; Li, E.; Liu, Y. Vision-Based Power Line Segmentation with an Attention Fusion Network. IEEE Sens. J. 2022, 22, 8196–8205. [Google Scholar] [CrossRef]
  2. Tao, X.; Zhang, D.; Wang, Z.; Liu, X.; Zhang, H.; Xu, D. Detection of Power Line Insulator Defects Using Aerial Images Analyzed with Convolutional Neural Networks. IEEE Trans. Syst. Man Cybern Syst. 2020, 50, 1486–1498. [Google Scholar] [CrossRef]
  3. Zhang, N.; Xu, W.; Dai, Y.; Ye, C.; Zhang, X. Application of UAV Oblique Photography and LiDAR in Power Facility Identification and Modeling: A Literature Review. In Proceedings of the Third International Conference on Geographic Information and Remote Sensing Technology (GIRST 2024), Rome, Italy, 2 April 2025; SPIE: Bellingham, WA, USA, 2025; Volume 13551, pp. 186–192. [Google Scholar]
  4. Xu, C.; Li, Q.; Zhou, Q.; Zhang, S.; Yu, D.; Ma, Y. Power Line-Guided Automatic Electric Transmission Line Inspection System. IEEE Trans. Instrum. Meas. 2022, 71, 3512118. [Google Scholar] [CrossRef]
  5. Tatarchenko, M.; Park, J.; Koltun, V.; Zhou, Q.-Y. Tangent Convolutions for Dense Prediction in 3D. In Proceedings of the 2018 IEEE/CVF Conference on Computer Vision and Pattern Recognition (CVPR), Salt Lake City, UT, USA, 18–23 June 2018; pp. 3887–3896. [Google Scholar]
  6. Li, H.; Guan, H.; Ma, L.; Lei, X.; Yu, Y.; Wang, H.; Delavar, M.R.; Li, J. MVPNet: A Multi-Scale Voxel-Point Adaptive Fusion Network for Point Cloud Semantic Segmentation in Urban Scenes. Int. J. Appl. Earth Obs. Geoinf. 2023, 122, 103391. [Google Scholar] [CrossRef]
  7. Qi, C.R.; Yi, L.; Su, H.; Guibas, L.J. PointNet++: Deep Hierarchical Feature Learning on Point Sets in a Metric Space. In Proceedings of the 31st International Conference on Neural Information Processing Systems, Long Beach, CA, USA, 4–9 December 2017; Curran Associates Inc.: Red Hook, NY, USA, 2017; pp. 5105–5114. [Google Scholar]
  8. Wang, Y.; Sun, Y.; Liu, Z.; Sarma, S.E.; Bronstein, M.M.; Solomon, J.M. Dynamic Graph CNN for Learning on Point Clouds. ACM Trans. Graph. 2019, 38, 146. [Google Scholar] [CrossRef]
  9. Hu, Q.; Yang, B.; Xie, L.; Rosa, S.; Guo, Y.; Wang, Z.; Trigoni, N.; Markham, A. RandLA-Net: Efficient Semantic Segmentation of Large-Scale Point Clouds. In Proceedings of the 2020 IEEE/CVF Conference on Computer Vision and Pattern Recognition (CVPR), Seattle, WA, USA, 13–19 June 2020; IEEE: New York, NY, USA, 2020; pp. 11105–11114. [Google Scholar]
  10. Guo, M.-H.; Cai, J.-X.; Liu, Z.-N.; Mu, T.-J.; Martin, R.R.; Hu, S.-M. PCT: Point Cloud Transformer. Comp. Vis. Media 2021, 7, 187–199. [Google Scholar] [CrossRef]
  11. Wu, X.; Jiang, L.; Wang, P.-S.; Liu, Z.; Liu, X.; Qiao, Y.; Ouyang, W.; He, T.; Zhao, H. Point Transformer V3: Simpler, Faster, Stronger. In Proceedings of the 2024 IEEE/CVF Conference on Computer Vision and Pattern Recognition (CVPR), Seattle, WA, USA, 16–22 June 2024; IEEE: New York, NY, USA, 2024; pp. 4840–4851. [Google Scholar]
  12. Wu, X.; Lao, Y.; Jiang, L.; Liu, X.; Zhao, H. Point Transformer V2: Grouped Vector Attention and Partition-Based Pooling. arXiv 2022, arXiv:2210.05666. [Google Scholar] [CrossRef]
  13. Robert, D.; Raguet, H.; Landrieu, L. Efficient 3D Semantic Segmentation with Superpoint Transformer. In Proceedings of the 2023 IEEE/CVF International Conference on Computer Vision (ICCV), Paris, France, 1–6 October 2023; IEEE: New York, NY, USA, 2023; pp. 17149–17158. [Google Scholar]
  14. Jiang, L.; Zhao, H.; Shi, S.; Liu, S.; Fu, C.-W.; Jia, J. PointGroup: Dual-Set Point Grouping for 3D Instance Segmentation. In Proceedings of the 2020 IEEE/CVF Conference on Computer Vision and Pattern Recognition (CVPR), Seattle, WA, USA, 13–19 June 2020; IEEE: New York, NY, USA, 2020; pp. 4866–4875. [Google Scholar]
  15. Qu, W.; Wang, J.; Gong, Y.; Huang, X.; Xiao, L. An End-to-End Robust Point Cloud Semantic Segmentation Network with Single-Step Conditional Diffusion Models. arXiv 2025, arXiv:2411.16308. [Google Scholar]
  16. Zhao, W.; Zhang, R.; Wang, Q.; Cheng, G.; Huang, K. BFANet: Revisiting 3D Semantic Segmentation with Boundary Feature Analysis. arXiv 2025, arXiv:2503.12539. [Google Scholar] [CrossRef]
  17. Dai, A.; Chang, A.X.; Savva, M.; Halber, M.; Funkhouser, T.; Niessner, M. ScanNet: Richly-Annotated 3D Reconstructions of Indoor Scenes. In Proceedings of the 2017 IEEE Conference on Computer Vision and Pattern Recognition (CVPR), Honolulu, HI, USA, 21–26 July 2017; IEEE: New York, NY, USA, 2017; pp. 2432–2443. [Google Scholar]
  18. Armeni, I.; Sener, O.; Zamir, A.R.; Jiang, H.; Brilakis, I.; Fischer, M.; Savarese, S. 3D Semantic Parsing of Large-Scale Indoor Spaces. In Proceedings of the 2016 IEEE Conference on Computer Vision and Pattern Recognition (CVPR), Las Vegas, NV, USA, 27–30 June 2016; IEEE: New York, NY, USA, 2016; pp. 1534–1543. [Google Scholar]
  19. Roynard, X.; Deschaud, J.-E.; Goulette, F. Paris-Lille-3D: A Large and High-Quality Ground-Truth Urban Point Cloud Dataset for Automatic Segmentation and Classification. Int. J. Robot. Res. 2018, 37, 545–557. [Google Scholar] [CrossRef]
  20. Chen, M.; Hu, Q.; Yu, Z.; Thomas, H.; Feng, A.; Hou, Y.; McCullough, K.; Ren, F.; Soibelman, L. STPLS3D A Large-Scale Synthetic and Real Aerial Photogrammetry 3D Point Cloud Dataset. arXiv 2022, arXiv:2203.09065. [Google Scholar]
  21. Han, X.; Liu, C.; Zhou, Y.; Tan, K.; Dong, Z.; Yang, B. WHU-Urban3D: An Urban Scene LiDAR Point Cloud Dataset for Semantic Instance Segmentation. ISPRS J. Photogramm. Remote Sens. 2024, 209, 500–513. [Google Scholar] [CrossRef]
  22. Su, H.; Maji, S.; Kalogerakis, E.; Learned-Miller, E. Multi-View Convolutional Neural Networks for 3D Shape Recognition. In Proceedings of the 2015 IEEE International Conference on Computer Vision (ICCV), Santiago, Chile, 7–13 December 2015; pp. 945–953. [Google Scholar]
  23. Boulch, A.; Guerry, J.; Le Saux, B.; Audebert, N. SnapNet: 3D Point Cloud Semantic Labeling with 2D Deep Segmentation Networks. Comput. Graph. 2018, 71, 189–198. [Google Scholar] [CrossRef]
  24. Chen, X.; Ma, H.; Wan, J.; Li, B.; Xia, T. Multi-View 3D Object Detection Network for Autonomous Driving. In Proceedings of the 2017 IEEE Conference on Computer Vision and Pattern Recognition (CVPR), Honolulu, HI, USA, 21–26 July 2017; pp. 1907–1915. [Google Scholar]
  25. Maturana, D.; Scherer, S. VoxNet: A 3D Convolutional Neural Network for Real-Time Object Recognition. In Proceedings of the 2015 IEEE/RSJ International Conference on Intelligent Robots and Systems (IROS), Hamburg, Germany, 28 September–3 October 2015; IEEE: New York, NY, USA, 2015; pp. 922–928. [Google Scholar]
  26. Wu, Z.; Song, S.; Khosla, A.; Yu, F.; Zhang, L.; Tang, X.; Xiao, J. 3D ShapeNets: A Deep Representation for Volumetric Shapes. In Proceedings of the 2015 IEEE Conference on Computer Vision and Pattern Recognition (CVPR), Boston, MA, USA, 7–12 June 2015; IEEE: New York, NY, USA, 2015; pp. 1912–1920. [Google Scholar]
  27. Wang, P.-S.; Sun, C.-Y.; Liu, Y.; Tong, X. Adaptive O-CNN: A Patch-Based Deep Representation of 3D Shapes. ACM Trans. Graph. 2018, 37, 1–11. [Google Scholar] [CrossRef]
  28. Perdomo, O.; Otalora, S.; Gonzalez, F.A.; Meriaudeau, F.; Muller, H. OCT-NET: A Convolutional Network for Automatic Classification of Normal and Diabetic Macular Edema Using Sd-Oct Volumes. In Proceedings of the 2018 IEEE 15th International Symposium on Biomedical Imaging (ISBI 2018), Washington, DC, USA, 4–7 April 2018; IEEE: New York, NY, USA, 2018; pp. 1423–1426. [Google Scholar]
  29. Le, T.; Duan, Y. PointGrid: A Deep Network for 3D Shape Understanding. In Proceedings of the 2018 IEEE/CVF Conference on Computer Vision and Pattern Recognition, Salt Lake City, UT, USA, 18–23 June 2018; IEEE: New York, NY, USA, 2018; pp. 9204–9214. [Google Scholar]
  30. Zhang, S.; Wang, B.; Chen, Y.; Zhang, S.; Zhang, W. Point and Voxel Cross Perception with Lightweight Cosformer for Large-Scale Point Cloud Semantic Segmentation. Int. J. Appl. Earth Obs. Geoinf. 2024, 131, 103951. [Google Scholar] [CrossRef]
  31. Zhu, X.; Zhou, H.; Wang, T.; Hong, F.; Ma, Y.; Li, W.; Li, H.; Lin, D. Cylindrical and Asymmetrical 3D Convolution Networks for LiDAR Segmentation. In Proceedings of the 2021 IEEE/CVF Conference on Computer Vision and Pattern Recognition (CVPR), Nashville, TN, USA, 20–25 June 2021; IEEE: New York, NY, USA, 2021; pp. 9934–9943. [Google Scholar]
  32. Zhang, C.; Wan, H.; Shen, X.; Wu, Z. PVT: Point-voxel Transformer for Point Cloud Learning. Int. J. Intell. Syst. 2022, 37, 11985–12008. [Google Scholar] [CrossRef]
  33. Qi, C.R.; Su, H.; Mo, K.; Guibas, L.J. PointNet: Deep Learning on Point Sets for 3D Classification and Segmentation. In Proceedings of the 30th IEEE Conference on Computer Vision and Pattern Recognition (CVPR 2017), Honolulu, HI, USA, 21–26 July 2017; IEEE: New York, NY, USA, 2017; pp. 77–85. [Google Scholar]
  34. Wu, W.; Qi, Z.; Fuxin, L. PointConv: Deep Convolutional Networks on 3D Point Clouds. In Proceedings of the 2019 IEEE/CVF Conference on Computer Vision and Pattern Recognition (CVPR), Long Beach, CA, USA, 15–20 June 2019; pp. 9621–9630. [Google Scholar]
  35. Robert, D.; Raguet, H.; Landrieu, L. Scalable 3D Panoptic Segmentation as Superpoint Graph Clustering. arXiv 2024, arXiv:2401.06704. [Google Scholar] [CrossRef]
  36. Yu, X.; Tang, L.; Rao, Y.; Huang, T.; Zhou, J.; Lu, J. Point-BERT: Pre-Training 3D Point Cloud Transformers with Masked Point Modeling. In Proceedings of the 2022 IEEE/CVF Conference on Computer Vision and Pattern Recognition (CVPR), New Orleans, LA, USA, 18–24 June 2022; IEEE: New York, NY, USA, 2022; pp. 19291–19300. [Google Scholar]
  37. Behley, J.; Garbade, M.; Milioto, A.; Quenzel, J.; Behnke, S.; Stachniss, C.; Gall, J. SemanticKITTI: A Dataset for Semantic Scene Understanding of LiDAR Sequences. In Proceedings of the 2019 IEEE/CVF International Conference on Computer Vision (ICCV), Seoul, Republic of Korea, 27 October–2 November 2019; IEEE: New York, NY, USA, 2019; pp. 9296–9306. [Google Scholar]
  38. Tian, Z.; Cui, J.; Jiang, L.; Qi, X.; Lai, X.; Chen, Y.; Liu, S.; Jia, J. Learning Context-Aware Classifier for Semantic Segmentation. Proc. AAAI Conf. Artif. Intell. 2023, 37, 2438–2446. [Google Scholar] [CrossRef]
  39. Wang, P.-S. OctFormer: Octree-Based Transformers for 3D Point Clouds. ACM Trans. Graph. 2023, 42, 1–11. [Google Scholar] [CrossRef]
  40. Peng, B.; Wu, X.; Jiang, L.; Chen, Y.; Zhao, H.; Tian, Z.; Jia, J. OA-CNNs: Omni-Adaptive Sparse CNNs for 3D Semantic Segmentation. In Proceedings of the 2024 IEEE/CVF Conference on Computer Vision and Pattern Recognition (CVPR), Seattle, WA, USA, 16–22 June 2024; IEEE: New York, NY, USA, 2024; pp. 21305–21315. [Google Scholar]
Figure 1. Overall Architecture of the EMPower-Net.
Remotesensing 17 03318 g001
Figure 2. Histogram of points located in different regions.
Remotesensing 17 03318 g002
Figure 3. Architecture of Elevation Distribution Module.
Remotesensing 17 03318 g003
Figure 4. Architecture of Multi-Resolution Module.
Remotesensing 17 03318 g004
Figure 5. Overview of Powerline Corridor Point Cloud dataset: (a) Yunnan; (b) Guangdong.
Remotesensing 17 03318 g005
Figure 6. Qualitative comparison of semantic segmentation results on Yunnan powerline corridor point clouds. (ac) show three typical scenes. Each row represents the result from a different method: ground truth, SPT, PCTv3, BFANet, CDSegNet and EMPower-Net. Zoomed-in regions highlight segmentation performance on fine-grained structures such as towers and powerlines.
Remotesensing 17 03318 g006
Figure 7. Qualitative comparison of semantic segmentation results on Guangdong powerline corridor point clouds. (ac) show three typical scenes. Each row represents the result from a different method: ground truth, SPT, PCTv3, BFANet, CDSegNet and EMPower-Net. Zoomed-in regions highlight segmentation performance on fine-grained structures such as towers and powerlines.
Remotesensing 17 03318 g007
Figure 8. Model parameters and average inference time. The size of each bubble reflects the number of model parameters, with larger bubbles indicating larger parameter counts.
Remotesensing 17 03318 g008
Figure 9. Visual comparison of segmentation results under different module configurations.
Remotesensing 17 03318 g009
Figure 10. Quantitative comparison of different methods on the Guangdong after transfer learning from the Yunnan.
Remotesensing 17 03318 g010
Figure 11. Performance comparison between model trained on the Yunnan data and transfer model tested on the Guangdong data.
Remotesensing 17 03318 g011
Figure 12. Visual comparison of segmentation results with/without elevation features.
Remotesensing 17 03318 g012
Figure 13. Impact of elevation features on segmentation metrics for WHU3D and Paris-Lille-3D.
Remotesensing 17 03318 g013
Figure 14. Effect of Histogram Bin Number and Voxelization Size on Semantic Segmentation Performance.
Remotesensing 17 03318 g014
Figure 15. PowerLine and Tower IoU Variation under Different Point Cloud Densities.
Remotesensing 17 03318 g015
Table 1. Training Parameters for Different Methods.
RandLADGCNNCACOctFormerSPTOACNNPCTv3BFACDSegEMPower
epoch1002509006002000900800400800500
lr0.010.010.0010.0050.00150.0010.0060.0010.0020.001
Table 2. Quantitative Different Point Cloud Classification Networks on the Yunnan Dataset.
ClassMetricMethods
RandLADGCNNCACOctFormerSPTOACNNPCTv3BFACDSegEMPower
GroundPrec35.9281.4769.7483.1870.9473.0776.3484.4568.8485.66
Recall68.0283.7196.0954.8185.2695.287.6687.6280.0088.72
F147.0182.5780.8266.0877.4482.6881.6186.0174.0087.16
IoU30.7370.3267.8249.3463.1970.4768.9375.4558.7377.25
VegetationPrec88.488.6898.3186.7393.5797.8395.6196.3797.4696.82
Recall20.7790.287.9287.0284.7490.3792.5295.5389.7795.87
F133.6389.4392.8286.8788.9493.9594.0495.9593.4696.34
IoU20.2286.6786.6176.7980.0888.688.7592.2187.7292.94
Power LinePrec5.2272.482.6584.3386.0595.5194.199.1450.3498.67
Recall81.5534.798.2560.8486.592.7591.0698.2694.0699.35
F19.8146.9189.7870.6886.2794.1192.5698.7065.5899.01
IoU5.1669.5881.4554.6675.8688.8786.1497.4448.7998.04
TowerPrec25.0112.9591.2242.4171.7894.1789.7196.8695.1097.67
Recall37.093.1950.7416.3572.3322.1954.3490.1253.5495.21
F129.875.1265.2123.6072.0535.9267.6993.3768.5096.43
IoU11.7320.6448.3812.1436.0259.8851.1687.5652.493.10
AveragePrec38.6463.8785.4874.1680.5890.1488.9494.2077.9394.70
Recall51.8552.9583.2554.7682.2175.1281.3992.8879.3494.79
F130.0856.0182.1661.8081.1776.6783.9793.5175.3894.73
IoU16.9661.8071.0648.2363.7976.9573.7488.1661.9190.33
Table 3. Quantitative Different Point Cloud Classification Networks on the Guangdong Dataset.
ClassMetricMethods
RandLADGCNNCACOctFormerSPTOACNNPCTv3BFACDSegEMPower
Ground Prec24.0368.6761.5773.1665.7665.1375.1682.6570.5181.19
Recall76.6379.1597.9127.0782.2297.0991.5289.0180.8391.80
F136.5973.5475.6039.5173.0877.9682.5485.7175.3286.17
IoU22.3958.1560.7724.6257.5763.8970.2775.0060.4175.70
VegetationPrec91.5894.9199.4988.9496.1798.9898.6498.3097.9098.75
Recall46.0595.0289.4997.6991.9692.2795.5097.2494.6396.89
F161.2894.9694.2393.1194.0295.5097.0497.7796.2497.81
IoU44.1890.4089.0987.1188.7191.3994.2695.6392.7595.72
Power LinePrec10.1178.8774.9068.2695.3690.5899.1199.3882.6799.84
Recall87.2617.6298.9061.1096.6499.6199.1299.8592.3499.82
F118.1228.8085.2464.4895.9994.8899.1299.6187.2499.83
IoU9.9616.8274.2847.5892.3090.2692.2599.2377.3699.66
TowerPrec60.5511.7155.6256.1158.5293.6990.6397.3573.7897.25
Recall6.204.5234.6634.9238.5713.1188.9389.9353.2094.19
F111.256.5242.7042.0546.5023.0089.7793.5061.8295.70
IoU5.963.9427.1527.4330.2932.7881.4487.7936.5191.75
AveragePrec46.5763.5472.9071.6278.9587.0190.8994.4281.2294.26
Recall54.0449.0780.2455.2077.3575.5293.7794.0180.2595.68
F131.8150.9674.4459.7977.4072.8492.1294.1580.1694.88
IoU20.6242.3262.8246.6967.2269.5884.5689.4166.7690.71
Table 4. Ablation Experiments on Every Components of Our Network.
MetricGroundVegetationPower LineTowerAverage
Only with MRPrec76.3495.6195.7789.7189.35
Recall87.6692.5295.3654.3482.47
F181.6194.0495.5767.6984.72
IoU68.9388.7591.5151.1675.08
Only with EDPrec80.8793.6494.1092.4090.25
Recall78.6894.7991.0669.2183.43
F179.7694.2192.5679.1486.41
IoU66.3389.0586.1465.4876.75
Table 5. Ablation study comparing histogram encoding with simplified alternatives (Z and Z+). Results are reported as IoU (%) on powerline and tower classes.
DatasetClassZZ+Histogram
YunnanPowerLine Line96.9897.8898.04
Tower88.5490.0393.10
GuangdongPowerLine Line97.8298.9399.66
Tower85.3386.2691.75
Disclaimer/Publisher’s Note: The statements, opinions and data contained in all publications are solely those of the individual author(s) and contributor(s) and not of MDPI and/or the editor(s). MDPI and/or the editor(s) disclaim responsibility for any injury to people or property resulting from any ideas, methods, instructions or products referred to in the content.