Highlights
What are the main findings?
- Time series of ground displacement were successfully generated for the entire Campi Flegrei and Vesuvio areas between 2010 and 2015, using RADARSAT-2 SAR imagery.
- There is no evidence of deformation activity around Vesuvio between 2010 and 2015. In contrast, significant, constant-shape deformation is evident in the Campi Flegrei area.
What is the implication of the main finding?
- The depressurisation that occurred around 8 km below Vesuvio in the early 2000s, when unrest at Campi Flegrei began, was not visible between 2010 and 2015.
- Connecting the ground deformation time series obtained from ERS/ENVISAT (1993–2010), RADARSAT-2 (2010–2015) and Sentinel-1 (from 2015 onwards) enables deformation at Campi Flegrei and Vesuvio to be studied over an uninterrupted period of more than 30 years.
Abstract
The area encompassing the Campi Flegrei and Vesuvio volcanoes, situated approximately 25 km apart and bisected by the city of Naples, Italy, is recognised as one of the most hazardous regions globally. In recent decades, the Campi Flegrei caldera has undergone significant changes in its monitored geophysical, geochemical and geodetical signals. The most recent, ongoing unrest began in 2005, resulting in an uplift of over 150 centimetres in the area of maximum uplift. Previous analyses of deformation data from ERS/ENVISAT (available up to 2010) and Sentinel-1 (available since 2015) Synthetic Aperture Radar (SAR) imagery, as well as global navigation satellite system data, have suggested that the shape of the deformation field at Campi Flegrei has remained constant and that the area around Vesuvio experienced a slight subsidence in the early 2000s, concurrently with a change in the sign of the ground deformation (from subsidence to uplift) at Campi Flegrei. This study presents and provides the ground displacement time series obtained from RADARSAT-2 images of the entire volcanic area from 2010 to 2015, thus filling the temporal gap between the ERS/ENVISAT and Sentinel-1 missions. The time series were generated using a bespoke procedure, based on the Sentinel Application Platform and the GMTSAR software. The validity of the displacement time series has been confirmed through comparison with continuous Global Positioning System data from the Neapolitan Volcanoes Continuous GPS network. Analysis of RADARSAT-2 ground displacements indicates that velocities in the vicinity of Vesuvio were no greater than a few millimetres per year, and no discernible deformation pattern is evident. Consequently, given the uncertainty in Differential Interferometry Synthetic Aperture Radar (DInSAR) measurements, there is no evidence to suggest deformation activity close to Vesuvio between 2010 and 2015. In contrast to Vesuvio, significant deformation is evident in the Campi Flegrei area. The shape of the ground displacement field remained constant between 2010 and 2015, within the uncertainty of DInSAR measurements. The mean upward velocity reaches a maximum of approximately 5 cm y−1, while the mean eastward velocity reaches 2.4 cm y−1.
1. Introduction
It is imperative to comprehend the characteristics of a volcanic system, a task that assumes even greater significance when the volcano is in pluri-decadal unrest and situated in a densely populated area. In this respect, ground deformation, as measured by means of satellite Differential Synthetic Aperture Radar Interferometry (DInSAR), is a valuable source of information due to its wide-area coverage and geometric resolution. The area encompassing the Campi Flegrei and Vesuvio volcanoes, situated approximately 25 km apart and bisected by the city of Naples, Italy, is recognised as one of the most hazardous regions globally (Figure 1).
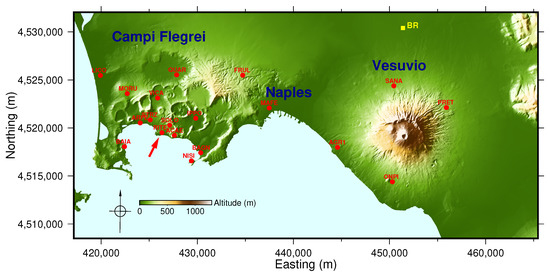
Figure 1.
Map of Campi Flegrei and Vesuvio volcanoes, UTM WGS84 33N coordinates. The map frame delineates the domain of the DInSAR data under consideration (easting from 417,150 m to 465,450 m; northing from 4,508,500 m to 4,532,050 m). Colours provide altitudes [1]. Red dots and labels indicate the cGPS stations [2] that were used for the testing of the DInSAR ground displacement time series. The red arrow indicates the RITE cGPS station, which is located in the area of maximum uplift. The yellow square and label denote Brusciano, which is employed as a reference point for the DInSAR displacements.
Following a period of dormancy spanning 3000 years and centuries of subsidence, Campi Flegrei erupted in 1538 (e.g., [3]). The eruption was preceded by an increase in seismic activity and substantial uplift, followed by deflation [4,5,6]. Campi Flegrei has gained global renown for its continual slow vertical movements (bradyseism), and it has been experiencing intermittent unrest since the 1950s. The area of maximum uplift has been identified as being located close to the RITE continuous Global Positioning System (cGPS) station (Figure 1). At least three significant periods of unrest were observed, firstly between 1950 and 1952, then between 1969 and 1972, and finally between 1982 and 1984 [7]. This latest episode was succeeded by a prolonged period of subsidence, punctuated by brief phases of uplift [7]. Since 2005, for most of the time, the Campi Flegrei area has been subject to an accelerated rate of uplift, resulting in significant elevation (more than 150 cm in the area of maximum uplift; see Figure 2) that has exceeded the levels recorded in 1984 (e.g., [8,9]). The uplift of Campi Flegrei is accompanied by geochemical anomalies and seismicity with magnitude greater than 4 (e.g., [9]).
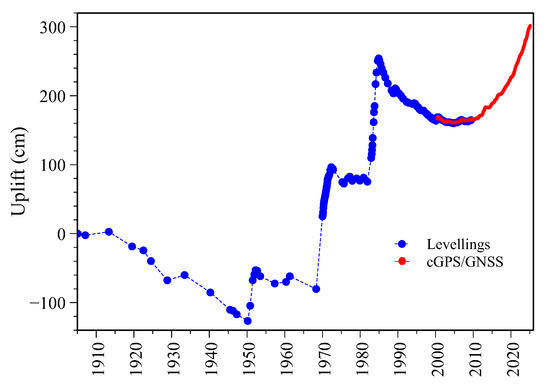
Figure 2.
Changes in ground level close to RITE, which is located in the area of maximum vertical displacement at Campi Flegrei, from 1905 to February 2025. Blue dots, levelling data [7]; red dots, vertical displacement from cGPS [2] and GNSS [9] data.
Vesuvio has been subject to numerous volcanic eruptions throughout its history. The most significant of these was the Plinian eruption of AD 79. This eruption was followed in sequence by sub-Plinian eruptions in the years 472 and 1631, and by semi-persistent activity until 1944. Since 1944, Vesuvio has been identified as being both active and dormant [10].
The eruptive histories of Campi Flegrei and Vesuvio are distinct, with the products of their past eruptions exhibiting different characteristics. However, they are compatible with the possible existence of a common deep magmatic layer at a depth of 8–10 km. The existence of this layer is corroborated by geophysical studies [11].
A recent paper used Synthetic Aperture Radar (SAR) data from the ERS/ENVISAT missions (1993–2010) and the Sentinel-1 mission (2015 to present), both of which are managed by the European Space Agency (ESA) [12]. The study concluded that the observed ground deformation during the ongoing uplift of Campi Flegrei was partially attributable to a source located approximately 8 km deep [13]. Furthermore, an analysis of ERS/ENVISAT data has revealed that depressurisation occurred at a depth of 8–9 km beneath Vesuvio in the early 2000s [8]. The same study also suggests that there was a probable deep interaction between the two volcanoes during the transition between subsidence and uplift at Campi Flegrei. Recent research and historical-artistic evidence suggest that the behaviour of the Campi Flegrei and Vesuvio was concurrent during the 16th century (F. Giudicepietro, personal communication).
The temporal gap between the conclusion of the ERS/ENVISAT mission in 2010 and the commencement of the ground displacement time series from the Sentinel-1 mission in 2015 is particularly important for studying Campi Flegrei and Vesuvio, especially in order to understand the origin and cause of the ongoing unrest of Campi Flegrei and to gain a deeper understanding of the possible interactions between the two volcanoes.
The RADARSAT-2 mission of the Canadian Space Agency (CSA) has been operational since 2007. Like ERS/ENVISAT and Sentinel-1, it operates in the C-band, and images from this mission are commercially available from MDA Geospatial Services Inc. (7500 Financial Drive, Brampton, Ontario, Canada) (https://mda.space/ (accessed on 19 September 2025)).This article focuses on ground deformation in the Campi Flegrei and Vesuvio area between ERS/ENVISAT and Sentinel-1 Missions from RADARSAT-2 imagery, and provides the related time series on an incomplete regular grid with a resolution of 150 m. RADARSAT-2 images were obtained within the framework of the ESA project PP0094512. The primary objective of the project was accomplished by implementing a bespoke procedure based on the Sentinel Application Platform (SNAP) [14] and GMTSAR [15]. This procedure was developed because it was impossible to use GMTSAR alone, as was done in [13] for Sentinel-1 imagery, for example. This was due to unsolvable problems encountered when co-registering some RADARSAT-2 images. The methodology can be used in similar situations where the co-registration of SAR images presents challenges.
2. Materials and Methods
2.1. Materials
The RADARSAT-2 satellite was launched in 2007. The system acquires SAR images in the C-band at 5.405 GHz with resolutions ranging from 3 to 100 m, depending on the selected imaging mode. Depending on the operational mode, either co-, cross- or quad-polarisation images are available. The images are not available free of charge, but are marketed by MDA Geospatial Services Inc. Thanks to the European Space Agency, 2 images in single (HH) polarisation, and 29 images in double (HH and HV) polarisation, which were captured during the ascending pass, were obtained. A further three images in single (HH) polarisation and 29 images in double (HH and HV) polarisation, captured during the descending pass, were obtained (Figure 3). The images are Single Look Complex (SLC) Standard 3 and have a nominal range resolution of approximately 25 m. In the study area, the angle of incidence of the line of sight (LOS) increases from 33° to 36° from west to east for the ascending pass, while it decreases from 37° to 34° from west to east for the descending pass. The LOS azimuth (positive from north to east) is −100° for the ascending orbit and 80° for the descending orbit.
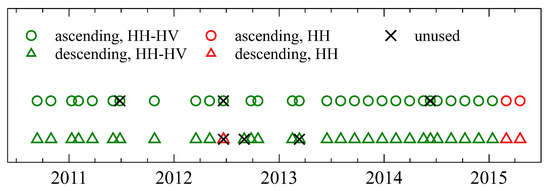
Figure 3.
Acquisition dates of the RADARSAT-2 images. Green circles and triangles, acquisition dates of the ascending- and descending-pass double-polarisation (HH and HV) images, respectively. Red circles and triangles, acquisition dates of the ascending- and descending-pass single-polarisation (HH) images, respectively. The presence of crossed symbols indicates that the images in question have been discarded.
The ground displacement time series were obtained from the HH images, and validated against cGPS daily data acquired at several stations located in the Neapolitan volcanic area [2]. The cGPS displacements given by [2] are referred to a local reference frame defined by six stations of the INGV (Istituto Nazionale di Geofisica e Vulcanologia) RING (Rete Integrata Nazionale GNSS) network located outside the Neapolitan volcanic area. The velocities of the six selected RING stations are considered indicative of the tectonic motion of the area.
2.2. Methods
The initial plan had been to employ the GMTSAR package [15], an approach that had previously yielded favourable outcomes in [13], for the entirety of the process associated with each of the two orbital passes. This process encompasses the co-registration of all images against a master image, as well as the generation of ground deformation time series. However, difficulties were encountered during the co-registration of RADARSAT-2 images that exhibited a substantial offset in the azimuthal direction when using GMTSAR. The issue was most likely attributable to the insufficient length of the orbit segment whose parameters are incorporated in the RADARSAT-2 products. Consequently, a bespoke procedure was developed, based on SNAP [14] and GMTSAR [15]. In addition, GMT [16] was used to perform operations on gridded datasets.
The primary steps involved in generating the LOS ground displacement time series for the ascending and descending passes are summarised below.
- HH interferometric pairs are selected based on timespan and perpendicular baseline thresholds.
- The two images of each interferometric pair are co-registered.
- An interferogram is generated and processed for each co-registered interferometric pair. This processing includes multilooking, phase filtering and terrain correction (the removal of phase components due to topography). The resultant phase and coherence maps are then stored for subsequent analysis.
- Each phase and coherence map is resampled on the same 25 × 25 m regular grid for all the interferometric pairs.
- The resulting phase map is unwrapped after masking out low-coherence pixels, the sea, wet areas and densely vegetated regions.
- A planar and a quadratic surface are fitted to each unwrapped phase map after masking the region of largest ground deformation. The best-fit surfaces are subtracted from the entire unwrapped phase map (detrending).
- The unwrapped phase maps are used to generate displacement maps for each epoch.
2.2.1. Selection and Co-Registration of the HH Interferometric Pairs (Steps 1 and 2 of the Procedure)
Firstly, for each pass, the perpendicular baselines with respect to a reference image were determined by using SNAP. Subsequently, a preliminary selection of candidate HH interferometric pairs was performed based on somewhat arbitrary thresholds for the timespan and perpendicular baseline (first step, see Figure 4a and Figure 5a). The timespan threshold was set at 370 days, which is similar to that used in [17,18], for example. The perpendicular baseline threshold was set at 450 m.
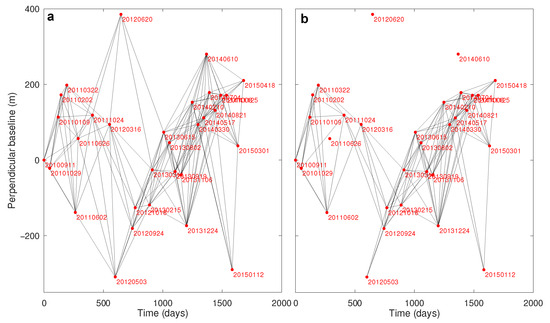
Figure 4.
Perpendicular baselines versus time (red dots) and interferometric pairs (black lines), ascending-pass images. The red labels identify the epochs as “yyyymmdd”. (a) The 160 interferometric pairs with a timespan of less than 370 days and a perpendicular baseline of less than 450 m. (b) The 124 interferometric pairs selected by excluding those that gave rise to unresolved unwrapping errors (see Figure 6).
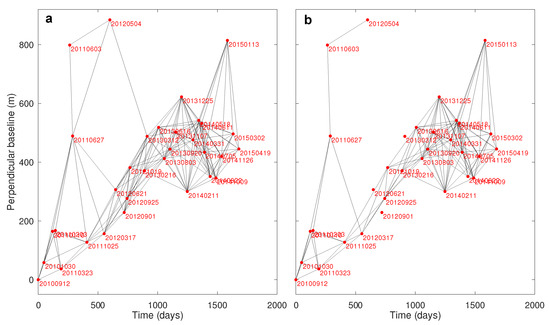
Figure 5.
Perpendicular baselines versus time (red dots) and interferometric pairs (black lines), descending-pass images. The red labels identify the epochs as “yyyymmdd”. (a) The 161 interferometric pairs with a timespan of less than 370 days and a perpendicular baseline of less than 450 m. (b) The 125 interferometric pairs selected by excluding those that gave rise to unresolved unwrapping errors (see Figure 6).
In the subsequent step of the procedure, the two images in each interferometric pair were co-registered by using 4000 ground control points through an appropriate SNAP Graph Processing Tool (GPT) script (step 2).
2.2.2. Interferogram Generation and Phase Unwrapping (Steps 3 to 6 of the Procedure)
The third to sixth steps of the process are schematised in Figure 6. Two SNAP GPT scripts, with their parameters adjusted through a series of tests, were used for executing the third step. The first SNAP GPT script generated the interferogram for each interferometric pair and produced the coherence and phase maps. The phase map was initially corrected by subtracting the flat Earth contribution and the topographic phase contribution using Shuttle Radar Topography Mission digital elevation data with a resolution of 1 arc-second (SRTM-1Sec) [19]. Subsequently, a multi-look filter with two range looks and nine azimuth looks was applied, thus resampling the maps at a nominal square pixel of approximately 43 m. Furthermore, a strong Goldstein phase filter [20] with an adaptive filter exponent (alpha in the GPT script) of 1 was also applied. The second SNAP GPT script addressed geometric distortions by using SRTM-1Sec data. Subsetting was also performed, resulting in the generation of maps with regular grids in geographic coordinates. All the phase and coherence maps were then resampled using GMT onto the same WGS84/UTM 33N 25 × 25 m regular grid, the extension of which is shown in Figure 1 (step 4).
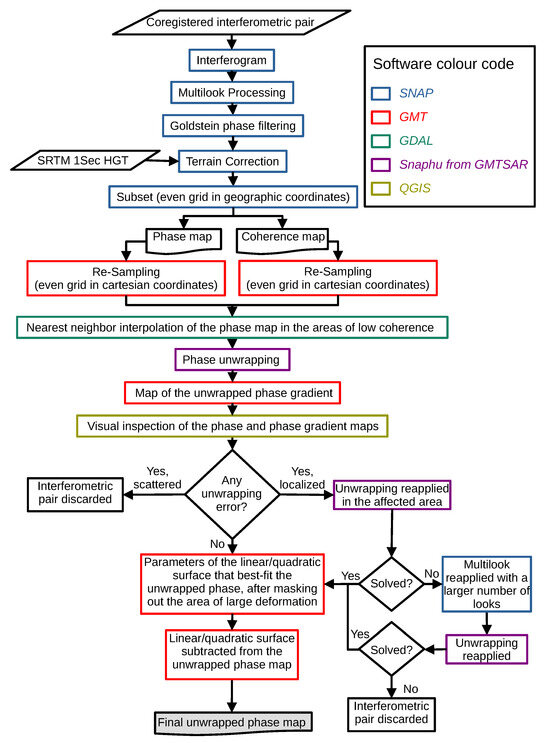
Figure 6.
Schematic flowchart illustrating the processing steps employed to generate the unwrapped phase maps from each co-registered interferometric pair. The colour of the contour of each symbol indicates the software used to perform the action.
Phase unwrapping was carried out by using the Snaphu code v. 2.0.7 [21], as provided by GMTSAR (step 5). The existence of decorrelated regions has been demonstrated to give rise to phase unwrapping errors, irrespective of whether the phase within these regions is maintained or set to zero. Consequently, prior to the unwrapping process, low-coherence pixels, the sea, wet areas and densely vegetated regions were masked out. Following [22], the masked areas in the phase maps were filled using a nearest-neighbour algorithm. We used the GDAL program gdal_fillnodata.py [23] instead of the analogous GMTSAR program because the former is much faster. After a series of tests were carried out, a maximum distance of 300 pixels was determined as the threshold beyond which interpolation would not be performed (see Figure 7).
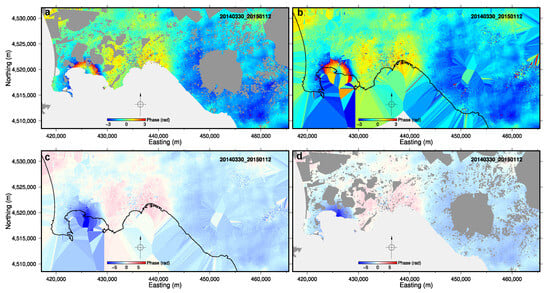
Figure 7.
Example of how the unwrapping procedure is applied (ascending-pass interferometric pair 30 March 2014 and 12 January 2015). (a) Interferometric phase, after masking out low-coherence pixels and densely vegetated regions (dark grey areas), as well as the sea and wet areas (light grey areas). (b) Interferometric phase, after the masked areas have been filled using a nearest-neighbour algorithm. (c) Unwrapped phase obtained from (b). (d) Unwrapped phase after masking the phase in (c) as was done in (a). UTM WGS84 33N coordinates.
We carried out numerous tests, varying the minimum coherence value so that pixels would not be masked out. Ultimately, we chose a coherence threshold of 0.1. This threshold may appear low; however, it is important to choose a value that balances phase noise, which must be kept as low as possible, and spatial coverage, which must be kept as high as possible to enable continuous unwrapping paths to be established. For most interferometric pairs, the percentage of pixels with a coherence value between 0.1 and 0.2 ranges from approximately 13% to 18%, while this percentage is lower than 10% for only a few interferometric pairs (see Supplementary Information Figure S1). Increasing the threshold value to 0.2 prevented continuous unwrapping paths for several interferometric pairs in various parts of the study area. Unfortunately, images are only available for a limited number of epochs, so it was important to use as many as possible.
The relationship between the percentage of pixels with coherence between 0.1 and 0.2 and timespan is weak, except for a few interferometric pairs with a timespan of less than around 100 days. By contrast, there is a strong relationship between the percentage of low-coherence pixels and the perpendicular baseline (see Supplementary Information Figure S1). Similar conclusions can be drawn from the scatter plots of the mean pixel coherence for each interferometric pair against timespan and perpendicular baseline, after masking out pixels with a coherence value below 0.1 (see Supplementary Information Figure S2).
Phase unwrapping errors cannot be ruled out. In the case of time series with numerous interferometric pairs, an a posteriori check is often performed automatically by verifying the congruity of all the triangular loops in the series. However, this technique is not without potential errors. Furthermore, it does not allow for the direct identification of individual interferometric pairs that are affected by unwrapping errors [24]. Given the relatively small number of interferometric pairs (see Figure 4a and Figure 5a), it was deemed more efficient to undertake a meticulous visual inspection of the unwrapped phase maps and unwrapped phase gradient maps for each pair (Figure 6).
In cases where a large number of unwrapping errors were identified across a substantial portion of the study area, the interferometric pair was discarded. In cases where unwrapping errors were concentrated in a relatively small part of the study area, the first step was to extract and re-unwrap the relevant part of the wrapped phase map. If successful, the re-unwrapped part was added back to the unwrapped phase map to replace the erroneously unwrapped part. Figure 8 shows an example. The unwrapping error can be seen clearly within the black rectangle in Figure 8c as well as in the amplitude of the gradient of the unwrapped phase in Figure 8d. The region outlined in black in Figure 8c was extracted from the interpolated wrapped phase grid in Figure 8b, re-unwrapped, and added back to the grid in Figure 8c to obtain the corrected unwrapped phase shown in Figure 8e. The three curves in Figure 8f relate to the initial unwrapped phase, the amplitude of its gradient, and the final unwrapped phase. These were all computed along the ABCDA path in Figure 8d and demonstrate the efficacy of correcting the unwrapping error for this interferometric pair.
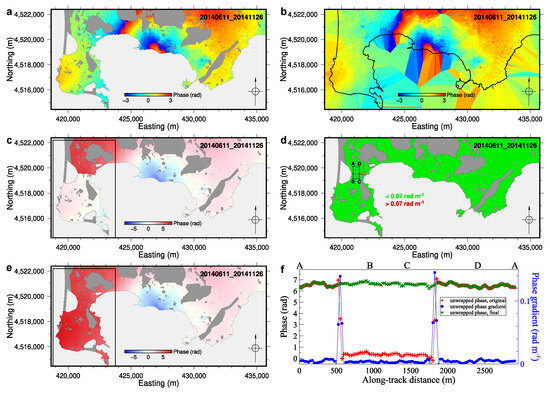
Figure 8.
Example illustrating the process of correcting an unwrapping error by re-unwrapping the sole area affected by the error (descending-pass interferometric pair 11 June 2014 and 26 November 2014). (a) Masked wrapped phase of the interferometric pair. (b) Interpolated wrapped phase. (c) Initial unwrapped phase; the black rectangle indicates the area extracted for re-unwrapping. (d) Amplitude of the gradient of the initial unwrapped phase. Green pixels indicate a gradient amplitude of less than 0.07 rad m−1, whereas red pixels indicate a gradient amplitude of greater than 0.07 rad m−1. (e) Final corrected unwrapped phase (see text for details). (f) Plots showing the values of various parameters along the ABCDA path, delineated by the black rectangle in (d) red pluses, unwrapped phase mapped in (c); blue dots, amplitude of the gradient of the unwrapped phase mapped in (d); green crosses, corrected unwrapped phase shown in (e). UTM WGS84 33N coordinates.
When the re-unwrapping approach failed, we tried a different one. An example is shown in Figure 9. The unwrapping error can be seen within the black rectangle in Figure 9c, as well as in the amplitude of the gradient of the unwrapped phase in Figure 9d. After applying a multi-look filter with three range looks and 13 azimuth looks to the entire study area, we re-unwrapped the interferometric phase. If successful, the region delineated by the black rectangle in Figure 9c was extracted from the resulting unwrapped phase grid. This region was then resampled onto a regular grid with a 25 × 25 m spacing. This resampled region was then added back to the incorrectly unwrapped phase grid to replace the part that was previously affected by errors (Figure 9e). As in Figure 8f, the three curves in Figure 9f relate to the initial unwrapped phase, the amplitude of its gradient, and the final unwrapped phase. The rectangular path is entirely contained within the replaced region; thus, the replaced unwrapped phase is smoother than the original.
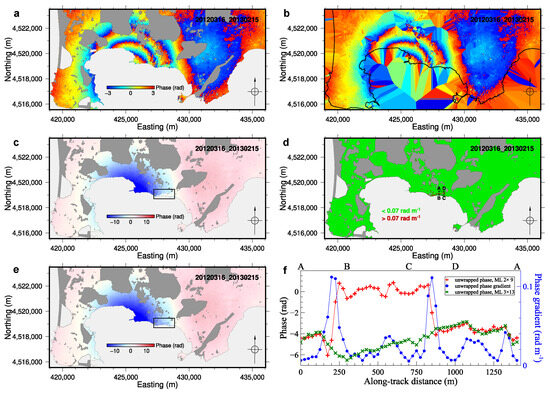
Figure 9.
Example illustrating the process of correcting an unwrapping error by changing the multi-look filter before re-unwrapping (ascending-pass interferometric pair 16 March 2012 and 15 February 2013). (a) Masked wrapped phase of the interferometric pair. (b) Interpolated wrapped phase. (c) Initial unwrapped phase; the black rectangle indicates the area affected by unwrapping errors. (d) Amplitude of the gradient of the initial unwrapped phase. Green pixels indicate a gradient amplitude of less than 0.07 rad m−1, whereas red pixels indicate a gradient amplitude of greater than 0.07 rad m−1. (e) Final corrected unwrapped phase; the black rectangle indicates where the initial, incorrectly unwrapped phase has been replaced with the correct one (see text for details). (f) Plots showing the values of various parameters along the ABCDA path, delineated by the black rectangle in (d): red pluses, unwrapped phase mapped in (c); blue dots, amplitude of the gradient of the unwrapped phase mapped in (d); green crosses, corrected unwrapped phase shown in (e). UTM WGS84 33N coordinates.
Having completed step 5 of the procedure, 124 out of 160 interferometric pairs were selected for the ascending pass (Figure 4b), while 125 out of 161 were selected for the descending pass (Figure 5b). The pixels common to all the selected interferometric pairs were then identified. Figure 10 shows the mean coherence of these pixels across all pairs. The mean coherence exceeds 0.3 for over 95% of pixels for both the ascending and descending passes.

The unwrapped phase may exhibit a discernible ramp. This phenomenon is often associated with suboptimal orbital parameters and/or atmospheric effects characterised by long wavelengths. Phase ramps are often removed from unwrapped interferograms by first fitting a low-order polynomial surface, which is then subtracted from the unwrapped phase [25]. In this study, a planar surface (linear phase ramp) and a quadratic surface (quadratic phase ramp) were fitted to each unwrapped interferogram, after masking out a region of large ground deformation. The best-fit surfaces were then subtracted from the entire unwrapped interferogram (step 6). The parameters of the best-fit surfaces are influenced, at least in part, by the characteristics of the selected large deformation region. The subtraction of the best-fit surfaces has the potential to generate artefacts with long wavelengths. Thus, a comparison was made between the ground displacement time series obtained as outlined in Section 2.2.3 and the cGPS time series, using a range of different masked regions. Ultimately, the regions delineated in Figure 11a,d were used.
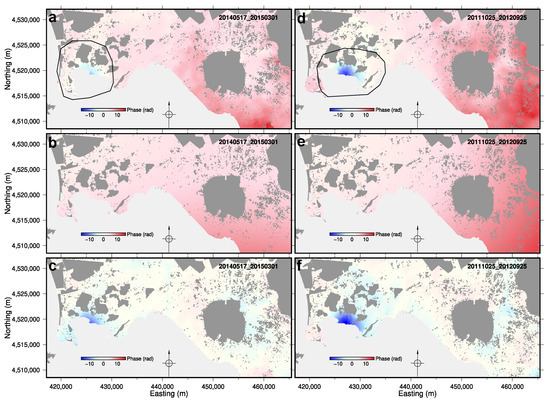
Figure 11.
Examples showing how a phase ramp (in this case, a quadratic surface) is fitted and then subtracted from an unwrapped interferogram. (a–c) Ascending-pass interferometric pair 17 May 2014 and 1 March 2015. (d–f) Descending-pass interferometric pair 25 October 2011 and 25 September 2012. (a,d) Unwrapped phase of the interferometric pair. The black polygons delineate the region of the largest ground deformation, which was masked out of all interferograms prior to fitting. (b,e) Best-fit quadratic surface grid. (c,f) Unwrapped phase after subtracting the best-fit quadratic surface from the grids in (a,d). UTM WGS84 33N coordinates.
An attempt was made to minimise the long-wavelength and elevation-dependent atmospheric errors present in each interferogram using the Generic Atmospheric Correction Online Service (GACOS) [26]. However, following a thorough evaluation, it was decided that this approach would not be employed due to its inability to substantially improve outcomes. This may be due to the low topographic heights in the regions covered by the pixels for which the displacement time series were generated.
2.2.3. Generation of the Ground Displacement Time Series (Step 7 of the Procedure)
In the final step of the procedure (step 7), the detrended, unwrapped phase grids were used to generate the LOS displacement maps for each epoch using the Small BAseline Subset (SBAS) approach [27]. Specifically, we used the parallel version of the code provided by GMTSAR. Despite the code’s capacity for atmospheric correction through common point staking [28], this method was not employed in this study due to its failure to significantly enhance the outcomes. Furthermore, no temporal smoothing was applied to the time series. Finally, the LOS displacements were downsampled from the original grid onto a new, regular grid with a resolution of 150 m × 150 m by computing the mean displacement of points situated within each non-empty block of the new grid.
As mentioned in Section 2.1, the cGPS displacements are referred to a local reference frame. Unfortunately, we could not apply the same procedure to the DInSAR series, as the study area does not include the RING stations that were used to define the local reference frame for the cGPS. We also decided not to use any of the cGPS stations in the Neapolitan volcanic area as reference points, as they could potentially be affected by deformation phenomena associated with Campi Flegrei or Vesuvio. After conducting some tests, we opted to refer the DInSAR displacements to a circular region with a radius of 150 m centred on Brusciano (WGS84/UTM33N coordinates 451,400 m E and 4,530,400 m N; see the yellow square and label in Figure 1). Comparing DInSAR and cGPS velocities shows that Brusciano remains almost fixed in the local reference frame used for the cGPS displacements (see Section 3).
3. Results
The DInSAR LOS ground displacement time series were generated using 28 images from ascending satellite passes and 29 images from descending satellite passes. These time series are provided in Supplementary Data Files S1–S4.
In accordance with standard practice, a comparison was made between the DInSAR and cGPS ground displacements to validate the time series. To accomplish this objective, the mean DInSAR LOS displacement of grid points within 150-metre-radius circular regions centred on each cGPS station was computed. The daily cGPS ground displacements were projected along each SAR LOS direction by combining the three displacement components— from south to north, from west to east and upwards—using the following equation (e.g., [29]):
where represents the cGPS displacement along the SAR LOS direction, while and represent the angle of incidence and the azimuth of the LOS, respectively.
Figure 12a–s and Figure 13a–s compare the DInSAR RADARSAT-2 LOS displacements with the projected cGPS ones (Equation (1)). The LOS displacements are shown before and after subtracting a linear and a quadratic surface from each unwrapped interferogram. The improvement obtained by subtracting the best-fit quadratic surface is evident.
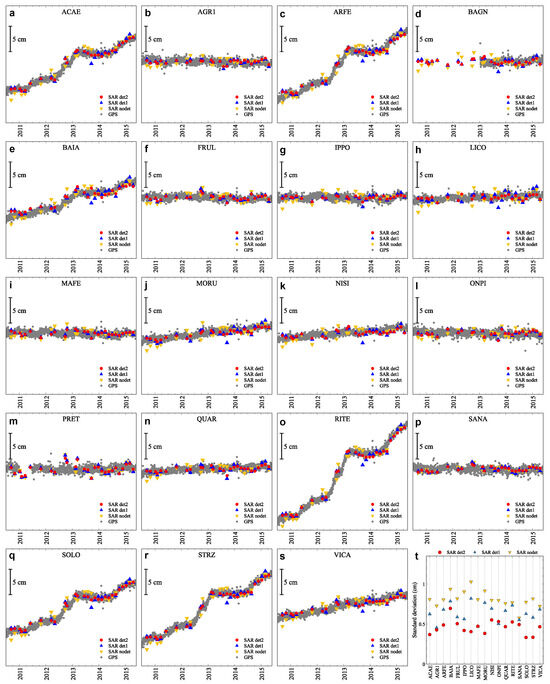
Figure 12.
Comparison between the DInSAR RADARSAT-2 LOS displacements, ascending pass, and the projected cGPS ones. (a–s) Same cGPS stations as in Figure 1, arranged in alphabetical order. Black vertical labelled bar, scale of the y-axis; dark-yellow down triangles (SAR nodet), DInSAR LOS displacements obtained without subtracting any phase ramp from the unwrapped interferograms; blue up triangles (SAR det1), DInSAR LOS displacements obtained after subtracting the best-fit linear phase ramp from each unwrapped interferogram; red dots (SAR det2), DInSAR LOS displacements obtained after subtracting the best-fit quadratic surface from each unwrapped interferogram; grey dots (cGPS), daily cGPS displacements projected along the ascending-pass LOS (Equation (1)). (t) Standard deviations of the differences between the DInSAR LOS displacements and the projected cGPS displacements, same symbols as in (a–s). The cGPS stations BAGN and PRET have been excluded due to the absence of data during a part of the investigated period (see plots (d,m)).
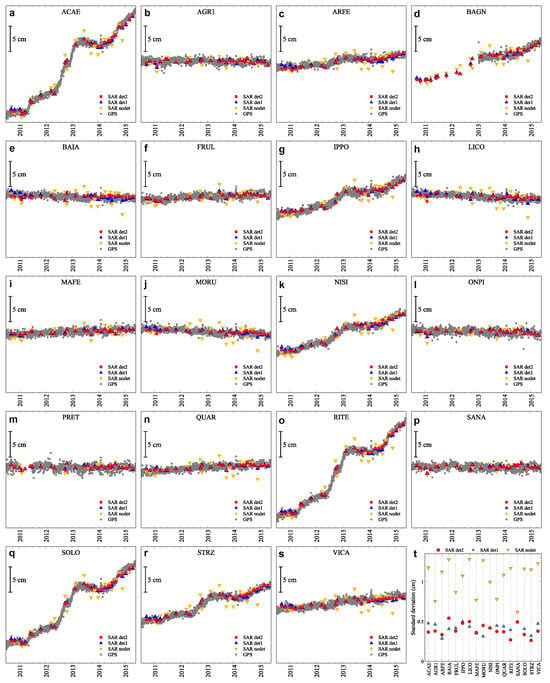
Figure 13.
Comparison between the DInSAR RADARSAT-2 LOS displacements, descending pass, and the projected cGPS ones. (a–s) Same cGPS stations as in Figure 1, arranged in alphabetical order. Black vertical labelled bar, scale of the y-axis; dark-yellow down triangles (SAR nodet), DInSAR LOS displacements obtained without subtracting any phase ramp from the unwrapped interferograms; blue up triangles (SAR det1), DInSAR LOS displacements obtained after subtracting the best-fit linear phase ramp from each unwrapped interferogram; red dots (SAR det2), DInSAR LOS displacements obtained after subtracting the best-fit quadratic surface from each unwrapped interferogram; grey dots (cGPS), daily cGPS displacements projected along the ascending-pass LOS (Equation (1)). (t) Standard deviations of the differences between the DInSAR LOS displacements and the projected cGPS displacements, same symbols as in (a–s). The cGPS stations BAGN and PRET have been excluded due to the absence of data during a part of the investigated period (see plots (d,m)).
This improvement is confirmed by the standard deviation of the differences between the DInSAR LOS displacements and the projected cGPS displacements, filtered using a central moving median window with a length of 21 days, for each cGPS station (see Figure 12t and Figure 13t). When the best-fit quadratic surface is subtracted, the mean standard deviation across all cGPS stations is found to be 0.46 cm for the ascending-pass time series and 0.39 cm for the descending-pass time series. The mean difference between the DInSAR and cGPS velocities is −0.03 cm yr−1 and +0.03 cm yr−1, respectively. The related standard deviations are 0.15 cm yr−1 and 0.11 cm yr−1, respectively. Thus, as a first approximation, an uncertainty of 0.86 cm at the two-standard-deviation level (hereinafter referred to as 2 ) can be attributed to DInSAR displacements and an uncertainty of 0.26 cm yr−1 at the two-standard-deviation level (hereinafter referred to as 2 ) can be attributed to DInSAR velocities.
In addition to comparing DInSAR and cGPS displacements, Figure 12 and Figure 13 also show the evolution of ground displacements in the Vesuvio and Campi Flegrei areas over time. Displacements at the cGPS stations in the Vesuvio area (AGR1, ONPI, PRET and SANA, see Figure 1) are minimal. To ascertain the extent of this feature throughout the area, mean ground displacement velocities were calculated for each pixel using the ascending-pass and descending-pass DInSAR time series. As Figure 14a,b show, there is no evidence of deformation activity within the 2 uncertainty level of DInSAR velocities.
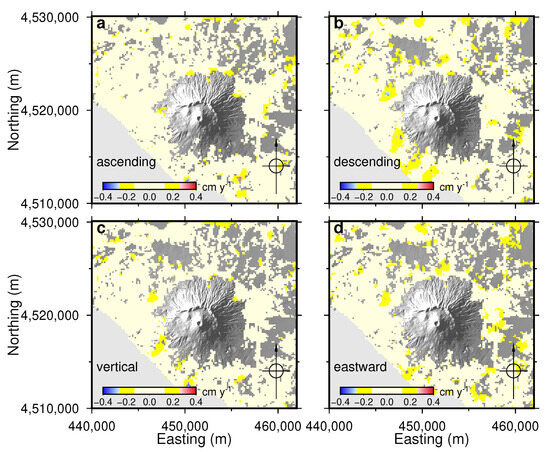
Figure 14.
Mean 2010–2015 DInSAR ground velocities for each pixel of the Vesuvio area. (a) Ascending-pass LOS direction. (b) Descending-pass LOS direction. (c) Vertical direction (Equation (2)). (d) Eastward direction (Equation (3)). Light yellow pixels have velocities with magnitude smaller than (0.13 cm yr−1). Yellow pixels have velocities whose magnitude lies between and 2 . UTM WGS84 33N coordinates.
To make the velocity fields easier to interpret, we calculated the approximate vertical () and eastward () displacements using the following equations [30]:
These relationships would be exact if the satellite orbits were polar. The mean vertical and eastward velocities for each pixel of the Vesuvio area are shown in Figure 14c,d.
In contrast to Vesuvio, displacements at cGPS stations within the Campi Flegrei area exhibit significant temporal variability (Figure 12 and Figure 13). Figure 15 shows the mean velocities at Campi Flegrei. The mean upward velocity reaches a maximum of approximately 5 cm y−1, while the mean eastward velocity reaches 2.4 cm y−1.
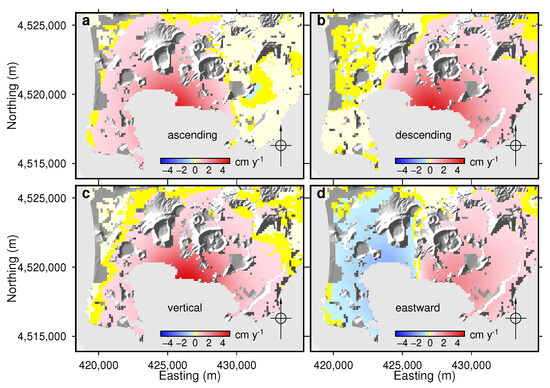
Figure 15.
Mean 2010–2015 DInSAR ground velocities for each pixel of the Campi Flegrei area. (a) Ascending-pass LOS direction. (b) Descending-pass LOS direction. (c) Vertical direction. (d) Eastward direction. Light yellow pixels have velocities with magnitude smaller than (0.13 cm yr−1). Yellow pixels have velocities whose magnitude lies between and 2 . UTM WGS84 33N coordinates.
Clearly, mean velocities are inadequate for fully characterising ground deformation in the Campi Flegrei area given that the displacement rate varies over time. However, closer examination reveals a striking similarity between all the time series, suggesting that the shape of the deformation field remains constant. If the shape of a deformation field remains constant over time, then the magnitude of any displacement component (ascending-pass LOS, descending-pass LOS, vertical or eastward) at a given point will be proportional to the same time function. The proportionality factor depends on both the displacement component and the point. Thus,
where is the component d of the displacement at grid point at the epoch k, represents the constant shape of the d-component field, and is its temporal evolution. can be the time history of any displacement component of any pixel, and is equal to one for the selected displacement component and pixel. Selecting a different displacement component or pixel to define results in the previous and simply being multiplied and divided by the same numerical factor, respectively.
To verify whether the shape of the deformation field at Campi Flegrei remains constant over time, we created scatter plots showing the correlation between the DInSAR LOS displacements at each pixel for each satellite pass (both ascending and descending) and the cGPS vertical displacement at the RITE station (Figure 1 and Figure 2). This cGPS displacement was selected as a candidate for , as it is often used to represent Campi Flegrei bradyseism (e.g., [18,31]). We filtered the RITE cGPS vertical displacement data using a central moving median window with a length of 21 days.
Figure 16 shows the slopes of the regression lines in the scatter plots for each pixel, as well as the standard deviations of the differences between the LOS displacements and the regression lines. The mean standard deviation is 0.4 cm for the ascending-pass time series (Figure 16b) and 0.3 cm for the descending-pass time series (Figure 16d). These values are similar to the standard deviations of the differences between the DInSAR and cGPS time series (Figure 12t and Figure 13t). The goodness-of-fit of the regression lines confirms that the shape of the ground displacement field between 2010 and 2015 remains constant within 2 . Therefore, Figure 16a,c show and , i.e., the constant shape of the ground displacement field for the ascending-pass and descending-pass LOSs between 2010 and 2015, respectively (see Equation (4)).
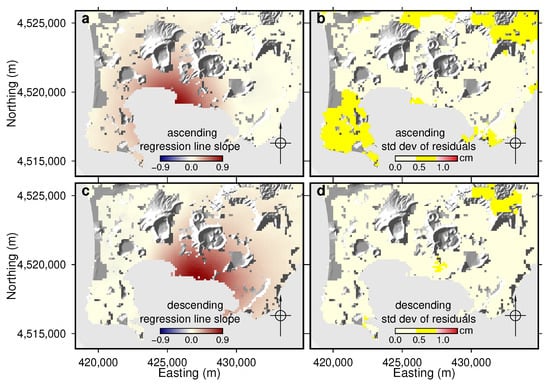
Figure 16.
Slopes and residuals of the linear regressions between the DInSAR LOS displacements and the RITE cGPS vertical displacements between 2010 and 2015. (a,c) Slopes for the ascending-pass and descending-pass LOSs, respectively. (b,d) Standard deviations of the differences between the LOS displacements and the regression lines (residuals). Light yellow pixels in (b,d) have residuals with an absolute value smaller than (0.43 cm); yellow pixels have residuals with an absolute value between and 2 . UTM WGS84 33N coordinates.
The contribution of the constant-shape displacement field to the “observed” ground displacement field (i.e., that obtained using the DInSAR time series) at each epoch can be calculated by multiplying the regression line slopes by the vertical cGPS vertical displacement of the RITE station at that epoch, as in Equation (4). Figure 17 plots the standard deviation of the difference between the two fields within the same region, as shown in Figure 16 for each epoch. These time histories support the conclusion that the shape of the ground deformation field remains constant within the 2 uncertainty level of DInSAR displacements.
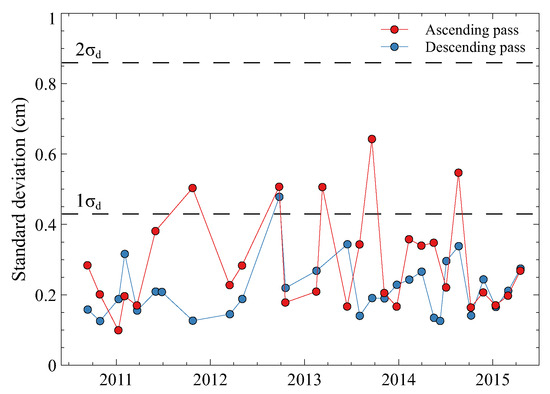
Figure 17.
Standard deviation of the difference between the DInSAR displacement field and the contribution of the constant shape component (Equation (4)) in the Campi Flegrei area, calculated for each epoch. Red dots, ascending-pass images. Blue dots, descending-pass images. Dashed black lines, one-standard-deviation (1 ) and two-standard-deviation (2 ) uncertainty levels.
4. Discussion and Conclusions
Time series of ground displacement were successfully generated for the entire Campi Flegrei and Vesuvio areas between 2010 and 2015 using RADARSAT-2 imagery. These series bridge the temporal gap between the conclusion of the time series derived from the analysis of ERS/ENVISAT SAR images and the commencement of those derived from the analysis of Sentinel-1 SAR images. We used a bespoke procedure based on SNAP and GMTSAR. This was necessary because the orbital information contained within the RADARSAT-2 products sometimes prevented the co-registration of images using GMTSAR—the tool that we had initially intended to use to produce the time series.
To ensure good spatial coverage and enable continuous unwrapping paths, we used a relatively low pixel-wise coherence level of 0.1 for phase unwrapping. We then meticulously inspected the unwrapped phase of each interferometric pair to identify any unwrapping errors. Of the initial 31 ascending and 32 descending HH images, 28 and 29 were used, respectively. The remaining images were discarded due to irreparable errors resulting from phase unwrapping in all the interferometric pairs that contained them.
After masking out a region of large ground deformation, linear and quadratic surfaces were fitted to the unwrapped phase distribution of each interferogram. The masked region differed for the ascending-pass and descending-pass interferometric pairs. The best-fit surfaces were then subtracted from the unwrapped phase distribution of the entire interferogram. These regions were drawn, albeit not optimised, following a comparison between DInSAR and cGPS displacements. Subtracting a linear or, even more effectively, a quadratic surface allowed for a significant improvement in the agreement between the DInSAR and cGPS displacement time series. This improvement also occurred inside the masked regions, where most of the cGPS stations are located. Finally, we could attribute an uncertainty of 0.86 cm at the two-standard-deviation level to our ground displacement time series and 0.26 cm yr−1 at the same level to velocities. These values are consistent with those typically obtained for displacement time series retrieved using the SBAS algorithm [30]. The mean difference between the DInSAR and cGPS velocities is −0.03 cm yr−1 and +0.03 cm yr−1 for the ascending and descending passes, respectively. This suggests that the reference point chosen for the DInSAR displacements (Brusciano, BR in Figure 1) can effectively be considered fixed relative to the local reference system used for the cGPS displacements [2]. This makes Brusciano a valuable reference point for analysing ground deformation across the entire Campi Flegrei and Vesuvio area.
Using the time series we have produced, we can draw some conclusions about any deformations that may have occurred in the Vesuvio or Campi Flegrei areas between 2010 and 2015. In the Vesuvio region, outside the masked low-coherence areas—the largest of which extends approximately 4 km from the summit of the volcano—the mean ground displacement velocities (ascending-pass LOS, descending-pass LOS, vertical and eastward) are smaller than the two-standard-deviation level of uncertainty. Consequently, there is no evidence of deformation activity between 2010 and 2015. This implies that the previously observed subsidence in a few spots in an area of discontinuous “girdle” around 10 km from the summit [32,33,34] has ceased. The rate of the spot subsidence was already observed to decrease over time during the period 1993–2010 by [35]. Furthermore, mean ground displacement velocities also suggest that the previous subsidence observed across the entire Vesuvio area [35] has ceased. This subsidence began in the early 2000s, when a change in the direction of the ground deformation (from subsidence to uplift) occurred at Campi Flegrei (see Figure 2). It was accompanied by westward and eastward displacement with in lobes to the east and west of Vesuvio, respectively, and was attributed to the deflation of a pressurised cavity several kilometres deep [35].
With regard to Campi Flegrei, the residuals from the linear regression between DInSAR LOS displacements at each pixel and cGPS vertical displacement at the RITE station are small. This suggests that the shape of the deformation field remained constant between 2010 and 2015, within the two-standard-deviation uncertainty level of DInSAR displacements. This result is consistent with previous findings for the period 1980–2010, which were obtained using levelling and EDM data, as well as ground displacement time series from ERS/ENVISAT images [36]. It is also consistent with findings for the period 2015–2022, which were obtained using ground displacement time series from Sentinel-1 images [13]. However, linear regression residuals are not homogeneous across the Campi Flegrei area, particularly for the ascending-pass LOS displacements (see Figure 16b). While this feature merits further investigation, it is beyond the scope of this study.
In the near future, an analysis of ground deformation across the entire area encompassing Campi Flegrei and Vesuvio from 1993 up to the present is planned. With regard to Campi Flegrei in particular, we will use linear regression models to verify whether the deformation field has remained unchanged, within the margin of error, from 1993 to the present day. We will also determine whether there were any differences in shape between the subsidence and uplift phases. For example, an Empirical Orthogonal Function analysis of ERS/ENVISAT and Sentinel-1 DInSAR time series revealed differences in the subsidence and uplift phases [13]. This suggests that an expansive source at a depth of approximately 8–9 km could potentially contribute to the deformation field during the uplift phase. We will also use linear regression models to highlight possible local deformation anomalies, such as that observed during the Campi Flegrei subsidence phase in the Solfata fumarolic field [36], near which the SOLO cGPS station is located. Another anomaly has been identified at the ACAE GPS station since 2019 [18]. If it is confirmed that the shape of the deformation field remains constant within the margin of error over periods of several years, it will be necessary to verify whether complex deformation sources (e.g., [37]) are required to justify this shape, or if the differences between it and the deformation field generated by “simple” pressurised sources (e.g., a sill) remain within the measurement errors. Another important point concerns the reason for the possible constant shape of the deformation field. Is it due to contraction during the subsidence phase and expansion during the uplift phase of a stationary source? Or is it due to the effects of geological structures, such as the ring faults of the caldera [38], or the caprock at a depth of approximately 2 km [39]?
As for Vesuvio, if the deformation that occurred after 2000 ended after a few years, then the temporal coincidence with the transition from subsidence to uplift at Campi Flegrei is either pure coincidence or indicates a possible link between the two volcanoes’ pumping systems. The deformation signal was small, with a velocity of a few millimetres per year [35]. However, even at such a small scale, these velocities that were higher than the approximately 2 mm/year should be considered with caution when interpreting DInSAR time series [40].
To achieve our goals, we must connect the displacement time series obtained from ERS/ENVISAT and Sentinel-1 SAR images to our RADARSAT-2 time series. Despite the brevity of the overlap periods, they are sufficient to enable this connection. Figure 18 shows three examples of long-term deformation at Campi Flegrei: vertical displacement at RITE, situated in the region of maximum uplift, and vertical and eastward displacements at ACAE, located in the area of maximum eastward displacement (see Figure 1 and Figure 15). The LOS directions for RADARSAT-2 and Sentinel-1 are very similar across Campi Flegrei, with incidence angles of around 35°. This would enable the LOS displacement time series to be connected. Conversely, the LOS directions for ERS/ENVISAT are quite different, with incidence angles of around 22.5°. We have therefore computed the approximate vertical and eastward displacements using Equations (2) and (3) in order to connect the three time series.
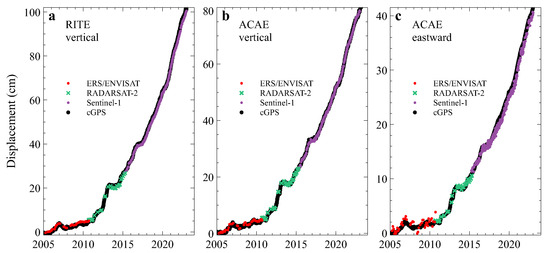
Figure 18.
Examples of long-term deformation, obtained by connecting the displacement time series from ERS/ENVISAT, RADARSAT-2, and Sentinel-1 imagery. Black dots, weekly cGPS data. Red dots, ERS/ENVISAT. Green crosses, RADARSAT-2. Violet dots, Sentinel-1. (a) Vertical displacement at the cGPS RITE station. (b) Vertical displacement at the cGPS ACAE station. (c) Eastward displacement at the cGPS ACAE station.
One final point: we have not explored the use of software such as Gamma (https://gamma-rs.ch/, accessed on 23 July 2025) or StaMPS (https://homepages.see.leeds.ac.uk/~earahoo/stamps/, accessed on 23 July 2025) to generate the displacement time series due to their commercial nature and/or their partial reliance on commercial software. In the future, we intend to use ISCE2 (https://github.com/isce-framework/isce2/, accessed on 23 July 2025), which is based entirely on free software.
Supplementary Materials
The following supporting information can be downloaded at: https://www.mdpi.com/article/10.3390/rs17193268/s1, Text S1: Supplementary material description; Figure S1: Percentage of pixels with a coherence between 0.1 and 0.2 for each interferometric pair against timespan and perpendicular baseline; Figure S2: Mean pixel coherence for each interferometric pair against timespan and perpendicular baseline; Data File S1: WGS84/UTM Zone 33 coordinates of the ascending-pass grid points; Data File S2: Ascending-pass LOS displacements on the points listed in Data File S1; Data File S3: WGS84/UTM Zone 33 coordinates of the descending-pass grid points; Data File S4: Descending-pass LOS displacements on the points listed in Data File S3. Data Files S2 and S4 are formatted as follows: The first row contains the coordinates of the reference point and additional information. The second row contains the modified Julian dates of the epochs. Each subsequent row provides the displacement (in centimetres) of the points whose coordinates are given in Data Files S1 and S3 at each epoch.
Author Contributions
Conceptualization, A.A. and L.C.; methodology, A.A. and L.C.; validation, A.A., G.S. and L.C.; investigation, A.A., G.S. and L.C.; data curation, A.A. and L.C.; writing—original draft preparation, A.A. and L.C.; writing—review and editing, A.A. and L.C.; visualization, A.A. and L.C.; supervision, A.A.; project administration, A.A. All authors have read and agreed to the published version of the manuscript.
Funding
This research received no external funding.
Data Availability Statement
The ground displacement time series presented in this study are included in the Supplementary Material. Further inquiries can be directed to the corresponding author. RADARSAT-2 images (RADARSAT-2 Data and Products @ MDA Geospatial Services Inc. (2023)—All Rights Reserved) are not available for sharing. RADARSAT is an official mark of the Canadian Space Agency.
Acknowledgments
We thank ESA for making the RADARSAT-2 SAR images available to us in the framework of project PP0094512, entitled “Campi Flegrei caldera evolution in between ERS/ENVISAT and Sentinel-1 missions”. We would like to express our sincere gratitude to Xiaohua Xu (University of Science and Technology of China) for his kind willingness to assist us in identifying the causes of the problems encountered during the co-registration of some of the RADARSAT-2 SAR images. We would also like to express our gratitude to IREA-CNR (Napoli, Italy) for providing us with the ERS/ENVISAT and Sentinel-1 displacement time series. We also thank the authors and maintainers of the open-source software used for this study, including SNAP (https://earth.esa.int/eogateway/tools/snap/, accessed on 23 July 2025), GDAL (https://gdal.org, accessed on 23 July 2025), GMTSAR (https://github.com/gmtsar/gmtsar, accessed on 23 July 2025), GMT (https://www.generic-mapping-tools.org/, accessed on 23 July 2025), Veusz (https://veusz.github.io/, accessed on 23 July 2025), LibreOffice (https://libreoffice.org, accessed on 23 July 2025), and Inkscape (https://inkscape.org/, accessed on 23 July 2025).
Conflicts of Interest
The authors declare no conflicts of interest.
Abbreviations
The following abbreviations are used in this manuscript:
| SAR | synthetic aperture radar |
| SBAS | Small BAseline Subset |
| DInSAR | Differential synthetic aperture radar interferometry |
| LOS | line of sight |
| DEM | digital elevation model |
| cGPS | continuous Global Positioning System |
| GNSS | Global Navigation Satellite System |
| NeVoCGPS | Neapolitan Volcanoes Continuous GPS network |
| ESA | European Space Agency |
| GPT | Graph Processing Tool |
References
- INGV. TINITALY, 10 m-Cell Size Grid. 2022. Available online: https://tinitaly.pi.ingv.it/ (accessed on 22 May 2025).
- De Martino, P.; Dolce, M.; Brandi, G.; Scarpato, G.; Tammaro, U. The Ground Deformation History of the Neapolitan Volcanic Area (Campi Flegrei Caldera, Somma–Vesuvius Volcano, and Ischia Island) from 20 Years of Continuous GPS Observations (2000–2019). Remote Sens. 2021, 13, 2725. [Google Scholar] [CrossRef]
- Woo, J.Y.L.; Kilburn, C.R.J. Intrusion and deformation at Campi Flegrei, southern Italy: Sills, dikes, and regional extension. J. Geophys. Res. 2010, 115, B12210. [Google Scholar] [CrossRef]
- Guidoboni, E.; Ciuccarelli, C. The Campi Flegrei caldera: Historical revision and new data on seismic crises, bradyseisms, the Monte Nuovo eruption and ensuing earthquakes (twelfth century 1582 AD). Bull. Volcanol. 2011, 73, 655–677. [Google Scholar] [CrossRef]
- Di Vito, M.A.; Acocella, V.; Aiello, G.; Barra, D.; Battaglia, M.; Carandente, A.; Del Gaudio, C.; de Vita, S.; Ricciardi, G.P.; Ricco, C.; et al. Magma transfer at Campi Flegrei caldera (Italy) before the 1538 AD eruption. Sci. Rep. 2016, 6, 32245. [Google Scholar] [CrossRef] [PubMed]
- Amoruso, A.; Crescentini, L.; D’Antonio, M.; Acocella, V. Thermally-assisted magma emplacement explains restless calderas. Sci. Rep. 2017, 7, 7948. [Google Scholar] [CrossRef]
- Del Gaudio, C.; Aquino, I.; Ricciardi, G.; Ricco, C.; Scandone, R. Unrest episodes at Campi Flegrei: A reconstruction of vertical ground movements during 1905–2009. J. Volcanol. Geotherm. Res. 2010, 185, 48–56. [Google Scholar] [CrossRef]
- Amoruso, A.; Gualandi, A.; Crescentini, L. On the Initial Phase of the Ongoing Unrest at Campi Flegrei and Its Relation with Subsidence at Vesuvio (Italy). Remote Sens. 2024, 16, 1717. [Google Scholar] [CrossRef]
- Sezione di Napoli OSSERVATORIO VESUVIANO. Bollettino di Sorveglianza-CAMPI FLEGREI-APRILE 2025. 2025. Available online: https://www.ov.ingv.it/index.php/monitoraggio-e-infrastrutture/bollettini-tutti/mensili-dei-vulcani-della-campania/flegrei/ (accessed on 22 May 2025).
- Cioni, R.; Bertagnini, A.; Santacroce, R.; Andronico, D. Explosive activity and eruption scenarios at Somma-Vesuvius (Italy): Towards a new classification scheme. J. Volcanol. Geotherm. Res. 2008, 178, 331–346. [Google Scholar] [CrossRef]
- Pappalardo, L.; Buono, G. Insights into Processes and Timescales of Magma Storage and Ascent From Textural and Geochemical Investigations: Case Studies from High-Risk Neapolitan Volcanoes (Italy). In Crustal Magmatic System Evolution: Anatomy, Architecture, and Physico-Chemical Processes; Masotta, M., Beier, C., Mollo, S., Eds.; John Wiley and Sons: New York, NY, USA, 2021. [Google Scholar] [CrossRef]
- ESA. Mission Programmes. 2025. Available online: https://earth.esa.int/eogateway/missions/ (accessed on 22 May 2025).
- Amoruso, A.; Crescentini, L. Clues of Ongoing Deep Magma Inflation at Campi Flegrei Caldera (Italy) from Empirical Orthogonal Function Analysis of SAR Data. Remote Sens. 2022, 14, 5698. [Google Scholar] [CrossRef]
- ESA. SNAP. 2025. Available online: https://earth.esa.int/eogateway/tools/snap/ (accessed on 22 May 2025).
- Sandwell, D.; Xu, X.; Mellors, R.; Tong, X.; Wei, M. GMTSAR-An InSAR Processing System Based on GMT. 2025. Available online: https://github.com/gmtsar/gmtsar (accessed on 22 May 2025).
- Wessel, P.; Luis, J.F.; Uieda, L.; Scharroo, R.; Wobbe, F.; Smith, W.H.F.; Tian, D. The Generic Mapping Tools Version 6. Geochem. Geophys. Geosyst. 2019, 20, 5556–5564. [Google Scholar] [CrossRef]
- Zhang, Y.; Liu, Y.; Jin, M.; Jing, Y.; Liu, Y.; Liu, Y.; Sun, W.; Wei, J.; Chen, Y. Monitoring Land Subsidence in Wuhan City (China) using the SBAS-InSAR Method with Radarsat-2 Imagery Data. Sensors 2019, 19, 743. [Google Scholar] [CrossRef]
- Giudicepietro, F.; Casu, F.; Bonano, M.; De Luca, C.; De Martino, P.; Di Traglia, F.; Di Vito, M.; Macedonio, G.; Manunta, M.; Monterroso, F.; et al. First evidence of a geodetic anomaly in the Campi Flegrei caldera (Italy) ground deformation pattern revealed by DInSAR and GNSS measurements during the 2021–2023 escalating unrest phase. Int. J. Appl. Earth Obs. Geoinf. 2024, 132, 104060. [Google Scholar] [CrossRef]
- Shuttle Radar Topography Mission (SRTM). Available online: https://www.earthdata.nasa.gov/data/instruments/srtm (accessed on 8 July 2025).
- Goldstein, R.M.; Werner, C.L. Radar Interferogram Phase Filtering for Geophysical Applications. Geophys. Res. Lett. 1998, 25, 4035–4038. [Google Scholar] [CrossRef]
- Chen, C.W.; Zebker, H.A. Phase unwrapping for large SAR interferograms: Statistical segmentation and generalized network models. IEEE Trans. Geosci. Remote Sens. 2002, 40, 1709–1719. Available online: https://web.stanford.edu/group/radar/softwareandlinks/sw/snaphu/ (accessed on 19 September 2025). [CrossRef]
- Shanker, A.P.; Zebker, H.A. Sparse Two-Dimensional Phase Unwrapping Using Regular Grid Methods. IEEE Geosci. Remote Sens. Lett. 2009, 6, 519–522. [Google Scholar] [CrossRef]
- GDAL/OGR Contributors. GDAL/OGR Geospatial Data Abstraction Software Library, 2025. Open Source Geospatial Foundation. Available online: https://gdal.org (accessed on 22 May 2025).
- Xu, X.; Sandwell, D.T. Toward Absolute Phase Change Recovery With InSAR: Correcting for Earth Tides and Phase Unwrapping Ambiguities. IEEE Trans. Geosci. Remote Sens. 2020, 58, 726–733. [Google Scholar] [CrossRef]
- Wang, T.; Jònsson, S. Phase-Ramp Reduction in Interseismic Interferograms From Pixel-Offsets. IEEE J. Sel. Top. Appl. Earth Obs. Remote Sens. 2014, 7, 1709–1718. [Google Scholar] [CrossRef]
- Yu, C.; Li, Z.; Penna, N.; Crippa, P. Generic atmospheric correction model for interferometric synthetic aperture radar observations. J. Geophys. Res. Solid Earth 2018, 123, 9202–9222. [Google Scholar] [CrossRef]
- Berardino, P.; Fornaro, G.; Lanari, R.; Sansosti, E. A new algorithm for surface deformation monitoring based on small baseline differential SAR interferograms. IEEE Trans. Geosci. Remote Sens. 2002, 40, 2375–2383. [Google Scholar] [CrossRef]
- Tymofyeyeva, E.; Fialko, Y. Mitigation of atmospheric phase delays in InSAR data, with application to the eastern California shear zone. J. Geophys. Res. Solid Earth 2015, 120, 5952–5963. [Google Scholar] [CrossRef]
- Fuhrmann, T.; Garthwaite, M.C. Resolving Three-Dimensional Surface Motion with InSAR: Constraints from Multi-Geometry Data Fusion. Remote Sens. 2019, 11, 241. [Google Scholar] [CrossRef]
- Pepe, A.; Calò, F. A review of interferometric Synthetic Aperture RADAR (InSAR) multi-track approaches for the retrieval of Earth’s surface displacements. Appl. Sci. 2017, 7, 1264. [Google Scholar] [CrossRef]
- Danesi, S.; Pino, N.A.; Carlino, S.; Kilburn, C.R.J. Evolution in unrest processes at Campi Flegrei caldera as inferred from local seismicity. Earth Planet. Sci. Lett. 2024, 626, 118530. [Google Scholar] [CrossRef]
- Lanari, R.; De Natale, G.; Berardino, P.; Sansosti, E.; Ricciardi, G.; Borgstrom, S.; Capuano, P.; Pingue, F.; Troise, C. Evidence for a peculiar style of ground deformation inferred at Vesuvius volcano. Geophys. Res. Lett. 2002, 29, 1292. [Google Scholar] [CrossRef]
- Borgia, A.; Tizzani, P.; Solaro, G.; Manzo, M.; Casu, F.; Luongo, G.; Pepe, A.; Berardino, P.; Fornaro, G.; Sansosti, E.; et al. Volcanic spreading of Vesuvius, a new paradigm for interpreting its volcanic activity. Geophys. Res. Lett. 2005, 32, L03303. [Google Scholar] [CrossRef]
- De Matteo, A.; Massa, B.; Castaldo, R.; D’Auria, L.; James, M.R.; Lane, S.J.; Pepe, S.; Tizzani, P. An integrated modeling approach for analyzing the deformation style of active volcanoes: Somma-Vesuvius case study. J. Geophys. Res. Solid Earth 2022, 127, e2021JB022338. [Google Scholar] [CrossRef]
- Amoruso, A.; Crescentini, L. DInSAR Data Reveal an Intriguing Contemporaneous Onset of Deep Deflation below Vesuvio and the Ongoing Campi Flegrei Uplift. Remote Sens. 2023, 15, 3038. [Google Scholar] [CrossRef]
- Amoruso, A.; Crescentini, L.; Sabbetta, I. Paired deformation sources of the Campi Flegrei caldera (Italy) required by recent (1980–2010) deformation history. J. Geophys. Res. Solid Earth 2014, 119, 858–879. [Google Scholar] [CrossRef]
- Tizzani, P.; Fernández, J.; Vitale, A.; Escayo, J.; Barone, A.; Castaldo, R.; Pepe, S.; De Novellis, V.; Solaro, G.; Pepe, A.; et al. 4D imaging of the volcano feeding system beneath the urban area of the Campi Flegrei caldera. Remote Sens. Environ. 2024, 315, 114480. [Google Scholar] [CrossRef]
- Beauducel, F.; De Natale, G.; Obrizzo, F.; Pingue, F. 3-D modelling of Campi Flegrei ground deformations: Role of Caldera boundary discontinuities. Pure Appl. Geophys. 2004, 161, 1329–1344. [Google Scholar] [CrossRef]
- Vanorio, T.; Kanitpanyacharoen, W. Rock physics of fibrous rocks akin to Roman concrete explains uplifts at Campi Flegrei Caldera. Science 2015, 349, 617–621. [Google Scholar] [CrossRef] [PubMed]
- Balz, T.; Ewais, M. Influence of Parameter Estimation Bounds on Velocity Estimation in PSInSAR. Remote Sens. 2025, 17, 788. [Google Scholar] [CrossRef]
Disclaimer/Publisher’s Note: The statements, opinions and data contained in all publications are solely those of the individual author(s) and contributor(s) and not of MDPI and/or the editor(s). MDPI and/or the editor(s) disclaim responsibility for any injury to people or property resulting from any ideas, methods, instructions or products referred to in the content. |
© 2025 by the authors. Licensee MDPI, Basel, Switzerland. This article is an open access article distributed under the terms and conditions of the Creative Commons Attribution (CC BY) license (https://creativecommons.org/licenses/by/4.0/).