1. Introduction
Estimating atmospheric precipitation remains a significant challenge in radar measurements, meteorology, and hydrology, given the dynamic nature of meteorological phenomena and the high temporal and spatial variability of meteorological structures [
1,
2]. However, various methods have been developed to estimate precipitation based on radar data, providing valuable information about ongoing precipitation events. A commonly used approach involves empirical relationships between radar reflectivity (Z) and rainfall intensity (R). The Marshall–Palmer relationship is widely regarded as a standard [
3,
4,
5,
6,
7] for radar reflectivity data measured at 1 km above ground level. However, applying a fixed Z–R relationship throughout the year, without accounting for seasonal variations or synoptic conditions, can introduce errors and often leads to the underestimation of precipitation values [
3,
8,
9,
10,
11].
Meteorological radars are widely employed across numerous countries for flood risk assessment, with radar-derived precipitation data playing an increasingly critical role in characterizing rainfall patterns. Within this framework, discrepancies in radar measurements are of particular importance and necessitate continued research aimed at refining and calibrating the associated estimation relationships [
7,
12,
13,
14,
15]. Nevertheless, the Z–R relationship remains a fundamental component of quantitative precipitation estimation and continues to be the subject of extensive investigation and methodological enhancement [
3,
4,
5,
6,
16]. Studies by other researchers have shown that the Z–R relationships results in the lowest root mean square error with respect to measurements from rain gauges [
17]. Radar reflectivity and precipitation intensity are also related through raindrop size distribution, as the coefficients of empirical relationships depend on the parameters of this distribution [
18].
The Polish meteorological radar network POLRAD was established in 2004. Within this network, the atmosphere is scanned using radars with a single-polarization electromagnetic wave. Between 2009 and 2024, the POLRAD network was systematically modernized and expanded by the Polish Institute of Meteorology and Water Management—National Research Institute (IMGW). The current radars emit an electromagnetic wave of dual polarization (horizontal and vertical), making it possible to determine the radar reflectivity of a hydrometeor in two planes. As a result of processing data obtained from these radars, extensive characterizations of atmospheric phenomena—including precipitation—can be obtained [
19,
20,
21,
22,
23,
24,
25,
26,
27].
In the hydrometeorological protection of the country, information on the location of precipitation zones, as well as the intensity, duration, and phase state of precipitation, makes it possible to determine actual atmospheric conditions and assess the degree of risk of the performed tasks [
28,
29]. The need for radar studies of atmospheric precipitation—including extreme precipitation totals—has been recognized by scientists from multiple European research centers, e.g., in Estonia and Italy [
11,
30,
31,
32,
33,
34]. On the other hand, Chinese research centers have conducted studies in which radar precipitation data were compared with direct precipitation measurements [
6,
17,
18,
19,
20]. Remote sensing data in cloud zones where precipitation occurs or conditions for precipitation are met is essential for developing accurate weather forecasts [
35,
36,
37,
38,
39,
40,
41,
42].
Estimations of radar precipitation data (precipitation intensity and totals over a selected period) are achieved based on empirically derived relationships between radar reflectivity and precipitation intensity [
8,
23,
43,
44,
45]. In the POLRAD system, the Marshall–Palmer relationship and radar reflectivity values determined at a height of 1 km above ground level are used as a standard [
46,
47]. The applied calculation algorithm does not account for the internal structure of the precipitation cloud or the type of precipitation [
9,
10,
48,
49,
50,
51,
52,
53,
54].
The motivation for this study arose from the lack of prior research on this topic in Poland, despite increasingly evident inaccuracies in precipitation estimates derived from the currently used radar products. This issue is particularly critical for hydrometeorological safety, especially in the wake of recent episodes of extreme rainfall and severe flooding in the region, such as those observed in Poland in September 2024. One of the key advantages of empirical Z–R relationships is their simplicity and suitability for operational use. These models are particularly valuable when radar reflectivity data are available at a high temporal resolution (e.g., every 5 min), enabling rapid data transmission and timely decision making [
55]. Moreover, following calibration and validation, such relationships can be adapted for use even with legacy radar systems lacking polarimetric capabilities, offering a cost-effective solution for many meteorological services. This approach also requires less hardware and computational power, thereby enhancing its accessibility to a wider range of users and regions. However, empirical approaches have inherent limitations, including an inability to differentiate between various types of hydrometeors (notably, this limitation was not applicable in the present study, as only rainfall occurred during the observation period). In contrast, modern techniques based on dual-polarization radar offer enhanced accuracy and support the identification of different precipitation types (e.g., rain, snow, and hail). Nevertheless, such methods often require complex computational algorithms, greater processing power, and longer processing times—factors that may limit their applicability in time-sensitive operational settings. For hydrometeorological monitoring, the timeliness and reliability of information are critical, particularly during extreme weather events. Therefore, the development, validation, and contextual parameterization of empirical relationships tailored to local synoptic conditions remain essential tools for rapid-response systems, civil protection services, and crisis management during periods of intense precipitation [
3,
6,
15,
16].
The selection of Z–R relationships in this study was guided by their specific characteristics and contextual relevance. From a synoptic perspective, considering the type and intensity of precipitation, as well as prevailing environmental conditions, the relationships analyzed—including Marshall–Palmer, Joss, and Muchnik—appear to be the most suitable. The Marshall–Palmer relationship was included due to its widespread use in operational meteorology and remote sensing. Its frequent application makes it a logical reference for comparing radar reflectivity at heights of both 1 km and 1.5 km [
3,
5,
16,
19]. The Muchnik relationship was selected based on precipitation type and geographic relevance. Originally developed for the Kyiv region in Ukraine, it was specifically designed for showers and steady rainfall, closely matching the precipitation regime observed during the study period. Given Kyiv’s location (approximately 500 km from the study area), it is reasonable to assume that the regional climatic conditions are comparable, further justifying its inclusion. The Joss relationship was chosen due to its suitability for convective precipitation, which predominated during the study period. Developed for the Locarno Monti region in Switzerland, it is well-adapted to temperate European climates, including the study area. Its inclusion also enabled an evaluation of its transferability and performance in a geographically proximate yet climatically distinct setting [
55].
The rain gauges used in this study are representative of radar-covered areas due to their uniform spatial distribution across the study region. Additionally, the rain gauges are operated by IMGW, ensuring high data reliability through rigorous quality control protocols. All instruments are professionally installed in accordance with national and international standards and are regularly calibrated, ensuring the accuracy and consistency of precipitation measurements. The gauges provide a high temporal resolution, recording precipitation at one-minute intervals. This enables the collection of detailed, time-resolved rainfall data. The observation period for both rain gauge and radar measurements was fully synchronized, covering a six-hour window from 06:00 to 12:00 UTC on 23 August 2021. This temporal alignment between datasets allowed for a reliable and direct comparison of radar-derived and ground-based precipitation estimates.
In previous studies [
56], rainfall intensities were determined from radar reflectivity values using empirical relationships, including Marshall–Palmer, Muchnik, and Joss, which are dedicated to different types of precipitation. However, to account for cloud structure, radar reflectivity values determined for heights of 1 km, 1.5 km, and 2 km above ground level were taken into consideration in the calculations. The results of preliminary studies indicate that the selection of a suitable computational algorithm leads to an improvement in the reliability of the radar precipitation data obtained [
56]. Our analysis demonstrated that, regardless of the empirical relationship used, the rainfall intensity values determined at a height of 1.5 km were the highest. In the study area, the radar reflectivity value at a height of 1.5 km was 55.75 dBZ, and this value was higher than that obtained at a height of 1 km (5.41 dBZ) and 2 km (0.25 dBZ). The intensity of rainfall was 66.41 mm·h
−1 at a height of 1 km, 98.92 mm·h
−1 at a height of 1.5 km, and 95.55 mm·h
−1 at a height of 2 km. Among the relationships studied, the highest rainfall intensity values were determined using the Marshall–Palmer relationship, while the lowest values were determined using the Joss relationship. Differences in the determined rainfall intensity were 19.93 mm·h
−1 for data at a height of 1 km, 16.79 mm·h
−1 for data at a height of 1.5 km, and 16.67 mm·h
−1 for data at a height of 2 km. These results demonstrate that the values obtained at a height of 1.5 km exhibited a greater consistency and convergence with reference rain gauge measurements than those obtained at 1 km, regardless of the relationship applied [
56].
In other articles, authors have shown that local factors also have an impact on the accuracy of measurements. Studies have also been conducted on the verification of precipitation data using a rain gauge network [
8,
9,
10,
11,
19]. Studies conducted on the basis of data from short time periods (up to 24 h) are the most interesting and representative. Uncertainties are limited in these cases, as the spatial correlation of these events is much lower [
26]. Therefore, our 6 h rainfall totals are reliable and representative. Scientists have emphasized the need for research comparing radar data with rain gauge network data, noting that radar measurements tend to underestimate precipitation. This is caused by processes that occur during precipitation; therefore, research in this area is justified [
8,
9,
10,
11]. The results presented indicate that it is important to conduct research on radar reflectivity and precipitation intensity using empirical relationships, as this can reduce the occurrence of errors in radar measurements [
9,
16]. In the next phase of the study, the total precipitation values for six hours were determined. Calculations were performed using the three selected relationships (i.e., Marshall–Palmer, Muchnik, and Joss) and radar data from 1 km and 1.5 km above ground level. The radar precipitation data obtained were analyzed for comparison with direct measurements from rain gauges at meteorological stations.
We aimed to conduct a comparative analysis of the precipitation totals derived from the selected empirical relationships and to evaluate precipitation estimates based on radar reflectivity at heights of 1 km and 1.5 km above ground level. This approach enabled an assessment of both the accuracy of the operationally applied relationship and the impact of measurement height on precipitation estimates. The methodology involved the analysis of radar-derived precipitation data validated against rain gauge measurements. To this end, we developed and applied rainfall accumulation maps and statistical analyses. The results identified the empirical relationship that yielded the precipitation totals most consistent with the rain gauge observations. Furthermore, the findings demonstrated that estimates based on radar reflectivity at 1.5 km above ground level were more accurate than those derived from the operationally used level of 1 km. These results have practical implications and may support more accurate precipitation assessments in operational meteorology.
3. Results
3.1. Comparative Analysis of Direct Rainfall Measurements with Radar Data Obtained 1 km Above Ground Level
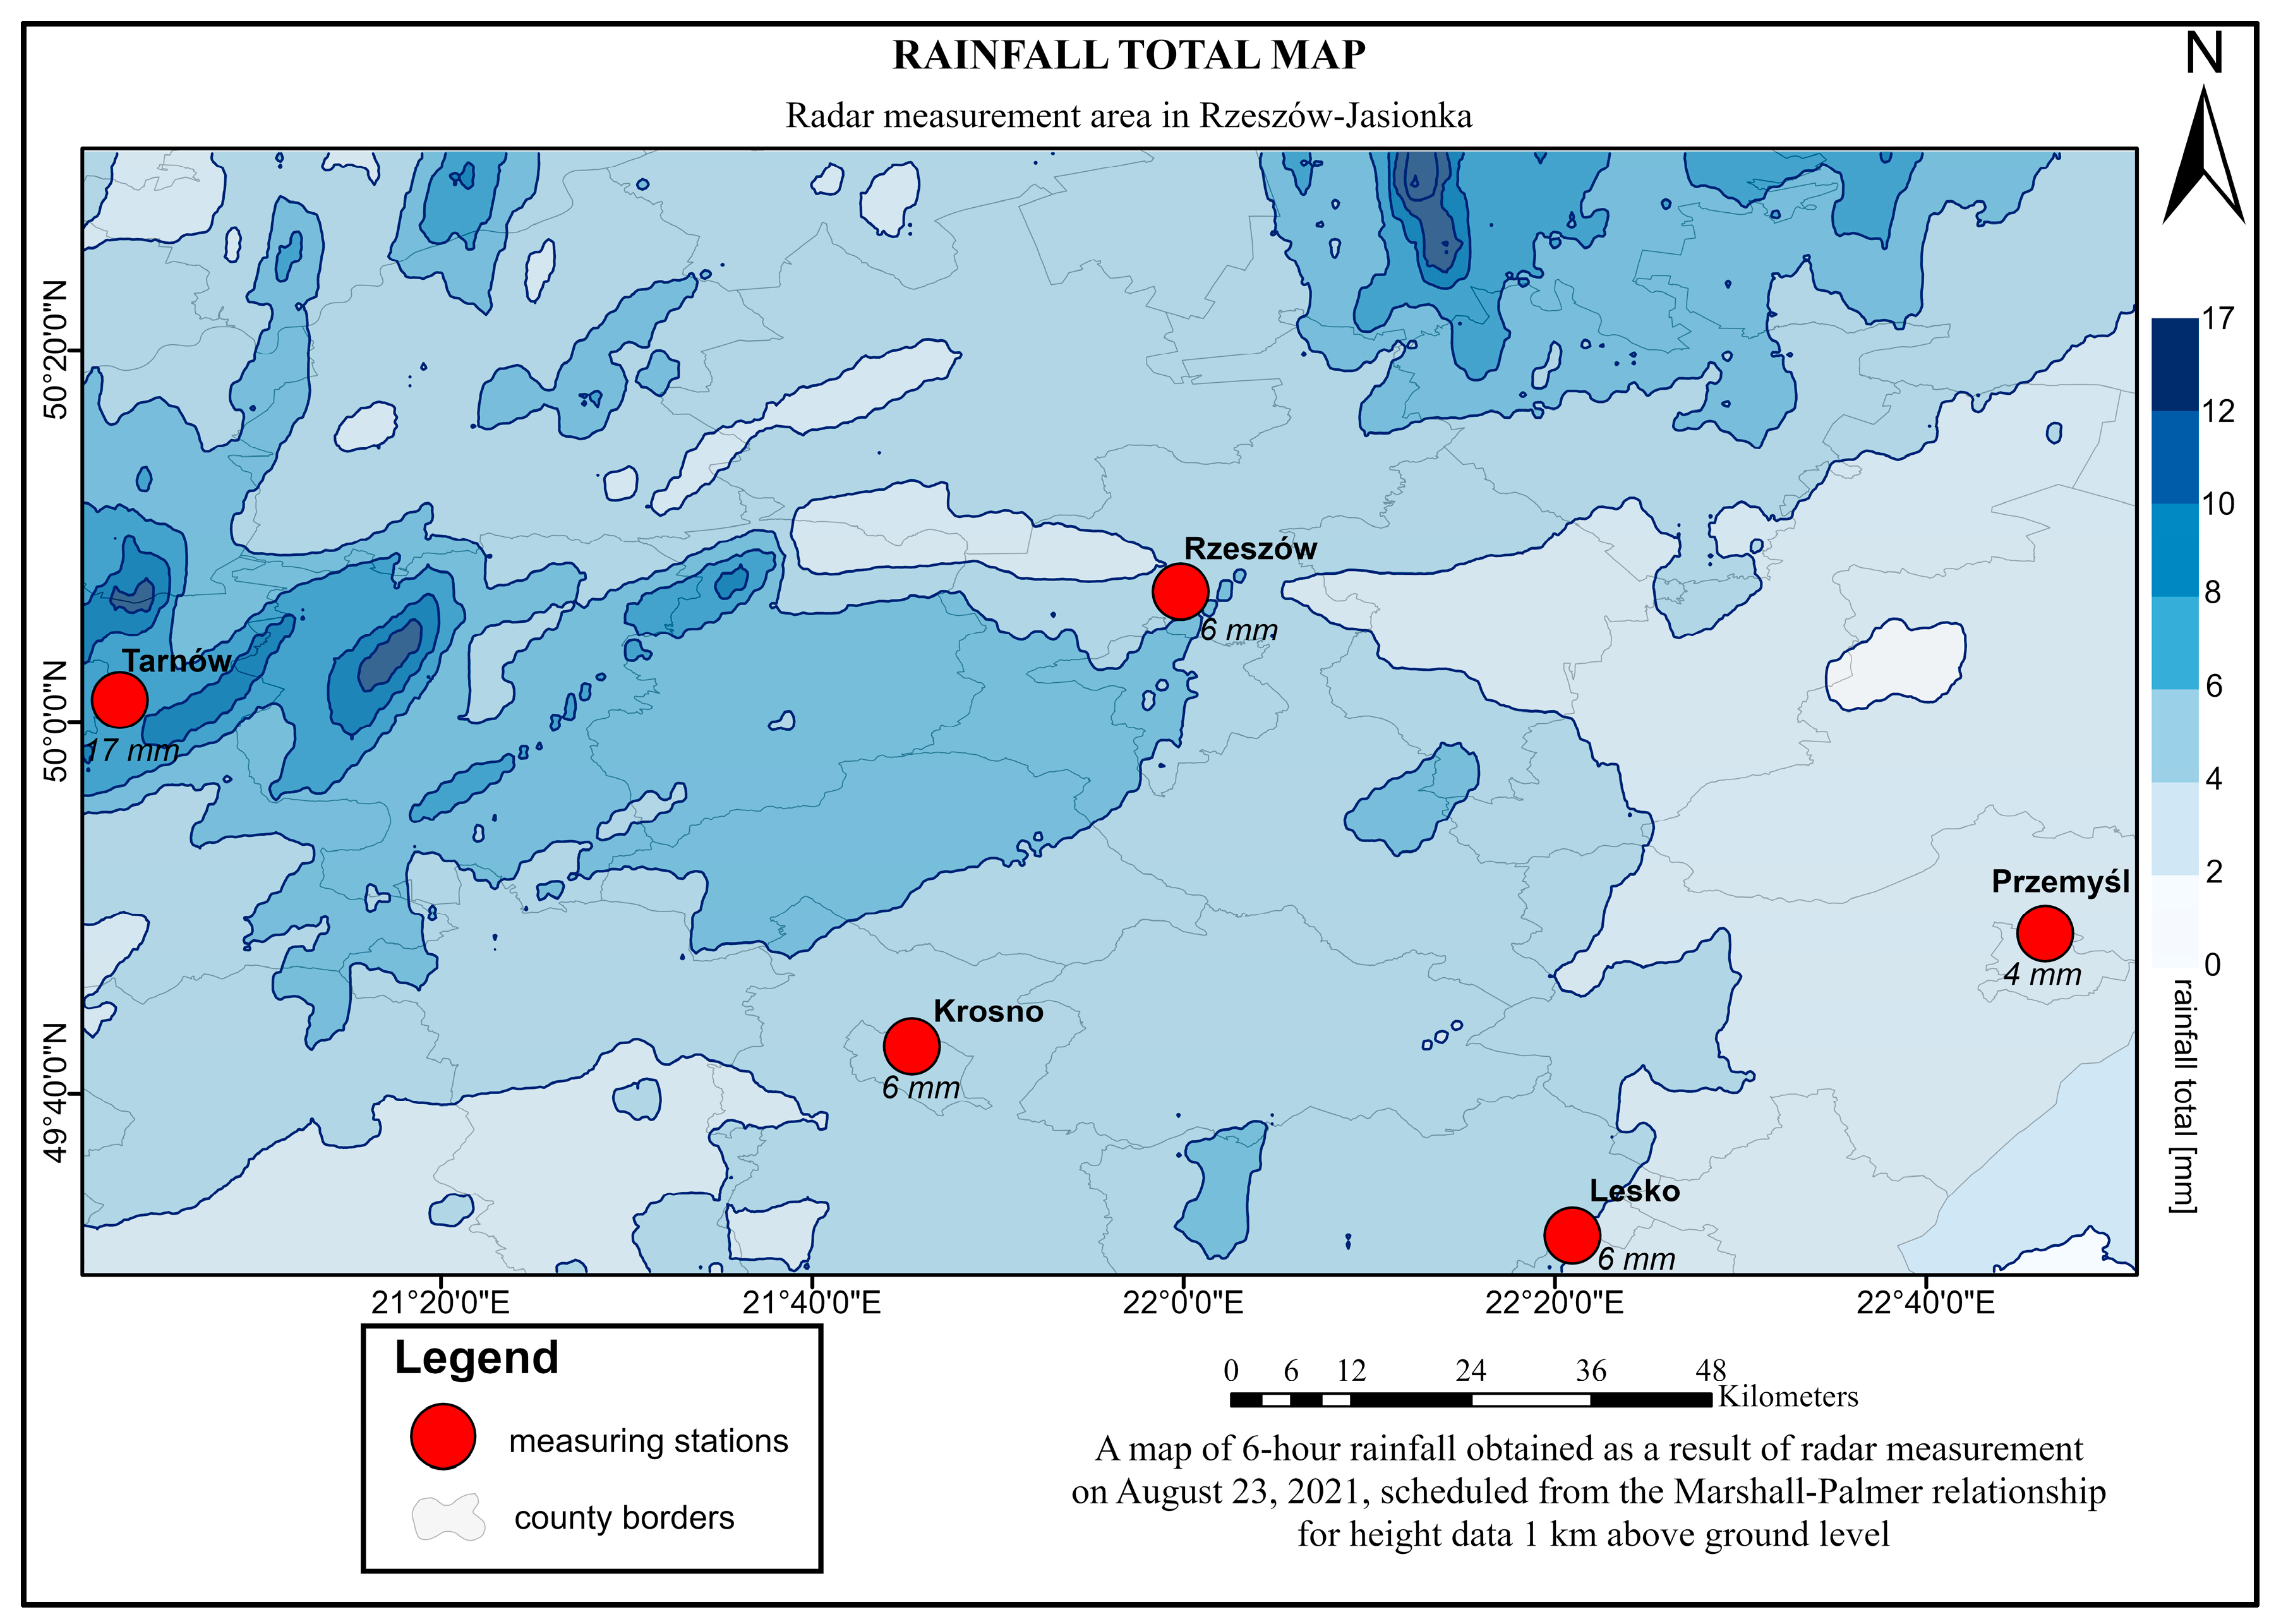
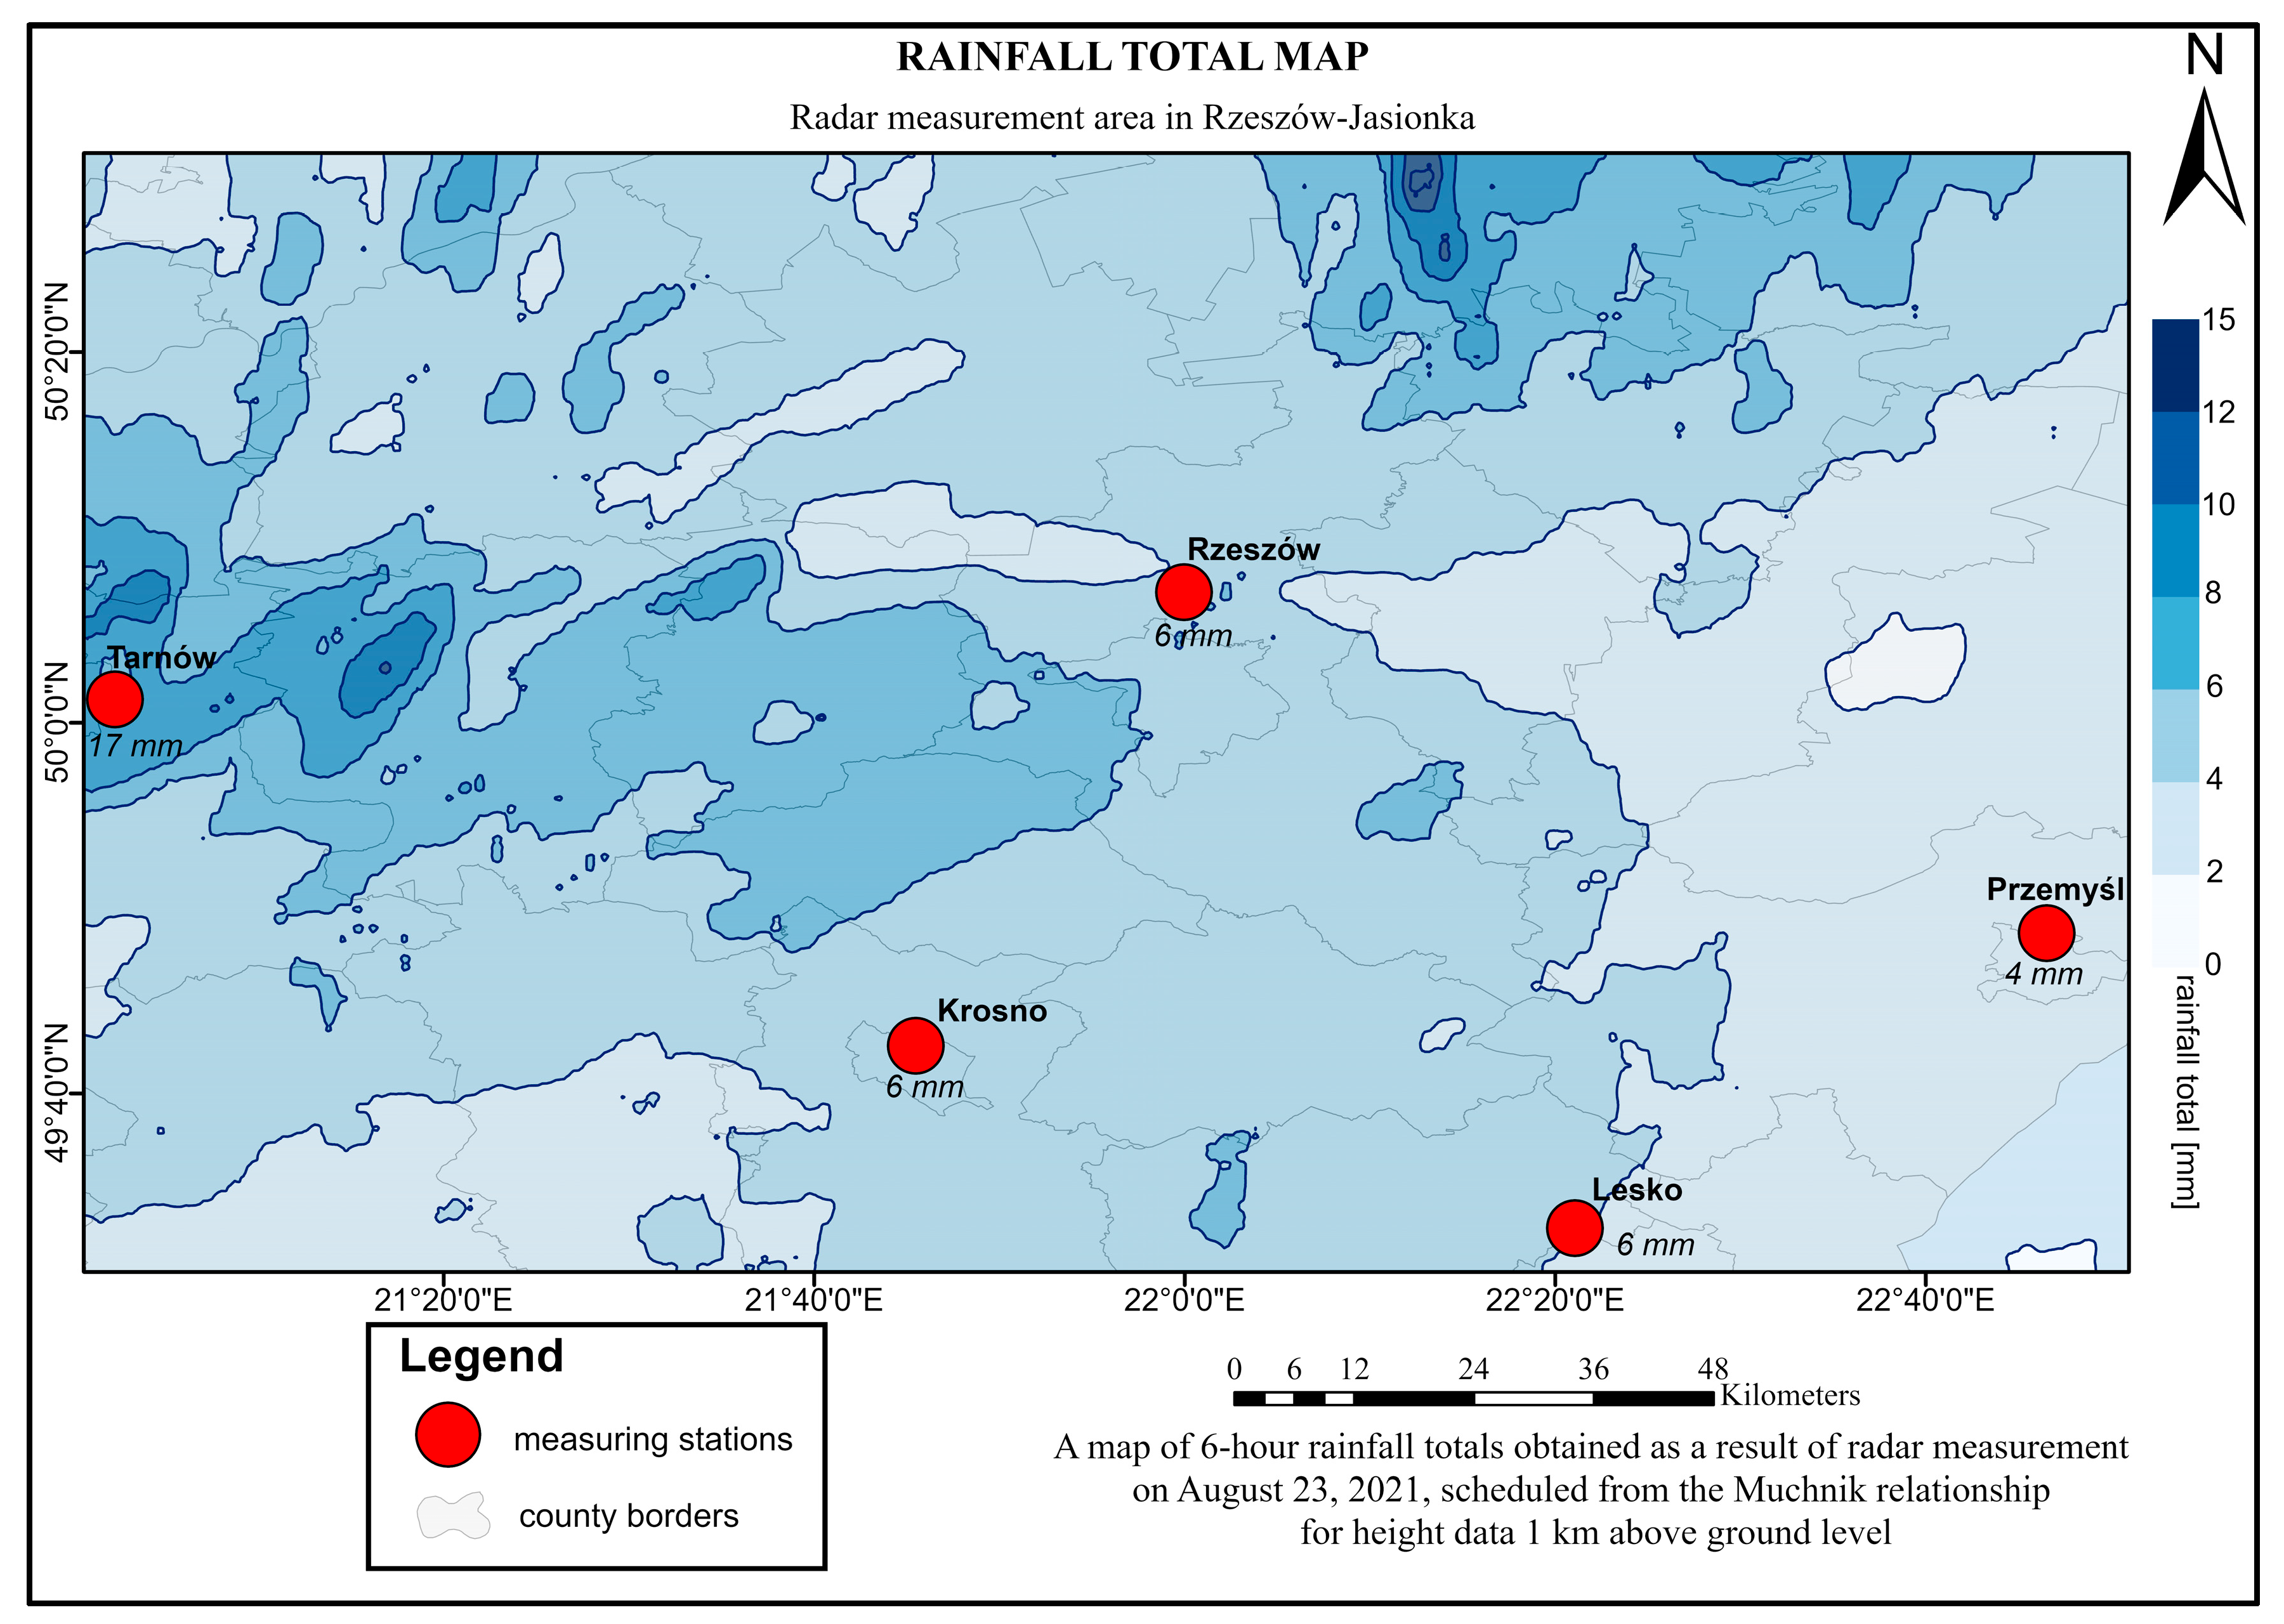
Precipitation maps were generated based on the radar precipitation data using the ArcGIS 3.4 software. This data included precipitation values over 6 h determined from radar reflectivity values at a height of 1 km above ground level using the Marshall–Palmer, Joss, and Muchnik relationships (
Figure 6,
Figure 7 and
Figure 8).
The total precipitation over six hours (on 23 August 2021, 06:00–12:00 UTC) measured at the Tarnów station was 17 mm. In the precipitation maps developed based on the Joss and Muchnik relationships, the Tarnów station area is located between isohyets with values of 8 mm and 10 mm (
Figure 7 and
Figure 8). In the map based on the Marshall–Palmer relationship, the Tarnów station area is located between isohyets of 10 mm and 12 mm (
Figure 6).
The total precipitation measured at the stations in Rzeszów, Krosno, and Lesko was 6 mm. In the precipitation maps, the 6 mm isohyet runs through the areas of the measurement stations (
Figure 6,
Figure 7 and
Figure 8). The total precipitation measured at the station in Przemyśl was 4 mm. In the precipitation maps, the area of the measurement station is located between isohyets of 2 mm and 4 mm (
Figure 6,
Figure 7 and
Figure 8).
The analysis of the precipitation maps shows the differences between the precipitation totals determined from the Marshall–Palmer relationship for radar reflectivity at a height of 1 km, and the results of direct measurements average 2.32 mm (
Table 2).
Table 2 summarizes the results of the direct precipitation measurements and radar precipitation data determined on the basis of the Joss, Marshall–Palmer, and Muchnik relationships for the measurement station regions in Tarnów, Rzeszów, Przemyśl, Lesko, and Krosno. The values of radar precipitation data for the measurement station regions were determined as the average value for 25 points located around them.
The precipitation data analysis shows that for precipitation amounts of a few millimeters, the differences between them and the results of direct measurements are minimal, ranging from 1 to 2 mm. In contrast, the differences are significant for precipitation of several millimeters.
3.2. Comparative Analysis of Direct Rainfall Measurements with Radar Data Obtained from 1.5 km Above Ground Level
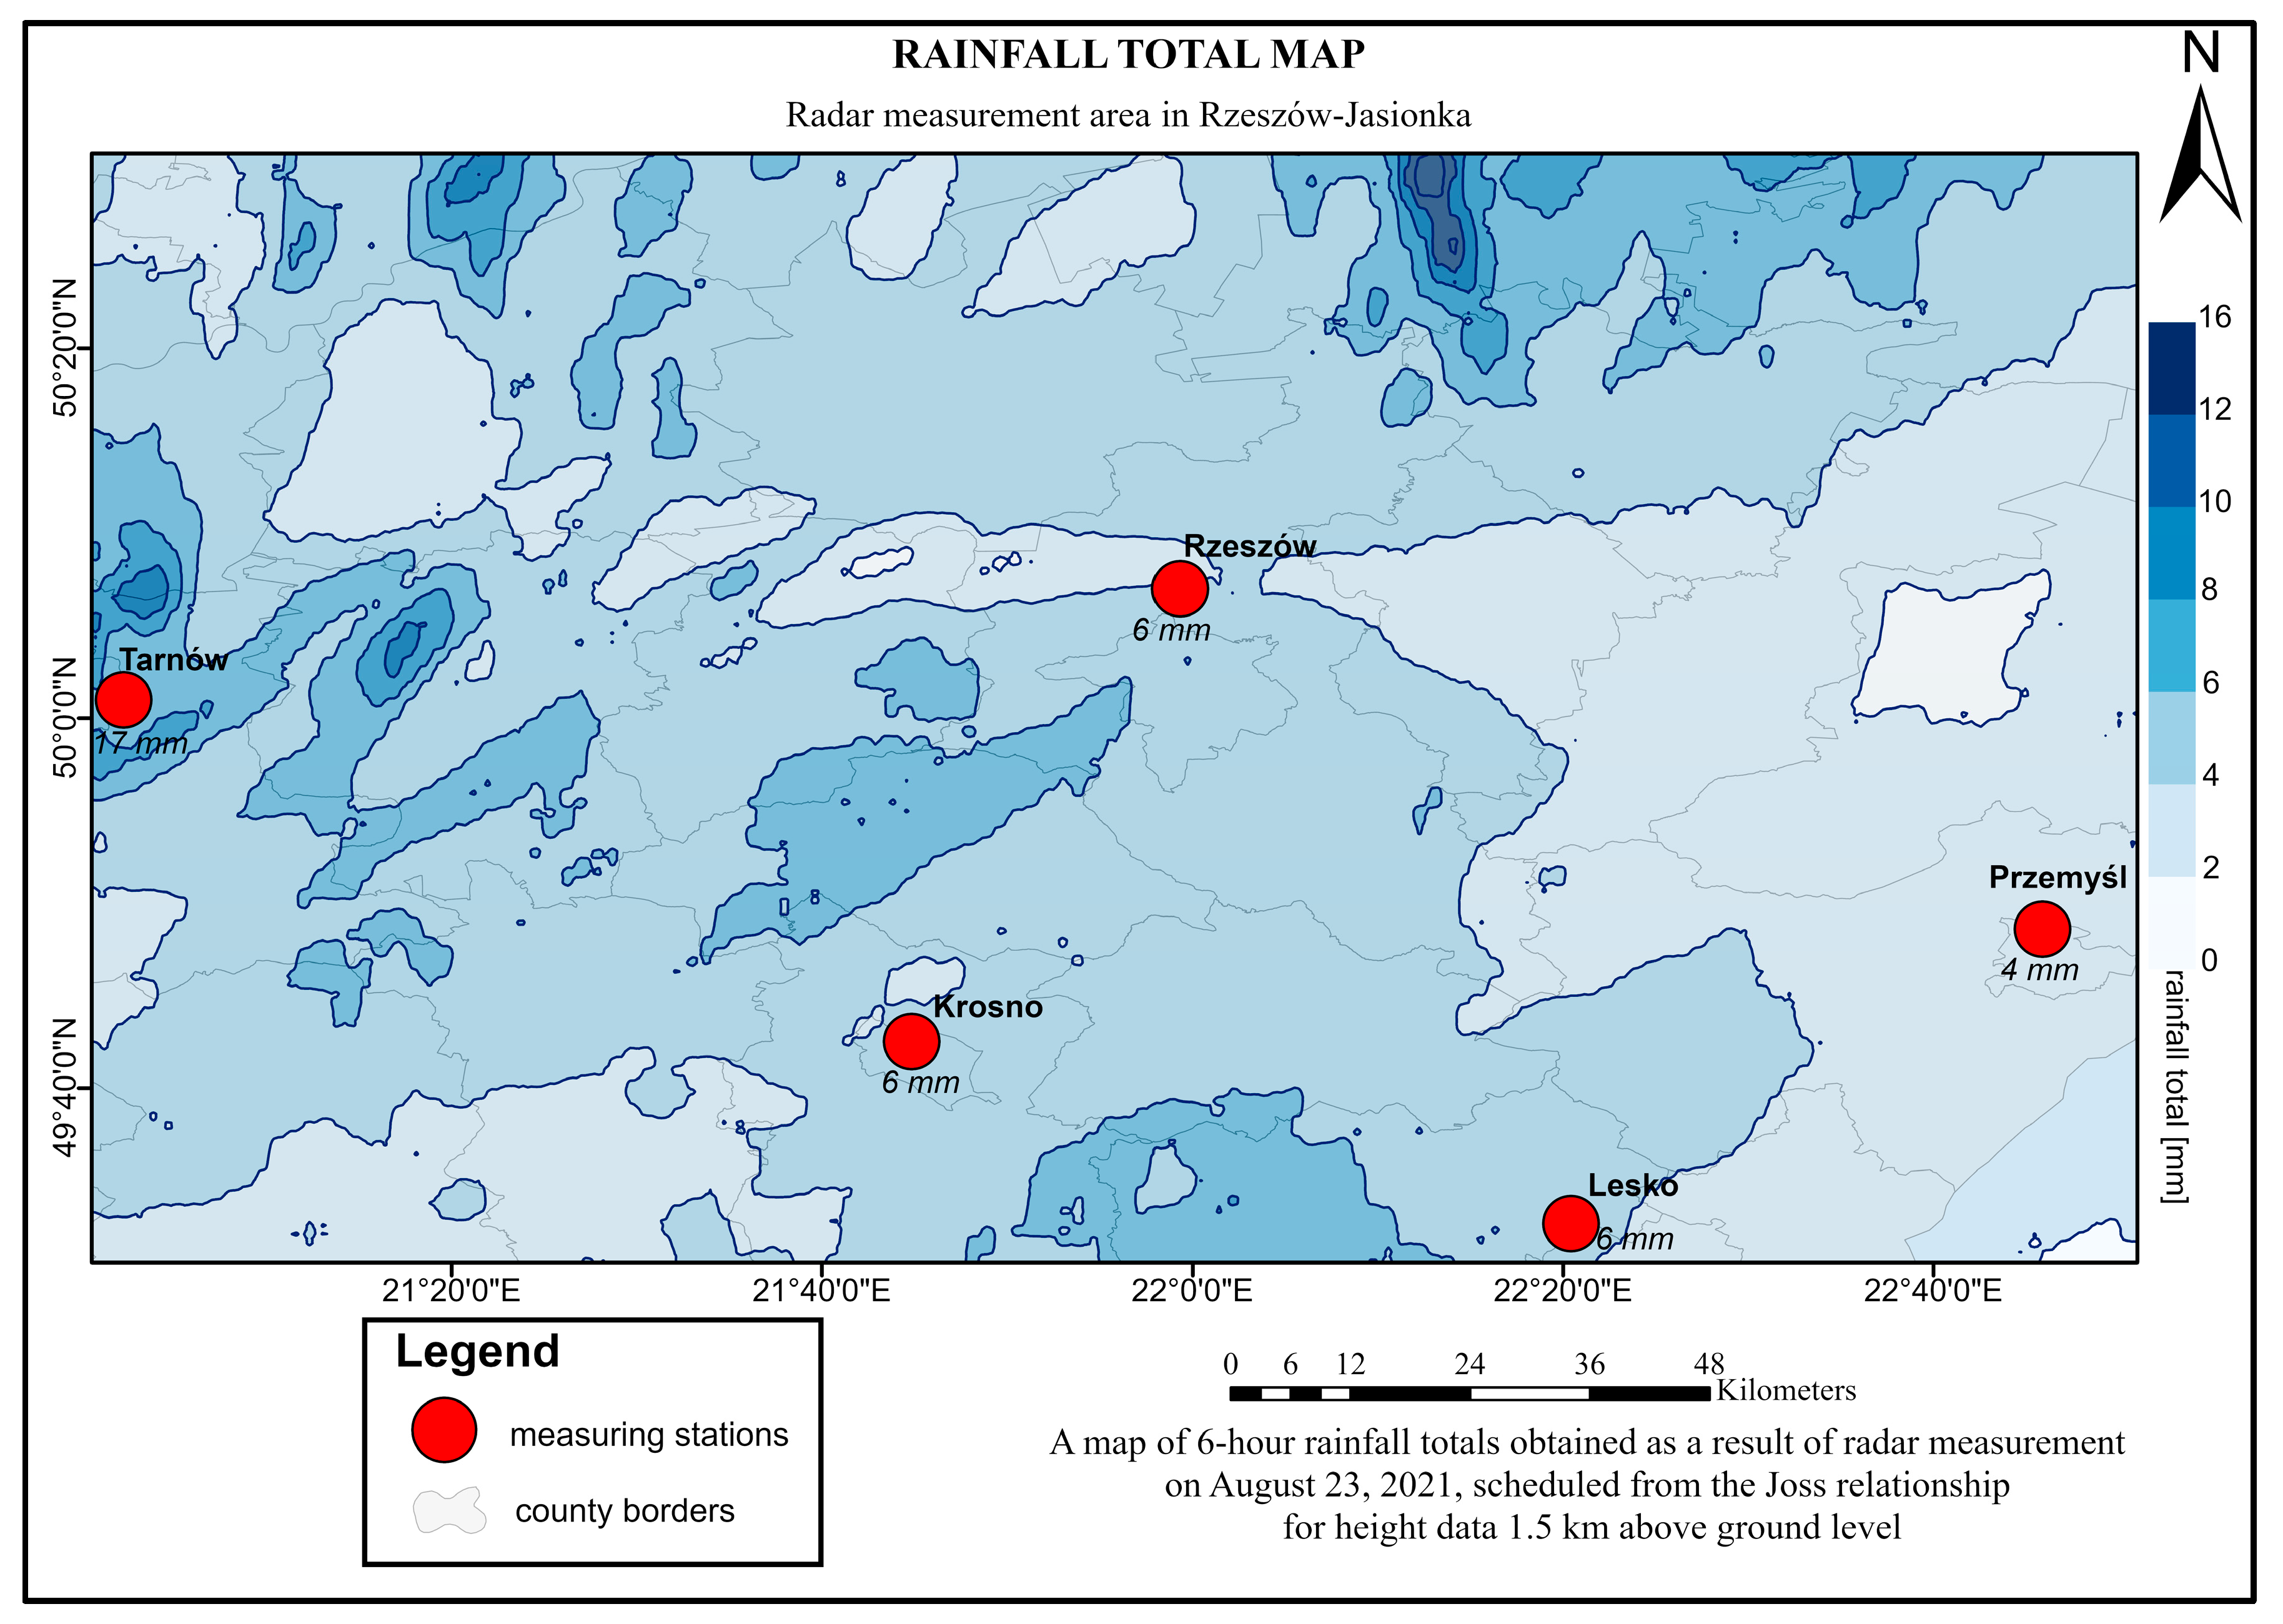
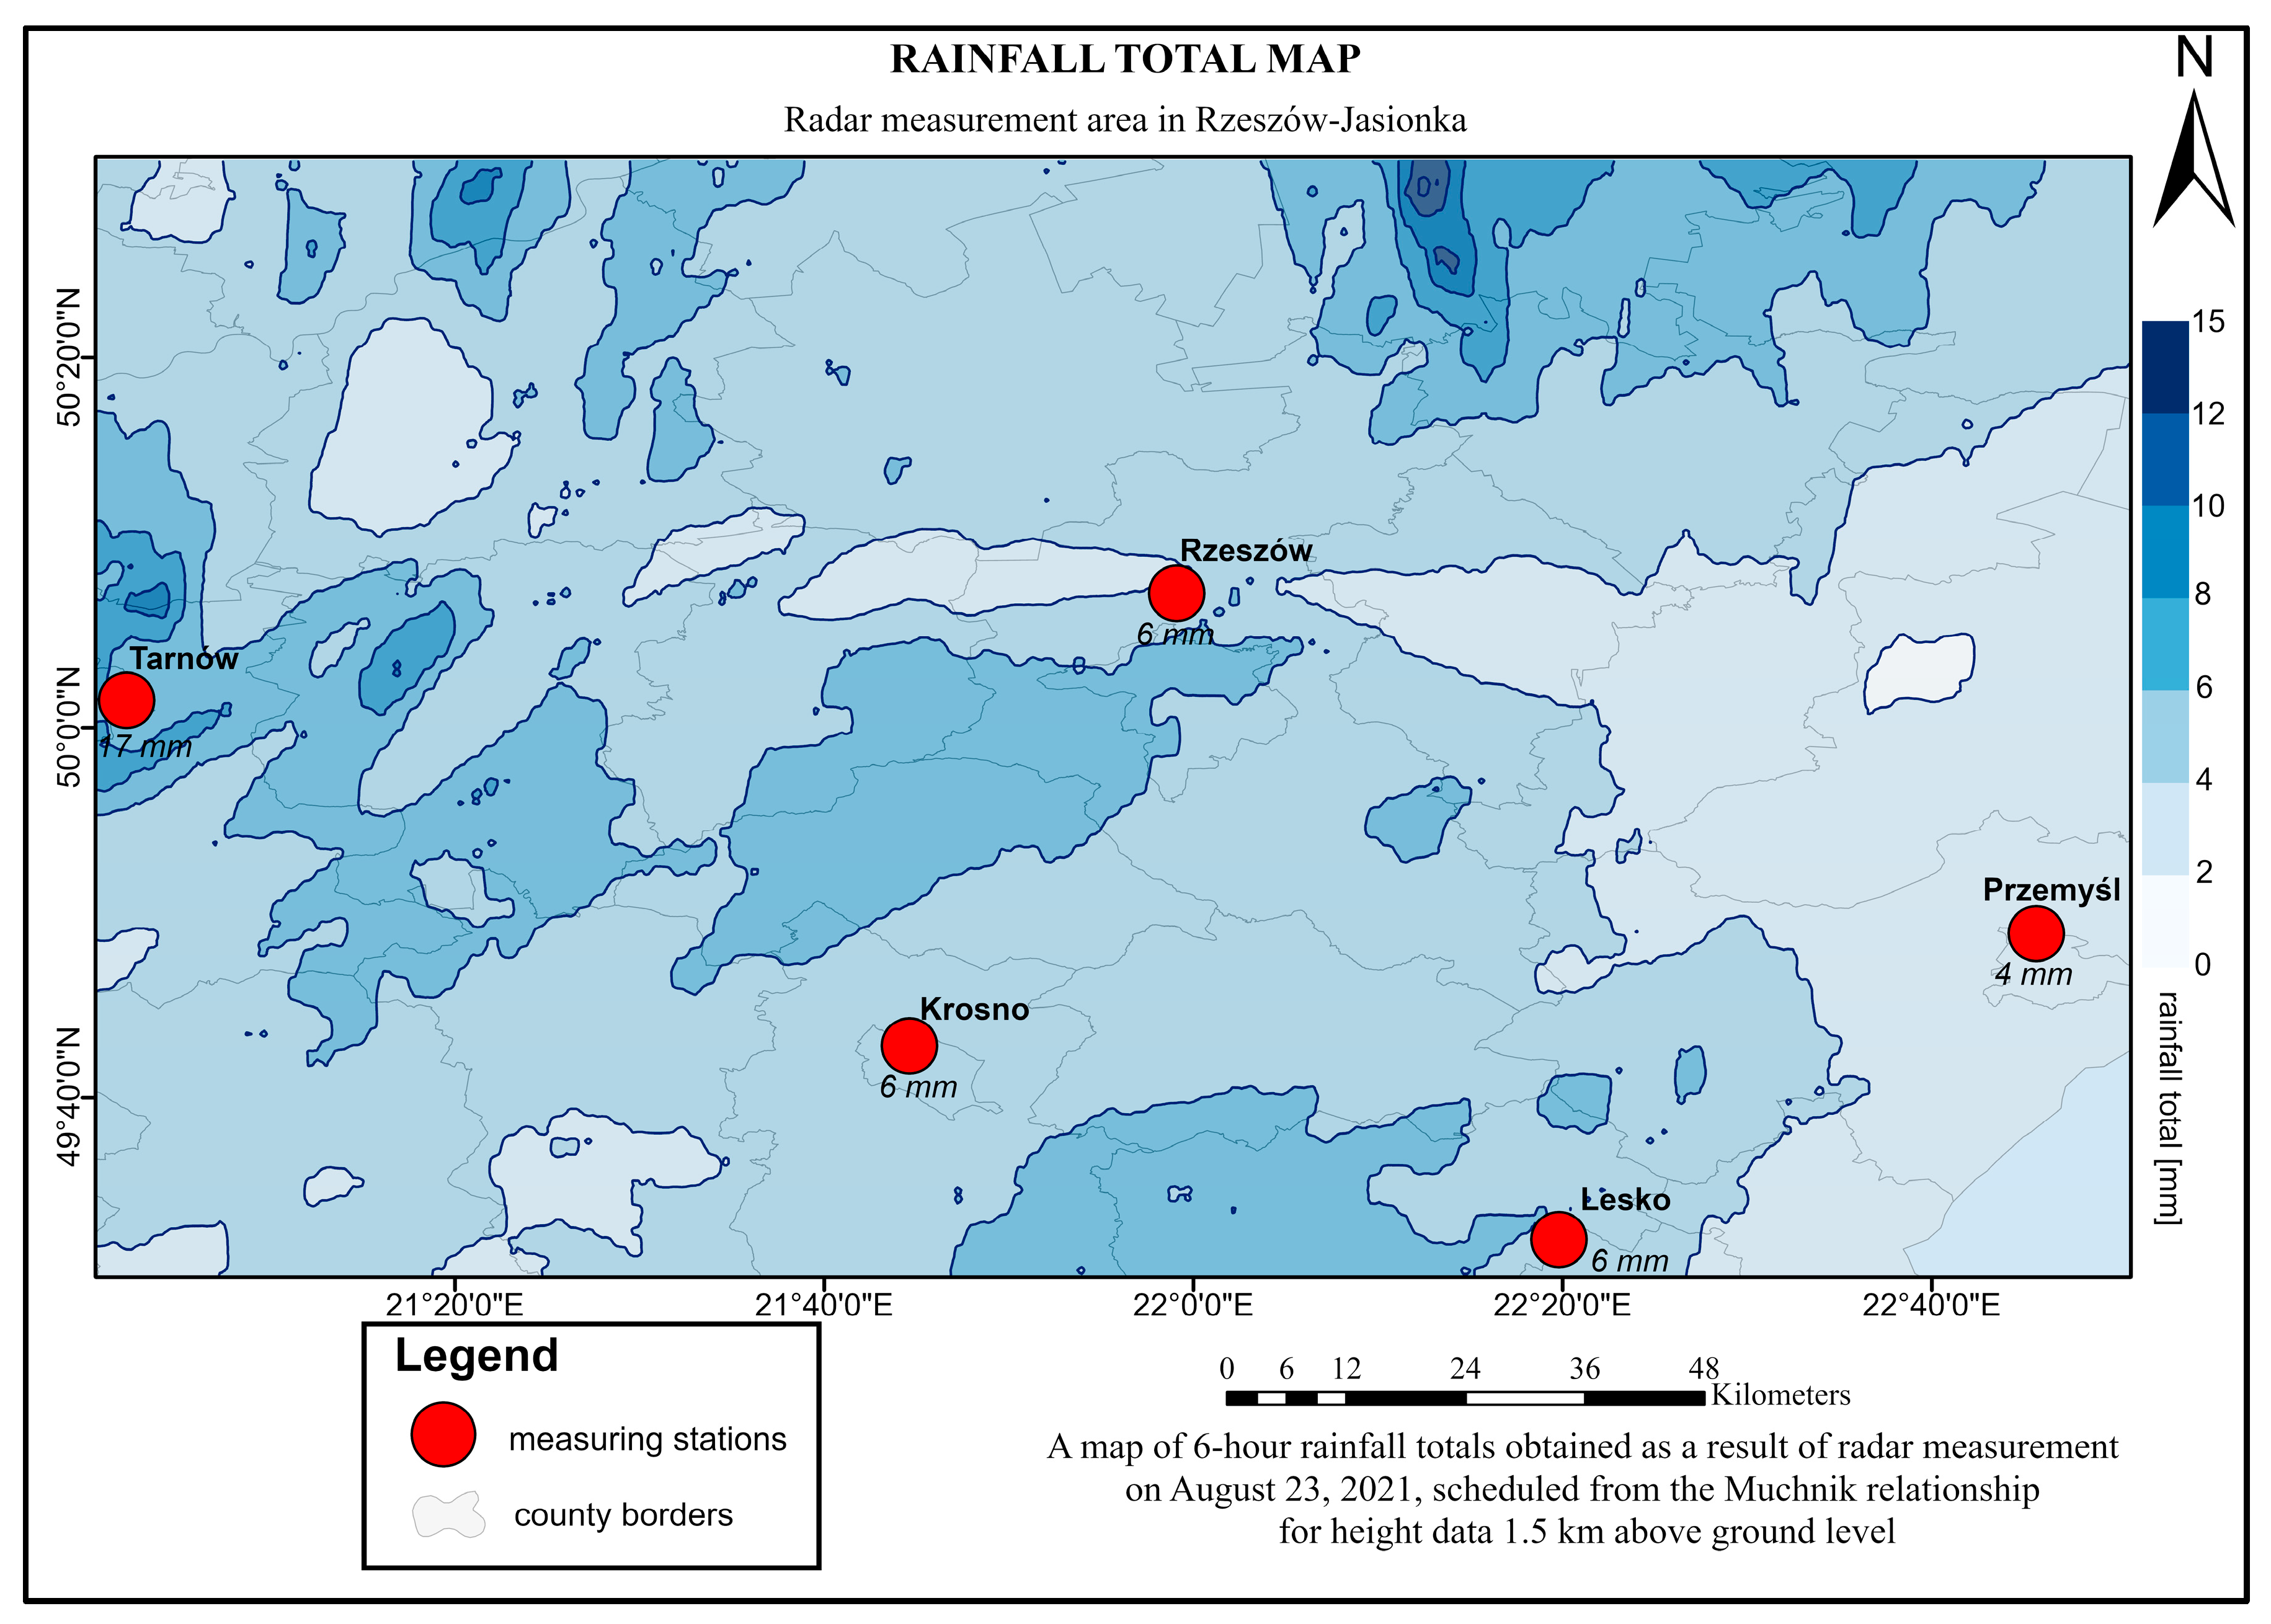
Based on the radar precipitation data, precipitation maps were generated using the ArcGIS software. To generate these, the total precipitation values over 6 h were obtained. These data were determined from radar reflectivity values at a height of 1.5 km above ground level using the Marshall–Palmer, Joss, and Muchnik relationships (
Figure 9,
Figure 10 and
Figure 11).
The total precipitation over six hours (on 23 August 2021, 06:00–12:00 UTC) measured at the station in Tarnów was 17 mm. On the precipitation map developed based on the Marshall–Palmer relationship, the station in Tarnow is located in an area with precipitation totals above 10 mm (
Figure 9).
The total precipitation measured at the stations in Rzeszów, Krosno, and Lesko was 6 mm. In the precipitation maps, the 6 mm isohyet runs through the areas of the measurement stations (
Figure 9,
Figure 10 and
Figure 11). The total precipitation measured at the station in Przemyśl was 4 mm. In the precipitation maps, the area of the measurement station is located between isohyets of 2 mm and 4 mm (
Figure 9,
Figure 10 and
Figure 11).
The analysis of the precipitation maps shows the differences between the precipitation totals determined from the Marshall–Palmer relationship for radar reflectivity from a height of 1.5 km, and the results of direct measurements average 1.99 mm (
Table 3).
Table 3 summarizes the results of the direct precipitation measurements and radar precipitation data based on the Joss, Marshall–Palmer, and Muchnik relationships for the measurement station regions in Tarnów, Rzeszów, Przemyśl, Lesko, and Krosno. The radar precipitation data values for the measurement station regions were determined as the average values of 25 points located around them.
An analysis of the radar precipitation data values shows that for precipitation amounts of a few millimeters, the differences between them and the results of direct measurements are slight, in the order of 1 mm. On the other hand, for rainfall in the order of several millimeters, the differences are significant.
3.3. Analysis of Selected Radar Parameters from Meteorological Radar in Rzeszów–Jasionka
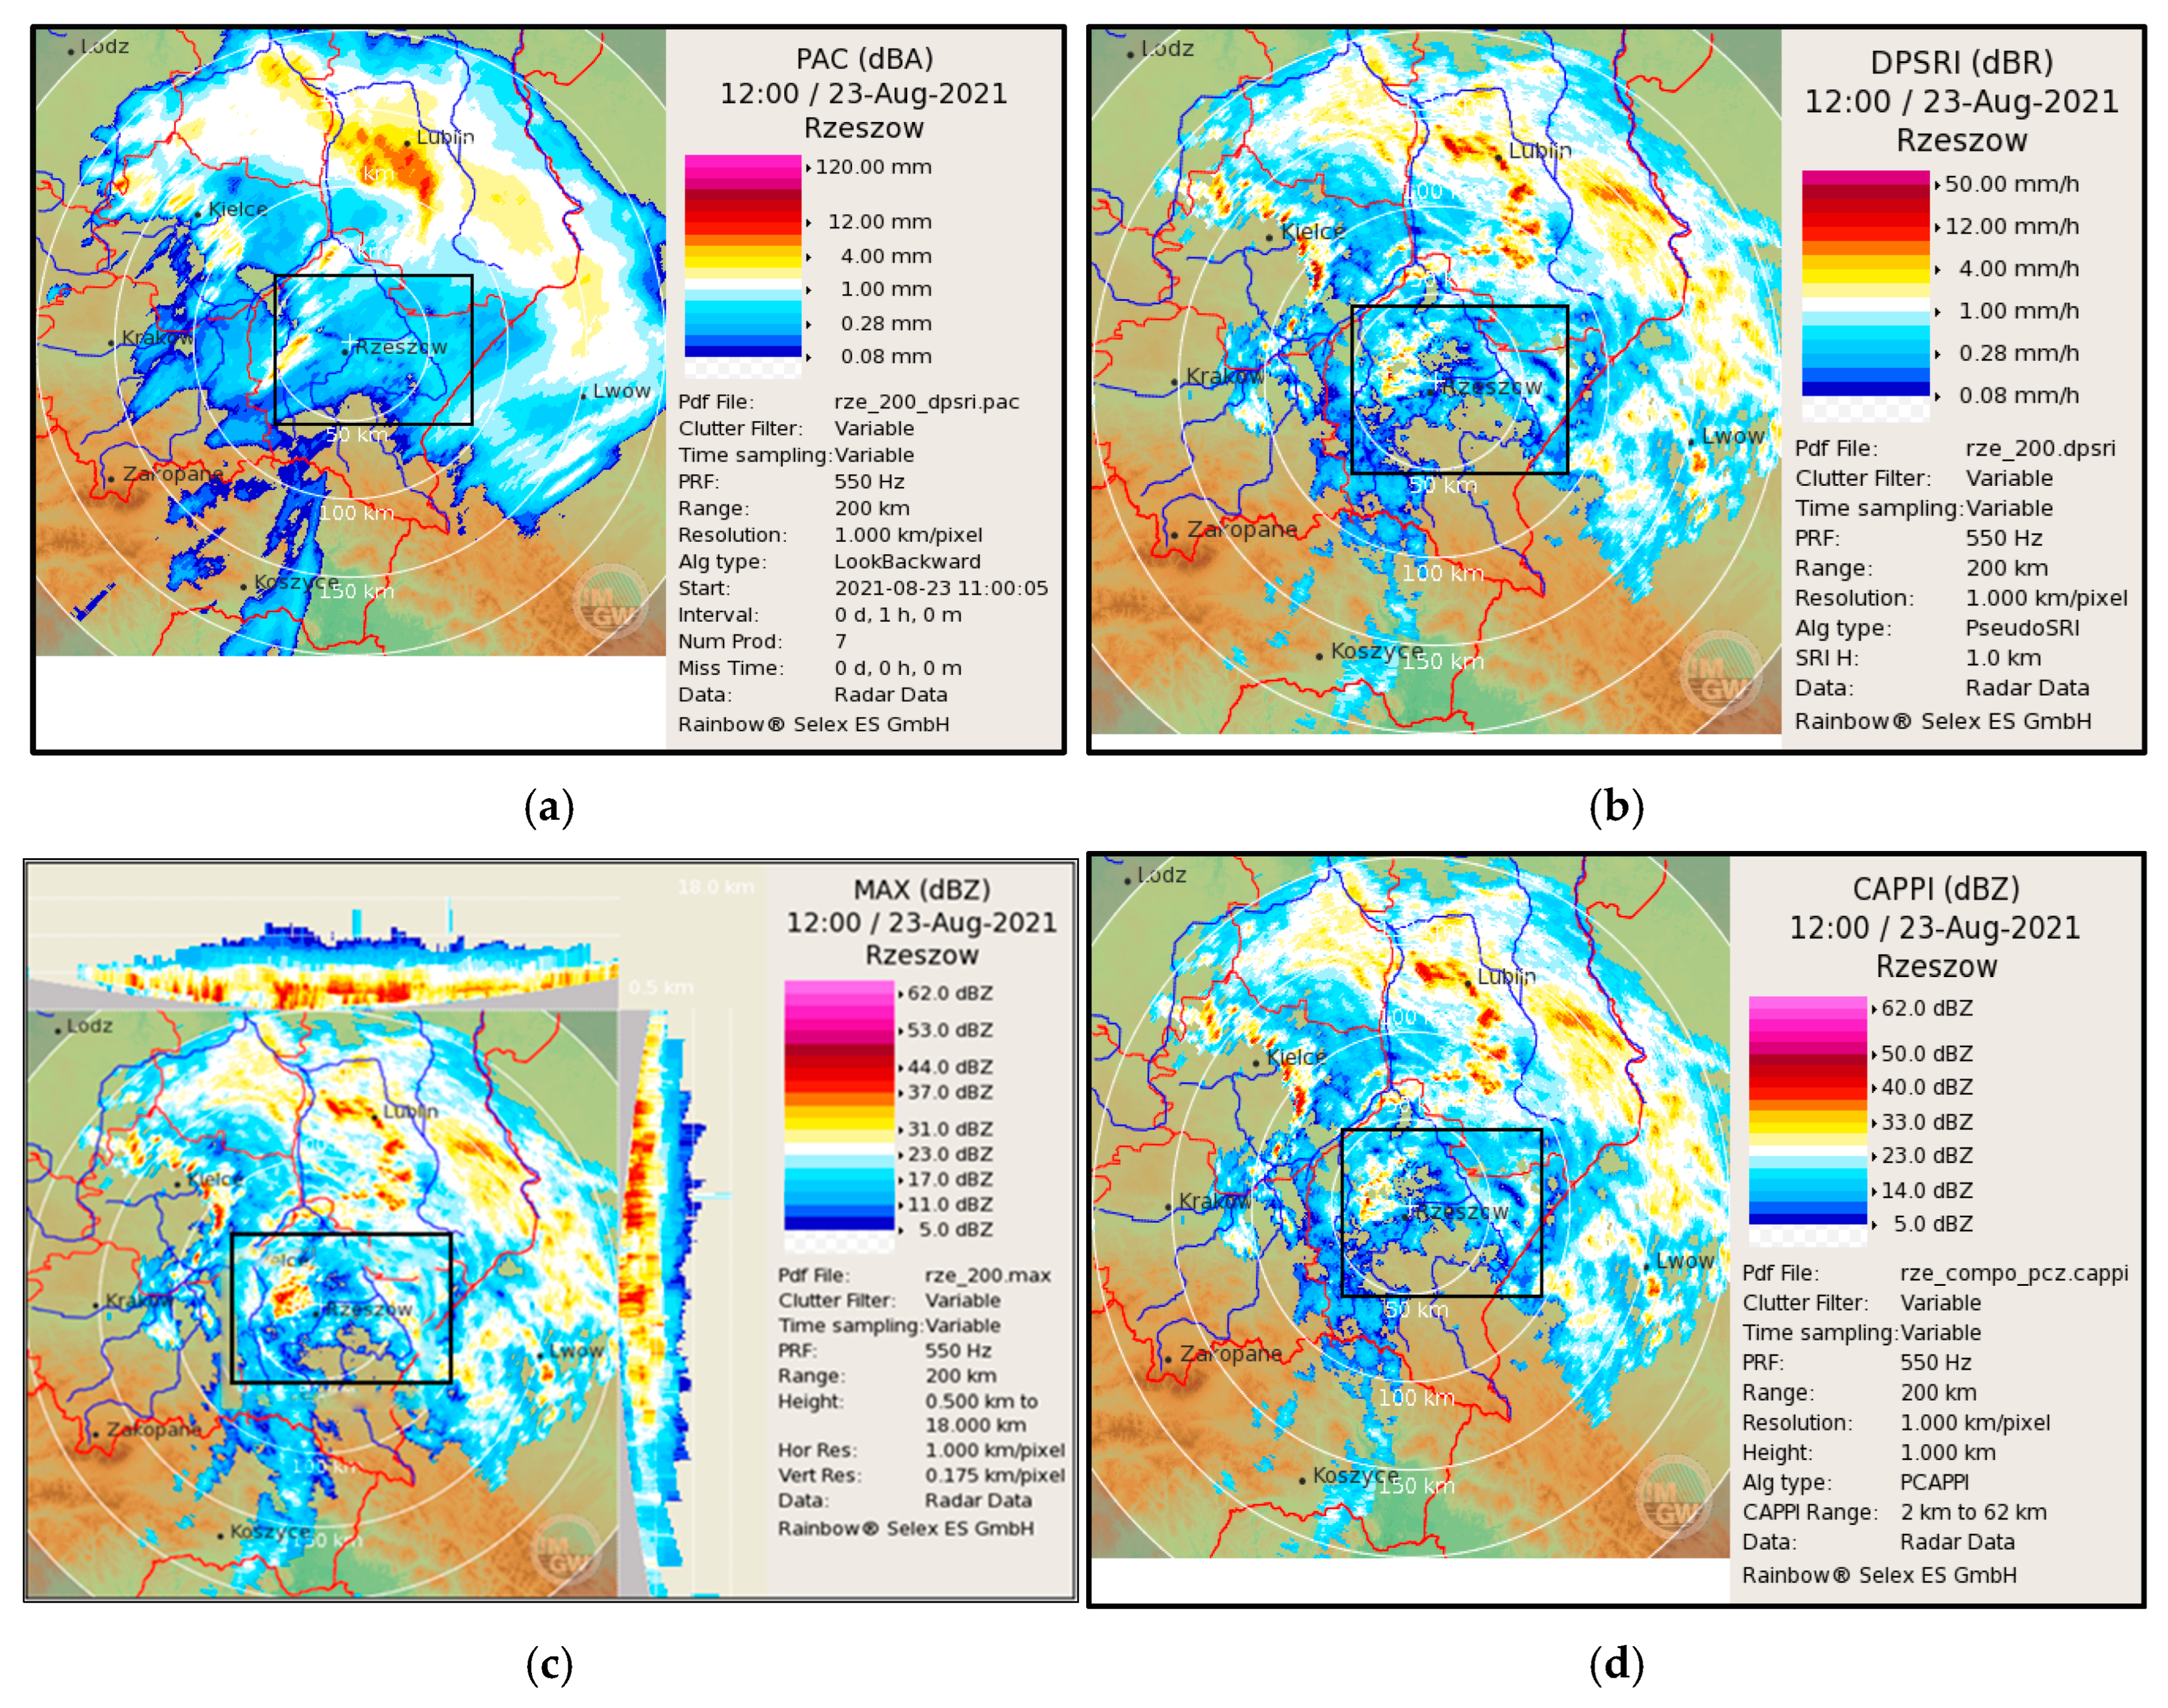
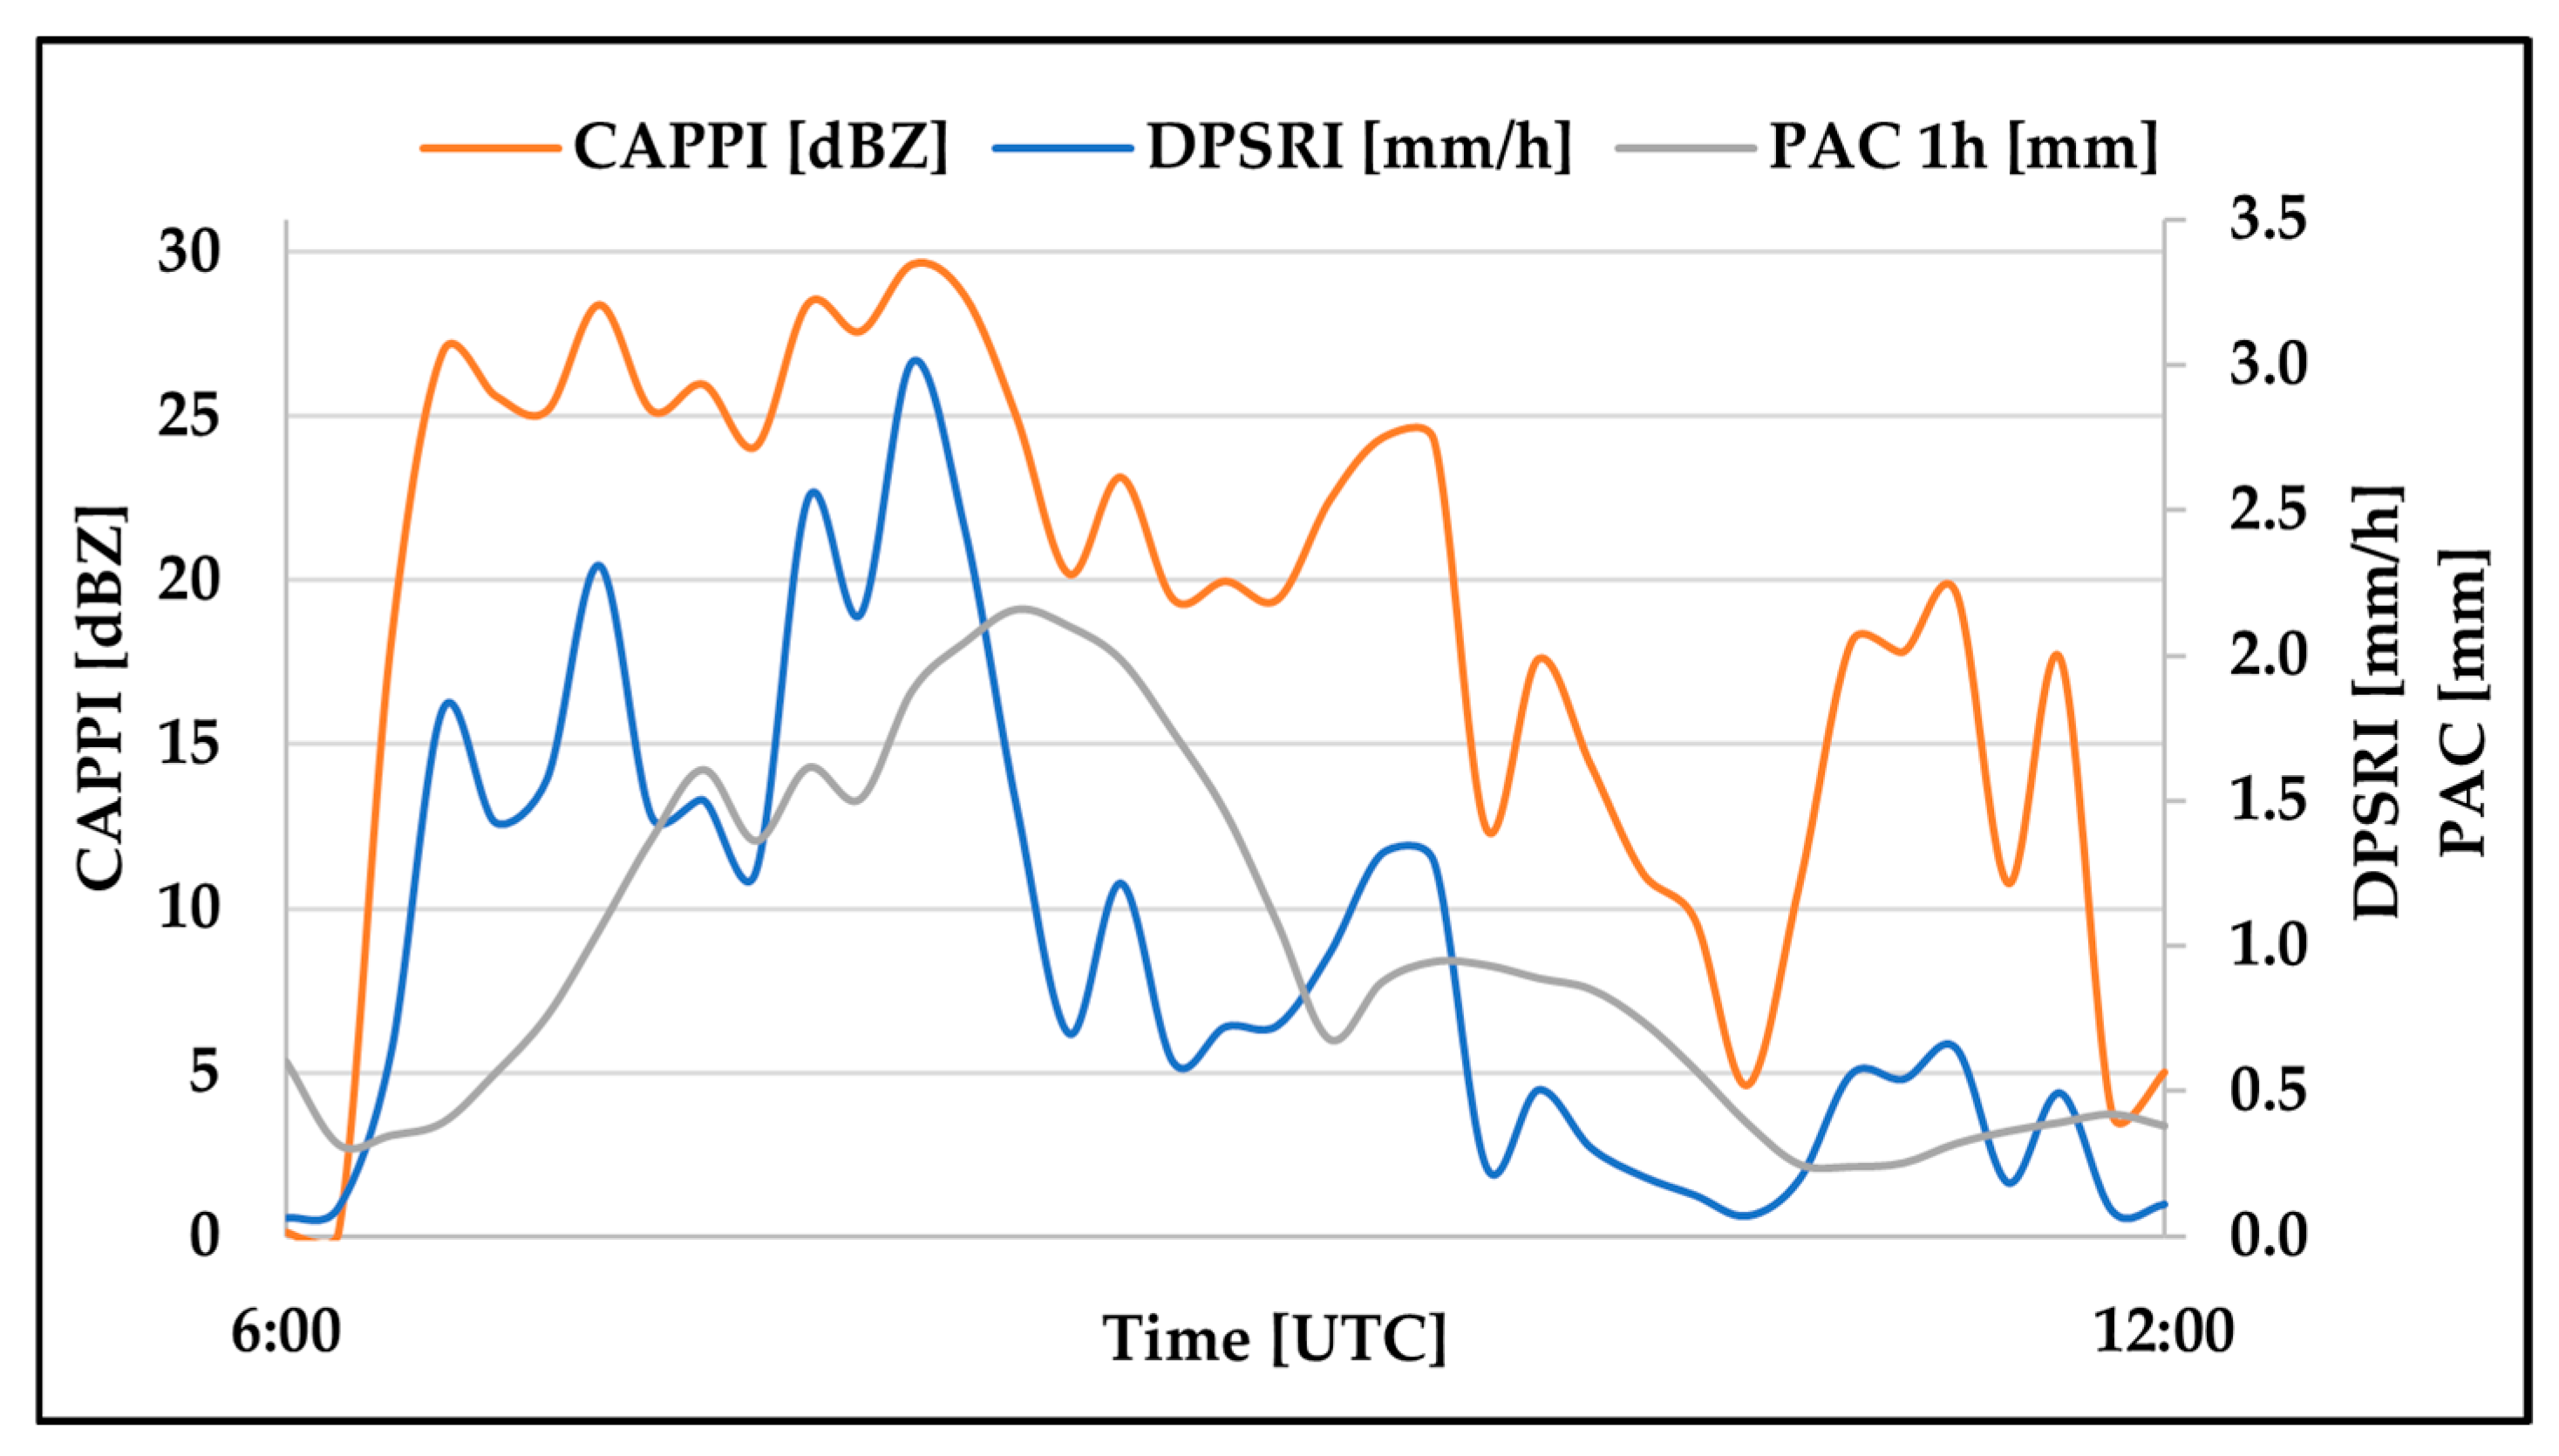
The analysis included values of radar parameters determined based on radar images, as follows: hourly precipitation accumulation (PAC), surface rainfall intensity DPSRI (at dual polarization), maximum reflectivity (MAX), and radar reflectivity at 1 km above the ground level (CAPPI) in the area of the meteorological radar in Rzeszów–Jasionka. The atmosphere was scanned every 10 min.
Figure 12 shows the time courses of the radar parameters, which are the average values determined for 25 measurement points in an area of 25 km
2 around the radar in Rzeszów–Jasionka.
The analysis of the developed time series shows that the values of surface rainfall intensity (DPSRI) and precipitation accumulation (PAC) increase with an increasing radar reflectivity (CAPPI). The highest values of radar reflectivity and precipitation intensity occurred at 8:00 UTC and were 29.62 dBZ and 3.01 mm·h−1, respectively, whereas the maximum value of the hourly precipitation sum of 2.16 mm occurred at 8:20 UTC.
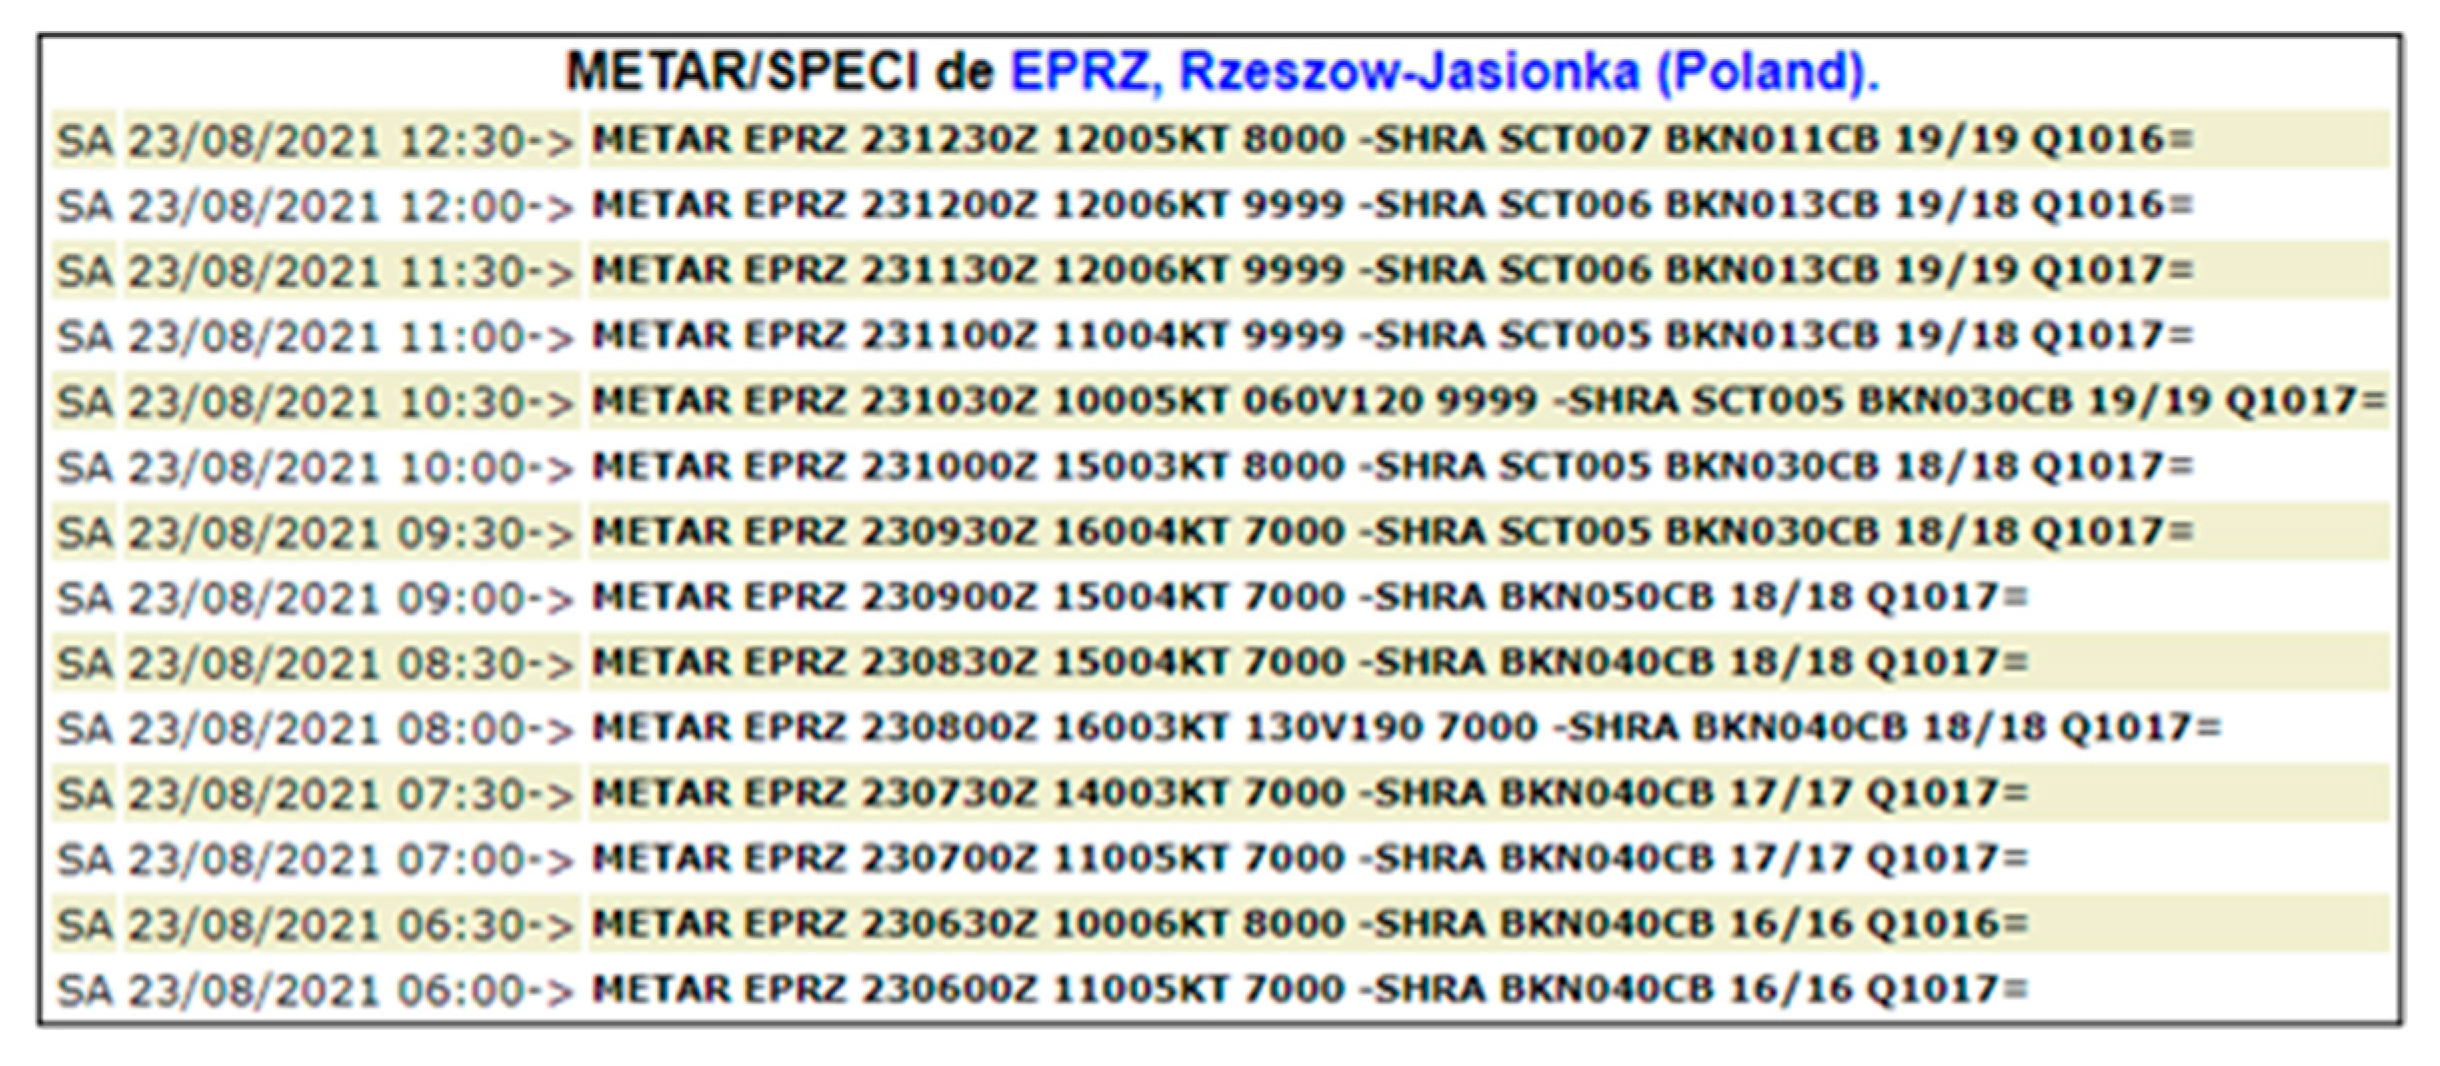
The analysis of the course of changes in atmospheric conditions in the Rzeszów region shows that there was a zone of cloudiness with weak shower rain, which limited visibility to 7 km, during the period from 05:30 to 13:30 UTC.
3.4. Analysis of the Obtained Results
Radar data were compared with actual data.
Table 4 shows the differences between the actual values and the values obtained from radar measurements for the empirical relationships studied.
Statistical indicators, including r, RMSE, rRMSE, Bias, rBias, NSE, and MAE, were used to evaluate the obtained results.
Table 5 shows the values of these indicators, which provide the basis for the analysis of the precipitation totals obtained from the radar measurements compared with the values obtained from the direct measurements.
The determined values of the selected statistical indicators, as listed in
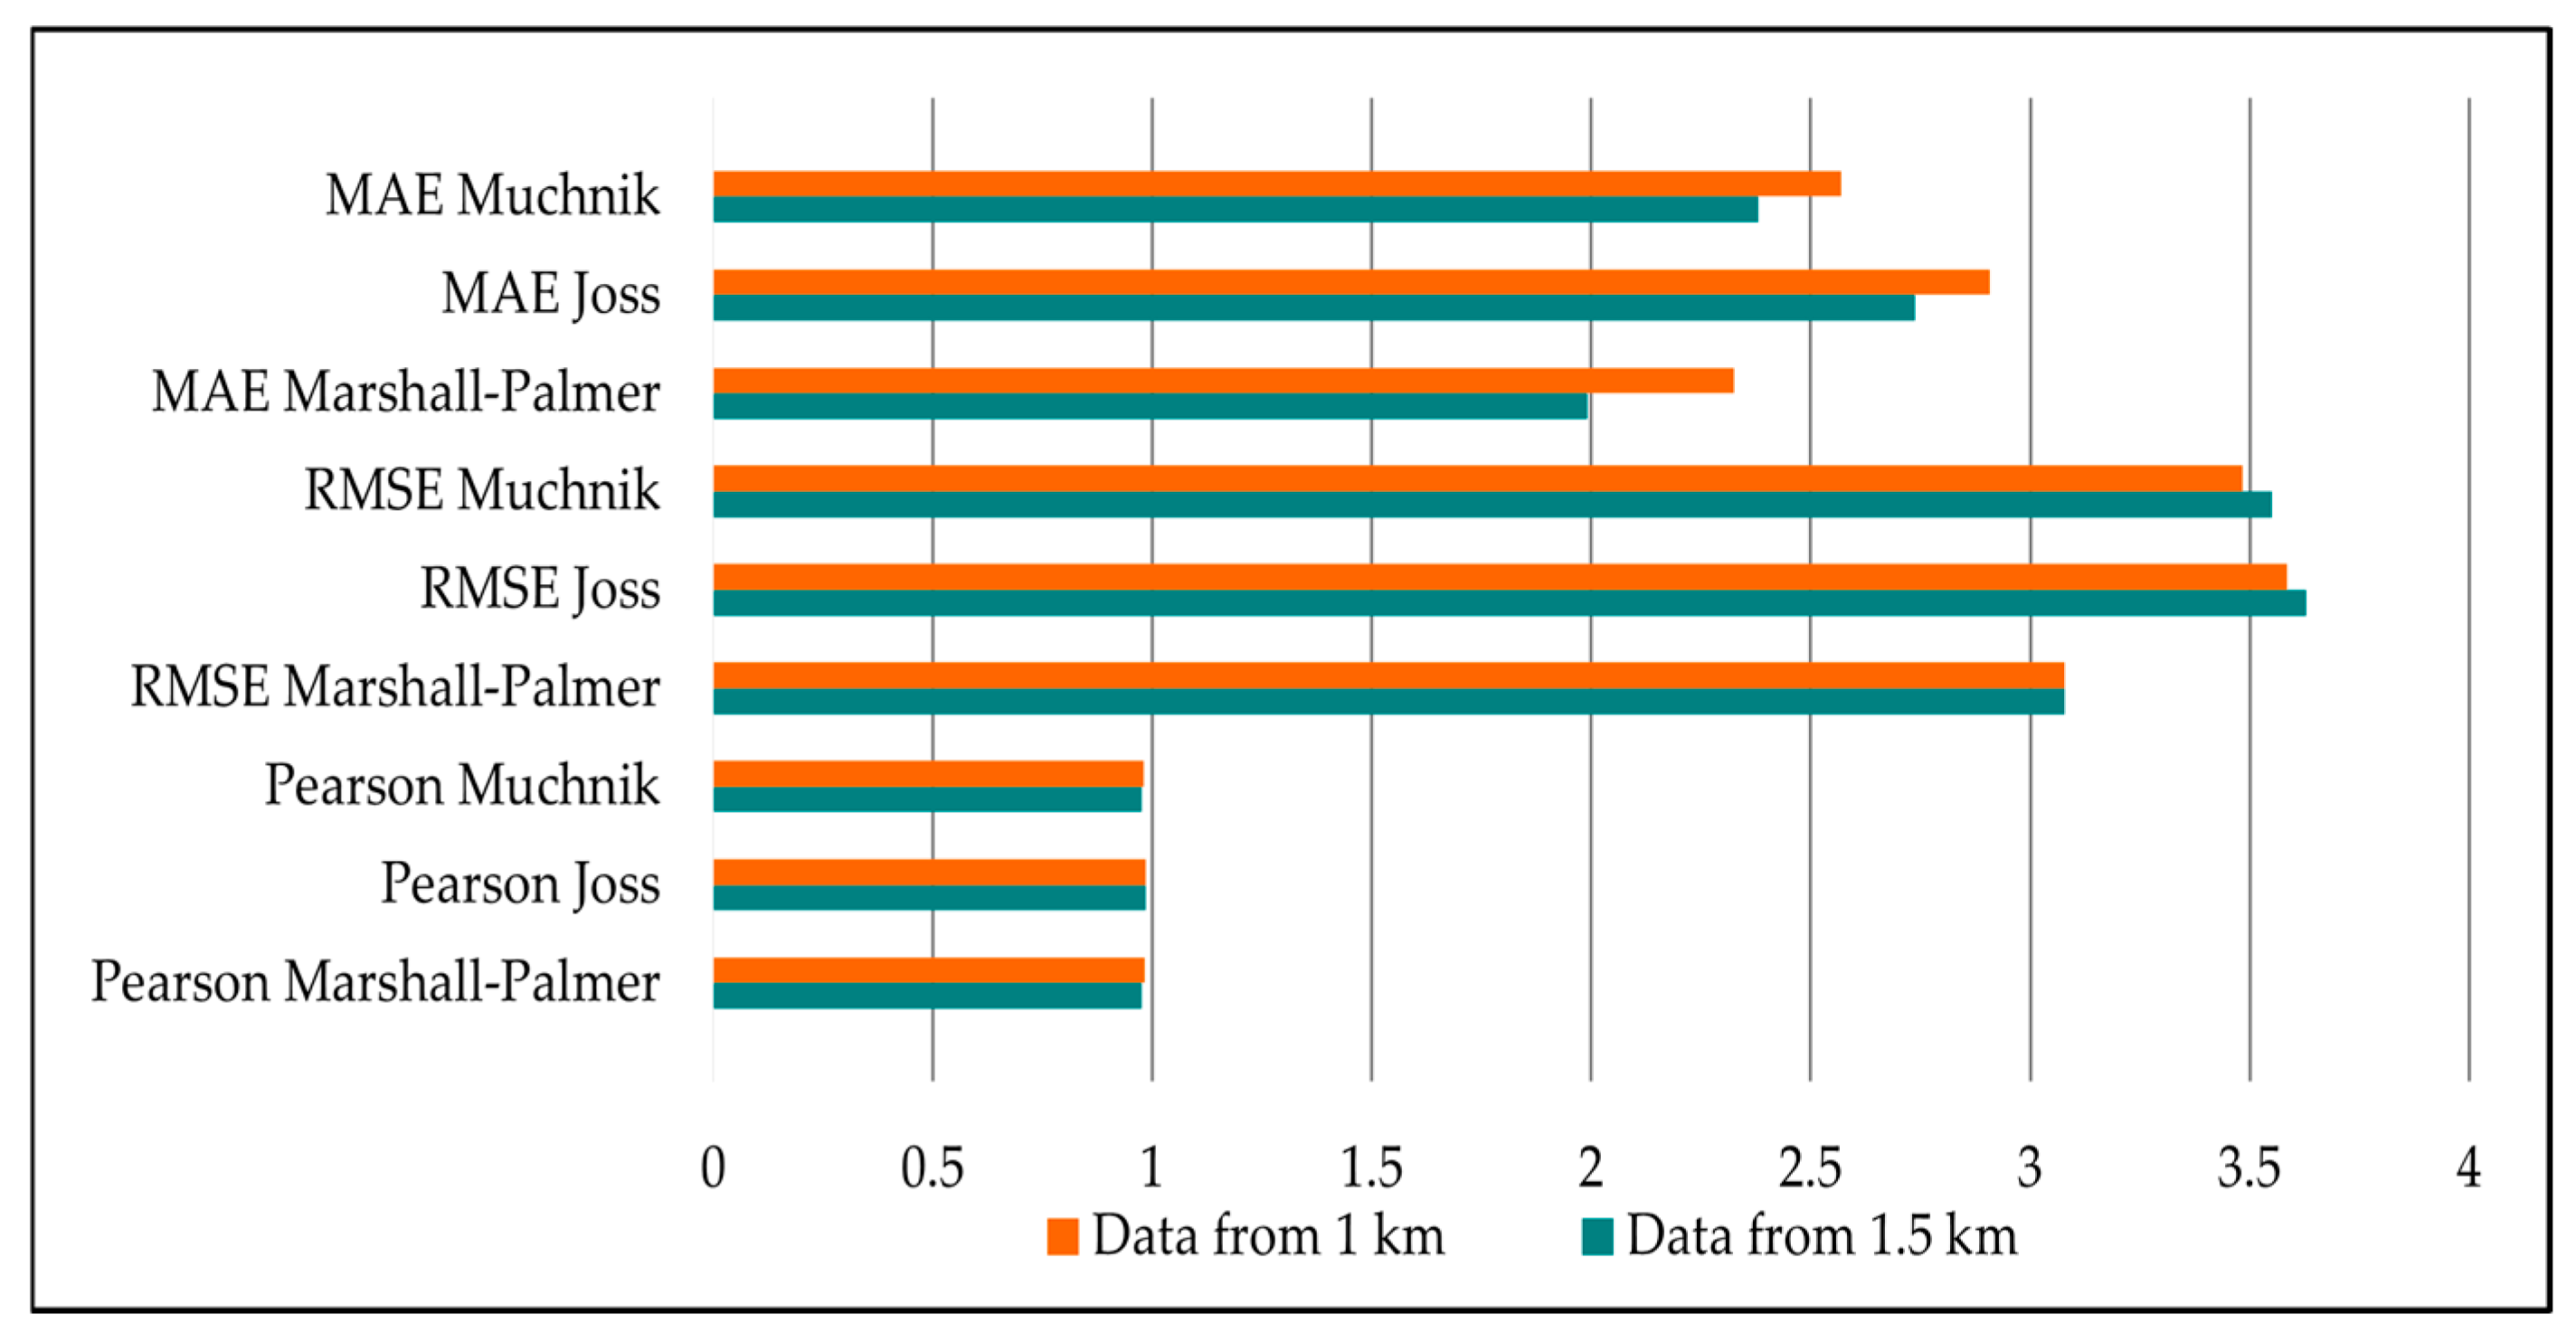
Table 5, are shown in
Figure 13. This allows for a comparison of the indices related to the determination of precipitation totals from radar data based on the relationships studied for radar reflectivity data at 1 km and 1.5 km above ground level. The actual rainfall totals obtained from the direct measurements served as the reference for evaluating the radar-derived measurements.
Table 4 and
Table 5, as well as
Figure 13, present the results of the analysis of the empirical Z–R relationships and data altitudes using selected statistical metrics. The smallest discrepancies between radar-derived precipitation estimates and actual totals recorded by rain gauges were observed for the Marshall–Palmer relationship at a height of 1.5 km at the Krosno station. Irrespective of the Z–R relationship applied, deviations were generally smaller for data obtained at 1.5 km compared to that at 1 km, with the exception of the Tarnów station, where the highest observed rainfall total (17 mm) was recorded. Overall, estimates based on the Marshall–Palmer relationship exhibited a higher accuracy than those derived using the Joss or Muchnik formulations. The smallest mean deviation (0.62 mm) was observed at the Rzeszów station, likely due to its close proximity to the radar site and the resulting influence on the structural variability of meteorological phenomena. Among the statistical indicators, both the r indicator and NSE achieved their highest values for the Marshall–Palmer relationship, reaching 0.98 and 0.56, respectively. These results indicate that this empirical relationship provides the best representation of the association between radar estimates and observed precipitation in the analyzed dataset. Furthermore, the MAE, amounting to 1.99 mm, was obtained for the Marshall–Palmer relationship at a height of 1.5 km. Regardless of the selected Z–R relationship, MAE values were consistently lower for the 1.5 km level, suggesting an improved accuracy of radar measurements at this higher atmospheric layer. However, both Bias and rBias values demonstrated a systematic underestimation across all tested relationships and altitudes.
The quantitative analysis of measurement uncertainty and precipitation estimation employed classical methods, such as calculating confidence intervals for mean differences between radar and rain gauge measurements, as well as a non-parametric approach based on bootstrapping. Calculations were performed using radar data collected at heights of 1 km and 1.5 km above ground level. The objective was to estimate the overall range of radar measurement errors in relation to reference measurements obtained from rain gauges.
The average difference between radar and rain gauge measurements at a height of 1.5 km was −2.37 mm, with a 95% confidence interval of ±3.38 mm. This means that the difference may range from approximately −5.77 mm to +1.03 mm. At a height of 1 km, the average difference was −2.60 mm and the confidence interval was ±2.99 mm. On average, the radar underestimated precipitation measurements by 2.60 mm. However, the difference may range from −5.59 mm to +0.39 mm.
Bootstrapping is a statistical method that involves repeatedly resampling with replacement from the original dataset to estimate the uncertainty of statistics such as means or confidence intervals. This method is particularly useful for small datasets or when the data do not meet the assumptions of classical methods, such as normality [
72]. In this study, bootstrapping was applied to estimate a reliable confidence interval for the mean difference between radar-based and gauge-based precipitation measurements. The average difference between radar and rain gauge measurements at a height of 1 km was −2.60 mm. Using the bootstrap method, the 95% confidence interval for the mean difference was determined to be (−4.73 mm, −1.21 mm). The average difference between radar and rain gauge measurements at a height of 1.5 km was −2.37 mm, indicating a systematic underestimation of precipitation by the radar system. The 95% bootstrap confidence interval for the mean difference was (−4.84 mm, −1.03 mm). Since the entire confidence intervals at both 1 km and 1.5 km altitudes lie below zero, there is strong statistical evidence that the radar consistently underestimates rainfall at the analyzed locations. This range highlights not only the magnitude of the bias, but also its consistency across the measurement sites.
3.5. A Spatiotemporal Analysis of Precipitation
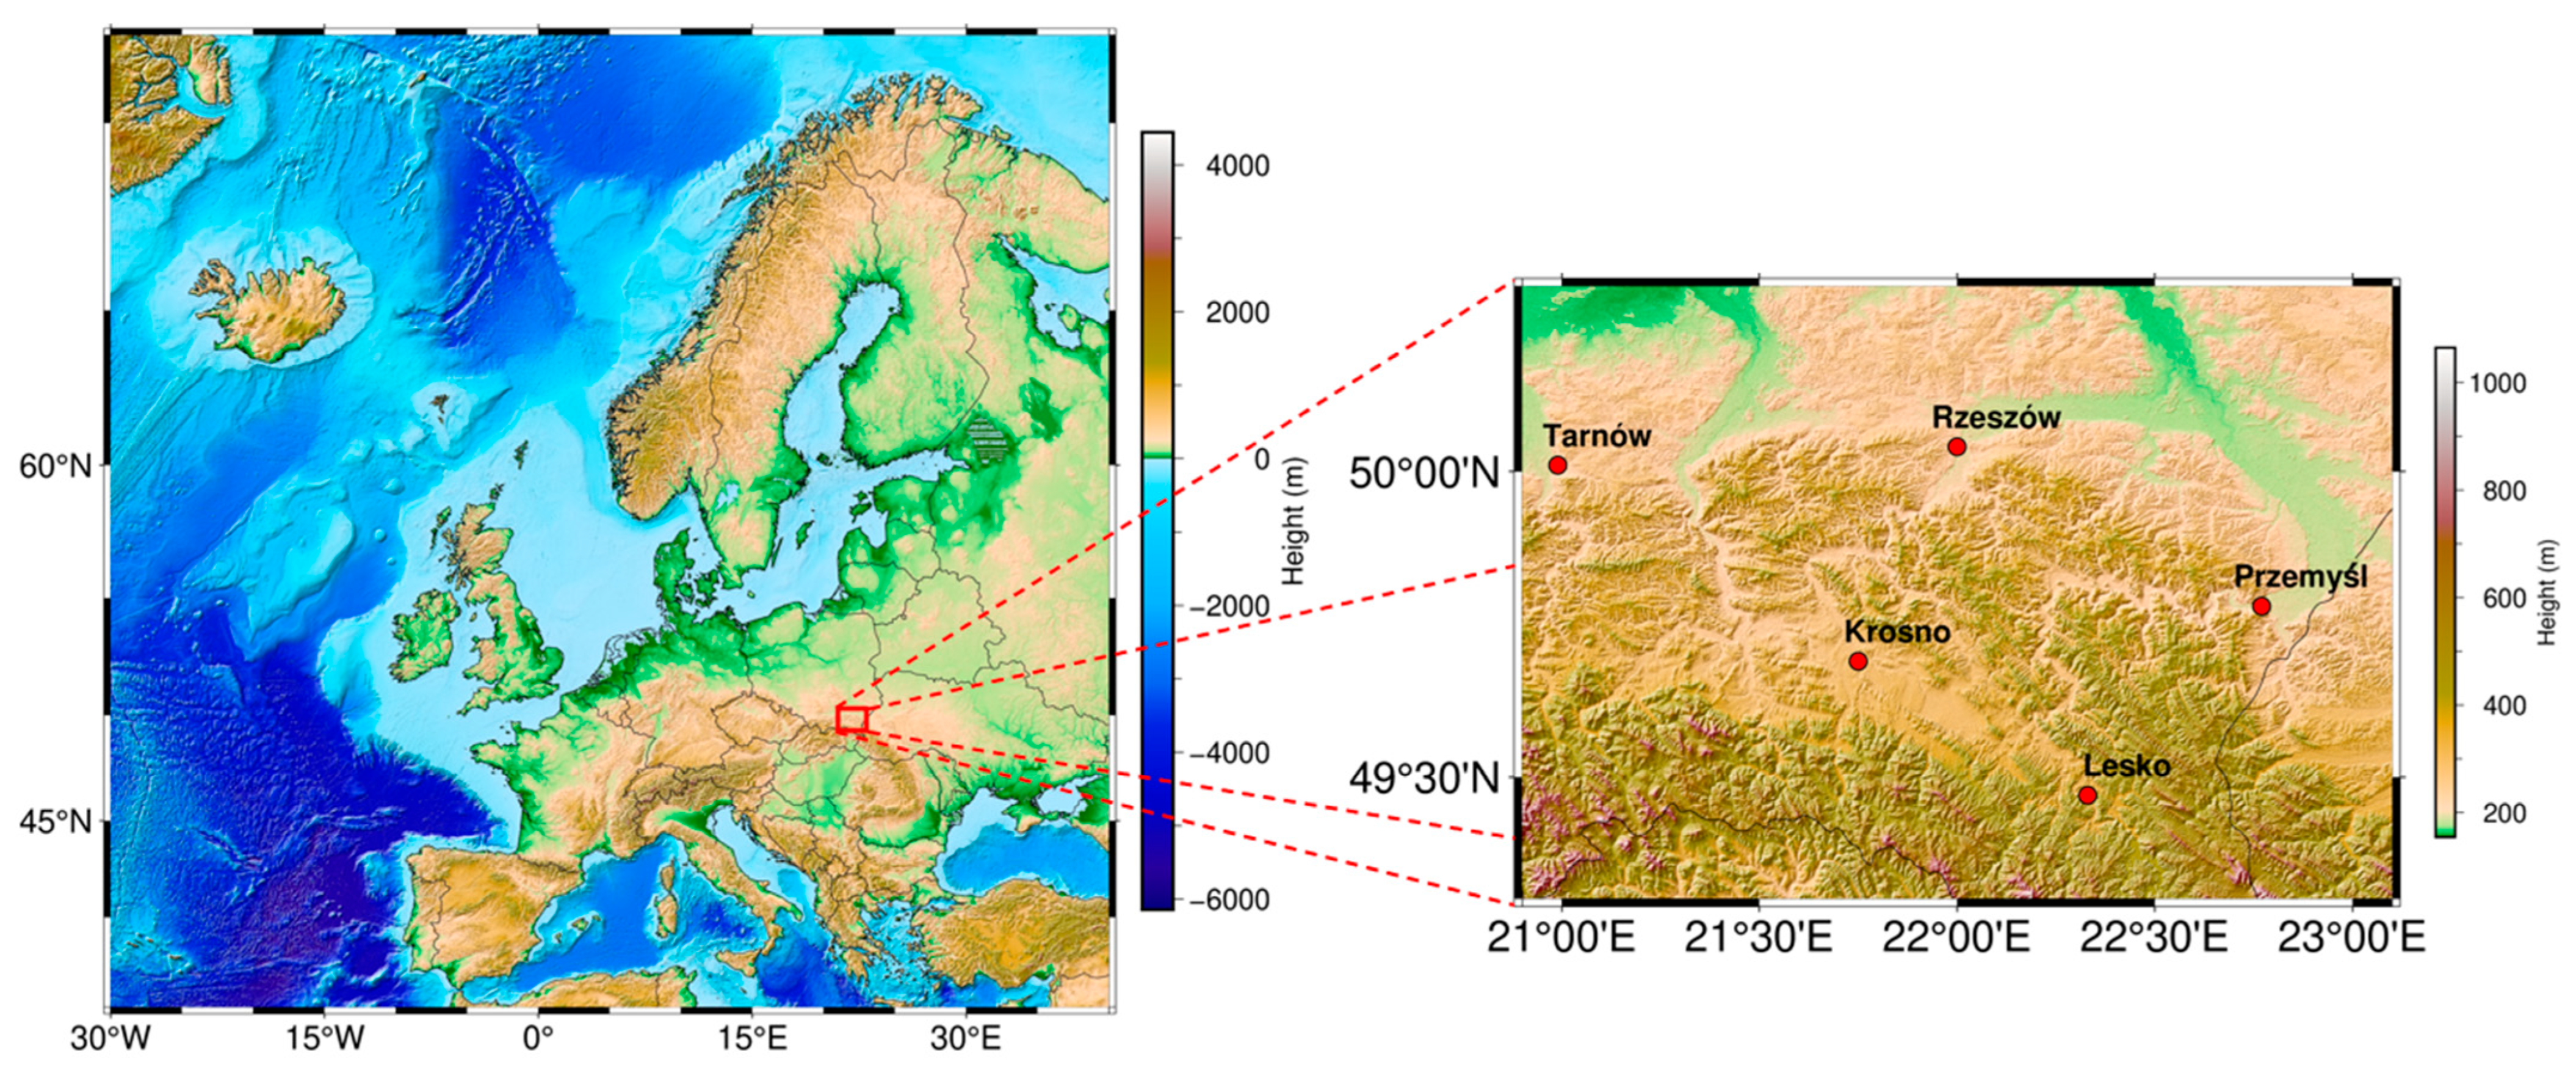
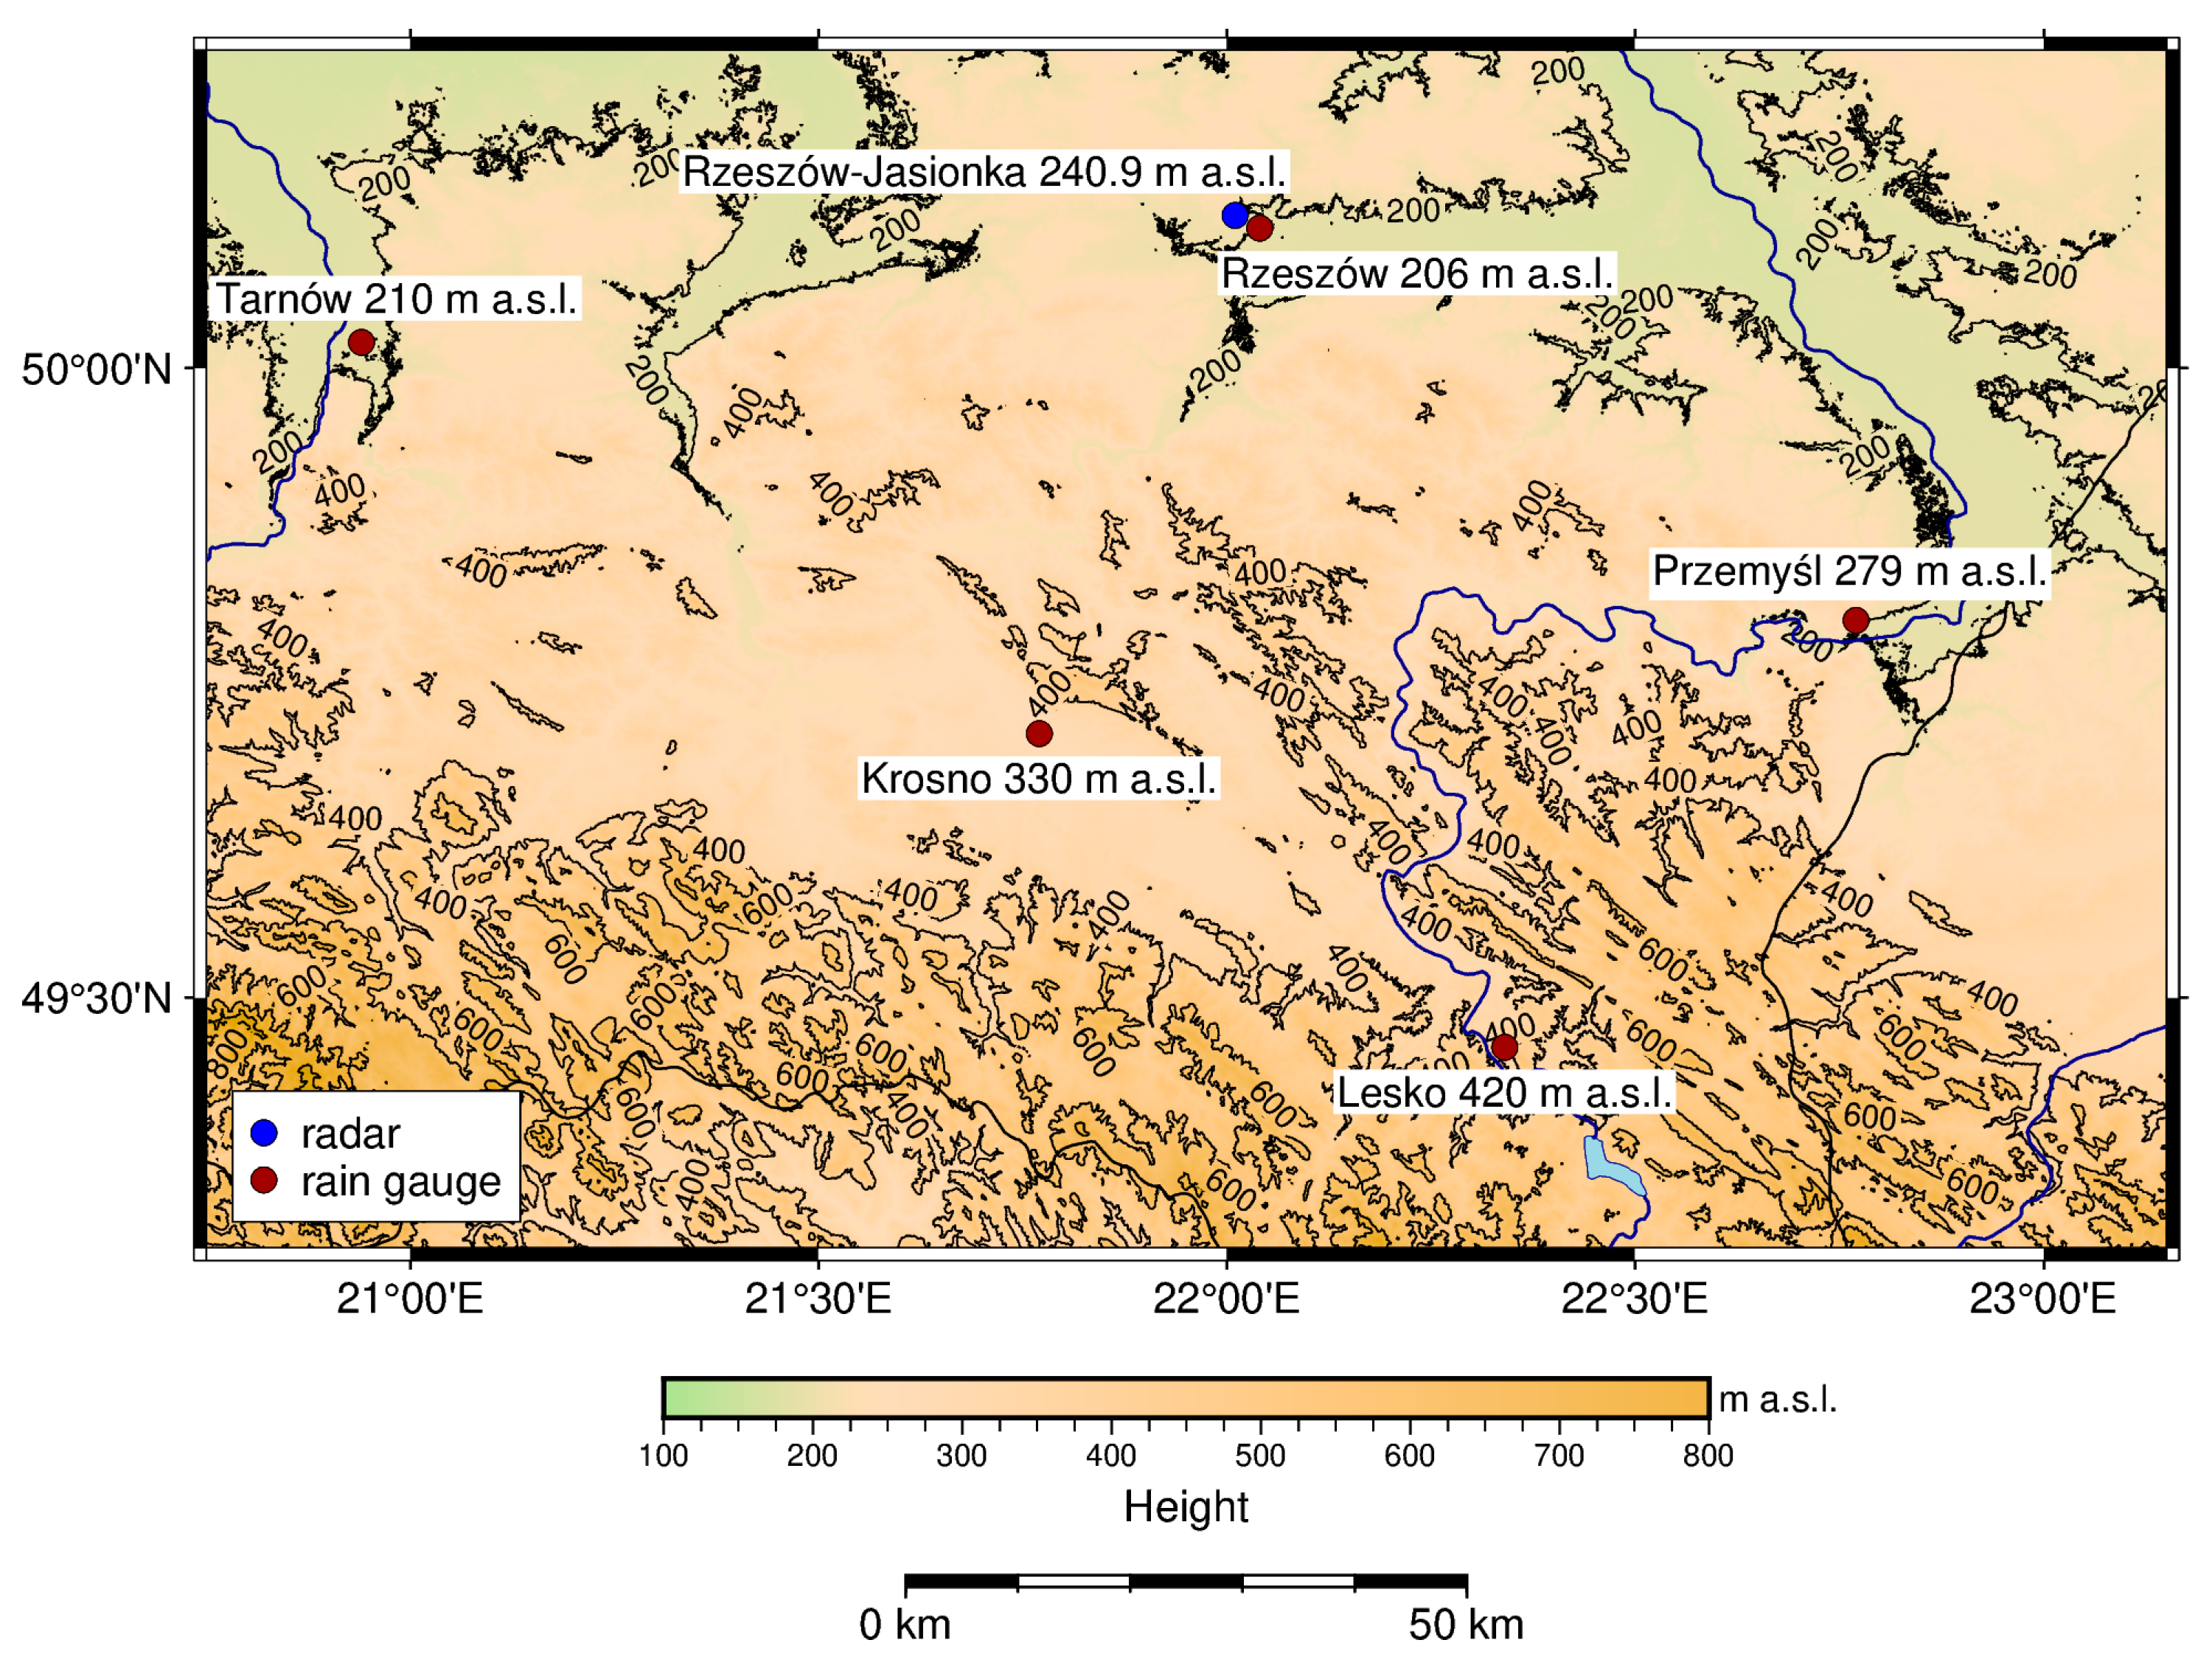
The analysis of the spatiotemporal variability of precipitation distribution is a key area of research in meteorology and hydrology. In particular, the movement of meteorological structures across a measurement area can lead to significant differences in recorded precipitation values, thereby affecting both the accuracy of forecasts and the effectiveness of early warning systems. In this study, such variability was analyzed using data from five measurement stations (
Figure 3,
Table 1) and radar-derived precipitation estimates based on the empirical relationships of Marshall–Palmer, Muchnik, and Joss. The radar data were collected at heights of 1 km and 1.5 km above ground level. To assess the accuracy of the precipitation estimates, several statistical indicators were employed, including MAE, RMSE, rRMSE, Bias, and rBIAS (
Table 6).
The MAE and RMSE indicate the magnitude of errors in precipitation estimation for individual locations. The lowest values were observed in Rzeszów, with an MAE and RMSE equal to 0.93 mm and 0.97 mm, respectively. This station is also located closest to the weather radar used in this study, which likely contributed to the higher accuracy of the radar-derived precipitation estimates. The highest errors were recorded in Tarnów (7.03 mm and 7.05 mm), the station farthest from the radar, where the highest precipitation total (17 mm) was also observed. An analysis of the rRMSE supports these findings. The value of rRMSE in Rzeszów was 16.22%, indicating that the radar data provided a good approximation of the precipitation measured by rain gauges. Although the rRMSE for Krosno reached 24.41%, it can still be considered acceptable for operational purposes, especially in regional analyses and hazard forecasting. At the remaining stations (Lesko, Przemyśl, and Tarnów), the rRMSE exceeded 30%, suggesting that the radar data did not accurately capture the variability of precipitation in terms of both magnitude and spatial distribution. Moreover, the analysis of Bias and relative Bias (rBias) revealed that the radar data systematically underestimated precipitation across all locations. The smallest underestimation was observed in Rzeszów (−0.93 mm, −15.44%), while the largest occurred in Tarnów (−7.03 mm, −41.37%).
3.6. Sensitivity of Empirical Z–R Relationships to Numerical Parameters of Precipitation Intensity
This study shows that the use of standard empirical relationships leads to an underestimation of rainfall totals based on radar data. Therefore, an attempt was made to assess the impact of the numerical parameters A and b (2) on the resulting rainfall intensity values R. The empirical relationships commonly used in radar precipitation estimation are based on the following specific parameter values: A = 200 and b = 1.6 for Marshall–Palmer; A = 204 and b = 1.7 for Joss; and A = 250 and b = 1.5 for Muchnik. Because these values are not always representative of local atmospheric conditions, this study also analyzed relationships with parameters taking values outside the standard range.
In the analysis, the following four combinations of parameters were adopted: A = 150 or 300 and b = 1.4 or 1.8. The selection of these parameters involved choosing larger and smaller values than those in the examined dependencies. The objective was to determine how these modifications affected the estimated values of precipitation intensity. Calculations were conducted for four cases labeled R
X, R
Y, R
Z, and R
H, corresponding to different combinations of A and b (
Table 7).
The analysis of variants describes the influence of parameters A and b on the precipitation intensity results. Using these numerical parameters, R was calculated and compared with measurements obtained based on the investigated relationships (
Table 8).
The analysis presented in this study investigates the influence of the empirical parameters A and b on the estimation of precipitation intensity R derived from radar reflectivity data. It is important to emphasize that this study does not involve validation using ground-based measurements, but rather focuses on the comparative effects of varying empirical parameter values.
The results demonstrate that parameters A and b both significantly affected the estimated rainfall intensity. For example, at a reflectivity value of 38.40 dBZ, the difference in R between the RX and RH variants reached 12.44 mm·h−1. Such discrepancies may lead to a misinterpretation of precipitation intensity and could partly explain the underestimation observed when using standard empirical relationships. Furthermore, the sensitivity analysis revealed that variations in the exponent b had a greater impact on estimated R values than equivalent changes in the coefficient A. Specifically, adjusting b from 1.4 to 1.8 (with A kept constant) resulted in differences of 5.05 mm·h−1 and 9.39 mm·h−1, whereas varying A from 150 to 300 (with b constant) led to differences of 3.05 mm·h−1 and 7.39 mm·h−1. These findings suggest that applying a fixed empirical relationship—such as the commonly used Marshall–Palmer formula (A = 200, b = 1.6)—may be insufficient under variable meteorological conditions. The analysis highlights the need for regional calibration of Z–R relationships or the implementation of context-sensitive parameterizations that consider factors such as precipitation intensity, cloud and precipitation types, synoptic situation, and local climatic characteristics. Notably, the highest rainfall estimates were obtained using the RH variant, which may offer a promising direction for addressing underestimation biases associated with traditional relationships.
Future research should consider a broader range of empirical parameters and incorporate actual gauge data, where available, to support comprehensive model validation. The methodology outlined in this study may serve as a basis for the local calibration of weather radar systems and support more accurate precipitation assessments in operational hydrometeorology.
3.7. Spatial Distribution of Radar Data in the Study Area
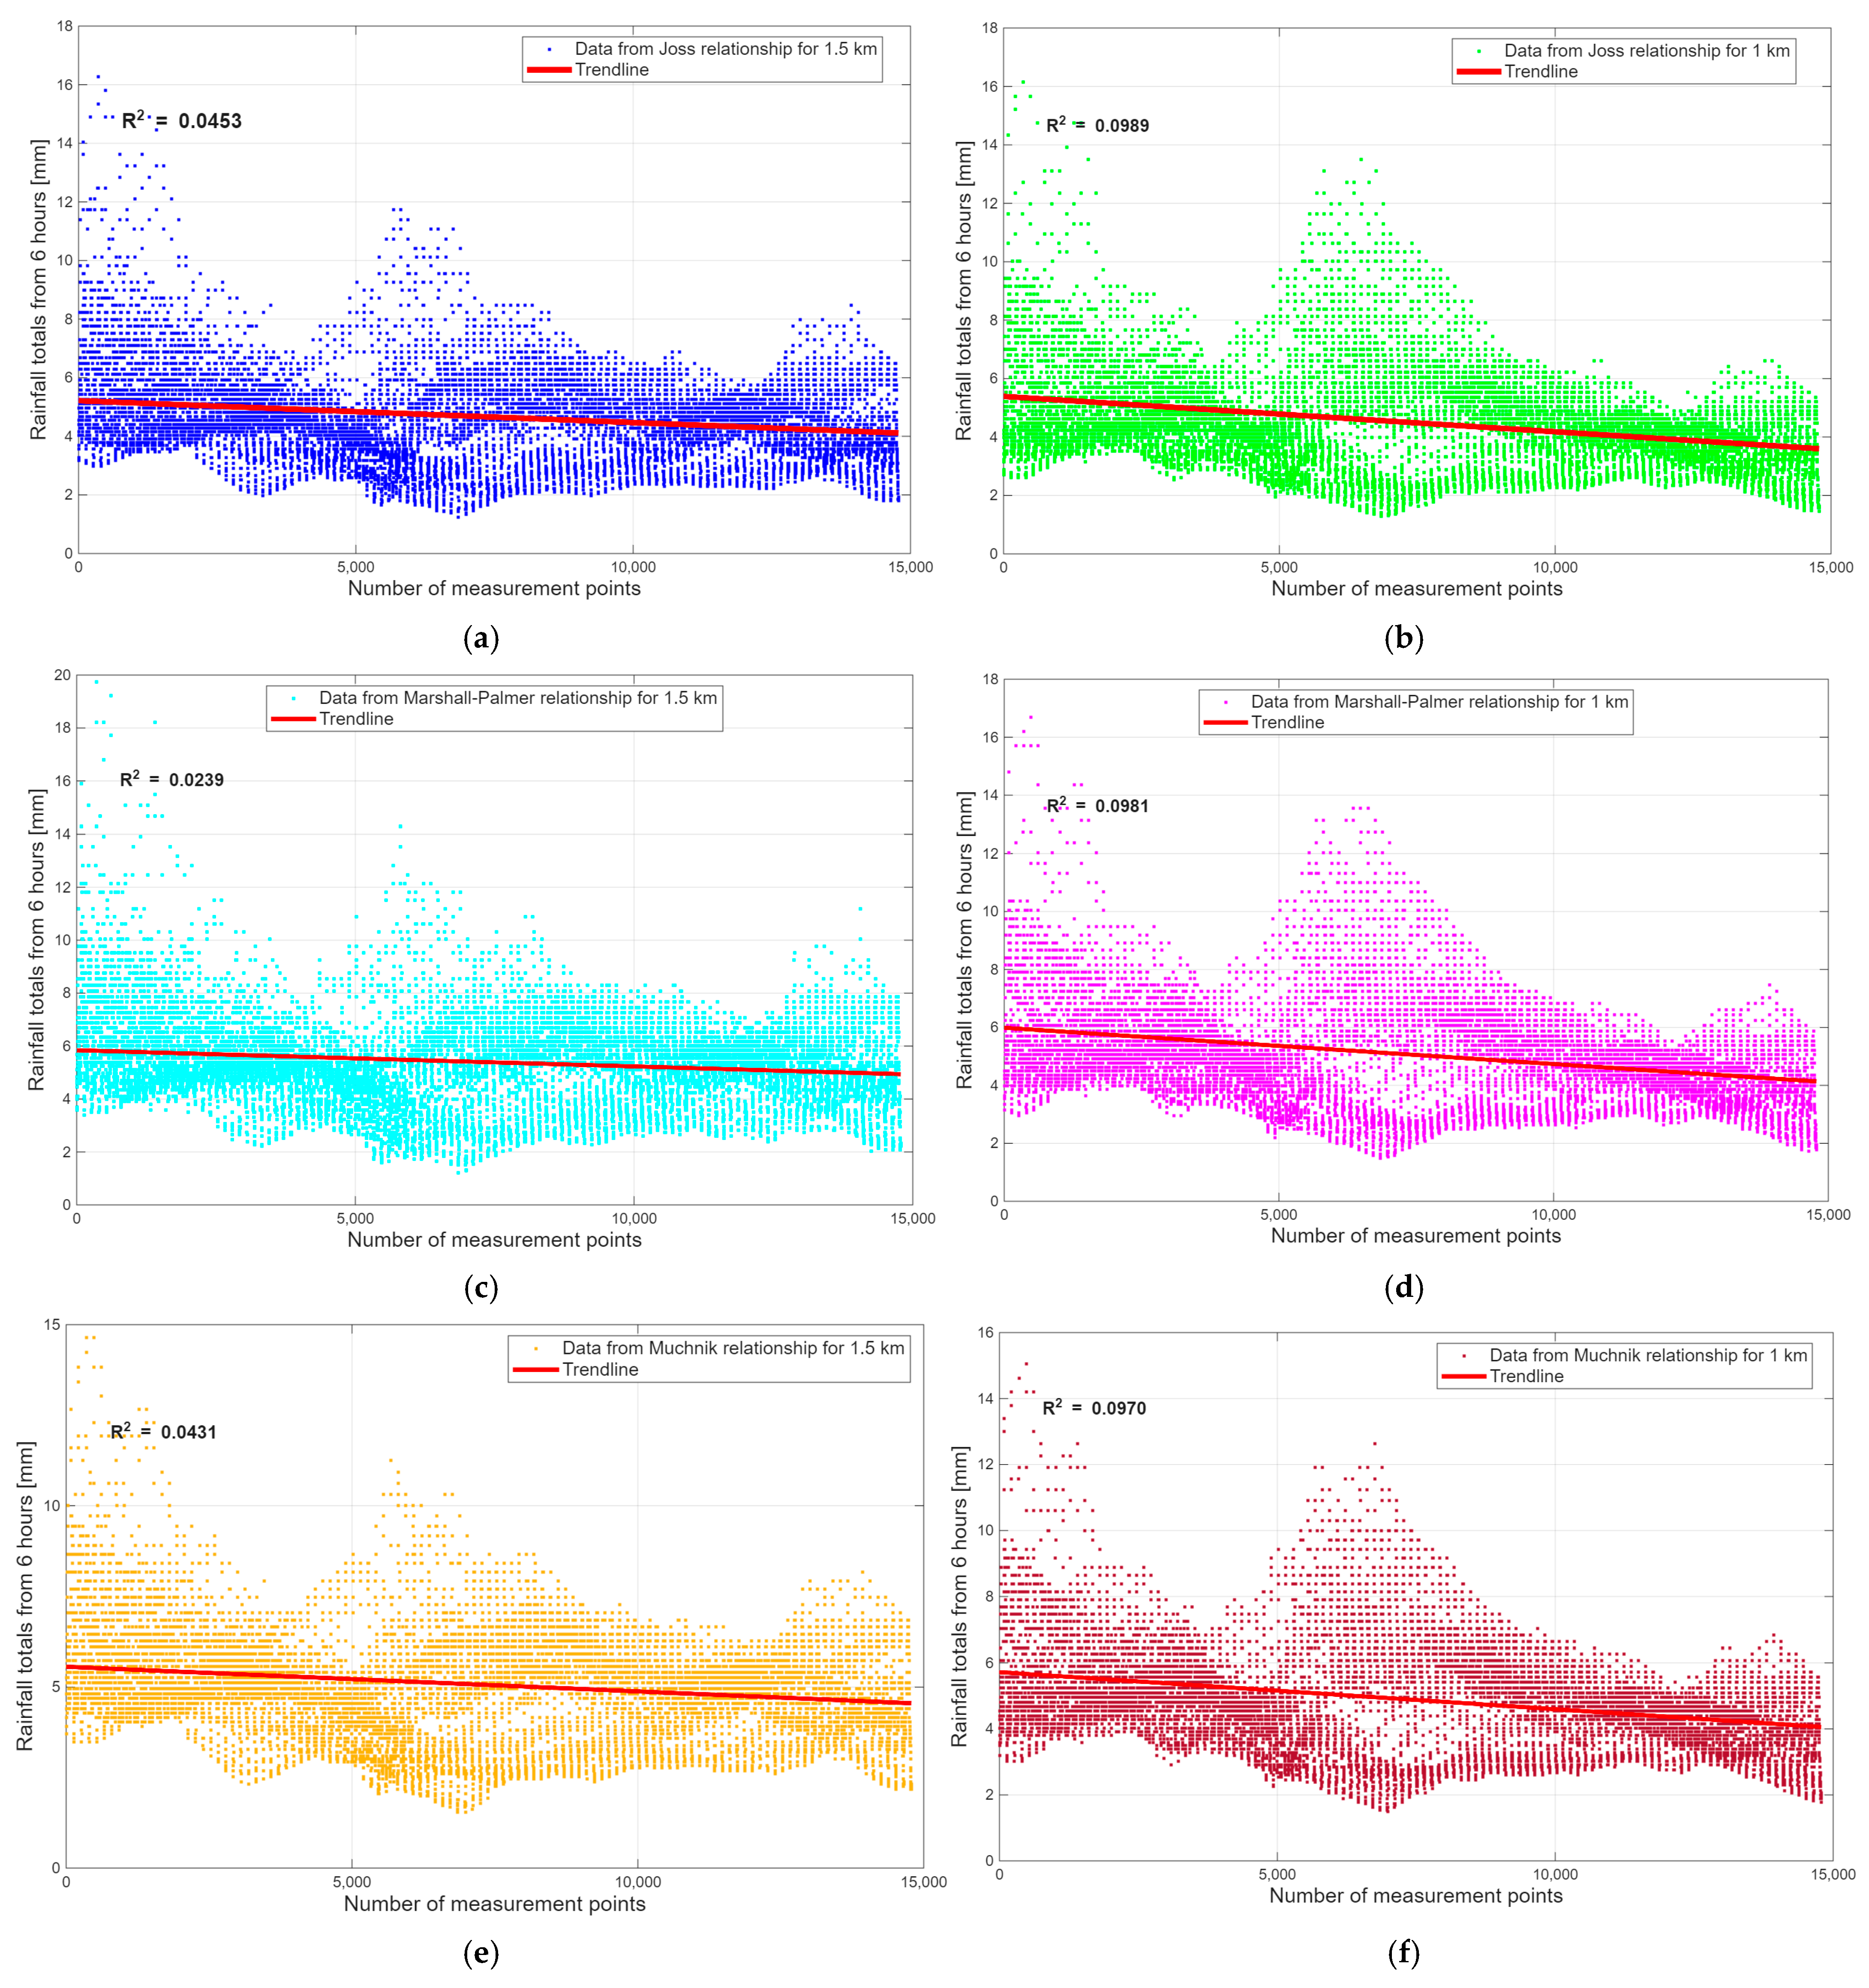
In the study area, 14,784 measurement points were generated from radar measurements for each study relationship at heights of 1 km and 1.5 km above ground level. The distribution of total rainfall was analyzed in the study area.
Figure 14 presents the radar data with a determined trend line. Each graphic shows the coefficient of determination R
2, which is a measure of the fit of the values of the individual data.
The graphics show the distribution of total precipitation values determined from the radar measurements. The results confirm the information reported in other articles on the high temporal and spatial variability of meteorological values, such as water droplets, as shown by radar measurements and their analyses. The coefficient of determination indicates that the radar data for the individual empirical relationships and the height above ground level exhibit minimal fit to the distribution of values in the study area.
Analysis of the R2 values indicates that the strongest correlation was observed when applying the Joss relationship at a height of 1 km. At this altitude, the data consistently yielded the highest R2 values across all tested Z–R relationships, ranging from 0.0239 to 0.0989, reflecting the inherently high temporal and spatial variability of precipitation events. Interestingly, the lowest R2 value was obtained for the Marshall–Palmer relationship at 1.5 km, despite this combination yielding the most accurate precipitation estimates in terms of MAE when compared with rain gauge measurements. This apparent paradox highlights a novel and important observation: a high correlation does not necessarily imply a high estimation accuracy, particularly for atmospheric variables such as rainfall, which are characterized by substantial variability and intermittency. This insight underscores the importance of using multiple evaluation metrics—such as both correlation coefficients and absolute error measures—when assessing the performance of radar-derived precipitation estimates.
These findings are not only methodologically significant, but also of considerable practical value. They provide new insights into the ongoing discourse on the limitations of Z–R correlation-based validation and advocate for a more comprehensive framework for evaluating radar-derived rainfall products. The results have broad implications for the advancement of precipitation monitoring systems, particularly in meteorology, hydrology, and early warning flood systems. Moreover, the study’s focus on height-dependent reflectivity analysis and the comparative evaluation of classical Z–R relationships offers a replicable model for operational radar networks and climate observation platforms worldwide. Such insights support both scientific progress and the implementation of more robust radar-based rainfall estimation methods in decision-making processes relevant to disaster risk reduction.
4. Discussion
This study presents a comparative analysis of radar precipitation data and direct measurements of precipitation amounts taken at meteorological stations. The empirical relationships between radar reflectivity and precipitation intensity developed by Muchnik, Joss, and Marshall–Palmer were used to determine precipitation totals over six hours.
The differences between the values of radar precipitation data determined from the three empirical relationships do not exceed a value of 1 mm. Therefore, for radar reflectivity at a height of 1 km above ground level, the differences are lower (range of 0.45–0.94 mm) than those at a height of 1.5 km (range of 0.51–0.98 mm).
In the case of rainfall of a few millimeters, regardless of the relationship used, the radar data values obtained are smaller than the direct measurements. The differences are 0.65 –2.68 mm for data obtained at a height of 1 km and 0.54 –1.83 mm for 1.5 km.
However, for precipitation heights reaching several millimeters, the differences between radar and direct measurements are significant, ranging from 6.24 mm to 7.18 mm for data obtained at a height of 1 km and from 6.66 mm to 7.64 mm for data obtained at a height of 1.5 km, respectively.
A comparison of the precipitation totals determined from the three empirical relationships shows that, using the Marshall–Palmer relationship, the differences between radar data and direct measurements are the smallest, ranging from 0.54 mm to 6.66 mm. The average difference between radar and direct values using the Marshall–Palmer relationship for data obtained at a height of 1 km is 2.32 mm, and that for data obtained at a height of 1.5 km is 1.99 mm. It should be noted that regardless of the relationship used and the level of data, radar measurements have lower values than direct measurements. The analysis also reveals that the rainfall totals determined for the 1.5 km data are higher than those for the 1 km data. These findings support the appropriateness of using 1.5 km data, particularly under heavy rainfall conditions, to minimize measurement errors.
Among the selected meteorological stations, regardless of the relationship used, the results closest to the real ones are obtained for the station in Rzeszów, where there was 6 mm of precipitation. The average deviation of the radar data is 0.93 mm. For the station at which the highest precipitation was measured (Tarnów—17 mm), the average difference in values from radar measurements against direct measurements is 7.03 mm. This leads to the conclusion that the higher the precipitation, the greater the deviation of the radar data from the actual values.
These results are compared with those presented in other articles. They confirm the fact that both convection and local factors influence the micro-physical processes of precipitation [
19]. The authors indicate that polarimetric indicators have a higher accuracy than standard relationships between radar reflectivity and precipitation intensity. In this study, the r value was 0.95 for the Marshall–Palmer relationship. The authors also conducted a study based on the value of KDP (specific differential phase) and ZDR (differential reflectivity). The results of this research show that the highest value was for (KDP, ZDR) at 0.99. In our studies using various empirical relationships, the r value was 0.98, which confirms the correlation between radar data and rain gauge measurement.
Nevertheless, the radar precipitation data are verified using actual measurements from weather stations that record total precipitation [
8,
9,
10,
11,
19]. Other studies indicate that radar measurements obtained over short time scales are the most interesting. In the case of short-lived precipitation, uncertainties are minimal due to the significantly lower spatial correlation of these events [
26]. This confirms that our research on precipitation totals determined over 6 h is reliable.
The analysis of the radar data performed using MATLAB R2025a (MATrix LABoratory) confirms the high temporal and spatial variability of radar data, which has also been described in other articles [
3,
4,
73,
74,
75]. The determined values of R
2 are in the range of 0.0239–0.0989, demonstrating the wide variability of the data and the specificity of the raindrop distribution. Interestingly, the smallest R
2 value (0.0239) is noted for the Marshall–Palmer relationship for data at 1.5 km, which exhibits the smallest deviations from the rain gauge system measurements. Therefore, the selection of a suitable empirical relationship is crucial for radar measurements of precipitation due to their high temporal and spatial variability [
4,
18].
Articles [
8,
9,
10,
11] have also demonstrated that radar data show some underestimation in precipitation, both in terms of occurrence and intensity. This is caused by collision and coalescence processes that occur during precipitation [
10]. However, these studies were conducted in China using radar data from the S, C, and X bands. In our research, we used data from the POLRAD network, in which radars operate only in the C band, which imposes certain limitations.
Articles that studied data from Brazil [
3,
4,
5,
6,
9] also highlighted the validity of conducting research on the relationship between radar reflectivity and precipitation intensity. Establishing the Z–R relationship allows deviations to be minimized, especially in cases where radar reflectivity values are below 40 dBZ for the selected region. In these studies, MAE and RMSE were also used to evaluate data. The RMSE values were approximately 2, whereas the MAE ranged from approximately 0.4 to 5. Studies of Z–R relationships that have been conducted in other countries (e.g., China, Greece, Malaysia, South Korea, and Thailand) indicate the validity of conducting analysis on standard data and conducting quality control on the empirical relationships used. No such studies have been conducted to date in our country (Poland). This research makes it possible to improve the quality of rainfall estimation and can be helpful in emergency situations. The advantage of Z–R dependencies is that they can be matched to the environmental conditions of the country, the season, and the synoptic situation. In addition, they can be applied operationally due to their simplicity and the speed of data processing [
3,
4,
5,
6,
16,
18].
Scientists have conducted extensive research on radar data and Z–R relationships, commonly employing statistical indices to evaluate the accuracy of radar-derived precipitation estimates. In our study, the r index was 0.98. For comparison, the values reported in other articles [
4,
6,
8,
9] range from 0.20 to 0.91—specifically, 0.69–0.91, 0.857–0.912, 0.7, and approximately 0.2–0.8, respectively. Despite the variability across studies, these consistently high values suggest a strong agreement between radar measurements and reference data. Regarding MAE, articles [
6,
8,
9] report values of 3.51 mm, 0.56 mm, 1–2.5 mm, respectively. In our analysis, the MAE values ranged from 1.99 mm to 2.91 mm, depending on the empirical relationship applied. For RMSE, the values reported in the literature [
4,
6,
9,
73] are approximately 0.5 mm, 4.65 mm, 1.5–2.5, and 1.06–1.85 mm, respectively, whereas our results fell within the range of 3.08–3.63 mm. In some studies [
3,
16], the Bias values were −0.246 mm and 1.5–4 mm, respectively. In our measurements, as also shown in [
16], an average underestimation of −2.48 mm was observed. In our study, the average rBias was −31.86%. However, in some cases reported in [
76], rBias exceeded 800%, while in [
73], the rBias for the Z–R relationships was 11.32%. This indicates a wide range of values, as well as significant temporal and spatial variability, and highlights the strong influence of environmental conditions. One article [
69] also included an analysis of measurements using the NSE, which, for measurements from rain gauges and radars, ranged from 0.23 to 0.83. In our study, the NSE values ranged between 0.39 and 0.56, indicating a comparable model performance within the context of these measurement methods. The R
2 index in our analysis ranged from 0.0239 to 0.0989, whereas reference [
9] reported values of 0.0979–0.1417, highlighting the substantial spatial variability of radar-derived precipitation. Additionally, one study [
14] reported an average discrepancy of 3.33 mm between radar estimates and rain gauge observations. In comparison, our study yielded a lower average difference of 2.49 mm, with individual discrepancies ranging from 1.99 mm to 2.91 mm across the evaluated relationships.
The empirical Z–R relationship, which links radar reflectivity (Z) to rainfall rate (R), remains a widely used method due to its simplicity and ease of implementation. Its main advantages include straightforward application in operational radar systems and relatively low computational requirements. However, the Z–R relationship is inherently limited by its empirical nature. It is sensitive to variability in drop size distributions, rainfall types, and local environmental conditions, often resulting in under- or overestimations of precipitation—particularly in complex meteorological scenarios. Recent advances in radar meteorology have introduced machine learning algorithms and dual-polarization radar techniques as promising alternatives. Machine learning approaches are capable of capturing nonlinear relationships and adapting to local rainfall characteristics, offering the potential for improved estimation accuracy. Dual-polarization radar provides enhanced microphysical insight, enabling the more accurate identification of precipitation types and the correction of systematic biases. Despite these advantages, modern methods also present challenges: they require more advanced data processing capabilities, greater computational resources, and access to large, high-quality training datasets. These demands may limit their practical implementation in real-time operational settings. Nevertheless, the integration of machine learning and dual-polarization techniques with traditional Z–R methods holds considerable promise for enhancing precipitation estimation and improving the quality of hydrometeorological applications.
In further studies, it will be crucial to conduct analyses using both empirical relationships for reflectivity data from different heights and dual-polarimetric variables such as ZDR and KDP. Data from rain gauge systems and radar data from two radars will also be applied.
5. Conclusions
Radar data were statistically analyzed using the Pearson correlation coefficient (r), RMSE, rRMSE, Bias, rBias, NSE, and MAE. Across all examined empirical relationships and measurement altitudes, the Pearson correlation coefficient consistently reached a high value of 0.98, indicating a strong agreement with in situ observations and a robust correlation under varying conditions.
The RMSE values represent the average deviation between radar-derived estimates and actual observations, serving as an indicator of prediction accuracy. Among the evaluated relationships, the largest average deviation (3.60 mm) was associated with the Joss relationship, whereas the smallest (3.08 mm) was observed for the Marshall–Palmer relationship. The RMSE values were slightly lower at the 1 km measurement level (3.38 mm) compared to the 1.5 km level (3.42 mm). Overall, the RMSE values were higher than the measurement deviations during the field survey.
The rRMSE is a commonly used metric for evaluating the relative accuracy of model estimates compared to reference observations. It provides a normalized measure of error magnitude, expressed as a percentage of the observed values, which allows for meaningful comparisons across datasets with varying scales. In this study, the average rRMSE was 43.68%, indicating a substantial deviation between radar-based precipitation estimates and rain gauge measurements. This level of error suggests that, while radar data effectively capture general precipitation patterns, there are significant discrepancies in their estimations of absolute rainfall amounts. The relatively high rRMSE underscores the challenges in accurately quantifying precipitation using radar data alone. It also highlights the importance of implementing correction techniques or integrating radar data with ground-based observations to improve the reliability of precipitation assessments.
Bias and rBias are statistical indicators commonly used to assess the systematic error between modeled or remotely sensed data and reference measurements. Bias quantifies the average absolute difference, indicating whether a model consistently overestimates or underestimates the observed values. In contrast, rBias expresses this deviation as a percentage relative to the reference values, enabling more meaningful comparisons across datasets with different magnitudes. In this study, the average Bias between radar-based precipitation estimates and rain gauge measurements was −2.48 mm, while the corresponding rBias was −31.86%. These negative values indicate a consistent underestimation of precipitation by the radar compared to the ground-based observations. These findings highlight a systematic underestimation inherent in radar-derived precipitation data, which may result from environmental factors, spatial heterogeneity, or algorithmic limitations in radar retrieval methods.
The NSE values obtained for the different parameterizations and measurement heights indicate varying degrees of model performance. For the Marshall–Palmer relationship, the NSE values were relatively high and identical at both heights—0.56 for 1 km and 1.5 km, suggesting a consistent and moderate predictive skill of this parameterization across these altitudes. In contrast, the Joss relationship yielded lower NSE values of 0.41 at 1 km and 0.39 at 1.5 km, indicating a weaker model performance and less reliability in reproducing observed data, especially as the altitude increases. The Muchnik relationship showed slightly better results than Joss but still below those of Marshall–Palmer, with NSE values of 0.44 at 1 km and 0.42 at 1.5 km, suggesting a moderate but not strong model efficiency. Overall, the NSE values decreased slightly with height for Joss and Muchnik, while remaining stable for Marshall–Palmer, which might reflect differences in how these parameterizations capture precipitation characteristics at different altitudes.
Analysis of the MAE shows (in line with RMSE) that the average error of radar values was the smallest using the Marshall–Palmer relationship, at approximately 2.16 mm. The MAE, in contrast to the RMSE, indicated that smaller differences between the radar measured values and the actual data occurred for 1.5 km data, on average, with a value of 2.37 mm (for data at 1 km, this was 2.60 mm). Interestingly, the MAE value at a height of 1.5 km using the Marshall–Palmer relationship was 1.99 mm, which is the same as the difference between radar and direct measurement values determined in the study. This suggests that the MAE may be reliable for evaluating radar data.
To evaluate the performance and reliability of radar-based precipitation estimates in comparison to ground-based rain gauge measurements, a set of statistical indicators was applied, including Pearson correlation, RMSE, rRMSE, Bias, rBias, NSE, and MAE. These metrics provided a comprehensive assessment of both the accuracy and systematic deviation of the radar estimates. The analysis of temporal and seasonal variability in these statistical scores revealed that radar performance was significantly influenced by changing atmospheric and environmental conditions, such as differences between convective and stratiform rainfall or seasonal shifts in precipitation patterns. Notably, increased errors and a tendency toward underestimation—reflected in the Bias and rBias values—were observed during specific periods. This underscores the importance of incorporating temporal dynamics into the quality assessment of radar data. These findings carry important implications for operational rainfall forecasting and mapping. They highlight the need for the seasonal calibration and correction of radar-derived precipitation products to ensure their reliability in hydrometeorological applications and real-time decision making. Accurate precipitation mapping requires not only the careful identification and quantification of radar-related errors, but also the integration of these insights into operational workflows. In this context, meteorologists can effectively use radar-based precipitation analyses to support informed and timely decision making.
A spatiotemporal analysis of precipitation variability associated with a meteorological structure was conducted. To assess the accuracy of precipitation estimates, several statistical indicators were employed, including MAE, RMSE, rRMSE, Bias, and rBIAS. The study of precipitation distribution is a significant area of research in meteorology and hydrology. In particular, the movement of meteorological structures over a measurement area can lead to substantial differences in recorded precipitation amounts, impacting both forecast accuracy and the effectiveness of early warning systems. In this study, such variability was examined using data from five measurement stations alongside radar-based precipitation estimates derived from the following empirical relationships: Marshall–Palmer, Muchnik, and Joss. Radar data were collected at altitudes of 1 km and 1.5 km above ground level. The station in Rzeszów exhibited the lowest MAE and RMSE values, as well as the lowest Bias (0.93 mm, 0.97 mm, and −0.93 mm, respectively), indicating that the radar-derived precipitation data at this site most accurately reflect the observed rainfall totals. This can be primarily attributed to the station’s proximity to the meteorological radar, which reduces radar signal degradation and results in more precise measurements. Conversely, the highest errors and greatest Bias and rBias (−7.03 mm and −41.37%, respectively) values were observed at the Tarnów station, located farthest from the radar and recording the highest precipitation amounts. The distance from the radar, combined with potential local terrain effects—such as signal obstruction and complex topography—likely contributes to the decreased quality of radar data and systematic underestimation of precipitation in this area. The stations in Krosno, Lesko, and Przemyśl demonstrated moderate error levels but showed a clear tendency toward underestimating rainfall totals. It is noteworthy that the rRMSE values exceeding 30% at these locations suggest a limited reliability of radar data for accurately capturing precipitation, particularly during localized and intense events.
The results of the spatiotemporal analysis of precipitation reveal significant variability in both intensity and the movement of meteorological structures across the study area. These findings highlight the importance for operational meteorologists—particularly those engaged in hazard monitoring—to account for atmospheric physical processes when interpreting observational data. Weather radars, widely used in operational meteorology due to their high temporal resolution and broad spatial coverage, are a primary tool for precipitation monitoring. However, this study demonstrates that radar-derived precipitation estimates should be interpreted in conjunction with point-based rain gauge measurements. This is especially critical during localized and intense precipitation events, where the volumetric nature of radar observations may lead to considerable estimation errors compared to ground-based measurements. The analysis confirms that accounting for the spatiotemporal variability of precipitation, particularly as influenced by the movement of meteorological systems, has significant practical implications in operational meteorology, hydrology, and risk management. It enhances short-term precipitation forecasting (nowcasting), which is essential during rapidly evolving weather events such as severe thunderstorms or heavy downpours. Furthermore, it supports the effectiveness of early warning systems by enabling the faster identification of high-risk areas, thereby improving the preparedness and response capacities of emergency services and crisis management authorities. Integrating radar and rain gauge data—with explicit consideration of their spatial and temporal characteristics—also enables the more accurate calibration and correction of radar precipitation products, ultimately improving their reliability. This approach holds value not only for hydrological modeling, but also for precision agriculture, where accurate, high-resolution meteorological information is crucial for informed decision making.
A comparative analysis of radar-based and rain gauge precipitation measurements at heights of 1 km and 1.5 km was conducted using 95% confidence intervals and the bootstrap method. At a 1.5 km altitude, the average difference was −2.37 mm, with a 95% confidence interval of ±3.38 mm, indicating that the true difference may range approximately from −5.77 mm to +1.03 mm. At a 1 km altitude, the average difference was slightly larger at −2.60 mm, with a 95% confidence interval of ±2.99 mm, corresponding to a range from −5.59 mm to +0.39 mm. Although the mean values indicate a systematic underestimation of precipitation by the radar, the presence of positive values within the confidence intervals suggests the possibility of overestimation in some cases. These findings highlight not only the variability of measurement error, but also emphasize the critical need for the routine, site-specific calibration and seasonal adjustment of radar parameters. Implementing such calibrations would enhance the operational accuracy of radar-based precipitation estimates, particularly under varying synoptic and local climatic conditions, thereby improving their reliability for hydrometeorological applications. To quantitatively assess measurement uncertainty, the bootstrap method was applied, which is particularly suitable for precipitation data, as it does not require the assumption of normality. The comparative analysis of radar-based and rain gauge precipitation measurements at heights of 1 km and 1.5 km revealed a systematic underestimation of rainfall by the radar system. At a height of 1 km, the average difference was −2.60 mm, with a 95% confidence interval estimated by bootstrapping as (−4.73 mm, −1.21 mm). At a height of 1.5 km, the average difference was −2.37 mm, with a 95% bootstrap confidence interval of (−4.84 mm, −1.03 mm). Both confidence intervals lie entirely below zero, indicating statistical significance and confirming that the radar consistently underestimated precipitation compared to the gauge measurements. These ranges not only reflect the magnitude of the average Bias, but also its consistency across the analyzed locations and altitudes. These findings are important for the interpretation and calibration of radar data in hydrological and meteorological applications, suggesting the need to account for systematic corrections in radar-based precipitation estimates.
Radar rainfall data were used to generate customized maps in ArcGIS with contributed isohyets of rainfall totals over 6 h. The developed maps can be used in emergency management centers for flood risk situations. When rainfall maps are combined with soil maps, it is possible to assess the passability of the terrain for the purpose of securing both land transport and ground military operations.
The most important findings of this study highlight that the numerical parameters used in empirical relationships are crucial for accurate precipitation estimation. The appropriate selection and calibration of these parameters—based on local conditions, precipitation type, and synoptic situations—can significantly improve measurement accuracy while maintaining the simplicity and high temporal resolution of radar-based data. This result is of practical importance and can be implemented operationally to support more effective meteorological and hydrological analyses. In particular, the study confirms that the regular recalibration of empirical Z–R relationships tailored to the local precipitation regimes and radar characteristics is essential for operational radar systems. Such adaptive calibration protocols can bridge the gap between the simplicity of empirical methods and the complex variability of precipitation, providing meteorological services with robust, timely data for decision support. One limitation identified is the occurrence of mixed-phase precipitation, which complicates the selection of suitable empirical relationships. Additionally, our study found that radar data collected at a height of 1.5 km yielded more accurate results for rainfall estimation, suggesting that measurements at this level may be more suitable for operational use. The findings of this study hold significant implications for both scientific research and operational meteorology. Through identifying the empirical Z–R relationships and measurement altitudes that yield the most accurate radar-based precipitation estimates, this study contributes to enhancing the reliability of rainfall measurements obtained from weather radar systems. This is particularly critical in the context of real-time flood forecasting, hydrological modeling, and climate monitoring, where even minor inaccuracies in precipitation data can lead to substantial uncertainties. Furthermore, the strong correlation demonstrated between radar-derived and gauge-based rainfall highlights the potential of a dual-polarization radar as a valuable tool for improving precipitation monitoring networks. These results provide a robust foundation for refining radar calibration procedures and optimizing the implementation of radar data into operational weather services.
The methodology developed in this study will be utilized to formulate standardized calibration and validation procedures for the entire POLRAD network, encompassing ten radars with diverse environmental settings. This approach acknowledges that regional variability in precipitation characteristics requires site-specific parameter adjustments to optimize radar performance. Successful implementation across the network could serve as a model for other countries with similar radar infrastructures, thereby enhancing the accuracy and operational utility of radar-based precipitation estimates on a broader scale.
In further work, studies will also be performed under situations of mixed precipitation (e.g., rain with snow) and solid precipitation (e.g., snow or hail). An important issue will be the development of new procedures to determine radar precipitation data in the presence of heavy rainfall, including torrential rainfall. It is recommended to investigate a wider range of numerical parameters used in empirical formulas, considering data from various altitudes and incorporating both rain gauge observations and dual-polarization radar data. This approach could further enhance the reliability and applicability of radar-based precipitation estimates. Overall, this study underscores the importance of dynamic and location-specific calibration strategies to fully harness the potential of radar precipitation data in operational meteorology. Future work aiming to integrate dual-polarization radar features and machine learning approaches, combined with empirical relationship refinement, holds promise for extending these findings to more complex meteorological scenarios and larger radar networks, thus improving flood forecasting, water resource management, and emergency response capabilities. This scalable approach will enhance the robustness of radar precipitation products across different climatic regions and operational contexts.
