Abstract
This study proposes a practical integration of an existing deep learning model (YOLOv9-E) and social participation GIS using multi-source remote sensing data to identify asbestos-containing materials located on the side of a building affected by light occlusions. These objects are often undetectable by traditional vertical or oblique photogrammetry, yet their precise localization is essential for effective removal planning. By leveraging the mobility and responsiveness of citizen investigators, we conducted fine-grained surveys in community spaces that were often inaccessible using conventional methods. The YOLOv9-E model demonstrated robustness on mobile-captured images, enriched with geolocation and orientation metadata, which improved the association between detections and specific buildings. By comparing results from Google Street View and field-based social imagery, we highlight the complementary strengths of both sources. Rather than introducing new algorithms, this study focuses on an applied integration framework to improve detection coverage, spatial precision, and participatory monitoring for environmental risk management. The dataset comprised 20,889 images, with 98% being used for training and validation and 2% being used for independent testing. The YOLOv9-E model achieved an mAP50 of 0.81 and an F1-score of 0.85 on the test set.
1. Introduction
Some important objects affected by light occlusion cannot be detected by overhead remote sensing techniques, which is a shortcoming of these techniques. Several auxiliary methods that require a vast number of resources and budgets have been applied to elaborate on the completeness of the database.
To understand the full scope of the problem that we aim to address, it is crucial to acknowledge the pervasive nature of asbestos. Asbestos fiber has been widely used in materials since the early 20th century owing to its advantageous properties, such as softness, insulation, and low cost. However, reports from the 1930s to the 1960s linked asbestos to lung cancer, mesothelioma, and asbestosis [1,2,3]. Consequently, the IARC classified asbestos as a group 1 carcinogen in the 1970s–1980s [4], leading to its gradual reduction and global ban. Since 2000, Taiwan has progressively prohibited asbestos-containing products, with minimal production being achieved by 2019. Exposure risks persist during mining, processing, usage and demolition.
This study focuses on detecting asbestos tiles on building roofs and sides. Despite these bans, many old buildings still contain significant amounts of asbestos tiles, posing environmental and health hazards upon aging and breakage. Accurate distribution mapping is crucial for achieving effective control. Remote sensing was the primary survey method. Existing studies on roof asbestos tile distribution have utilized satellite and aerial imagery using methods such as spectral analysis, machine learning (SVM and random forest), and deep learning (CNN) [5,6,7,8,9]. Some studies have also compared model performance between SVM and CNN approaches for hyperspectral image classification [10]. In 2022, Yu et al. successfully mapped approximately 230,000 asbestos tile roofs across Taiwan and Penghu using multisource imagery and machine learning [11], thereby providing vital distribution data.
However, these studies mainly addressed roof asbestos tiles [12,13,14], overlooking the side of the building. Surveying buildings presents challenges owing to irregular shapes in imagery from varying orientations and environmental obstructions, poor lighting, and occlusions from vegetation and structures, complicating remote sensing. In contrast, manual ground surveys offer higher accuracy for irregularly oriented asbestos tiles but suffer from inefficiency and inconsistent accuracy.
To overcome these limitations, this study presents an applied integration of deep-learning models, specifically YOLO, with social participation [15]. The goal is not to propose new algorithms but to demonstrate how existing AI tools can be practically deployed to support grassroots-level environmental investigations. Mobile phone images provided by social participation were used for asbestos tile recognition with a mobile app, and location data were logged for coverage verification. The use of geotagged and orientation-aware imagery significantly improved the identification of overlooked areas when overlaid with Google Street View or Taiwan’s Building Inquiring GIS. This approach enables a more comprehensive spatial analysis of asbestos tile distribution, especially in visually restricted areas, such as vertical façades.
To structure the scope of our applied integration approach and guide our evaluations, we propose the following research questions:
- Can the integration of AI-based object detection with community-contributed imagery improve the identification of asbestos-containing materials in urban environments affected by visual occlusions?
- How effectively can participatory GIS, when combined with multi-source remote sensing data, support the spatial mapping of asbestos-containing materials in built environments?
- Is YOLOv9-E suitable for real-time inference and mobile deployment using imagery captured through social participation?
These questions reflect our core hypothesis that integrating AI models, participatory GIS, and remote sensing imagery can enhance the monitoring and mapping of asbestos-related environmental risks under occlusion and visual complexity.
2. Materials and Methods
2.1. Data Collection and Processing
This study employed YOLOv9-E as a deep learning model for image recognition of asbestos tiles. To ensure the accuracy and robustness of the AI model across diverse scenarios, we utilized a multisource image acquisition strategy incorporating Google Street View imagery, mobile phone photography, and drone photography.
Google Street View images were obtained via the Static API between January 2024 and March 2025 using parameters such as pitch values of −10 and 45, a fov value of 90, and adjusted heading angles to align with building orientations. Although precise image capture dates by Google are not always available via the API, visual inspection indicates that most images were captured between 2021 and 2024, ensuring an acceptable image currency for urban structure identification.
Mobile phone and drone imagery provided supplementary data, capturing asbestos-containing building materials from various angles under different lighting and environmental conditions. This varied dataset was aimed at enhancing the generalization ability of the model for effective and accurate identification in real-world situations. Social participation played a crucial role in rapidly and efficiently collecting a substantial volume of diverse mobile phone images, thereby significantly expanding the training dataset.
For the ground truth data, the “LabelImg” software was used for manual annotation. This process involved labeling the location and category of asbestos tiles within each image, including the position, shape, and size of the material. A data review mechanism was implemented to ensure annotation accuracy and consistency. Furthermore, the ground truth data were categorized based on the building part (e.g., roof and building side) and the image source. This refined categorization facilitates more precise training [16], enabling the model to better differentiate between various types of asbestos-containing building materials.
To maximize the utility of this diverse training dataset, advanced data augmentation techniques were applied. These included random rotations, cropping, and adjustments to brightness and contrast, effectively simulating a wider range of real-world conditions and further enhancing the model’s resilience and performance in image recognition tasks. The spatial distribution of the collected and analyzed imagery was managed and visualized using a GIS platform in Taiwan, allowing for effective spatial analysis of potential asbestos tile locations.
2.2. Establishment, Training, and Validation of Deep Learning Models
2.2.1. Deep Learning Model Selection
This study employed YOLOv9-E as an AI model for image recognition. Rather than modifying the model architecture or training structure, we adopted the YOLOv9-E (enhanced) version as is because of the balance between its high detection accuracy, computational efficiency, and suitability for mobile deployment. Developed by Wang et al., YOLOv9 integrates features such as Programmable Gradient Information (PGI) and Generalized Efficient Layer Aggregation Networks (GELANs), which contribute to its performance [17]. These built-in features improve gradient retention and parameter efficiency, enabling the model to operate effectively in constrained or variable imaging environments typical of citizen-captured data. Therefore, our selection of YOLOv9-E was based on its readiness for real-world application scenarios rather than architectural novelty.
It is important to clarify that this research project was initiated in early 2024 and concluded in April 2025. At the time of model selection, YOLOv9-E was released in February 2024 and offered an optimal balance among performance, efficiency, and real-time applicability on mobile devices, which aligned with our deployment goals. Although more recent object detectors such as YOLOv10 and YOLOv12 have since emerged, our model choice reflects the state of the art available during the active research period. Moving forward, subsequent studies under new funding schemes have considered the adoption of YOLOv12 or other advanced architectures. Thus, our work should be viewed as a snapshot of applied research that uses the most suitable tools available at the time of execution.
The selection of YOLOv9-E is further supported by the technical characteristics of the model. Specifically, YOLOv9 demonstrates strong performance in terms of parameter efficiency and accuracy, which are essential for applications involving variable imaging conditions and limited computational resources. The following considerations are key to our model’s adoption:
- High Accuracy and Efficiency: YOLOv9 achieves competitive detection accuracy with a relatively small number of parameters and a lower computational cost.
- Effective Learning: It offers excellent learning efficiency, even without large-scale pretraining datasets.
- Robustness: YOLOv9’s architecture supports strong generalization under diverse field conditions, including varying lighting and partial occlusion.
Key Technical Innovations
- Programmable Gradient Information (PGI) mitigates information loss in deep networks using a multilevel auxiliary information mechanism with an auxiliary reversible branch, preserving gradient flow and enhancing fine-grained features.
- GELAN supports improved information integration through hierarchical aggregation, enhanced parameter utilization, and a faster inference speed.
YOLOv9-E demonstrated superior performance in terms of parameter efficiency and accuracy compared to the other models. For this study, the YOLOv9-E (enhanced) version was selected because of its high accuracy in identifying asbestos-containing building materials.
2.2.2. Evaluation of Deep Learning Model Effectiveness
This study does not implement collaborative learning techniques such as co-training or multimodal feature fusion. Instead, it emphasizes collaboration by integrating citizen-generated data with AI-assisted detection and GIS analysis for environmental monitoring.
The performance of the trained deep learning model was evaluated by comparing its predictions with ground truth labels on a test dataset. The key evaluation metrics included the following:
- Precision: TP/(TP + FP) (minimizes false positives);
- Recall: TP/(TP + FN) (minimizes false negatives);
- F1-score: 2 * (Precision * Recall)/(Precision + Recall) (balanced metric);
- Accuracy: (TP + TN)/(TP + TN + FP + FN).
The F1-score was the primary evaluation metric, balancing precision and recall for accurate asbestos tile identification. The confidence threshold was adjusted to optimize balance. Future model improvements will focus on maximizing the F1-score to enhance the overall performance in diverse datasets and environments.
2.3. Social Participation Survey of Asbestos Tile
The pros and cons of social participation GIS (public participation GIS/PPGIS) are listed as flowing and integrating community input into spatial decision-making processes, such as urban planning, environmental management, and resource allocation. Table 1 provides a structured overview of the key advantages and limitations of social participation GIS as identified in relevant studies.

Table 1.
Summary of pros and cons of social participation GIS.
The key consideration in applying social participation GIS is that combining targeted invitations with open recruitment can improve representativeness. Using multiple engagement methods (digital and analog) helps include diverse groups and mitigates digital divide issues. Involving experts (e.g., anthropologists) in the design and interpretation of PPGIS can help address issues of bias and data validity [18]. PPGIS is a powerful tool for democratizing spatial decision-making, but its effectiveness depends on careful planning, inclusivity, and a critical analysis of the data collected. This study addressed the challenge of efficiently mapping asbestos tile distribution on the sides of a building by integrating field investigations with social participation. Although mobile phone photography offers advantages over Street View with a higher resolution and access to confined spaces, it traditionally involves high labor costs. Leveraging Taiwan’s strong history of social participation, this research engaged the public to enhance the survey scope and efficiency and to raise public awareness. This approach goes beyond traditional policy promotion, actively involving citizens in data collection and analysis to better understand asbestos tile distribution across Taiwan.
This study incorporated social participation across two key phases, integrated with a deep learning (YOLO)-driven methodology:
- Initial Data Collection: A small group of trained citizens collected images of potential asbestos tiles on building sides and recorded their locations, contributing to the dataset for deep learning model training.
- On-site Investigation: A mobile application powered by the trained YOLO model enables a broader group of citizens to identify and locate asbestos tiles on building sides.
A core component of this research was a mobile application designed to facilitate social participation in an asbestos tile survey. The app empowers citizens to
- Capture and upload images of potential asbestos-containing materials on building sides, directly contributing to the image recognition data.
- Record precise locations using the GPS of their phones, enabling an accurate spatial analysis within the GIS framework.
- Receive guidance and information on asbestos tile identification, ensuring data quality.
- Contribute data to a centralized database, supporting the comprehensive mapping and analysis of asbestos tile distribution in Taiwan.
Mobile applications significantly enhance the efficiency and scalability of asbestos tile surveys, thereby enabling a more comprehensive understanding of the problem and informing targeted mitigation strategies.
2.4. Mobile App Development
This research incorporated a mobile application to facilitate public social participation in identifying asbestos tiles on buildings. The core functions of the app were designed to enhance the efficiency and accuracy of data collection and reporting.
Key App Functions:
- Image Recognition: Users capture photos of suspected materials, and the app employs a deep learning model, specifically YOLO, for rapid image recognition to estimate the likelihood of the presence of an asbestos tile.
- Real-time Location: The app integrates GPS functionality to record the precise locations of photographed materials, enabling accurate spatial analysis within a GIS framework.
- Reporting: Users can upload photos, identification results, and location data, including details regarding the building or other locations. These data are then used to update the central database.
The app streamlines data collection, allowing for a more comprehensive mapping of asbestos tile distribution across Taiwan.
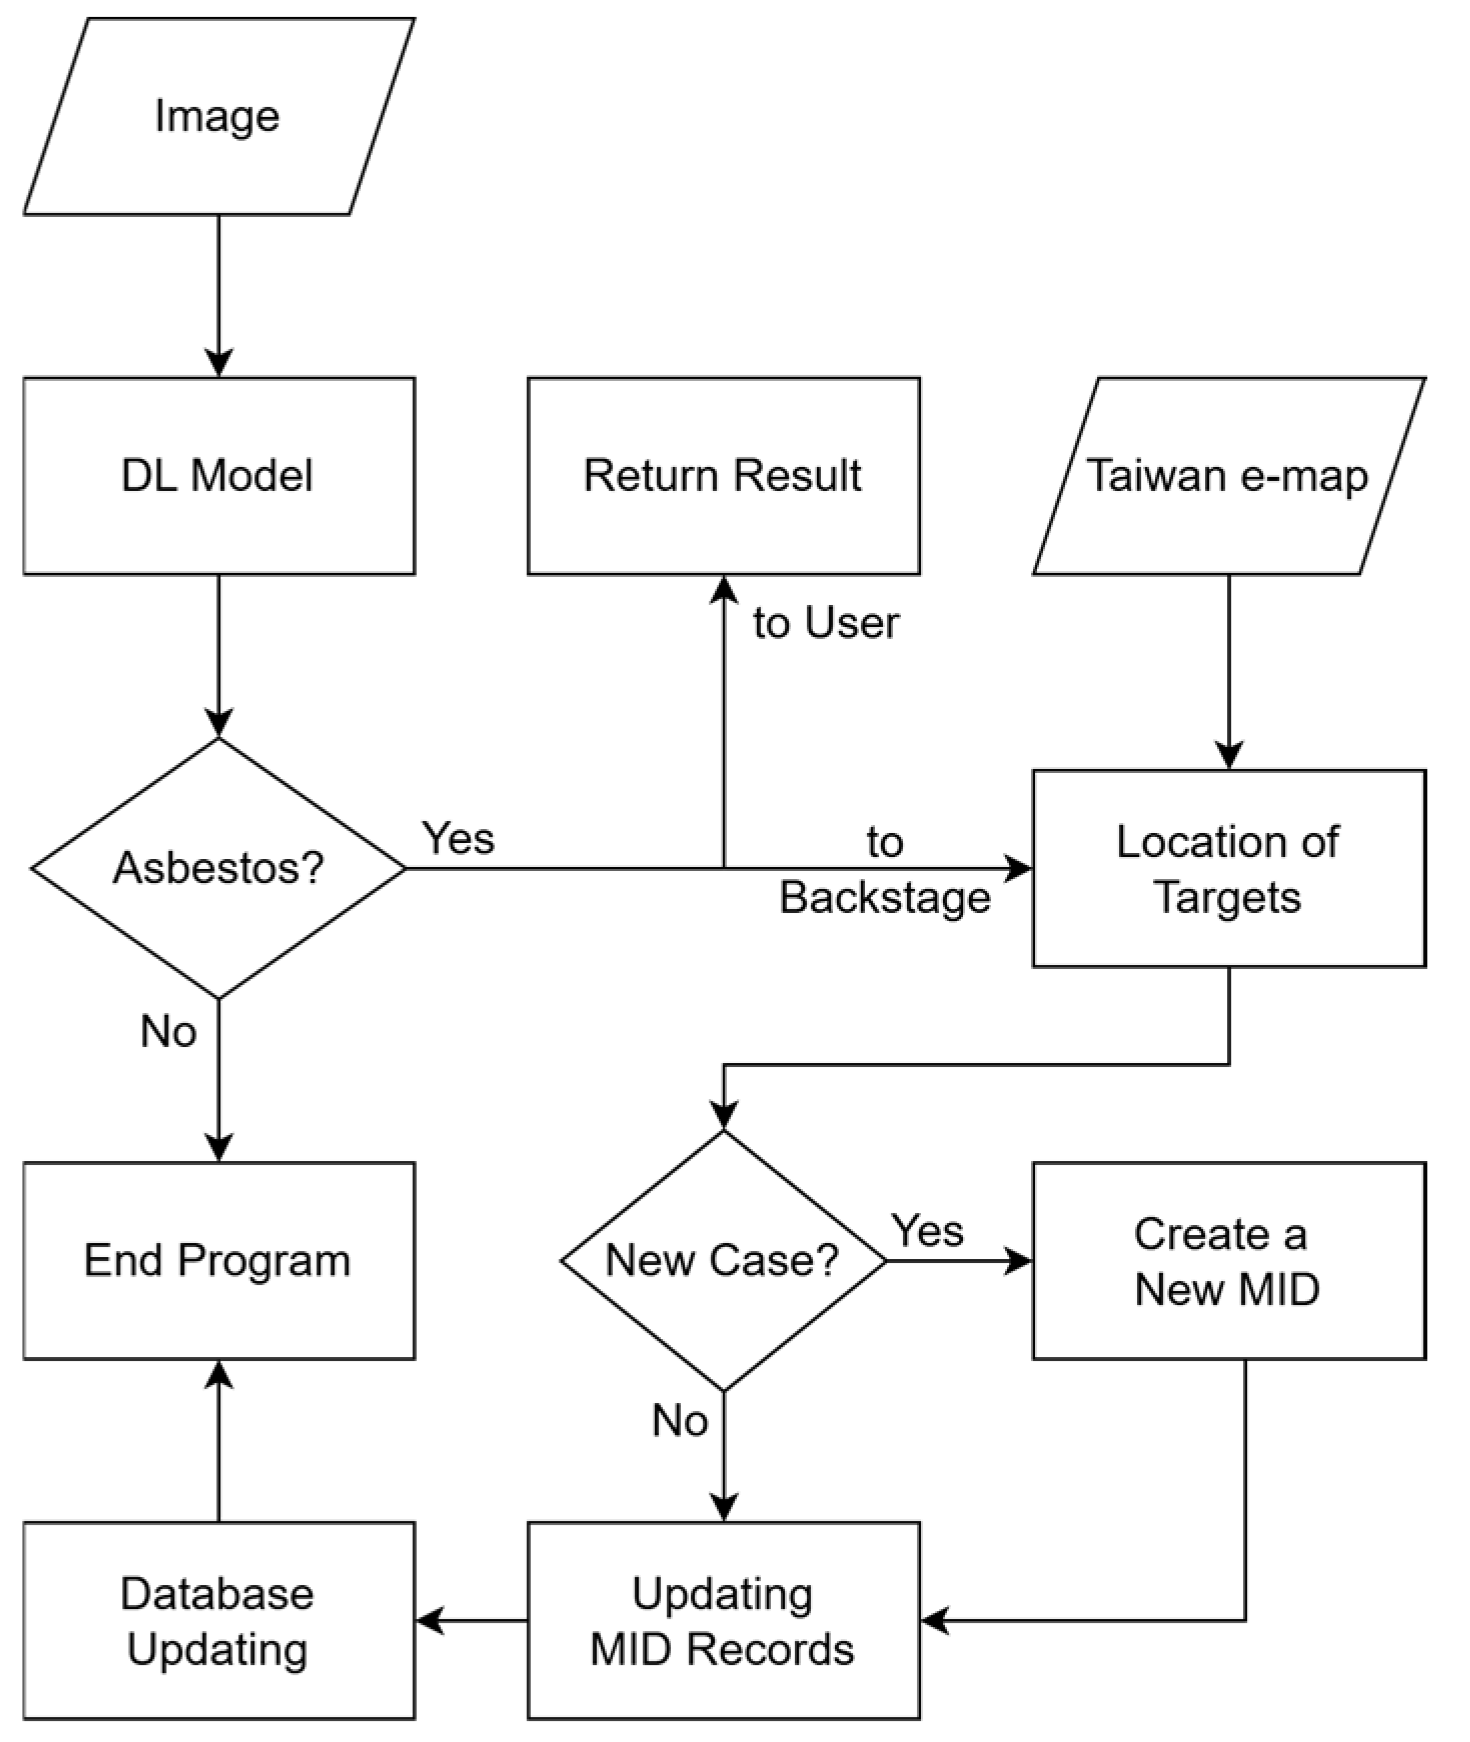
The data handling process of the application is illustrated in Figure 1. When a user submits a photo, the deep learning model processes the image to determine whether an asbestos tile is present. If it is confirmed, the application checks the database. Existing entries are updated, whereas new cases are assigned a unique identifier (MID) and added to the database. This process ensures efficient data management and updating.

Figure 1.
A schematic of the data identification process and database operation of the app.
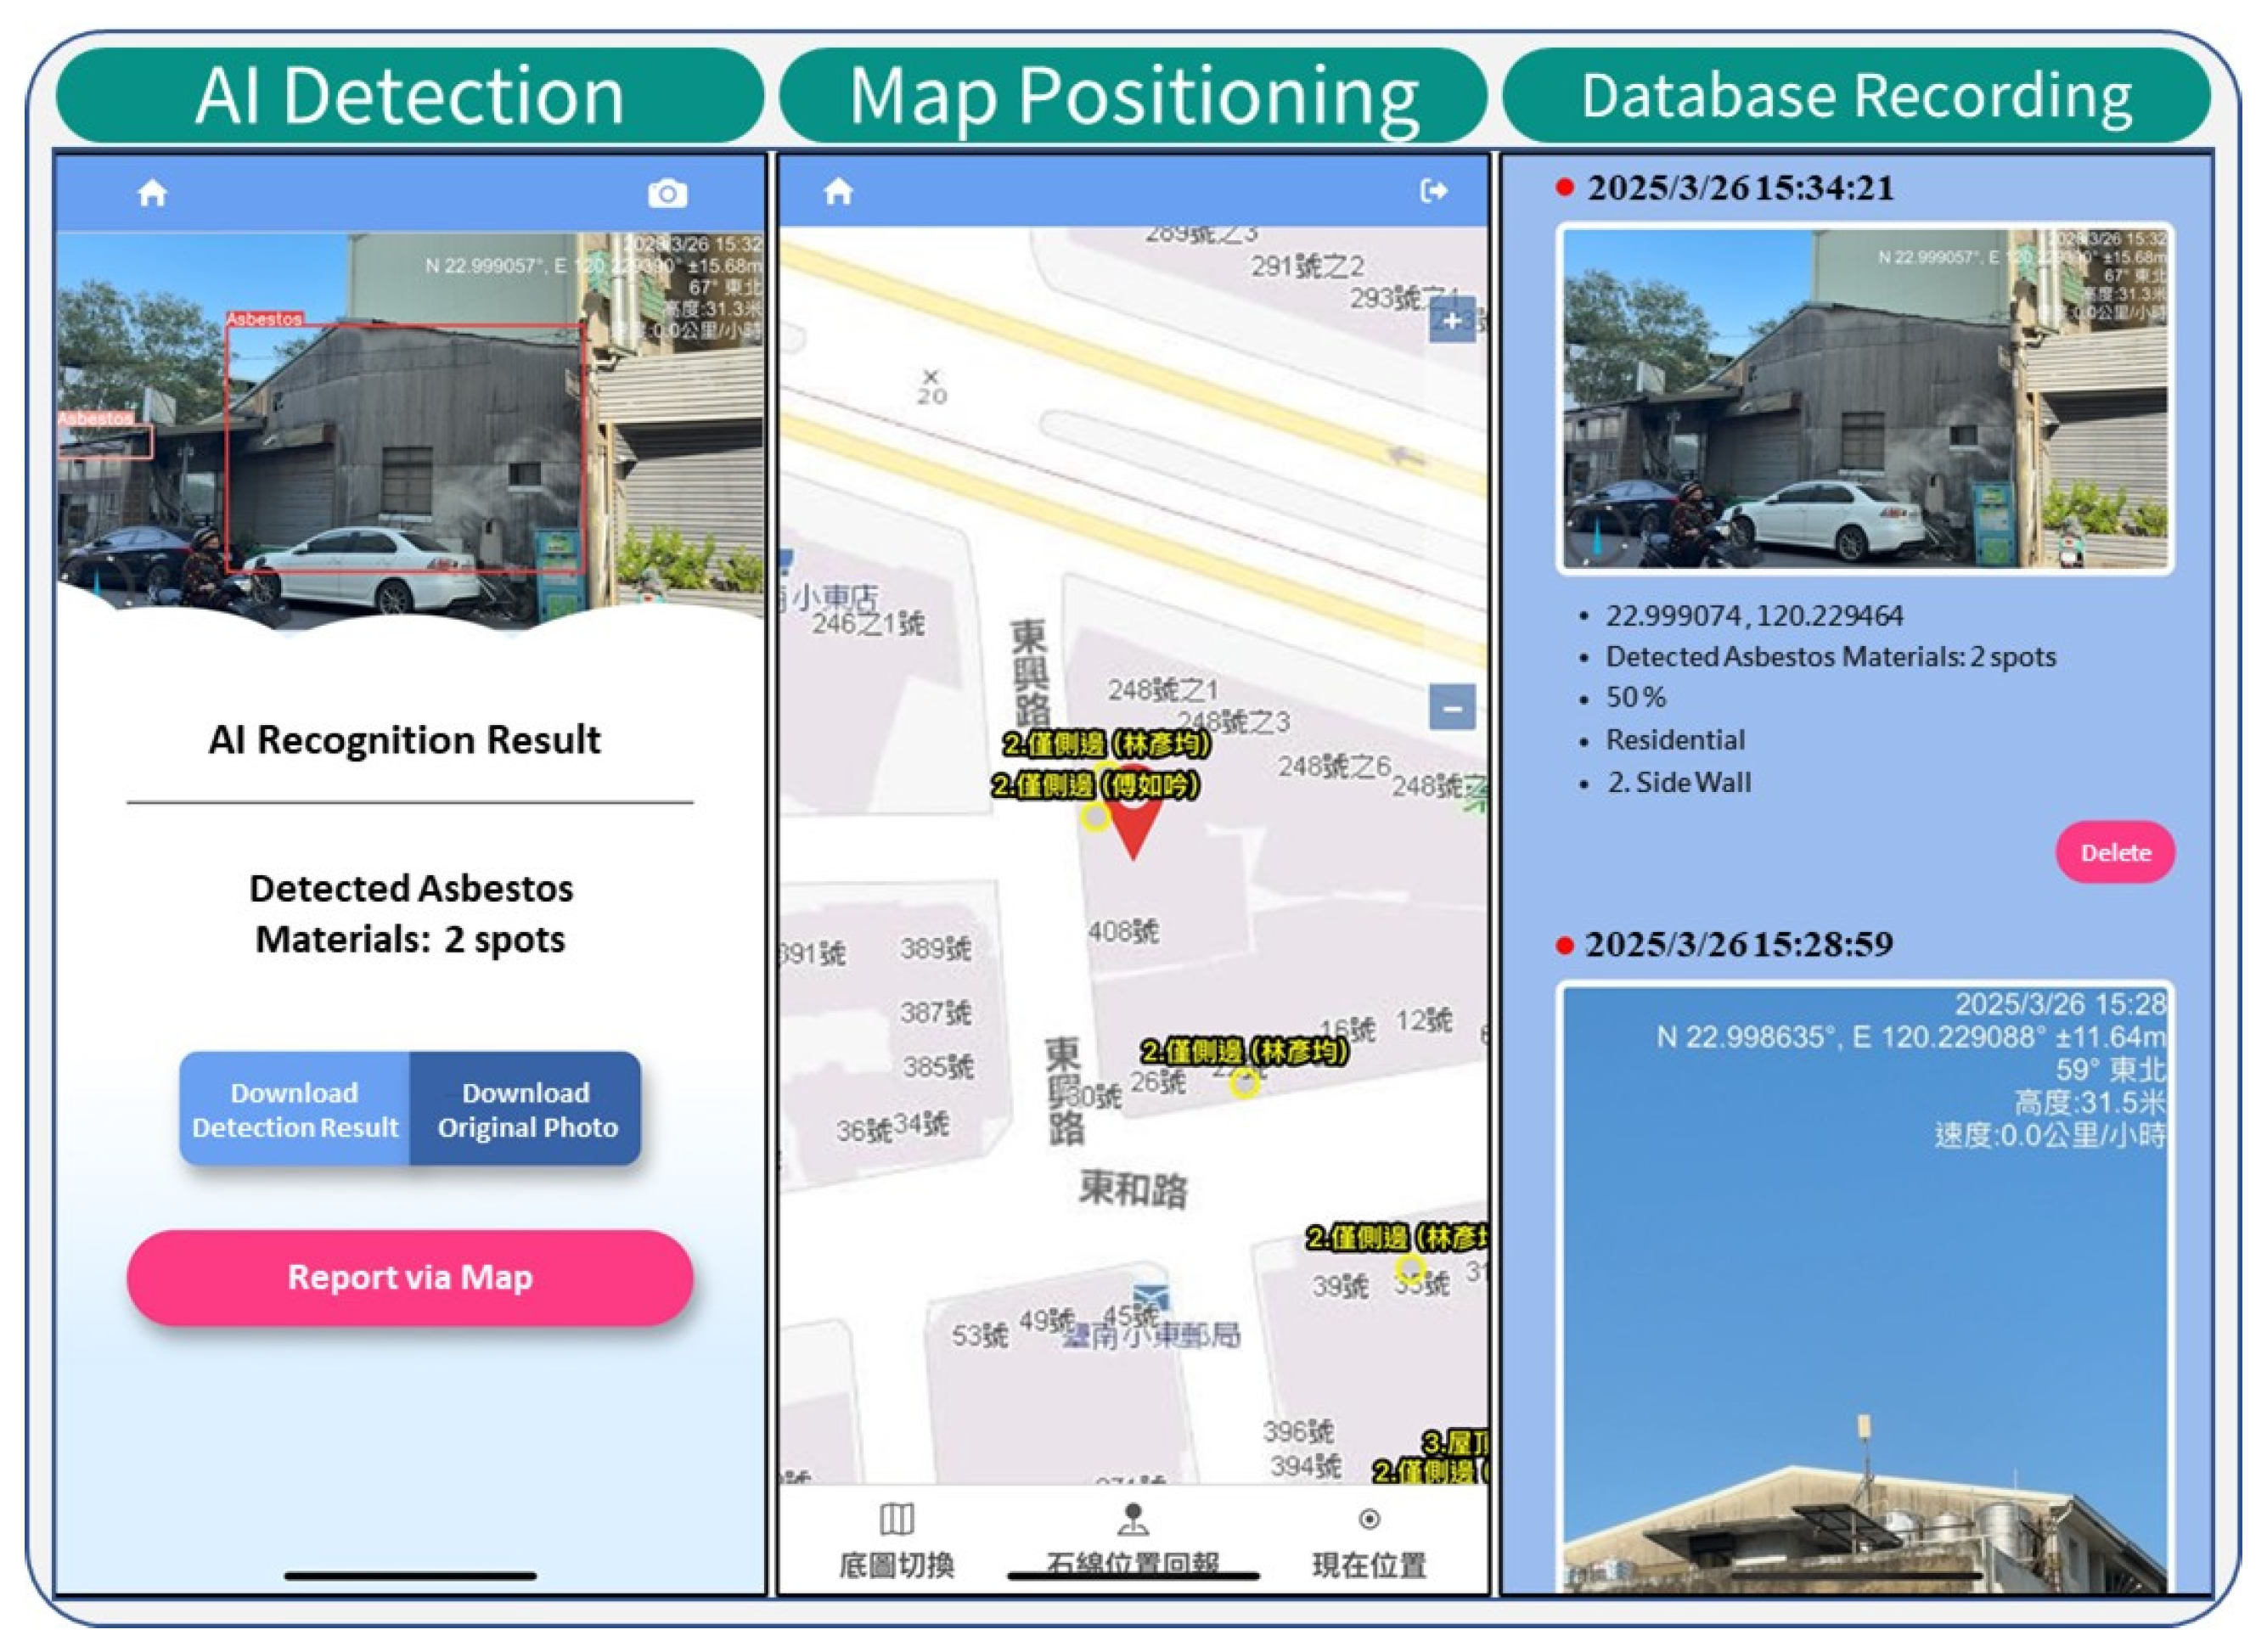
As shown in Figure 2, the app guides users to capture images of suspected materials. The integrated YOLOv9-E model then performs real-time classification, with the results and GPS location data displayed immediately on the smartphone screen.
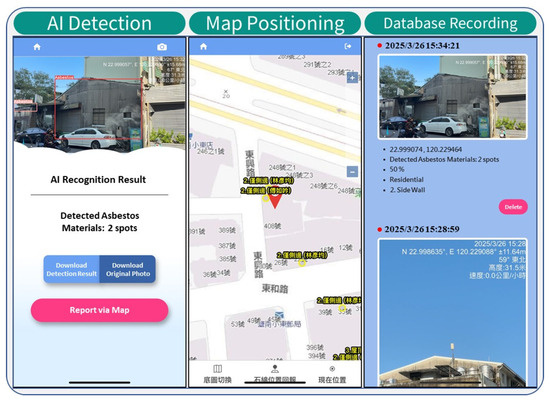
Figure 2.
An example of the functions of this app.
3. Results
3.1. Image Acquisition, Labeling, Classification, and Preprocessing
Image data from the following three sources were used as the basis to train the deep learning model: mobile phone photography, UAV imagery, and Google Street View imagery. The differences between urban and rural environments in Street View imagery were also considered, as illustrated in Figure 3. Simultaneously, the LabelImg software was used for ground truth data labeling. Table 2 lists the number of images collected and manual labels for each image source.
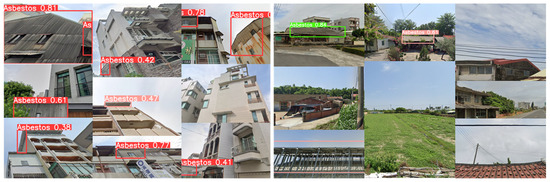
Figure 3.
Comparison of asbestos roofing materials observed in urban (left) and rural (right) environments.
Table 2.
Summary of image data quantity and manually labeled asbestos materials from different sources.
The dataset was split into training and validation sets in an 80:20 ratio. Additionally, 10% of non-asbestos background data was included in the training set to effectively reduce false positives. This approach allows the model to maintain comparable accuracy while enabling the use of a lower confidence threshold. The YOLOv9-E models were trained using PyTorch 2.0.1 on an NVIDIA RTX 4090 GPU. The models typically converged within 100 epochs, and increasing the number of epochs beyond this threshold did not lead to further improvements in accuracy. Furthermore, hyperparameter evolution was conducted over 300 iterations to optimize the model’s performance; however, the results indicate that the default hyperparameter settings remained optimal. As shown in Figure 3, noticeable differences were observed between UAV imagery and ground-based sources such as mobile phones and Google Street View photographs. UAV images captured from a top-down aerial perspective differ significantly in terms of the viewing angle and scale. Mobile phone images tend to present asbestos materials at a closer range and with greater clarity as they are typically taken manually at short distances. By contrast, Google Street View imagery often contains more distant views of asbestos-containing materials, resulting in smaller object sizes and increased visual complexity.
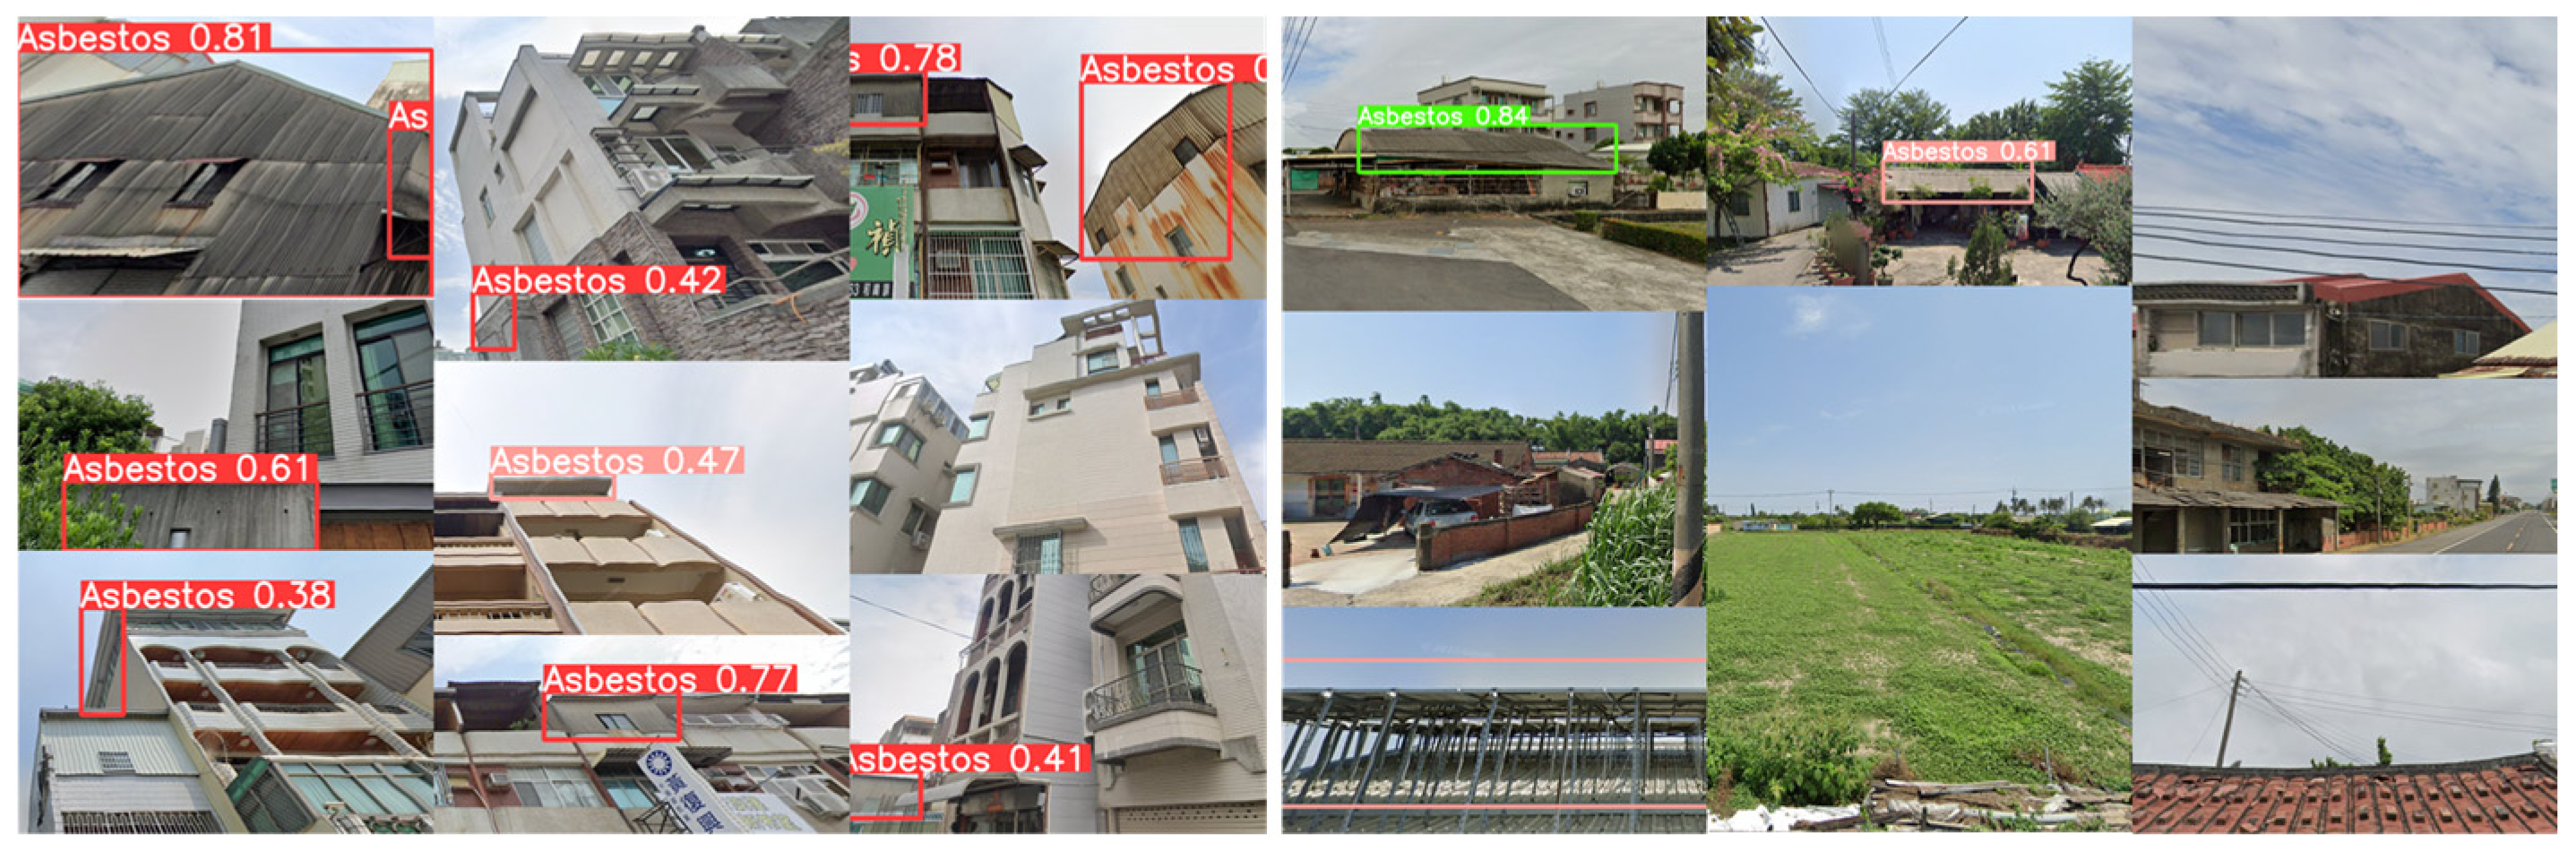
Representative prediction results for unseen test images are shown in Figure 4. These visualizations demonstrate the ability of the YOLOv9-E model to detect asbestos-containing materials under diverse conditions, including different lighting, camera angles, and building materials. The images confirm that the model can accurately localize asbestos tiles across various environments and perspectives, validating its generalization performance.
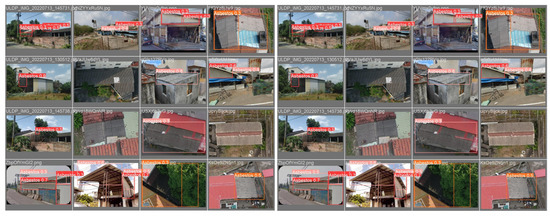
Figure 4.
Independent validation results of YOLOv9 model on unseen test images.
3.2. Comparison of AI Classification Accuracy Tests
YOLO-based deep learning models were evaluated using different photo sources to identify asbestos tiles on building sides. The models were trained under two classification schemes: single-category (general asbestos tile) and multicategory (UAV roof, Street View roof/side, and mobile phone roof/side).
The performance of the model was assessed using the F1-score, precision, and recall, focusing on the relationship between these metrics and confidence scores.
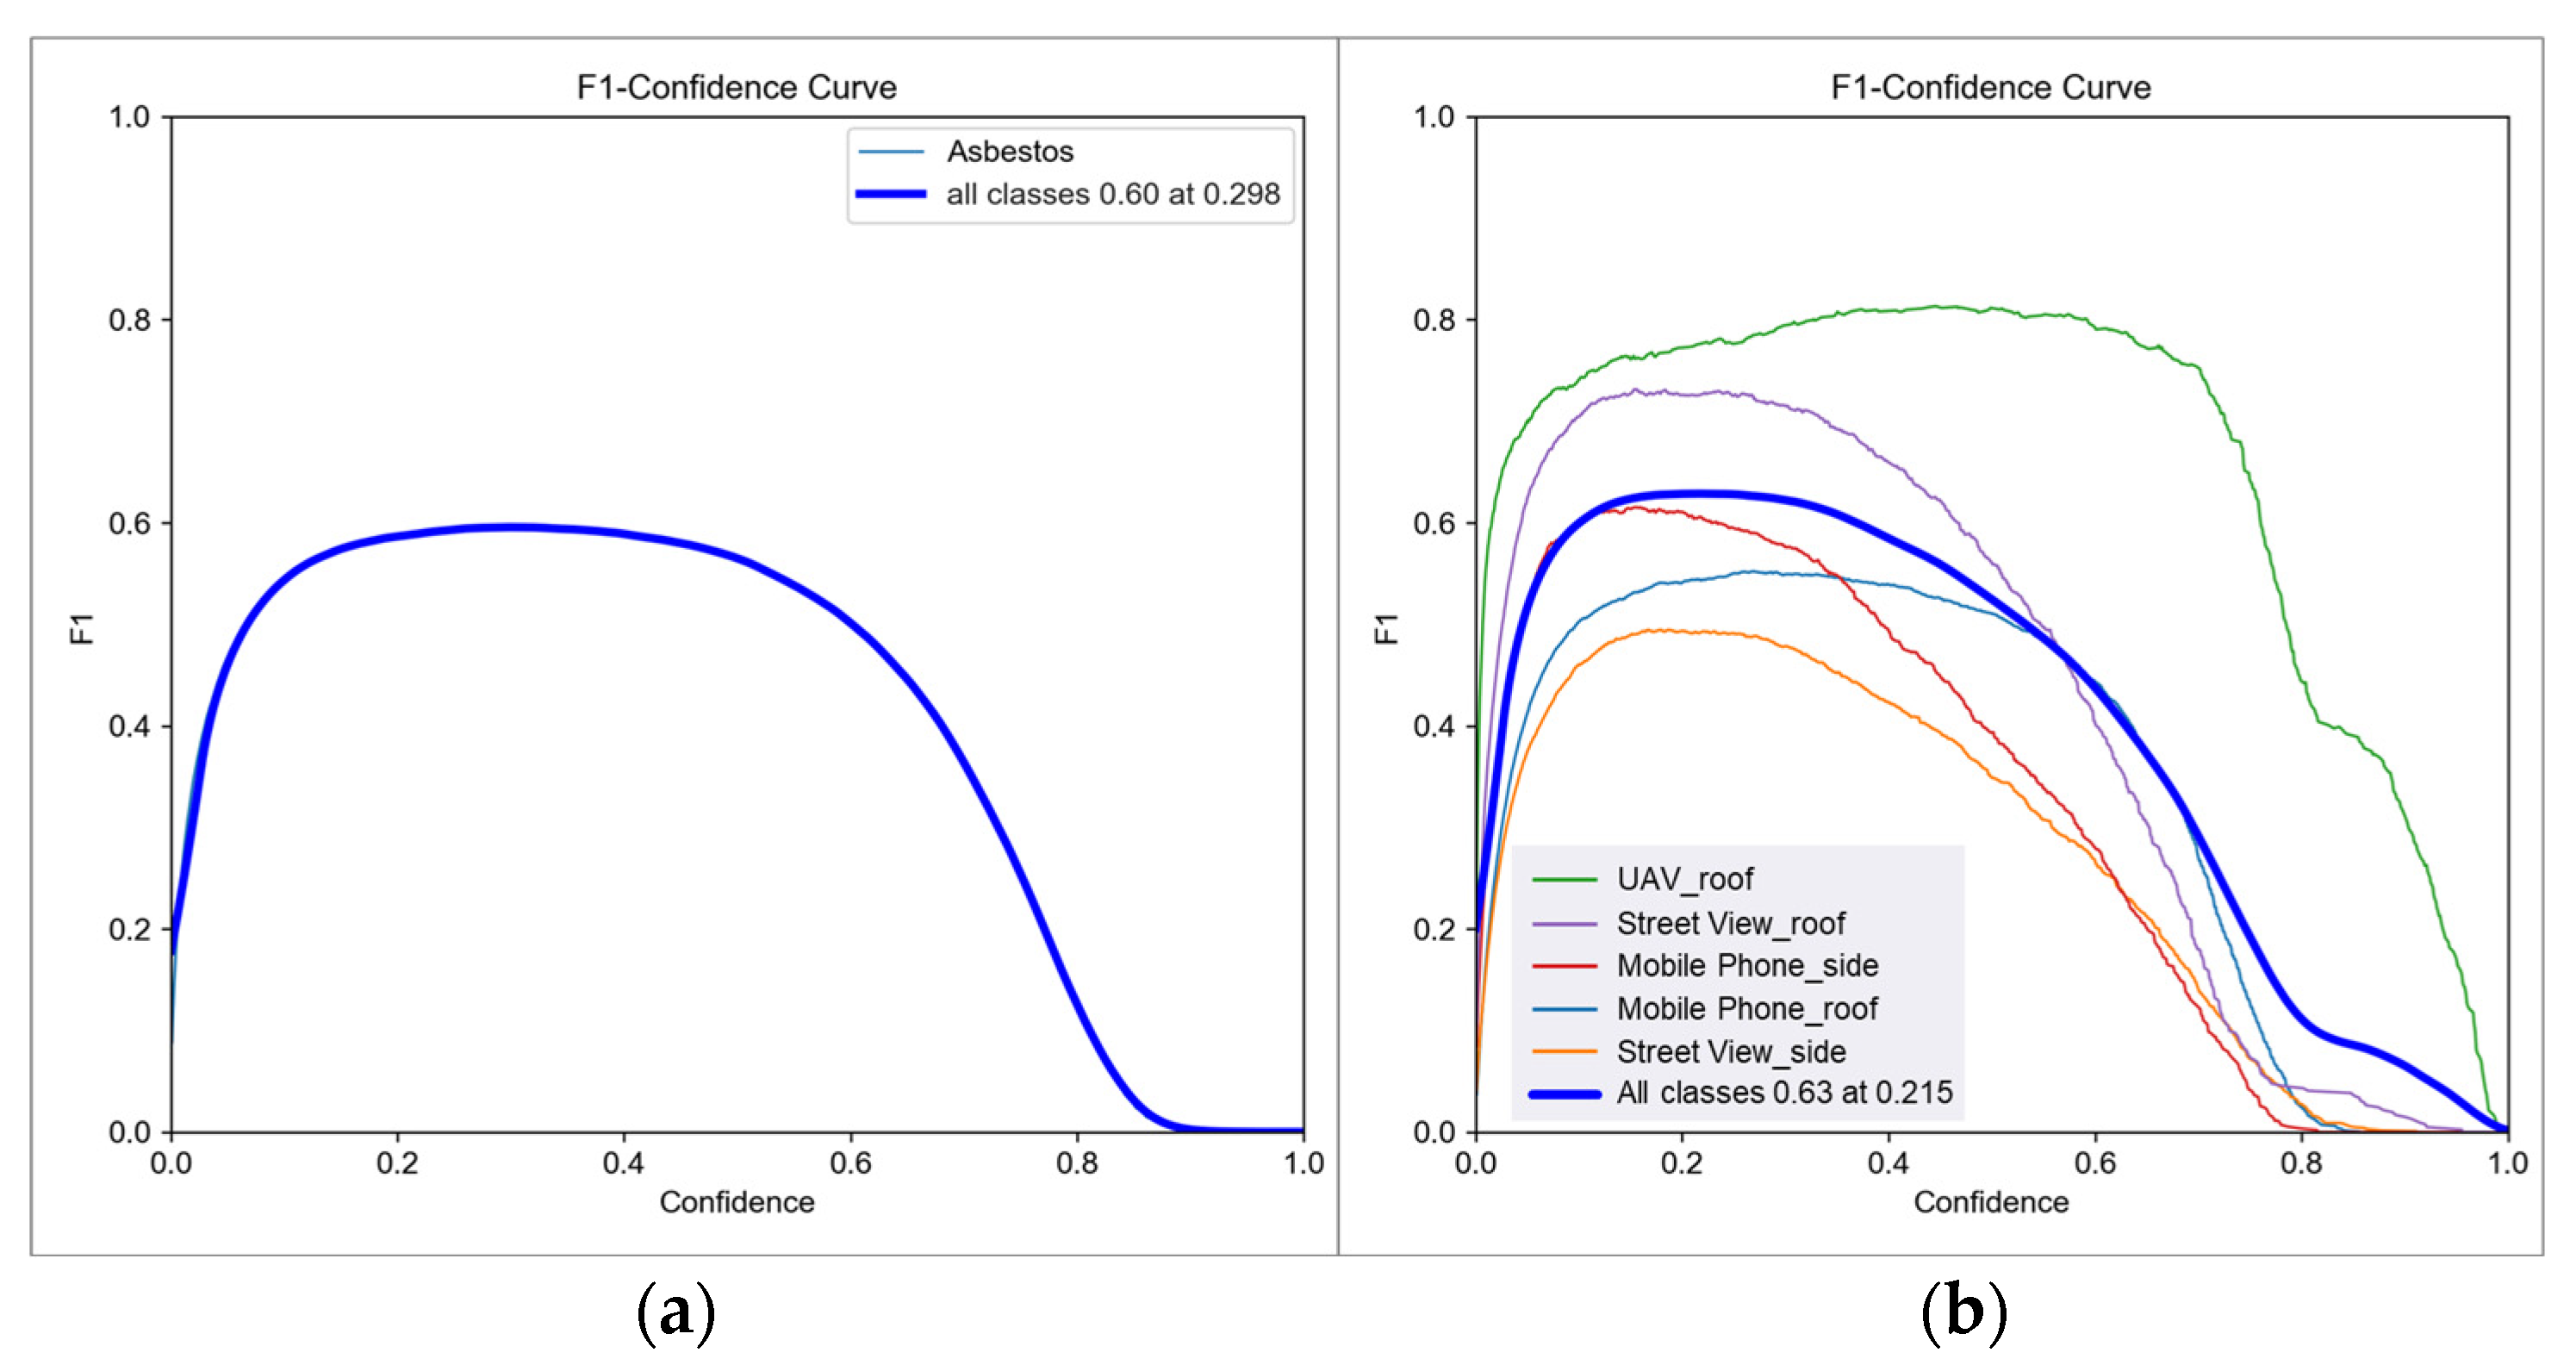
As shown in Figure 5, the single-category model achieved a stable F1-score of 0.60 within a confidence range of 0.298 to 0.7 (Figure 5), and the multi-category model reached an average F1-score of 0.63 with a confidence score of 0.215, with variations across categories (Figure 5b). “UAV roof” performed best at higher confidence (around 0.6).

Figure 5.
F1-score and confidence relationship of single-class asbestos classification model (a) and multiclass asbestos classification model (b).
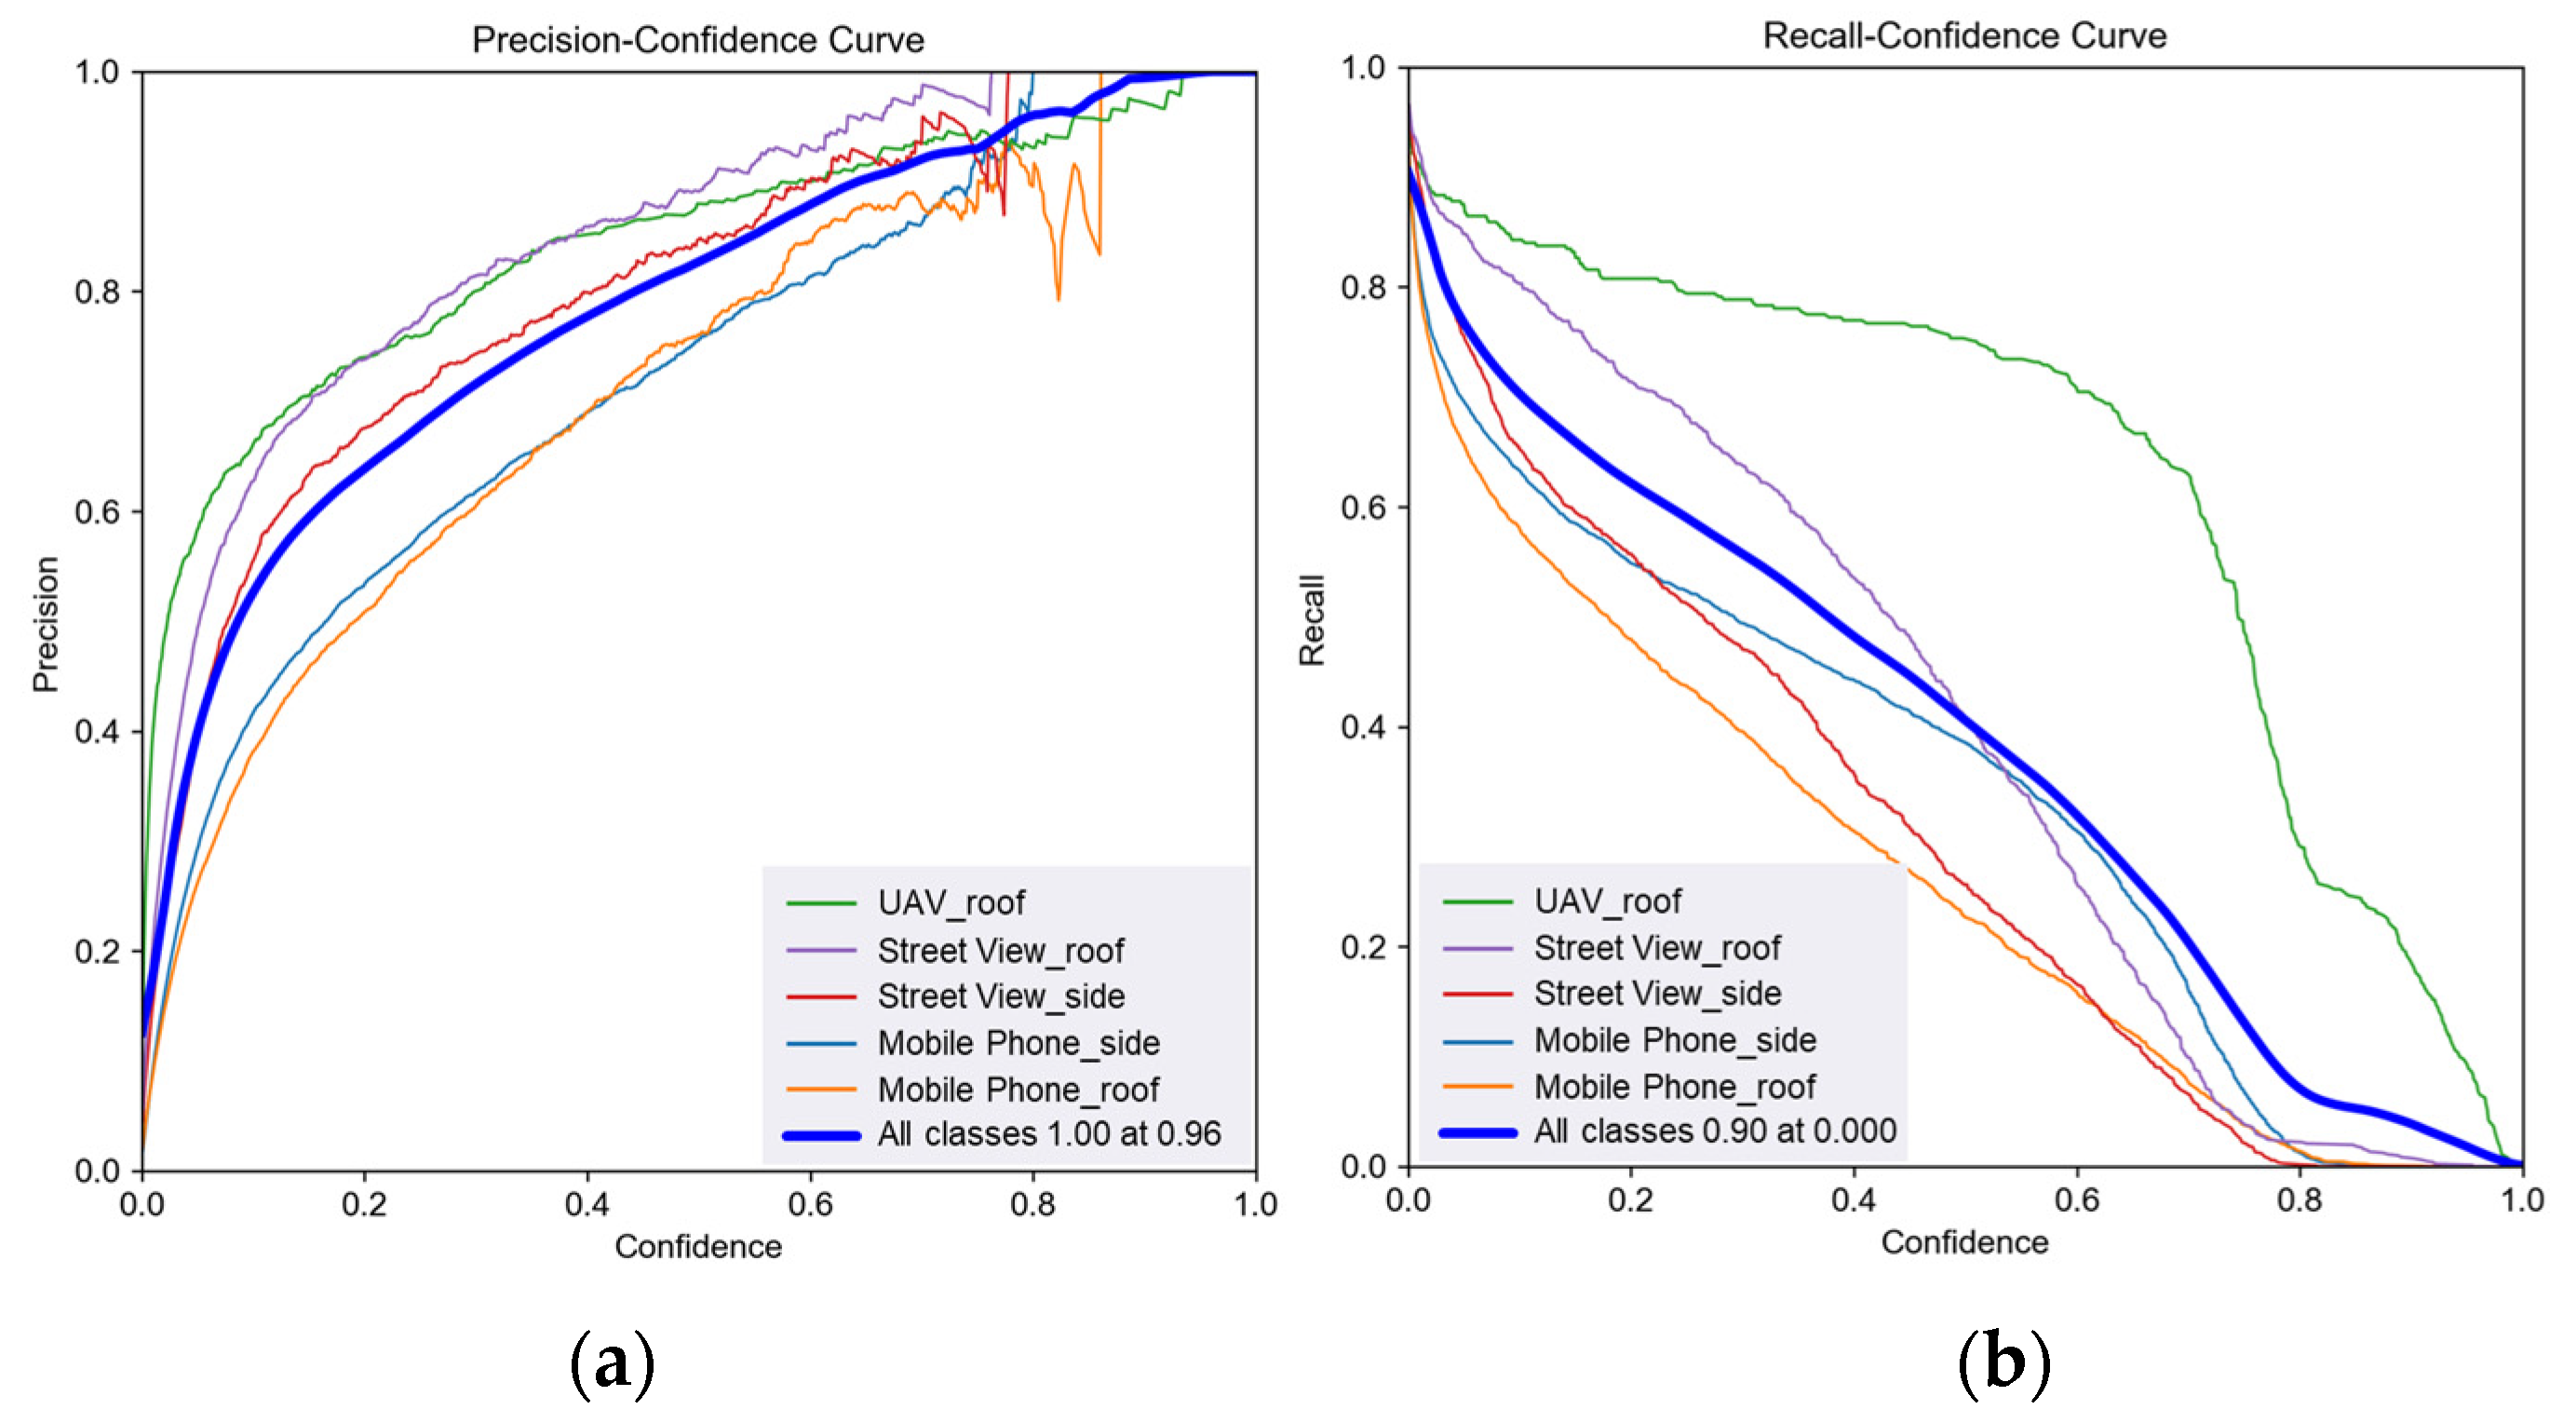
Figure 6 illustrates the precision and recall curves of the multicategory model. “Mobile Phone-side” demonstrated high precision (approaching 1) at high confidence, but recall decreased with increasing confidence. “Mobile Phone-roof” showed unstable precision and a sharp decline in recall as confidence increased.

Figure 6.
Graphs of confidence scores for the precision (a) and recall (b) of the multi-category asbestos classification model.
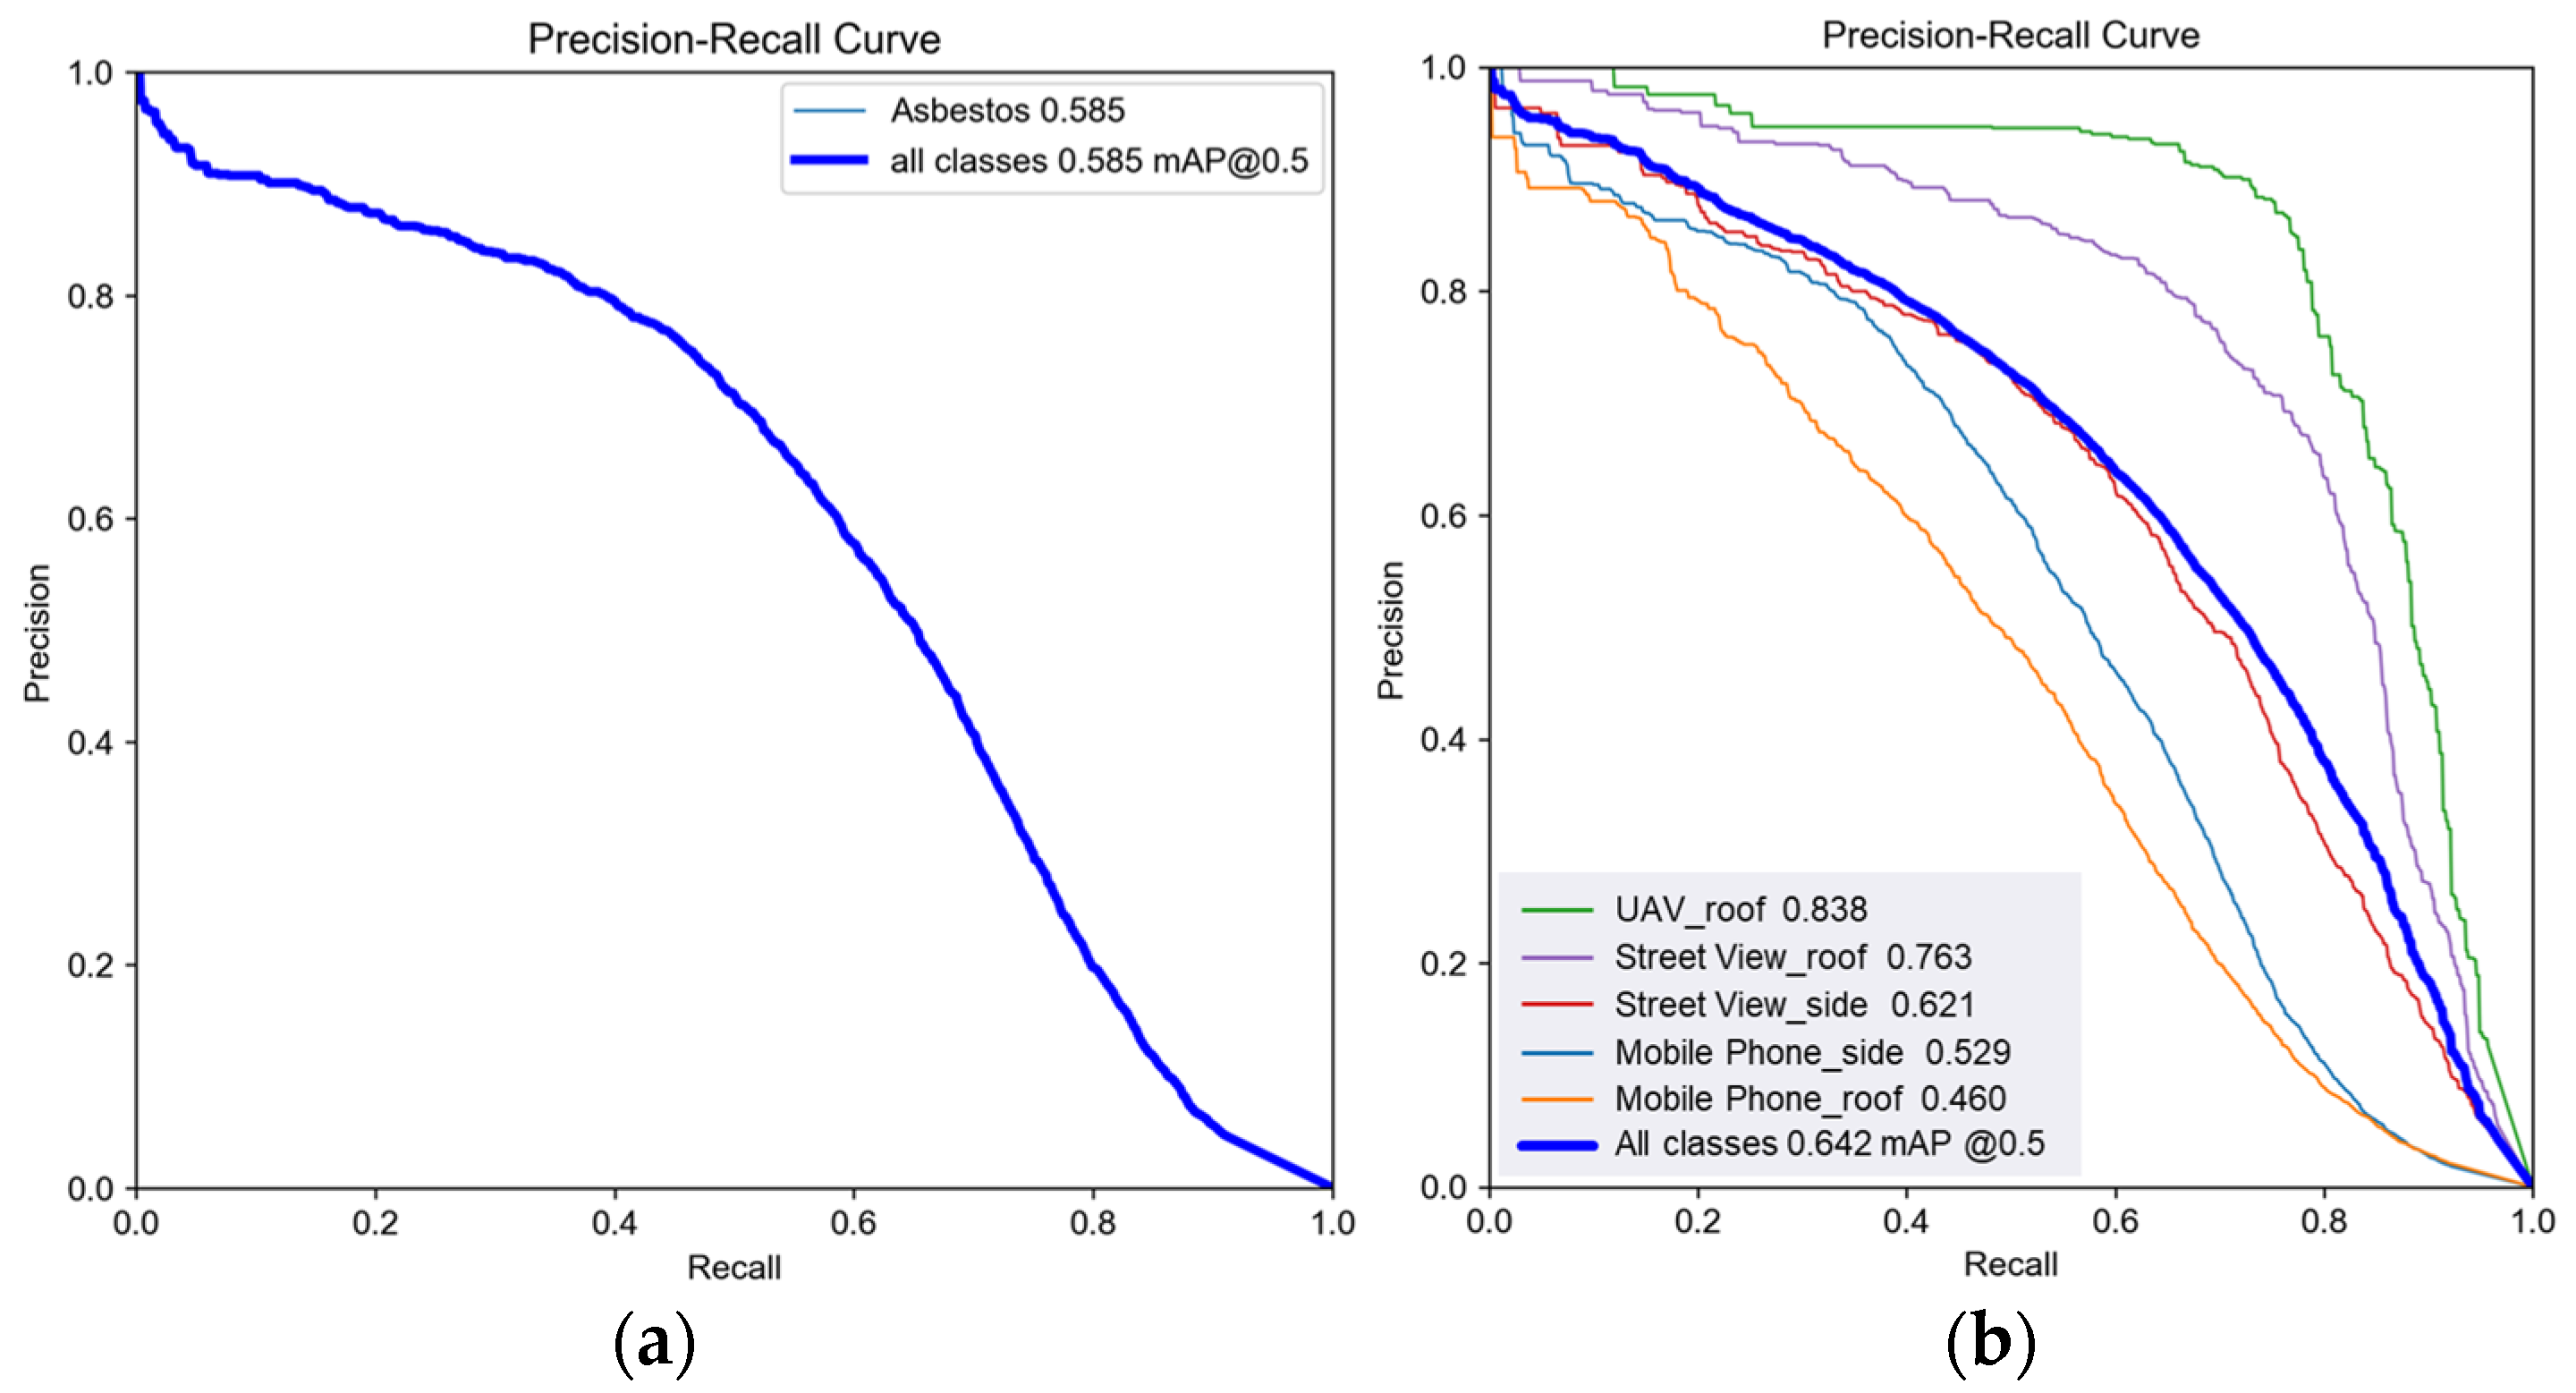
To conduct a comprehensive evaluation of the model’s performance, we further report standard object detection metrics, including the mean average precision (mAP) at IoU thresholds of 0.5 (mAP@50) and across a range of thresholds (mAP@50:95), along with class-wise precision–recall curves.
Figure 7 compares the PR curves of one- and five-class detection models. The one-class model achieved a mean mAP@50 of 0.585. In contrast, the five-class model, which distinguishes between image sources (e.g., UAV, mobile phone, and Google Street View), achieved a higher mean mAP@50 of 0.642. Notably, the UAV_roof and Street View_roof categories reached class-specific mAP values of 0.838 and 0.763, respectively, whereas categories such as Mobile_Phone_roof performed worse.
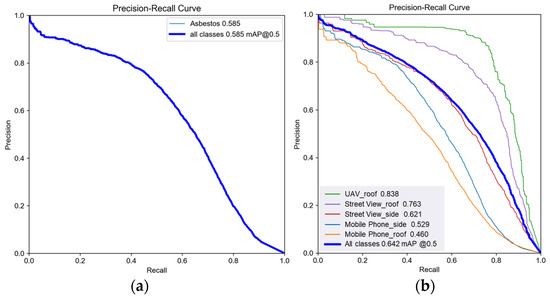
Figure 7.
Precision–recall curves of one-class (a) and five-class (b) detection models.
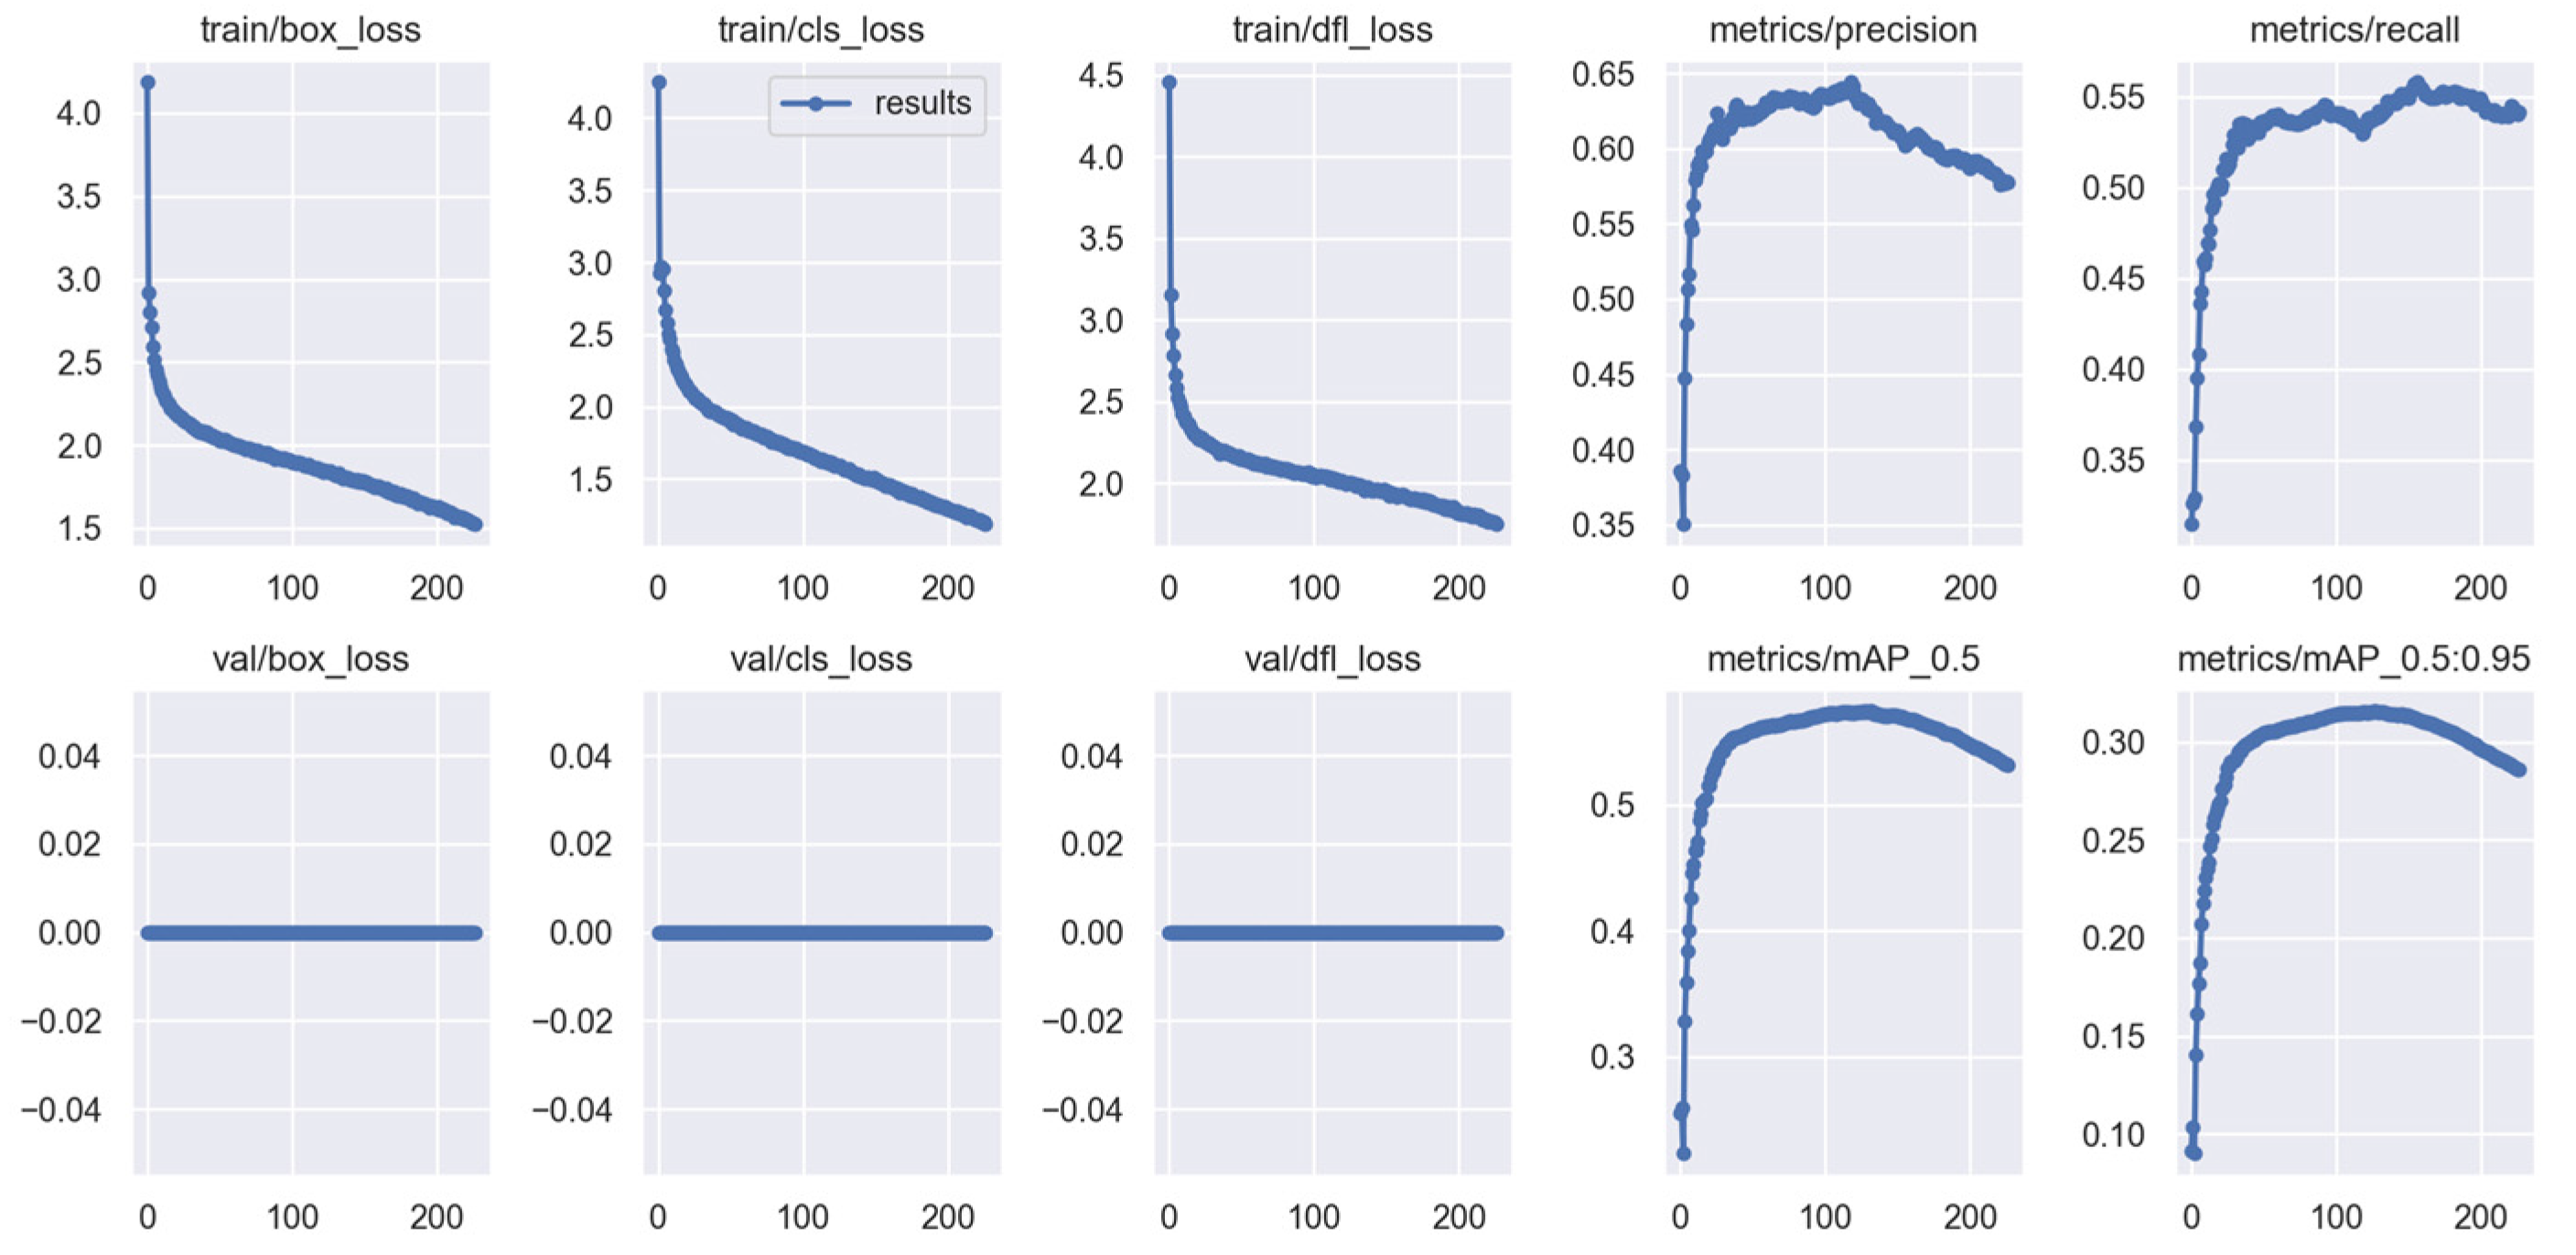
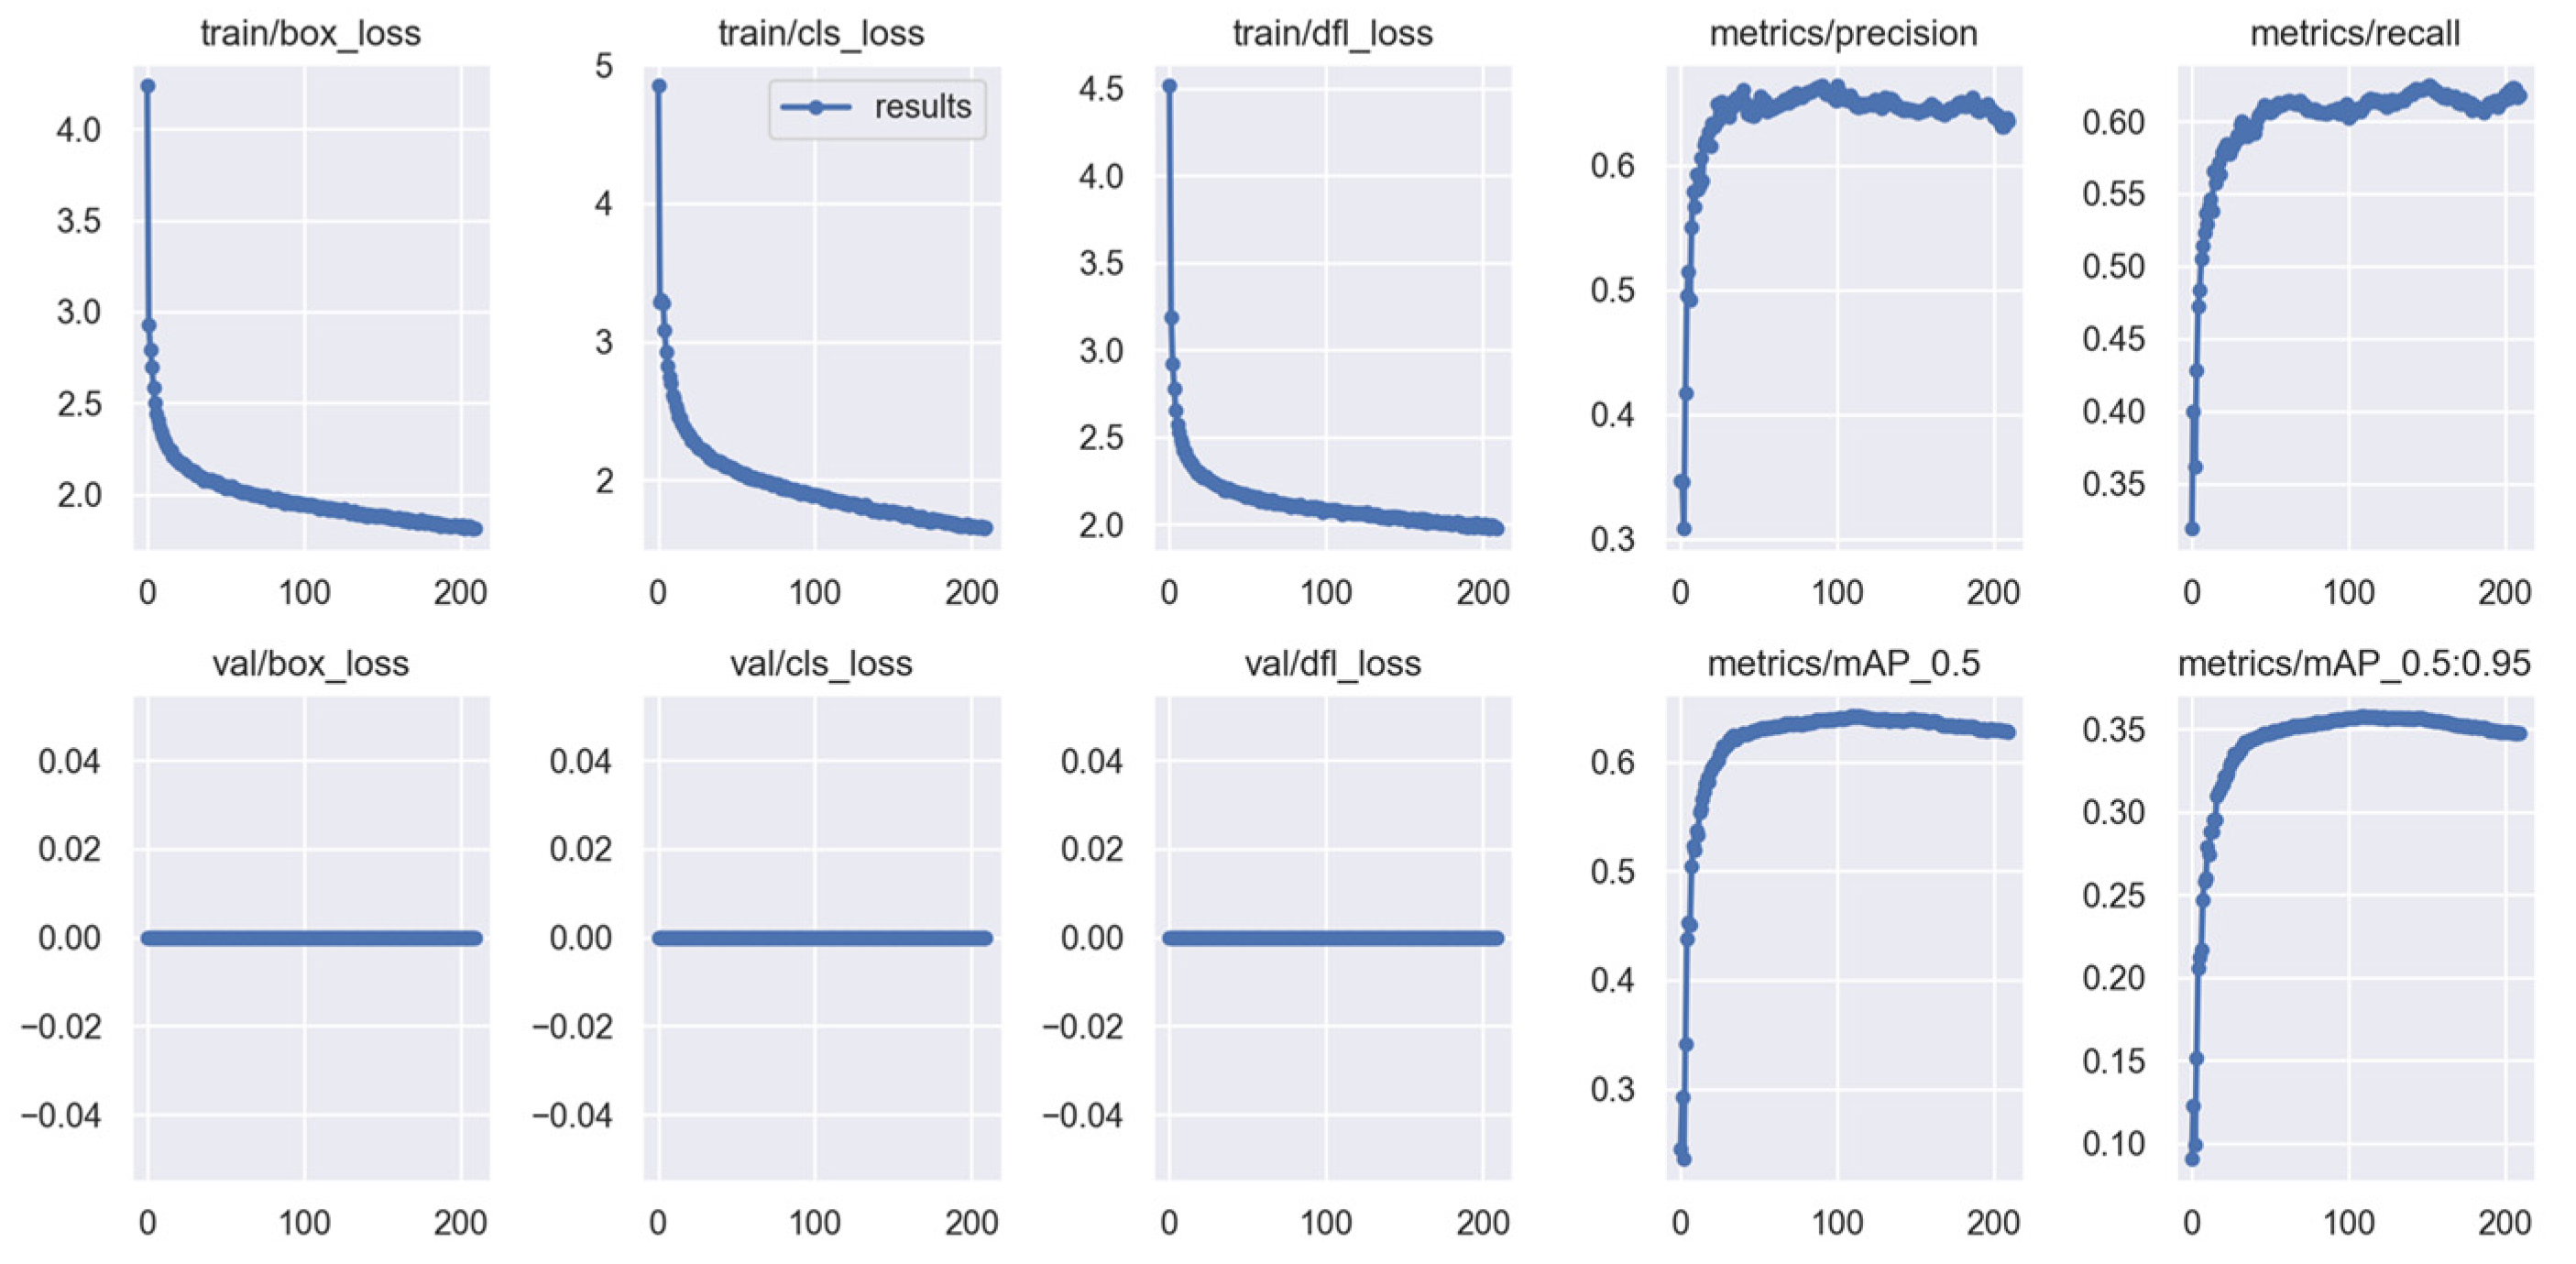
Figure 8 and Figure 9 show the training performance of the one-class and five-class models, respectively. While both models exhibited stable convergence of loss functions, the five-class model showed superior performance in terms of both mAP@50 (0.642 vs. 0.585) and mAP@50:95 (0.35 vs. 0.297). These results suggest that explicitly modeling the visual differences between data sources may enhance generalization, particularly in occlusion-heavy or visually complex environments.
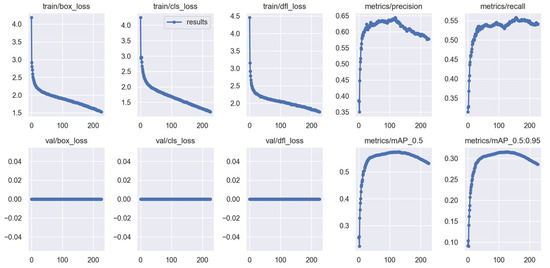
Figure 8.
Training performance (loss and mAP@50) for one-class model.
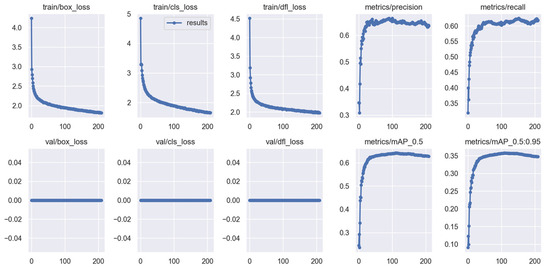
Figure 9.
Training performance (loss, mAP@50, and mAP@50:95) for five-class model.
While both models achieved acceptable precision and recall values, the five-class model demonstrated superior performance, particularly for UAV and Street View imagery. Nevertheless, precision–recall trade-offs remain evident in mobile phone-based façade images, emphasizing the need for more targeted training samples.
3.3. AI-Assisted Identification of Asbestos Building Materials
This section compares the effectiveness of two image sources for AI-assisted asbestos tile identification on the building side: Google Street View and social participation images. Google Street View provides publicly available imagery for automated processing, whereas social participation is carried out using a mobile application to capture and report suspected materials. This study analyzed performance in terms of precision, recall, and F1-score within a defined test area in Tainan City, Taiwan.
Table 3 summarizes the performance of the AI model using deep learning for each image source. The following is a brief discussion of the AI identification performance based on four indicators: precision, recall, F1-score, and accuracy.
Table 3.
Performance evaluation of AI recognition on two image sources.
- Precision: The social participation model achieved 100% precision, indicating no false positives owing to close-range targeted image capture. Google Street View has 82.63% precision, with more misjudgments likely owing to image quality and obstructions.
- Recall: Both methods showed similar recall (approximately 83%), indicating comparable sensitivity for detecting asbestos-containing materials.
- F1-Score: The social participation model (90.91%) outperformed Google Street View (82.73%), demonstrating a better balance between precision and recall.
- Accuracy: While Google Street View demonstrated an accuracy of 90.90%, the accuracy measure was not applicable for the social participation dataset because of the absence of “non-asbestos” samples. Therefore, comparisons between the two methods based solely on accuracy may be misleading. Instead, precision and recall provide meaningful insights into the performance differences between the two approaches.
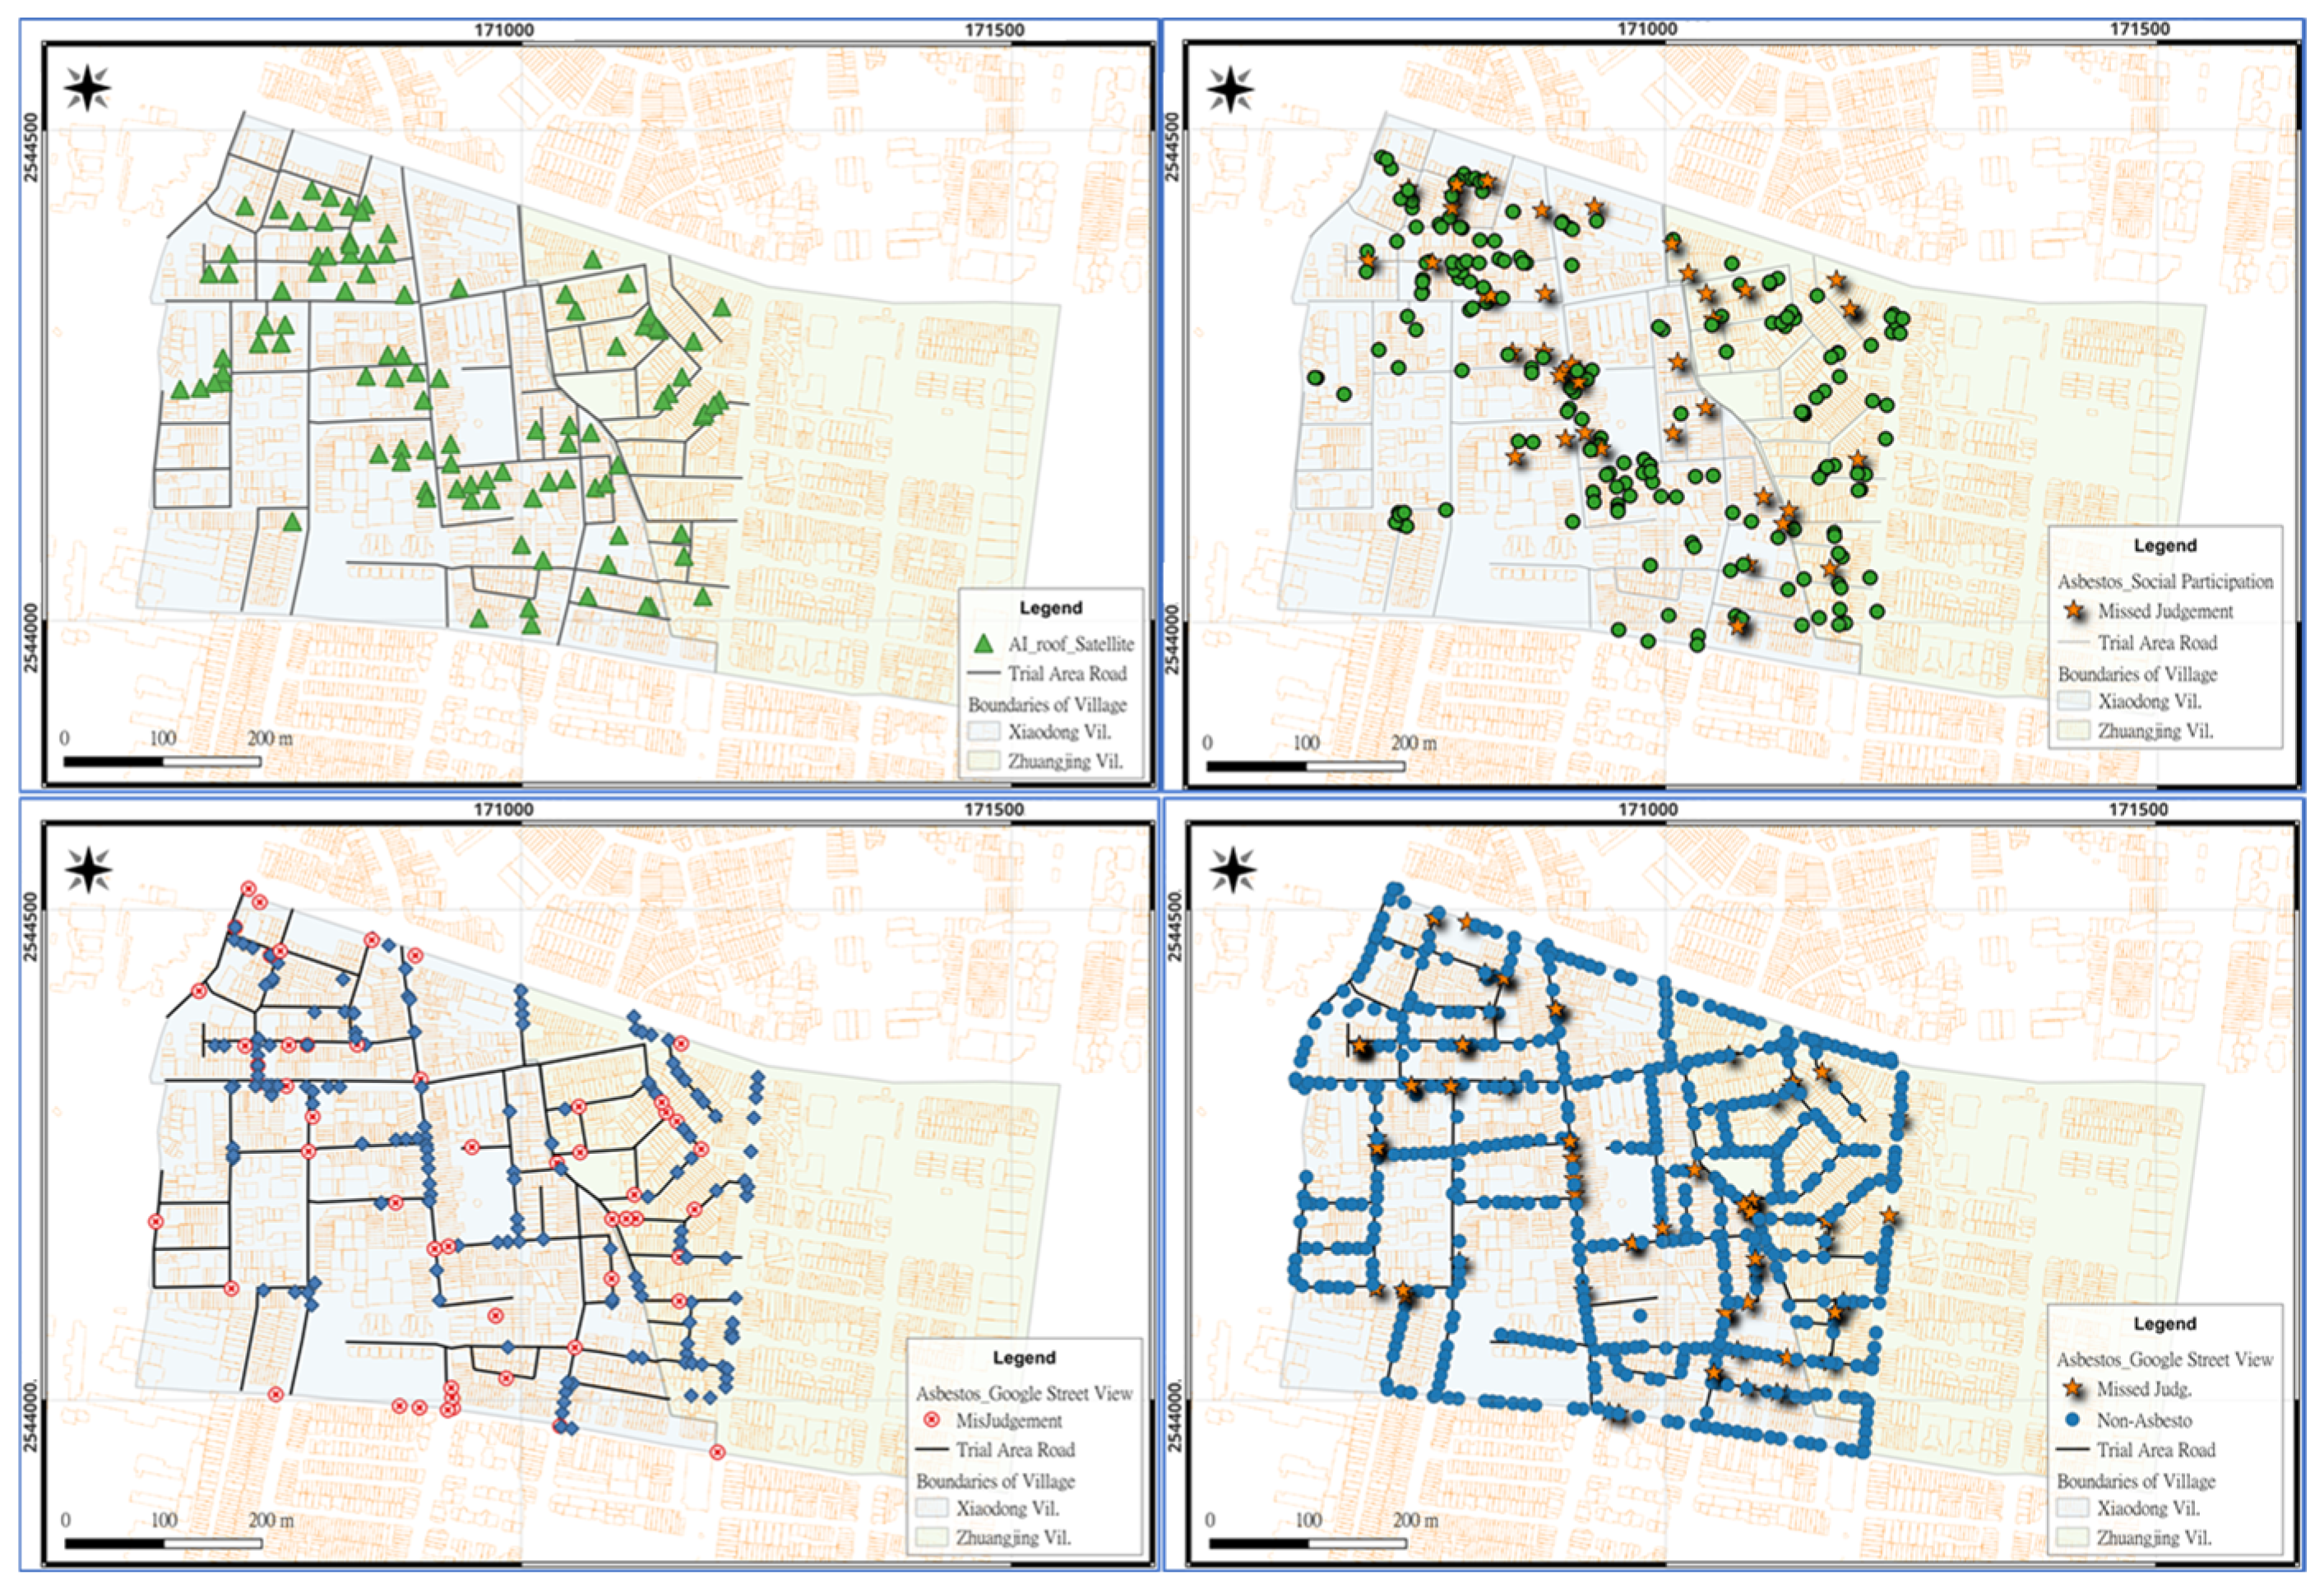
Figure 10 illustrates the spatial analysis of AI-identified asbestos tiles from satellite imagery, Google Street View, and social participation images. A key observation is the consistency between roof asbestos tile locations identified via satellite and building-side locations identified by Street View and social participation, suggesting a correlation in material use.

Figure 10.
Spatial distribution of AI results for judging asbestos tiles. Note: 1. Upper left: AI roof detection from satellite imagery. The green triangles represent the detected asbestos roofs across villages. 2. Upper right: AI asbestos detection from social participation images. Green dots = confirmed asbestos; orange stars = missed asbestos (manually verified). 3. Bottom left: AI asbestos detection from Google Street View. Blue diamonds = AI-confirmed asbestos; red circles = misjudged locations. 4. Bottom right: AI-missed asbestos from the Google Street View analysis. Blue points = no asbestos (predicted as non-asbestos by AI); orange stars = missed judgments (actual asbestos).
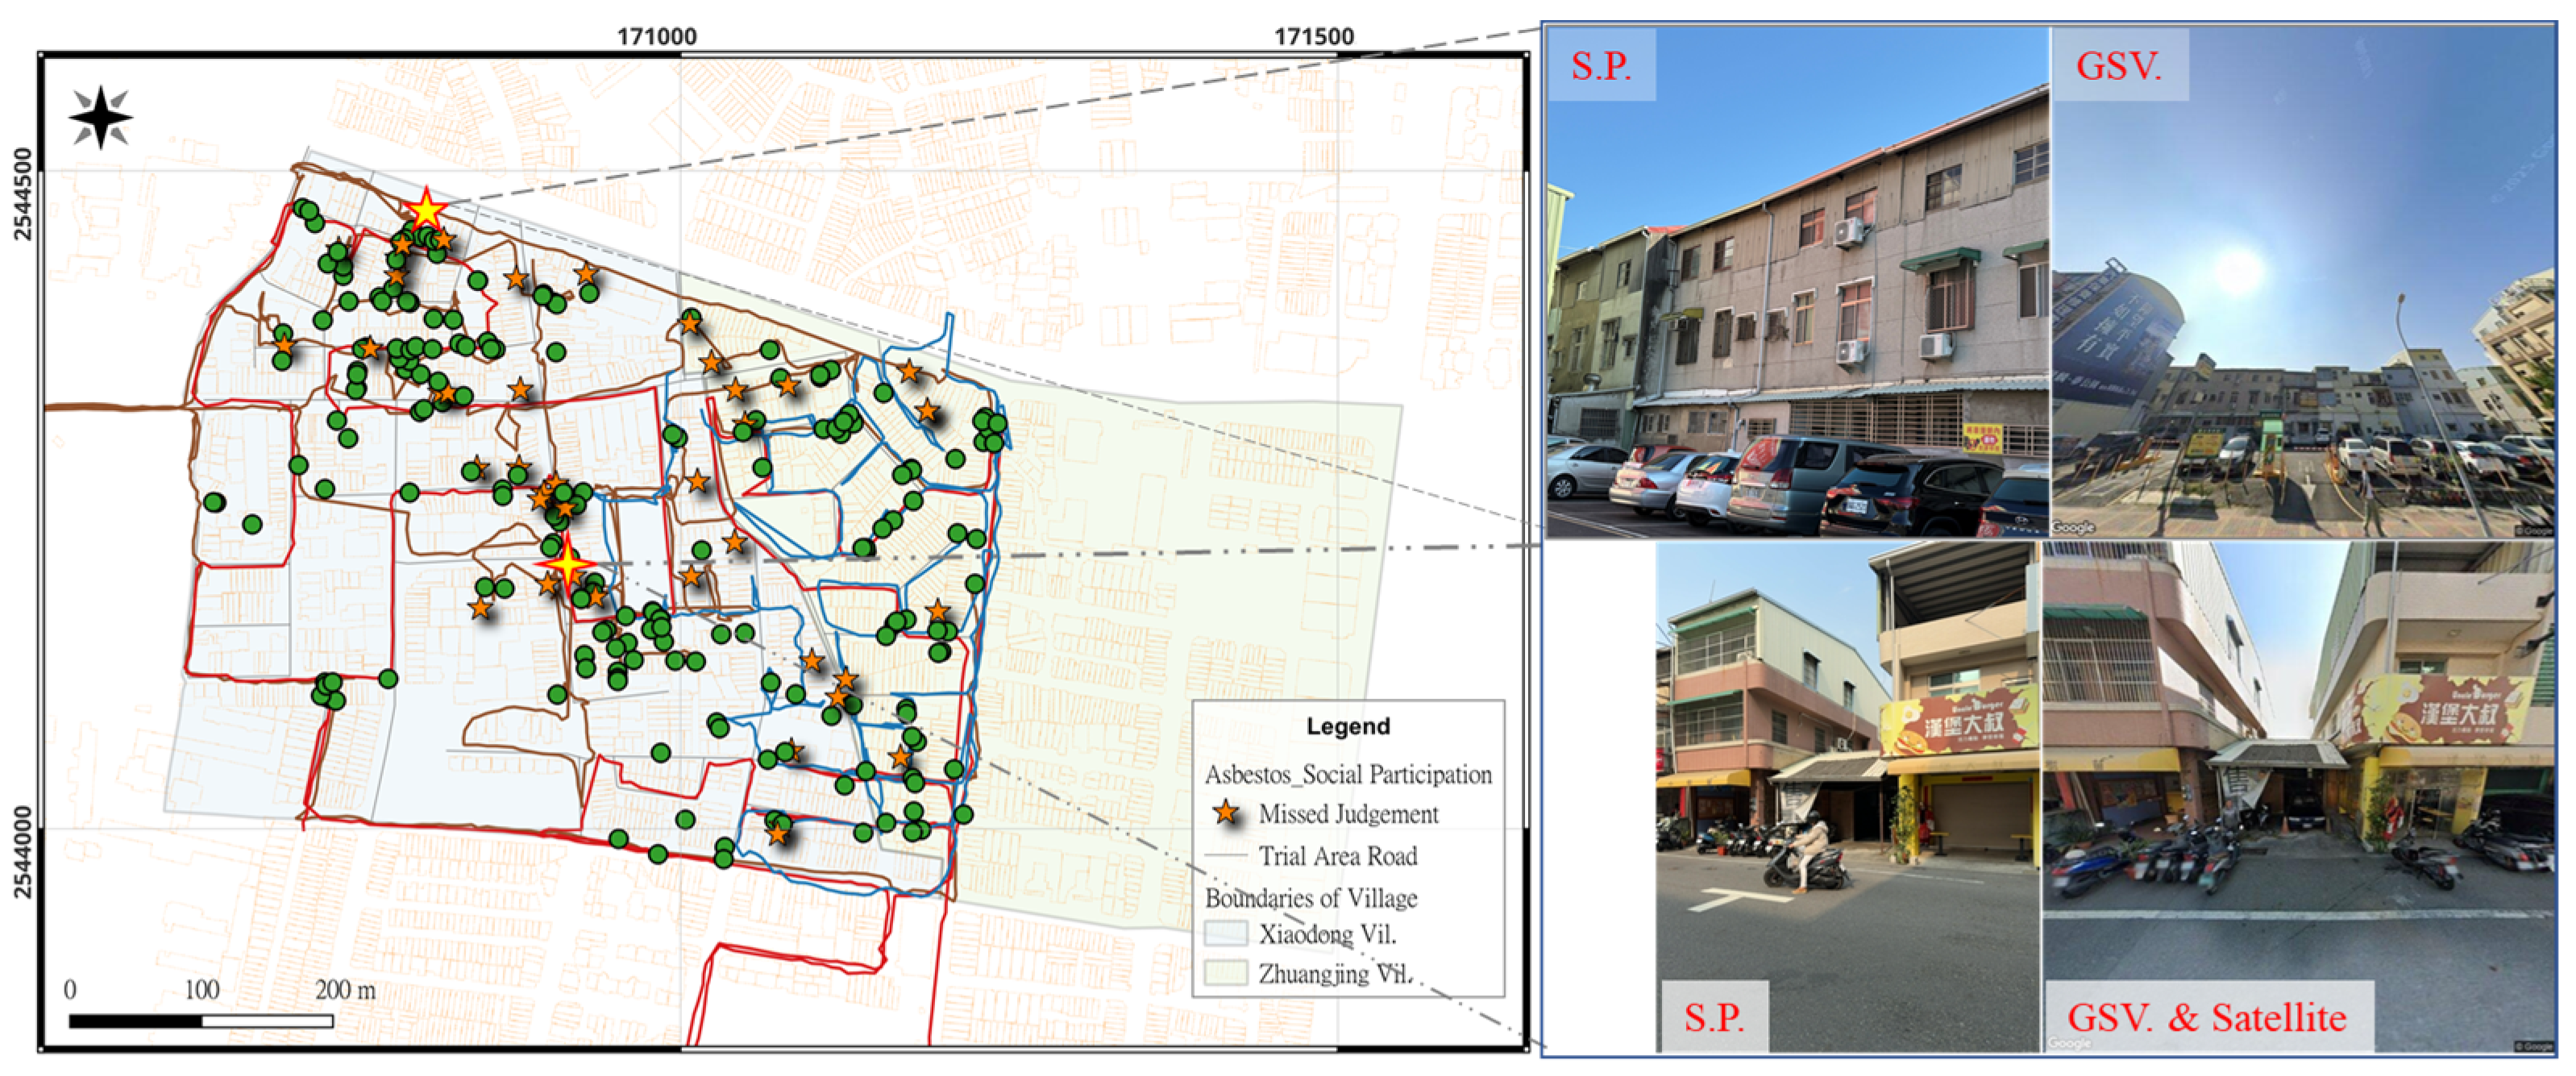
Figure 11 illustrates the surveyors’ reach and demonstrates how social participation surveys enabled us to access areas inaccessible to both satellite imagery and Street View, thereby capturing hidden or unique asbestos tiles that AI could potentially miss.
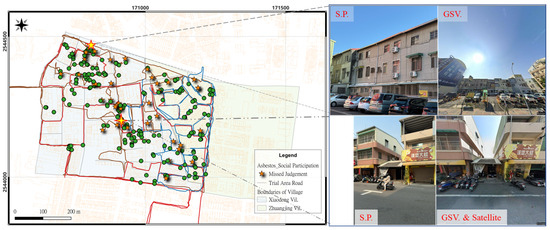
Figure 11.
Surveyors’ coverage and the ability of social participation to identify overlooked asbestos tiles. Note: 1. S.P = Social participation surveys. 2. Top right: GSV perspective and distance affect AI’s detection on building sides. 3. Bottom right: Obstruction by adjacent buildings and roof shape hinders GSV and satellite imagery for identifying asbestos roofing.
3.4. Advantages and Challenges of Citizen Science Surveys
As evidenced by the findings in the previous section, the efficiency of asbestos tile identification using satellite imagery is constrained by environmental factors such as resolution and building occlusion. Although Google Street View (GSV) data offers extensive coverage and accessibility, its utility for detailed and effective asbestos tile identification is limited by the capture locations, driving routes, and image angles of Street View vehicles. Furthermore, GSV imagery lacks the precision required for the accurate spatial annotation of asbestos-containing materials.
By contrast, social participation can access areas that are inaccessible to Street View vehicles, enabling more detailed inspections. This facilitated the effective capture of concealed, small, or uniquely patterned asbestos-containing building materials. Another significant advantage of social participation surveys is the potential for a more precise geolocation of buildings containing asbestos materials through the integration of smartphone GPS and directional metadata associated with the captured images. Consequently, despite the relatively time-consuming nature of the survey process and the potentially lower volume of images compared to GSV, the detailed inspection capabilities and inherent geolocational accuracy render social participation a viable and valuable supplementary approach for asbestos tile detection and mapping.
In the field-based validation phase, a total of 12.5 person-hours were invested by trained research staff and volunteers, resulting in the identification of 246 asbestos roofing or siding structures. This equates to approximately 19.7 detections per person-hour. Although we did not quantify which of these instances were unobservable from satellite or Street View imagery, the detection rate illustrates the practical efficiency of incorporating community-based efforts into environmental surveillance.
Table 4 summarizes and compares the advantages and limitations (pros and cons) of using GSV imagery versus social participation imagery in asbestos tile surveys.
Table 4.
Comparative evaluation of GSV vs. social participation imagery.
4. Discussion
This study integrated the YOLOv9-E deep learning model, public participation GIS (PPGIS), and multi-source remote sensing imagery to identify asbestos-containing materials (ACMs) affected by visual occlusion in various environmental contexts. The findings demonstrate that this integrated framework effectively addresses the three core research questions.
4.1. Effectiveness of AI and Community-Contributed Imagery in Occluded Environments
The first research question is as follows: can the integration of AI-based object detection with community-contributed imagery improve the identification of asbestos-containing materials in urban environments affected by visual occlusions?
These findings support our hypothesis. Close-range images captured by citizens provided high-resolution targeted data on occluded or difficult-to-access buildings. The results achieved a precision of 100% and an F1-score of 90.91%, significantly outperforming the Google Street View (GSV) images. This demonstrates that community-generated imagery can effectively compensate for the limitations of traditional remote sensing in visually restricted areas, thereby improving both detection coverage and accuracy.
4.2. Complementarity of Remote Sensing and Social Participatory GIS
The second question explored was as follows: can the combination of social participatory GIS and multi-source remote sensing data support more comprehensive spatial mapping of ACMs?
The answer was affirmative. As shown in Figure 10 and Figure 11, the combined use of satellite imagery, GSV, and smartphone-based image collection forms a complementary system that enables more complete mapping of ACM distribution. This integration revealed hotspot areas that were otherwise undetectable using a single data source. Spatial complementarity, along with a real-time feedback mechanism, enhanced the precision and coverage of the mapping results.
4.3. Applicability of YOLOv9-E for Mobile Real-Time Deployment
The third question asked was as follows: is YOLOv9-E suitable for real-time inference and mobile deployment using socially captured imagery?
This study confirmed the feasibility of deploying YOLOv9-E on mobile devices. The model achieved a test set mAP@50 of 0.81, demonstrating sufficient detection accuracy and computational efficiency. The real-time classification and GPS tagging functions of the smartphone app also significantly improved user engagement and data quality, making it a practical tool for grassroots-level community participation in data collection.
4.4. Trade-Offs and Limitations of Different Image Sources and Model Performance
Despite the effectiveness of the integrated approach, each image source presents a trade-off. GSV offers large-scale, automated processing capabilities but is limited by the image update frequency and viewing angles. In contrast, social participation imagery provides fresh and high-resolution data but requires significant human effort and time. As summarized in Table 4, these sources differed in terms of time efficiency, accessibility, detection accuracy, and annotation capacity. Practical applications should balance their use adaptively based on situational needs.
Regarding model performance, while YOLOv9-E showed overall stability, the classification strategies influenced the outcomes. The five-class model performed better for the UAV and GSV images, whereas the single-class model maintained its consistency. However, mobile phone images, particularly those of building façades, exhibited greater variability in precision and recall, indicating the need for more representative training samples and clearer user guidance.
Although this study focused on one-stage detectors for real-time performance and deployment feasibility, we recognize the relevance of two-stage detectors such as Faster R-CNN in academic and high-precision contexts. In a comparative study conducted by Fatima et al. (2024), YOLOv9 outperformed Faster R-CNN in all three mAP metrics (mAP@50, mAP@75, and mAP@50-95), indicating better localization and classification precision. Moreover, YOLOv9 achieved an approximately 2.7 times faster inference speed (0.0311 s vs. 0.0844 s) [19], making it significantly more suitable for mobile or edge device deployment. These results reinforce our model selection in favor of practical deployment requirements without compromising accuracy.
4.5. Implications for Environmental Policy and Monitoring Practice
This study demonstrated the potential of combining AI and citizen science for asbestos monitoring. In scenarios in which official resources are limited, integrating AI detection with community reporting offers a viable alternative for asbestos risk management. Spatial statistical methods such as Moran’s I and LISA [20,21] can be incorporated to identify risk hotspots and guide targeted remediation efforts and policy implementation.
5. Conclusions
This study presents a practical integration framework combining deep learning (YOLOv9-E) and multi-source remote sensing imagery, including Google Street View and public participation GIS, to detect asbestos tiles affected by light occlusion. Unlike previous efforts that primarily focused on rooftops, our approach emphasized the detection of materials on the building side, addressing a critical blind spot in existing datasets.
Through social participation, citizens contributed cellular phone photos that were enriched with geolocation and orientation metadata. These user-generated images effectively complemented GSV imagery in capturing oblique and occluded views of the structures. The YOLOv9-E model, trained on this hybrid dataset, demonstrated strong performance, validating the applicability of deep learning in real-world environmental monitoring.
Future research directions include extending this framework to monitor other hazardous building materials, integrating spatial statistical tools to identify risk hotspots, and enhancing data quality through structured citizen training programs. Ultimately, this approach offers a scalable and inclusive pathway for participatory environmental surveillance and asbestos risk mitigation.
Supplementary Materials
The following supporting information can be downloaded at: https://www.mdpi.com/article/10.3390/rs17132131/s1, Figure S1: ZIP file containing (1) 250 sample street-view images for model evaluation and FAIR compliance, and (2) a community outreach flyer used for public engagement.
Author Contributions
Conceptualization, T.-T.Y. and J.-C.L.; methodology, S.-C.L.; software, Y.-E.Y.; validation, Y.-E.Y., J.-C.L. and G.-W.L.; formal analysis, Y.-C.L.; investigation, Y.-C.L.; resources, T.-T.Y. and S.-C.L.; data curation, Y.-C.L.; writing—original draft preparation, Y.-C.L.; writing—review and editing, T.-T.Y.; visualization, Y.-E.Y.; supervision, T.-T.Y.; project administration, T.-T.Y.; funding acquisition, G.-W.L. All authors have read and agreed to the published version of the manuscript.
Funding
This research was funded by the Chemicals Administration, Ministry of Environment, Taiwan, under Grant No. 113DA015.
Data Availability Statement
The anonymized dataset, trained weights, and configuration files supporting this study are available in the Supplementary Materials (see supplementary_dataset.zip).
Acknowledgments
The authors extend their sincere gratitude to the Chemicals Administration, Ministry of Environment, Taiwan, and the Chung-Shin Survey Company for their invaluable support in administrative, technical, and research execution aspects. We are also deeply thankful to Tien-Hsiang Yu, Chief of Siaodong Village, East District, Tainan City, for his comprehensive assistance during the on-site investigations and for providing us with the opportunity to raise awareness among residents about the hazards of asbestos. Finally, we express our appreciation to all volunteers who helped with the on-site surveys, contributing significantly to the continuous refinement of the AI model. During the preparation of this manuscript, ChatGPT (OpenAI, GPT-4o) and Gemini (Google, 2.0 Flash) were used for text translation and manuscript proofreading. The authors have reviewed and edited the manuscript and take full responsibility for the content of this publication.
Conflicts of Interest
The authors declare no conflicts of interest.
Abbreviations
The following abbreviations are used in this manuscript:
| ACMs | Asbestos-Containing Materials |
| AI | Artificial Intelligence |
| API | Application Programming Interface |
| CNN | Convolutional Neural Network |
| FP | False Positive |
| FN | False Negative |
| GELAN | Generalized Efficient Layer Aggregation Network |
| GIS | Geographic Information System |
| GPS | Global Positioning System |
| GSV | Google Street View |
| IARC | International Agency for Research on Cancer |
| IoU | Intersection over Union |
| mAP | Mean Average Precision |
| MID | Unique Identifier |
| PPGIS | Public Participation GIS |
| PGI | Programmable Gradient Information |
| S.P. | Social Participation surveys |
| SVM | Support Vector Machine |
| TN | True Negative |
| TP | True Positive |
| UAV | Unmanned Aerial Vehicle |
| YOLOv9 | You Only Look Once Version 9 |
References
- Doll, R. Mortality from lung cancer in asbestos workers. Br. J. Ind. Med. 1955, 12, 81. [Google Scholar] [CrossRef] [PubMed]
- Kiviluoto, R. Pleural calcification as a reontgenologic sign of non-occupational endemic anthophyllite-asbesto-sis. Acta Radiol. 1960, 194, 1–67. [Google Scholar]
- Lynch, K.M.; Smith, W.A. Pulmonary asbestosis III: Carcinoma of lung in asbesto-silicosis. Am. J. Cancer 1935, 24, 56–64. [Google Scholar] [CrossRef]
- IARC. Asbestos (chrysotile, amosite, crocidolite, tremolite, actinolite, and anthophyllite). In IARC Monographs on the Evaluation of Carcinogenic Risks to Humans. A Review of Human Carcinogens; Part C: Arsenic, Metals, Fibres, and Dusts; IARC: Lyon, France, 2012; p. 219. [Google Scholar]
- Bassani, C.; Cavalli, R.M.; Cavalcante, F.; Cuomo, V.; Palombo, A.; Pascucci, S.; Pignatti, S. Deterioration status of asbestos-cement roofing sheets assessed by analyzing hyperspectral data. Remote Sens. Environ. 2007, 109, 361–378. [Google Scholar] [CrossRef]
- Cilia, C.; Panigada, C.; Rossini, M.; Candiani, G.; Pepe, M.; Colombo, R. Mapping of asbestos cement roofs and their weathering status using hyperspectral aerial images. ISPRS Int. J. Geo-Inf. 2015, 4, 928–941. [Google Scholar] [CrossRef]
- Gibril, M.B.A.; Shafri, H.Z.; Hamedianfar, A. New semi-automated mapping of asbestos cement roofs using rule-based object-based image analysis and Taguchi optimization technique from WorldView-2 images. Int. J. Remote Sens. 2017, 38, 467–491. [Google Scholar] [CrossRef]
- Krówczyńska, M.; Raczko, E.; Staniszewska, N.; Wilk, E. Asbestos—Cement roofing identification using remote sensing and convolutional neural networks (CNNs). Remote Sens. 2020, 12, 408. [Google Scholar] [CrossRef]
- Tommasini, M.; Bacciottini, A.; Gherardelli, M. A QGIS tool for automatically identifying asbestos roofing. ISPRS Int. J. Geo-Inf. 2019, 8, 131. [Google Scholar] [CrossRef]
- Hasan, H.; Shafri, H.Z.; Habshi, M. A comparison between support vector machine (SVM) and convolutional neural network (CNN) models for hyperspectral image classification. In Proceedings of the IOP Conference Series: Earth and Environmental Science, Kuala Lumpur, Malaysia, 25–27 August 2018; IOP Publishing: Bristol, UK, 2019; p. 012035. [Google Scholar]
- Yu, T.-T.; Lin, Y.-C.; Lan, S.-C.; Yang, Y.-E.; Wu, P.-Y.; Lin, J.-C. Mapping asbestos-cement corrugated roofing tiles with imagery cube via machine learning in Taiwan. Remote Sens. 2022, 14, 3418. [Google Scholar] [CrossRef]
- Baek, S.-C.; Lee, K.-H.; Kim, I.-H.; Seo, D.-M.; Park, K. Construction of Asbestos Slate Deep-Learning Training-Data Model Based on Drone Images. Sensors 2023, 23, 8021. [Google Scholar] [CrossRef] [PubMed]
- Gubiani, D.; Sgrazzutti, G.; Basso, M.; Viero, E.; Tavaris, D.; Foresti, G.L.; Scagnetto, I. A dynamic neural network model for the identification of asbestos roofings in hyperspectral images covering a large regional area. Comput.-Aided Civ. Infrastruct. Eng. 2025, 40, 879–894. [Google Scholar] [CrossRef]
- Abbasi, M.; Hosseiny, B.; Stewart, R.A.; Kalantari, M.; Patorniti, N.; Mostafa, S.; Awrangjeb, M. Multi-temporal change detection of asbestos roofing: A hybrid object-based deep learning framework with post-classification structure. Remote Sens. Appl. Soc. Environ. 2024, 34, 101167. [Google Scholar] [CrossRef]
- Zou, Z.; Chen, K.; Shi, Z.; Guo, Y.; Ye, J. Object detection in 20 years: A survey. Proc. IEEE 2023, 111, 257–276. [Google Scholar] [CrossRef]
- Imran, A.; Hulikal, M.; Gardi, H. Real Time American Sign Language Detection Using Yolo-v9. arXiv 2024, arXiv:2407.17950. [Google Scholar]
- Wang, C.-Y.; Yeh, I.-H.; Mark Liao, H.-Y. Yolov9: Learning what you want to learn using programmable gradient information. In Proceedings of the European conference on computer vision, Milan, Italy, 29 September–4 October 2024; pp. 1–21. [Google Scholar]
- Aranda, N.R.; De Waegemaeker, J.; Van de Weghe, N. The evolution of public participation GIS (PPGIS) barriers in spatial planning practice. Appl. Geogr. 2023, 155, 102940. [Google Scholar] [CrossRef]
- Fatima, Z.; Tanveer, M.H.; Mariam, H.; Voicu, R.C.; Rehman, T.; Riaz, R. Performance Comparison of Object Detection Models for Road Sign Detection Under Different Conditions. Int. J. Adv. Comput. Sci. Appl. 2024, 15, 996–1005. [Google Scholar] [CrossRef]
- Anselin, L. Local indicators of spatial association—LISA. Geogr. Anal. 1995, 27, 93–115. [Google Scholar] [CrossRef]
- Moran, P.A. Notes on continuous stochastic phenomena. Biometrika 1950, 37, 17–23. [Google Scholar] [CrossRef] [PubMed]
Disclaimer/Publisher’s Note: The statements, opinions and data contained in all publications are solely those of the individual author(s) and contributor(s) and not of MDPI and/or the editor(s). MDPI and/or the editor(s) disclaim responsibility for any injury to people or property resulting from any ideas, methods, instructions or products referred to in the content. |
© 2025 by the authors. Licensee MDPI, Basel, Switzerland. This article is an open access article distributed under the terms and conditions of the Creative Commons Attribution (CC BY) license (https://creativecommons.org/licenses/by/4.0/).