Article

Can Measurement and Input Uncertainty Explain Discrepancies Between the Wheat Canopy Scattering Model and SMAPVEX12 Observations?

Department of Infrastructure Engineering, The University of Melbourne, Parkville, VIC 3010, Australia
*
Author to whom correspondence should be addressed.
Remote Sens. 2025, 17(1), 164; https://doi.org/10.3390/rs17010164
Submission received: 29 September 2024 / Revised: 4 December 2024 / Accepted: 17 December 2024 / Published: 6 January 2025

Abstract

:
Realistic representation of microwave backscattering from vegetated surfaces is important for developing accurate soil moisture retrieval algorithms that use synthetic aperture radar (SAR) imagery. Many studies have reported considerable discrepancies between the simulated and observed backscatter. However, there has been limited effort to identify the sources of errors and contributions quantitatively using process-based backscatter simulation in comparison with extensive ground observations. This study examined the influence of input uncertainties on simulated backscatter from a first-order radiative transfer model, named the Wheat Canopy Scattering Model (WCSM), using ground-based and airborne data collected during the SMAPVEX12 campaign. Input uncertainties to WCSM were simulated using error statistics for two crop growth stages. The Sobol’ method was adopted to analyze the uncertainty in WCSM-simulated backscatters originating from different inputs before and after the wheat ear emergence. The results show that despite the presence of wheat ears, uncertainty in root mean square (RMS) height of 0.2 cm significantly influences simulated co-polarized backscatter uncertainty. After ear emergence, uncertainty in ears dominates simulated cross-polarized backscatter uncertainty. In contrast, uncertainty in RMS height before ear emergence dominates the accuracy of simulated cross-polarized backscatter. These findings suggest that considering wheat ears in the model structure and precise representation of surface roughness is essential to accurately simulate backscatter from a wheat field. Since the discrepancy between the simulated and observed backscatter coefficients is due to both model and observation uncertainty, the uncertainty of the UAVSAR data was estimated by analyzing the scatter between multiple backscatter coefficients obtained from the same targets near-simultaneously, assuming the scatter represents the observation uncertainty. Observation uncertainty of UAVSAR backscatter for HH, VV, and HV polarizations are 0.8 dB, 0.87 dB, and 0.86 dB, respectively. Discrepancies between WCSM-simulated backscatter and UAVSAR observations are discussed in terms of simulation and observation uncertainty.

Graphical Abstract

1. Introduction

Active microwave remote sensing, particularly synthetic aperture radar (SAR), has been extensively used in the field of agriculture for soil and crop monitoring [1,2,3,4,5] owing to its ability to provide all-weather data, ability to penetrate clouds and vegetation canopies, and the sensitivity of the radar backscatter to dielectric properties of the target objects. In the presence of vegetation, the backscatter coefficient is influenced by surface parameters such as soil roughness and soil moisture content, the crop biophysical parameters (crop water content), and the geometric properties of the crop canopy. However, not all parameters contribute to the backscatter coefficient equally; thus, accurate soil and crop monitoring in agricultural fields using SAR data depends on a comprehensive understanding of the surface scattering processes. As radar responds to both the soil and vegetation, accurate modeling of the contributions of soil and crop parameters in backscattering models is required, which is more challenging than modeling scattering from bare soil.
Physical scattering models are developed based on the interaction of electromagnetic waves with the vegetation canopy where the canopy is modeled as either a continuous medium or a discrete medium [6,7]. The continuous medium approach assumes random fluctuations in the permittivity of the canopy and the average backscattering cross-section of vegetation is estimated using the mean and correlation of the permittivity [6]. The main deficiency of continuous medium models [8,9,10] is their inability to relate the inputs of the model to the actual physical properties of the vegetation causing the scattering. In the discrete medium approach, the canopy is regarded as a collection of randomly distributed discrete scatterers with average sizes and shapes representing the various vegetation components [7,11,12,13]. The discrete scatterers are generally assumed to be distributed in one or two layers. The discrete medium approach can be based on analytic wave theory or radiative transfer theory. Analytic wave theory relies on Maxwell’s equations and approximations [14,15,16] are made to obtain practical results. However, since the wave theory approaches ignore multiple incoherent scattering from discrete targets, its use is typically limited to weakly scattering media [17]. In contrast, radiative transfer theory can account for more complex scattering behaviors of discrete targets, which is thus well-suited for vegetation media where the scatterers have discrete configurations and a markedly higher dielectric constant than that of the background which is air [11].
The radiative transfer approach [18] is developed based on the energy balance, and the commonly used radiative transfer models for vegetation range from the zeroth-order Water Cloud Model (WCM) [19] to more sophisticated first-order models including the Single Scattering Radiative Transfer Model (SSRT) [20], the Michigan Microwave Canopy Scattering Model (MIMICS) [11], and the Tor Vergata model [21], followed by second- and higher-order models. Whereas zeroth-order models only involve vegetation scattering and ground scattering attenuated by vegetation, first- or higher-order models include the interactions between the canopy and ground. The Water Cloud Model (WCM), which is also known as the tau-omega model, was developed based on a zeroth-order radiative transfer solution where the vegetation canopy is characterized as a collection of uniformly distributed water droplets [19]. The two main deficiencies in the WCM are the assumption of vegetation as a single layer with a uniform distribution of vegetation moisture content which is a huge simplification of the reality when a canopy is generally made up of discrete scatterers (leaves, stems, ears, etc.) and the absence of multiple scattering between the soil and canopy and within the canopy [22,23,24]. In comparison, the first- or higher-order radiative transfer models improve the representation of scattering from agricultural fields more realistically.
Wheat is a major agricultural crop grown in many regions of the world that accounts for 28% of the global grain production. Thus, improved management of wheat cropping fields and wheat yield enabled by accurate soil moisture monitoring is important for food security and sustainable agriculture. SAR data are ideal for wheat crop monitoring owing to their outstanding ability to provide all-weather data and sensitivity for the characteristics of both wheat crops and the soil underneath [1,2,25]. Several attempts have been made to simulate backscatter from a wheat field using first- or higher-order radiative transfer approaches. The Michigan Microwave Canopy Scattering Model (MIMICS) is based on the first-order radiative transfer equation. It was initially developed to simulate backscatter from a horizontally continuous forest canopy [11]. By eliminating the trunk component, it was later adapted to simulate L- and C-band co-polarized backscatter from wheat fields [26]. To this end, it was assumed that a wheat canopy could be represented by plane rectangular leaves and cylindrical stems. The adapted MIMICS model used the Physics Optics (PO) model to simulate the soil scattering because it was more suitable in an agricultural context than the Geometrical Optics (GO) and Small Perturbation Method (SPM) models [27]. The main shortcoming of PO, GO, and SPM soil scattering models is that they are applicable for only a particular range of soil roughness values [17]. When comparing the modeled backscatter from the adapted MIMICS model simulations against Canada Centre for Remote Sensing (CCRS) ground-based scatterometer measurements, higher simulation precision was achieved for HH than VV for both L- and C-bands [26]. The adapted MIMICS model often underestimates total backscatter which has been attributed to either a missing scattering element or systematic bias in field measurements [26]. Limitations of the adapted MIMICS model include the fact that it only simulates co-polarized backscatter and that it neglects the scattering from wheat ears.
A second-order radiative transfer approach has also been used to model the backscatter from a wheat canopy by Cookmartin et al. [28]. They considered the wheat to be a multi-layer canopy over a rough soil surface where stems were modeled as cylinders with finite lengths and leaves as circular or elliptical discs. Surface scattering was computed using the semi-empirical Oh model [29]. Unlike early in the season, large discrepancies were observed between the modeled and measured backscatter towards the fully developed stage of the wheat crop. This has been attributed to overestimated attenuation in the wheat canopy due to the fact that the predicted backscatter was often underestimated. It has been suggested that the contribution from second-order scattering terms to total scattering is no more than 0.5 dB for cereal crops [28]. Another study [30] used the first-order radiative transfer approach with the wheat canopy modeled as curved elliptical leaves and long cylindrical stems in combination with the Integral Equation Model (IEM) soil scattering model that was developed to bridge the gap between Physics Optics (PO), Geometrical Optics (GO), and Small Perturbation Method (SPM) soil scattering models [31]. This approach still did not accurately predict backscatter. The two main deficiencies common to the above scattering models for wheat canopies are the neglect of the scattering contribution from wheat ears [32] and/or the surface scattering of the soil being overly simplified.
To address the above deficiencies, the Wheat Canopy Scattering Model (WCSM) [32] was proposed. The WCSM considers scattering from the surface and several crop components including wheat ears to estimate the total backscatter with the intention that no data fitting would be required. The WCSM was developed based on the first-order radiative transfer equations and soil scattering is estimated using the Advanced Integral Equation Model (AIEM) [33], a well-established theoretical soil scattering model. In the WCSM, the wheat canopy is represented as a two-layer medium above the rough soil surface. The model was initially developed for use in wheat crop growth monitoring and validated using C-band SAR data only. Simulation errors of less than 1.8 dB were found for co- and cross-polarized backscatter from the elongating to milking growth stages. The applicability of WCSM to other bands is yet to be explored.
Although scattering predictions have performed well against laboratory conditions, testing against field data has found significant discrepancies between simulated and observed backscatter [34]. This has often been attributed to the scale mismatch that arises when comparing point-scale simulations to pixel-scale radar observations [35,36] or inaccuracies in models concerning missing scattering elements [26,37]. While uncertainties in the model outputs caused by soil moisture and surface roughness have been analyzed by applying a Markov Chain Monte Carlo-based sampling strategy on several bare soil scattering models coupled with WCM [34], there has been limited effort to identify sources of errors using a first- or higher-order model with extensive soil and crop measurements.
Generally, differences in observed and simulated backscatter can be decomposed into observation and model uncertainty. Model uncertainty can be further categorized into uncertainty arising from inputs, model structure, and tunable parameters. Previous studies have rarely discussed discrepancies between simulated and observed backscatter in terms of observation uncertainty and model uncertainty, which are important to understand when assessing model performance. The WCSM requires multiple input data including the radar configuration, and various soil and crop biophysical and geometric properties to simulate backscatter. Overall, the geometric properties of the wheat crop components and ground measurements have associated uncertainties due to imperfect measurements and spatial variability that then propagate through the scattering model, in addition to any model structural deficiencies. Hence, it is important to understand to what extent model and observation uncertainty can explain the differences between radar observations and simulations allowing inferences about the importance of these sources of uncertainty together with the model structural uncertainty to be made.
Understanding major input uncertainties in scattering models is critical for carefully organizing experimental campaigns and for model optimization purposes. To understand the simulation precision of the adapted MIMICS backscattering model for wheat fields at L- and C-bands, Toure et al. [26] undertook an error analysis where they estimated the simulation uncertainty caused by the uncertainties in input parameters and compared those, together with measurement uncertainty, to the total error. However, they only considered the errors associated with the canopy (leaves and stems only) and soil moisture, not soil roughness. As L-band backscatter is more sensitive to soil roughness than soil moisture content [38] and scattering from wheat ears dominates over the contributions from leaves and stems at C-band [32,37], it is important to analyze how uncertainties associated with those inputs influence simulated L-band backscatter.
The objective of this study is to explore the factors causing discrepancies between backscattering model simulations and radar observations in terms of both model and observation uncertainty. We hypothesize that a significant portion of the discrepancy originates from the uncertainties in the input variables of WCSM and SAR data. Consequently, we focus our analysis on the impact of errors in the input and SAR imagery on the simulated backscatter by WCSM. This analysis is based on SMAPVEX12 campaign data. First, we compare WCSM L-band model simulations with UAVSAR observations. Then, we use the Sobol’ method [39] to understand uncertainty in WCSM simulations due to input factors. Next, we analyze the multiple UAVSAR images acquired with the same field conditions and different incidence angles to estimate the observation uncertainty. This then enables us to infer how much of the discrepancy between simulated and observed backscatter (total uncertainty) is related to input and observation uncertainties and better identify the contribution of model structural uncertainty. Based on the results of the uncertainty analyses of this study, we expect to answer the following questions: (1) To what extent does the combination of uncertainty in ground measured variables and UAVSAR observations explain the differences in observed and simulated backscatter? (2) What are other possible reasons for discrepancies between observed and simulated backscatter? and (3) What are the implications of uncertainty analysis for the modeling community and future experimental campaigns?

2. Models and Materials

2.1. Wheat Canopy Scattering Model

The Wheat Canopy Scattering Model (WCSM) [32] is a physically based microwave scattering model developed based on the first-order radiative transfer process. The model is capable of simulating backscatter from wheat and soil at multiple growth stages. In the WCSM, the wheat canopy is assumed to be a two-layer dielectric medium upon a rough soil surface (Figure 1). Layer 1 consists of wheat ears and 20% of leaves in the canopy while the lower layer accounts for the remaining 80% of leaves and the stems. Wheat ears are modeled as randomly oriented short dielectric cylinders with a slight vertically inclined morphology while stems are considered to be vertical slim cylinders with finite length. Leaves are treated as vertically inclined long thin elliptic dielectric discs. As wheat ears are considered to be a discontinuous layer, attenuation from wheat ears is not considered. Orientations of wheat canopy scatterers are simulated separately using probability distribution functions [32]. In addition, WCSM uses the Advanced Integral Equation Model (AIEM) [33] to simulate the scattering from the soil underneath the two-layer wheat canopy.
The total backscatter intensity simulated by the WCSM is the linear combination of volume scattering of ears, leaves and stems, their double-bounce scattering with the ground surface, and attenuated ground surface scattering (Equation (1)).
σ t o t a l 0 = σ g r o u n d 0 + σ e a r 0 + σ e a r g r o u n d 0 + σ l e a f 0 + σ l e a f g r o u n d 0 + σ s t e m 0 + σ s t e m g r o u n d 0
The WCSM simulates the radar backscatter based on wheat crop biophysical and geometric parameters, soil characteristics, and radar configuration parameters (Table 1). The soil dielectric constant is calculated using the Dobson model [40], and the dielectric properties of wheat ears, stems and leaves are calculated based on the Debye–Cole dual–dispersion model (with the Debye relaxation term) [41].

2.2. SMAPVEX12 Campaign

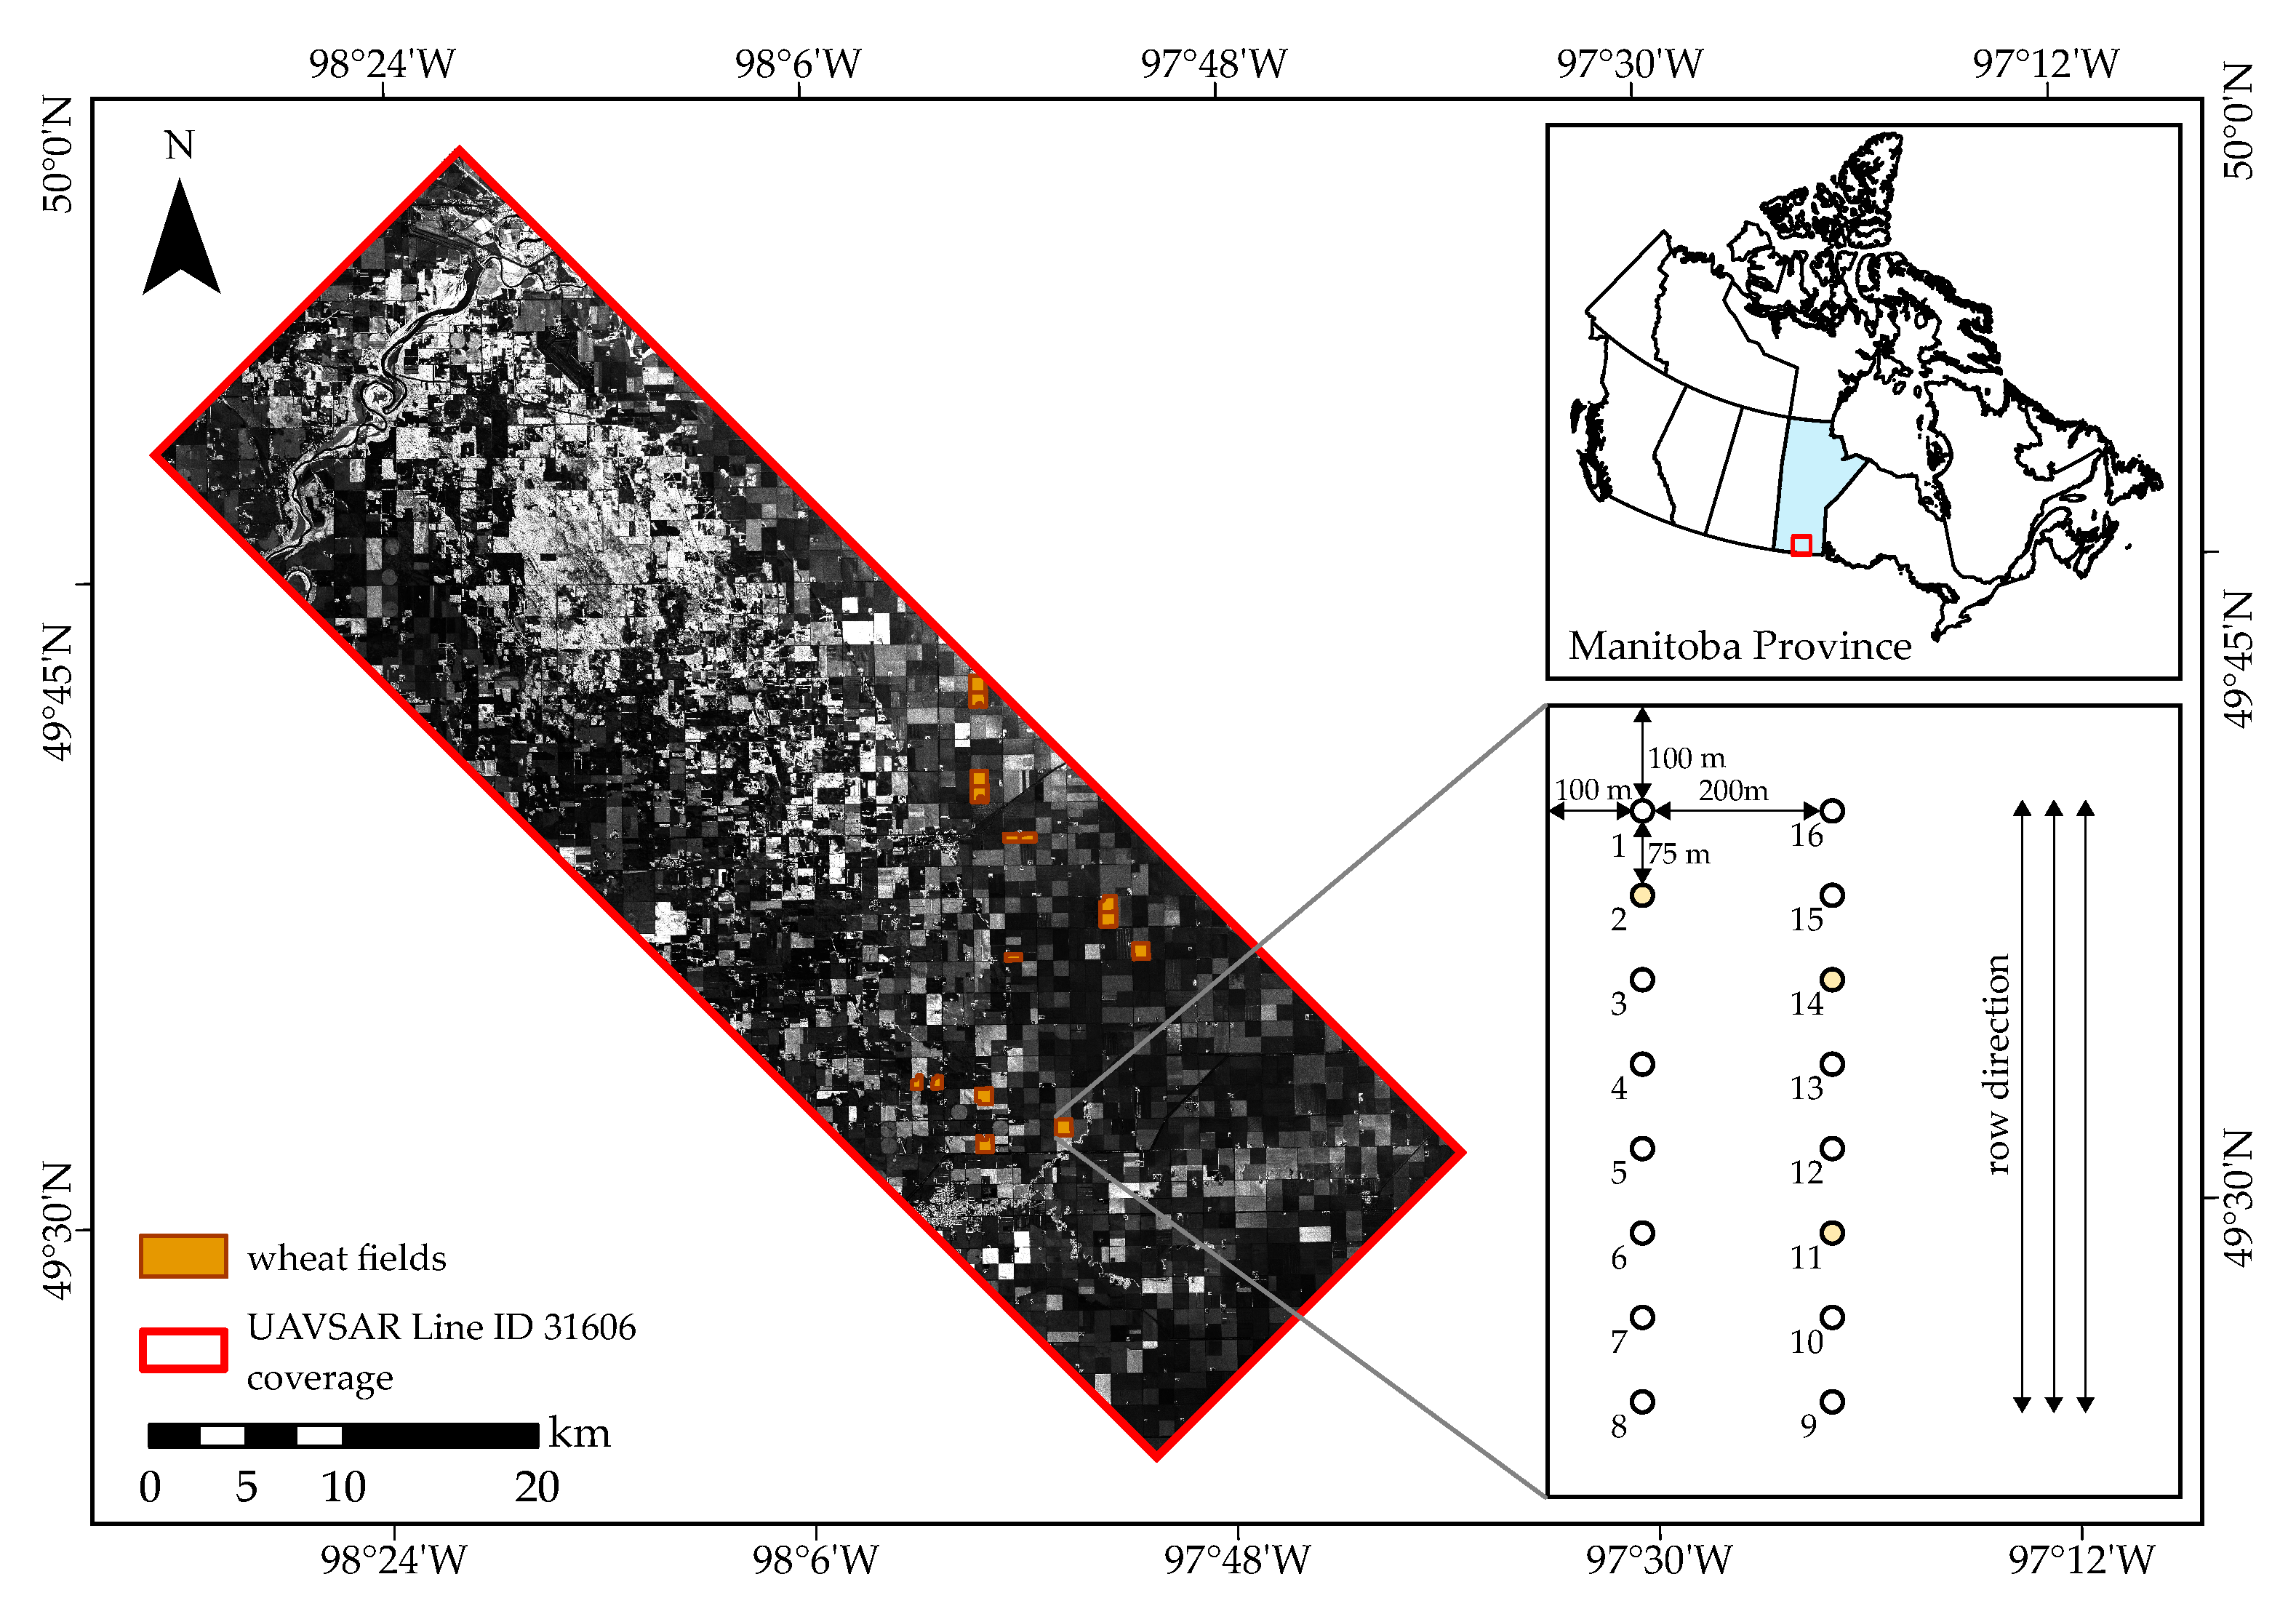
We used the ground measurements and airborne SAR images collected during the Soil Moisture Active Passive Validation Experiment 2012 (SMAPVEX12). The SMAPVEX12 campaign was conducted over an area of 12.8 km × 70 km with a topography of flat to moderately undulating slopes (maximum slope of 2%), located south of Winnipeg, Manitoba, Canada (Figure 2). The study area consisted of forest cover and agriculture land cover with a wide range of crop types: soybean, wheat, winter wheat, oat, corn, canola, pasture, and forage [42]. Soil texture varied from loamy fine sands in the west to heavy clay in the east featuring significant spatial variability in soil moisture across the study site [42]. The campaign was conducted from the early stage of crop growth (7 June 2012) until maximum biomass accumulation (19 July 2012) during which crop conditions and soil moisture varied considerably [1,43].

2.2.1. Ground Measurements

Ground measurements of soil and crops collected in 14 wheat fields (11 spring wheat and 3 winter wheat fields) were used in the current study (Table 1). Ground samples were collected in experimental fields of at least 800 m × 800 m in size. For each field, soil moisture (top 6 cm) was measured at 16 sampling locations, 8 in each of the two parallel transects, to capture the spatial variability across the field. In addition, soil temperature measurements were made at sampling locations #1, #8, #9, and #16 of each field. Furthermore, the ground surface data collection was conducted on the same day as the airborne image acquisition to minimize the effect of temporal variability in the measurements. For logistical reasons, wheat crop parameters (crop height, stem diameter and crop water content) were made at the sampling locations numbered #2, #11, and #14 in each field on non-flight dates. Therefore, the forward simulations for this study were only made at each of those three sampling locations for each wheat field. Ground measurements of soil were made over 11 days across the SMAPVEX12 campaign.

2.2.2. Remote Sensing Data

The Uninhabited Aerial Vehicle Synthetic Aperture Radar (UAVSAR) [44] is an airborne fully polarimetric L-band (frequency of 1.26 GHz and a wavelength of 23.84 cm) SAR that NASA JPL developed. The nominal flight altitude for SMAPVEX12 was 13 km and the speed of the aircraft was 220 m/s [42]. Four flight lines (line ID: 31603, 31604, 31605, and 31606) were set to provide full coverage of the study area. UAVSAR was configured to face the left of the flight direction with the incidence angle varying between 25° and 65°. This study utilizes 14 scenes for backscatter observation uncertainty analysis and 11 scenes (marked * in Table 2 due to soil moisture availability) in exploring the performance of the WCSM at L-band SAR of each four-line IDs in the study.

3. Methods

3.1. Overview

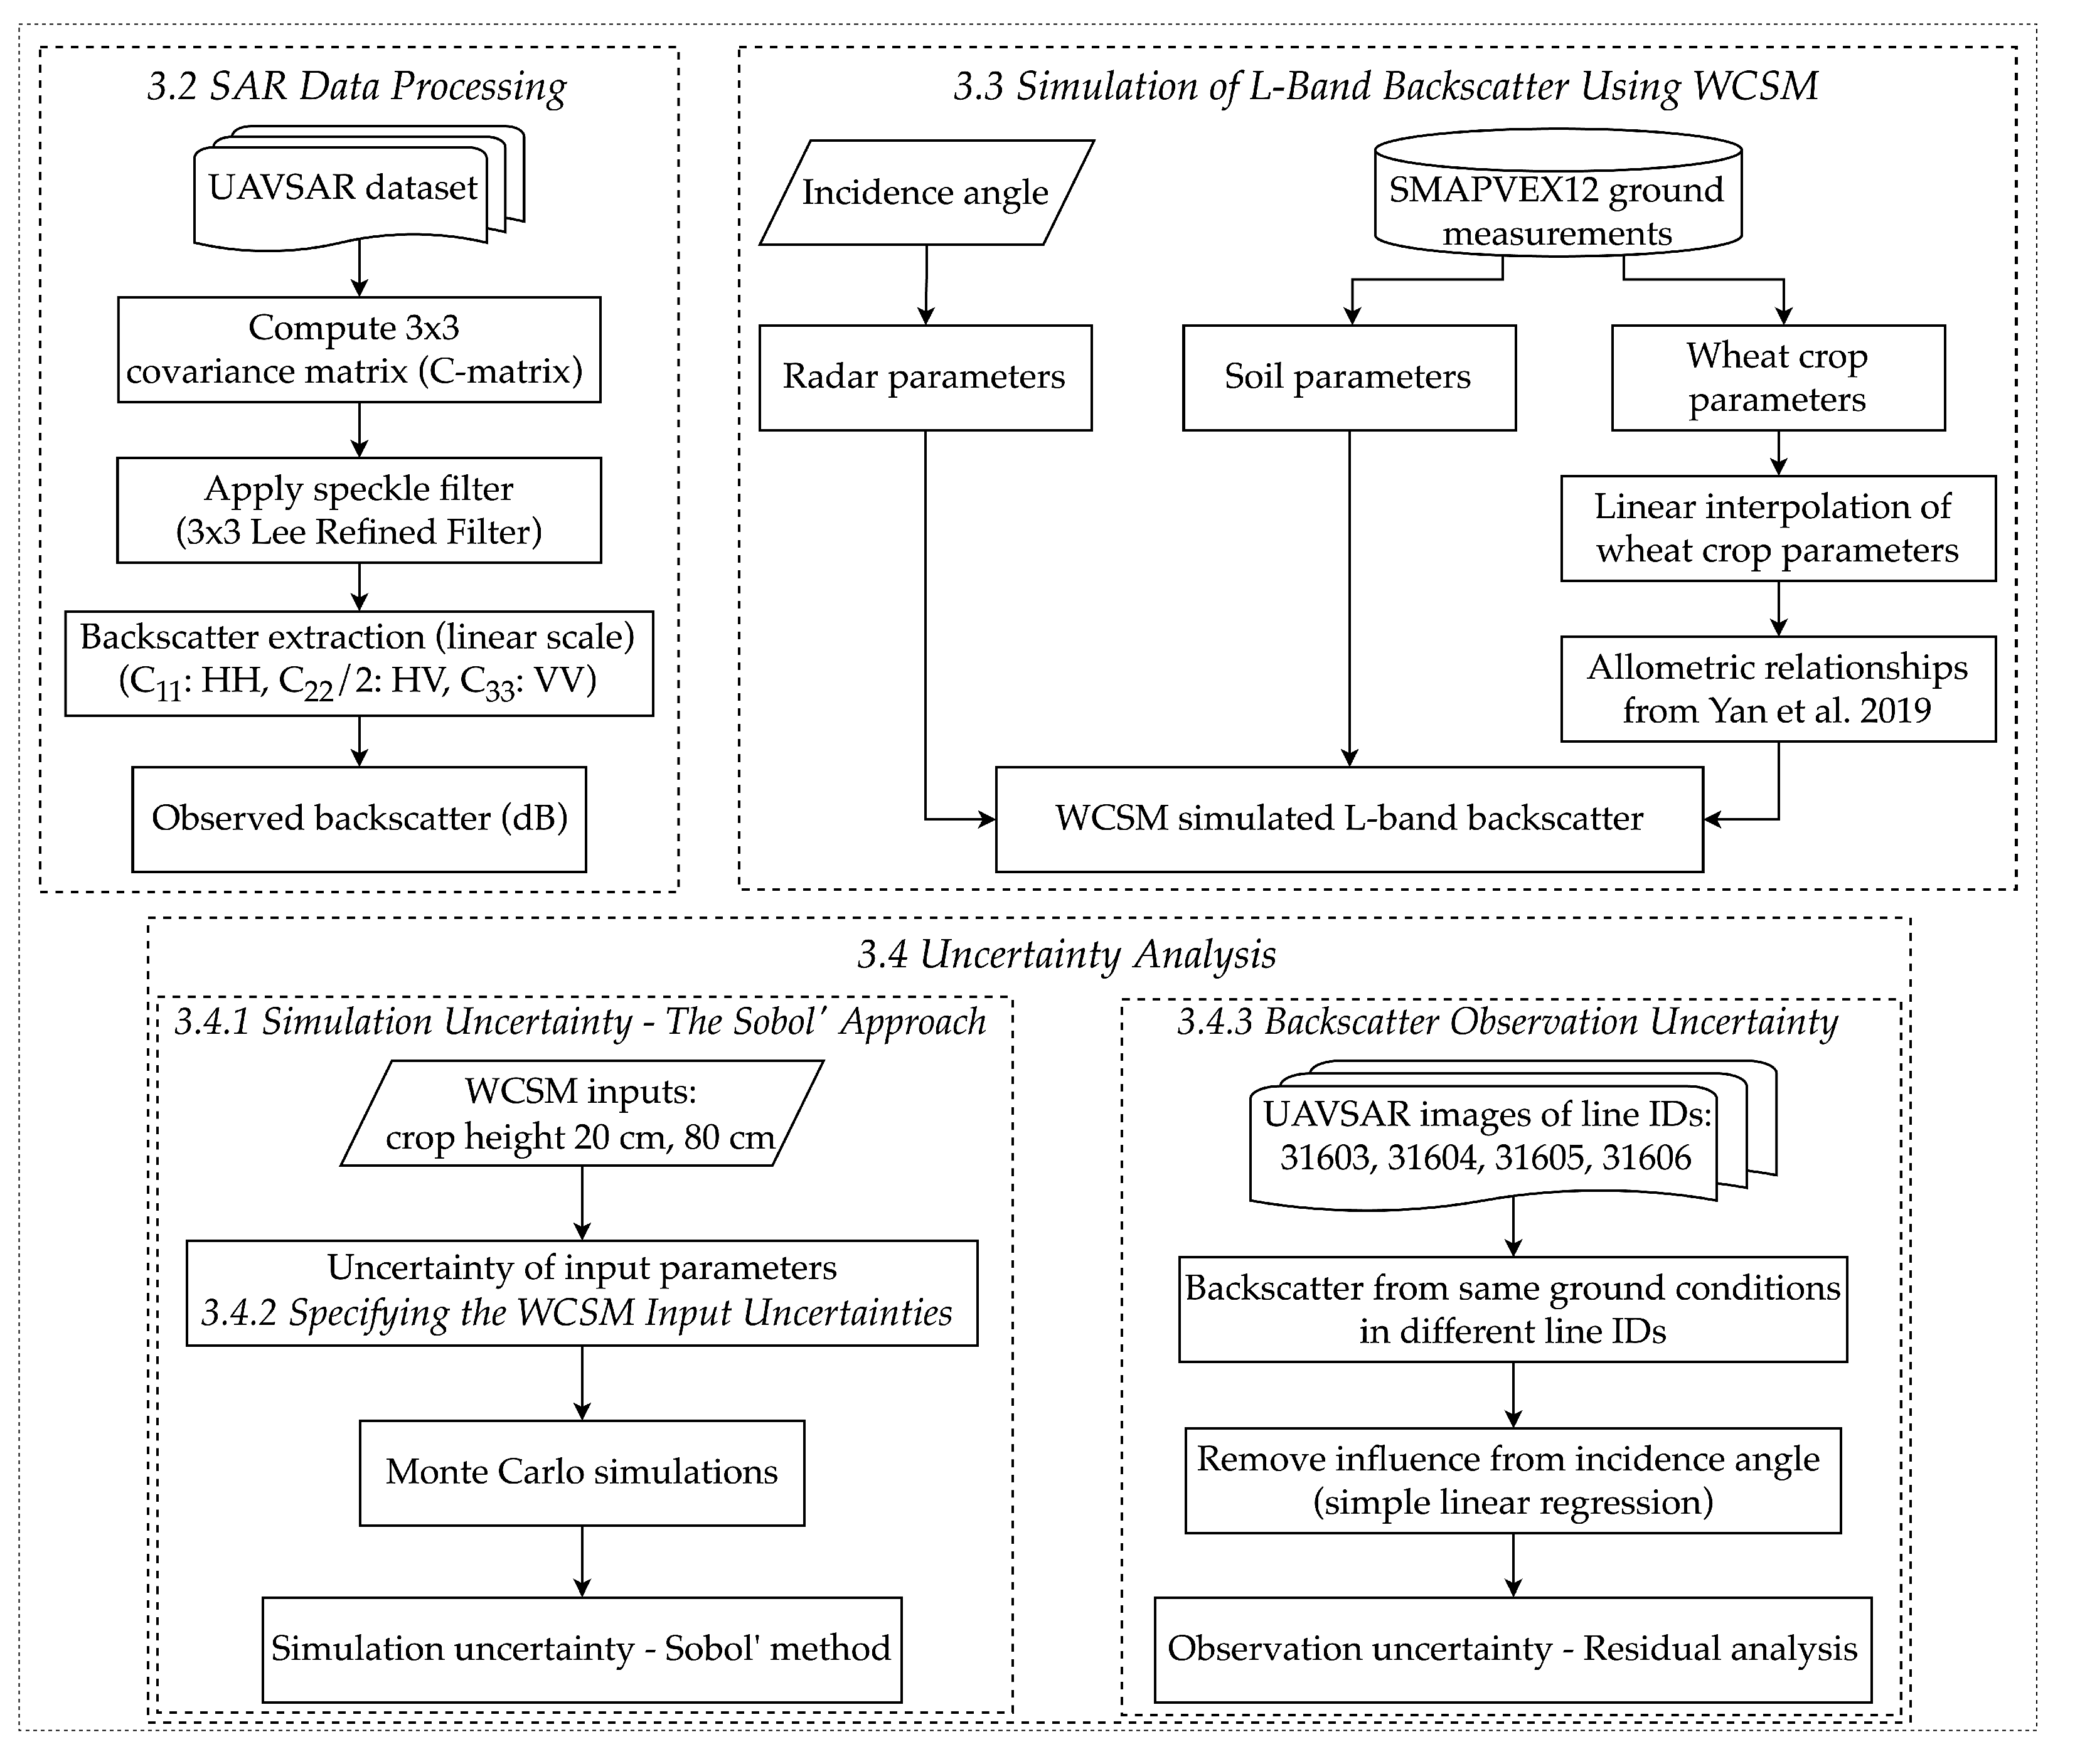
We used the SMAPVEX12 campaign ground measurements and UAVSAR image acquisitions to evaluate the Wheat Canopy Scattering Model (WCSM) performance at L-band. Figure 3 presents the methodology of this study. First, L-band SAR forward simulations corresponding to the ground measurements were undertaken using the WCSM and compared with the respective UAVSAR backscatter values in all the wheat fields for all four flight lines. Next, to understand the reasons for discrepancies, we conducted an uncertainty analysis. We tried to understand the crucial factors for simulation uncertainty using the Sobol’ method to comprehend how the uncertainties associated with input factors to WCSM can influence simulated backscatter for two crop growth stages (crop height 20 cm without wheat ears and crop height 80 cm with wheat ears). Multiple UAVSAR image acquisitions (4 different line IDs) were made across the study area during SMAPVEX12 on each flight date with common sampling locations. To understand the uncertainty in observed data, we extracted the UAVSAR backscatter values of the common sampling locations from different acquisitions on the same date which were repeated for all flight dates and analyzed them to calculate observed backscatter uncertainty for all three polarizations.

3.2. SAR Data Processing

The UAVSAR multi-looked and complex ground range detected (GRD) products from 3 m spatial resolution files were processed in PolSARpro version 6.0 (ESA-STEP) [45]. First, the polarimetric 3×3 covariance matrix (C-matrix) was generated from the GRD dataset for which speckle noise suppression (3×3 Lee Refined Filter) was applied [46]. Diagonal elements of the C-matrix (C11, C22, C33) from 3 m pixels were then spatially averaged over a 9 m (i.e., 3×3 pixel) window at the sampling locations #2, #11, and #14 of each wheat field for all the scenes (Table 2) using ArcMap version 10.8.1 (Esri). Finally, the backscatter values in linear scale were converted into decibels (dB) to compute σ H H 0 (C11), σ H V 0 (C22/2) and σ V V 0 (C33).

3.3. Simulation of L-Band Backscatter Using WCSM

For each overpass, the WCSM was used to simulate backscatter at the sampling locations #2, #11, and #14 for each experimental wheat field where ground crop samples were made. In addition to soil and wheat crop data, radar configuration parameters (frequency and incidence angle) are required to simulate backscatter using the WCSM. The location-specific incidence angle is essential to acquire precise forward simulations as the incidence angle in wheat fields generally varies within 23°–63°. The incidence angle file (.inc) provided with UAVSAR data contained the local incidence angle which is the angle between the surface normal and the radar line of sight. Location-specific incidence angles were extracted after spatially averaging over a 9 m window to use as one of the inputs to WCSM.
The ground data were used to specify WCSM inputs as follows. The three repeat soil moisture measurements made using a handheld Stevens Water Hydra Probe or Delta-T Theta Probe [42] from each sampling location were averaged. The average of soil temperature measurements at sampling locations #1, #8, #9, and #16 of each field was used as the soil temperature of the simulation sampling locations. Soil surface roughness was measured keeping a portable pin profilometer (1 m wide with 0.5 cm pin spacing) parallel to the look direction of UAVSAR flights at sampling locations #1 and #2 and the average root mean square (RMS) height and correlation length from these two locations were used for each backscatter simulation location in each field. The exponential autocorrelation function (ACF) was used as the surface roughness correlation function. It was assumed that surface roughness remained unchanged during the campaign as further tillage operations were not conducted, and negligible macrostructure changes occurred due to surface erosion [42,43]. Soil textural properties were collected for each field at either sampling location #3 or #12. Surface roughness, soil texture, and temperature were assumed to be constant across the field.
Wheat crop height, stem diameter, and crop water content (CWC) were also measured; however, as there were gaps of up to 13 days between wheat crop parameters and UAVSAR acquisitions, crop data were linearly interpolated to estimate the wheat crop characteristics corresponding to UAVSAR image acquisitions. CWC measurements (kg of water/kg of wet biomass) during SMAPVEX12 were measured for the total crop (stems, leaves and ears), the stems and leaves combined, and ears separately for the sampling location #2. At sampling locations #11 and #14 only the CWC of the total crop was measured. The WCSM requires CWC of the leaves, stems and ears separately. Using the ratio between the CWC of each wheat crop component to the total CWC at sampling location #2 for each field, the water content of ‘ears’ and ‘leaf & stem’ were calculated for the sampling locations #11 and #14. In addition, it was further assumed that the CWC of leaves and stems was the same. Due to high variability in crop height and stem diameter, 10 measurements were made at each location (#2, #11, and #14) on each wheat crop parameter collection day and the average for each day was used to represent the field condition.
In addition to the crop properties above, the geometric properties of the leaf (length, width, thickness), stem (height), ear (height and diameter), and panicle (height) are required as inputs to the WCSM (Table 1). As the other explicit geometric properties were not available in the SMAPVEX12 geodatabase, data from Yan et al. [32] were used to derive allometric relationships to estimate these geometric properties to be input into the WCSM. The wheat fields were in the heading and flowering stages between 17 June–8 July 2012 [46]; therefore, it was assumed that wheat ears started emerging in all the wheat fields after 17 June 2012. Finally, crop density (number of stems/m2) for each field was calculated using the mean number of plants along a 1 m length of a row and the average row spacing, both of which were measured at each field.
Once all the input data were prepared, forward simulations for sampling locations #2, #11, and #14 for all the wheat fields (Field ID: 31, 32, 41, 42, 44, 45, 65, 73, 74, 81, 85, 91, 104, 105) were conducted using WCSM, which were then compared with their corresponding observed backscatter values. The performance of WCSM-simulated backscatter was estimated using the root mean square error (RMSE) (Equation (2)), bias (Equation (3)) and Pearson correlation coefficient (R) (Equation (4)) where Y ^ i is simulated backscatter, σ Y i ^ is the standard deviation of simulated backscatter, Y i is observed backscatter, σ Y i is the standard deviation of observed backscatter, and N is the number of simulations.
R M S E = i = 1 N ( Y ^ i Y i ) 2 N
B i a s = i = 1 N ( Y ^ i Y i ) N
R = 1 N i = 1 N ( Y ^ i 1 N i = 1 N Y ^ i ) ( Y i 1 N i = 1 N Y i ) σ Y i ^ σ Y i

3.4. Uncertainty Analysis

The aim of this study is to investigate the factors responsible for the discrepancies between WCSM simulations and UAVSAR observations. More specifically, we examined the impact of observation uncertainty and WCSM input uncertainty on the discrepancy. Uncertainty in simulated backscatter from WCSM is likely due to uncertainty in input factors and structural deficiencies that propagate through the model. Due to the limited ground measurements available to assess the structural deficiency of WCSM, we focus our analysis on the impact of input uncertainty on the simulated backscatter by WCSM. This study uses the Sobol’ approach to understand uncertainty in WCSM simulations due to input factors. Next, the multiple UAVSAR images acquired with the same field conditions (soil and crop) and different incidence angles are utilized to estimate uncertainty in UAVSAR data.

3.4.1. Simulation Uncertainty—The Sobol’ Approach

WCSM is a nonlinear discrete scattering model that requires multiple inputs of the canopy, wheat ear, leaf, stem, soil and radar configurations (Table 1) to simulate backscatter from a wheat field. Often all those inputs are not measured or available from experimental campaigns. Therefore, this study adopted allometric relationships to estimate the inputs that were not available from the SMAPVEX12 campaign. In this study, the Sobol’ method [39] is used to identify and decompose the WCSM uncertainty associated with input uncertainties into effects associated with each input at two crop growth stages: before (crop height 20 cm without wheat ears) and after heading (crop height 80 cm with wheat ears).
Monte Carlo methods can be used to propagate uncertainty in model inputs to simulation outputs, provided the input uncertainty can be specified. The Sobol’ method enables the simulation uncertainty from Monte Carlo to be decomposed into the effects of different inputs. While this is typically used for sensitivity analysis, with careful specification of the error distributions for model inputs, it can also be used in the context of model uncertainty analysis and is hence used here. In addition, the Sobol’ method is capable of handling nonlinear and nonmonotonic functions, thus ideal to be applied to identify and quantify crucial input factors in a radiative transfer model [47].
The Sobol’ method is a global sensitivity analysis technique that uses a variance-based concept to quantify the amount of variance due to each input factor; V( X i ) towards the unconditional variance of the output V(Y), incorporating variability in the input factors through probability distribution functions using Monte Carlo simulations [39].
The first-order sensitivity index ( S i ), which is also referred to as the ’main effect’ of each input factor, is the variance contribution of each input parameter ( X i ) on total model variance (Equation (5)) while the second-order sensitivity index represents the interaction between parameters i and j (Equation (6)). Total sensitivity ( S T i ) is the sum of main effects and all their interactions with other parameters (second- and higher; up to k t h order) (Equation (7)).
S i = V i V = V [ E ( Y | X i ) ] V
S i j = V i j V
S T i = S i + i j S i j + i j k S i j k + . . .
The original Sobol’ method requires n · ( 2 k + 1 ) model runs to estimate S i and S T i where n is the sample size (generally n = 1000 is considered) and k is the number of input factors. As the interested factors in our case is 20, we used the method proposed by Saltelli [48], in which a reduced number of model simulations n · ( k + 2 ) are proposed.

3.4.2. Specifying the WCSM Input Uncertainties

Typical ranges of uncertainty for nine input parameters to WCSM (marked * in Table 3) were obtained from published literature [26] (we assumed that uncertainties were presented by 1 standard deviation in Toure et al. [26]), and the uncertainties for the rest of the factors in Table 3 were chosen based on general knowledge. However, uncertainty values for ear height, ear diameter, and stem height were not available in the published literature. As we considered allometric relationships (linear regression) between relevant crop components and crop height to estimate those factors using the data from Yan et al. [32], we considered the standard deviation of residuals ( ε —root mean square error) as the uncertainty of each of those factors.
Once the uncertainty ranges of all input parameters were prepared, input values were varied in their respective ranges following a Gaussian normal distribution and Monte Carlo simulations were obtained using the WCSM. This was repeated for two sets of input values for crop height 20 cm (before heading) and 80 cm (after heading; shown in Table 3). Thereafter, we calculated the standard deviation of the simulated backscatter and used the Sobol’ method to obtain the sensitivity indices and interpreted how the uncertainties affiliated with each input factor influence the simulated HH-, VV-, and HV-polarized backscatters based on the total sensitivity index for both the crop growth stages.

3.4.3. Backscatter Observation Uncertainty

Estimating observation uncertainty is possible with multiple observations of the same point. The SMAPVEX12 study area is covered by four UAVSAR flight lines, namely 31603 (5 wheat fields), 31604 (6 fields), 31605 (13 fields including field #55), and 31606 (15 fields including field #55), and near-simultaneous images corresponding to these four flight lines were acquired on the flight dates. We assumed that the variability of repeat measurements represents observation uncertainty. Irrespective of the field conditions (soil and crop) for a sampling location within all line ID acquisitions, only the incidence angle changed within different line IDs which has a systematic impact on observed backscatter. Consequently, after removing the systematic difference, it is assumed that variability represents the observation uncertainty. Thus, backscatter from the same locations were compared with each other and the systematic influence by incidence angle was removed fitting a simple linear regression model to calculate the variability of residuals which represents the uncertainty in UAVSAR data.
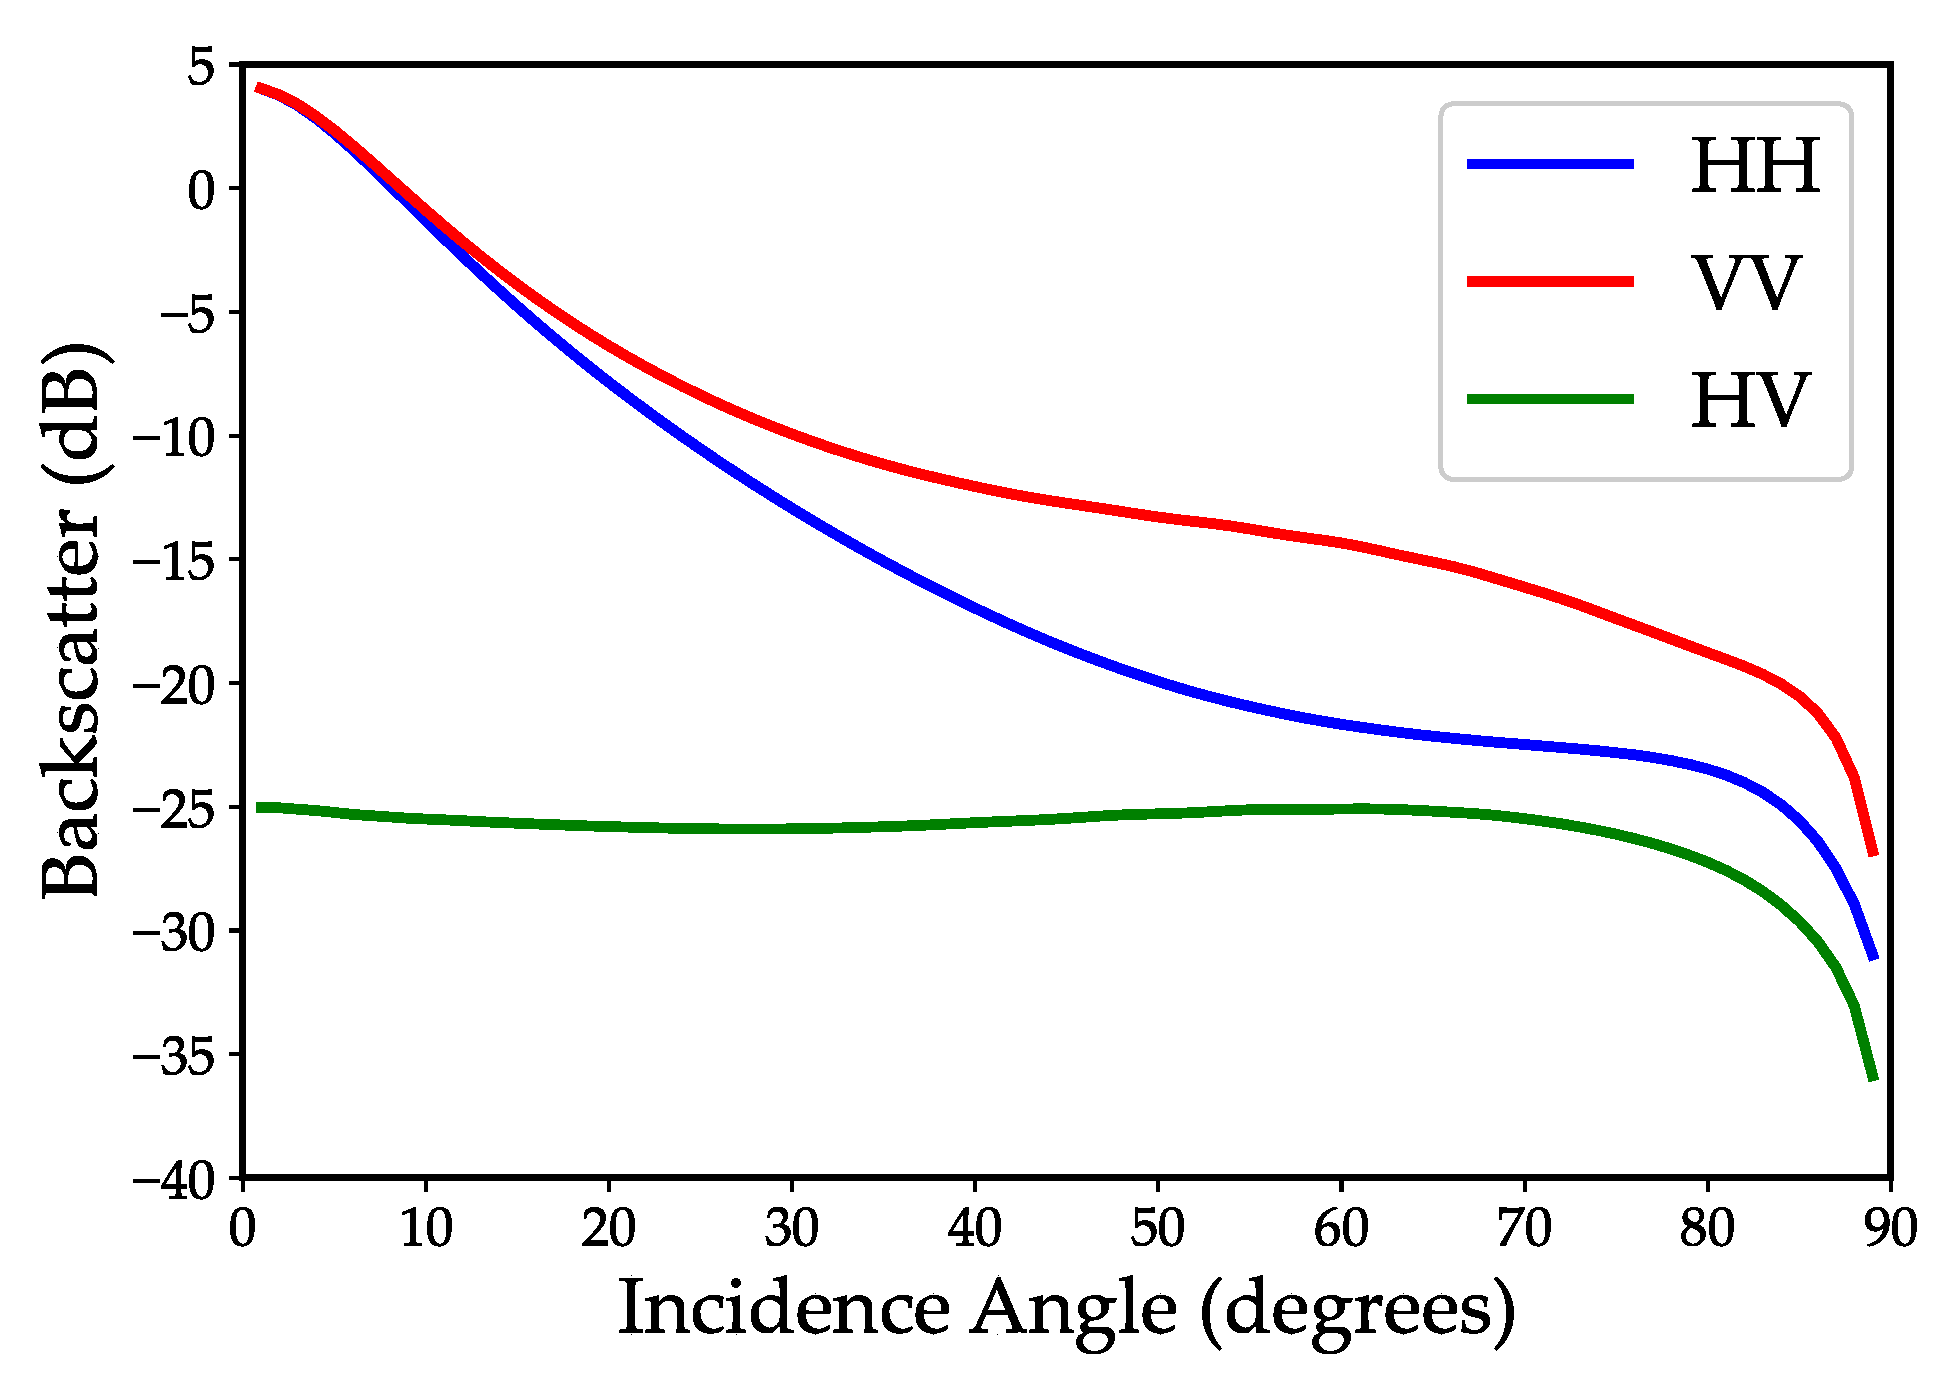
First, observed backscatter from one line ID were plotted against those from another line ID for different combinations: 31604 vs. 31603, 31605 vs. 31603, 31606 vs. 31603, 31605 vs. 31604, 31606 vs. 31604, and 31606 vs. 31605. The incidence angle for the UAVSAR data in wheat fields ranges from 23° and 63°. Figure 4 shows the variation of WCSM-simulated backscatter against incidence angle. We assumed that the variation in simulated backscatter within this incidence angle range is linear with the highest slope observed for HH polarization and the smallest/almost unchanged simulated backscatter is observed for HV polarization. Next, a simple linear regression model was fitted to the paired backscatter to account for the systematic differences due to incidence angle. Residuals from the regression model were calculated and the standard deviation of those residuals ( σ S D r e s i d u a l 0 ) was estimated. Here we are comparing UAVSAR data against UAVSAR data, and we assume similar observation errors (variability) in each axis. Therefore, the random error of UAVSAR observations ( σ o b s e r r o r 0 ) can be calculated as follows:
σ o b s e r r o r 0 = σ S D r e s i d u a l 0 2
The resultant σ o b s e r r o r 0 for the six line ID combinations in different polarizations were calculated. Finally, the average σ o b s e r r o r 0 of all the line ID combinations was estimated for each of the three polarizations and considered as the observation uncertainty.

4. Results

4.1. Uncertainty Analysis

4.1.1. Simulation Uncertainty

We used the Sobol’ method to estimate the influence of uncertainties associated with the 20 input parameters (k) on the simulated co- and cross-polarized total backscatters. After checking the convergence of the sensitivity indices with the ensemble size (Appendix A), 10,000 Monte Carlo simulations were used to conduct the uncertainty analyses for each scenario. Variations in simulated error (1 standard deviation) at 20 random points used for WCSM simulations from SMAPVEX12 ground data were examined. As the simulated error among the points for all the polarizations did not show much variation, the average was considered as the WCSM simulation uncertainty. The uncertainty (68% confidence interval) in WCSM-simulated backscatter due to inputs is 1.88 dB, 1.73 dB, and 1.8 dB for HH, VV, and HV polarizations, respectively (Table 4).
The WCSM requires many input factors to simulate backscatter and identifying crucial input factors helps guide measurement efforts for future campaigns. The contribution of each input factor to total simulated uncertainty was investigated using the total sensitivity index obtained from the Sobol’ method for two states of the wheat crop; where the crop height is 20 cm (prior to wheat ear emergence) and 80 cm (with the presence of wheat ears) to identify crucial factor/factors to WCSM-simulated uncertainty. For both crop heights, the simulated co-polarized backscatter uncertainty mainly originates from the uncertainty associated with RMS height followed by incidence angle (Figure 5 and Appendix B). However, this is not the case for cross polarization. For cross-polarized backscatter, although the simulated uncertainty is dominated by RMS height at 20 cm of crop height (without the presence of wheat ears), for the 80 cm crop height (where the wheat ears are fully grown), much of the simulated uncertainty arises from ear diameter and ear water content.

4.1.2. Backscatter Observation Uncertainty

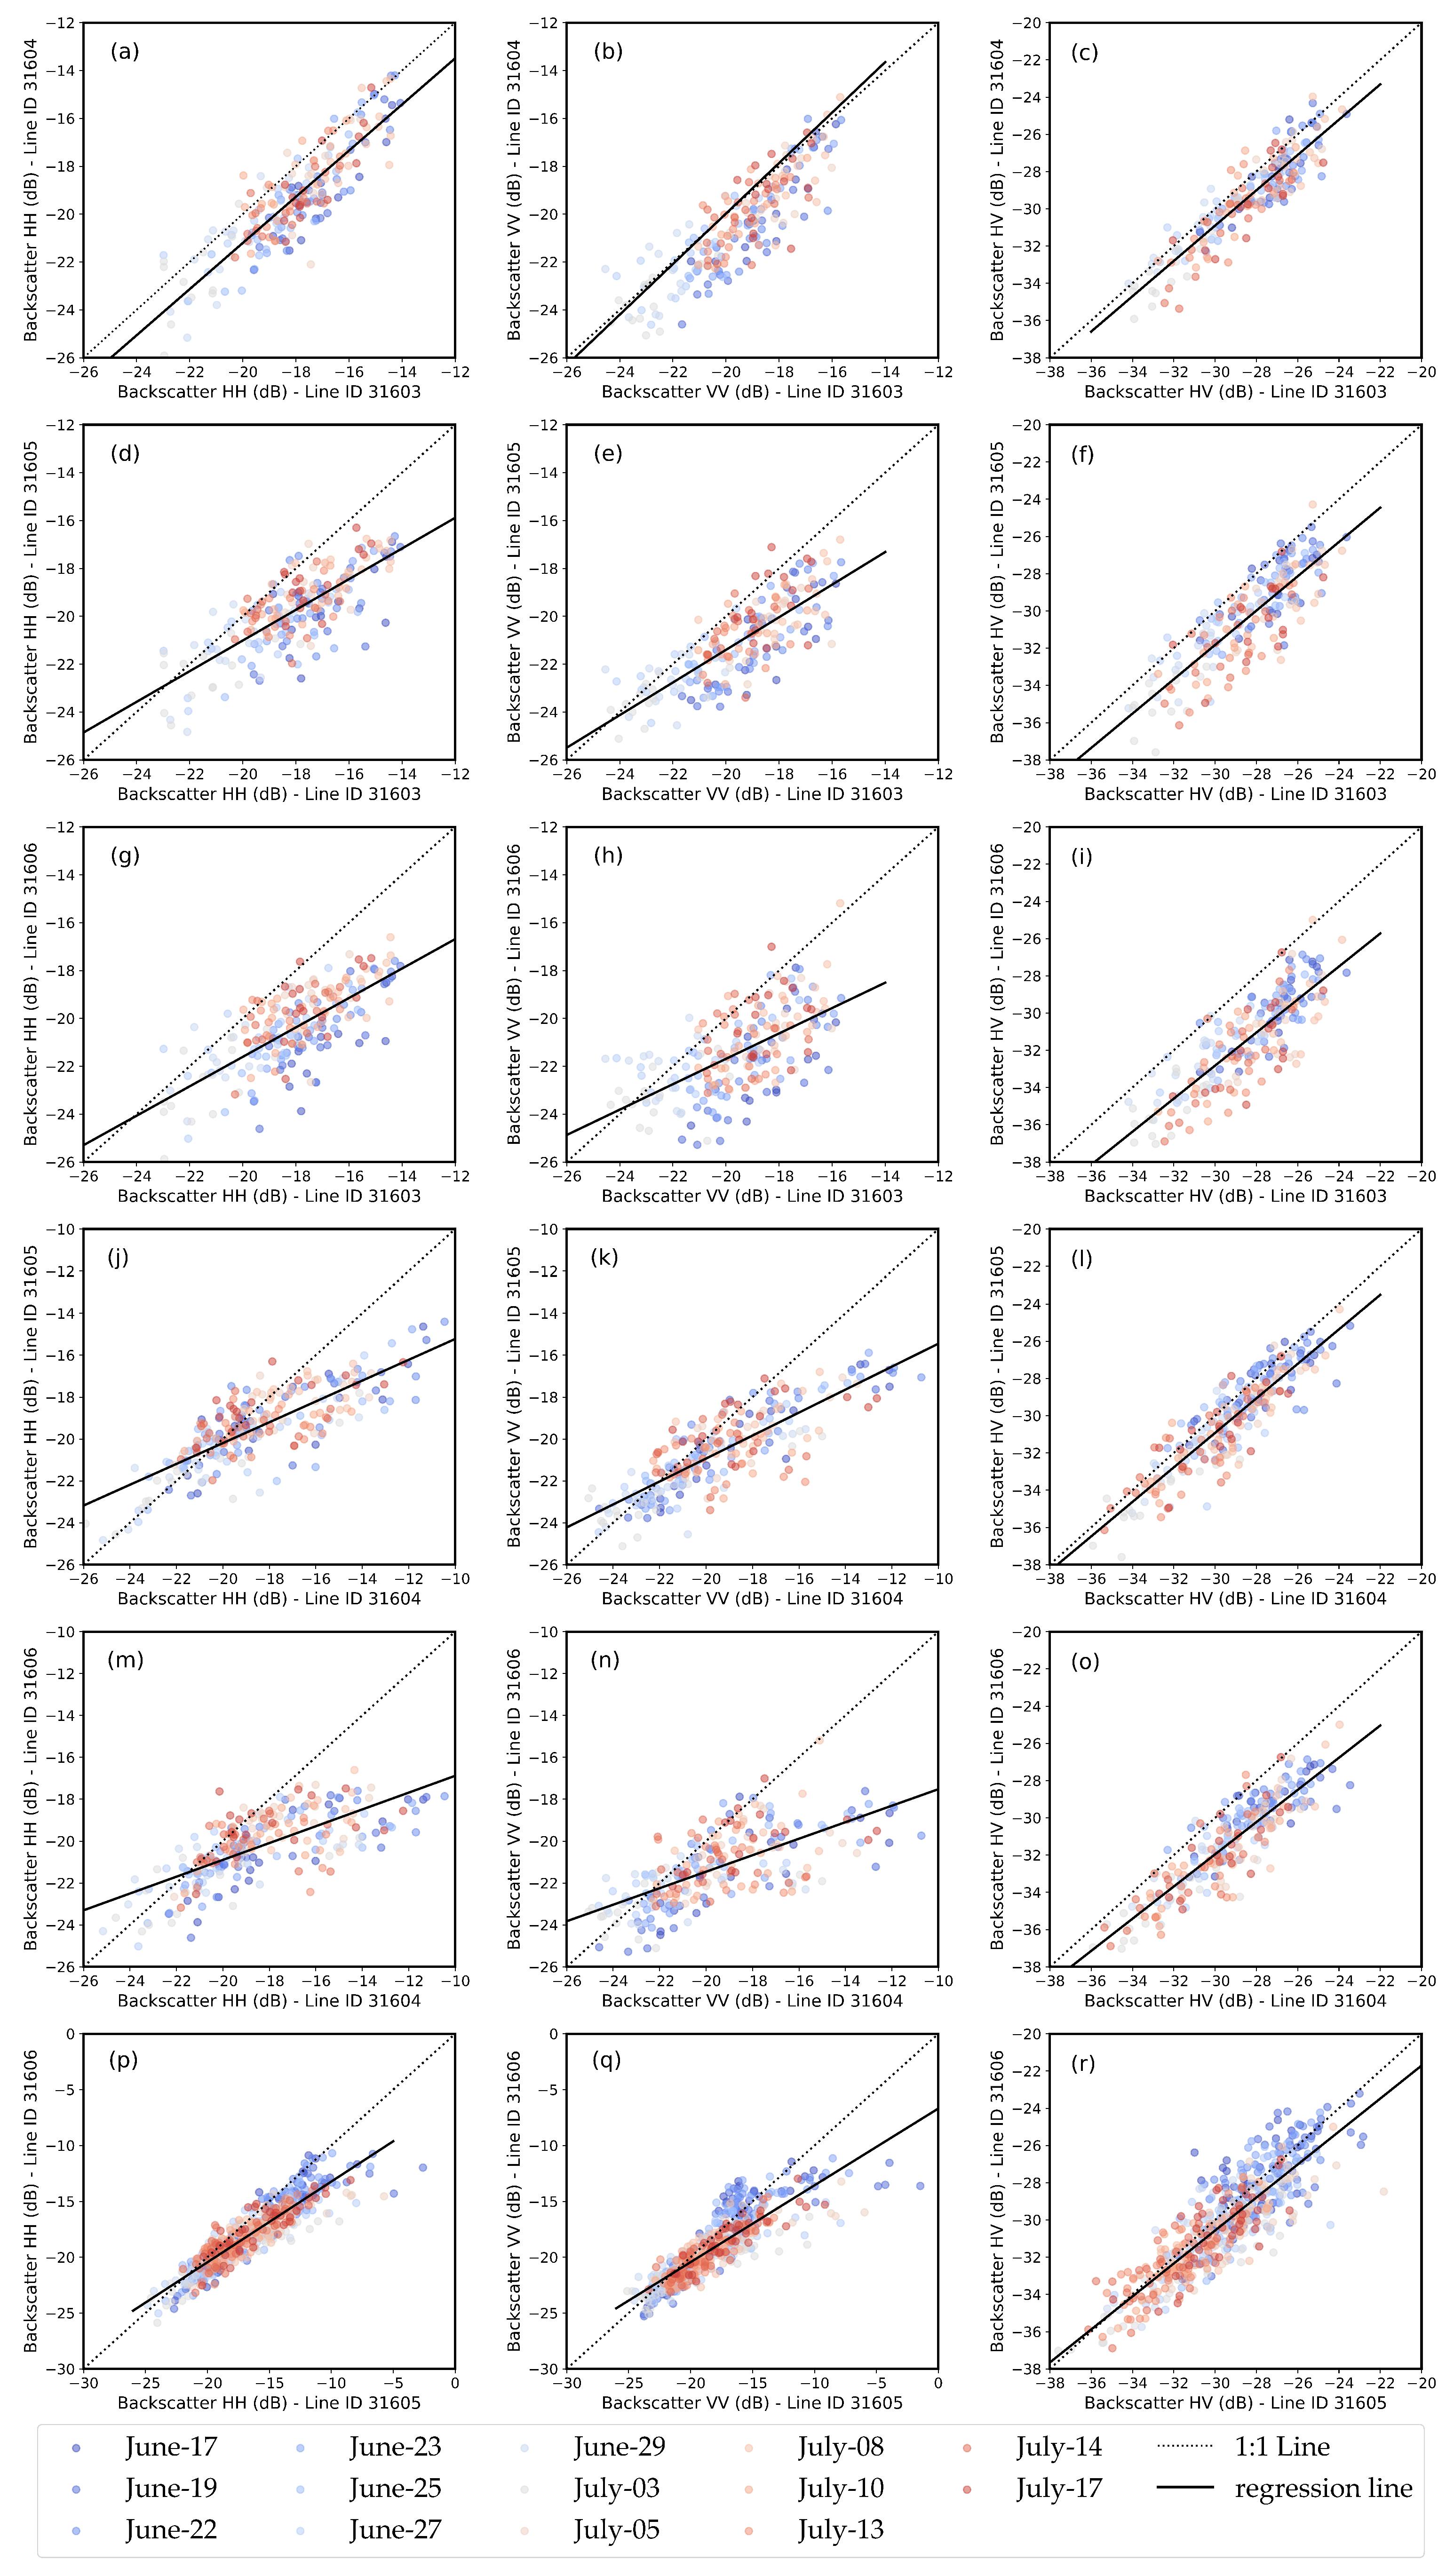
Figure 6 compares observed HH-, VV-, and HV-polarized backscatters for different line ID combinations. The incidence angle for UAVSAR data in wheat fields ranges from 23°–63° (Appendix C). For some flight line combinations, the difference in the incidence angle for a sampling location is small. This is true for line IDs 31605 and 31606 (4° difference for six wheat fields). Similar incidence angle differences for sampling locations are observed between line IDs 31603 and 31604, and line IDs 31604 and 31605 (7° difference), on average. As the influence on HV polarization from the incidence angle is small, the observed HV-polarized backscatter should fall close to the 1:1 line for those line ID combinations, which it does (Figure 6c,l,r). The largest incidence angle difference at sampling locations occurs between flight line IDs 31603 and 31606, and the largest differences in backscatter also occur between those IDs in all three polarizations (Figure 6g–i).
Backscatter observation uncertainty was estimated by examining the scatter around the best-fit linear relationships shown in Figure 6. Table 5 reports the uncertainty of observed backscatter for all three polarizations obtained for different line ID combinations of UAVSAR image acquisitions after analyzing the multiple UAVSAR observations made on the same sampling location with unchanged ground conditions and varying incidence angle. The average uncertainties of observed HH-, VV-, and HV-polarized backscatters can be summarized as 0.8 dB, 0.87 dB, and 0.86 dB, respectively.

4.2. L-Band Backscatter Coefficients Simulated by WCSM

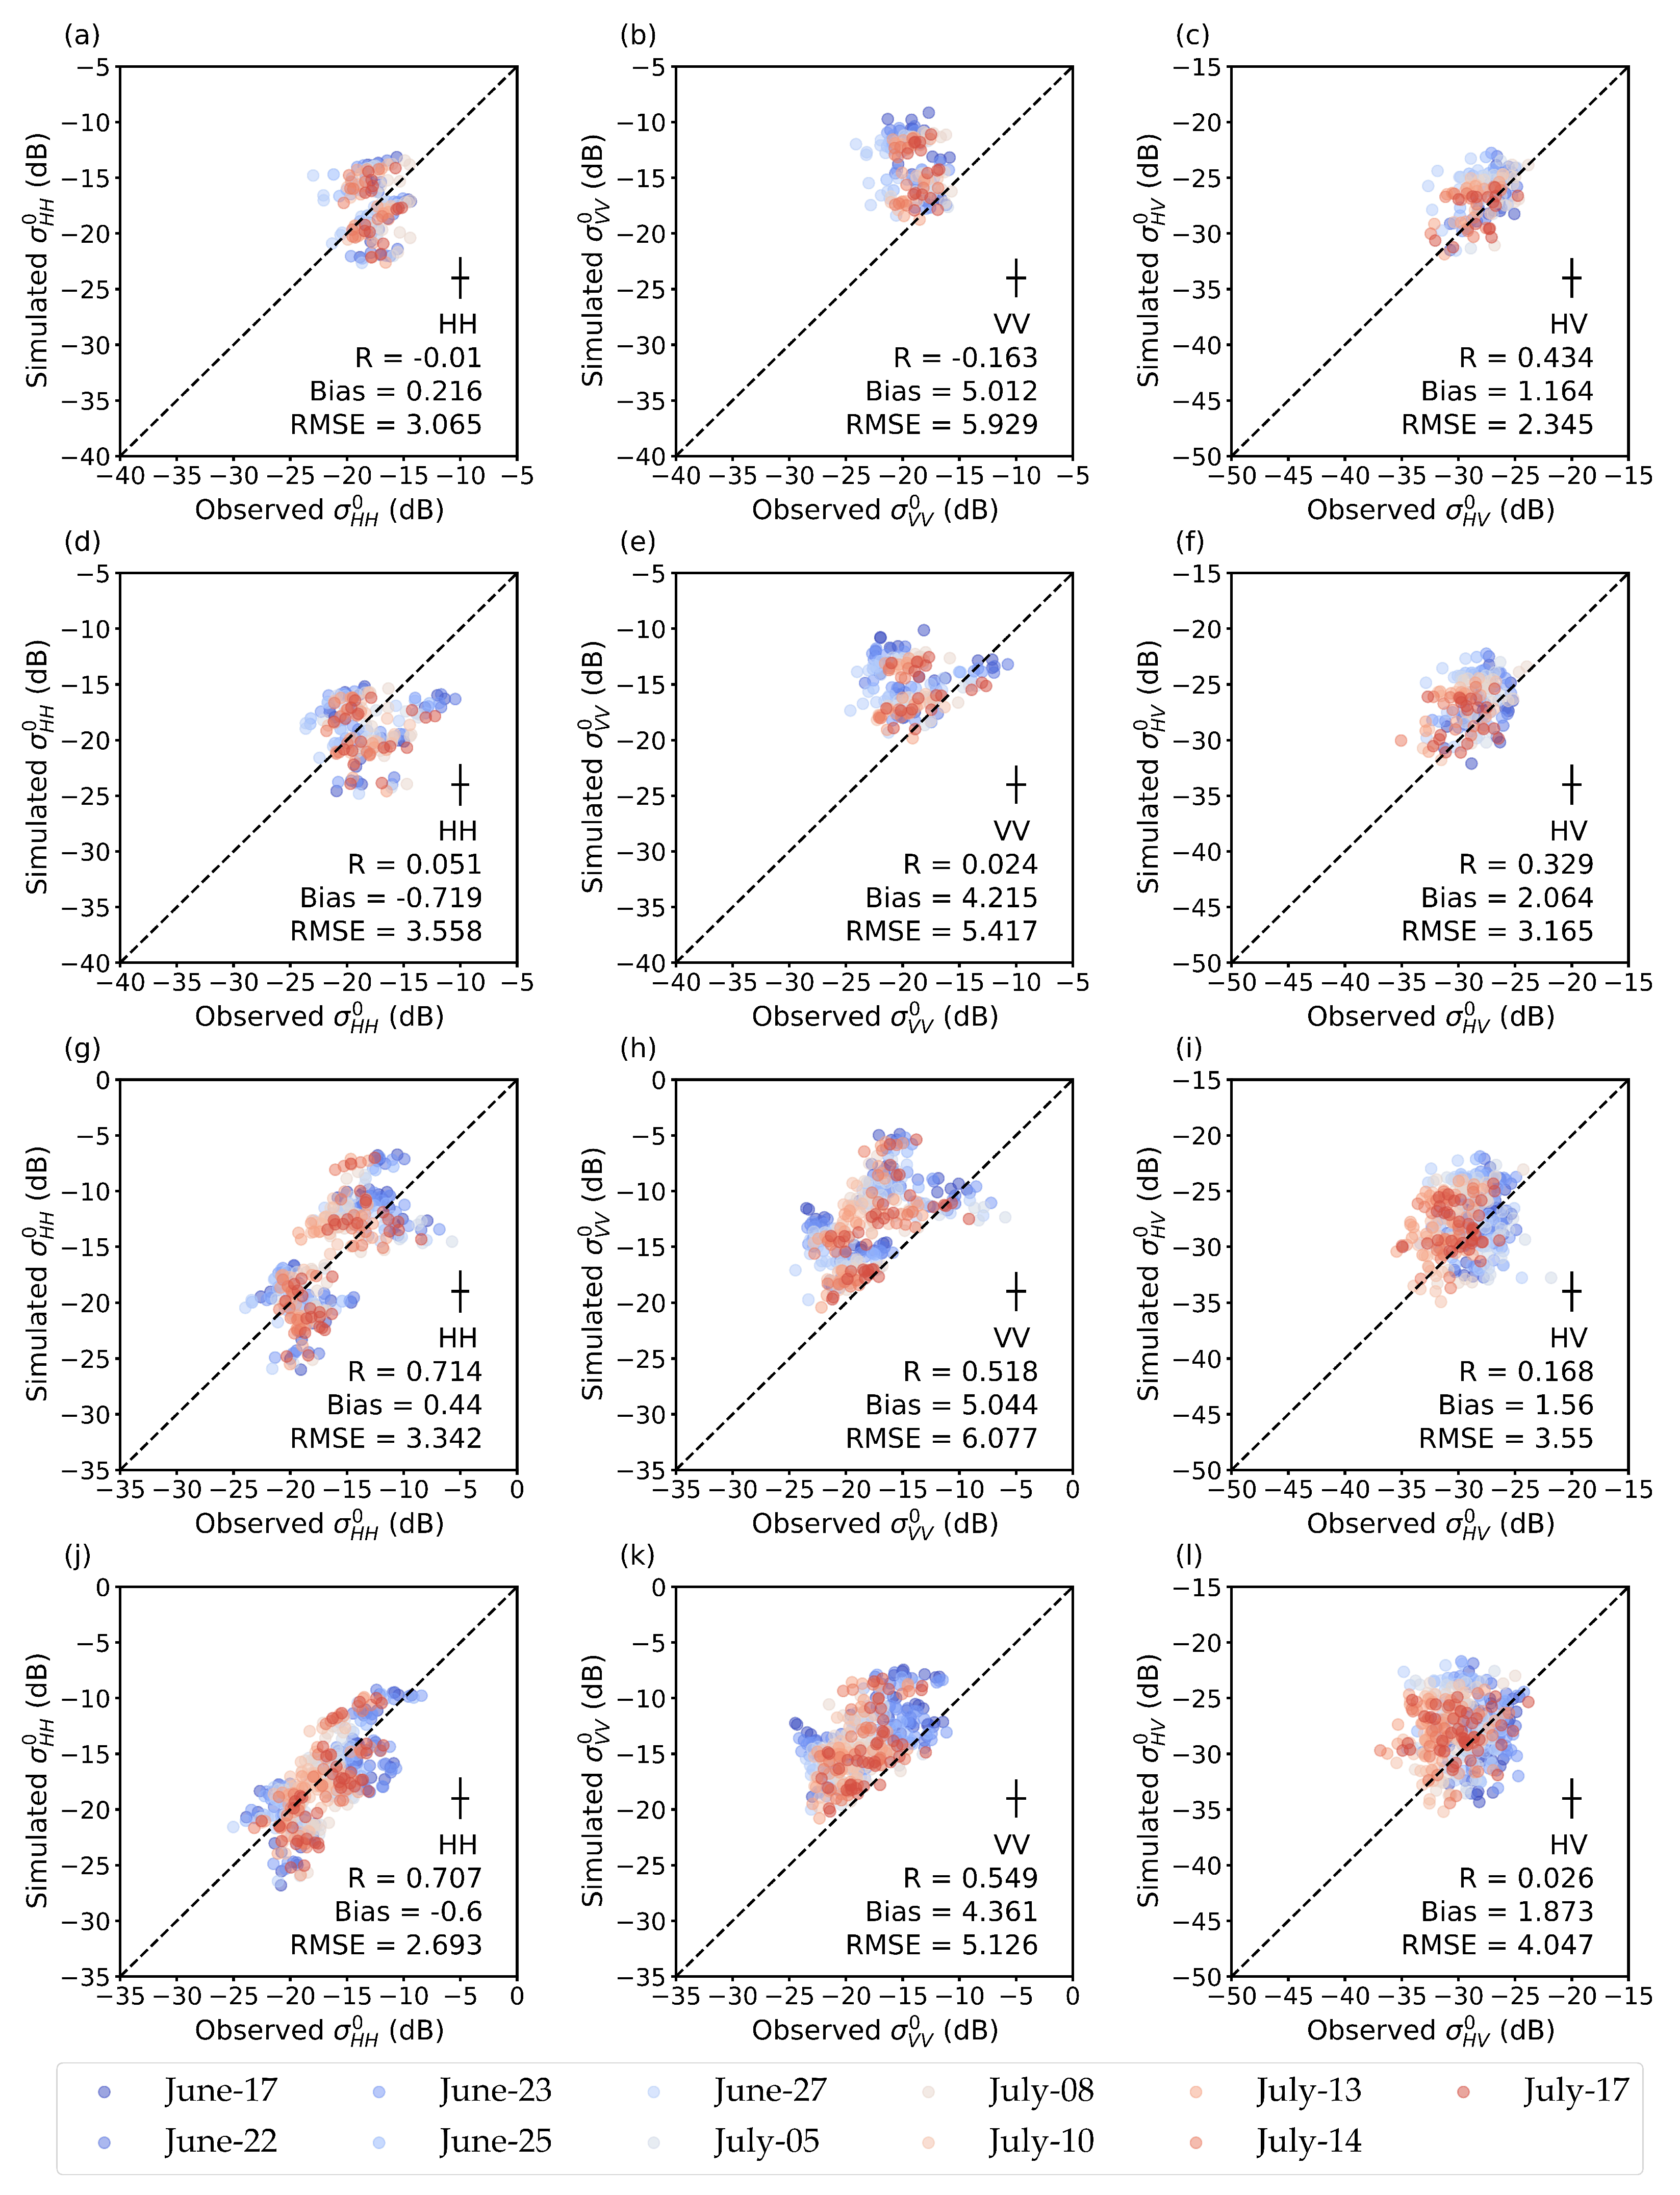
Figure 7 compares the UAVSAR backscatters at all three polarizations for each sampling location across SMAPVEX12 with the respective WCSM-simulated backscatters for all four flight line IDs. Overall, we observed considerable discrepancies between simulated and observed backscatter which are beyond the estimated simulation uncertainty and observation uncertainty. Simulated backscatter coefficients for HH polarization exhibited the best alignment with airborne observations, with the smallest RMSE and systematic error followed by HV polarization. The highest mean additive bias was detected in the VV-polarized backscatter with the highest RMSE for the same. It is clear from Figure 7 that simulated and observed VV-polarized backscatter agree well for some sampling locations and days; however, on most days, there is a significant overestimation of simulated VV-polarized backscatter.
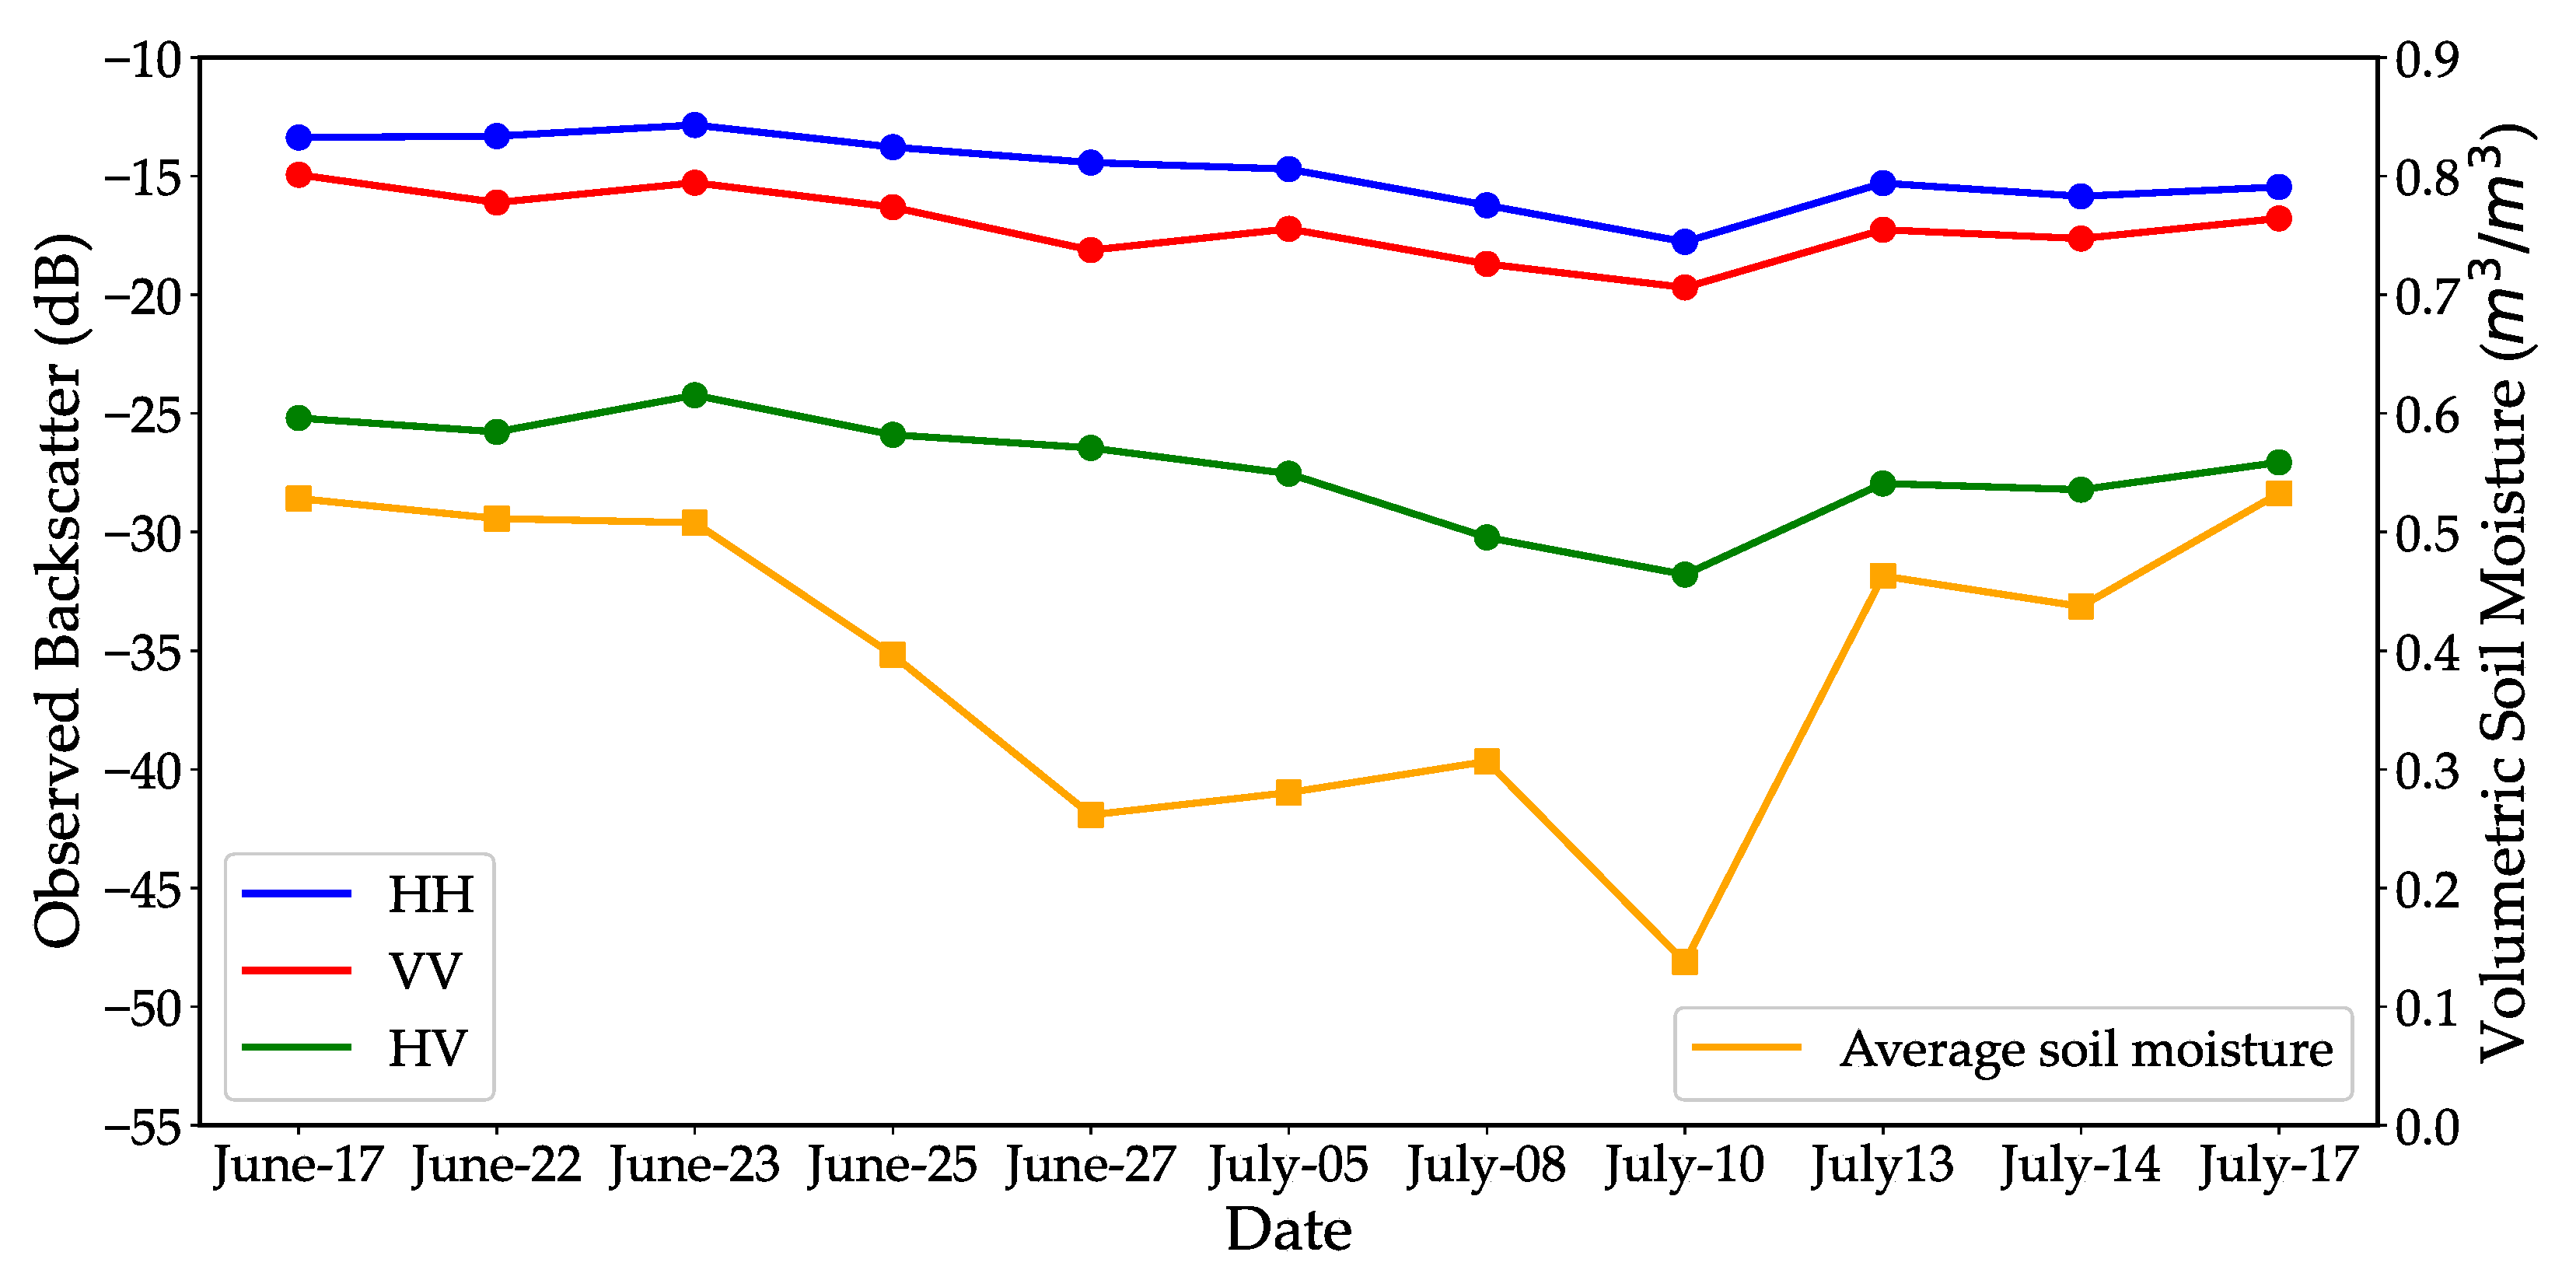
Figure 8 shows the relative contributions from soil and vegetation (volume scattering of ear, leaf, and stem together) to simulated total HH-, VV-, and HV-polarized backscatters for different fields on 17 July 2012, for line ID 31606. This is when the wheat crop was at the fully grown stage. It is observed that soil scattering dominates the total co-polarized signal at the L-band while a significant contribution for cross-polarized backscatter is from vegetation scattering. Variation of UAVSAR backscatters at multiple polarizations with soil moisture measurements across SMAPVEX12 was examined, and the co-polarized backscatter varies following a similar pattern to soil moisture further confirming that soil scattering dominates the total co-polarized backscatter (Figure 9).
To understand the sensitivity of HH-, VV-, and HV-polarized backscatters to CWC of wheat crop components, we varied the water content of ear, leaf, and stem, while keeping other input parameters constant (Figure 10). A stronger increase in total cross-polarized backscatter at the L-band was observed for increasing ear water content (mainly for CWC > 0.4 kg of water/kg of wet biomass) than for the other vegetation components. There was a comparatively smaller increase in co-polarized backscatter with increasing ear water content. L-band total co-polarized backscatters remained almost unchanged with the increasing leaf and stem water content, while they influenced the total cross-polarized backscatter at very high gravimetric water contents only. From the above relative contributions, it was found that total co-polarized backscatter is dominated by soil scattering, further confirming that increasing the CWC of leaves and stems in a wheat crop canopy has very little to no influence on HH- and VV-polarized backscatter. It is also noticed that the CWC of wheat ears significantly influences the total HV-polarized backscatter followed by co-polarized backscatter.

5. Discussion

5.1. Interpretation of Discrepancies Using Simulation and Observation Uncertainty

Laboratory scale studies have reported good agreement between model simulations and the corresponding radar observations; however, significant discrepancies are reported at the field scale [25,28,34,49]. Our L-band backscatter coefficients simulated by WCSM and observed backscatter from UAVSAR across the SMAPVEX12 campaign study area also indicate significant discrepancies (Figure 7). While the WCSM has reproduced C-band backscatter from wheat fields with an error of less than 1.8 dB [32], comparatively higher errors were observed at L-band SAR in the present study. Balenzano et al. [49] also observed less error for C-band (1.1 dB) and higher error for L-band (2.5 dB) when comparing modeled backscatter from a first-order radiative transfer approach with E-SAR data from wheat cropping fields. WCSM tends to overestimate VV- and HV-polarized backscatter with a systematic bias of 4.66 dB and 1.67 dB, respectively. A similar bias (4 dB) for VV polarization was also detected by Balanzano et al. [49]. In this study, the total estimated uncertainty for HH and HV polarizations is about 80% of the RMSE between the WCSM-simulated and UAVSAR observed backscatter (∼2.7 dB c.f. 3.2 dB), and the RMSE for VV polarization (5.63 dB) is more than double the estimated total uncertainty (2.6 dB) (Table 6). This implies that in addition to observation uncertainty and measurement uncertainty of inputs to WCSM, other factors contribute to discrepancies and are much more significant for VV polarization.

5.2. Potential Causes of Discrepancies Between Observed and Simulated Backscatter

The comparison of estimated uncertainty in WCSM-simulated backscatter with the errors between simulated and observed backscatter suggests that there are additional reasons for these discrepancies. These include differences in the contributions of soil and vegetation to total backscatter between polarizations, changing surface roughness, the representation of plant components in WCSM, and the first-order radiative transfer nature of the WCSM.
The lowest RMSE values were observed for HH polarization. In other studies, better simulation performance was also found for HH polarization in both L- and C-bands in wheat backscatter simulations using the adapted MIMICS model [26]. Similar to our results from the simulation uncertainty analysis (Figure 5), Toure et al. [26] found that measurement uncertainty associated with input parameters influences VV polarization more than HH polarization and that the best simulation results were obtained for HH-polarized backscatter when using the adapted version of MIMICS for the wheat canopy. The relative contributions of attenuated soil scattering and vegetation scattering (Figure 8) to the total L-band backscatter results presented here show that the soil scattering contribution dominates the co-polarized backscatter and thus the causes of discrepancies between simulated and observed co-polarized backscatter are more likely related to the soil (mainly RMS height as observed in the simulation uncertainty analysis) than to vegetation characteristics. These results agree with [25,26,49], who found that the majority of the contribution to co-polarized backscatter is from the ground surface, with less influence from vegetation effects, throughout the wheat cropping season at L-band. In addition, El Hajj et al. [50] discovered that L-band HH polarization is still sensitive to soil moisture even when the wheat canopy is well-developed [50]. This is consistent with scattering theory given the higher penetration of the L-band SAR signal through the canopy, implying that the dominant scattering contribution should come from the soil. This further confirms that as the L-band SAR penetrates deeper into the wheat canopy, they are more sensitive to soil properties (surface roughness and soil moisture) and can be used to retrieve soil properties in the presence of a wheat canopy.
Furthermore, several studies have found that soil scattering contribution due to surface roughness is higher than that due to soil moisture [51,52]. Our simulation uncertainty analysis suggests that the main source of error for co-polarized backscatter is the assumption of constant surface roughness within the field. Only having two measurements (at sampling locations #1 and #2) in each wheat field is insufficient to represent the overall field variability of roughness. In addition, surface roughness can change throughout the cropping season due to precipitation and various other processes causing errors in simulated co-polarized backscatter, noting that uncertainty in surface roughness influences VV polarization than HH polarization. The reason for high systematic bias in VV polarization could potentially be due to using overestimated RMS height values obtained as the average from the measurements at sampling locations #1 and #2 for the majority of the wheat fields. On the other hand, WCSM assumes single-scale surface roughness which is inadequate to represent the actual surface undulations in a wheat field. This is a likely reason for the comparatively higher errors observed in VV- than in HH-polarized backscatter.
The representation of crop components in the WCSM may also be important. The WCSM considers stems as full cylinders but in reality, stems become hollow at the mature crop growth stage. Vecchia et al. [53] found that considering the stem hollowness in wheat crops is essential to simulate backscatter accurately. Their field measurements showed that representing the stem as a solid cylinder is incorrect for mature wheat crops as this generally leads to underestimating the soil scattering due to overestimation of stem attenuation. Stem hollowness reduces stem attenuation, thereby enhancing the soil scattering contribution which will in turn increase total backscatter. According to Bhogapurapu et al. [46], wheat crops were in the heading and flowering stages between 17 June–8 July 2012, meaning that the wheat crops were in mature stages towards the end of the SMAPVEX12 campaign. Thus, neglecting stem hollowness in WCSM could have been a reason for the underestimation of HH-polarized backscatter from WCSM. Furthermore, WCSM represents wheat leaves as vertically inclined elliptical discs while leaves follow a curved structure in reality. Considering leaf curvature reduces the leaf backscattering [53], which is not considered in the WCSM. Vegetation scattering (linear addition of volume scattering of ear, leaf and stem) dominates the total HV-polarized backscatter (Figure 8). A potential explanation for positive systematic bias between simulated and observed HV-polarized backscatter (Figure 7) is neglecting leaf curvature which consequently overestimates leaf scattering.
Another potential cause of observed discrepancies is that the WCSM is based on first-order radiative transfer modeling. Although first-order modeling is well suited for sparse canopies, which is the condition in the early stages of a wheat field, the canopy becomes dense in the fully developed stage of the wheat crop. The independent scatterer approximation may become less effective for a dense medium as the resulting complex multiple backscattering would require higher-order radiative transfer modeling to be accurately represented. Generally, such multiple scattering is not taken into account in first-order radiative transfer modeling. In another study, this led to underestimates of the co-polarized C-band SAR signal from a wheat field [30]. Although we did not observe such an underestimation for VV polarization in our WCSM-simulated backscatter at the L-band, this might be a reason for the underestimation of the simulated HH-polarized backscatter.
There is a wide range of other potential causes of discrepancy between the WCSM-simulated and the observed backscatter that have been addressed in the literature. In addition to all the above, other possible reasons for discrepancies can be related to the penetration depth of the L-band SAR signal being different from the soil moisture measurement depth during SMAPVEX12 (which was 6 cm). Errors arising from uncertainties associated with orientation in scatterers can be considerable [28]. The other unexplainable discrepancies between WCSM-simulated and UAVSAR observed backscatter could be due to model structural deficiencies related to various assumptions made including scatterer shape and orientation that propagate through the model in terms of simulated backscatter. Furthermore, as crop measurements were made during non-flight dates, linear interpolation was adopted to estimate crop height, stem diameter and gravimetric water content of ears, leaves and stems corresponding to UAVSAR observations. The relationships could have been non-linear which is another potential error. Geometric errors and other errors associated with UAVSAR data in addition to observed uncertainty could be another potential reason.

5.3. Implications of Uncertainty Analysis

Microwave scattering models require numerous ground measurements such as geometric and biophysical properties of crop canopy and soil surface parameters which require significant labor and time for field measurements. Therefore, it is important to identify the crucial parameters to be measured for the effective planning and execution of field campaigns. Furthermore, by identifying insignificant parameters, they can be given less priority during field campaigns and could potentially be fixed in models thereby reducing the number of inputs and simplifying the model.
Error statistics of inputs to WCSM were simulated and the influence of uncertainty in different inputs on simulated backscatter was systematically explored in this study. This simulation uncertainty analysis (Figure 5) indicated that uncertainty in co-polarized backscatter is dominated by uncertainties associated with RMS height followed by incidence angle throughout the cropping season irrespective of the phenological stage. This further implies that incidence angle normalization and assuming a constant RMS height can add possible errors mainly to co-polarized backscatter simulations which in return may contribute to the accuracy of parameter retrieval from scattering models. The uncertainty in cross-polarized backscatter is predominantly influenced by the uncertainties in ear diameter and ear water content at the L-band during the mature stage of the wheat crop. This suggests that it is important to measure wheat ear dimensions and RMS height accurately in field campaigns to reduce the impact of this uncertainty on simulation errors at L-band. Furthermore, a similar approach used in simulation uncertainty analysis in the present study can be applied to sophisticated scattering models developed for other crops, such as rice, corn and soybeans to identify crucial factors for simulation uncertainty in the respective models.
When developing soil moisture inversion algorithms using SAR data, it is necessary to consider observation uncertainty in the inversion algorithm as failure to account for uncertainty in the data source themselves can result in larger uncertainty in soil moisture inversions [54]. This study quantified the observation uncertainty of UAVSAR backscatter for HH, VV, and HV polarizations by analyzing near-simultaneous images with the same ground (soil and crop) conditions and different incidence angles, that can be considered in soil moisture inversion algorithms as uncertainty in SAR data to reduce inversion error.

6. Conclusions

To date, little attention has been given to understanding how the simulated backscatter uncertainty from a physical model can be apportioned to uncertainties associated with input factors, nor how much these uncertainties, in combination with uncertainty in observed backscatter, might explain discrepancies between scattering models and observations. This study investigated discrepancies between the Wheat Canopy Scattering Model (WCSM) simulations at L-band and UAVSAR observations made during the SMAPVEX12 campaign in terms of both simulation and observation uncertainty.
Simulation uncertainty was ∼1 dB higher than observation uncertainty (∼0.8 dB) for all three polarizations. Observation and simulation uncertainty together are 2.68 dB, 2.6 dB, and 2.66 dB for HH, VV, and HV polarizations, respectively. The overall error between WCSM-simulated and UAVSAR observed backscatter (RMSE) is 3.2 dB, 5.6 dB, and 3.3 dB for HH, VV, and HV polarizations, respectively. Thus input and observation uncertainties did not fully explain the differences between WCSM-simulated and UAVSAR backscatter for HH and HV polarizations and explained less than half of the difference for VV polarization.
We found that considering the scattering contribution from wheat ears is essential when modeling electromagnetic scattering from a wheat canopy at L-band. Uncertainty in surface roughness, particularly RMS height followed by incidence angle significantly influences the accuracy of co-polarized backscatters irrespective of the crop growth stage. Thus, assuming constant surface roughness spatially and over time likely contributes to errors between simulated and observed backscatter. In addition, normalizing the incidence angle rather than using the location-specific incidence angle can also result in discrepancies between simulated and observed co-polarized backscatters. Further advancements could focus on improving the WCSM considering leaf curvature, stem hollowness and anisotropic surface roughness. As the current study was limited to understanding simulation uncertainty arising from geometric and biophysical properties of soil and wheat crop, extending the uncertainty analysis to understand whether the orientation of scatterers has a significant influence on the simulated backscatter at multiple polarizations would be insightful.

Author Contributions

Conceptualization, L.W., A.W.W., J.A., and D.R.; methodology, L.W., A.W.W. and D.R.; formal analysis, L.W.; investigation, L.W., A.W.W., J.A. and D.R.; writing—original draft preparation, L.W.; writing—review and editing, A.W.W., J.A. and D.R.; supervision, A.W.W., J.A. and D.R. All authors have read and agreed to the published version of the manuscript.

Funding

This research has been supported by the Melbourne Research Scholarship program of The University of Melbourne.

Data Availability Statement

SMAPVEX12 ground data can be accessed from the National Snow and Ice Data Center (NSIDC) https://nsidc.org/data/explore-data (accessed on 25 January 2023) and University of Sherbrooke https://smapvex12.espaceweb.usherbrooke.ca (accessed on 11 January 2023) websites. SMAPVEX12-UAVSAR data can be downloaded from NASA Jet Propulsion Laboratory (JPL) https://uavsar.jpl.nasa.gov (accessed on 20 January 2023).

Acknowledgments

The authors are indebted to Yuan Zhang, Key Laboratory of Geographic Information Science, East China Normal University, Shanghai, China for providing the Wheat Canopy Scattering Model (WCSM) codes. The authors are also grateful to the ESA-STEP team for providing PolSARpro version 6.0 open-source software tools for UAVSAR data processing and to the SMAPVEX12 ground and aircraft crews for their tireless efforts in collecting data used in this study.

Conflicts of Interest

The authors declare no conflicts of interest.

Abbreviations

The following abbreviations are used in this manuscript:
SARSynthetic Aperture Radar
WCSMWheat Canopy Scattering Model
AIEMAdvanced Integral Equation Model
SMAPVEX12Soil Moisture Active Passive Validation Experiment 2012
UAVSARUninhabited Aerial Vehicle Synthetic Aperture Radar
GRDGround Range Detected
ACFAutocorrelation Function
RMS heightRoot Mean Square height
CWCCrop Water Content
RMSERoot Mean Square Error

Appendix A

Figure A1 demonstrates the evolution of the first-order sensitivity index ( S 1 ) and total sensitivity index ( S T ) against the ensemble size for all three polarizations. The Sobol’ method requires n · ( k + 2 ) runs where generally n = 1000 . Although the ideal number of simulations required is 220,000 which requires significant simulation time, the convergence of the sensitivity indices was examined and 10,000 Monte Carlo simulations were used for the simulation uncertainty analyses.
Figure A1. Evolution of sensitivity indices with ensemble size; first-order sensitivity ( S 1 ) (a) HH, (b) VV, (c) HV polarizations and total sensitivity ( S T ) (d) HH, (e) VV, (f) HV polarizations.
Remotesensing 17 00164 g0a1

Appendix B

Figure A2 illustrates the rank of the first-order sensitivity ( S 1 ) and total sensitivity ( S T ) values of all the input factors to WCSM-simulated backscatter for all three polarizations at two crop heights; 20 cm and 80 cm. Generally, S 1 and S T show similar ranks.
Figure A2. Rank of (a) S 1 and (b) S T of the 20 input factors to WCSM from the Sobol’ method for HH, VV, and HV polarizations at two different crop heights; 20 cm and 80 cm.
Remotesensing 17 00164 g0a2

Appendix C

Local incidence angle of sampling locations #2, #11, and #14 of wheat fields in different UAVSAR flight line IDs.
Table A1. Local incidence angle of sampling locations #2, #11, and #14 of wheat fields corresponding to different UAVSAR line IDs used in this study.
Site-IDIncidence Angle (Degrees)
31603316043160531606
31-2---26.6
31-11---25.7
31-14---26.2
32-2---23.5
32-11---23.4
32-14---23.2
41-2--26.937.6
41-11--25.736.6
41-14--26.437.3
42-2--24.435.7
42-11--24.936.1
42-14--24.435.8
44-2--27.838.3
44-11--28.138.6
44-14--28.639
45-2--24.836
45-11--26.837.7
45-14--25.236.2
55-2--25.836.7
55-11--26.437.3
55-14--25.536.6
65-2-32.64249.3
65-11-30.840.548.1
65-14-31.941.448.9
73-246.753.158.162.1
73-1144.951.656.760.8
73-1445.351.956.960.9
74-243.750.65660.2
74-1143.250.255.659.8
74-1443.250.155.459.6
81-239.747.653.658.3
81-1141.248.954.759.3
81-1440.448.15458.6
85-235.744.551.256.5
85-1135.444.250.956.1
85-1435.444.351.156.4
91-245.652.257.461.5
91-1144.551.256.360.4
91-144551.656.760.7
104-2--27.638.3
104-11--25.736.7
104-14--26.237.1
105-2--25.336.4
105-11--23.635
105-14--24.335.6

References

  1. Hosseini, M.; McNairn, H. Using multi-polarization C-and L-band synthetic aperture radar to estimate biomass and soil moisture of wheat fields. Int. J. Appl. Earth Obs. Geoinf. 2017, 58, 50–64. [Google Scholar] [CrossRef]
  2. Mattia, F.; Le Toan, T.; Picard, G.; Posa, F.I.; D’Alessio, A.; Notarnicola, C.; Gatti, A.M.; Rinaldi, M.; Satalino, G.; Pasquariello, G. Multitemporal C-band radar measurements on wheat fields. IEEE Trans. Geosci. Remote. Sens. 2003, 41, 1551–1560. [Google Scholar] [CrossRef]
  3. Brown, S.C.; Quegan, S.; Morrison, K.; Bennett, J.C.; Cookmartin, G. High-resolution measurements of scattering in wheat canopies-implications for crop parameter retrieval. IEEE Trans. Geosci. Remote. Sens. 2003, 41, 1602–1610. [Google Scholar] [CrossRef]
  4. Kim, S.B.; Liao, T.H. Robust retrieval of soil moisture at field scale across wide-ranging SAR incidence angles for soybean, wheat, forage, oat and grass. Remote. Sens. Environ. 2021, 266, 112712. [Google Scholar] [CrossRef]
  5. Huang, X.; Wang, J.; Shang, J. An adaptive two-component model-based decomposition on soil moisture estimation for C-band RADARSAT-2 imagery over wheat fields at early growing stages. IEEE Geosci. Remote. Sens. Lett. 2016, 13, 414–418. [Google Scholar] [CrossRef]
  6. Lang, R.H. Electromagnetic backscattering from a sparse distribution of lossy dielectric scatterers. Radio Sci. 1981, 16, 15–30. [Google Scholar] [CrossRef]
  7. Karam, M.A.; Fung, A.K.; Lang, R.H.; Chauhan, N.S. A microwave scattering model for layered vegetation. IEEE Trans. Geosci. Remote. Sens. 1992, 30, 767–784. [Google Scholar] [CrossRef]
  8. Fung, A.K.; Fung, H. Application of first-order renormalization method to scattering from a vegetation-like half-space. IEEE Trans. Geosci. Electron. 1977, 15, 189–195. [Google Scholar] [CrossRef]
  9. Fung, A.K.; Ulaby, F.T. A scatter model for leafy vegetation. IEEE Trans. Geosci. Electron. 1978, 16, 281–286. [Google Scholar] [CrossRef]
  10. Fung, A.K. Scattering from a vegetation layer. IEEE Trans. Geosci. Electron. 1979, 17, 1–6. [Google Scholar] [CrossRef]
  11. Ulaby, F.T.; Sarabandi, K.; Mcdonald, K.; Whitt, M.; Dobson, M.C. Michigan microwave canopy scattering model. Int. J. Remote. Sens. 1990, 11, 1223–1253. [Google Scholar] [CrossRef]
  12. Karam, M.A.; Fung, A.K. Scattering from randomly oriented circular discs with application to vegetation. Radio Sci. 1983, 18, 557–565. [Google Scholar] [CrossRef]
  13. Karam, M.; Fung, A. Electromagnetic scattering from a layer of finite length, randomly oriented, dielectric, circular cylinders over a rough interface with application to vegetation. Int. J. Remote. Sens. 1988, 9, 1109–1134. [Google Scholar] [CrossRef]
  14. Ishimaru, A. Wave Propagation and Scattering in Random Media; Academic Press: New York, NY, USA, 1978; Volume 2. [Google Scholar]
  15. Fung, A. A review of volume scatter theories for modeling applications. Radio Sci. 1982, 17, 1007–1017. [Google Scholar] [CrossRef]
  16. Frisch, U. Wave Propagation in Random Media, Probabilistic Methods in Applied Mathematics; Academic Press: New York, NY, USA, 1968; Volume 1, pp. 75–198. [Google Scholar]
  17. Ulaby, F.T.; Moore, R.K.; Fung, A.K. Microwave Remote Sensing: Active and Passive; Vol. III—Volume Scattering and Emission Theory, Advanced Systems and Applications; Artech House: Norwood, MA, USA, 1986. [Google Scholar]
  18. Chandrasekhar, S. Radiative Transfer; Dover Publications, Inc.: New York, NY, USA, 1960. [Google Scholar]
  19. Attema, E.; Ulaby, F.T. Vegetation modeled as a water cloud. Radio Sci. 1978, 13, 357–364. [Google Scholar] [CrossRef]
  20. De Roo, R.D.; Du, Y.; Ulaby, F.T.; Dobson, M.C. A semi-empirical backscattering model at L-band and C-band for a soybean canopy with soil moisture inversion. IEEE Trans. Geosci. Remote. Sens. 2001, 39, 864–872. [Google Scholar] [CrossRef]
  21. Ferrazzoli, P.; Guerriero, L. Radar sensitivity to tree geometry and woody volume: A model analysis. IEEE Trans. Geosci. Remote. Sens. 1995, 33, 360–371. [Google Scholar] [CrossRef]
  22. Prevot, L.; Champion, I.; Guyot, G. Estimating surface soil moisture and leaf area index of a wheat canopy using a dual-frequency (C and X bands) scatterometer. Remote. Sens. Environ. 1993, 46, 331–339. [Google Scholar] [CrossRef]
  23. Bindlish, R.; Barros, A.P. Parameterization of vegetation backscatter in radar-based, soil moisture estimation. Remote. Sens. Environ. 2001, 76, 130–137. [Google Scholar] [CrossRef]
  24. Steele-Dunne, S.C.; McNairn, H.; Monsivais-Huertero, A.; Judge, J.; Liu, P.W.; Papathanassiou, K. Radar remote sensing of agricultural canopies: A review. IEEE J. Sel. Top. Appl. Earth Obs. Remote. Sens. 2017, 10, 2249–2273. [Google Scholar] [CrossRef]
  25. Acuña, M.; Ferrazzoli, P.; Guerriero, L. Modeling L-and X-band backscattering of wheat and tests over fields of Pampas. Eur. J. Remote. Sens. 2019, 52, 84–101. [Google Scholar] [CrossRef]
  26. Toure, A.; Thomson, K.P.; Edwards, G.; Brown, R.J.; Brisco, B.G. Adaptation of the MIMICS backscattering model to the agricultural context-wheat and canola at L and C bands. IEEE Trans. Geosci. Remote. Sens. 1994, 32, 47–61. [Google Scholar] [CrossRef]
  27. Toure, A.; Thomson, K.; Edwards, G.; Brown, R.; Brisco, B. Applying the MIMICS backscattering model in an agricultural context. Can. J. Remote. Sens. 1991, 17, 339–347. [Google Scholar] [CrossRef]
  28. Cookmartin, G.; Saich, P.; Quegan, S.; Cordey, R.; Burgess-Allen, P.; Sowter, A. Modeling microwave interactions with crops and comparison with ERS-2 SAR observations. IEEE Trans. Geosci. Remote. Sens. 2000, 38, 658–670. [Google Scholar] [CrossRef]
  29. Oh, Y.; Sarabandi, K.; Ulaby, F.T. An empirical model and an inversion technique for radar scattering from bare soil surfaces. IEEE Trans. Geosci. Remote. Sens. 1992, 30, 370–381. [Google Scholar] [CrossRef]
  30. Picard, G.; Le Toan, T.; Mattia, F. Understanding C-band radar backscatter from wheat canopy using a multiple-scattering coherent model. IEEE Trans. Geosci. Remote. Sens. 2003, 41, 1583–1591. [Google Scholar] [CrossRef]
  31. Fung, A.K.; Li, Z.; Chen, K.S. Backscattering from a randomly rough dielectric surface. IEEE Trans. Geosci. Remote. Sens. 1992, 30, 356–369. [Google Scholar] [CrossRef]
  32. Yan, W.; Zhang, Y.; Yang, T.; Liu, X. A microwave scattering model for simulating the C-Band SAR backscatter of wheat canopy. Am. J. Remote Sens. 2019, 7, 13–24. [Google Scholar] [CrossRef]
  33. Chen, K.S.; Wu, T.D.; Tsang, L.; Li, Q.; Shi, J.; Fung, A.K. Emission of rough surfaces calculated by the integral equation method with comparison to three-dimensional moment method simulations. IEEE Trans. Geosci. Remote. Sens. 2003, 41, 90–101. [Google Scholar] [CrossRef]
  34. Ma, C.; Li, X.; Chen, K.S. The discrepancy between backscattering model simulations and radar observations caused by scaling issues: An uncertainty analysis. IEEE Trans. Geosci. Remote. Sens. 2019, 57, 5356–5372. [Google Scholar] [CrossRef]
  35. Merzouki, A.; McNairn, H.; Pacheco, A. Evaluation of the Dubois, Oh, and IEM radar backscatter models over agricultural fields using C-band RADARSAT-2 SAR image data. Can. J. Remote. Sens. 2010, 36, S274–S286. [Google Scholar] [CrossRef]
  36. Dong, L.; Baghdadi, N.; Ludwig, R. Validation of the AIEM through correlation length parameterization at field scale using radar imagery in a semi-arid environment. IEEE Geosci. Remote. Sens. Lett. 2012, 10, 461–465. [Google Scholar] [CrossRef]
  37. Huang, B.; Chen, Y.; He, L.; Tong, L.; Wang, Y. Backscattering modeling of wheat using vector radiative transfer theory. J. Appl. Remote. Sens. 2015, 9, 097093-1–097093-11. [Google Scholar] [CrossRef]
  38. Brogioni, M.; Pettinato, S.; Macelloni, G.; Paloscia, S.; Pampaloni, P.; Pierdicca, N.; Ticconi, F. Sensitivity of bistatic scattering to soil moisture and surface roughness of bare soils. Int. J. Remote. Sens. 2010, 31, 4227–4255. [Google Scholar] [CrossRef]
  39. Saltelli, A.; Ratto, M.; Andres, T.; Campolongo, F.; Cariboni, J.; Gatelli, D.; Saisana, M.; Tarantola, S. Global Sensitivity Analysis: The Primer; John Wiley & Sons: Chichester, UK, 2008. [Google Scholar]
  40. Dobson, M.C.; Ulaby, F.T.; Hallikainen, M.T.; El-Rayes, M.A. Microwave dielectric behavior of wet soil-Part II: Dielectric mixing models. IEEE Trans. Geosci. Remote. Sens. 1985, GE-23, 35–46. [Google Scholar] [CrossRef]
  41. Ulaby, F.T.; El-Rayes, M.A. Microwave dielectric spectrum of vegetation-Part II: Dual-dispersion model. IEEE Trans. Geosci. Remote. Sens. 1987, GE-25, 550–557. [Google Scholar] [CrossRef]
  42. McNairn, H.; Jackson, T.J.; Wiseman, G.; Belair, S.; Berg, A.; Bullock, P.; Colliander, A.; Cosh, M.H.; Kim, S.B.; Magagi, R.; et al. The soil moisture active passive validation experiment 2012 (SMAPVEX12): Prelaunch calibration and validation of the SMAP soil moisture algorithms. IEEE Trans. Geosci. Remote. Sens. 2014, 53, 2784–2801. [Google Scholar] [CrossRef]
  43. Huang, H.; Liao, T.H.; Kim, S.B.; Xu, X.; Tsang, L.; Jackson, T.J.; Yueh, S.H. L-Band Radar Scattering and Soil Moisture Retrieval of Wheat, Canola and Pasture Fields for SMAP Active Algorithms. Prog. Electromagn. Res. 2021, 170, 129–152. [Google Scholar] [CrossRef]
  44. Hensley, S.; Wheeler, K.; Sadowy, G.; Jones, C.; Shaffer, S.; Zebker, H.; Miller, T.; Heavey, B.; Chuang, E.; Chao, R.; et al. The UAVSAR instrument: Description and first results. In Proceedings of the 2008 IEEE Radar Conference, Rome, Italy, 26–30 May 2008; pp. 1–6. [Google Scholar]
  45. Pottier, E.; Ferro-Famil, L.; Fitrzyk, M.; Desnos, Y.L. PolSARpro-Bio: An ESA educational toolbox used for self-education in the field of PolSAR, Pol-InSAR and Pol-TomoSAR data analysis. In Proceedings of the IGARSS 2018-2018 IEEE International Geoscience and Remote Sensing Symposium, Valencia, Spain, 22–27 July 2018; pp. 6568–6571. [Google Scholar]
  46. Bhogapurapu, N.; Dey, S.; Mandal, D.; Bhattacharya, A.; Karthikeyan, L.; McNairn, H.; Rao, Y. Soil moisture retrieval over croplands using dual-pol L-band GRD SAR data. Remote Sens. Environ. 2022, 271, 112900. [Google Scholar] [CrossRef]
  47. Neelam, M.; Mohanty, B.P. Global sensitivity analysis of the radiative transfer model. Water Resour. Res. 2015, 51, 2428–2443. [Google Scholar] [CrossRef]
  48. Saltelli, A. Making best use of model evaluations to compute sensitivity indices. Comput. Phys. Commun. 2002, 145, 280–297. [Google Scholar] [CrossRef]
  49. Balenzano, A.; Mattia, F.; Satalino, G.; Davidson, M.W. Dense temporal series of C-and L-band SAR data for soil moisture retrieval over agricultural crops. IEEE J. Sel. Top. Appl. Earth Obs. Remote. Sens. 2010, 4, 439–450. [Google Scholar] [CrossRef]
  50. El Hajj, M.; Baghdadi, N.; Bazzi, H.; Zribi, M. Penetration analysis of SAR signals in the C and L bands for wheat, maize, and grasslands. Remote Sens. 2018, 11, 31. [Google Scholar] [CrossRef]
  51. Altese, E.; Bolognani, O.; Mancini, M.; Troch, P.A. Retrieving soil moisture over bare soil from ERS 1 synthetic aperture radar data: Sensitivity analysis based on a theoretical surface scattering model and field data. Water Resour. Res. 1996, 32, 653–661. [Google Scholar] [CrossRef]
  52. Ma, C.; Li, X.; Wang, S. A global sensitivity analysis of soil parameters associated with backscattering using the advanced integral equation model. IEEE Trans. Geosci. Remote. Sens. 2015, 53, 5613–5623. [Google Scholar]
  53. Della Vecchia, A.; Ferrazzoli, P.; Guerriero, L.; Blaes, X.; Defourny, P.; Dente, L.; Mattia, F.; Satalino, G.; Strozzi, T.; Wegmuller, U. Influence of geometrical factors on crop backscattering at C-band. IEEE Trans. Geosci. Remote. Sens. 2006, 44, 778–790. [Google Scholar] [CrossRef]
  54. Ma, C.; Li, X.; Notarnicola, C.; Wang, S.; Wang, W. Uncertainty quantification of soil moisture estimations based on a Bayesian probabilistic inversion. IEEE Trans. Geosci. Remote. Sens. 2017, 55, 3194–3207. [Google Scholar] [CrossRef]
Figure 1. Schematic diagram of the scattering mechanisms considered in the Wheat Canopy Scattering Model (WCSM) (adapted from Yan et al. [32]).
Remotesensing 17 00164 g001
Figure 2. Map of the study area and wheat sampling fields used in the present study overlaid on the UAVSAR-HH backscatter intensity image acquired on 17 July 2012 for line ID 31606. The inset illustrates the layout of the 16 sampling locations within each wheat field. Wheat crop measurements were made at sampling locations #2, #11, and #14 in each wheat field.
Remotesensing 17 00164 g002
Figure 3. Schematic diagram of the methods followed in the study; steps followed in UAVSAR data processing and backscatter extraction, simulating L-band backscatter using the Wheat Canopy Scattering Model (WCSM) using SMAPVEX12 ground measurements and allometric relationships from Yan et al. [32], simulation uncertainty, and observation uncertainty analyses.
Remotesensing 17 00164 g003
Figure 4. Wheat Canopy Scattering Model (WCSM) simulated total backscatter for HH, VV, and HV polarizations as a function of the incidence angle.
Remotesensing 17 00164 g004
Figure 5. Total sensitivity ( S T ) values from the Sobol’ method for WCSM-simulated HH-, VV-, and HV-polarized backscatters for two different crop growth stages; (a) crop height 20 cm (before heading − without wheat ears) and (b) crop height 80 cm (after heading − with wheat ears).
Remotesensing 17 00164 g005
Figure 6. Correlation plots between observed backscatter for different line ID combinations: 31604 vs. 31603 (a) HH, (b) VV, (c) HV; 31605 vs. 31603 (d) HH, (e) VV, (f) HV; 31606 vs. 31603 (g) HH, (h) VV, (i) HV; 31605 vs. 31604 (j) HH, (k) VV, (l) HV; 31606 vs. 31604 (m) HH, (n) VV, (o) HV; 31606 vs. 31605 (p) HH, (q) VV, (r) HV.
Remotesensing 17 00164 g006
Figure 7. Comparison of observed backscatter from UAVSAR and simulated backscatter from the Wheat Canopy Scattering Model (WCSM) where rows represent the flight line IDs 31603, 31604, 31605, and 31606, and columns represent HH-, VV-, and HV-polarized backscatter, respectively. (a) 31603-HH, (b) 31603-VV, (c) 31603-HV, (d) 31604-HH, (e) 31604-VV, (f) 31604-HV, (g) 31605-HH, (h) 31605-VV, (i) 31605-HV, (j) 31606-HH, (k) 31606-VV, and (l) 31606-HV. Uncertainty in observations and simulations are shown via x and y error bars (±standard deviation), respectively, at the mid-right in each panel.
Remotesensing 17 00164 g007
Figure 8. Total backscatter and relative contributions of soil (attenuated soil scattering) and vegetation (volume scattering of ear, leaf, and stem) simulated from the Wheat Canopy Scattering Model (WCSM) for all three polarizations at sampling locations #2, #11, and #14 of wheat fields #44, #45, #65, #73, #74, #81, #85, and #91 on 17 July 2012 for line ID 31606.
Remotesensing 17 00164 g008
Figure 9. Time series of UAVSAR backscatter for HH, VV, and HV polarizations and soil moisture measurements in wheat field #42 (sampling location #2) during SMAPVEX12 campaign.
Remotesensing 17 00164 g009
Figure 10. Sensitivity of WCSM-simulated total backscatter for HH, VV, and HV polarizations at L-band with changes in gravimetric water content of wheat (a) ears, (b) leaves, and (c) stems.
Remotesensing 17 00164 g010
Table 1. Input parameters of the wheat crop, soil, and radar configurations required for the Wheat Canopy Scattering Model (WCSM) with the details of SMAPVEX12 measurement availability.
ItemParametersSMAPVEX12 Measurement Availability
CanopyHeight
Crop density
Measured 1
Measured
PanicleHeightDerived 2
EarHeight
Diameter
Gravimetric water content
Derived
Derived
Measured
LeafLength
Width
Thickness
Gravimetric water content
Derived
Derived
Derived
Measured
StemHeight
Diameter
Gravimetric water content
Derived
Measured
Measured
SoilVolumetric moisture content
Temperature
Soil texture (sand and clay contents)
Root mean square (RMS) height
Correlation length
Measured
Measured
Measured
Measured
Measured
RadarFrequency
Incidence angle
Available 3
Available
1 Ground measurements collected during SMAPVEX12 campaign were used. 2 Values derived from allometric relationships in ground measurements of Yan et al. [32]. 3 Available from UAVSAR data.
Table 2. Specifications of UAVSAR data (full-pol-GRD) for all four line IDs (31603, 31604, 31605, and 31606) used in this study from the SMAPVEX12 campaign.
Day of Year (DOY)UAVSAR Acquisition DateFlight ID
169 *17 June 201212044
17119 June 201212045
174 *22 June 201212046
175 *23 June 201212047
177 *25 June 201212048
179 *27 June 201212049
18129 June 201212050
1853 July 201212055
187 *5 July 201212056
190 *8 July 201212057
192 *10 July 201212058
195 *13 July 201212059
196 *14 July 201212060
199 *17 July 201212061
* UAVSAR images used to compare with WCSM-simulated backscatter.
Table 3. Input data for Wheat Canopy Scattering Model (WCSM) after the heading stage (with the presence of wheat ears) and the respective uncertainty (1 σ ) values used for the Monte Carlo simulations used in the Sobol’ approach.
Input ParameterValueUncertainty (1 Standard Deviation)
Crop density (number of stems/m2) *38320
Crop height (cm) *805
Panicle height (cm)101
Ear height (cm)8.50.27
Ear diameter (cm)1.10.074
Ear water content fraction *0.50.03
Leaf length (cm) *201
Leaf width (cm) *1.20.5
Leaf thickness (cm) *0.020.002
Leaf water content fraction *0.650.03
Stem height (cm)671.73
Stem diameter (cm)0.330.02
Stem water content fraction *0.650.03
RMS height (cm)0.80.2
Correlation length (cm)121
Surface temperature (°C)16.52
Soil moisture (m3/m3) *0.250.025
Incidence angle (degrees)352
Sand content (%)155
Clay content (%)435
* Measurement uncertainties are from Toure et al. [26].
Table 4. Simulation uncertainty of Wheat Canopy Scattering Model (WCSM) backscatter for HH, VV, and HV polarizations obtained from the Monte Carlo simulations used for the Sobol’ method (± standard deviation).
σ HH 0 σ VV 0 σ HV 0
Simulation uncertainty (dB)1.881.731.80
Table 5. Observation uncertainty of UAVSAR backscatter for HH, VV, and HV polarizations obtained from analyzing the multiple images acquired at the same location with unchanged ground conditions (soil and crop) and different incidence angles.
Line ID CombinationObservation Uncertainty (dB)
σ HH 0 σ VV 0 σ HV 0
31604 vs. 316030.7610.7540.718
31605 vs. 316030.7580.7460.970
31606 vs. 316030.8150.9710.970
31605 vs. 316040.7650.7640.794
31606 vs. 316040.8080.9030.782
31606 vs. 316050.8631.0710.948
Table 6. Uncertainty estimated from observation and simulation uncertainty analyses and RMSE between the WCSM-simulated backscatter and UAVSAR observations.
σ HH 0 σ VV 0 σ HV 0
Observation uncertainty (dB)0.800.870.86
Simulation uncertainty (dB)1.881.731.80
Total uncertainty (dB)2.682.602.66
RMSE between simulated and observed backscatter (dB)3.175.633.27
Disclaimer/Publisher’s Note: The statements, opinions and data contained in all publications are solely those of the individual author(s) and contributor(s) and not of MDPI and/or the editor(s). MDPI and/or the editor(s) disclaim responsibility for any injury to people or property resulting from any ideas, methods, instructions or products referred to in the content.